Albany, OR Map & Demographics
Albany Map
Albany Overview
$31,872
PER CAPITA INCOME
$83,786
AVG FAMILY INCOME
$69,777
AVG HOUSEHOLD INCOME
31.5%
WAGE / INCOME GAP [ % ]
68.5¢/ $1
WAGE / INCOME GAP [ $ ]
$10,449
FAMILY INCOME DEFICIT
0.39
INEQUALITY / GINI INDEX
56,348
TOTAL POPULATION
27,978
MALE POPULATION
28,370
FEMALE POPULATION
98.62
MALES / 100 FEMALES
101.40
FEMALES / 100 MALES
36.5
MEDIAN AGE
3.1
AVG FAMILY SIZE
2.6
AVG HOUSEHOLD SIZE
27,497
LABOR FORCE [ PEOPLE ]
63.0%
PERCENT IN LABOR FORCE
6.7%
UNEMPLOYMENT RATE
Albany Area Codes
Income in Albany
Income Overview in Albany
Per Capita Income in Albany is $31,872, while median incomes of families and households are $83,786 and $69,777 respectively.
| Characteristic | Number | Measure |
| Per Capita Income | 56,348 | $31,872 |
| Median Family Income | 13,841 | $83,786 |
| Mean Family Income | 13,841 | $97,110 |
| Median Household Income | 21,484 | $69,777 |
| Mean Household Income | 21,484 | $82,726 |
| Income Deficit | 13,841 | $10,449 |
| Wage / Income Gap (%) | 56,348 | 31.47% |
| Wage / Income Gap ($) | 56,348 | 68.53¢ per $1 |
| Gini / Inequality Index | 56,348 | 0.39 |
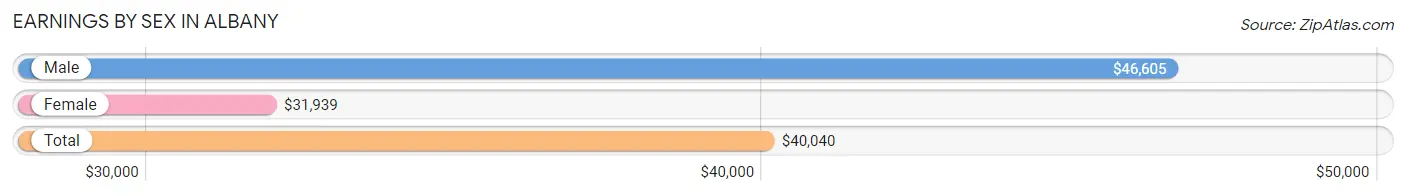
Earnings by Sex in Albany
Average Earnings in Albany are $40,040, $46,605 for men and $31,939 for women, a difference of 31.5%.
| Sex | Number | Average Earnings |
| Male | 15,191 (53.4%) | $46,605 |
| Female | 13,260 (46.6%) | $31,939 |
| Total | 28,451 (100.0%) | $40,040 |
Earnings by Sex by Income Bracket in Albany
The most common earnings brackets in Albany are $75,000 to $99,999 for men (1,988 | 13.1%) and $25,000 to $29,999 for women (1,113 | 8.4%).
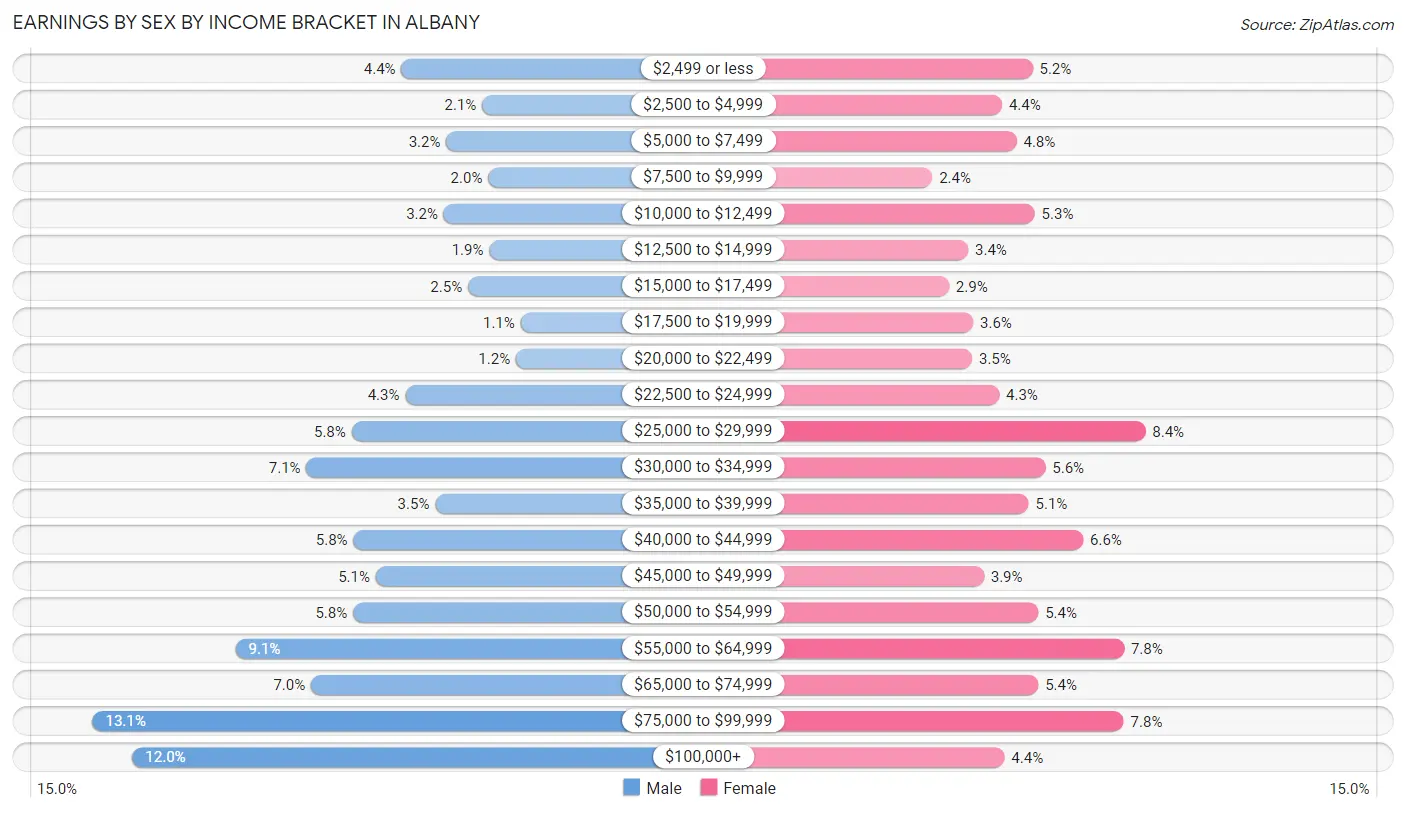
| Income | Male | Female |
| $2,499 or less | 670 (4.4%) | 692 (5.2%) |
| $2,500 to $4,999 | 325 (2.1%) | 578 (4.4%) |
| $5,000 to $7,499 | 478 (3.2%) | 632 (4.8%) |
| $7,500 to $9,999 | 300 (2.0%) | 318 (2.4%) |
| $10,000 to $12,499 | 489 (3.2%) | 700 (5.3%) |
| $12,500 to $14,999 | 295 (1.9%) | 452 (3.4%) |
| $15,000 to $17,499 | 386 (2.5%) | 381 (2.9%) |
| $17,500 to $19,999 | 161 (1.1%) | 471 (3.5%) |
| $20,000 to $22,499 | 181 (1.2%) | 467 (3.5%) |
| $22,500 to $24,999 | 653 (4.3%) | 567 (4.3%) |
| $25,000 to $29,999 | 882 (5.8%) | 1,113 (8.4%) |
| $30,000 to $34,999 | 1,075 (7.1%) | 740 (5.6%) |
| $35,000 to $39,999 | 525 (3.5%) | 677 (5.1%) |
| $40,000 to $44,999 | 875 (5.8%) | 881 (6.6%) |
| $45,000 to $49,999 | 780 (5.1%) | 511 (3.8%) |
| $50,000 to $54,999 | 876 (5.8%) | 714 (5.4%) |
| $55,000 to $64,999 | 1,378 (9.1%) | 1,033 (7.8%) |
| $65,000 to $74,999 | 1,056 (7.0%) | 714 (5.4%) |
| $75,000 to $99,999 | 1,988 (13.1%) | 1,031 (7.8%) |
| $100,000+ | 1,818 (12.0%) | 588 (4.4%) |
| Total | 15,191 (100.0%) | 13,260 (100.0%) |
Earnings by Sex by Educational Attainment in Albany
Average earnings in Albany are $52,296 for men and $38,263 for women, a difference of 26.8%. Men with an educational attainment of graduate degree enjoy the highest average annual earnings of $71,923, while those with high school diploma education earn the least with $38,924. Women with an educational attainment of graduate degree earn the most with the average annual earnings of $64,967, while those with less than high school education have the smallest earnings of $17,222.
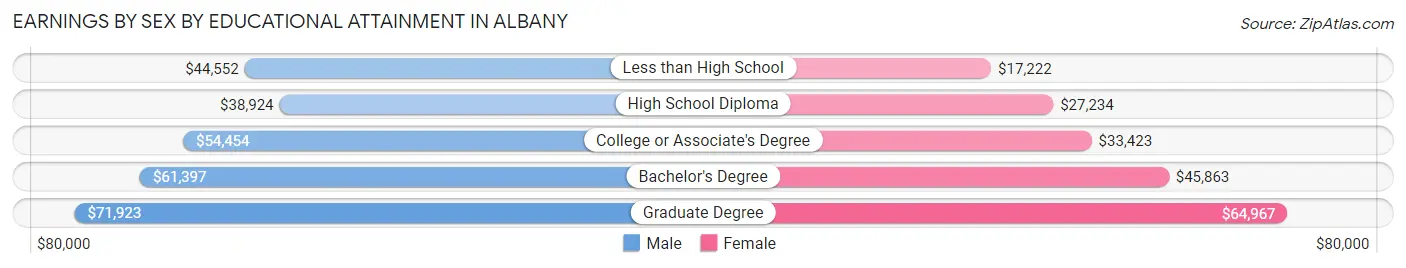
| Educational Attainment | Male Income | Female Income |
| Less than High School | $44,552 | $17,222 |
| High School Diploma | $38,924 | $27,234 |
| College or Associate's Degree | $54,454 | $33,423 |
| Bachelor's Degree | $61,397 | $45,863 |
| Graduate Degree | $71,923 | $64,967 |
| Total | $52,296 | $38,263 |
Family Income in Albany
Family Income Brackets in Albany
According to the Albany family income data, there are 3,031 families falling into the $100,000 to $149,999 income range, which is the most common income bracket and makes up 21.9% of all families. Conversely, the $10,000 to $14,999 income bracket is the least frequent group with only 152 families (1.1%) belonging to this category.
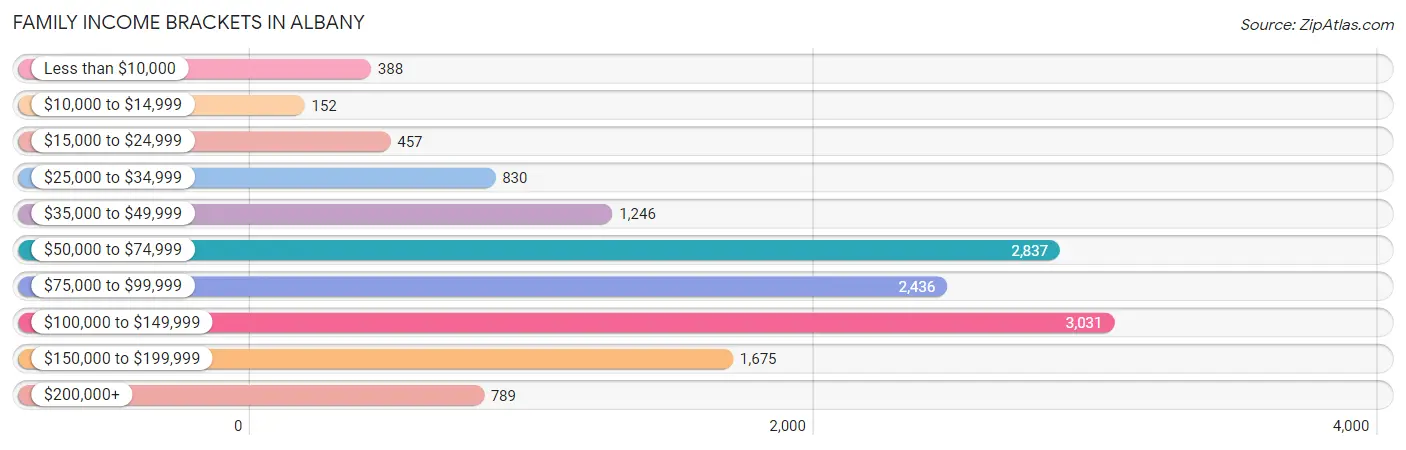
| Income Bracket | # Families | % Families |
| Less than $10,000 | 388 | 2.8% |
| $10,000 to $14,999 | 152 | 1.1% |
| $15,000 to $24,999 | 457 | 3.3% |
| $25,000 to $34,999 | 830 | 6.0% |
| $35,000 to $49,999 | 1,246 | 9.0% |
| $50,000 to $74,999 | 2,837 | 20.5% |
| $75,000 to $99,999 | 2,436 | 17.6% |
| $100,000 to $149,999 | 3,031 | 21.9% |
| $150,000 to $199,999 | 1,675 | 12.1% |
| $200,000+ | 789 | 5.7% |
Family Income by Famaliy Size in Albany
5-person families (993 | 7.2%) account for the highest median family income in Albany with $101,422 per family, while 2-person families (6,279 | 45.4%) have the highest median income of $39,852 per family member.
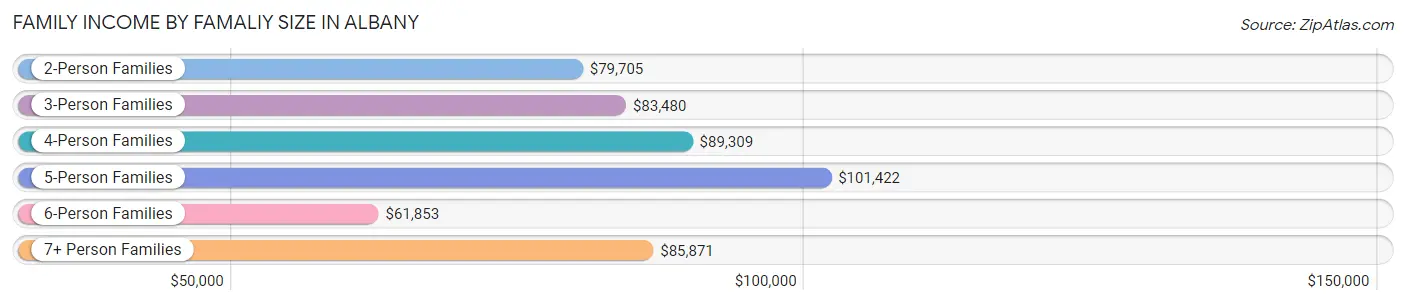
| Income Bracket | # Families | Median Income |
| 2-Person Families | 6,279 (45.4%) | $79,705 |
| 3-Person Families | 3,122 (22.6%) | $83,480 |
| 4-Person Families | 2,761 (20.0%) | $89,309 |
| 5-Person Families | 993 (7.2%) | $101,422 |
| 6-Person Families | 517 (3.7%) | $61,853 |
| 7+ Person Families | 169 (1.2%) | $85,871 |
| Total | 13,841 (100.0%) | $83,786 |
Family Income by Number of Earners in Albany
The median family income in Albany is $83,786, with families comprising 3+ earners (1,423) having the highest median family income of $139,567, while families with no earners (2,192) have the lowest median family income of $56,368, accounting for 10.3% and 15.8% of families, respectively.
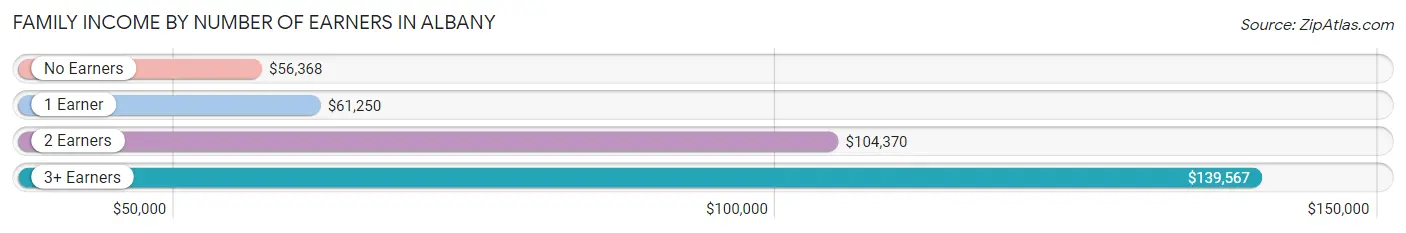
| Number of Earners | # Families | Median Income |
| No Earners | 2,192 (15.8%) | $56,368 |
| 1 Earner | 4,172 (30.1%) | $61,250 |
| 2 Earners | 6,054 (43.7%) | $104,370 |
| 3+ Earners | 1,423 (10.3%) | $139,567 |
| Total | 13,841 (100.0%) | $83,786 |
Household Income in Albany
Household Income Brackets in Albany
With 4,103 households falling in the category, the $50,000 to $74,999 income range is the most frequent in Albany, accounting for 19.1% of all households. In contrast, only 645 households (3.0%) fall into the less than $10,000 income bracket, making it the least populous group.
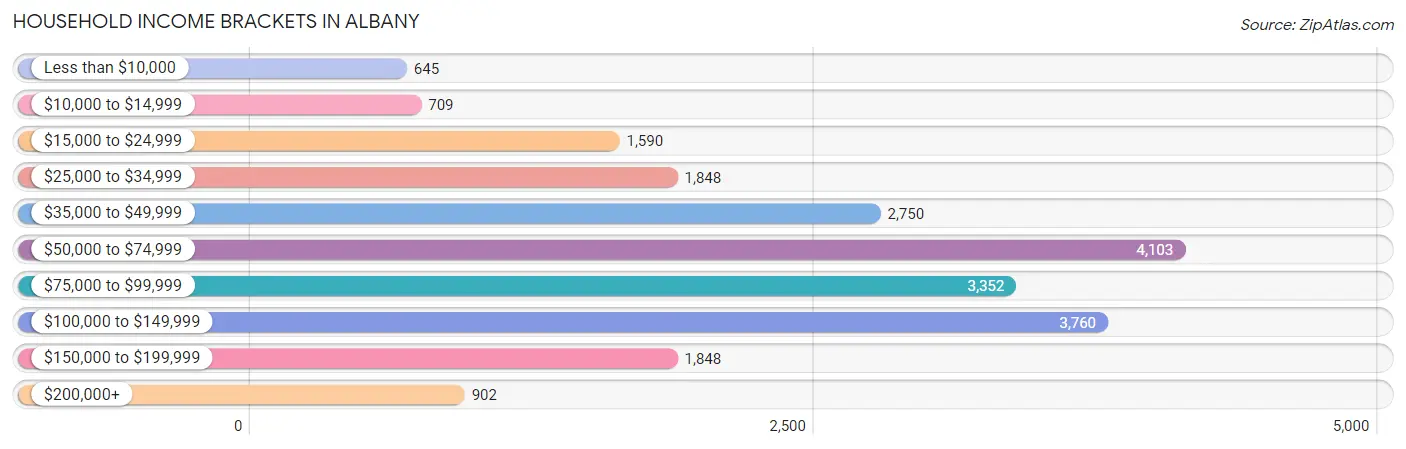
| Income Bracket | # Households | % Households |
| Less than $10,000 | 645 | 3.0% |
| $10,000 to $14,999 | 709 | 3.3% |
| $15,000 to $24,999 | 1,590 | 7.4% |
| $25,000 to $34,999 | 1,848 | 8.6% |
| $35,000 to $49,999 | 2,750 | 12.8% |
| $50,000 to $74,999 | 4,103 | 19.1% |
| $75,000 to $99,999 | 3,352 | 15.6% |
| $100,000 to $149,999 | 3,760 | 17.5% |
| $150,000 to $199,999 | 1,848 | 8.6% |
| $200,000+ | 902 | 4.2% |
Household Income by Householder Age in Albany
The median household income in Albany is $69,777, with the highest median household income of $80,576 found in the 45 to 64 years age bracket for the primary householder. A total of 7,019 households (32.7%) fall into this category. Meanwhile, the 15 to 24 years age bracket for the primary householder has the lowest median household income of $40,361, with 925 households (4.3%) in this group.
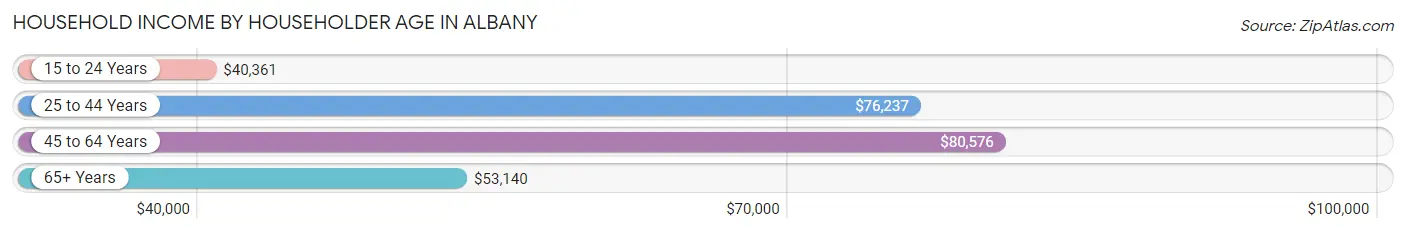
| Income Bracket | # Households | Median Income |
| 15 to 24 Years | 925 (4.3%) | $40,361 |
| 25 to 44 Years | 8,137 (37.9%) | $76,237 |
| 45 to 64 Years | 7,019 (32.7%) | $80,576 |
| 65+ Years | 5,403 (25.2%) | $53,140 |
| Total | 21,484 (100.0%) | $69,777 |
Poverty in Albany
Income Below Poverty by Sex and Age in Albany
With 12.3% poverty level for males and 11.4% for females among the residents of Albany, 5 year old males and 18 to 24 year old females are the most vulnerable to poverty, with 95 males (29.7%) and 590 females (24.8%) in their respective age groups living below the poverty level.
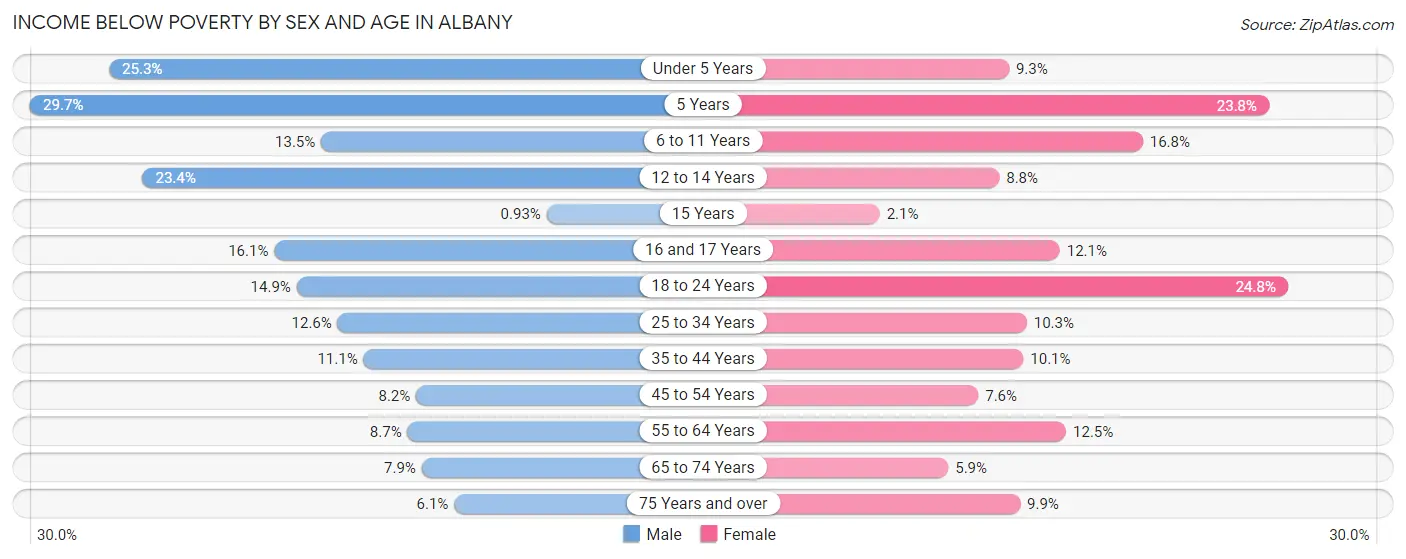
| Age Bracket | Male | Female |
| Under 5 Years | 487 (25.3%) | 171 (9.3%) |
| 5 Years | 95 (29.7%) | 34 (23.8%) |
| 6 to 11 Years | 324 (13.5%) | 345 (16.8%) |
| 12 to 14 Years | 246 (23.4%) | 75 (8.8%) |
| 15 Years | 5 (0.9%) | 9 (2.1%) |
| 16 and 17 Years | 99 (16.1%) | 97 (12.1%) |
| 18 to 24 Years | 351 (14.8%) | 590 (24.8%) |
| 25 to 34 Years | 496 (12.6%) | 405 (10.3%) |
| 35 to 44 Years | 432 (11.1%) | 443 (10.1%) |
| 45 to 54 Years | 264 (8.2%) | 217 (7.6%) |
| 55 to 64 Years | 253 (8.7%) | 413 (12.5%) |
| 65 to 74 Years | 197 (7.9%) | 153 (5.9%) |
| 75 Years and over | 86 (6.1%) | 203 (9.9%) |
| Total | 3,335 (12.3%) | 3,155 (11.4%) |
Income Above Poverty by Sex and Age in Albany
According to the poverty statistics in Albany, males aged 15 years and females aged 15 years are the age groups that are most secure financially, with 99.1% of males and 97.9% of females in these age groups living above the poverty line.
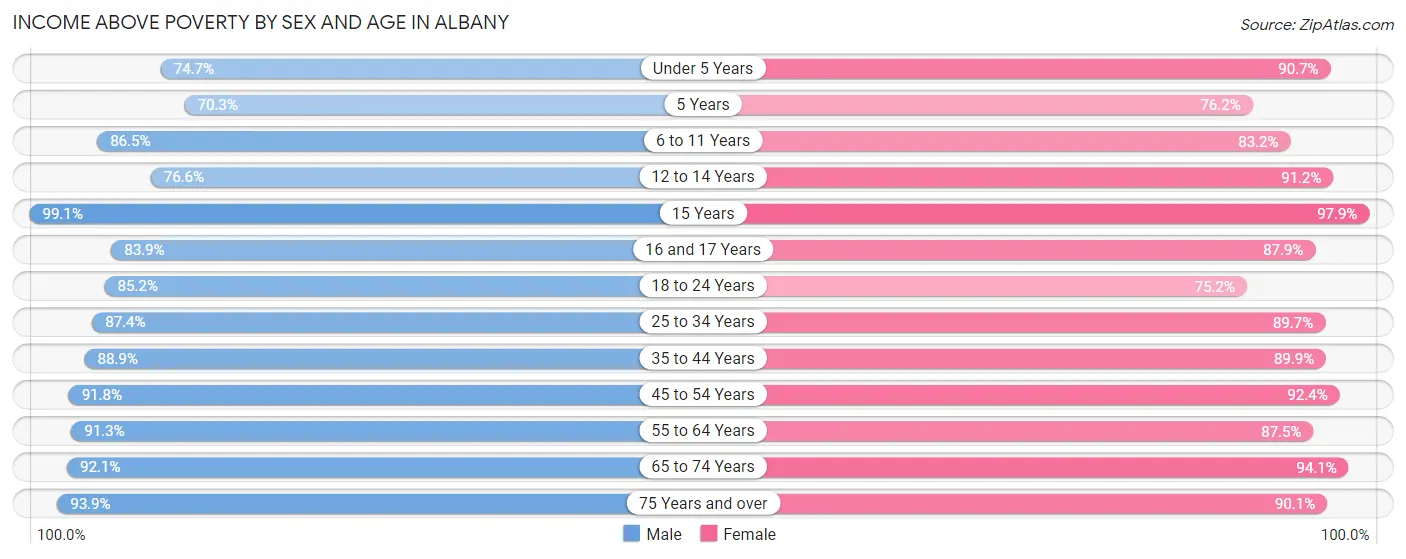
| Age Bracket | Male | Female |
| Under 5 Years | 1,439 (74.7%) | 1,665 (90.7%) |
| 5 Years | 225 (70.3%) | 109 (76.2%) |
| 6 to 11 Years | 2,077 (86.5%) | 1,713 (83.2%) |
| 12 to 14 Years | 804 (76.6%) | 780 (91.2%) |
| 15 Years | 534 (99.1%) | 417 (97.9%) |
| 16 and 17 Years | 516 (83.9%) | 702 (87.9%) |
| 18 to 24 Years | 2,013 (85.2%) | 1,786 (75.2%) |
| 25 to 34 Years | 3,449 (87.4%) | 3,528 (89.7%) |
| 35 to 44 Years | 3,448 (88.9%) | 3,937 (89.9%) |
| 45 to 54 Years | 2,954 (91.8%) | 2,639 (92.4%) |
| 55 to 64 Years | 2,662 (91.3%) | 2,893 (87.5%) |
| 65 to 74 Years | 2,301 (92.1%) | 2,425 (94.1%) |
| 75 Years and over | 1,328 (93.9%) | 1,841 (90.1%) |
| Total | 23,750 (87.7%) | 24,435 (88.6%) |
Income Below Poverty Among Married-Couple Families in Albany
The poverty statistics for married-couple families in Albany show that 3.7% or 393 of the total 10,496 families live below the poverty line. Families with 3 or 4 children have the highest poverty rate of 17.1%, comprising of 153 families. On the other hand, families with no children have the lowest poverty rate of 2.4%, which includes 139 families.
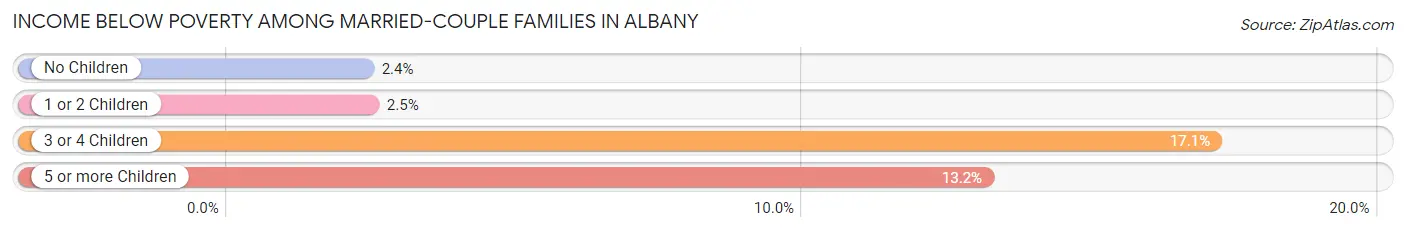
| Children | Above Poverty | Below Poverty |
| No Children | 5,707 (97.6%) | 139 (2.4%) |
| 1 or 2 Children | 3,590 (97.5%) | 91 (2.5%) |
| 3 or 4 Children | 740 (82.9%) | 153 (17.1%) |
| 5 or more Children | 66 (86.8%) | 10 (13.2%) |
| Total | 10,103 (96.3%) | 393 (3.7%) |
Income Below Poverty Among Single-Parent Households in Albany
According to the poverty data in Albany, 10.1% or 123 single-father households and 24.4% or 519 single-mother households are living below the poverty line. Among single-father households, those with 1 or 2 children have the highest poverty rate, with 80 households (24.4%) experiencing poverty. Likewise, among single-mother households, those with 1 or 2 children have the highest poverty rate, with 419 households (34.3%) falling below the poverty line.
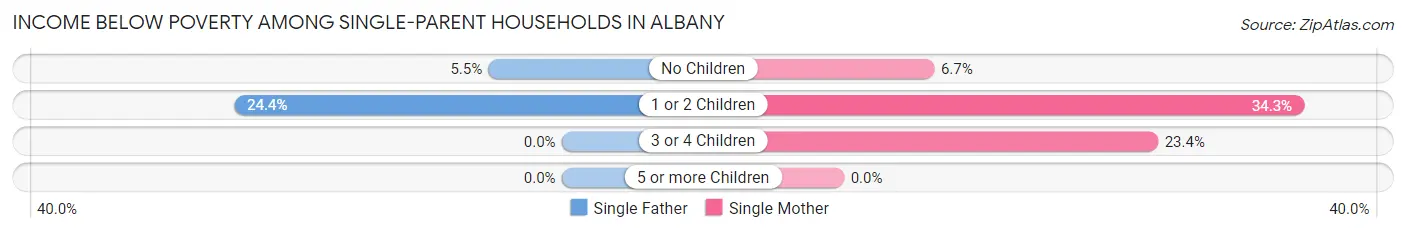
| Children | Single Father | Single Mother |
| No Children | 43 (5.5%) | 45 (6.7%) |
| 1 or 2 Children | 80 (24.4%) | 419 (34.3%) |
| 3 or 4 Children | 0 (0.0%) | 55 (23.4%) |
| 5 or more Children | 0 (0.0%) | 0 (0.0%) |
| Total | 123 (10.1%) | 519 (24.4%) |
Income Below Poverty Among Married-Couple vs Single-Parent Households in Albany
The poverty data for Albany shows that 393 of the married-couple family households (3.7%) and 642 of the single-parent households (19.2%) are living below the poverty level. Within the married-couple family households, those with 3 or 4 children have the highest poverty rate, with 153 households (17.1%) falling below the poverty line. Among the single-parent households, those with 1 or 2 children have the highest poverty rate, with 499 household (32.2%) living below poverty.
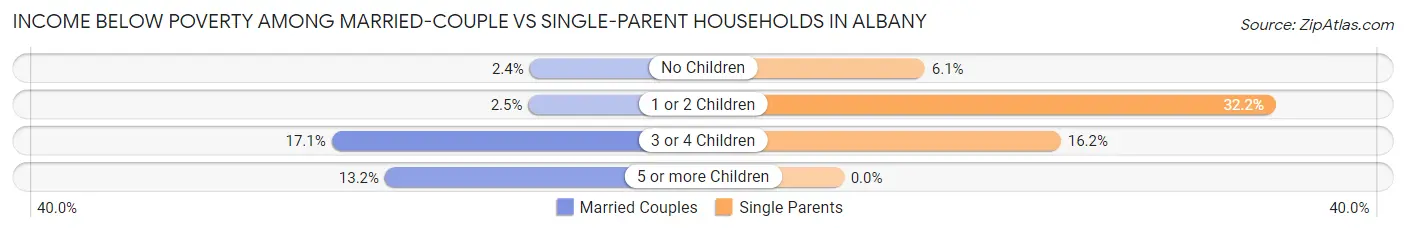
| Children | Married-Couple Families | Single-Parent Households |
| No Children | 139 (2.4%) | 88 (6.0%) |
| 1 or 2 Children | 91 (2.5%) | 499 (32.2%) |
| 3 or 4 Children | 153 (17.1%) | 55 (16.2%) |
| 5 or more Children | 10 (13.2%) | 0 (0.0%) |
| Total | 393 (3.7%) | 642 (19.2%) |
Race in Albany
The most populous races in Albany are White / Caucasian (46,617 | 82.7%), Hispanic or Latino (7,965 | 14.1%), and Two or more Races (4,900 | 8.7%).
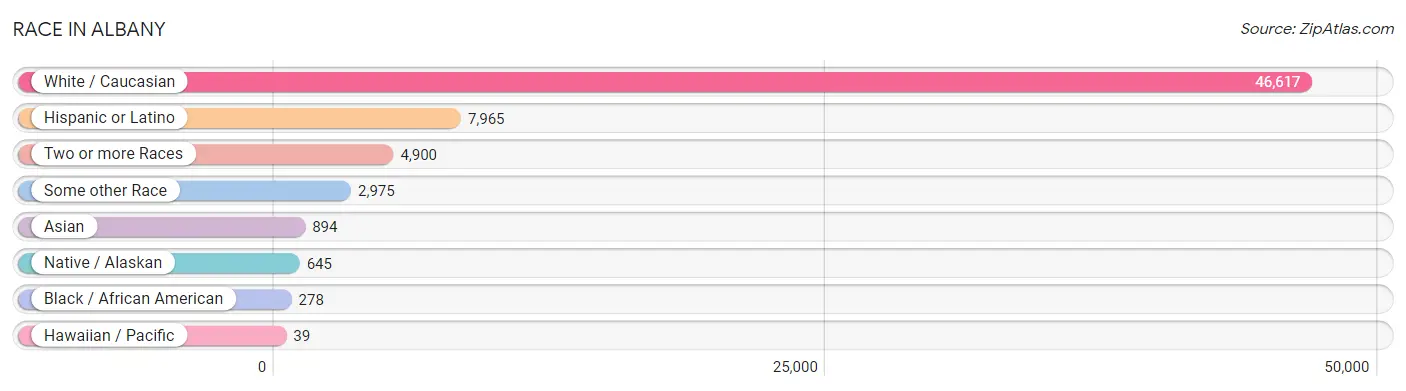
| Race | # Population | % Population |
| Asian | 894 | 1.6% |
| Black / African American | 278 | 0.5% |
| Hawaiian / Pacific | 39 | 0.1% |
| Hispanic or Latino | 7,965 | 14.1% |
| Native / Alaskan | 645 | 1.1% |
| White / Caucasian | 46,617 | 82.7% |
| Two or more Races | 4,900 | 8.7% |
| Some other Race | 2,975 | 5.3% |
| Total | 56,348 | 100.0% |
Ancestry in Albany
The most populous ancestries reported in Albany are German (10,761 | 19.1%), English (8,172 | 14.5%), Mexican (6,766 | 12.0%), Irish (5,475 | 9.7%), and European (3,042 | 5.4%), together accounting for 60.7% of all Albany residents.
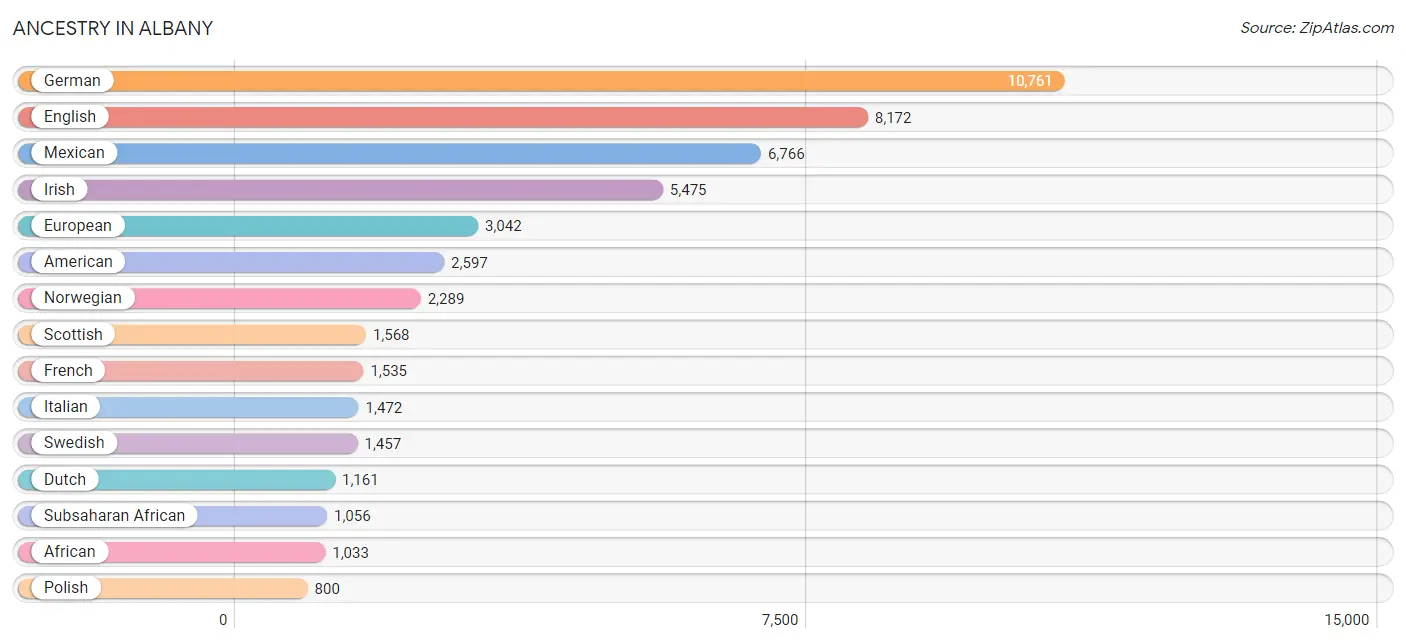
| Ancestry | # Population | % Population |
| African | 1,033 | 1.8% |
| Alaska Native | 277 | 0.5% |
| Alaskan Athabascan | 147 | 0.3% |
| Aleut | 23 | 0.0% |
| American | 2,597 | 4.6% |
| Apache | 80 | 0.1% |
| Arab | 94 | 0.2% |
| Argentinean | 52 | 0.1% |
| Armenian | 20 | 0.0% |
| Austrian | 138 | 0.2% |
| Bangladeshi | 150 | 0.3% |
| Basque | 50 | 0.1% |
| Belgian | 134 | 0.2% |
| Bhutanese | 213 | 0.4% |
| Blackfeet | 73 | 0.1% |
| Bolivian | 15 | 0.0% |
| British | 792 | 1.4% |
| Burmese | 234 | 0.4% |
| Canadian | 352 | 0.6% |
| Central American | 214 | 0.4% |
| Central American Indian | 48 | 0.1% |
| Cherokee | 213 | 0.4% |
| Cheyenne | 15 | 0.0% |
| Chickasaw | 12 | 0.0% |
| Chilean | 9 | 0.0% |
| Chinese | 7 | 0.0% |
| Choctaw | 44 | 0.1% |
| Colombian | 58 | 0.1% |
| Creek | 82 | 0.2% |
| Croatian | 35 | 0.1% |
| Cuban | 59 | 0.1% |
| Czech | 275 | 0.5% |
| Czechoslovakian | 41 | 0.1% |
| Danish | 772 | 1.4% |
| Delaware | 12 | 0.0% |
| Dutch | 1,161 | 2.1% |
| Eastern European | 166 | 0.3% |
| English | 8,172 | 14.5% |
| Estonian | 15 | 0.0% |
| European | 3,042 | 5.4% |
| Finnish | 213 | 0.4% |
| French | 1,535 | 2.7% |
| French American Indian | 99 | 0.2% |
| French Canadian | 237 | 0.4% |
| German | 10,761 | 19.1% |
| Greek | 567 | 1.0% |
| Guatemalan | 52 | 0.1% |
| Honduran | 90 | 0.2% |
| Hungarian | 131 | 0.2% |
| Icelander | 62 | 0.1% |
| Indian (Asian) | 500 | 0.9% |
| Inupiat | 23 | 0.0% |
| Iranian | 22 | 0.0% |
| Irish | 5,475 | 9.7% |
| Iroquois | 48 | 0.1% |
| Italian | 1,472 | 2.6% |
| Jamaican | 10 | 0.0% |
| Jordanian | 31 | 0.1% |
| Kenyan | 7 | 0.0% |
| Kiowa | 15 | 0.0% |
| Korean | 468 | 0.8% |
| Laotian | 5 | 0.0% |
| Lebanese | 52 | 0.1% |
| Lithuanian | 39 | 0.1% |
| Luxembourger | 14 | 0.0% |
| Mexican | 6,766 | 12.0% |
| Mexican American Indian | 281 | 0.5% |
| Native Hawaiian | 169 | 0.3% |
| Navajo | 16 | 0.0% |
| Nigerian | 16 | 0.0% |
| Northern European | 216 | 0.4% |
| Norwegian | 2,289 | 4.1% |
| Osage | 23 | 0.0% |
| Pakistani | 6 | 0.0% |
| Palestinian | 31 | 0.1% |
| Panamanian | 10 | 0.0% |
| Pennsylvania German | 9 | 0.0% |
| Peruvian | 10 | 0.0% |
| Polish | 800 | 1.4% |
| Portuguese | 113 | 0.2% |
| Puerto Rican | 244 | 0.4% |
| Romanian | 92 | 0.2% |
| Russian | 355 | 0.6% |
| Salvadoran | 62 | 0.1% |
| Samoan | 65 | 0.1% |
| Scandinavian | 384 | 0.7% |
| Scotch-Irish | 774 | 1.4% |
| Scottish | 1,568 | 2.8% |
| Serbian | 63 | 0.1% |
| Sioux | 44 | 0.1% |
| Slavic | 24 | 0.0% |
| Slovak | 102 | 0.2% |
| South American | 144 | 0.3% |
| Spaniard | 199 | 0.4% |
| Spanish | 39 | 0.1% |
| Spanish American Indian | 49 | 0.1% |
| Sri Lankan | 20 | 0.0% |
| Subsaharan African | 1,056 | 1.9% |
| Swedish | 1,457 | 2.6% |
| Swiss | 405 | 0.7% |
| Syrian | 11 | 0.0% |
| Thai | 119 | 0.2% |
| Tlingit-Haida | 60 | 0.1% |
| Turkish | 23 | 0.0% |
| Ukrainian | 151 | 0.3% |
| Vietnamese | 26 | 0.1% |
| Welsh | 276 | 0.5% |
| Yugoslavian | 24 | 0.0% | View All 108 Rows |
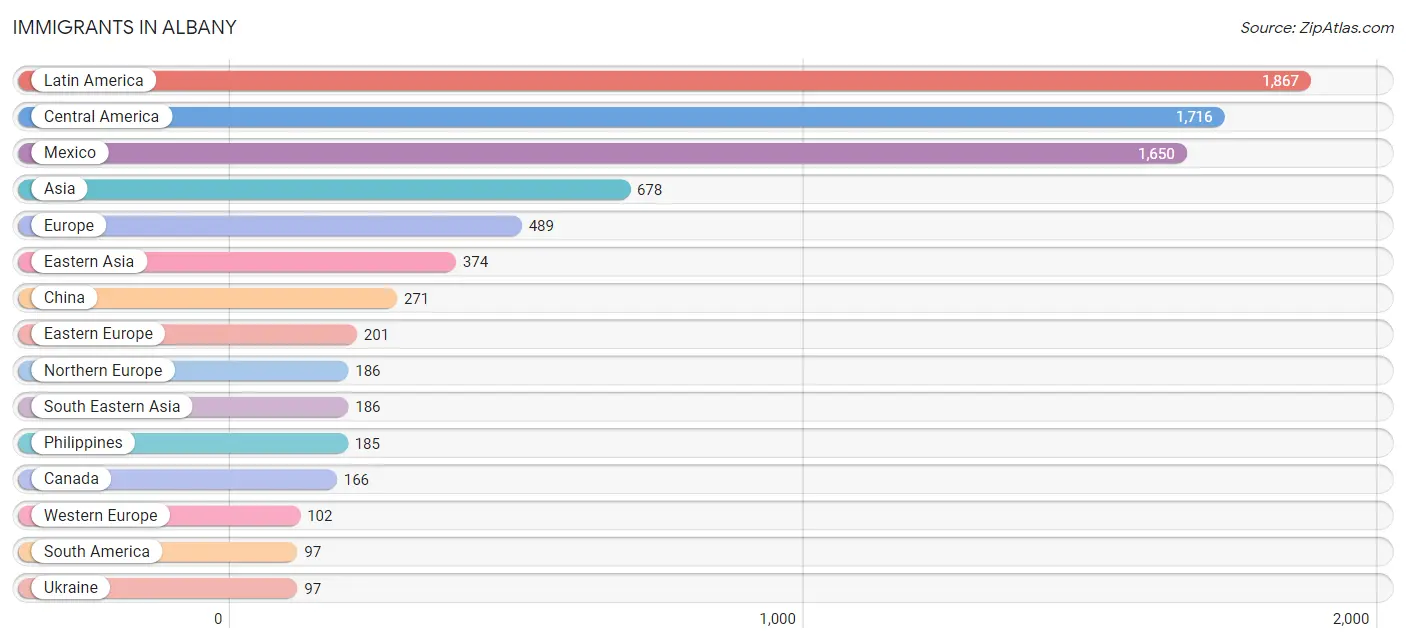
Immigrants in Albany
The most numerous immigrant groups reported in Albany came from Latin America (1,867 | 3.3%), Central America (1,716 | 3.0%), Mexico (1,650 | 2.9%), Asia (678 | 1.2%), and Europe (489 | 0.9%), together accounting for 11.4% of all Albany residents.
| Immigration Origin | # Population | % Population |
| Africa | 25 | 0.0% |
| Argentina | 15 | 0.0% |
| Asia | 678 | 1.2% |
| Bangladesh | 2 | 0.0% |
| Belgium | 6 | 0.0% |
| Canada | 166 | 0.3% |
| Caribbean | 54 | 0.1% |
| Central America | 1,716 | 3.0% |
| Chile | 1 | 0.0% |
| China | 271 | 0.5% |
| Colombia | 71 | 0.1% |
| Cuba | 44 | 0.1% |
| Denmark | 5 | 0.0% |
| Eastern Asia | 374 | 0.7% |
| Eastern Europe | 201 | 0.4% |
| El Salvador | 62 | 0.1% |
| England | 56 | 0.1% |
| Europe | 489 | 0.9% |
| Germany | 27 | 0.1% |
| Guatemala | 4 | 0.0% |
| Hong Kong | 48 | 0.1% |
| Hungary | 12 | 0.0% |
| India | 42 | 0.1% |
| Ireland | 45 | 0.1% |
| Jamaica | 10 | 0.0% |
| Japan | 46 | 0.1% |
| Korea | 57 | 0.1% |
| Latin America | 1,867 | 3.3% |
| Lebanon | 29 | 0.1% |
| Mexico | 1,650 | 2.9% |
| Moldova | 23 | 0.0% |
| Netherlands | 35 | 0.1% |
| Nigeria | 4 | 0.0% |
| Northern Europe | 186 | 0.3% |
| Norway | 13 | 0.0% |
| Oceania | 17 | 0.0% |
| Pakistan | 26 | 0.1% |
| Peru | 10 | 0.0% |
| Philippines | 185 | 0.3% |
| Poland | 11 | 0.0% |
| Romania | 16 | 0.0% |
| Russia | 42 | 0.1% |
| South Africa | 21 | 0.0% |
| South America | 97 | 0.2% |
| South Central Asia | 85 | 0.2% |
| South Eastern Asia | 186 | 0.3% |
| Sri Lanka | 15 | 0.0% |
| Sweden | 9 | 0.0% |
| Switzerland | 34 | 0.1% |
| Taiwan | 17 | 0.0% |
| Thailand | 1 | 0.0% |
| Ukraine | 97 | 0.2% |
| Western Africa | 4 | 0.0% |
| Western Asia | 33 | 0.1% |
| Western Europe | 102 | 0.2% | View All 55 Rows |
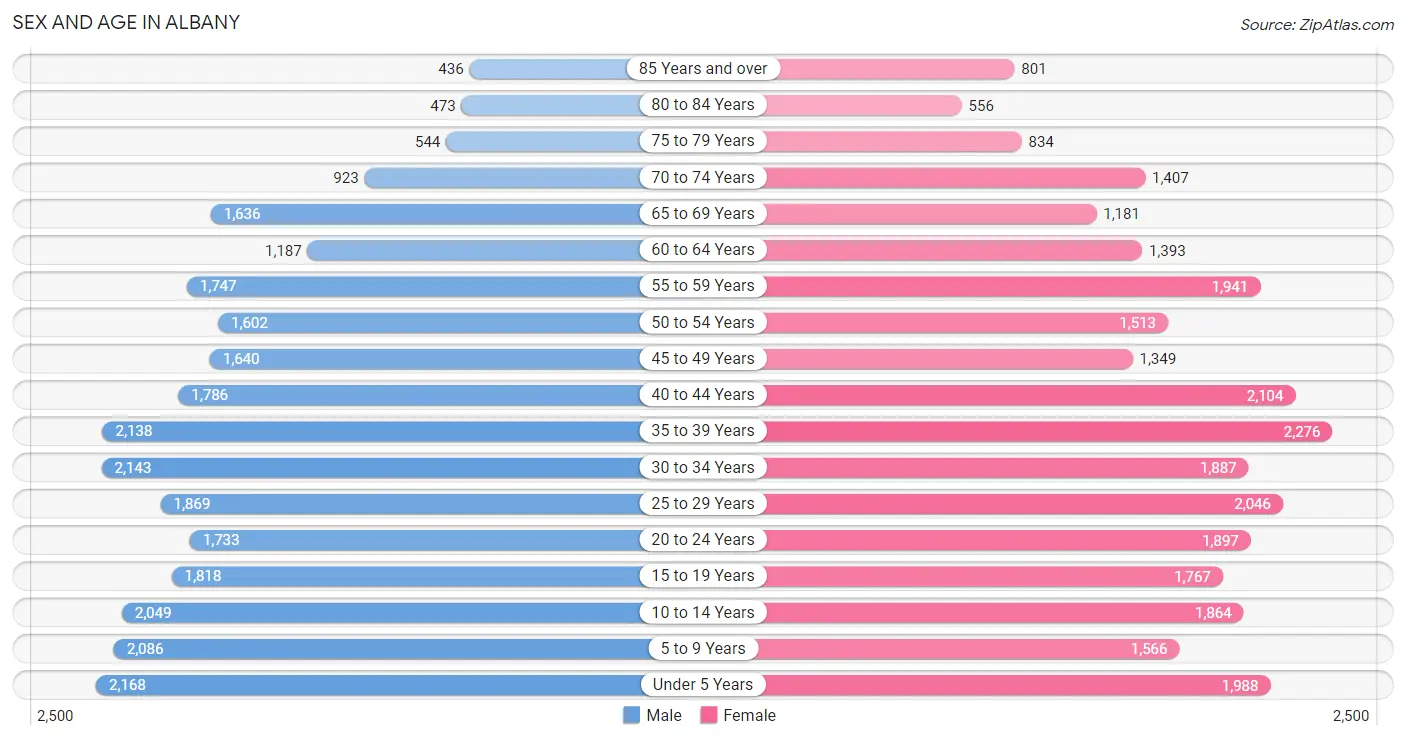
Sex and Age in Albany
Sex and Age in Albany
The most populous age groups in Albany are Under 5 Years (2,168 | 7.7%) for men and 35 to 39 Years (2,276 | 8.0%) for women.
| Age Bracket | Male | Female |
| Under 5 Years | 2,168 (7.7%) | 1,988 (7.0%) |
| 5 to 9 Years | 2,086 (7.5%) | 1,566 (5.5%) |
| 10 to 14 Years | 2,049 (7.3%) | 1,864 (6.6%) |
| 15 to 19 Years | 1,818 (6.5%) | 1,767 (6.2%) |
| 20 to 24 Years | 1,733 (6.2%) | 1,897 (6.7%) |
| 25 to 29 Years | 1,869 (6.7%) | 2,046 (7.2%) |
| 30 to 34 Years | 2,143 (7.7%) | 1,887 (6.7%) |
| 35 to 39 Years | 2,138 (7.6%) | 2,276 (8.0%) |
| 40 to 44 Years | 1,786 (6.4%) | 2,104 (7.4%) |
| 45 to 49 Years | 1,640 (5.9%) | 1,349 (4.8%) |
| 50 to 54 Years | 1,602 (5.7%) | 1,513 (5.3%) |
| 55 to 59 Years | 1,747 (6.2%) | 1,941 (6.8%) |
| 60 to 64 Years | 1,187 (4.2%) | 1,393 (4.9%) |
| 65 to 69 Years | 1,636 (5.9%) | 1,181 (4.2%) |
| 70 to 74 Years | 923 (3.3%) | 1,407 (5.0%) |
| 75 to 79 Years | 544 (1.9%) | 834 (2.9%) |
| 80 to 84 Years | 473 (1.7%) | 556 (2.0%) |
| 85 Years and over | 436 (1.6%) | 801 (2.8%) |
| Total | 27,978 (100.0%) | 28,370 (100.0%) |
Families and Households in Albany
Median Family Size in Albany
The median family size in Albany is 3.11 persons per family, with married-couple families (10,496 | 75.8%) accounting for the largest median family size of 3.19 persons per family. On the other hand, single male/father families (1,219 | 8.8%) represent the smallest median family size with 2.65 persons per family.
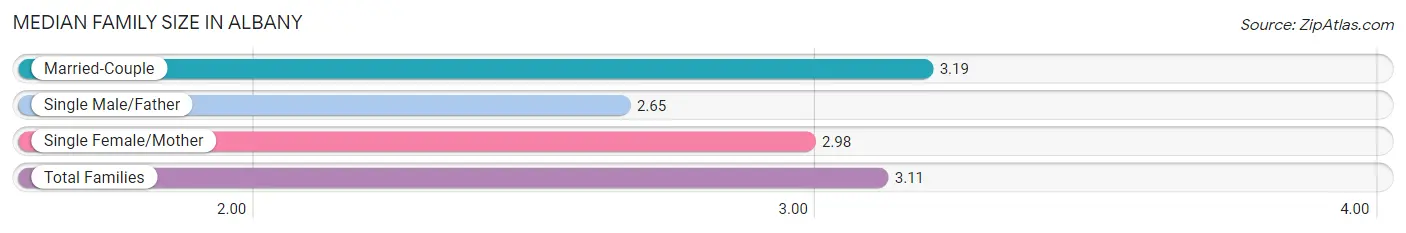
| Family Type | # Families | Family Size |
| Married-Couple | 10,496 (75.8%) | 3.19 |
| Single Male/Father | 1,219 (8.8%) | 2.65 |
| Single Female/Mother | 2,126 (15.4%) | 2.98 |
| Total Families | 13,841 (100.0%) | 3.11 |
Median Household Size in Albany
The median household size in Albany is 2.58 persons per household, with single female/mother households (2,126 | 9.9%) accounting for the largest median household size of 3.3 persons per household. non-family households (7,643 | 35.6%) represent the smallest median household size with 1.43 persons per household.
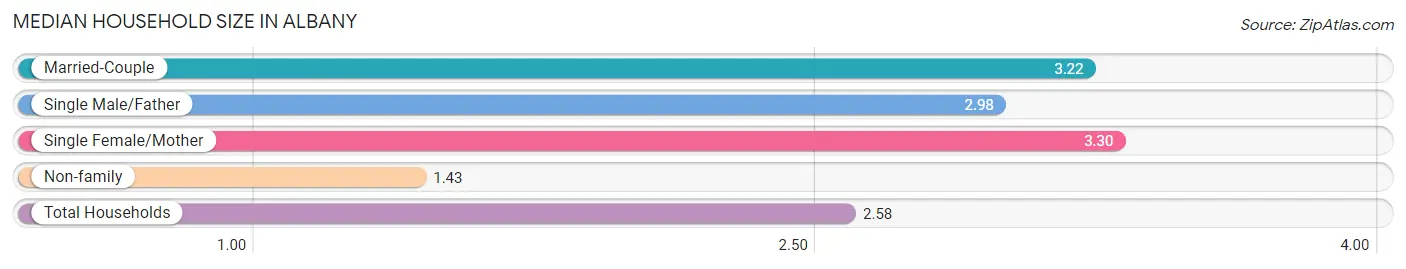
| Household Type | # Households | Household Size |
| Married-Couple | 10,496 (48.8%) | 3.22 |
| Single Male/Father | 1,219 (5.7%) | 2.98 |
| Single Female/Mother | 2,126 (9.9%) | 3.30 |
| Non-family | 7,643 (35.6%) | 1.43 |
| Total Households | 21,484 (100.0%) | 2.58 |
Household Size by Marriage Status in Albany
Out of a total of 21,484 households in Albany, 13,841 (64.4%) are family households, while 7,643 (35.6%) are nonfamily households. The most numerous type of family households are 2-person households, comprising 5,697, and the most common type of nonfamily households are 1-person households, comprising 5,764.
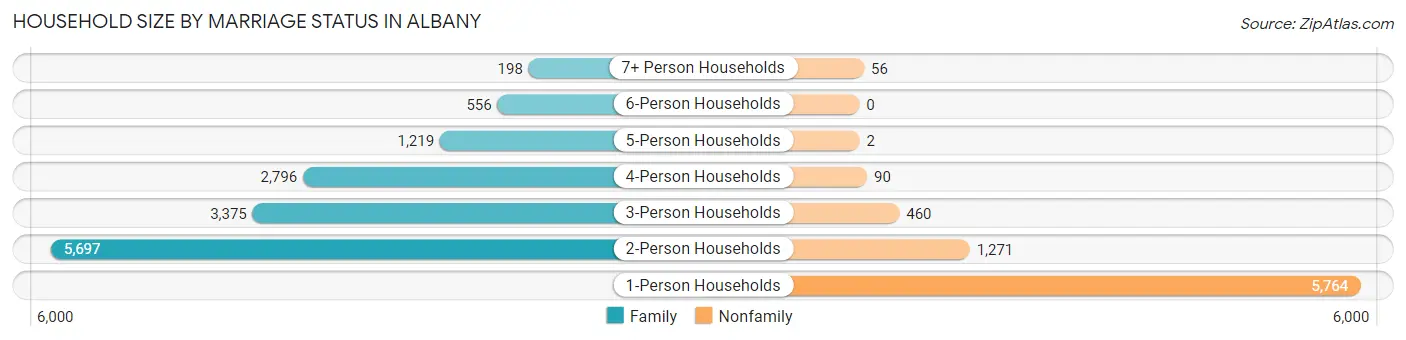
| Household Size | Family Households | Nonfamily Households |
| 1-Person Households | - | 5,764 (26.8%) |
| 2-Person Households | 5,697 (26.5%) | 1,271 (5.9%) |
| 3-Person Households | 3,375 (15.7%) | 460 (2.1%) |
| 4-Person Households | 2,796 (13.0%) | 90 (0.4%) |
| 5-Person Households | 1,219 (5.7%) | 2 (0.0%) |
| 6-Person Households | 556 (2.6%) | 0 (0.0%) |
| 7+ Person Households | 198 (0.9%) | 56 (0.3%) |
| Total | 13,841 (64.4%) | 7,643 (35.6%) |
Female Fertility in Albany
Fertility by Age in Albany
Average fertility rate in Albany is 47.0 births per 1,000 women. Women in the age bracket of 20 to 34 years have the highest fertility rate with 101.0 births per 1,000 women. Women in the age bracket of 20 to 34 years acount for 92.0% of all women with births.
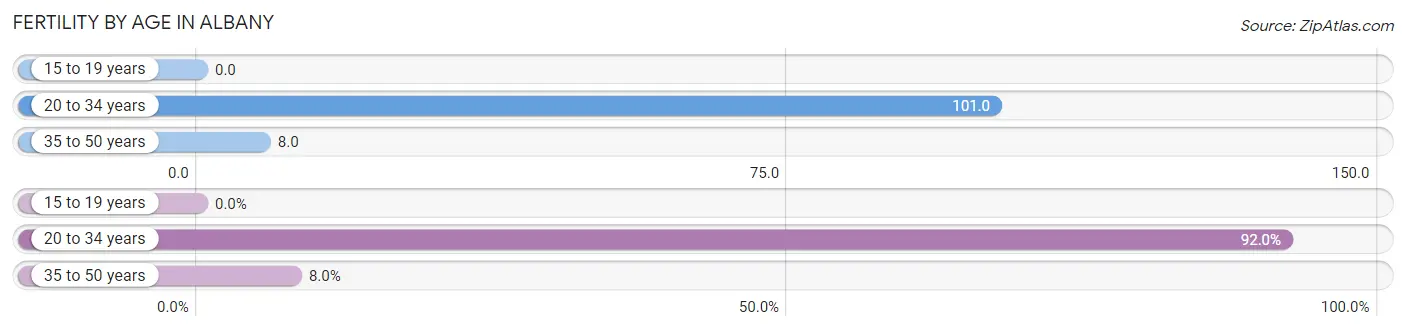
| Age Bracket | Women with Births | Births / 1,000 Women |
| 15 to 19 years | 0 (0.0%) | 0.0 |
| 20 to 34 years | 589 (92.0%) | 101.0 |
| 35 to 50 years | 51 (8.0%) | 8.0 |
| Total | 640 (100.0%) | 47.0 |
Fertility by Age by Marriage Status in Albany
84.5% of women with births (640) in Albany are married. The highest percentage of unmarried women with births falls into 35 to 50 years age bracket with 21.6% of them unmarried at the time of birth, while the lowest percentage of unmarried women with births belong to 20 to 34 years age bracket with 14.9% of them unmarried.
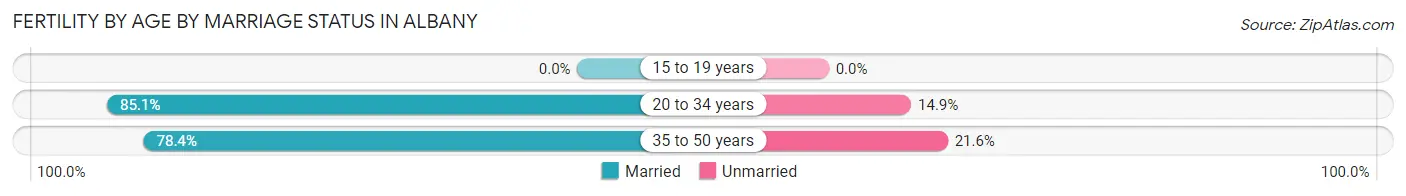
| Age Bracket | Married | Unmarried |
| 15 to 19 years | 0 (0.0%) | 0 (0.0%) |
| 20 to 34 years | 501 (85.1%) | 88 (14.9%) |
| 35 to 50 years | 40 (78.4%) | 11 (21.6%) |
| Total | 541 (84.5%) | 99 (15.5%) |
Fertility by Education in Albany
Average fertility rate in Albany is 47.0 births per 1,000 women. Women with the education attainment of graduate degree have the highest fertility rate of 67.0 births per 1,000 women, while women with the education attainment of less than high school have the lowest fertility at 11.0 births per 1,000 women. Women with the education attainment of college or associate's degree represent 38.0% of all women with births.
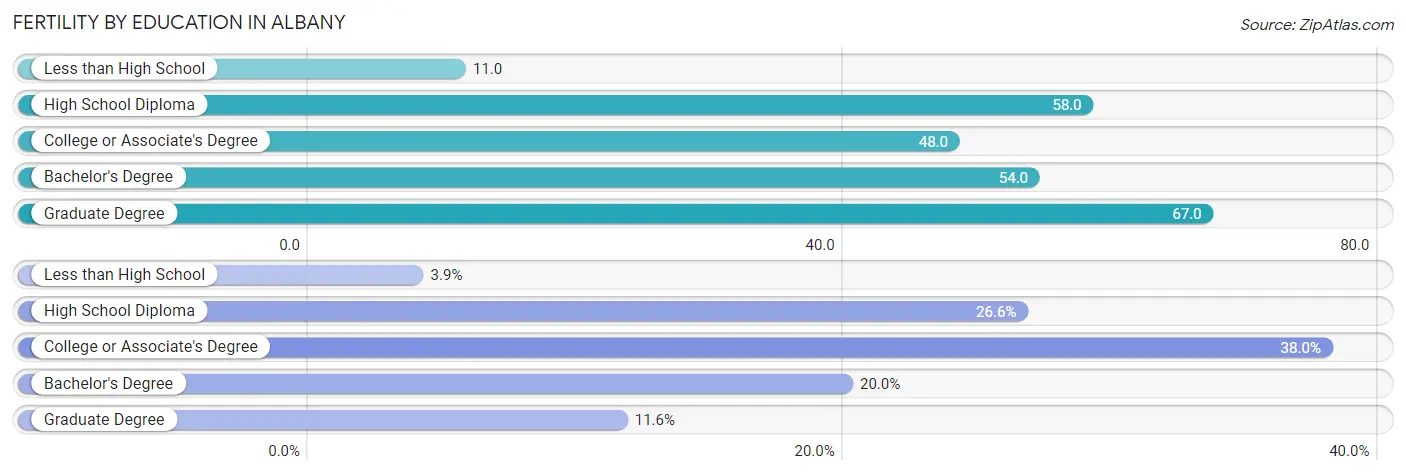
| Educational Attainment | Women with Births | Births / 1,000 Women |
| Less than High School | 25 (3.9%) | 11.0 |
| High School Diploma | 170 (26.6%) | 58.0 |
| College or Associate's Degree | 243 (38.0%) | 48.0 |
| Bachelor's Degree | 128 (20.0%) | 54.0 |
| Graduate Degree | 74 (11.6%) | 67.0 |
| Total | 640 (100.0%) | 47.0 |
Fertility by Education by Marriage Status in Albany
15.5% of women with births in Albany are unmarried. Women with the educational attainment of bachelor's degree are most likely to be married with 100.0% of them married at childbirth, while women with the educational attainment of less than high school are least likely to be married with 60.0% of them unmarried at childbirth.
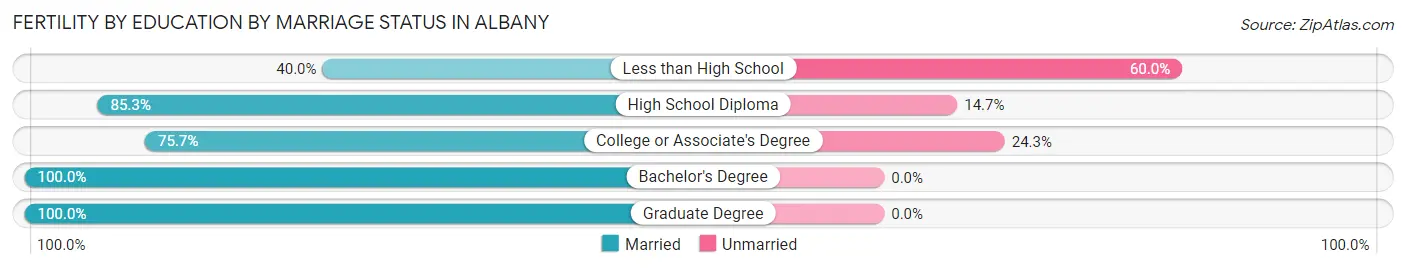
| Educational Attainment | Married | Unmarried |
| Less than High School | 10 (40.0%) | 15 (60.0%) |
| High School Diploma | 145 (85.3%) | 25 (14.7%) |
| College or Associate's Degree | 184 (75.7%) | 59 (24.3%) |
| Bachelor's Degree | 128 (100.0%) | 0 (0.0%) |
| Graduate Degree | 74 (100.0%) | 0 (0.0%) |
| Total | 541 (84.5%) | 99 (15.5%) |
Employment Characteristics in Albany
Employment by Class of Employer in Albany
Among the 25,025 employed individuals in Albany, private company employees (16,320 | 65.2%), not-for-profit organizations (2,765 | 11.1%), and state government employees (1,956 | 7.8%) make up the most common classes of employment.
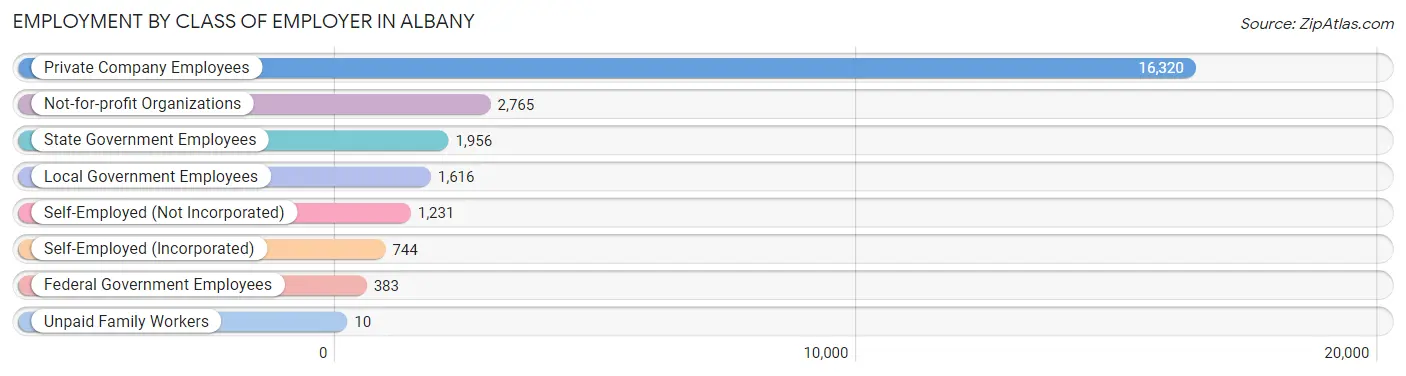
| Employer Class | # Employees | % Employees |
| Private Company Employees | 16,320 | 65.2% |
| Self-Employed (Incorporated) | 744 | 3.0% |
| Self-Employed (Not Incorporated) | 1,231 | 4.9% |
| Not-for-profit Organizations | 2,765 | 11.1% |
| Local Government Employees | 1,616 | 6.5% |
| State Government Employees | 1,956 | 7.8% |
| Federal Government Employees | 383 | 1.5% |
| Unpaid Family Workers | 10 | 0.0% |
| Total | 25,025 | 100.0% |
Employment Status by Age in Albany
According to the labor force statistics for Albany, out of the total population over 16 years of age (43,646), 63.0% or 27,497 individuals are in the labor force, with 6.7% or 1,842 of them unemployed. The age group with the highest labor force participation rate is 25 to 29 years, with 82.7% or 3,238 individuals in the labor force. Within the labor force, the 16 to 19 years age range has the highest percentage of unemployed individuals, with 30.9% or 366 of them being unemployed.
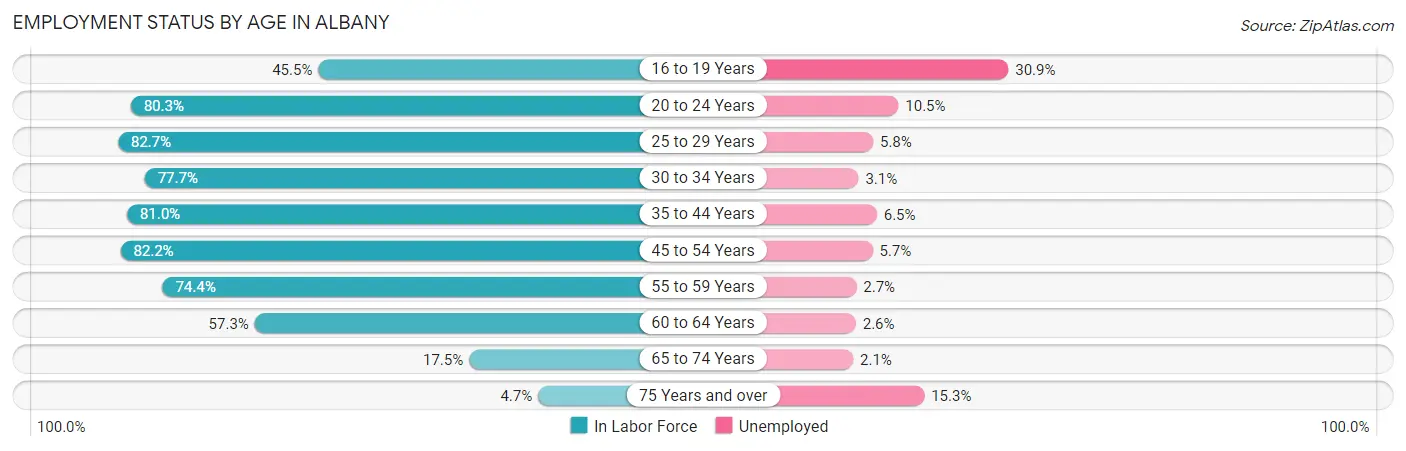
| Age Bracket | In Labor Force | Unemployed |
| 16 to 19 Years | 1,185 (45.5%) | 366 (30.9%) |
| 20 to 24 Years | 2,915 (80.3%) | 306 (10.5%) |
| 25 to 29 Years | 3,238 (82.7%) | 188 (5.8%) |
| 30 to 34 Years | 3,131 (77.7%) | 97 (3.1%) |
| 35 to 44 Years | 6,726 (81.0%) | 437 (6.5%) |
| 45 to 54 Years | 5,017 (82.2%) | 286 (5.7%) |
| 55 to 59 Years | 2,744 (74.4%) | 74 (2.7%) |
| 60 to 64 Years | 1,478 (57.3%) | 38 (2.6%) |
| 65 to 74 Years | 901 (17.5%) | 19 (2.1%) |
| 75 Years and over | 171 (4.7%) | 26 (15.3%) |
| Total | 27,497 (63.0%) | 1,842 (6.7%) |
Employment Status by Educational Attainment in Albany
According to labor force statistics for Albany, 78.0% of individuals (22,324) out of the total population between 25 and 64 years of age (28,621) are in the labor force, with 5.0% or 1,116 of them being unemployed. The group with the highest labor force participation rate are those with the educational attainment of bachelor's degree or higher, with 87.0% or 7,136 individuals in the labor force. Within the labor force, individuals with college / associate degree education have the highest percentage of unemployment, with 6.6% or 600 of them being unemployed.
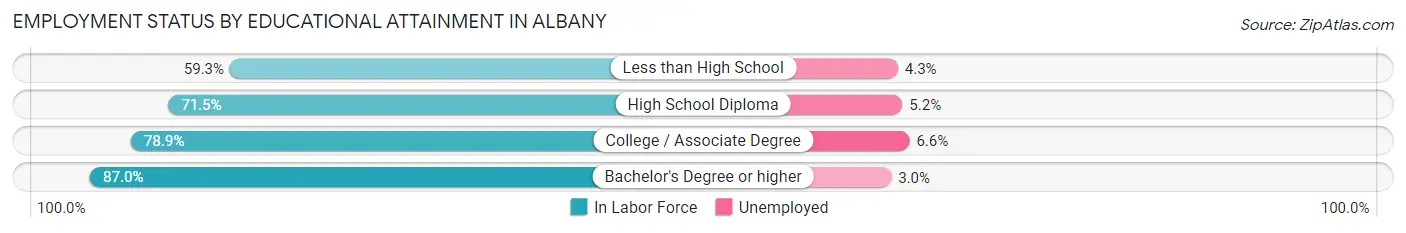
| Educational Attainment | In Labor Force | Unemployed |
| Less than High School | 1,283 (59.3%) | 93 (4.3%) |
| High School Diploma | 4,816 (71.5%) | 350 (5.2%) |
| College / Associate Degree | 9,089 (78.9%) | 760 (6.6%) |
| Bachelor's Degree or higher | 7,136 (87.0%) | 246 (3.0%) |
| Total | 22,324 (78.0%) | 1,431 (5.0%) |
Employment Occupations by Sex in Albany
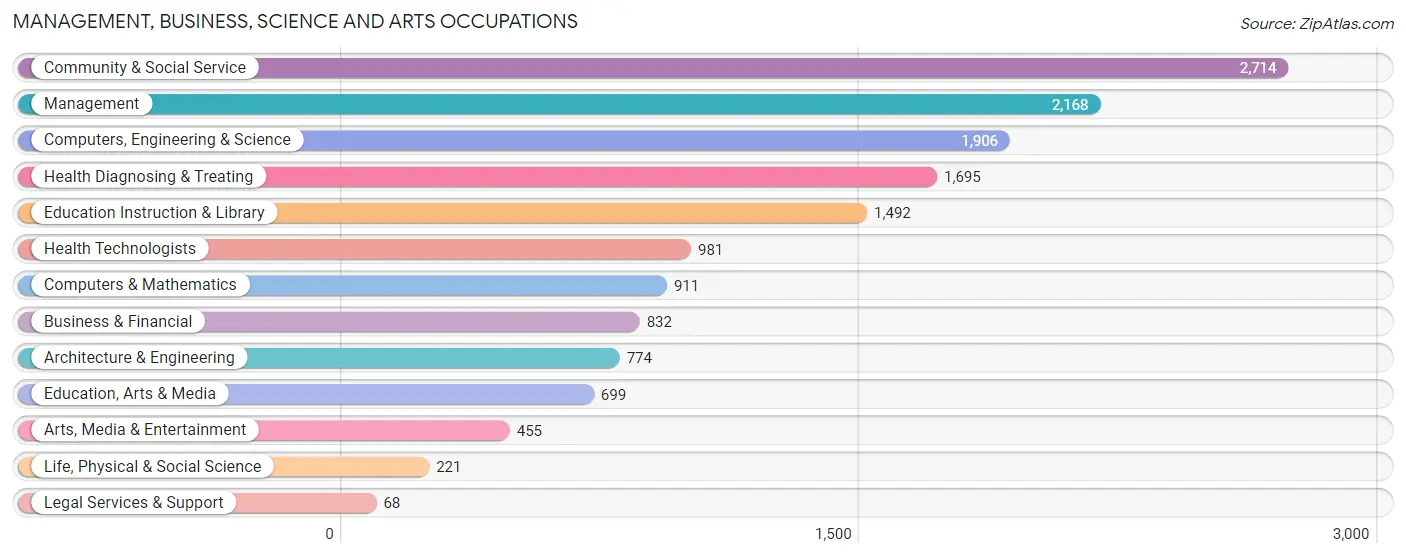
Management, Business, Science and Arts Occupations
The most common Management, Business, Science and Arts occupations in Albany are Community & Social Service (2,714 | 10.6%), Management (2,168 | 8.5%), Computers, Engineering & Science (1,906 | 7.4%), Health Diagnosing & Treating (1,695 | 6.6%), and Education Instruction & Library (1,492 | 5.8%).
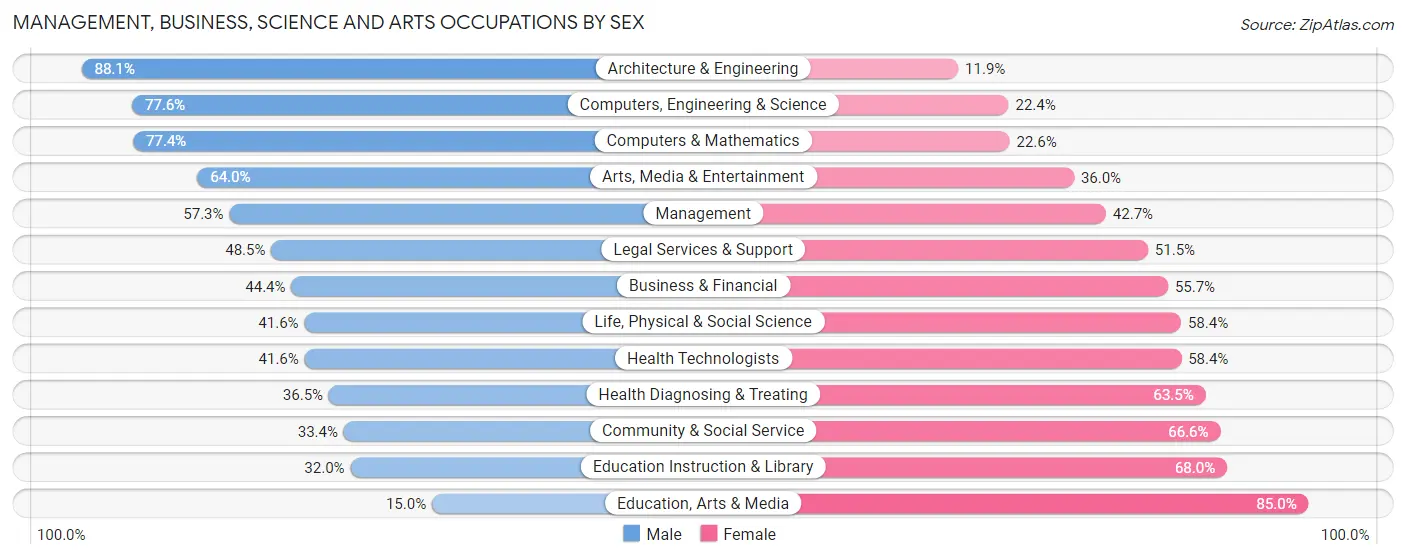
Management, Business, Science and Arts Occupations by Sex
Within the Management, Business, Science and Arts occupations in Albany, the most male-oriented occupations are Architecture & Engineering (88.1%), Computers, Engineering & Science (77.6%), and Computers & Mathematics (77.4%), while the most female-oriented occupations are Education, Arts & Media (85.0%), Education Instruction & Library (68.0%), and Community & Social Service (66.6%).
| Occupation | Male | Female |
| Management | 1,242 (57.3%) | 926 (42.7%) |
| Business & Financial | 369 (44.4%) | 463 (55.6%) |
| Computers, Engineering & Science | 1,479 (77.6%) | 427 (22.4%) |
| Computers & Mathematics | 705 (77.4%) | 206 (22.6%) |
| Architecture & Engineering | 682 (88.1%) | 92 (11.9%) |
| Life, Physical & Social Science | 92 (41.6%) | 129 (58.4%) |
| Community & Social Service | 907 (33.4%) | 1,807 (66.6%) |
| Education, Arts & Media | 105 (15.0%) | 594 (85.0%) |
| Legal Services & Support | 33 (48.5%) | 35 (51.5%) |
| Education Instruction & Library | 478 (32.0%) | 1,014 (68.0%) |
| Arts, Media & Entertainment | 291 (64.0%) | 164 (36.0%) |
| Health Diagnosing & Treating | 619 (36.5%) | 1,076 (63.5%) |
| Health Technologists | 408 (41.6%) | 573 (58.4%) |
| Total (Category) | 4,616 (49.5%) | 4,699 (50.4%) |
| Total (Overall) | 13,597 (53.0%) | 12,062 (47.0%) |
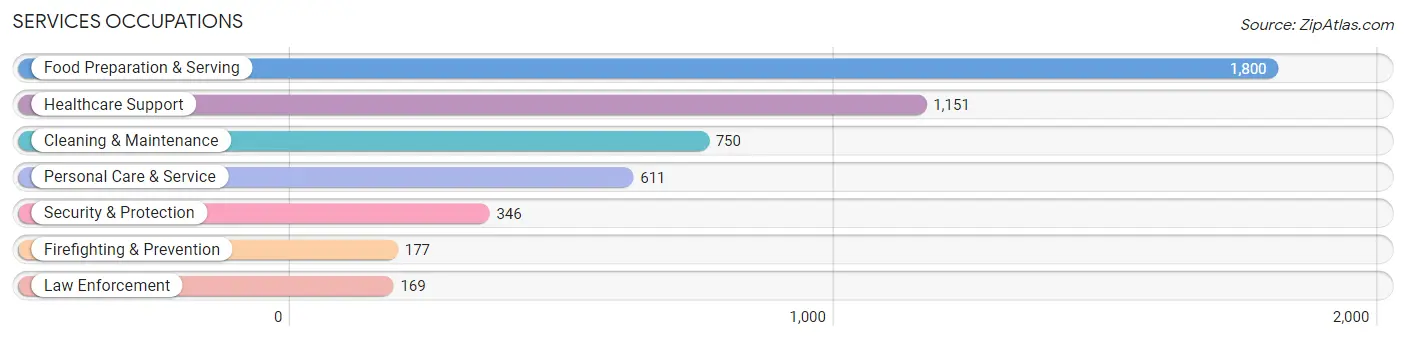
Services Occupations
The most common Services occupations in Albany are Food Preparation & Serving (1,800 | 7.0%), Healthcare Support (1,151 | 4.5%), Cleaning & Maintenance (750 | 2.9%), Personal Care & Service (611 | 2.4%), and Security & Protection (346 | 1.3%).
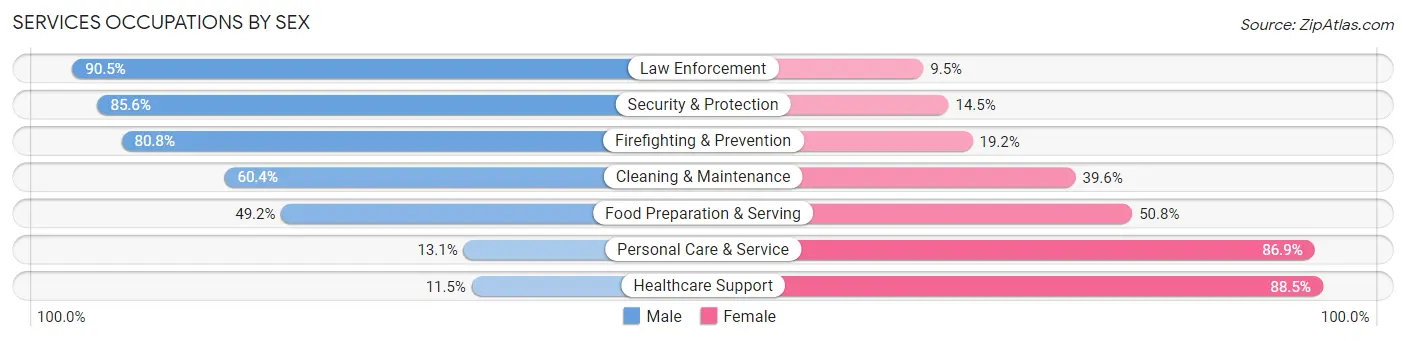
Services Occupations by Sex
Within the Services occupations in Albany, the most male-oriented occupations are Law Enforcement (90.5%), Security & Protection (85.6%), and Firefighting & Prevention (80.8%), while the most female-oriented occupations are Healthcare Support (88.5%), Personal Care & Service (86.9%), and Food Preparation & Serving (50.8%).
| Occupation | Male | Female |
| Healthcare Support | 132 (11.5%) | 1,019 (88.5%) |
| Security & Protection | 296 (85.6%) | 50 (14.4%) |
| Firefighting & Prevention | 143 (80.8%) | 34 (19.2%) |
| Law Enforcement | 153 (90.5%) | 16 (9.5%) |
| Food Preparation & Serving | 885 (49.2%) | 915 (50.8%) |
| Cleaning & Maintenance | 453 (60.4%) | 297 (39.6%) |
| Personal Care & Service | 80 (13.1%) | 531 (86.9%) |
| Total (Category) | 1,846 (39.6%) | 2,812 (60.4%) |
| Total (Overall) | 13,597 (53.0%) | 12,062 (47.0%) |
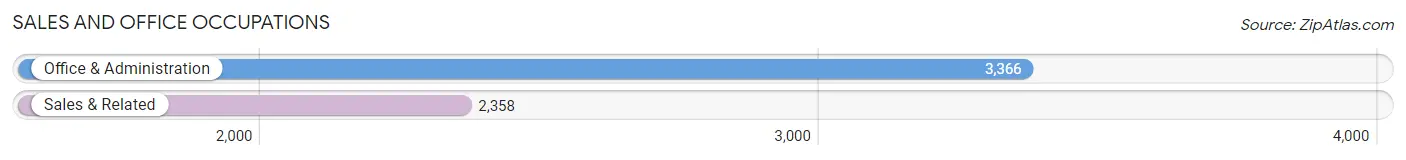
Sales and Office Occupations
The most common Sales and Office occupations in Albany are Office & Administration (3,366 | 13.1%), and Sales & Related (2,358 | 9.2%).
Sales and Office Occupations by Sex
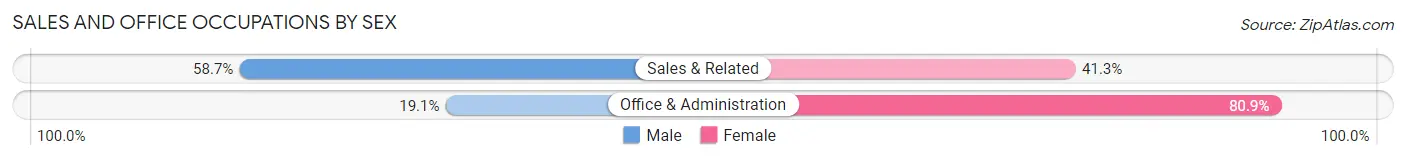
| Occupation | Male | Female |
| Sales & Related | 1,385 (58.7%) | 973 (41.3%) |
| Office & Administration | 643 (19.1%) | 2,723 (80.9%) |
| Total (Category) | 2,028 (35.4%) | 3,696 (64.6%) |
| Total (Overall) | 13,597 (53.0%) | 12,062 (47.0%) |
Natural Resources, Construction and Maintenance Occupations
The most common Natural Resources, Construction and Maintenance occupations in Albany are Construction & Extraction (1,685 | 6.6%), Installation, Maintenance & Repair (473 | 1.8%), and Farming, Fishing & Forestry (243 | 0.9%).
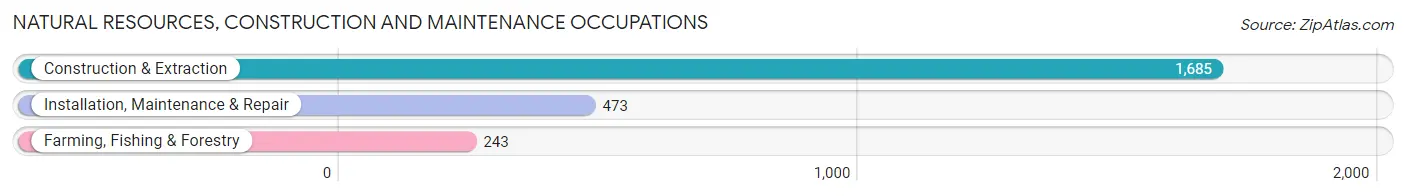
Natural Resources, Construction and Maintenance Occupations by Sex
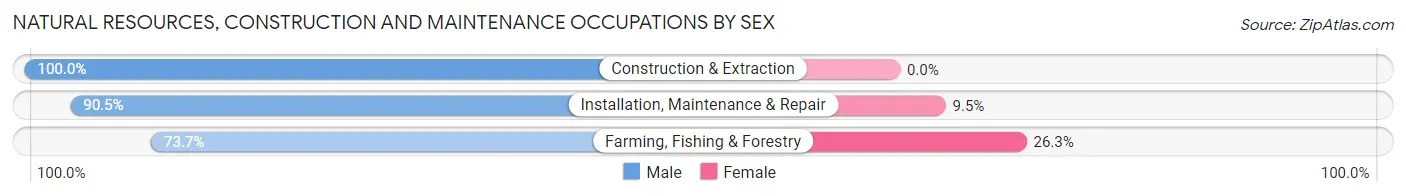
| Occupation | Male | Female |
| Farming, Fishing & Forestry | 179 (73.7%) | 64 (26.3%) |
| Construction & Extraction | 1,685 (100.0%) | 0 (0.0%) |
| Installation, Maintenance & Repair | 428 (90.5%) | 45 (9.5%) |
| Total (Category) | 2,292 (95.5%) | 109 (4.5%) |
| Total (Overall) | 13,597 (53.0%) | 12,062 (47.0%) |
Production, Transportation and Moving Occupations
The most common Production, Transportation and Moving occupations in Albany are Production (1,454 | 5.7%), Material Moving (1,254 | 4.9%), and Transportation (853 | 3.3%).
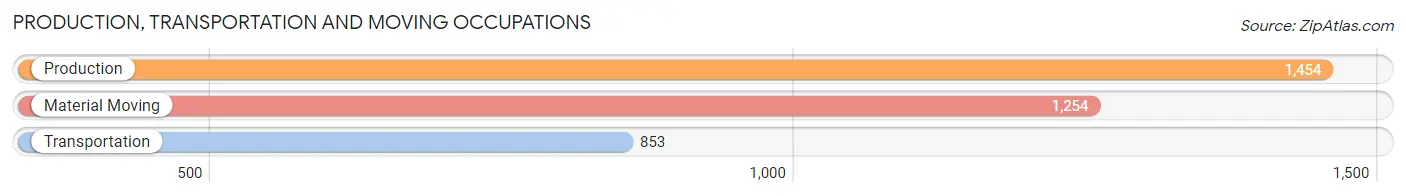
Production, Transportation and Moving Occupations by Sex
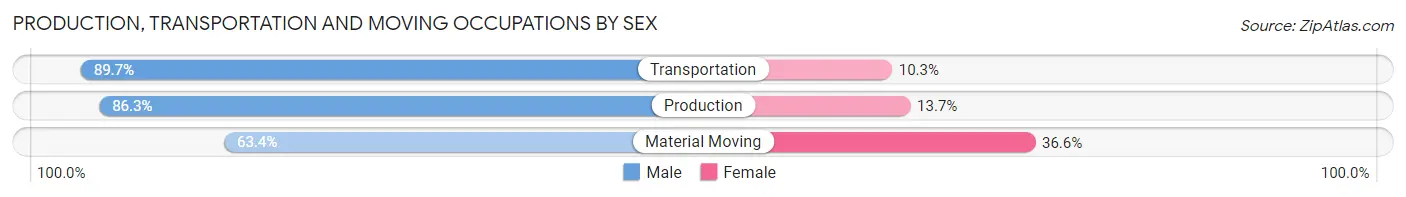
| Occupation | Male | Female |
| Production | 1,255 (86.3%) | 199 (13.7%) |
| Transportation | 765 (89.7%) | 88 (10.3%) |
| Material Moving | 795 (63.4%) | 459 (36.6%) |
| Total (Category) | 2,815 (79.0%) | 746 (20.9%) |
| Total (Overall) | 13,597 (53.0%) | 12,062 (47.0%) |
Employment Industries by Sex in Albany
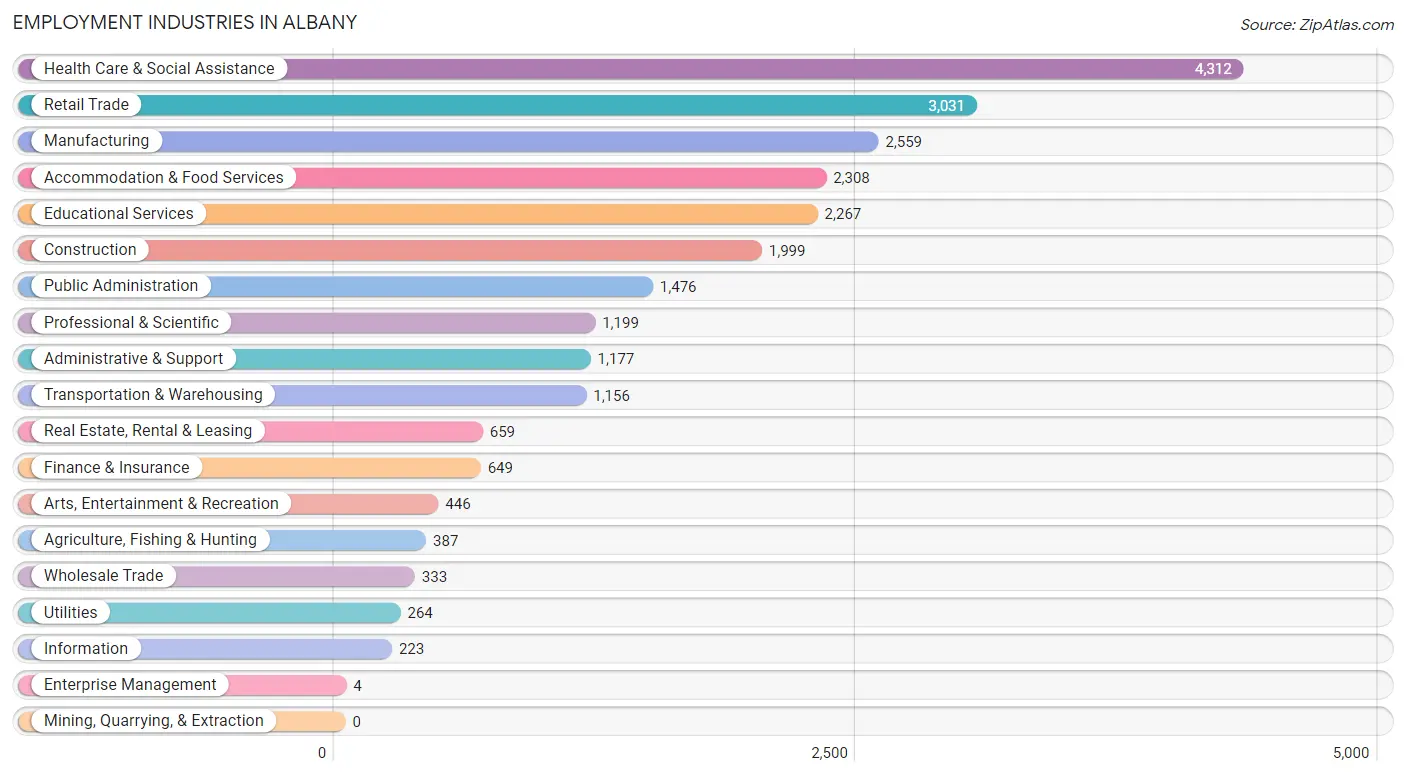
Employment Industries in Albany
The major employment industries in Albany include Health Care & Social Assistance (4,312 | 16.8%), Retail Trade (3,031 | 11.8%), Manufacturing (2,559 | 10.0%), Accommodation & Food Services (2,308 | 9.0%), and Educational Services (2,267 | 8.8%).
Employment Industries by Sex in Albany
The Albany industries that see more men than women are Construction (97.0%), Transportation & Warehousing (81.8%), and Utilities (81.4%), whereas the industries that tend to have a higher number of women are Enterprise Management (100.0%), Health Care & Social Assistance (77.2%), and Finance & Insurance (73.7%).
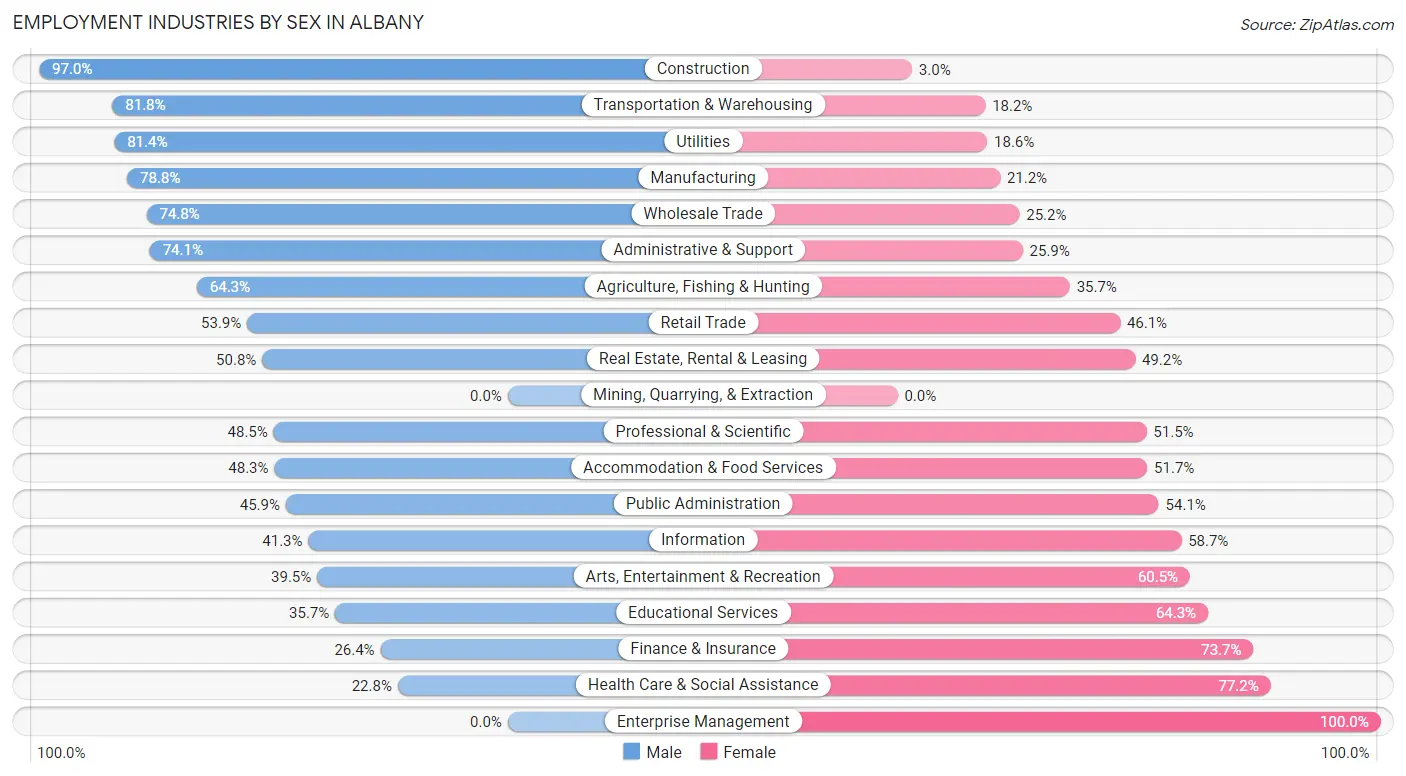
| Industry | Male | Female |
| Agriculture, Fishing & Hunting | 249 (64.3%) | 138 (35.7%) |
| Mining, Quarrying, & Extraction | 0 (0.0%) | 0 (0.0%) |
| Construction | 1,939 (97.0%) | 60 (3.0%) |
| Manufacturing | 2,016 (78.8%) | 543 (21.2%) |
| Wholesale Trade | 249 (74.8%) | 84 (25.2%) |
| Retail Trade | 1,635 (53.9%) | 1,396 (46.1%) |
| Transportation & Warehousing | 946 (81.8%) | 210 (18.2%) |
| Utilities | 215 (81.4%) | 49 (18.6%) |
| Information | 92 (41.3%) | 131 (58.7%) |
| Finance & Insurance | 171 (26.4%) | 478 (73.7%) |
| Real Estate, Rental & Leasing | 335 (50.8%) | 324 (49.2%) |
| Professional & Scientific | 581 (48.5%) | 618 (51.5%) |
| Enterprise Management | 0 (0.0%) | 4 (100.0%) |
| Administrative & Support | 872 (74.1%) | 305 (25.9%) |
| Educational Services | 810 (35.7%) | 1,457 (64.3%) |
| Health Care & Social Assistance | 982 (22.8%) | 3,330 (77.2%) |
| Arts, Entertainment & Recreation | 176 (39.5%) | 270 (60.5%) |
| Accommodation & Food Services | 1,115 (48.3%) | 1,193 (51.7%) |
| Public Administration | 678 (45.9%) | 798 (54.1%) |
| Total | 13,597 (53.0%) | 12,062 (47.0%) |
Education in Albany
School Enrollment in Albany
The most common levels of schooling among the 12,765 students in Albany are high school (2,950 | 23.1%), elementary school (2,884 | 22.6%), and middle school (2,619 | 20.5%).
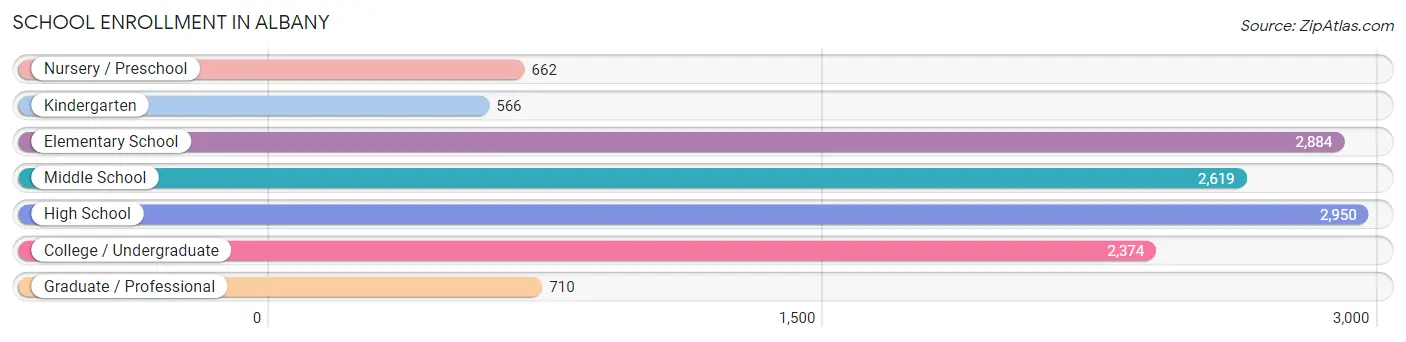
| School Level | # Students | % Students |
| Nursery / Preschool | 662 | 5.2% |
| Kindergarten | 566 | 4.4% |
| Elementary School | 2,884 | 22.6% |
| Middle School | 2,619 | 20.5% |
| High School | 2,950 | 23.1% |
| College / Undergraduate | 2,374 | 18.6% |
| Graduate / Professional | 710 | 5.6% |
| Total | 12,765 | 100.0% |
School Enrollment by Age by Funding Source in Albany
Out of a total of 12,765 students who are enrolled in schools in Albany, 1,442 (11.3%) attend a private institution, while the remaining 11,323 (88.7%) are enrolled in public schools. The age group of 3 to 4 year olds has the highest likelihood of being enrolled in private schools, with 310 (55.7% in the age bracket) enrolled. Conversely, the age group of 20 to 24 year olds has the lowest likelihood of being enrolled in a private school, with 1,161 (95.6% in the age bracket) attending a public institution.
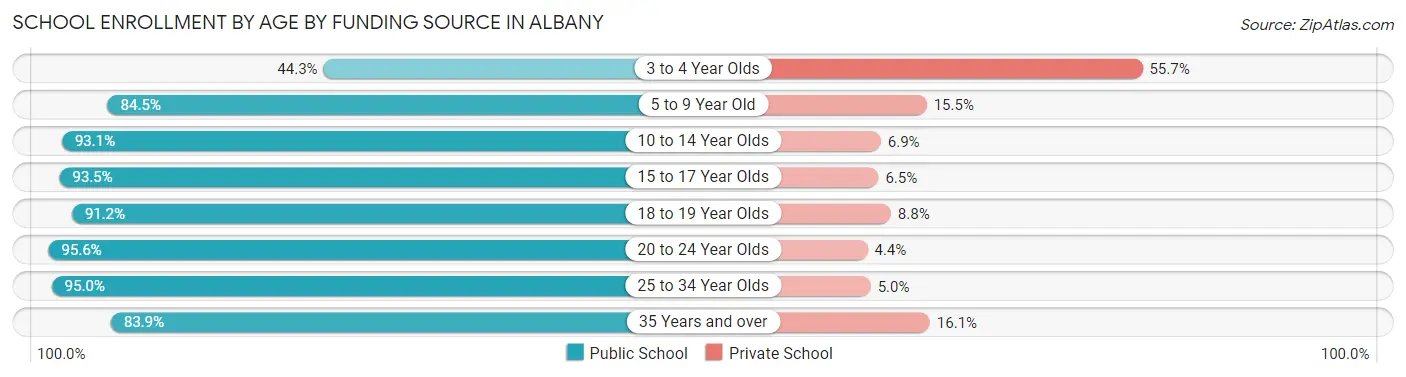
| Age Bracket | Public School | Private School |
| 3 to 4 Year Olds | 247 (44.3%) | 310 (55.7%) |
| 5 to 9 Year Old | 2,525 (84.5%) | 462 (15.5%) |
| 10 to 14 Year Olds | 3,147 (93.1%) | 234 (6.9%) |
| 15 to 17 Year Olds | 2,137 (93.5%) | 148 (6.5%) |
| 18 to 19 Year Olds | 694 (91.2%) | 67 (8.8%) |
| 20 to 24 Year Olds | 1,161 (95.6%) | 54 (4.4%) |
| 25 to 34 Year Olds | 772 (95.0%) | 41 (5.0%) |
| 35 Years and over | 643 (83.9%) | 123 (16.1%) |
| Total | 11,323 (88.7%) | 1,442 (11.3%) |
Educational Attainment by Field of Study in Albany
Business (1,541 | 13.4%), education (1,386 | 12.1%), science & technology (1,265 | 11.0%), social sciences (1,185 | 10.3%), and bio, nature & agricultural (1,005 | 8.8%) are the most common fields of study among 11,479 individuals in Albany who have obtained a bachelor's degree or higher.
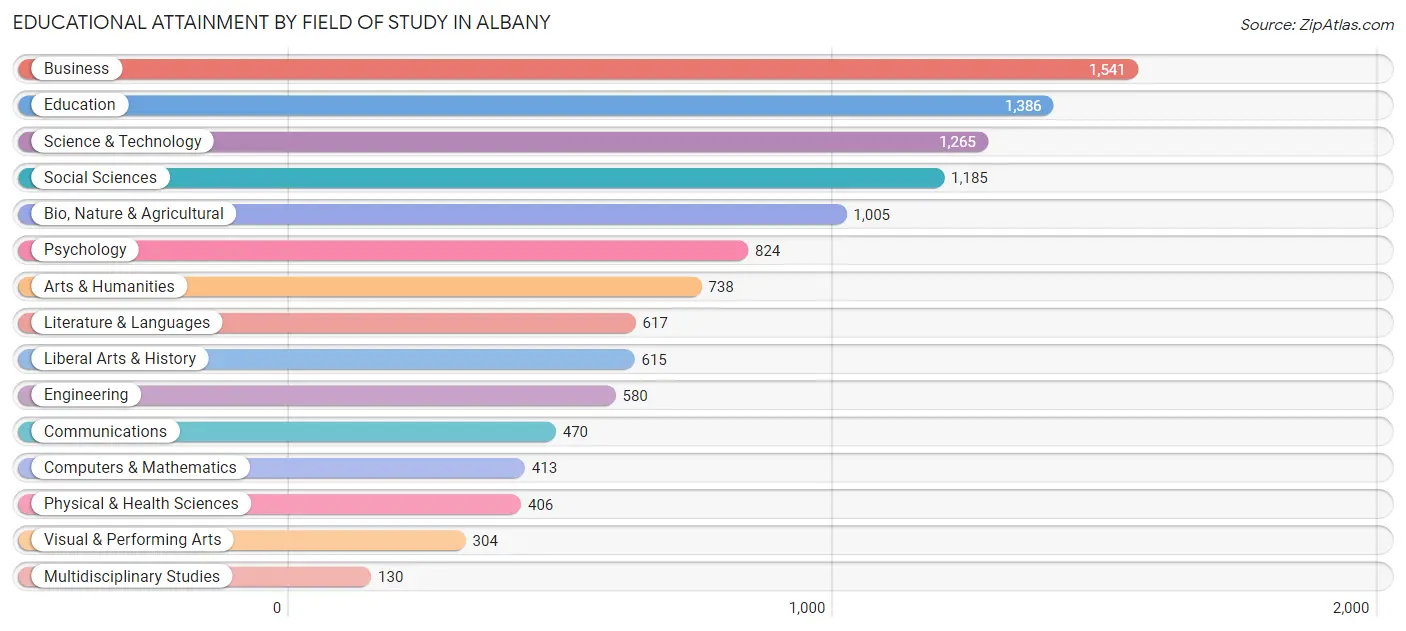
| Field of Study | # Graduates | % Graduates |
| Computers & Mathematics | 413 | 3.6% |
| Bio, Nature & Agricultural | 1,005 | 8.8% |
| Physical & Health Sciences | 406 | 3.5% |
| Psychology | 824 | 7.2% |
| Social Sciences | 1,185 | 10.3% |
| Engineering | 580 | 5.1% |
| Multidisciplinary Studies | 130 | 1.1% |
| Science & Technology | 1,265 | 11.0% |
| Business | 1,541 | 13.4% |
| Education | 1,386 | 12.1% |
| Literature & Languages | 617 | 5.4% |
| Liberal Arts & History | 615 | 5.4% |
| Visual & Performing Arts | 304 | 2.6% |
| Communications | 470 | 4.1% |
| Arts & Humanities | 738 | 6.4% |
| Total | 11,479 | 100.0% |
Transportation & Commute in Albany
Vehicle Availability by Sex in Albany
The most prevalent vehicle ownership categories in Albany are males with 2 vehicles (5,860, accounting for 44.0%) and females with 2 vehicles (4,472, making up 50.3%).
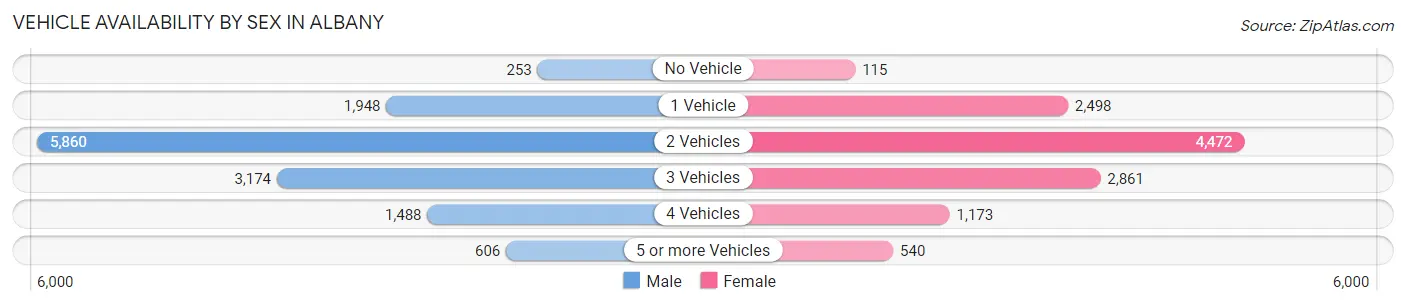
| Vehicles Available | Male | Female |
| No Vehicle | 253 (1.9%) | 115 (1.0%) |
| 1 Vehicle | 1,948 (14.6%) | 2,498 (21.4%) |
| 2 Vehicles | 5,860 (44.0%) | 4,472 (38.4%) |
| 3 Vehicles | 3,174 (23.8%) | 2,861 (24.5%) |
| 4 Vehicles | 1,488 (11.2%) | 1,173 (10.1%) |
| 5 or more Vehicles | 606 (4.5%) | 540 (4.6%) |
| Total | 13,329 (100.0%) | 11,659 (100.0%) |
Commute Time in Albany
The most frequently occuring commute durations in Albany are 10 to 14 minutes (4,464 commuters, 19.7%), 5 to 9 minutes (3,578 commuters, 15.8%), and 15 to 19 minutes (3,423 commuters, 15.1%).
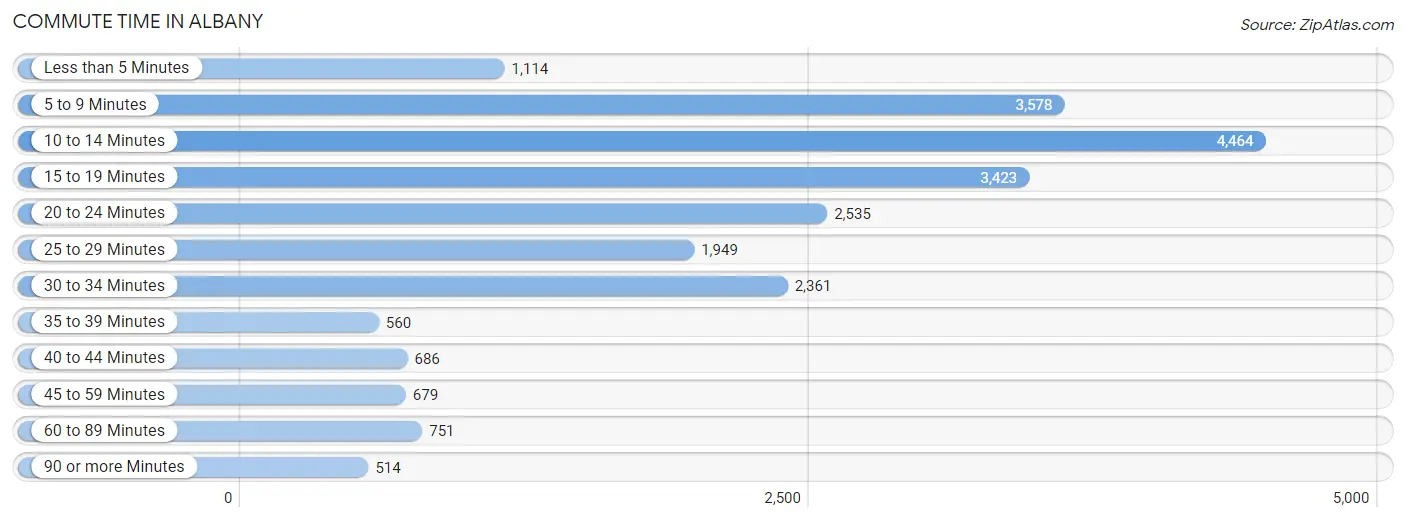
| Commute Time | # Commuters | % Commuters |
| Less than 5 Minutes | 1,114 | 4.9% |
| 5 to 9 Minutes | 3,578 | 15.8% |
| 10 to 14 Minutes | 4,464 | 19.7% |
| 15 to 19 Minutes | 3,423 | 15.1% |
| 20 to 24 Minutes | 2,535 | 11.2% |
| 25 to 29 Minutes | 1,949 | 8.6% |
| 30 to 34 Minutes | 2,361 | 10.4% |
| 35 to 39 Minutes | 560 | 2.5% |
| 40 to 44 Minutes | 686 | 3.0% |
| 45 to 59 Minutes | 679 | 3.0% |
| 60 to 89 Minutes | 751 | 3.3% |
| 90 or more Minutes | 514 | 2.3% |
Commute Time by Sex in Albany
The most common commute times in Albany are 10 to 14 minutes (2,341 commuters, 19.2%) for males and 10 to 14 minutes (2,123 commuters, 20.4%) for females.
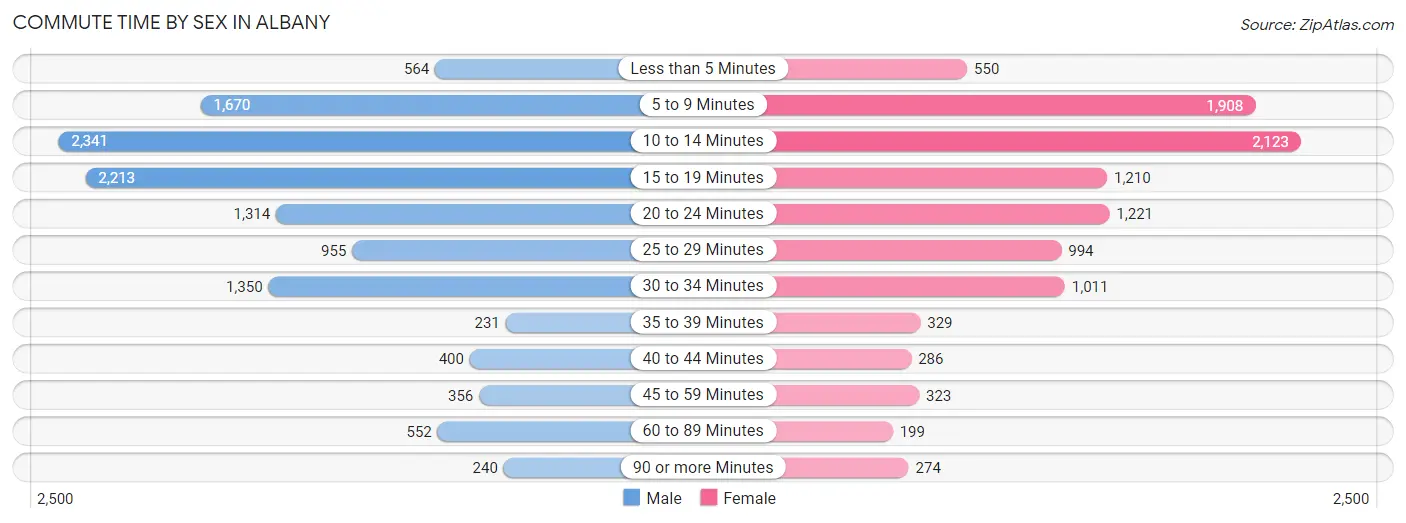
| Commute Time | Male | Female |
| Less than 5 Minutes | 564 (4.6%) | 550 (5.3%) |
| 5 to 9 Minutes | 1,670 (13.7%) | 1,908 (18.3%) |
| 10 to 14 Minutes | 2,341 (19.2%) | 2,123 (20.4%) |
| 15 to 19 Minutes | 2,213 (18.2%) | 1,210 (11.6%) |
| 20 to 24 Minutes | 1,314 (10.8%) | 1,221 (11.7%) |
| 25 to 29 Minutes | 955 (7.8%) | 994 (9.5%) |
| 30 to 34 Minutes | 1,350 (11.1%) | 1,011 (9.7%) |
| 35 to 39 Minutes | 231 (1.9%) | 329 (3.2%) |
| 40 to 44 Minutes | 400 (3.3%) | 286 (2.7%) |
| 45 to 59 Minutes | 356 (2.9%) | 323 (3.1%) |
| 60 to 89 Minutes | 552 (4.5%) | 199 (1.9%) |
| 90 or more Minutes | 240 (2.0%) | 274 (2.6%) |
Time of Departure to Work by Sex in Albany
The most frequent times of departure to work in Albany are 7:00 AM to 7:29 AM (1,776, 14.6%) for males and 7:00 AM to 7:29 AM (1,611, 15.4%) for females.
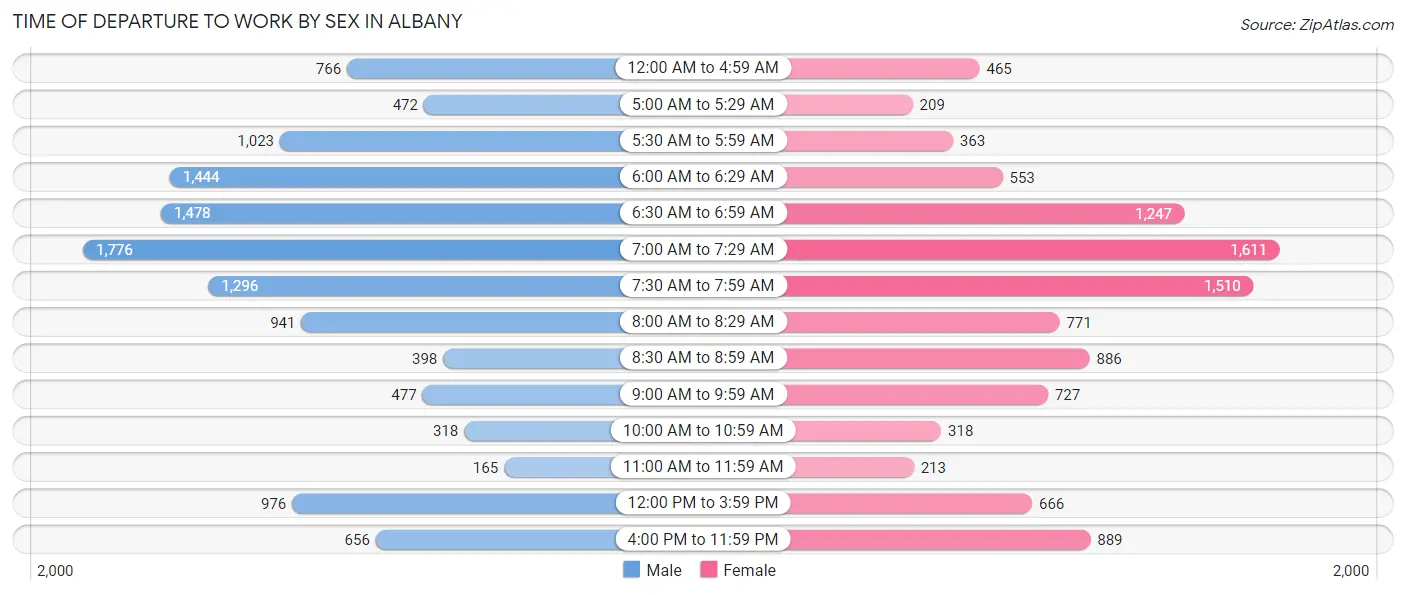
| Time of Departure | Male | Female |
| 12:00 AM to 4:59 AM | 766 (6.3%) | 465 (4.5%) |
| 5:00 AM to 5:29 AM | 472 (3.9%) | 209 (2.0%) |
| 5:30 AM to 5:59 AM | 1,023 (8.4%) | 363 (3.5%) |
| 6:00 AM to 6:29 AM | 1,444 (11.8%) | 553 (5.3%) |
| 6:30 AM to 6:59 AM | 1,478 (12.1%) | 1,247 (12.0%) |
| 7:00 AM to 7:29 AM | 1,776 (14.6%) | 1,611 (15.4%) |
| 7:30 AM to 7:59 AM | 1,296 (10.6%) | 1,510 (14.5%) |
| 8:00 AM to 8:29 AM | 941 (7.7%) | 771 (7.4%) |
| 8:30 AM to 8:59 AM | 398 (3.3%) | 886 (8.5%) |
| 9:00 AM to 9:59 AM | 477 (3.9%) | 727 (7.0%) |
| 10:00 AM to 10:59 AM | 318 (2.6%) | 318 (3.0%) |
| 11:00 AM to 11:59 AM | 165 (1.3%) | 213 (2.0%) |
| 12:00 PM to 3:59 PM | 976 (8.0%) | 666 (6.4%) |
| 4:00 PM to 11:59 PM | 656 (5.4%) | 889 (8.5%) |
| Total | 12,186 (100.0%) | 10,428 (100.0%) |
Housing Occupancy in Albany
Occupancy by Ownership in Albany
Of the total 21,484 dwellings in Albany, owner-occupied units account for 12,930 (60.2%), while renter-occupied units make up 8,554 (39.8%).
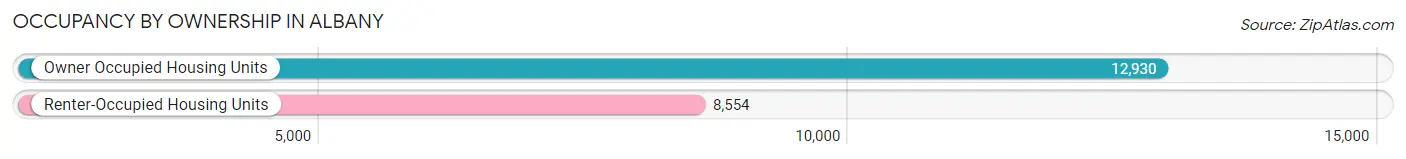
| Occupancy | # Housing Units | % Housing Units |
| Owner Occupied Housing Units | 12,930 | 60.2% |
| Renter-Occupied Housing Units | 8,554 | 39.8% |
| Total Occupied Housing Units | 21,484 | 100.0% |
Occupancy by Household Size in Albany
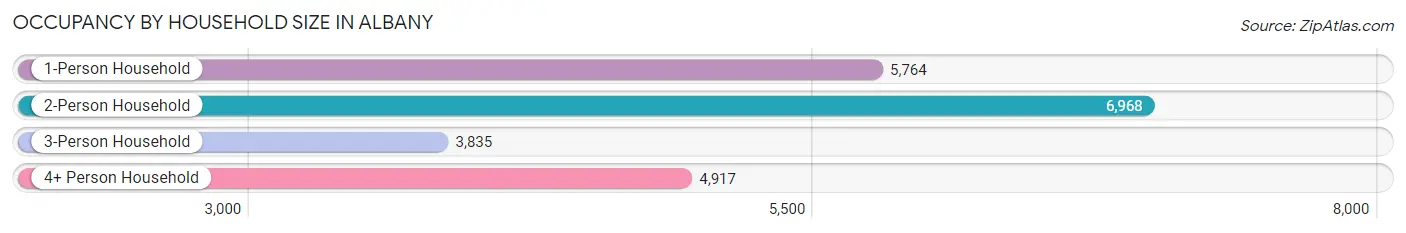
| Household Size | # Housing Units | % Housing Units |
| 1-Person Household | 5,764 | 26.8% |
| 2-Person Household | 6,968 | 32.4% |
| 3-Person Household | 3,835 | 17.8% |
| 4+ Person Household | 4,917 | 22.9% |
| Total Housing Units | 21,484 | 100.0% |
Occupancy by Ownership by Household Size in Albany
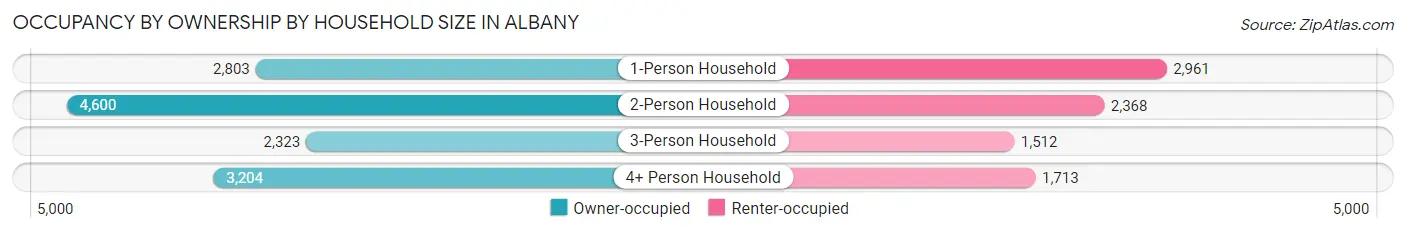
| Household Size | Owner-occupied | Renter-occupied |
| 1-Person Household | 2,803 (48.6%) | 2,961 (51.4%) |
| 2-Person Household | 4,600 (66.0%) | 2,368 (34.0%) |
| 3-Person Household | 2,323 (60.6%) | 1,512 (39.4%) |
| 4+ Person Household | 3,204 (65.2%) | 1,713 (34.8%) |
| Total Housing Units | 12,930 (60.2%) | 8,554 (39.8%) |
Occupancy by Educational Attainment in Albany
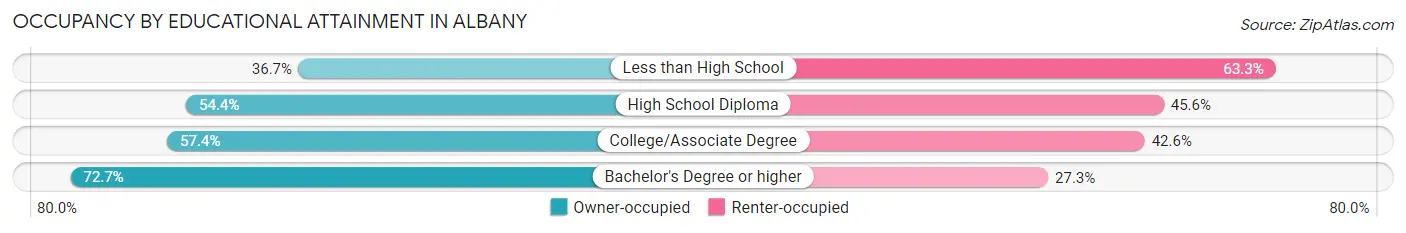
| Household Size | Owner-occupied | Renter-occupied |
| Less than High School | 422 (36.7%) | 729 (63.3%) |
| High School Diploma | 2,380 (54.4%) | 1,997 (45.6%) |
| College/Associate Degree | 5,529 (57.4%) | 4,104 (42.6%) |
| Bachelor's Degree or higher | 4,599 (72.7%) | 1,724 (27.3%) |
Occupancy by Age of Householder in Albany
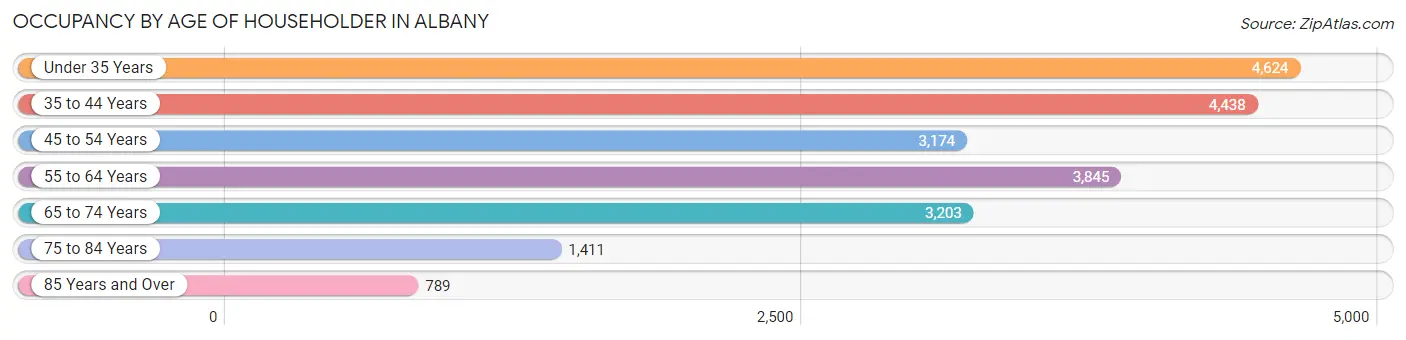
| Age Bracket | # Households | % Households |
| Under 35 Years | 4,624 | 21.5% |
| 35 to 44 Years | 4,438 | 20.7% |
| 45 to 54 Years | 3,174 | 14.8% |
| 55 to 64 Years | 3,845 | 17.9% |
| 65 to 74 Years | 3,203 | 14.9% |
| 75 to 84 Years | 1,411 | 6.6% |
| 85 Years and Over | 789 | 3.7% |
| Total | 21,484 | 100.0% |
Housing Finances in Albany
Median Income by Occupancy in Albany
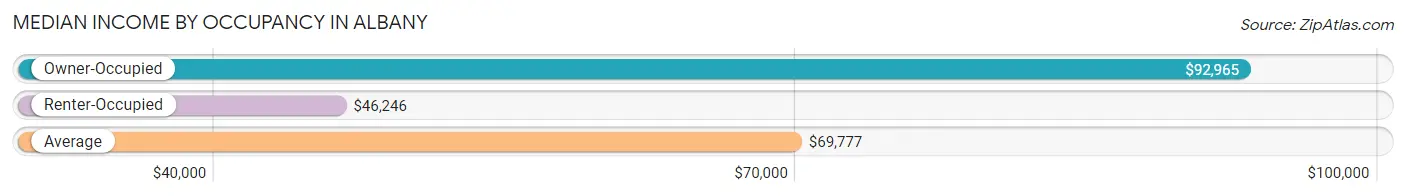
| Occupancy Type | # Households | Median Income |
| Owner-Occupied | 12,930 (60.2%) | $92,965 |
| Renter-Occupied | 8,554 (39.8%) | $46,246 |
| Average | 21,484 (100.0%) | $69,777 |
Occupancy by Householder Income Bracket in Albany
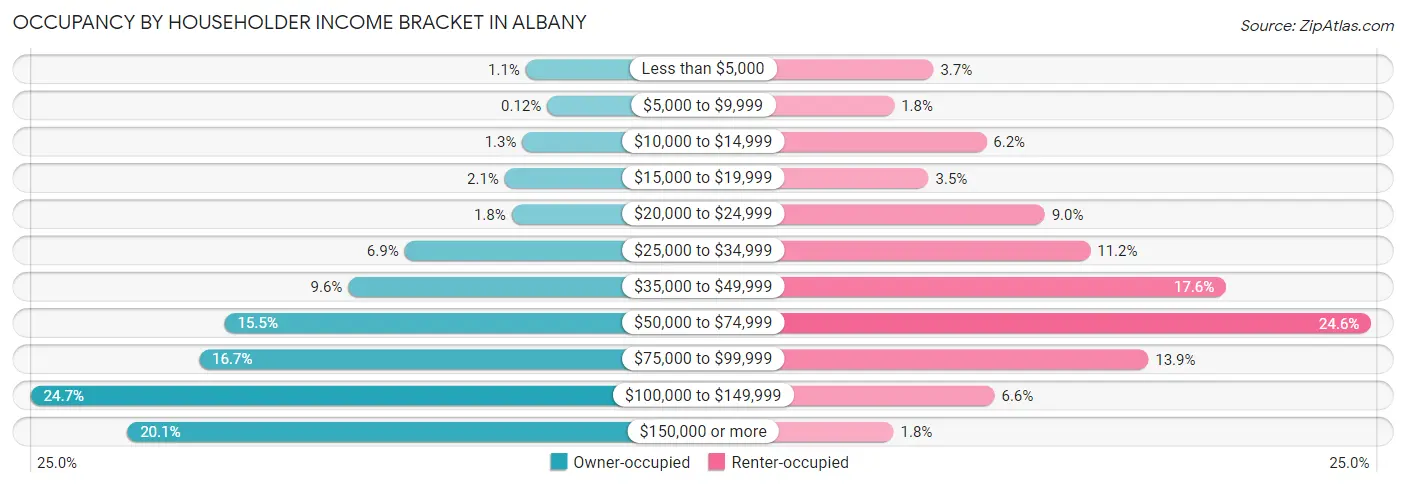
| Income Bracket | Owner-occupied | Renter-occupied |
| Less than $5,000 | 148 (1.1%) | 317 (3.7%) |
| $5,000 to $9,999 | 15 (0.1%) | 157 (1.8%) |
| $10,000 to $14,999 | 168 (1.3%) | 533 (6.2%) |
| $15,000 to $19,999 | 277 (2.1%) | 298 (3.5%) |
| $20,000 to $24,999 | 234 (1.8%) | 771 (9.0%) |
| $25,000 to $34,999 | 893 (6.9%) | 956 (11.2%) |
| $35,000 to $49,999 | 1,240 (9.6%) | 1,509 (17.6%) |
| $50,000 to $74,999 | 2,002 (15.5%) | 2,100 (24.5%) |
| $75,000 to $99,999 | 2,158 (16.7%) | 1,192 (13.9%) |
| $100,000 to $149,999 | 3,195 (24.7%) | 566 (6.6%) |
| $150,000 or more | 2,600 (20.1%) | 155 (1.8%) |
| Total | 12,930 (100.0%) | 8,554 (100.0%) |
Monthly Housing Cost Tiers in Albany
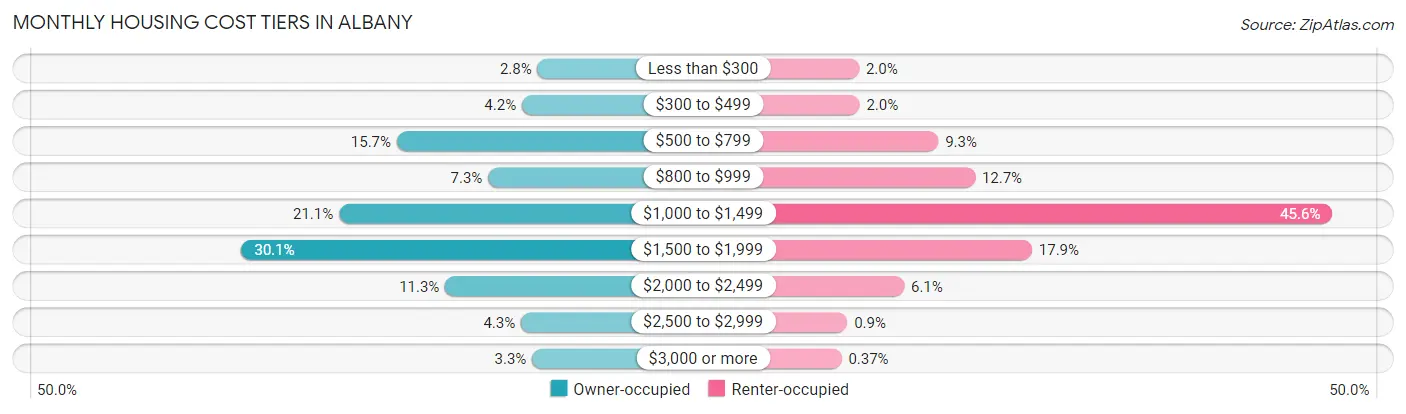
| Monthly Cost | Owner-occupied | Renter-occupied |
| Less than $300 | 360 (2.8%) | 169 (2.0%) |
| $300 to $499 | 544 (4.2%) | 174 (2.0%) |
| $500 to $799 | 2,034 (15.7%) | 794 (9.3%) |
| $800 to $999 | 947 (7.3%) | 1,083 (12.7%) |
| $1,000 to $1,499 | 2,722 (21.0%) | 3,896 (45.6%) |
| $1,500 to $1,999 | 3,885 (30.0%) | 1,531 (17.9%) |
| $2,000 to $2,499 | 1,459 (11.3%) | 524 (6.1%) |
| $2,500 to $2,999 | 556 (4.3%) | 77 (0.9%) |
| $3,000 or more | 423 (3.3%) | 32 (0.4%) |
| Total | 12,930 (100.0%) | 8,554 (100.0%) |
Physical Housing Characteristics in Albany
Housing Structures in Albany
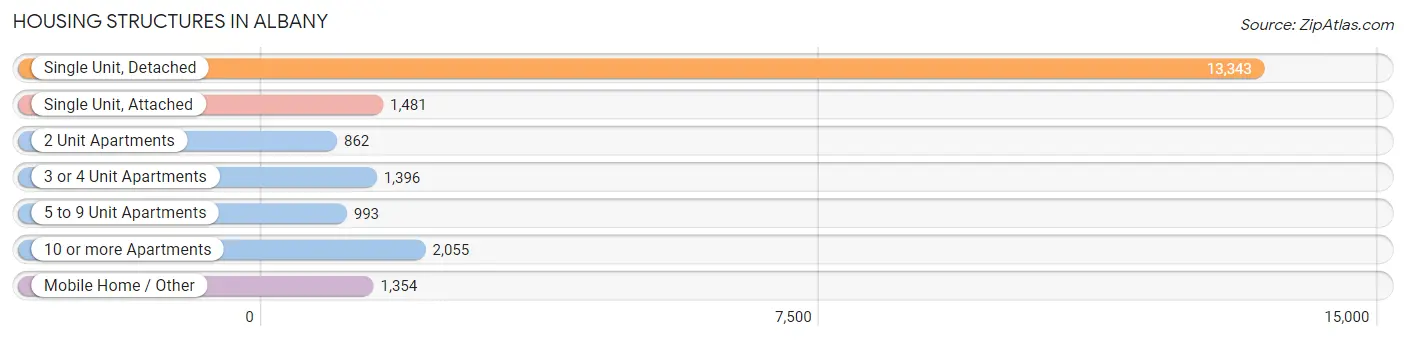
| Structure Type | # Housing Units | % Housing Units |
| Single Unit, Detached | 13,343 | 62.1% |
| Single Unit, Attached | 1,481 | 6.9% |
| 2 Unit Apartments | 862 | 4.0% |
| 3 or 4 Unit Apartments | 1,396 | 6.5% |
| 5 to 9 Unit Apartments | 993 | 4.6% |
| 10 or more Apartments | 2,055 | 9.6% |
| Mobile Home / Other | 1,354 | 6.3% |
| Total | 21,484 | 100.0% |
Housing Structures by Occupancy in Albany
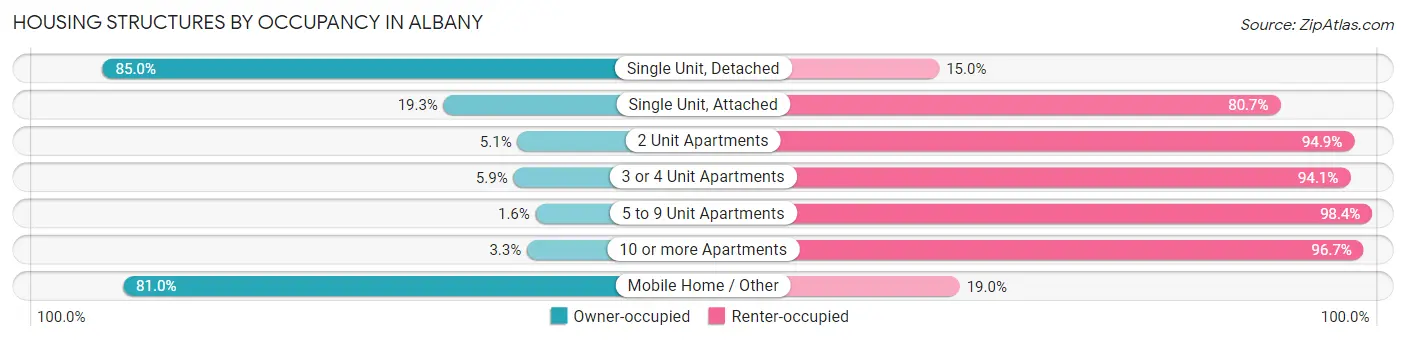
| Structure Type | Owner-occupied | Renter-occupied |
| Single Unit, Detached | 11,338 (85.0%) | 2,005 (15.0%) |
| Single Unit, Attached | 286 (19.3%) | 1,195 (80.7%) |
| 2 Unit Apartments | 44 (5.1%) | 818 (94.9%) |
| 3 or 4 Unit Apartments | 82 (5.9%) | 1,314 (94.1%) |
| 5 to 9 Unit Apartments | 16 (1.6%) | 977 (98.4%) |
| 10 or more Apartments | 67 (3.3%) | 1,988 (96.7%) |
| Mobile Home / Other | 1,097 (81.0%) | 257 (19.0%) |
| Total | 12,930 (60.2%) | 8,554 (39.8%) |
Housing Structures by Number of Rooms in Albany
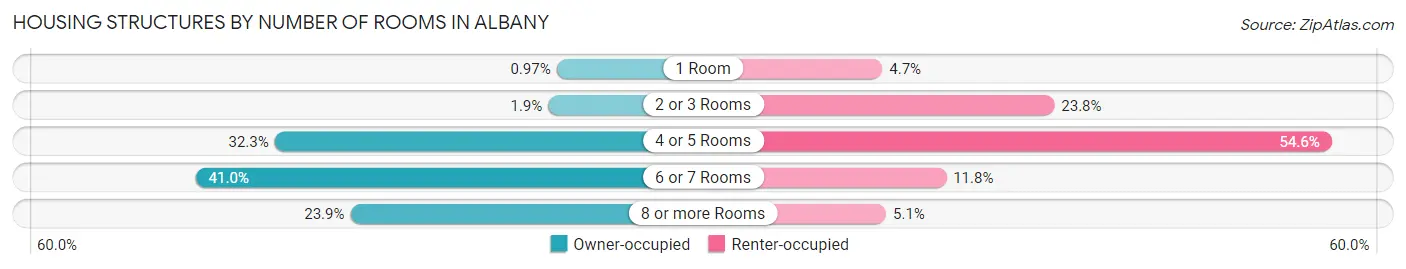
| Number of Rooms | Owner-occupied | Renter-occupied |
| 1 Room | 126 (1.0%) | 403 (4.7%) |
| 2 or 3 Rooms | 246 (1.9%) | 2,036 (23.8%) |
| 4 or 5 Rooms | 4,171 (32.3%) | 4,668 (54.6%) |
| 6 or 7 Rooms | 5,303 (41.0%) | 1,009 (11.8%) |
| 8 or more Rooms | 3,084 (23.8%) | 438 (5.1%) |
| Total | 12,930 (100.0%) | 8,554 (100.0%) |
Housing Structure by Heating Type in Albany
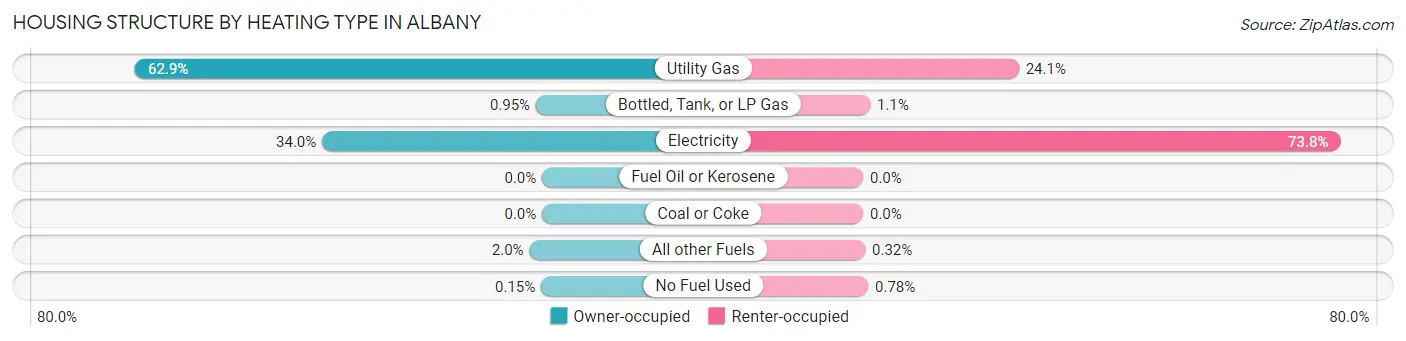
| Heating Type | Owner-occupied | Renter-occupied |
| Utility Gas | 8,135 (62.9%) | 2,059 (24.1%) |
| Bottled, Tank, or LP Gas | 123 (0.9%) | 92 (1.1%) |
| Electricity | 4,398 (34.0%) | 6,309 (73.8%) |
| Fuel Oil or Kerosene | 0 (0.0%) | 0 (0.0%) |
| Coal or Coke | 0 (0.0%) | 0 (0.0%) |
| All other Fuels | 254 (2.0%) | 27 (0.3%) |
| No Fuel Used | 20 (0.2%) | 67 (0.8%) |
| Total | 12,930 (100.0%) | 8,554 (100.0%) |
Household Vehicle Usage in Albany
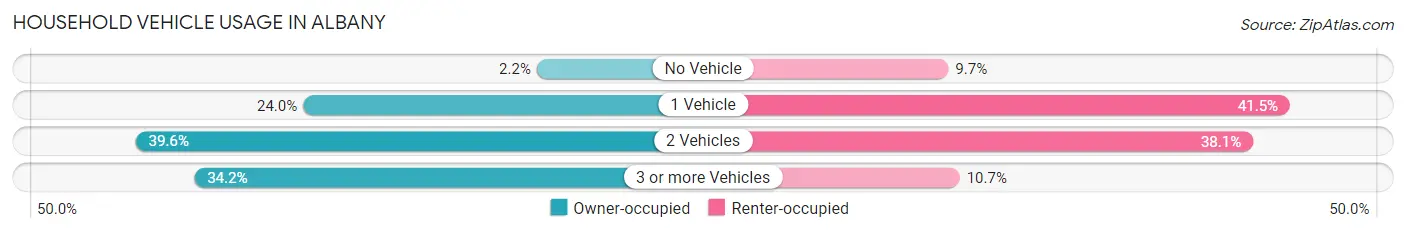
| Vehicles per Household | Owner-occupied | Renter-occupied |
| No Vehicle | 283 (2.2%) | 826 (9.7%) |
| 1 Vehicle | 3,105 (24.0%) | 3,553 (41.5%) |
| 2 Vehicles | 5,125 (39.6%) | 3,258 (38.1%) |
| 3 or more Vehicles | 4,417 (34.2%) | 917 (10.7%) |
| Total | 12,930 (100.0%) | 8,554 (100.0%) |
Real Estate & Mortgages in Albany
Real Estate and Mortgage Overview in Albany
| Characteristic | Without Mortgage | With Mortgage |
| Housing Units | 3,936 | 8,994 |
| Median Property Value | $293,500 | $331,700 |
| Median Household Income | $60,391 | $2,090 |
| Monthly Housing Costs | $684 | $423 |
| Real Estate Taxes | $3,751 | $149 |
Property Value by Mortgage Status in Albany
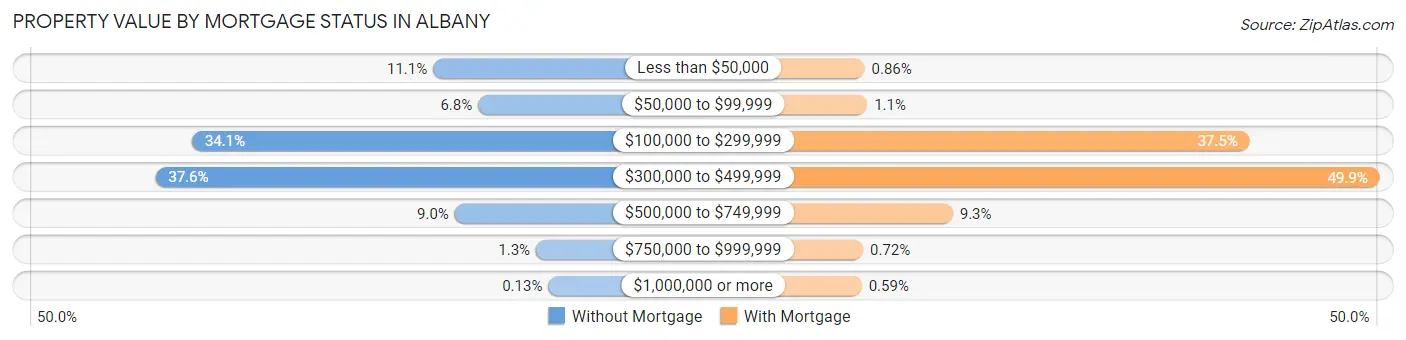
| Property Value | Without Mortgage | With Mortgage |
| Less than $50,000 | 437 (11.1%) | 77 (0.9%) |
| $50,000 to $99,999 | 268 (6.8%) | 100 (1.1%) |
| $100,000 to $299,999 | 1,341 (34.1%) | 3,376 (37.5%) |
| $300,000 to $499,999 | 1,478 (37.6%) | 4,490 (49.9%) |
| $500,000 to $749,999 | 356 (9.0%) | 833 (9.3%) |
| $750,000 to $999,999 | 51 (1.3%) | 65 (0.7%) |
| $1,000,000 or more | 5 (0.1%) | 53 (0.6%) |
| Total | 3,936 (100.0%) | 8,994 (100.0%) |
Household Income by Mortgage Status in Albany
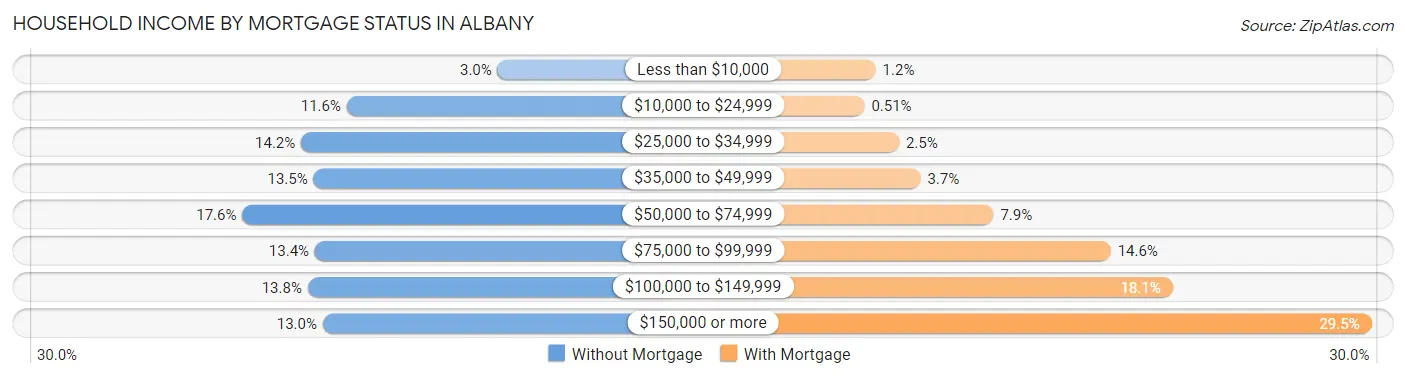
| Household Income | Without Mortgage | With Mortgage |
| Less than $10,000 | 117 (3.0%) | 103 (1.1%) |
| $10,000 to $24,999 | 456 (11.6%) | 46 (0.5%) |
| $25,000 to $34,999 | 559 (14.2%) | 223 (2.5%) |
| $35,000 to $49,999 | 531 (13.5%) | 334 (3.7%) |
| $50,000 to $74,999 | 691 (17.6%) | 709 (7.9%) |
| $75,000 to $99,999 | 528 (13.4%) | 1,311 (14.6%) |
| $100,000 to $149,999 | 544 (13.8%) | 1,630 (18.1%) |
| $150,000 or more | 510 (13.0%) | 2,651 (29.5%) |
| Total | 3,936 (100.0%) | 8,994 (100.0%) |
Property Value to Household Income Ratio in Albany
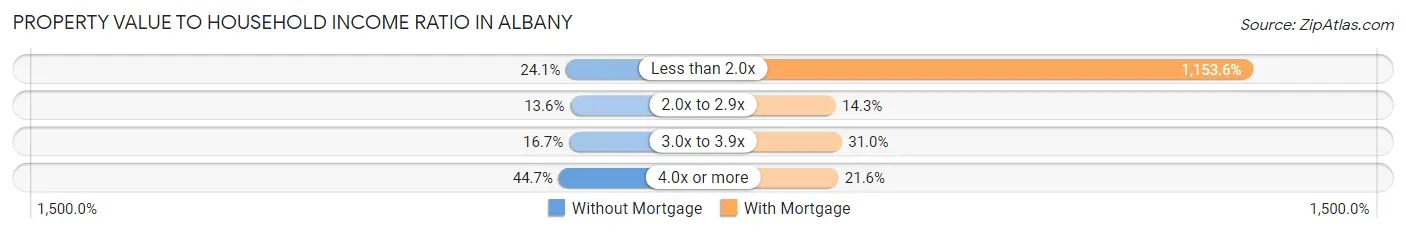
| Value-to-Income Ratio | Without Mortgage | With Mortgage |
| Less than 2.0x | 950 (24.1%) | 103,756 (1,153.6%) |
| 2.0x to 2.9x | 535 (13.6%) | 1,282 (14.2%) |
| 3.0x to 3.9x | 657 (16.7%) | 2,785 (31.0%) |
| 4.0x or more | 1,758 (44.7%) | 1,941 (21.6%) |
| Total | 3,936 (100.0%) | 8,994 (100.0%) |
Real Estate Taxes by Mortgage Status in Albany
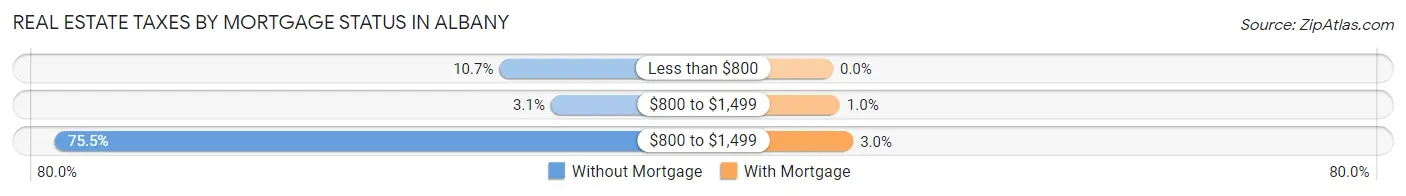
| Property Taxes | Without Mortgage | With Mortgage |
| Less than $800 | 419 (10.6%) | 0 (0.0%) |
| $800 to $1,499 | 123 (3.1%) | 90 (1.0%) |
| $800 to $1,499 | 2,973 (75.5%) | 265 (2.9%) |
| Total | 3,936 (100.0%) | 8,994 (100.0%) |
Health & Disability in Albany
Health Insurance Coverage by Age in Albany
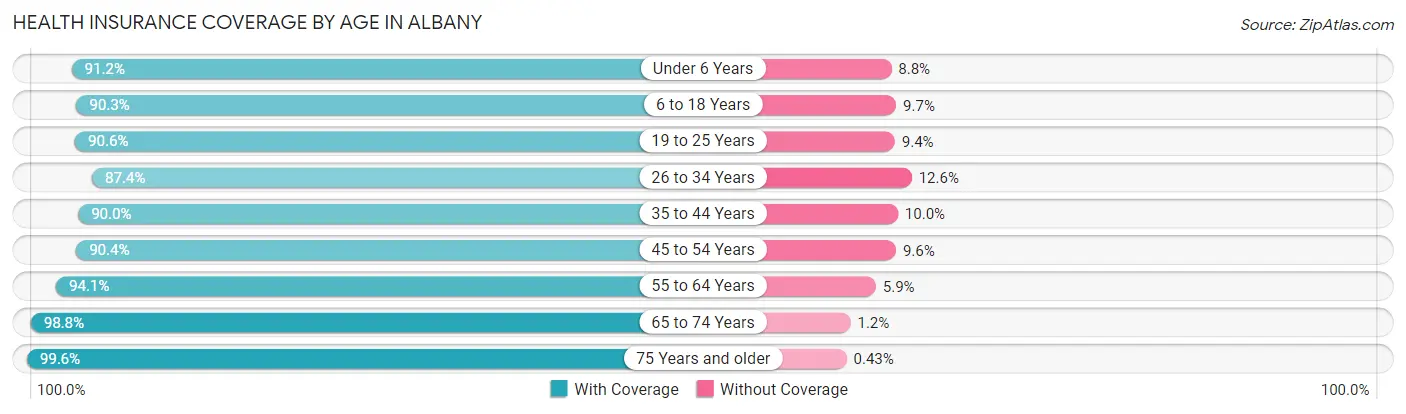
| Age Bracket | With Coverage | Without Coverage |
| Under 6 Years | 4,225 (91.2%) | 406 (8.8%) |
| 6 to 18 Years | 9,147 (90.3%) | 979 (9.7%) |
| 19 to 25 Years | 4,659 (90.6%) | 485 (9.4%) |
| 26 to 34 Years | 5,944 (87.4%) | 855 (12.6%) |
| 35 to 44 Years | 7,434 (90.0%) | 826 (10.0%) |
| 45 to 54 Years | 5,489 (90.4%) | 585 (9.6%) |
| 55 to 64 Years | 5,855 (94.1%) | 366 (5.9%) |
| 65 to 74 Years | 5,017 (98.8%) | 59 (1.2%) |
| 75 Years and older | 3,443 (99.6%) | 15 (0.4%) |
| Total | 51,213 (91.8%) | 4,576 (8.2%) |
Health Insurance Coverage by Citizenship Status in Albany
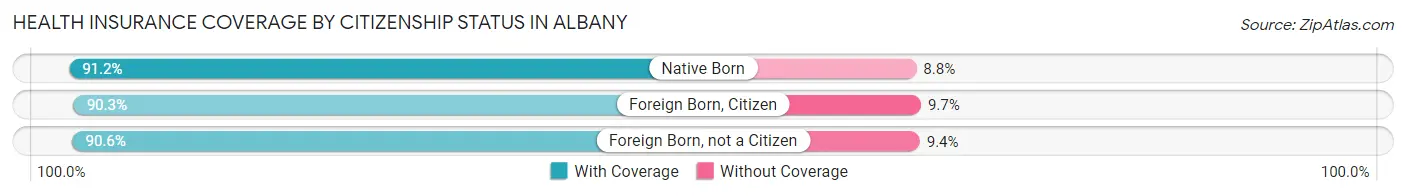
| Citizenship Status | With Coverage | Without Coverage |
| Native Born | 4,225 (91.2%) | 406 (8.8%) |
| Foreign Born, Citizen | 9,147 (90.3%) | 979 (9.7%) |
| Foreign Born, not a Citizen | 4,659 (90.6%) | 485 (9.4%) |
Health Insurance Coverage by Household Income in Albany
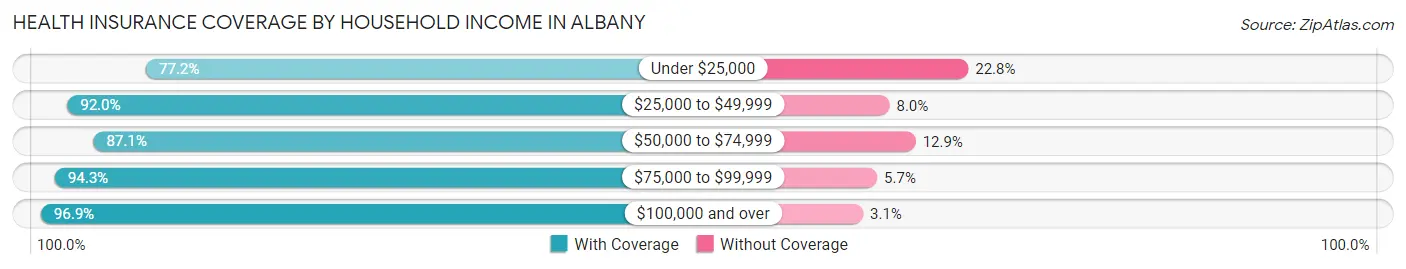
| Household Income | With Coverage | Without Coverage |
| Under $25,000 | 4,239 (77.2%) | 1,249 (22.8%) |
| $25,000 to $49,999 | 8,930 (92.0%) | 778 (8.0%) |
| $50,000 to $74,999 | 9,455 (87.1%) | 1,401 (12.9%) |
| $75,000 to $99,999 | 8,737 (94.3%) | 527 (5.7%) |
| $100,000 and over | 19,406 (96.9%) | 613 (3.1%) |
Public vs Private Health Insurance Coverage by Age in Albany
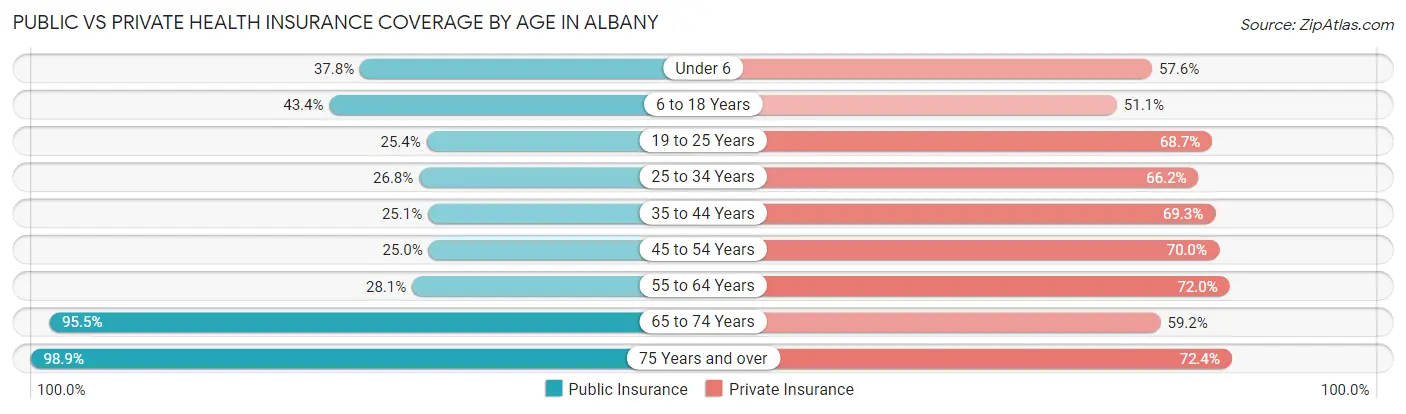
| Age Bracket | Public Insurance | Private Insurance |
| Under 6 | 1,748 (37.8%) | 2,667 (57.6%) |
| 6 to 18 Years | 4,399 (43.4%) | 5,170 (51.1%) |
| 19 to 25 Years | 1,306 (25.4%) | 3,536 (68.7%) |
| 25 to 34 Years | 1,820 (26.8%) | 4,500 (66.2%) |
| 35 to 44 Years | 2,076 (25.1%) | 5,722 (69.3%) |
| 45 to 54 Years | 1,520 (25.0%) | 4,250 (70.0%) |
| 55 to 64 Years | 1,746 (28.1%) | 4,477 (72.0%) |
| 65 to 74 Years | 4,846 (95.5%) | 3,003 (59.2%) |
| 75 Years and over | 3,420 (98.9%) | 2,503 (72.4%) |
| Total | 22,881 (41.0%) | 35,828 (64.2%) |
Disability Status by Sex by Age in Albany
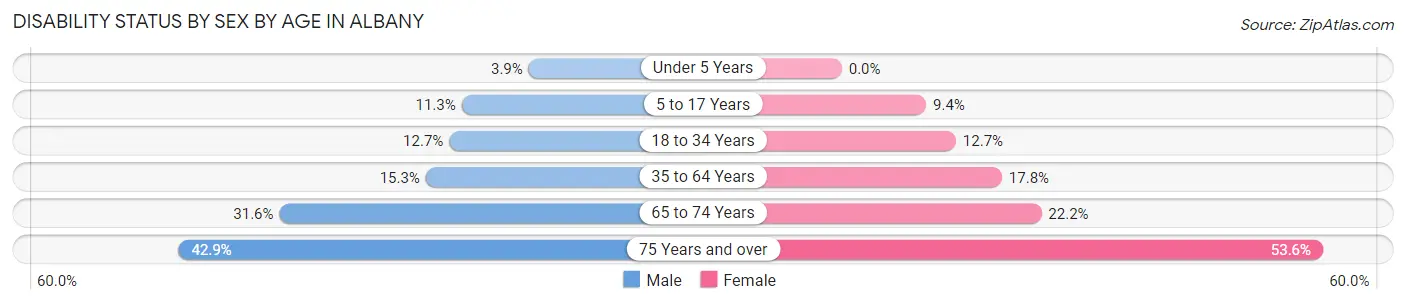
| Age Bracket | Male | Female |
| Under 5 Years | 84 (3.9%) | 0 (0.0%) |
| 5 to 17 Years | 600 (11.3%) | 437 (9.4%) |
| 18 to 34 Years | 800 (12.7%) | 802 (12.7%) |
| 35 to 64 Years | 1,535 (15.3%) | 1,880 (17.8%) |
| 65 to 74 Years | 790 (31.6%) | 573 (22.2%) |
| 75 Years and over | 606 (42.9%) | 1,095 (53.6%) |
Disability Class by Sex by Age in Albany
Disability Class: Hearing Difficulty
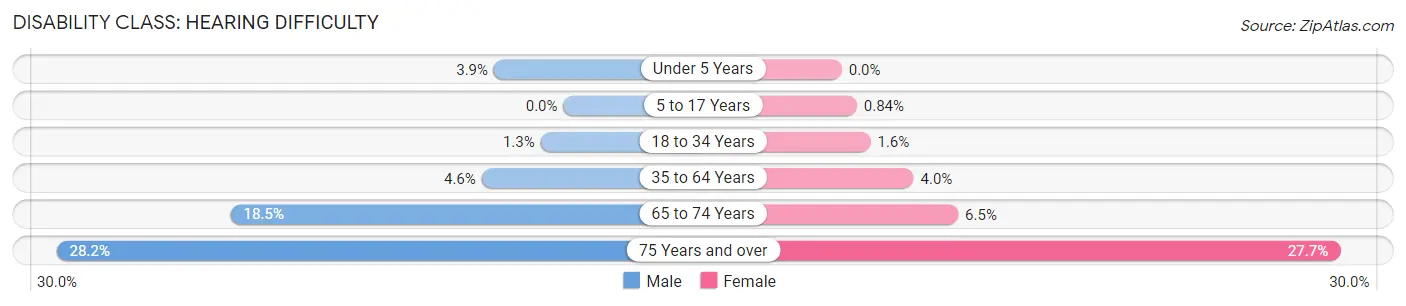
| Age Bracket | Male | Female |
| Under 5 Years | 84 (3.9%) | 0 (0.0%) |
| 5 to 17 Years | 0 (0.0%) | 39 (0.8%) |
| 18 to 34 Years | 80 (1.3%) | 101 (1.6%) |
| 35 to 64 Years | 456 (4.5%) | 422 (4.0%) |
| 65 to 74 Years | 463 (18.5%) | 167 (6.5%) |
| 75 Years and over | 399 (28.2%) | 567 (27.7%) |
Disability Class: Vision Difficulty
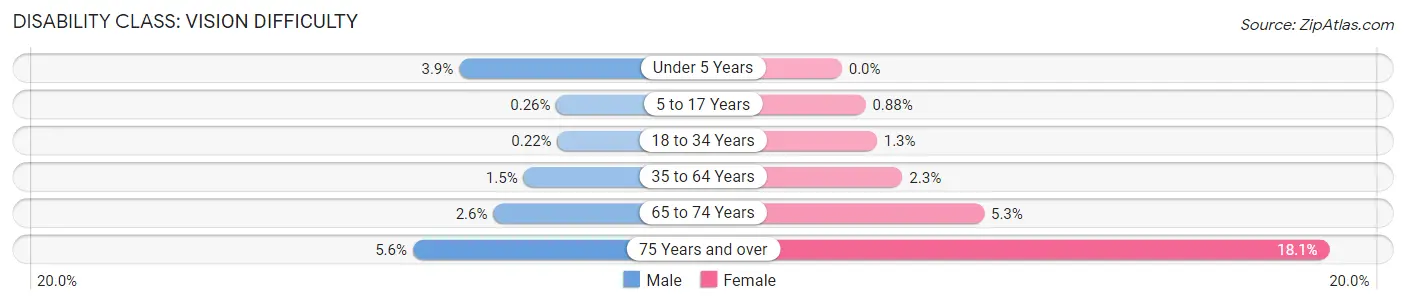
| Age Bracket | Male | Female |
| Under 5 Years | 84 (3.9%) | 0 (0.0%) |
| 5 to 17 Years | 14 (0.3%) | 41 (0.9%) |
| 18 to 34 Years | 14 (0.2%) | 82 (1.3%) |
| 35 to 64 Years | 148 (1.5%) | 237 (2.2%) |
| 65 to 74 Years | 65 (2.6%) | 136 (5.3%) |
| 75 Years and over | 79 (5.6%) | 370 (18.1%) |
Disability Class: Cognitive Difficulty
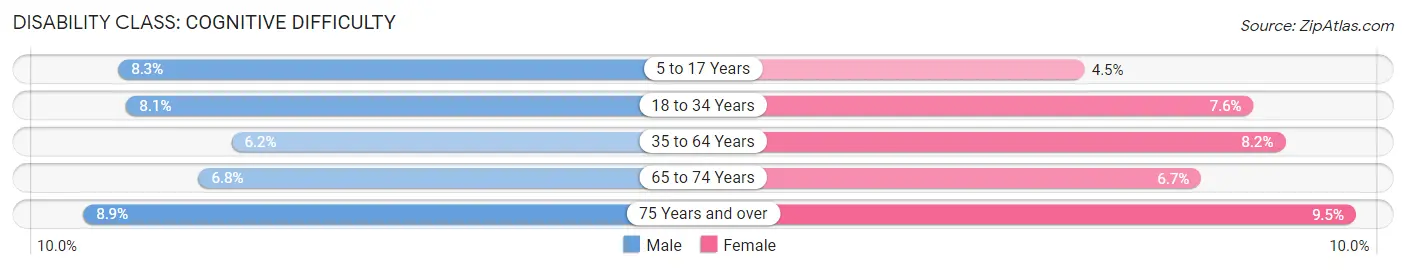
| Age Bracket | Male | Female |
| 5 to 17 Years | 437 (8.3%) | 210 (4.5%) |
| 18 to 34 Years | 510 (8.1%) | 482 (7.6%) |
| 35 to 64 Years | 617 (6.2%) | 868 (8.2%) |
| 65 to 74 Years | 169 (6.8%) | 172 (6.7%) |
| 75 Years and over | 126 (8.9%) | 195 (9.5%) |
Disability Class: Ambulatory Difficulty
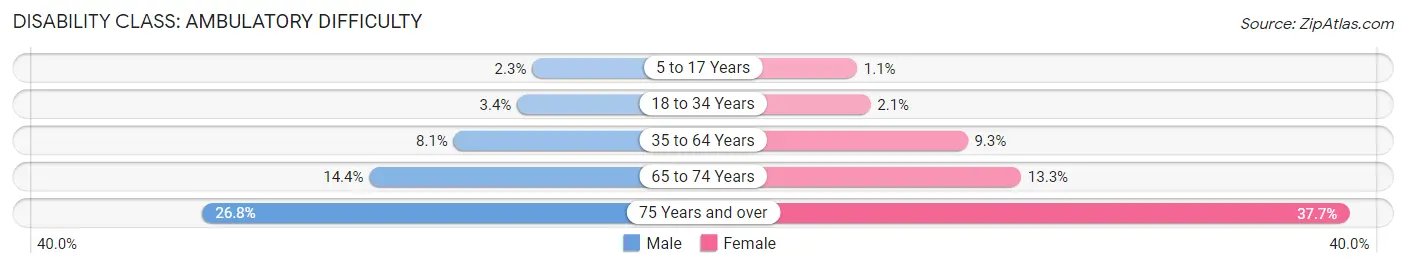
| Age Bracket | Male | Female |
| 5 to 17 Years | 122 (2.3%) | 52 (1.1%) |
| 18 to 34 Years | 216 (3.4%) | 134 (2.1%) |
| 35 to 64 Years | 815 (8.1%) | 984 (9.3%) |
| 65 to 74 Years | 360 (14.4%) | 343 (13.3%) |
| 75 Years and over | 379 (26.8%) | 770 (37.7%) |
Disability Class: Self-Care Difficulty
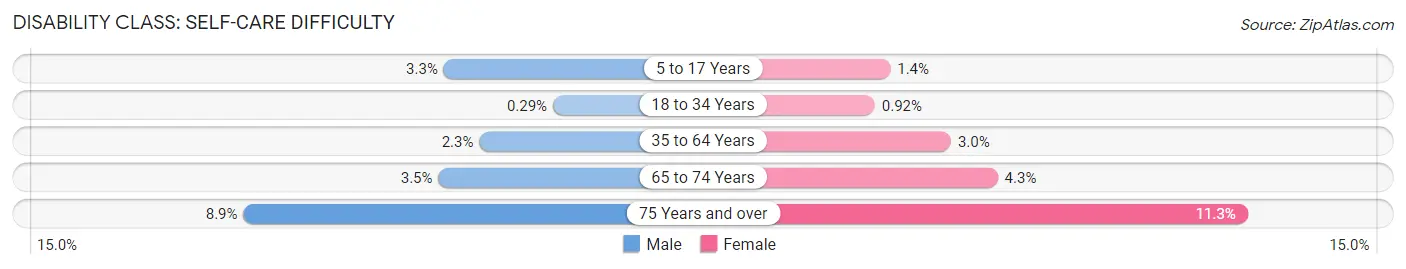
| Age Bracket | Male | Female |
| 5 to 17 Years | 176 (3.3%) | 63 (1.3%) |
| 18 to 34 Years | 18 (0.3%) | 58 (0.9%) |
| 35 to 64 Years | 234 (2.3%) | 320 (3.0%) |
| 65 to 74 Years | 87 (3.5%) | 112 (4.3%) |
| 75 Years and over | 126 (8.9%) | 231 (11.3%) |
Technology Access in Albany
Computing Device Access in Albany
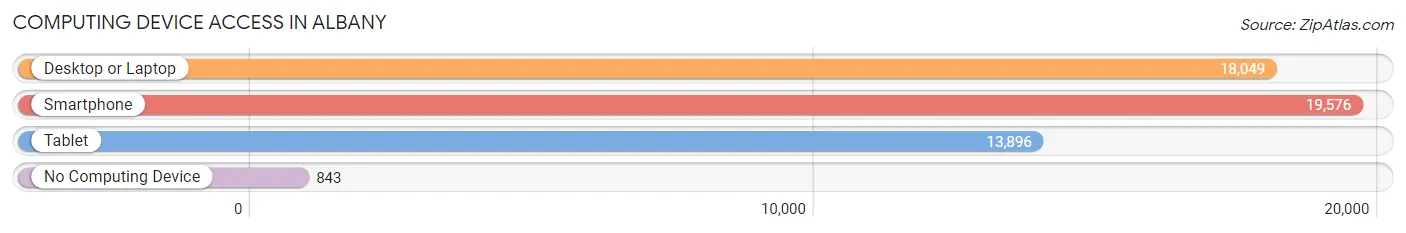
| Device Type | # Households | % Households |
| Desktop or Laptop | 18,049 | 84.0% |
| Smartphone | 19,576 | 91.1% |
| Tablet | 13,896 | 64.7% |
| No Computing Device | 843 | 3.9% |
| Total | 21,484 | 100.0% |
Internet Access in Albany
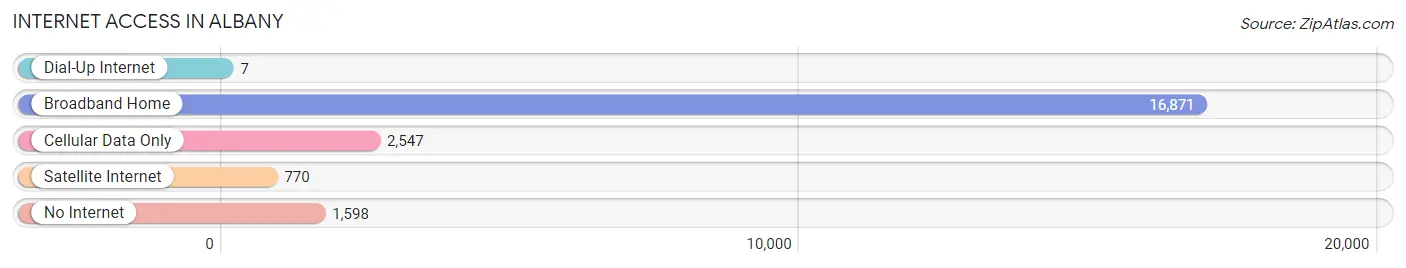
| Internet Type | # Households | % Households |
| Dial-Up Internet | 7 | 0.0% |
| Broadband Home | 16,871 | 78.5% |
| Cellular Data Only | 2,547 | 11.9% |
| Satellite Internet | 770 | 3.6% |
| No Internet | 1,598 | 7.4% |
| Total | 21,484 | 100.0% |
Albany Summary
Albany, Oregon is a city located in the Willamette Valley of the Pacific Northwest. It is the county seat of Linn County and the 11th largest city in the state. Albany is located on the banks of the Willamette River, about 45 miles south of Portland and 15 miles south of Salem. The city has a population of about 50,000 people and is the economic hub of the region.
History
The area that is now Albany was first inhabited by the Kalapuya Native American tribe. The first European settlers arrived in the area in the early 1840s, and the city was officially incorporated in 1864. The city was named after Albany, New York, the hometown of the city's first postmaster.
In the late 19th century, Albany was a major center for the timber industry. The city was also home to several large flour mills and other industries. In the early 20th century, the city experienced a period of growth and prosperity, and many of the city's historic buildings were constructed during this time.
Geography
Albany is located in the Willamette Valley, a fertile agricultural region in the Pacific Northwest. The city is situated on the banks of the Willamette River, about 45 miles south of Portland and 15 miles south of Salem. The city is surrounded by rolling hills and is located at the confluence of the Calapooia and Willamette Rivers.
The climate in Albany is mild and temperate, with warm summers and cool winters. The average annual temperature is around 50 degrees Fahrenheit. The city receives an average of 37 inches of precipitation per year, with most of it falling in the winter months.
Economy
Albany's economy is largely based on agriculture and manufacturing. The city is home to several large food processing plants, including a Nestle plant and a Tyson Foods plant. The city is also home to several large lumber mills and other wood-related industries.
The city is also home to several large retail stores, including Walmart, Target, and Home Depot. The city is also home to several large medical facilities, including Samaritan Albany General Hospital and Good Samaritan Regional Medical Center.
Demographics
As of the 2010 census, Albany had a population of 50,158 people. The racial makeup of the city was 79.2% White, 1.3% African American, 0.7% Native American, 1.7% Asian, 0.2% Pacific Islander, and 14.2% from other races. Hispanic or Latino of any race were 19.2% of the population.
The median household income in Albany was $45,837, and the median family income was $54,837. The per capita income in the city was $22,837. About 14.2% of the population was below the poverty line.
Albany is a diverse city with a rich history and a vibrant economy. The city is home to a variety of industries, including agriculture, manufacturing, retail, and healthcare. The city is also home to a diverse population, with a variety of racial and ethnic backgrounds.
Common Questions
What is Per Capita Income in Albany?
Per Capita income in Albany is $31,872.
What is the Median Family Income in Albany?
Median Family Income in Albany is $83,786.
What is the Median Household income in Albany?
Median Household Income in Albany is $69,777.
What is Income or Wage Gap in Albany?
Income or Wage Gap in Albany is 31.5%.
Women in Albany earn 68.5 cents for every dollar earned by a man.
What is Family Income Deficit in Albany?
Family Income Deficit in Albany is $10,449.
Families that are below poverty line in Albany earn $10,449 less on average than the poverty threshold level.
What is Inequality or Gini Index in Albany?
Inequality or Gini Index in Albany is 0.39.
What is the Total Population of Albany?
Total Population of Albany is 56,348.
What is the Total Male Population of Albany?
Total Male Population of Albany is 27,978.
What is the Total Female Population of Albany?
Total Female Population of Albany is 28,370.
What is the Ratio of Males per 100 Females in Albany?
There are 98.62 Males per 100 Females in Albany.
What is the Ratio of Females per 100 Males in Albany?
There are 101.40 Females per 100 Males in Albany.
What is the Median Population Age in Albany?
Median Population Age in Albany is 36.5 Years.
What is the Average Family Size in Albany
Average Family Size in Albany is 3.1 People.
What is the Average Household Size in Albany
Average Household Size in Albany is 2.6 People.
How Large is the Labor Force in Albany?
There are 27,497 People in the Labor Forcein in Albany.
What is the Percentage of People in the Labor Force in Albany?
63.0% of People are in the Labor Force in Albany.
What is the Unemployment Rate in Albany?
Unemployment Rate in Albany is 6.7%.