Cave Junction, OR Map & Demographics
Cave Junction Map
Cave Junction Overview
$21,408
PER CAPITA INCOME
$44,926
AVG FAMILY INCOME
$34,594
AVG HOUSEHOLD INCOME
8.0%
WAGE / INCOME GAP [ % ]
92.0¢/ $1
WAGE / INCOME GAP [ $ ]
0.45
INEQUALITY / GINI INDEX
1,910
TOTAL POPULATION
851
MALE POPULATION
1,059
FEMALE POPULATION
80.36
MALES / 100 FEMALES
124.44
FEMALES / 100 MALES
45.2
MEDIAN AGE
3.0
AVG FAMILY SIZE
2.2
AVG HOUSEHOLD SIZE
638
LABOR FORCE [ PEOPLE ]
41.1%
PERCENT IN LABOR FORCE
10.3%
UNEMPLOYMENT RATE
Cave Junction Zip Codes
Cave Junction Area Codes
Income in Cave Junction
Income Overview in Cave Junction
Per Capita Income in Cave Junction is $21,408, while median incomes of families and households are $44,926 and $34,594 respectively.
| Characteristic | Number | Measure |
| Per Capita Income | 1,910 | $21,408 |
| Median Family Income | 451 | $44,926 |
| Mean Family Income | 451 | $61,223 |
| Median Household Income | 859 | $34,594 |
| Mean Household Income | 859 | $48,798 |
| Income Deficit | 451 | $0 |
| Wage / Income Gap (%) | 1,910 | 8.04% |
| Wage / Income Gap ($) | 1,910 | 91.96¢ per $1 |
| Gini / Inequality Index | 1,910 | 0.45 |
Earnings by Sex in Cave Junction
Average Earnings in Cave Junction are $22,435, $23,750 for men and $21,840 for women, a difference of 8.0%.
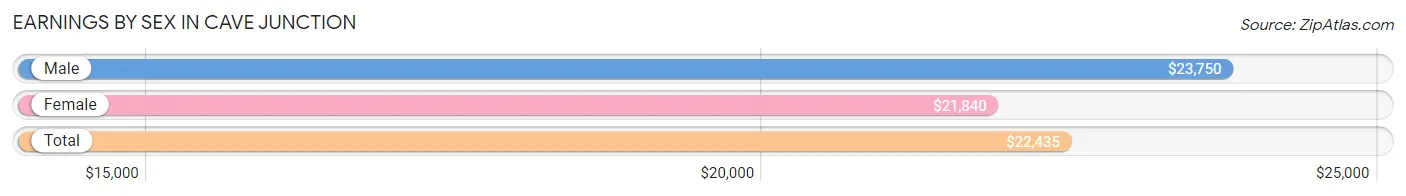
| Sex | Number | Average Earnings |
| Male | 283 (42.0%) | $23,750 |
| Female | 390 (58.0%) | $21,840 |
| Total | 673 (100.0%) | $22,435 |
Earnings by Sex by Income Bracket in Cave Junction
The most common earnings brackets in Cave Junction are $35,000 to $39,999 for men (37 | 13.1%) and $20,000 to $22,499 for women (53 | 13.6%).
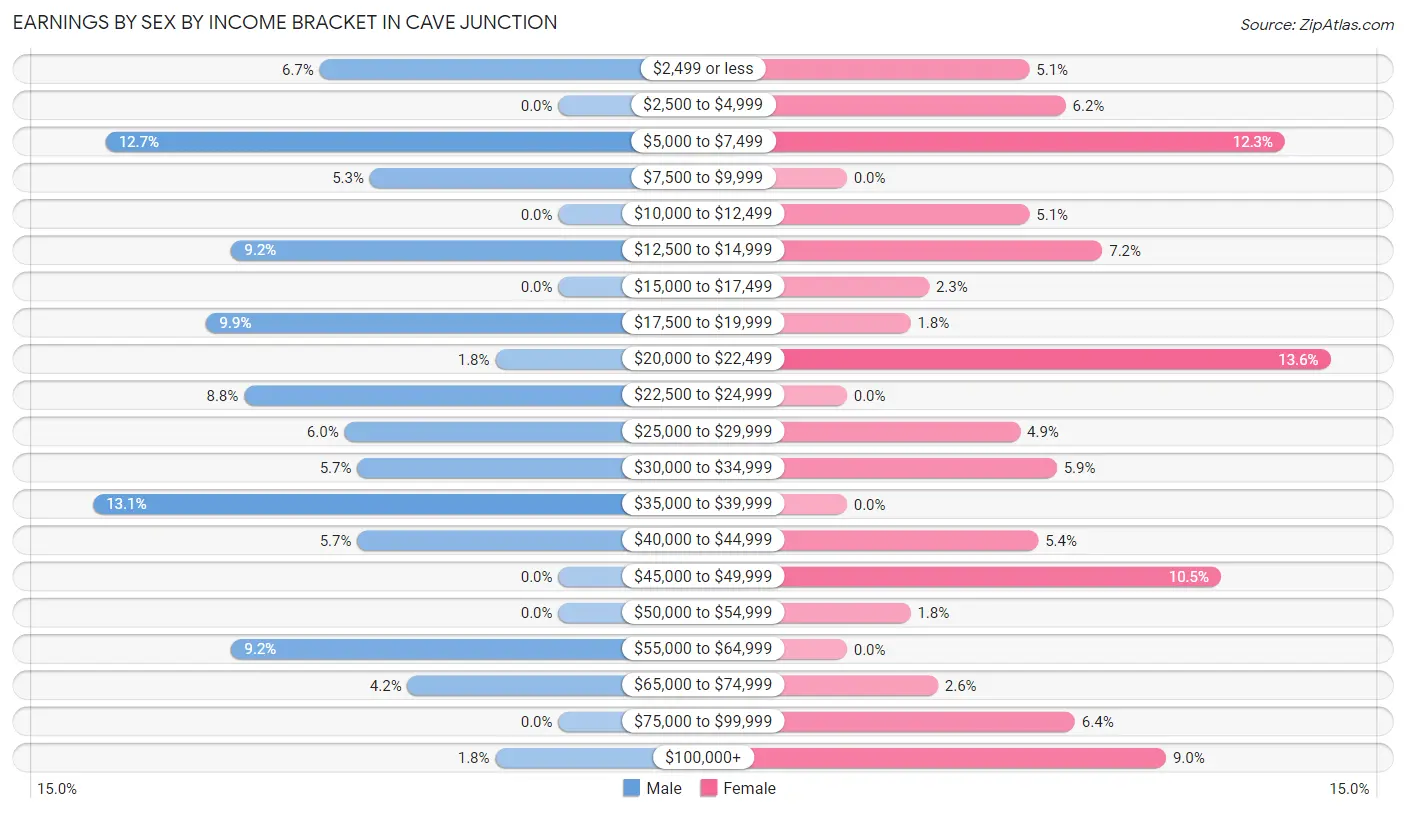
| Income | Male | Female |
| $2,499 or less | 19 (6.7%) | 20 (5.1%) |
| $2,500 to $4,999 | 0 (0.0%) | 24 (6.1%) |
| $5,000 to $7,499 | 36 (12.7%) | 48 (12.3%) |
| $7,500 to $9,999 | 15 (5.3%) | 0 (0.0%) |
| $10,000 to $12,499 | 0 (0.0%) | 20 (5.1%) |
| $12,500 to $14,999 | 26 (9.2%) | 28 (7.2%) |
| $15,000 to $17,499 | 0 (0.0%) | 9 (2.3%) |
| $17,500 to $19,999 | 28 (9.9%) | 7 (1.8%) |
| $20,000 to $22,499 | 5 (1.8%) | 53 (13.6%) |
| $22,500 to $24,999 | 25 (8.8%) | 0 (0.0%) |
| $25,000 to $29,999 | 17 (6.0%) | 19 (4.9%) |
| $30,000 to $34,999 | 16 (5.7%) | 23 (5.9%) |
| $35,000 to $39,999 | 37 (13.1%) | 0 (0.0%) |
| $40,000 to $44,999 | 16 (5.7%) | 21 (5.4%) |
| $45,000 to $49,999 | 0 (0.0%) | 41 (10.5%) |
| $50,000 to $54,999 | 0 (0.0%) | 7 (1.8%) |
| $55,000 to $64,999 | 26 (9.2%) | 0 (0.0%) |
| $65,000 to $74,999 | 12 (4.2%) | 10 (2.6%) |
| $75,000 to $99,999 | 0 (0.0%) | 25 (6.4%) |
| $100,000+ | 5 (1.8%) | 35 (9.0%) |
| Total | 283 (100.0%) | 390 (100.0%) |
Earnings by Sex by Educational Attainment in Cave Junction
Average earnings in Cave Junction are $22,600 for men and $22,358 for women, a difference of 1.1%. Men with an educational attainment of high school diploma enjoy the highest average annual earnings of $23,350, while those with high school diploma education earn the least with $23,350. Women with an educational attainment of bachelor's degree earn the most with the average annual earnings of $34,076, while those with college or associate's degree education have the smallest earnings of $20,917.
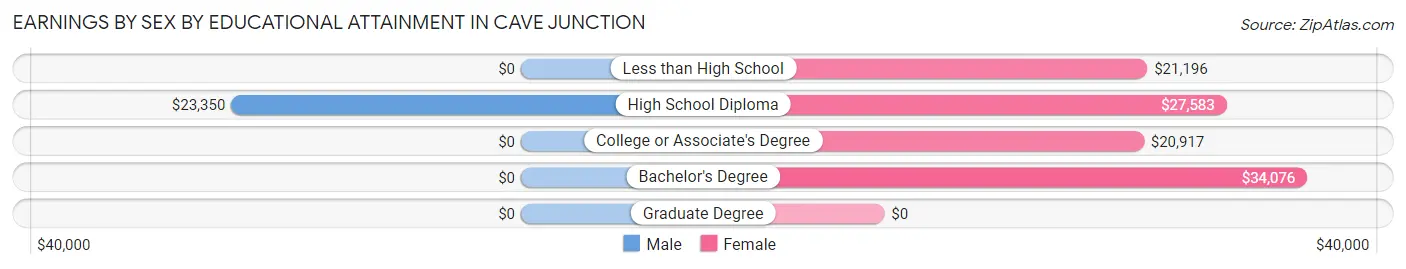
| Educational Attainment | Male Income | Female Income |
| Less than High School | - | - |
| High School Diploma | $23,350 | $27,583 |
| College or Associate's Degree | - | - |
| Bachelor's Degree | - | - |
| Graduate Degree | - | - |
| Total | $22,600 | $22,358 |
Family Income in Cave Junction
Family Income Brackets in Cave Junction
According to the Cave Junction family income data, there are 90 families falling into the $35,000 to $49,999 income range, which is the most common income bracket and makes up 20.0% of all families. Conversely, the $200,000+ income bracket is the least frequent group with only 13 families (2.9%) belonging to this category.
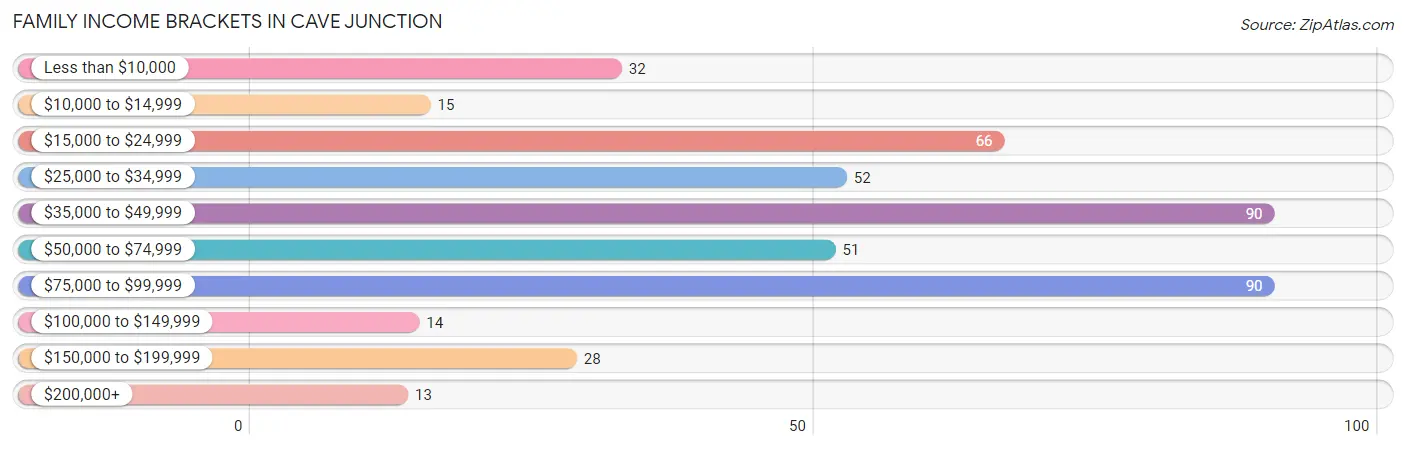
| Income Bracket | # Families | % Families |
| Less than $10,000 | 32 | 7.1% |
| $10,000 to $14,999 | 15 | 3.3% |
| $15,000 to $24,999 | 66 | 14.6% |
| $25,000 to $34,999 | 52 | 11.5% |
| $35,000 to $49,999 | 90 | 20.0% |
| $50,000 to $74,999 | 51 | 11.3% |
| $75,000 to $99,999 | 90 | 20.0% |
| $100,000 to $149,999 | 14 | 3.1% |
| $150,000 to $199,999 | 28 | 6.2% |
| $200,000+ | 13 | 2.9% |
Family Income by Famaliy Size in Cave Junction
4-person families (56 | 12.4%) account for the highest median family income in Cave Junction with $83,864 per family, while 2-person families (266 | 59.0%) have the highest median income of $24,125 per family member.
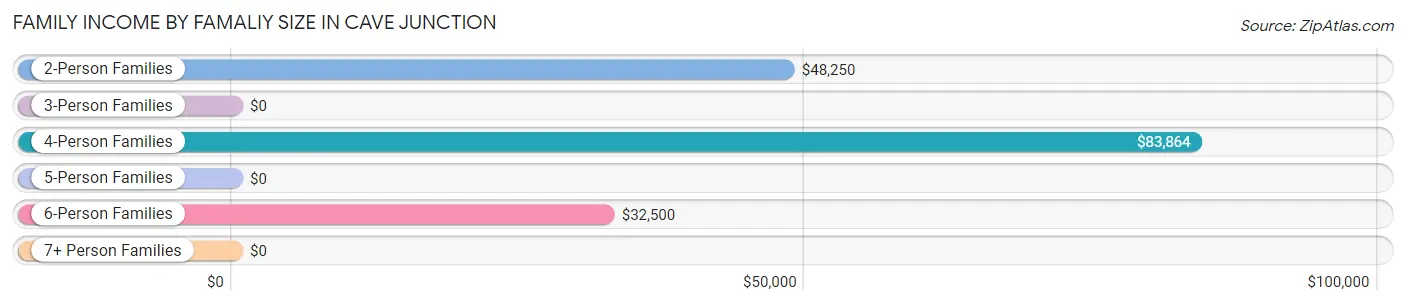
| Income Bracket | # Families | Median Income |
| 2-Person Families | 266 (59.0%) | $48,250 |
| 3-Person Families | 58 (12.9%) | $0 |
| 4-Person Families | 56 (12.4%) | $83,864 |
| 5-Person Families | 21 (4.7%) | $0 |
| 6-Person Families | 34 (7.5%) | $32,500 |
| 7+ Person Families | 16 (3.5%) | $0 |
| Total | 451 (100.0%) | $44,926 |
Family Income by Number of Earners in Cave Junction
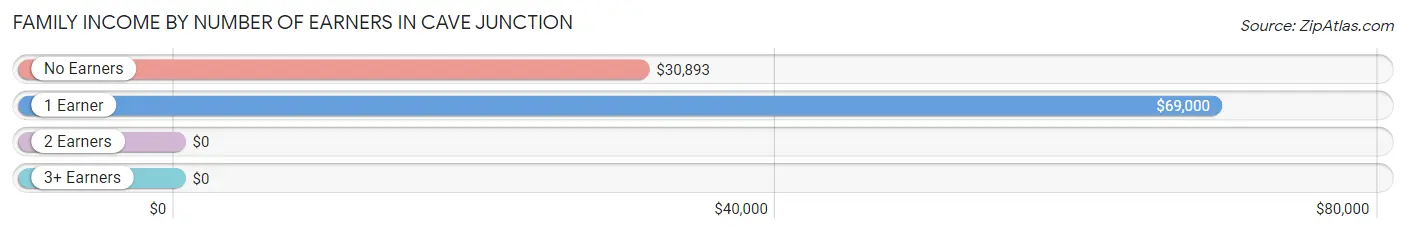
| Number of Earners | # Families | Median Income |
| No Earners | 167 (37.0%) | $30,893 |
| 1 Earner | 186 (41.2%) | $69,000 |
| 2 Earners | 69 (15.3%) | $0 |
| 3+ Earners | 29 (6.4%) | $0 |
| Total | 451 (100.0%) | $44,926 |
Household Income in Cave Junction
Household Income Brackets in Cave Junction
With 160 households falling in the category, the $25,000 to $34,999 income range is the most frequent in Cave Junction, accounting for 18.6% of all households. In contrast, only 14 households (1.6%) fall into the $100,000 to $149,999 income bracket, making it the least populous group.
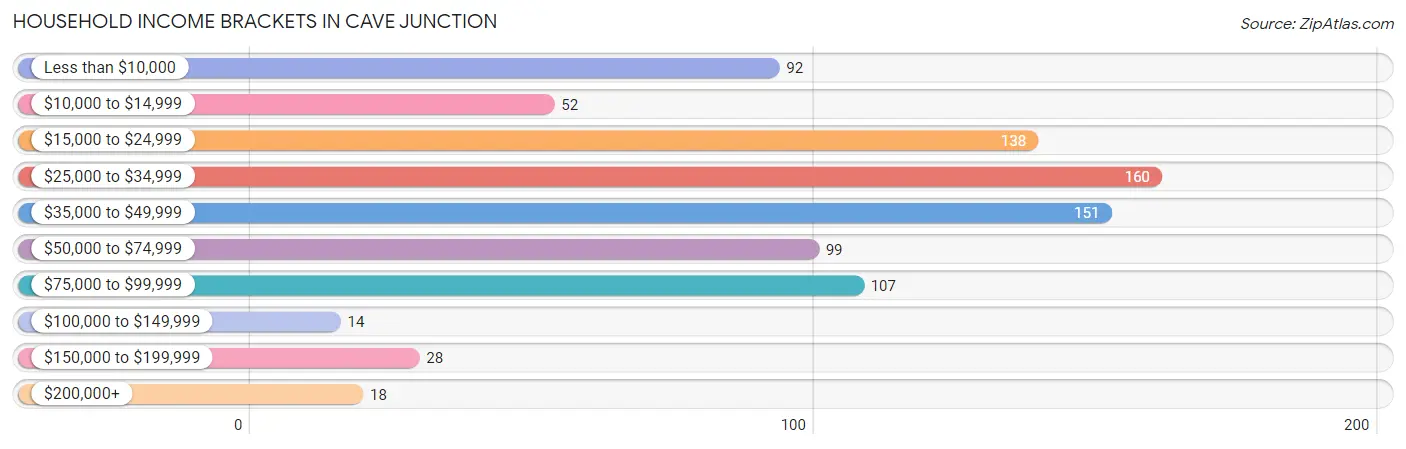
| Income Bracket | # Households | % Households |
| Less than $10,000 | 92 | 10.7% |
| $10,000 to $14,999 | 52 | 6.1% |
| $15,000 to $24,999 | 138 | 16.1% |
| $25,000 to $34,999 | 160 | 18.6% |
| $35,000 to $49,999 | 151 | 17.6% |
| $50,000 to $74,999 | 99 | 11.5% |
| $75,000 to $99,999 | 107 | 12.5% |
| $100,000 to $149,999 | 14 | 1.6% |
| $150,000 to $199,999 | 28 | 3.3% |
| $200,000+ | 18 | 2.1% |
Household Income by Householder Age in Cave Junction
The median household income in Cave Junction is $34,594, with the highest median household income of $69,750 found in the 25 to 44 years age bracket for the primary householder. A total of 189 households (22.0%) fall into this category. Meanwhile, the 15 to 24 years age bracket for the primary householder has the lowest median household income of $0, with 25 households (2.9%) in this group.
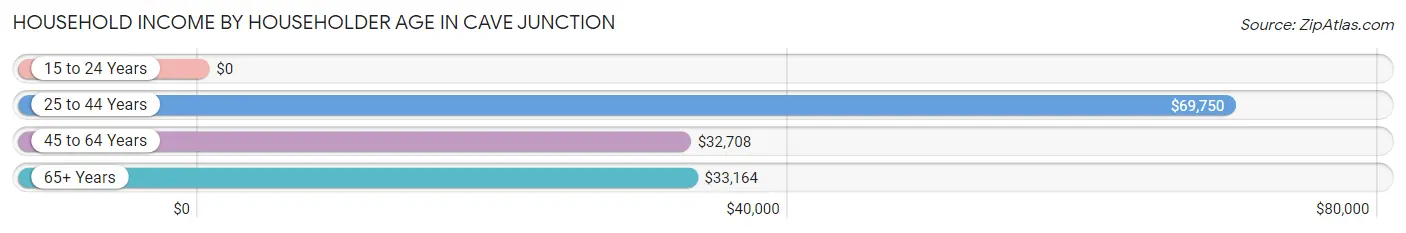
| Income Bracket | # Households | Median Income |
| 15 to 24 Years | 25 (2.9%) | $0 |
| 25 to 44 Years | 189 (22.0%) | $69,750 |
| 45 to 64 Years | 227 (26.4%) | $32,708 |
| 65+ Years | 418 (48.7%) | $33,164 |
| Total | 859 (100.0%) | $34,594 |
Poverty in Cave Junction
Income Below Poverty by Sex and Age in Cave Junction
With 35.6% poverty level for males and 37.3% for females among the residents of Cave Junction, 5 year old males and under 5 year old females are the most vulnerable to poverty, with 8 males (100.0%) and 30 females (100.0%) in their respective age groups living below the poverty level.
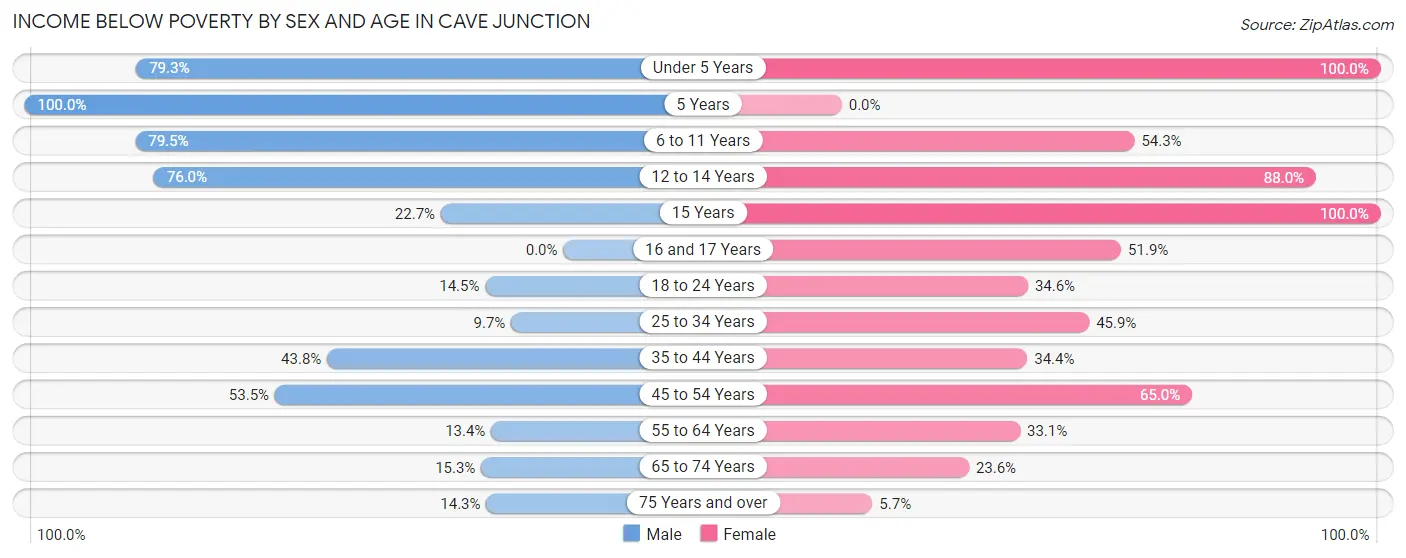
| Age Bracket | Male | Female |
| Under 5 Years | 65 (79.3%) | 30 (100.0%) |
| 5 Years | 8 (100.0%) | 0 (0.0%) |
| 6 to 11 Years | 58 (79.4%) | 44 (54.3%) |
| 12 to 14 Years | 19 (76.0%) | 22 (88.0%) |
| 15 Years | 5 (22.7%) | 7 (100.0%) |
| 16 and 17 Years | 0 (0.0%) | 14 (51.8%) |
| 18 to 24 Years | 10 (14.5%) | 38 (34.5%) |
| 25 to 34 Years | 9 (9.7%) | 45 (45.9%) |
| 35 to 44 Years | 32 (43.8%) | 42 (34.4%) |
| 45 to 54 Years | 53 (53.5%) | 39 (65.0%) |
| 55 to 64 Years | 15 (13.4%) | 46 (33.1%) |
| 65 to 74 Years | 18 (15.2%) | 63 (23.6%) |
| 75 Years and over | 11 (14.3%) | 5 (5.7%) |
| Total | 303 (35.6%) | 395 (37.3%) |
Income Above Poverty by Sex and Age in Cave Junction
According to the poverty statistics in Cave Junction, males aged 25 to 34 years and females aged 5 years are the age groups that are most secure financially, with 90.3% of males and 100.0% of females in these age groups living above the poverty line.
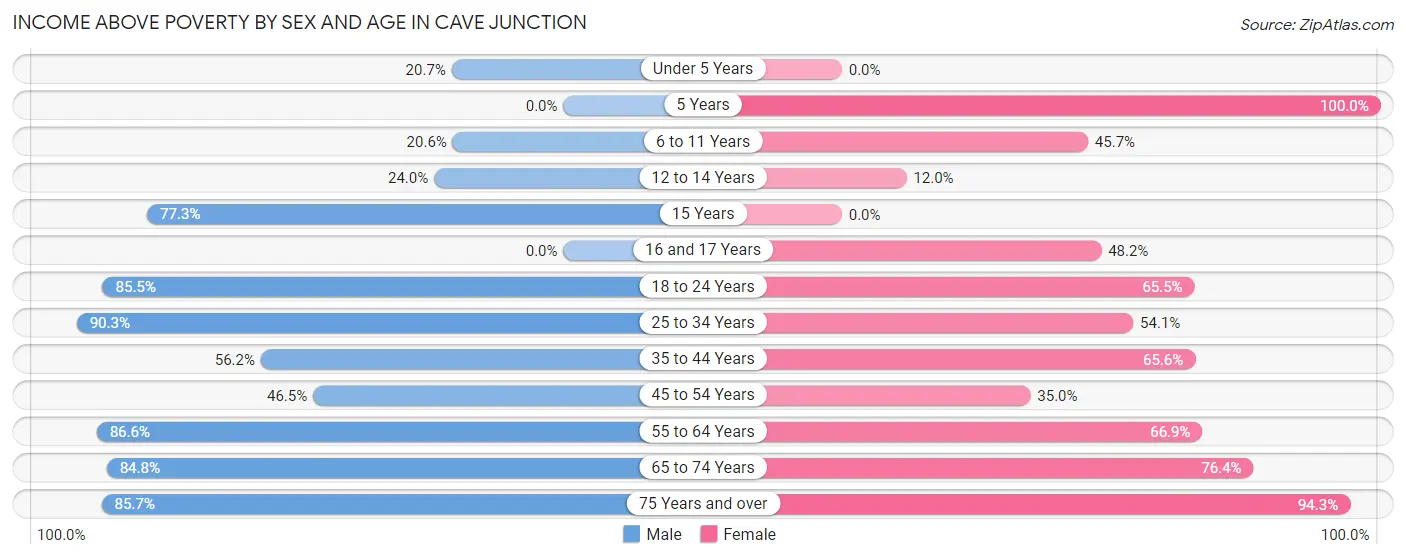
| Age Bracket | Male | Female |
| Under 5 Years | 17 (20.7%) | 0 (0.0%) |
| 5 Years | 0 (0.0%) | 5 (100.0%) |
| 6 to 11 Years | 15 (20.5%) | 37 (45.7%) |
| 12 to 14 Years | 6 (24.0%) | 3 (12.0%) |
| 15 Years | 17 (77.3%) | 0 (0.0%) |
| 16 and 17 Years | 0 (0.0%) | 13 (48.1%) |
| 18 to 24 Years | 59 (85.5%) | 72 (65.4%) |
| 25 to 34 Years | 84 (90.3%) | 53 (54.1%) |
| 35 to 44 Years | 41 (56.2%) | 80 (65.6%) |
| 45 to 54 Years | 46 (46.5%) | 21 (35.0%) |
| 55 to 64 Years | 97 (86.6%) | 93 (66.9%) |
| 65 to 74 Years | 100 (84.8%) | 204 (76.4%) |
| 75 Years and over | 66 (85.7%) | 83 (94.3%) |
| Total | 548 (64.4%) | 664 (62.7%) |
Income Below Poverty Among Married-Couple Families in Cave Junction
The poverty statistics for married-couple families in Cave Junction show that 20.0% or 65 of the total 325 families live below the poverty line. Families with 5 or more children have the highest poverty rate of 100.0%, comprising of 16 families. On the other hand, families with 1 or 2 children have the lowest poverty rate of 0.0%, which includes 0 families.
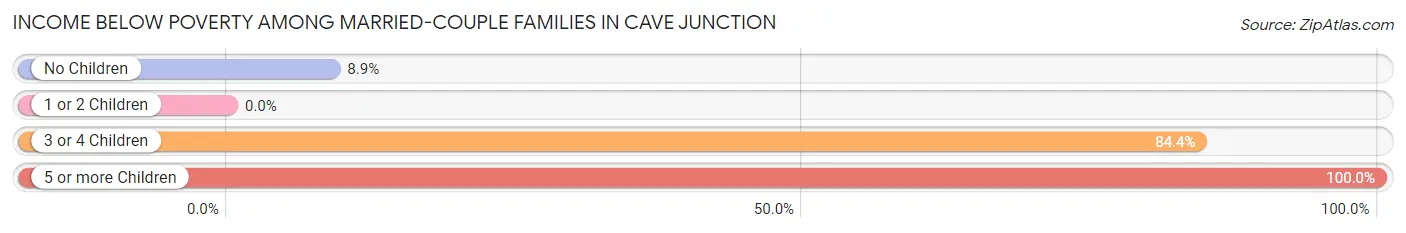
| Children | Above Poverty | Below Poverty |
| No Children | 225 (91.1%) | 22 (8.9%) |
| 1 or 2 Children | 30 (100.0%) | 0 (0.0%) |
| 3 or 4 Children | 5 (15.6%) | 27 (84.4%) |
| 5 or more Children | 0 (0.0%) | 16 (100.0%) |
| Total | 260 (80.0%) | 65 (20.0%) |
Income Below Poverty Among Single-Parent Households in Cave Junction
According to the poverty data in Cave Junction, 70.5% or 31 single-father households and 34.2% or 28 single-mother households are living below the poverty line. Among single-father households, those with 3 or 4 children have the highest poverty rate, with 6 households (100.0%) experiencing poverty. Likewise, among single-mother households, those with 3 or 4 children have the highest poverty rate, with 11 households (100.0%) falling below the poverty line.
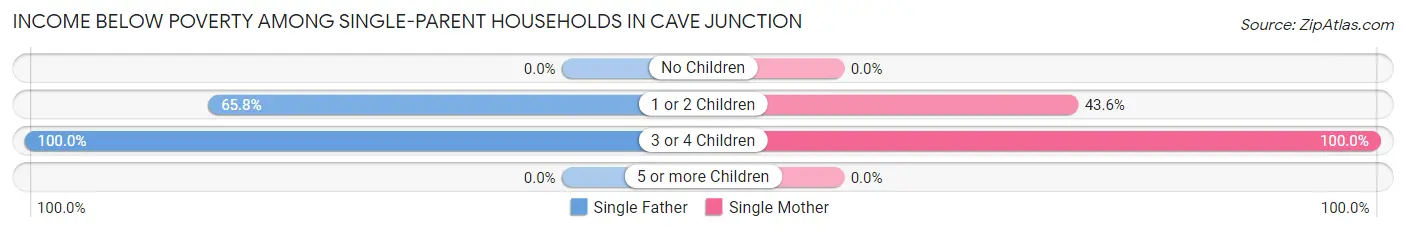
| Children | Single Father | Single Mother |
| No Children | 0 (0.0%) | 0 (0.0%) |
| 1 or 2 Children | 25 (65.8%) | 17 (43.6%) |
| 3 or 4 Children | 6 (100.0%) | 11 (100.0%) |
| 5 or more Children | 0 (0.0%) | 0 (0.0%) |
| Total | 31 (70.5%) | 28 (34.2%) |
Income Below Poverty Among Married-Couple vs Single-Parent Households in Cave Junction
The poverty data for Cave Junction shows that 65 of the married-couple family households (20.0%) and 59 of the single-parent households (46.8%) are living below the poverty level. Within the married-couple family households, those with 5 or more children have the highest poverty rate, with 16 households (100.0%) falling below the poverty line. Among the single-parent households, those with 3 or 4 children have the highest poverty rate, with 17 household (100.0%) living below poverty.
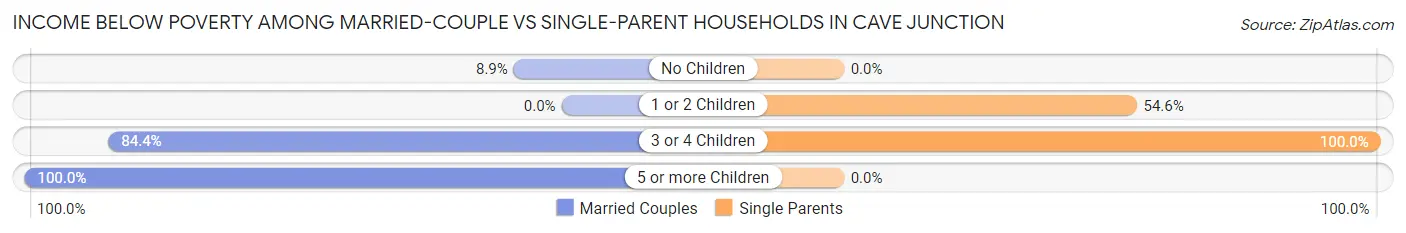
| Children | Married-Couple Families | Single-Parent Households |
| No Children | 22 (8.9%) | 0 (0.0%) |
| 1 or 2 Children | 0 (0.0%) | 42 (54.5%) |
| 3 or 4 Children | 27 (84.4%) | 17 (100.0%) |
| 5 or more Children | 16 (100.0%) | 0 (0.0%) |
| Total | 65 (20.0%) | 59 (46.8%) |
Race in Cave Junction
The most populous races in Cave Junction are White / Caucasian (1,662 | 87.0%), Hispanic or Latino (269 | 14.1%), and Two or more Races (152 | 8.0%).
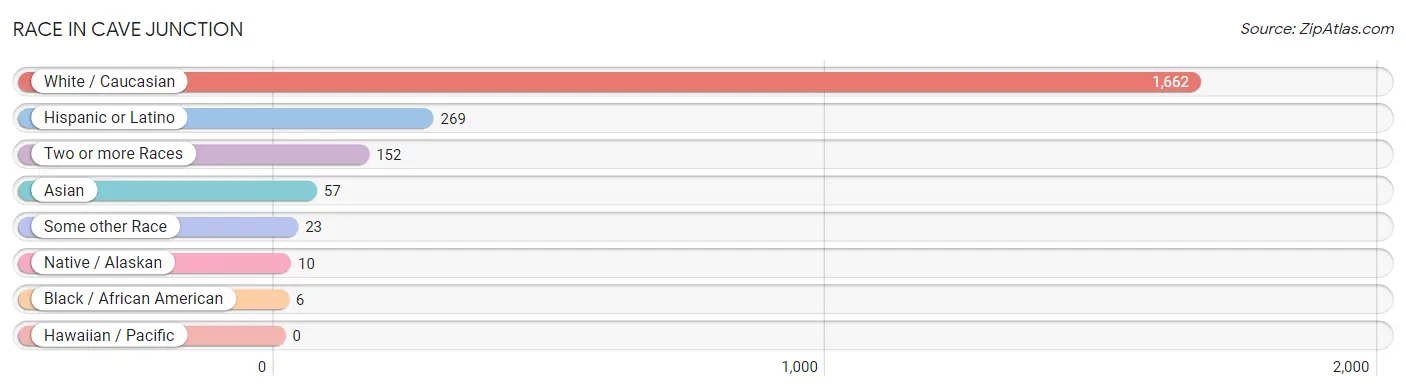
| Race | # Population | % Population |
| Asian | 57 | 3.0% |
| Black / African American | 6 | 0.3% |
| Hawaiian / Pacific | 0 | 0.0% |
| Hispanic or Latino | 269 | 14.1% |
| Native / Alaskan | 10 | 0.5% |
| White / Caucasian | 1,662 | 87.0% |
| Two or more Races | 152 | 8.0% |
| Some other Race | 23 | 1.2% |
| Total | 1,910 | 100.0% |
Ancestry in Cave Junction
The most populous ancestries reported in Cave Junction are Irish (288 | 15.1%), English (264 | 13.8%), German (258 | 13.5%), Mexican (186 | 9.7%), and American (112 | 5.9%), together accounting for 58.0% of all Cave Junction residents.
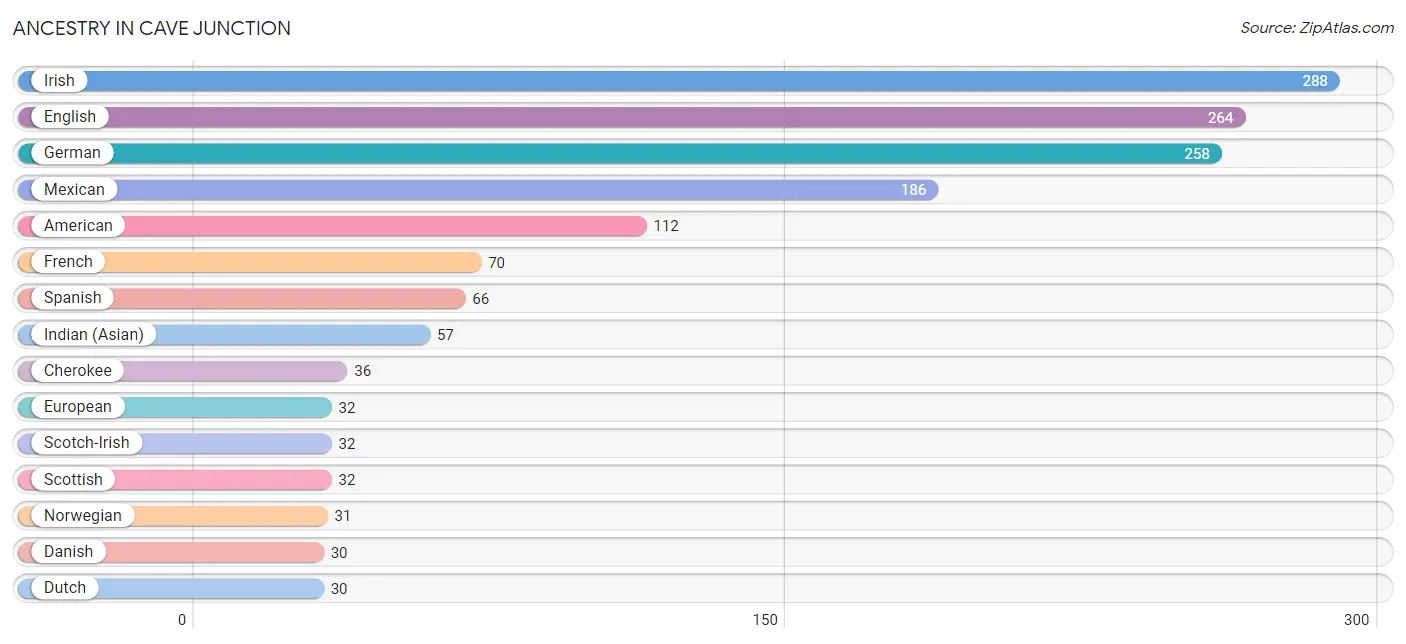
| Ancestry | # Population | % Population |
| American | 112 | 5.9% |
| Austrian | 15 | 0.8% |
| British | 23 | 1.2% |
| Canadian | 7 | 0.4% |
| Cherokee | 36 | 1.9% |
| Creek | 3 | 0.2% |
| Czech | 1 | 0.1% |
| Danish | 30 | 1.6% |
| Dutch | 30 | 1.6% |
| English | 264 | 13.8% |
| European | 32 | 1.7% |
| Finnish | 6 | 0.3% |
| French | 70 | 3.7% |
| German | 258 | 13.5% |
| Greek | 27 | 1.4% |
| Hungarian | 15 | 0.8% |
| Indian (Asian) | 57 | 3.0% |
| Irish | 288 | 15.1% |
| Italian | 16 | 0.8% |
| Mexican | 186 | 9.7% |
| Norwegian | 31 | 1.6% |
| Polish | 7 | 0.4% |
| Pueblo | 7 | 0.4% |
| Puerto Rican | 16 | 0.8% |
| Scotch-Irish | 32 | 1.7% |
| Scottish | 32 | 1.7% |
| South African | 13 | 0.7% |
| Spanish | 66 | 3.5% |
| Subsaharan African | 13 | 0.7% |
| Swedish | 28 | 1.5% |
| Ukrainian | 6 | 0.3% |
| Welsh | 13 | 0.7% |
| Yugoslavian | 6 | 0.3% | View All 33 Rows |
Immigrants in Cave Junction
The most numerous immigrant groups reported in Cave Junction came from Canada (50 | 2.6%), Central America (24 | 1.3%), Latin America (24 | 1.3%), Mexico (24 | 1.3%), and Asia (23 | 1.2%), together accounting for 7.6% of all Cave Junction residents.
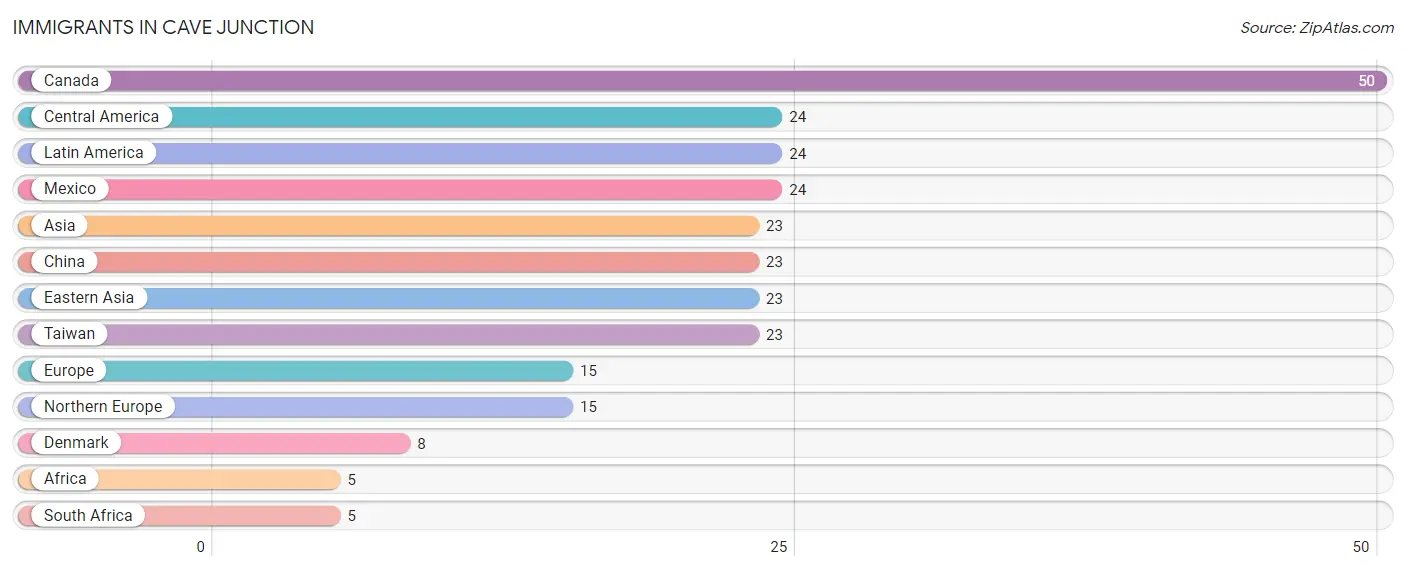
| Immigration Origin | # Population | % Population |
| Africa | 5 | 0.3% |
| Asia | 23 | 1.2% |
| Canada | 50 | 2.6% |
| Central America | 24 | 1.3% |
| China | 23 | 1.2% |
| Denmark | 8 | 0.4% |
| Eastern Asia | 23 | 1.2% |
| Europe | 15 | 0.8% |
| Latin America | 24 | 1.3% |
| Mexico | 24 | 1.3% |
| Northern Europe | 15 | 0.8% |
| South Africa | 5 | 0.3% |
| Taiwan | 23 | 1.2% | View All 13 Rows |
Sex and Age in Cave Junction
Sex and Age in Cave Junction
The most populous age groups in Cave Junction are 60 to 64 Years (87 | 10.2%) for men and 70 to 74 Years (166 | 15.7%) for women.
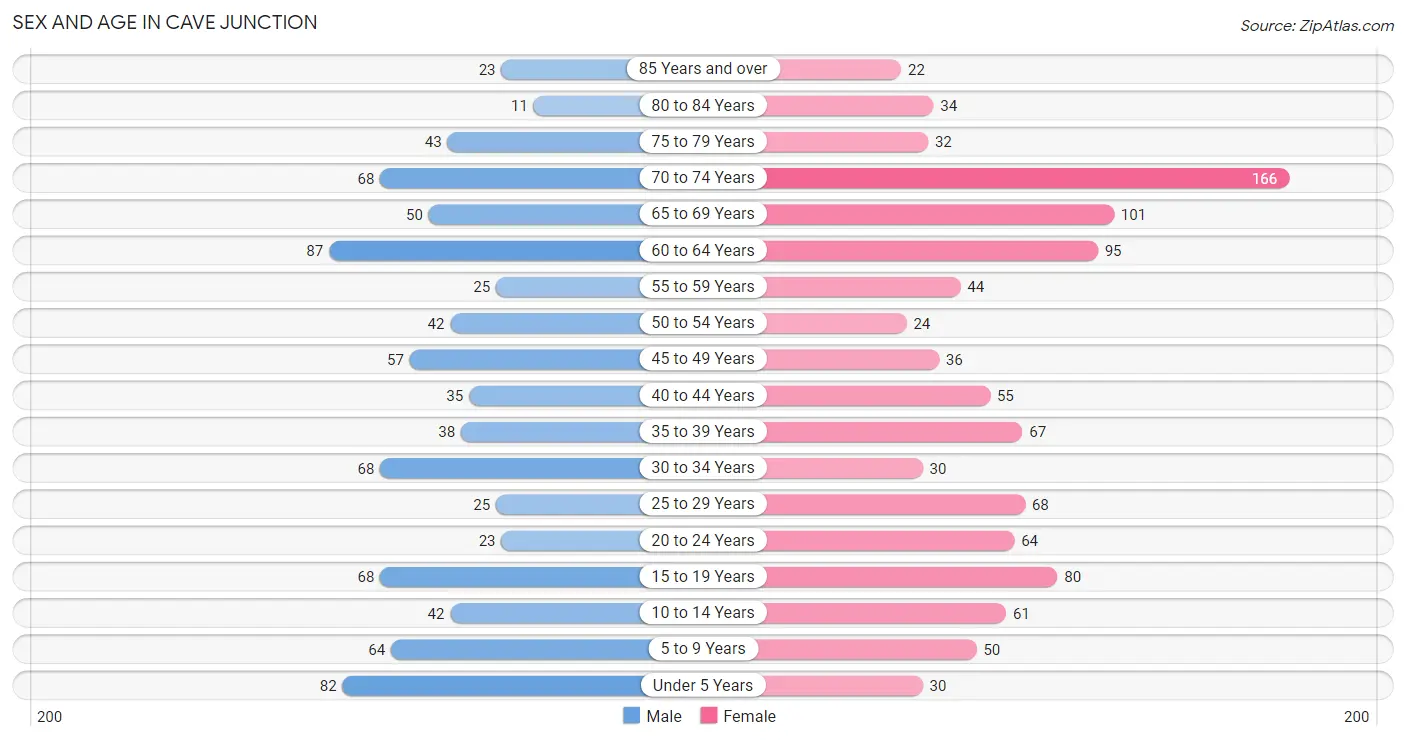
| Age Bracket | Male | Female |
| Under 5 Years | 82 (9.6%) | 30 (2.8%) |
| 5 to 9 Years | 64 (7.5%) | 50 (4.7%) |
| 10 to 14 Years | 42 (4.9%) | 61 (5.8%) |
| 15 to 19 Years | 68 (8.0%) | 80 (7.5%) |
| 20 to 24 Years | 23 (2.7%) | 64 (6.0%) |
| 25 to 29 Years | 25 (2.9%) | 68 (6.4%) |
| 30 to 34 Years | 68 (8.0%) | 30 (2.8%) |
| 35 to 39 Years | 38 (4.5%) | 67 (6.3%) |
| 40 to 44 Years | 35 (4.1%) | 55 (5.2%) |
| 45 to 49 Years | 57 (6.7%) | 36 (3.4%) |
| 50 to 54 Years | 42 (4.9%) | 24 (2.3%) |
| 55 to 59 Years | 25 (2.9%) | 44 (4.2%) |
| 60 to 64 Years | 87 (10.2%) | 95 (9.0%) |
| 65 to 69 Years | 50 (5.9%) | 101 (9.5%) |
| 70 to 74 Years | 68 (8.0%) | 166 (15.7%) |
| 75 to 79 Years | 43 (5.1%) | 32 (3.0%) |
| 80 to 84 Years | 11 (1.3%) | 34 (3.2%) |
| 85 Years and over | 23 (2.7%) | 22 (2.1%) |
| Total | 851 (100.0%) | 1,059 (100.0%) |
Families and Households in Cave Junction
Median Family Size in Cave Junction
The median family size in Cave Junction is 3.02 persons per family, with single male/father families (44 | 9.8%) accounting for the largest median family size of 3.77 persons per family. On the other hand, married-couple families (325 | 72.1%) represent the smallest median family size with 2.94 persons per family.
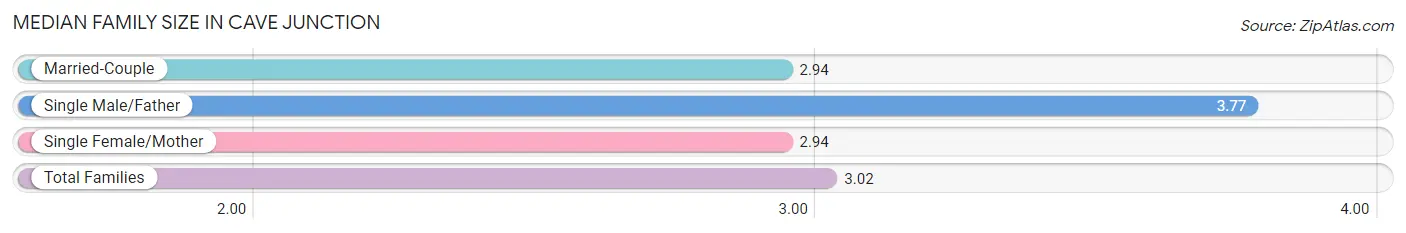
| Family Type | # Families | Family Size |
| Married-Couple | 325 (72.1%) | 2.94 |
| Single Male/Father | 44 (9.8%) | 3.77 |
| Single Female/Mother | 82 (18.2%) | 2.94 |
| Total Families | 451 (100.0%) | 3.02 |
Median Household Size in Cave Junction
The median household size in Cave Junction is 2.21 persons per household, with single male/father households (44 | 5.1%) accounting for the largest median household size of 4.64 persons per household. non-family households (408 | 47.5%) represent the smallest median household size with 1.21 persons per household.
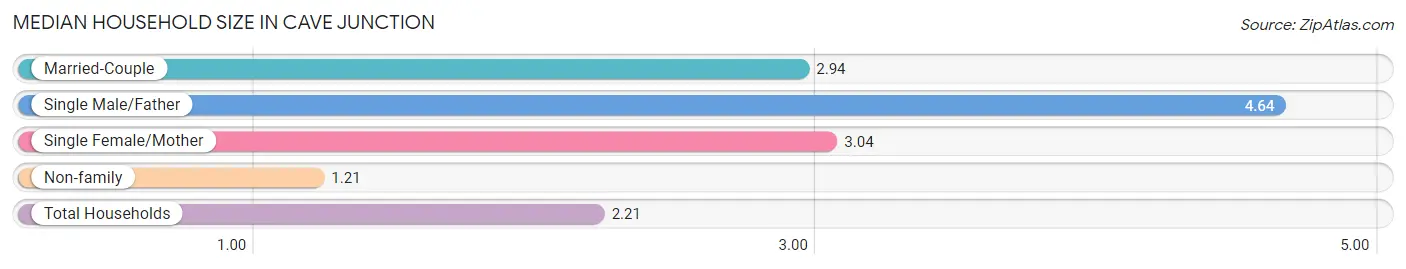
| Household Type | # Households | Household Size |
| Married-Couple | 325 (37.8%) | 2.94 |
| Single Male/Father | 44 (5.1%) | 4.64 |
| Single Female/Mother | 82 (9.6%) | 3.04 |
| Non-family | 408 (47.5%) | 1.21 |
| Total Households | 859 (100.0%) | 2.21 |
Household Size by Marriage Status in Cave Junction
Out of a total of 859 households in Cave Junction, 451 (52.5%) are family households, while 408 (47.5%) are nonfamily households. The most numerous type of family households are 2-person households, comprising 256, and the most common type of nonfamily households are 1-person households, comprising 342.
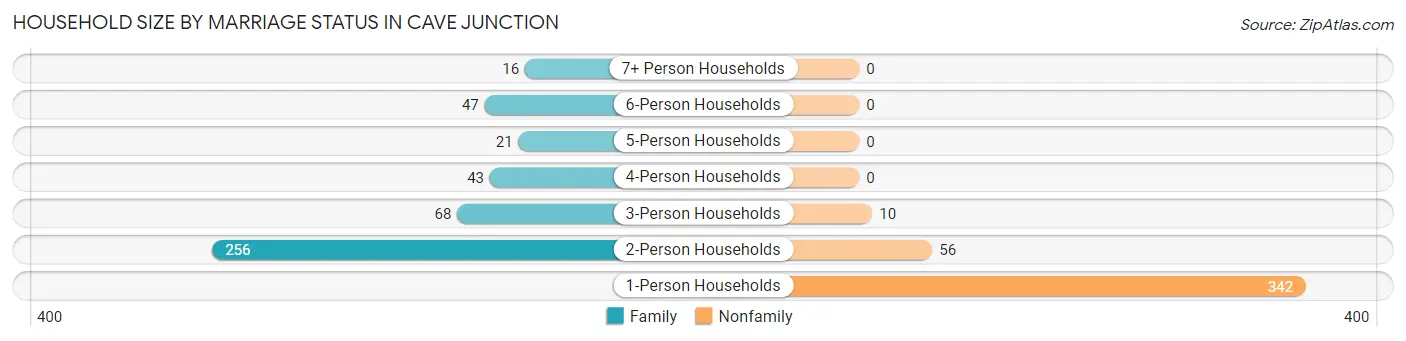
| Household Size | Family Households | Nonfamily Households |
| 1-Person Households | - | 342 (39.8%) |
| 2-Person Households | 256 (29.8%) | 56 (6.5%) |
| 3-Person Households | 68 (7.9%) | 10 (1.2%) |
| 4-Person Households | 43 (5.0%) | 0 (0.0%) |
| 5-Person Households | 21 (2.4%) | 0 (0.0%) |
| 6-Person Households | 47 (5.5%) | 0 (0.0%) |
| 7+ Person Households | 16 (1.9%) | 0 (0.0%) |
| Total | 451 (52.5%) | 408 (47.5%) |
Female Fertility in Cave Junction
Fertility by Age in Cave Junction
Average fertility rate in Cave Junction is 76.0 births per 1,000 women. Women in the age bracket of 20 to 34 years have the highest fertility rate with 142.0 births per 1,000 women. Women in the age bracket of 20 to 34 years acount for 71.9% of all women with births.
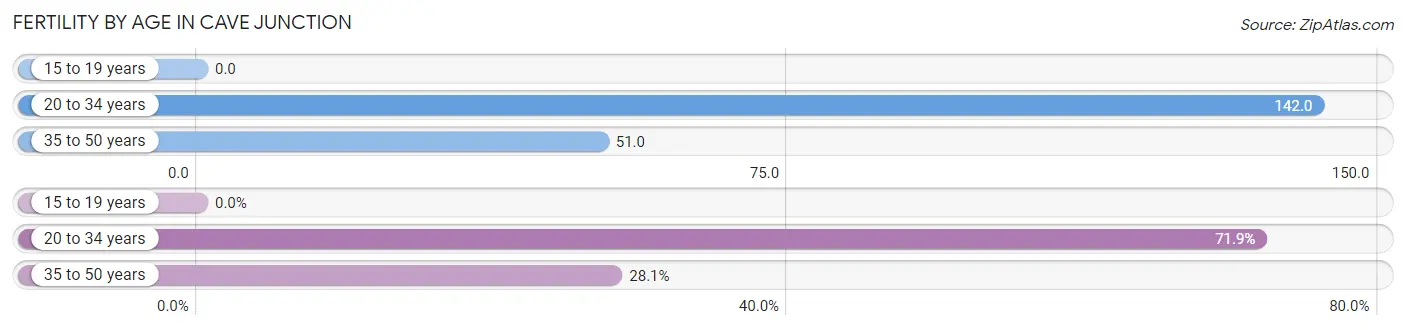
| Age Bracket | Women with Births | Births / 1,000 Women |
| 15 to 19 years | 0 (0.0%) | 0.0 |
| 20 to 34 years | 23 (71.9%) | 142.0 |
| 35 to 50 years | 9 (28.1%) | 51.0 |
| Total | 32 (100.0%) | 76.0 |
Fertility by Age by Marriage Status in Cave Junction
46.9% of women with births (32) in Cave Junction are married. The highest percentage of unmarried women with births falls into 20 to 34 years age bracket with 73.9% of them unmarried at the time of birth, while the lowest percentage of unmarried women with births belong to 35 to 50 years age bracket with 0.0% of them unmarried.
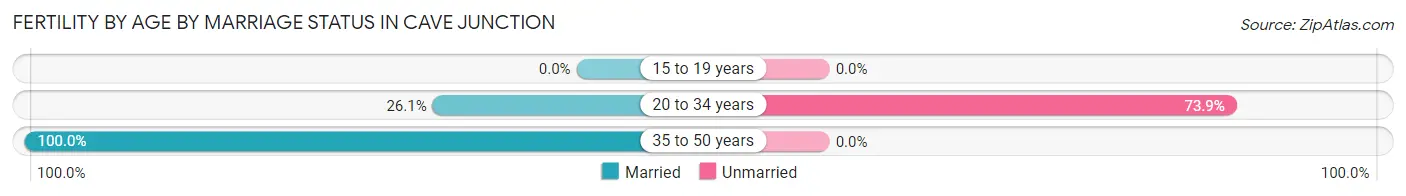
| Age Bracket | Married | Unmarried |
| 15 to 19 years | 0 (0.0%) | 0 (0.0%) |
| 20 to 34 years | 6 (26.1%) | 17 (73.9%) |
| 35 to 50 years | 9 (100.0%) | 0 (0.0%) |
| Total | 15 (46.9%) | 17 (53.1%) |
Fertility by Education in Cave Junction
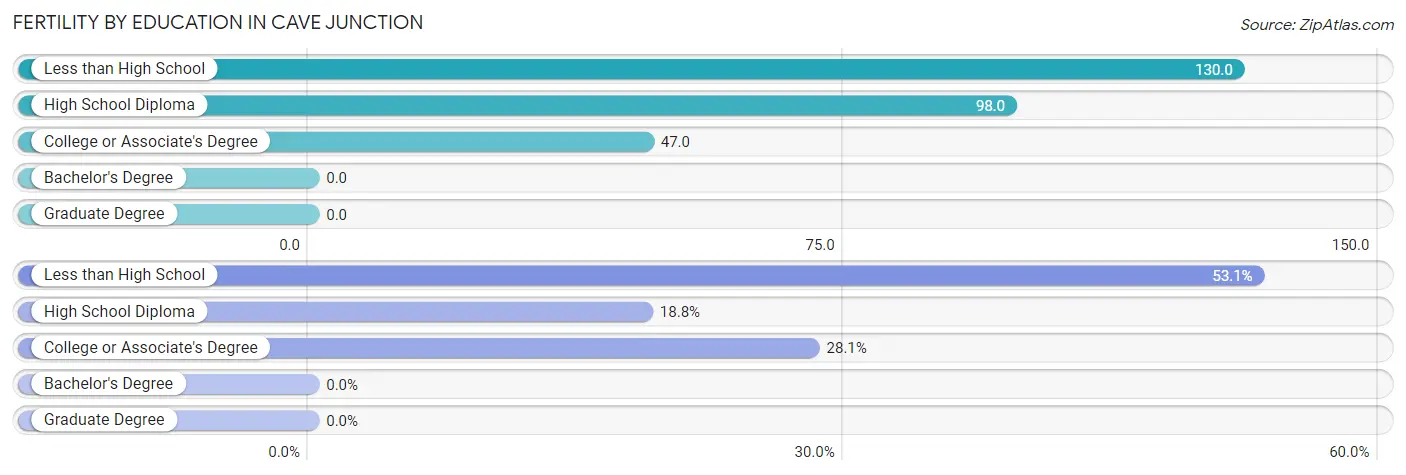
| Educational Attainment | Women with Births | Births / 1,000 Women |
| Less than High School | 17 (53.1%) | 130.0 |
| High School Diploma | 6 (18.8%) | 98.0 |
| College or Associate's Degree | 9 (28.1%) | 47.0 |
| Bachelor's Degree | 0 (0.0%) | 0.0 |
| Graduate Degree | 0 (0.0%) | 0.0 |
| Total | 32 (100.0%) | 76.0 |
Fertility by Education by Marriage Status in Cave Junction
53.1% of women with births in Cave Junction are unmarried. Women with the educational attainment of high school diploma are most likely to be married with 100.0% of them married at childbirth, while women with the educational attainment of less than high school are least likely to be married with 100.0% of them unmarried at childbirth.
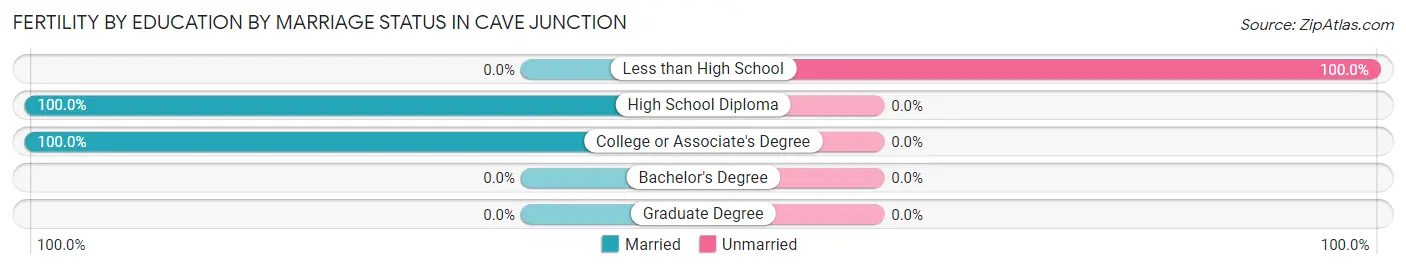
| Educational Attainment | Married | Unmarried |
| Less than High School | 0 (0.0%) | 17 (100.0%) |
| High School Diploma | 6 (100.0%) | 0 (0.0%) |
| College or Associate's Degree | 9 (100.0%) | 0 (0.0%) |
| Bachelor's Degree | 0 (0.0%) | 0 (0.0%) |
| Graduate Degree | 0 (0.0%) | 0 (0.0%) |
| Total | 15 (46.9%) | 17 (53.1%) |
Employment Characteristics in Cave Junction
Employment by Class of Employer in Cave Junction
Among the 563 employed individuals in Cave Junction, private company employees (393 | 69.8%), not-for-profit organizations (79 | 14.0%), and local government employees (30 | 5.3%) make up the most common classes of employment.
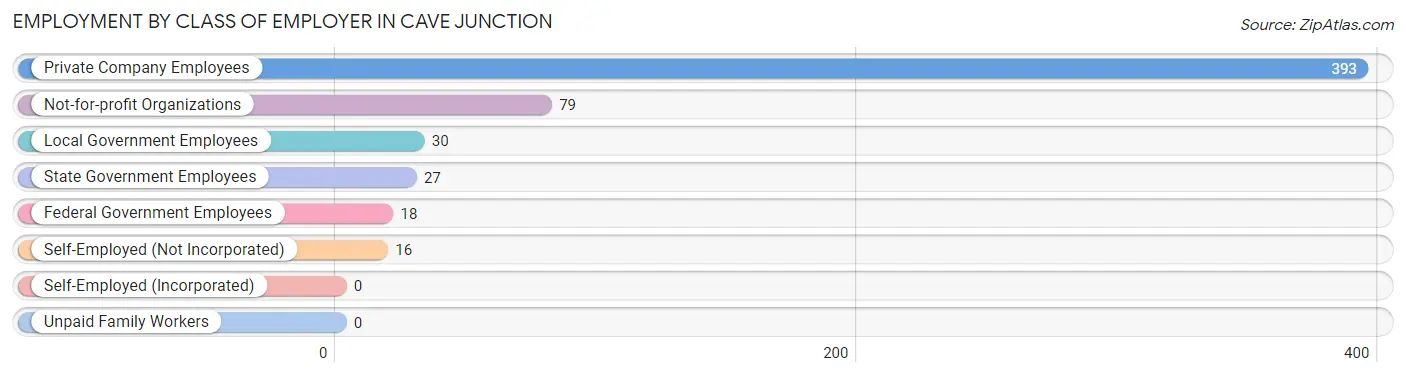
| Employer Class | # Employees | % Employees |
| Private Company Employees | 393 | 69.8% |
| Self-Employed (Incorporated) | 0 | 0.0% |
| Self-Employed (Not Incorporated) | 16 | 2.8% |
| Not-for-profit Organizations | 79 | 14.0% |
| Local Government Employees | 30 | 5.3% |
| State Government Employees | 27 | 4.8% |
| Federal Government Employees | 18 | 3.2% |
| Unpaid Family Workers | 0 | 0.0% |
| Total | 563 | 100.0% |
Employment Status by Age in Cave Junction
According to the labor force statistics for Cave Junction, out of the total population over 16 years of age (1,552), 41.1% or 638 individuals are in the labor force, with 10.3% or 66 of them unemployed. The age group with the highest labor force participation rate is 25 to 29 years, with 86.0% or 80 individuals in the labor force. Within the labor force, the 20 to 24 years age range has the highest percentage of unemployed individuals, with 56.3% or 40 of them being unemployed.
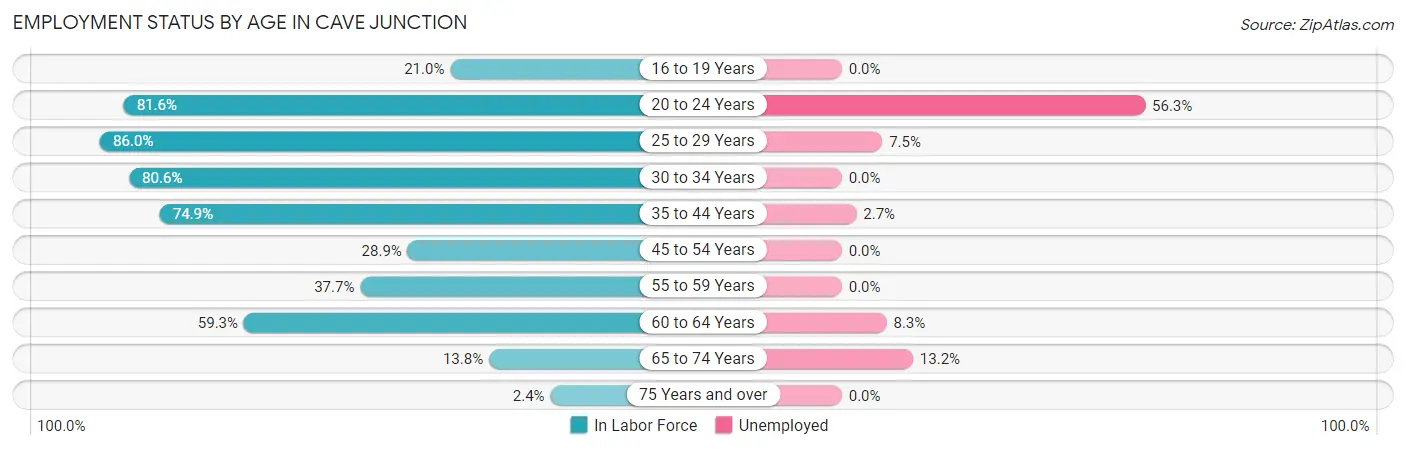
| Age Bracket | In Labor Force | Unemployed |
| 16 to 19 Years | 25 (21.0%) | 0 (0.0%) |
| 20 to 24 Years | 71 (81.6%) | 40 (56.3%) |
| 25 to 29 Years | 80 (86.0%) | 6 (7.5%) |
| 30 to 34 Years | 79 (80.6%) | 0 (0.0%) |
| 35 to 44 Years | 146 (74.9%) | 4 (2.7%) |
| 45 to 54 Years | 46 (28.9%) | 0 (0.0%) |
| 55 to 59 Years | 26 (37.7%) | 0 (0.0%) |
| 60 to 64 Years | 108 (59.3%) | 9 (8.3%) |
| 65 to 74 Years | 53 (13.8%) | 7 (13.2%) |
| 75 Years and over | 4 (2.4%) | 0 (0.0%) |
| Total | 638 (41.1%) | 66 (10.3%) |
Employment Status by Educational Attainment in Cave Junction
According to labor force statistics for Cave Junction, 60.9% of individuals (485) out of the total population between 25 and 64 years of age (796) are in the labor force, with 3.9% or 19 of them being unemployed. The group with the highest labor force participation rate are those with the educational attainment of bachelor's degree or higher, with 100.0% or 94 individuals in the labor force. Within the labor force, individuals with high school diploma education have the highest percentage of unemployment, with 16.2% or 19 of them being unemployed.
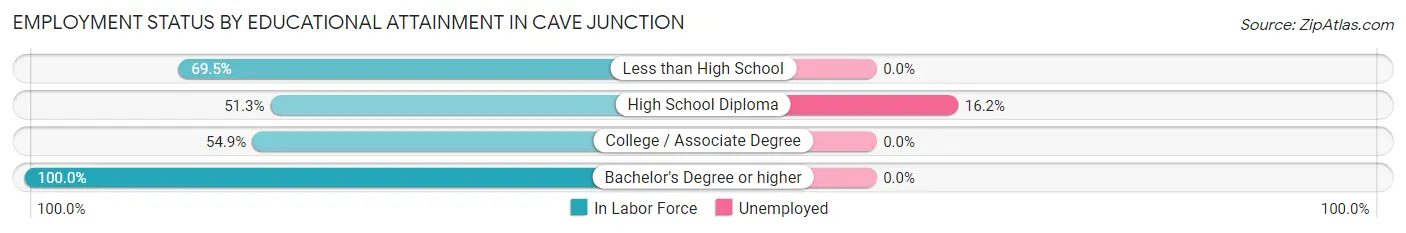
| Educational Attainment | In Labor Force | Unemployed |
| Less than High School | 66 (69.5%) | 0 (0.0%) |
| High School Diploma | 117 (51.3%) | 37 (16.2%) |
| College / Associate Degree | 208 (54.9%) | 0 (0.0%) |
| Bachelor's Degree or higher | 94 (100.0%) | 0 (0.0%) |
| Total | 485 (60.9%) | 31 (3.9%) |
Employment Occupations by Sex in Cave Junction
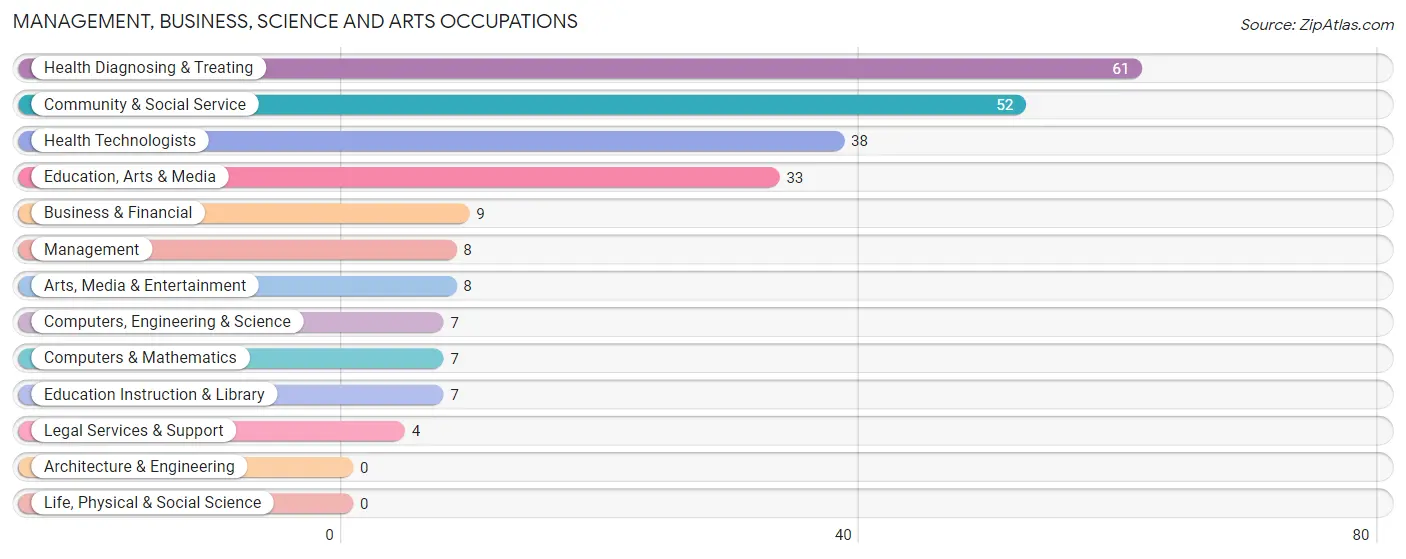
Management, Business, Science and Arts Occupations
The most common Management, Business, Science and Arts occupations in Cave Junction are Health Diagnosing & Treating (61 | 10.7%), Community & Social Service (52 | 9.1%), Health Technologists (38 | 6.6%), Education, Arts & Media (33 | 5.8%), and Business & Financial (9 | 1.6%).
Management, Business, Science and Arts Occupations by Sex
Within the Management, Business, Science and Arts occupations in Cave Junction, the most male-oriented occupations are Management (100.0%), Computers, Engineering & Science (100.0%), and Computers & Mathematics (100.0%), while the most female-oriented occupations are Community & Social Service (100.0%), Education, Arts & Media (100.0%), and Legal Services & Support (100.0%).
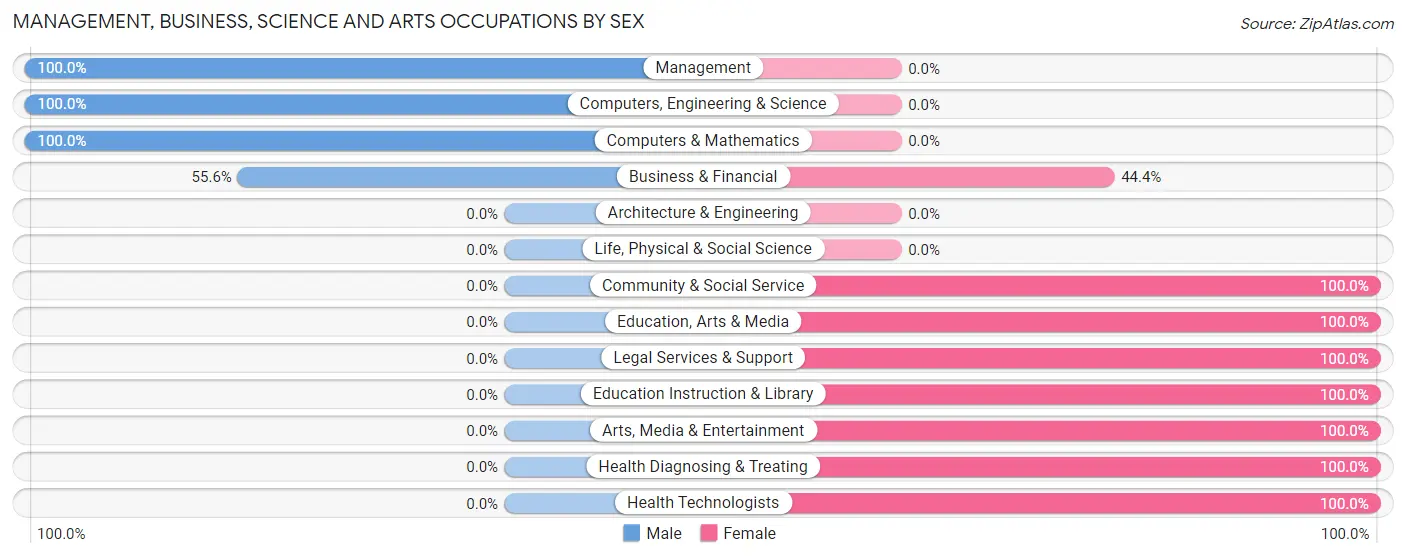
| Occupation | Male | Female |
| Management | 8 (100.0%) | 0 (0.0%) |
| Business & Financial | 5 (55.6%) | 4 (44.4%) |
| Computers, Engineering & Science | 7 (100.0%) | 0 (0.0%) |
| Computers & Mathematics | 7 (100.0%) | 0 (0.0%) |
| Architecture & Engineering | 0 (0.0%) | 0 (0.0%) |
| Life, Physical & Social Science | 0 (0.0%) | 0 (0.0%) |
| Community & Social Service | 0 (0.0%) | 52 (100.0%) |
| Education, Arts & Media | 0 (0.0%) | 33 (100.0%) |
| Legal Services & Support | 0 (0.0%) | 4 (100.0%) |
| Education Instruction & Library | 0 (0.0%) | 7 (100.0%) |
| Arts, Media & Entertainment | 0 (0.0%) | 8 (100.0%) |
| Health Diagnosing & Treating | 0 (0.0%) | 61 (100.0%) |
| Health Technologists | 0 (0.0%) | 38 (100.0%) |
| Total (Category) | 20 (14.6%) | 117 (85.4%) |
| Total (Overall) | 226 (39.5%) | 346 (60.5%) |
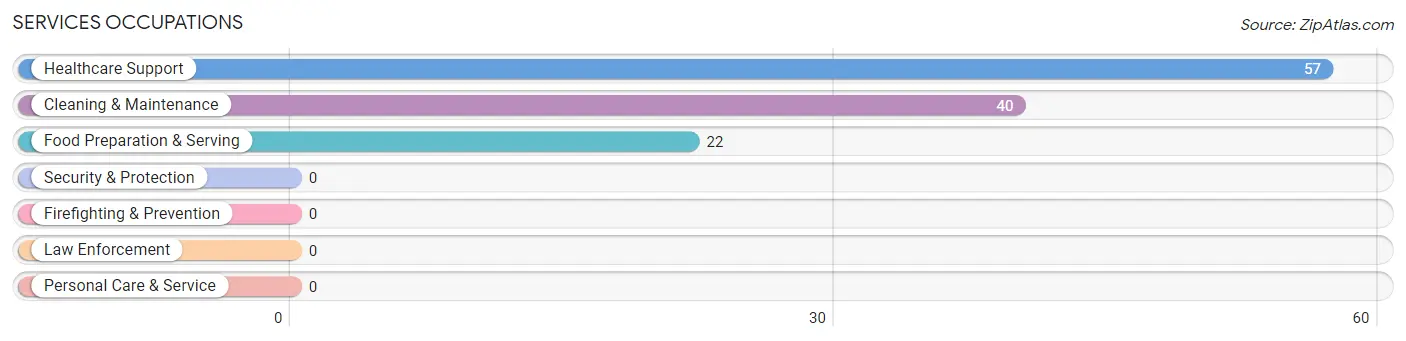
Services Occupations
The most common Services occupations in Cave Junction are Healthcare Support (57 | 10.0%), Cleaning & Maintenance (40 | 7.0%), and Food Preparation & Serving (22 | 3.8%).
Services Occupations by Sex
Within the Services occupations in Cave Junction, the most male-oriented occupations are Food Preparation & Serving (72.7%), Cleaning & Maintenance (52.5%), and Healthcare Support (24.6%), while the most female-oriented occupations are Healthcare Support (75.4%), Cleaning & Maintenance (47.5%), and Food Preparation & Serving (27.3%).
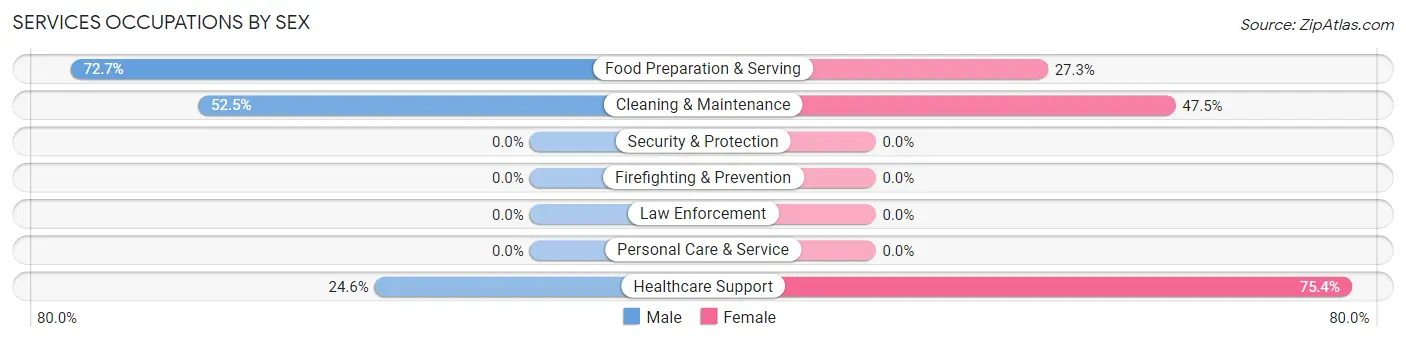
| Occupation | Male | Female |
| Healthcare Support | 14 (24.6%) | 43 (75.4%) |
| Security & Protection | 0 (0.0%) | 0 (0.0%) |
| Firefighting & Prevention | 0 (0.0%) | 0 (0.0%) |
| Law Enforcement | 0 (0.0%) | 0 (0.0%) |
| Food Preparation & Serving | 16 (72.7%) | 6 (27.3%) |
| Cleaning & Maintenance | 21 (52.5%) | 19 (47.5%) |
| Personal Care & Service | 0 (0.0%) | 0 (0.0%) |
| Total (Category) | 51 (42.9%) | 68 (57.1%) |
| Total (Overall) | 226 (39.5%) | 346 (60.5%) |
Sales and Office Occupations
The most common Sales and Office occupations in Cave Junction are Sales & Related (139 | 24.3%), and Office & Administration (79 | 13.8%).

Sales and Office Occupations by Sex
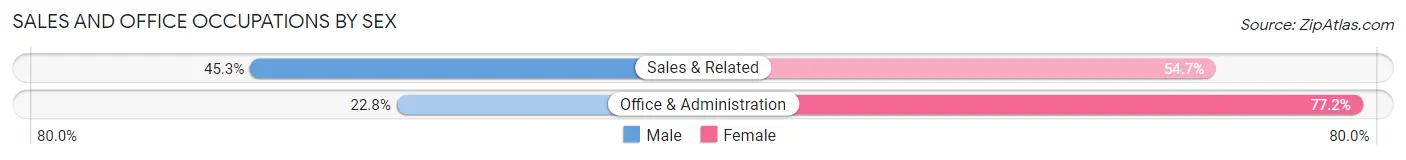
| Occupation | Male | Female |
| Sales & Related | 63 (45.3%) | 76 (54.7%) |
| Office & Administration | 18 (22.8%) | 61 (77.2%) |
| Total (Category) | 81 (37.2%) | 137 (62.8%) |
| Total (Overall) | 226 (39.5%) | 346 (60.5%) |
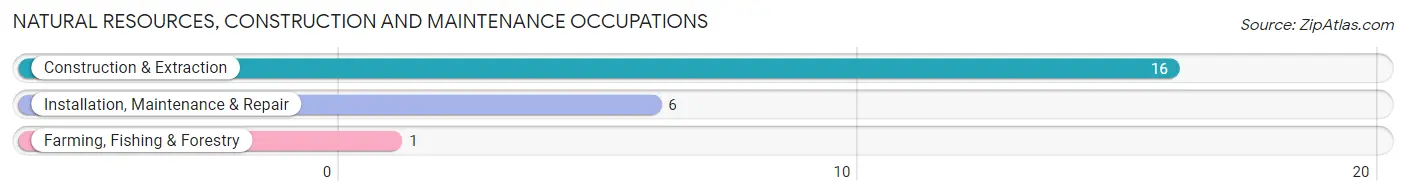
Natural Resources, Construction and Maintenance Occupations
The most common Natural Resources, Construction and Maintenance occupations in Cave Junction are Construction & Extraction (16 | 2.8%), Installation, Maintenance & Repair (6 | 1.1%), and Farming, Fishing & Forestry (1 | 0.2%).
Natural Resources, Construction and Maintenance Occupations by Sex
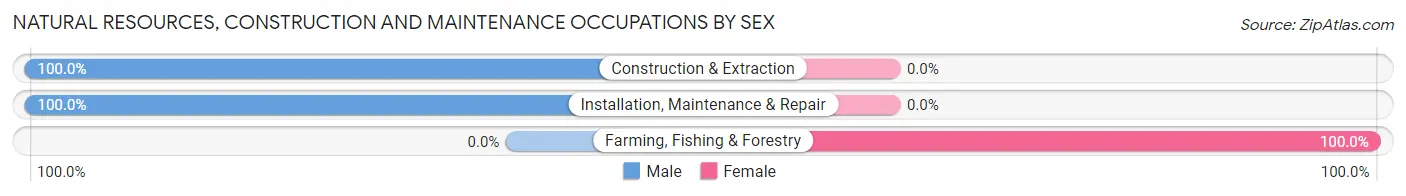
| Occupation | Male | Female |
| Farming, Fishing & Forestry | 0 (0.0%) | 1 (100.0%) |
| Construction & Extraction | 16 (100.0%) | 0 (0.0%) |
| Installation, Maintenance & Repair | 6 (100.0%) | 0 (0.0%) |
| Total (Category) | 22 (95.7%) | 1 (4.3%) |
| Total (Overall) | 226 (39.5%) | 346 (60.5%) |
Production, Transportation and Moving Occupations
The most common Production, Transportation and Moving occupations in Cave Junction are Material Moving (52 | 9.1%), and Production (23 | 4.0%).
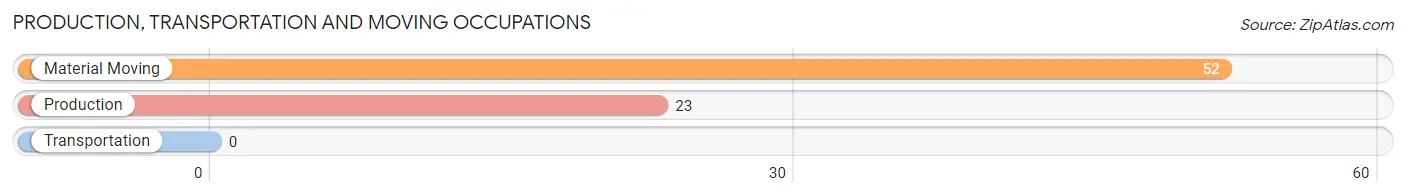
Production, Transportation and Moving Occupations by Sex
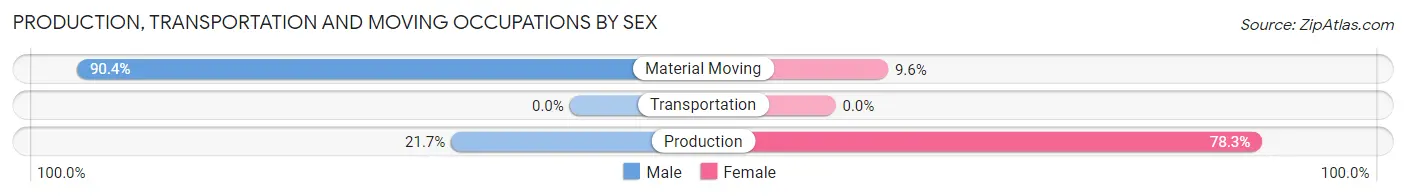
| Occupation | Male | Female |
| Production | 5 (21.7%) | 18 (78.3%) |
| Transportation | 0 (0.0%) | 0 (0.0%) |
| Material Moving | 47 (90.4%) | 5 (9.6%) |
| Total (Category) | 52 (69.3%) | 23 (30.7%) |
| Total (Overall) | 226 (39.5%) | 346 (60.5%) |
Employment Industries by Sex in Cave Junction
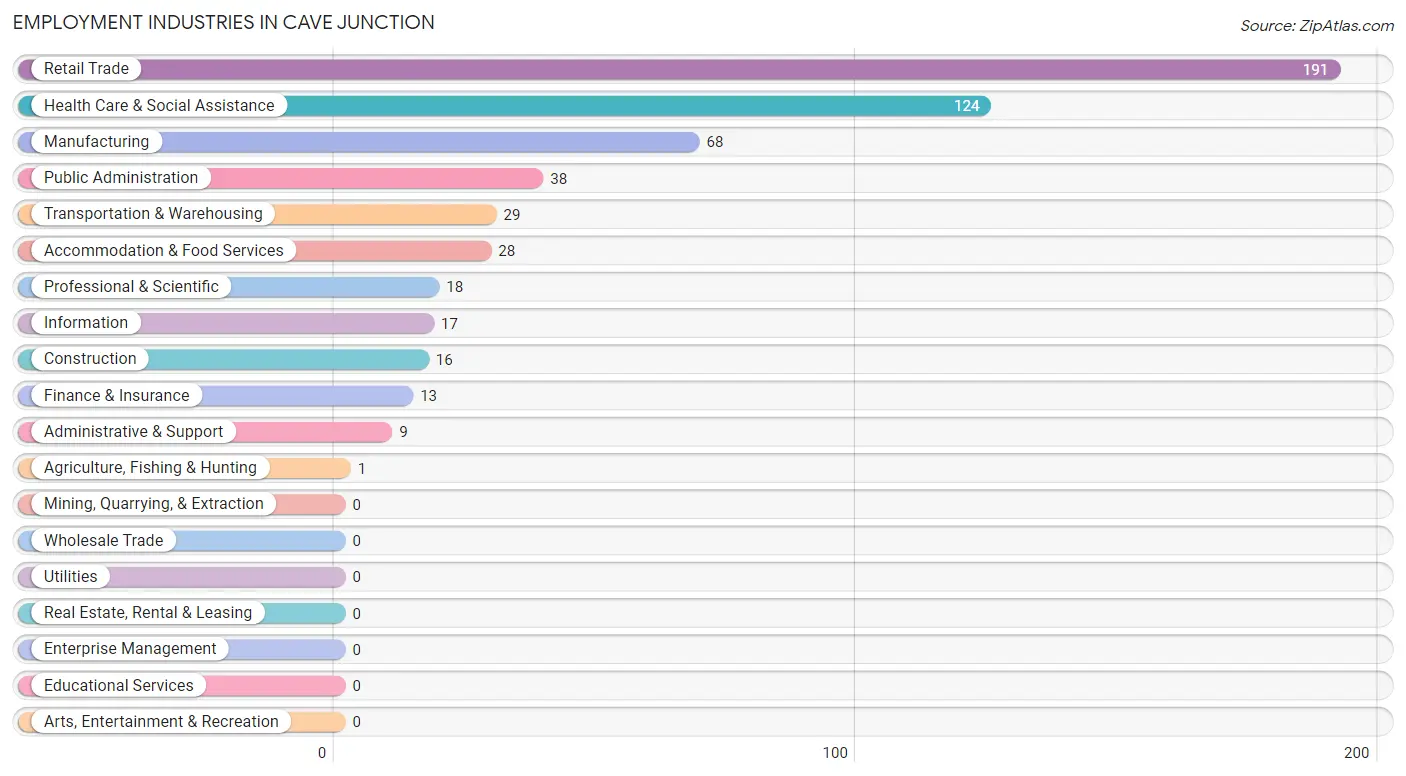
Employment Industries in Cave Junction
The major employment industries in Cave Junction include Retail Trade (191 | 33.4%), Health Care & Social Assistance (124 | 21.7%), Manufacturing (68 | 11.9%), Public Administration (38 | 6.6%), and Transportation & Warehousing (29 | 5.1%).
Employment Industries by Sex in Cave Junction
The Cave Junction industries that see more men than women are Administrative & Support (100.0%), Transportation & Warehousing (79.3%), and Accommodation & Food Services (78.6%), whereas the industries that tend to have a higher number of women are Agriculture, Fishing & Hunting (100.0%), Construction (100.0%), and Information (100.0%).
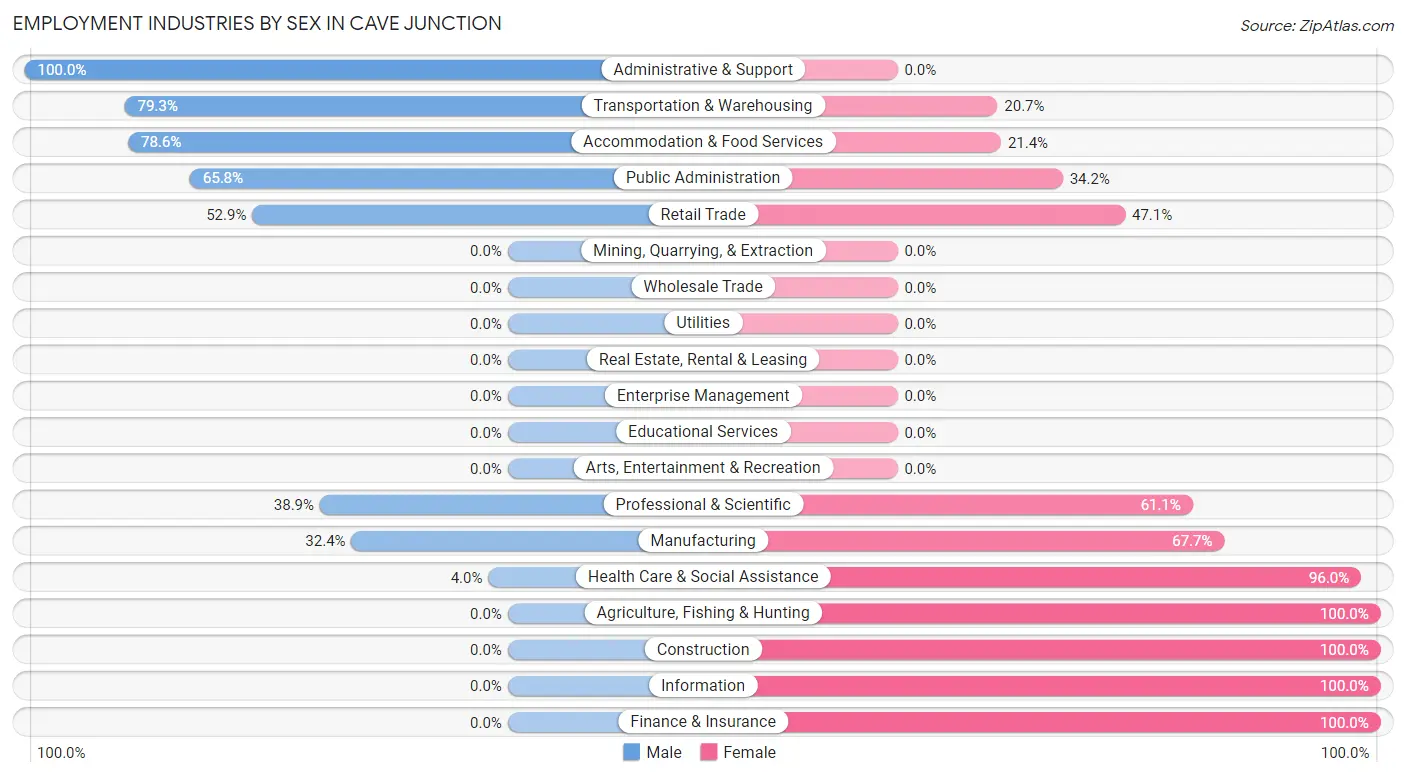
| Industry | Male | Female |
| Agriculture, Fishing & Hunting | 0 (0.0%) | 1 (100.0%) |
| Mining, Quarrying, & Extraction | 0 (0.0%) | 0 (0.0%) |
| Construction | 0 (0.0%) | 16 (100.0%) |
| Manufacturing | 22 (32.4%) | 46 (67.6%) |
| Wholesale Trade | 0 (0.0%) | 0 (0.0%) |
| Retail Trade | 101 (52.9%) | 90 (47.1%) |
| Transportation & Warehousing | 23 (79.3%) | 6 (20.7%) |
| Utilities | 0 (0.0%) | 0 (0.0%) |
| Information | 0 (0.0%) | 17 (100.0%) |
| Finance & Insurance | 0 (0.0%) | 13 (100.0%) |
| Real Estate, Rental & Leasing | 0 (0.0%) | 0 (0.0%) |
| Professional & Scientific | 7 (38.9%) | 11 (61.1%) |
| Enterprise Management | 0 (0.0%) | 0 (0.0%) |
| Administrative & Support | 9 (100.0%) | 0 (0.0%) |
| Educational Services | 0 (0.0%) | 0 (0.0%) |
| Health Care & Social Assistance | 5 (4.0%) | 119 (96.0%) |
| Arts, Entertainment & Recreation | 0 (0.0%) | 0 (0.0%) |
| Accommodation & Food Services | 22 (78.6%) | 6 (21.4%) |
| Public Administration | 25 (65.8%) | 13 (34.2%) |
| Total | 226 (39.5%) | 346 (60.5%) |
Education in Cave Junction
School Enrollment in Cave Junction
The most common levels of schooling among the 399 students in Cave Junction are elementary school (118 | 29.6%), high school (92 | 23.1%), and middle school (81 | 20.3%).
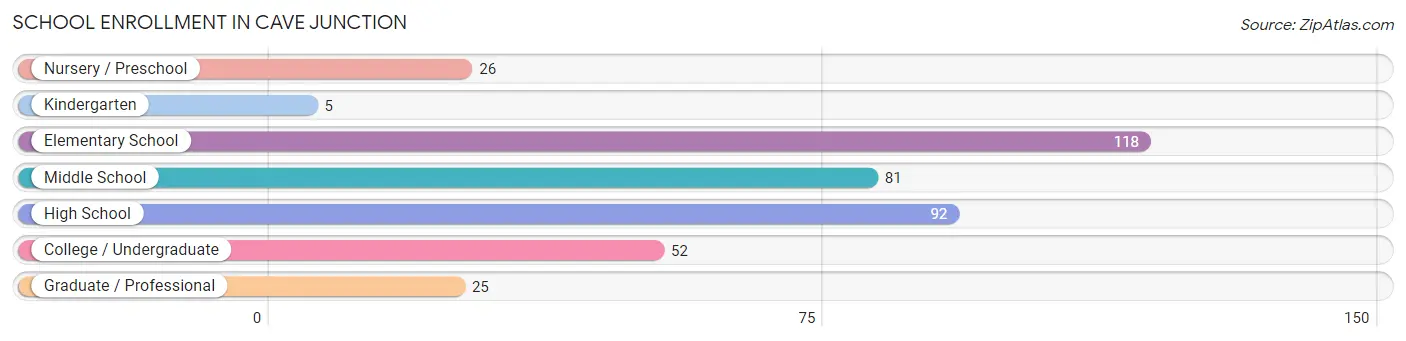
| School Level | # Students | % Students |
| Nursery / Preschool | 26 | 6.5% |
| Kindergarten | 5 | 1.3% |
| Elementary School | 118 | 29.6% |
| Middle School | 81 | 20.3% |
| High School | 92 | 23.1% |
| College / Undergraduate | 52 | 13.0% |
| Graduate / Professional | 25 | 6.3% |
| Total | 399 | 100.0% |
School Enrollment by Age by Funding Source in Cave Junction
Out of a total of 399 students who are enrolled in schools in Cave Junction, 1 (0.3%) attend a private institution, while the remaining 398 (99.7%) are enrolled in public schools. The age group of 18 to 19 year olds has the highest likelihood of being enrolled in private schools, with 1 (1.5% in the age bracket) enrolled. Conversely, the age group of 3 to 4 year olds has the lowest likelihood of being enrolled in a private school, with 18 (100.0% in the age bracket) attending a public institution.
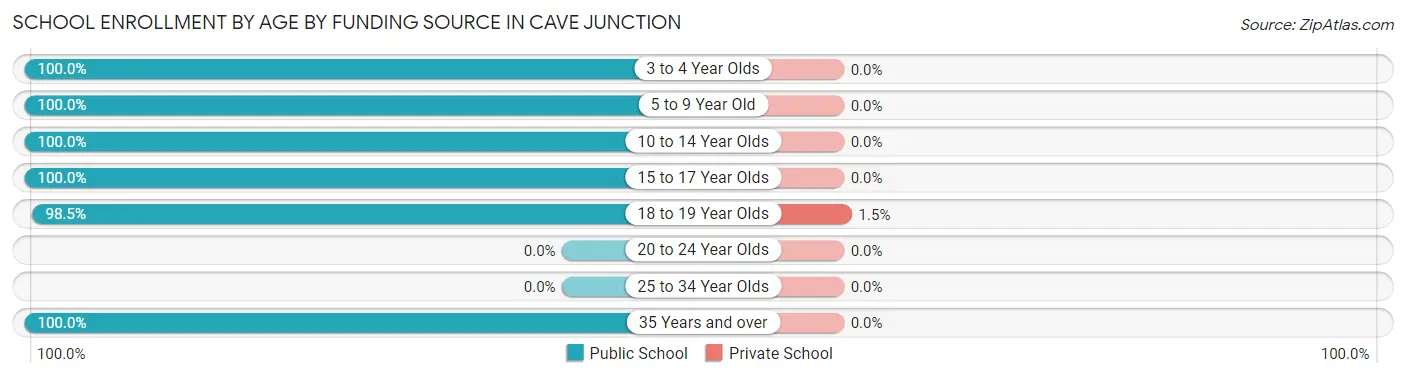
| Age Bracket | Public School | Private School |
| 3 to 4 Year Olds | 18 (100.0%) | 0 (0.0%) |
| 5 to 9 Year Old | 108 (100.0%) | 0 (0.0%) |
| 10 to 14 Year Olds | 103 (100.0%) | 0 (0.0%) |
| 15 to 17 Year Olds | 56 (100.0%) | 0 (0.0%) |
| 18 to 19 Year Olds | 66 (98.5%) | 1 (1.5%) |
| 20 to 24 Year Olds | 0 (0.0%) | 0 (0.0%) |
| 25 to 34 Year Olds | 0 (0.0%) | 0 (0.0%) |
| 35 Years and over | 47 (100.0%) | 0 (0.0%) |
| Total | 398 (99.7%) | 1 (0.3%) |
Educational Attainment by Field of Study in Cave Junction
Business (53 | 35.1%), psychology (26 | 17.2%), science & technology (23 | 15.2%), visual & performing arts (16 | 10.6%), and bio, nature & agricultural (11 | 7.3%) are the most common fields of study among 151 individuals in Cave Junction who have obtained a bachelor's degree or higher.
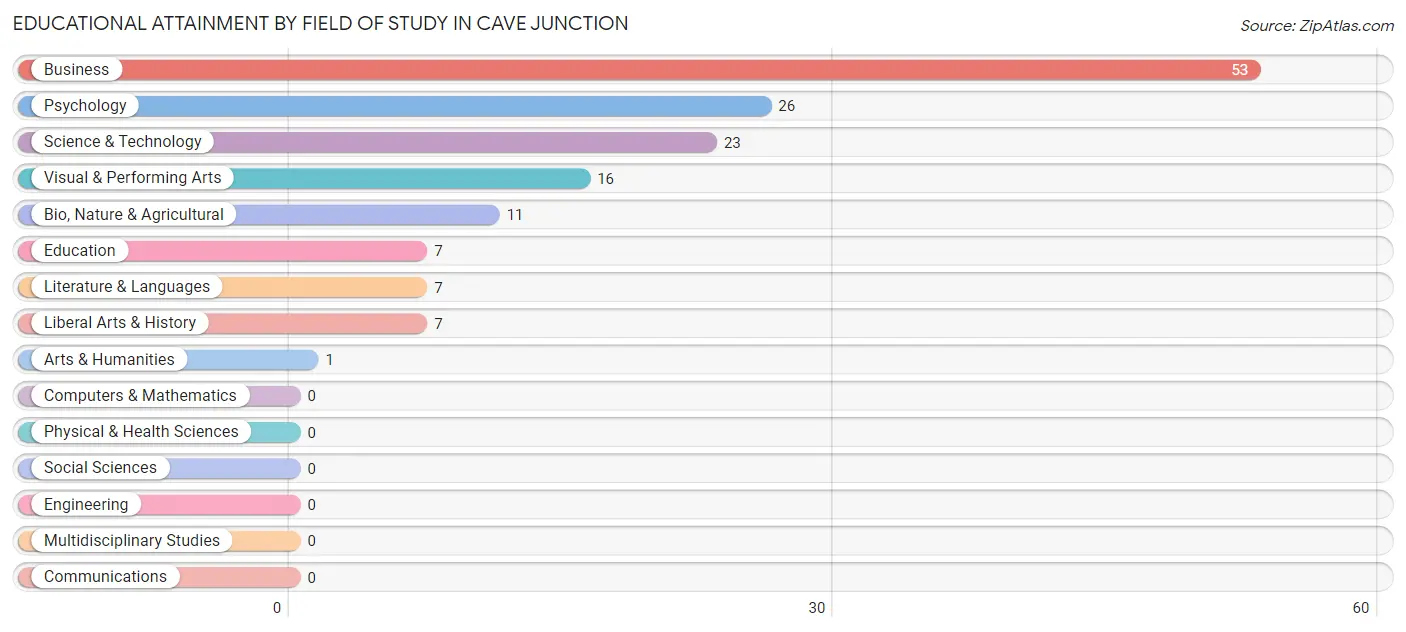
| Field of Study | # Graduates | % Graduates |
| Computers & Mathematics | 0 | 0.0% |
| Bio, Nature & Agricultural | 11 | 7.3% |
| Physical & Health Sciences | 0 | 0.0% |
| Psychology | 26 | 17.2% |
| Social Sciences | 0 | 0.0% |
| Engineering | 0 | 0.0% |
| Multidisciplinary Studies | 0 | 0.0% |
| Science & Technology | 23 | 15.2% |
| Business | 53 | 35.1% |
| Education | 7 | 4.6% |
| Literature & Languages | 7 | 4.6% |
| Liberal Arts & History | 7 | 4.6% |
| Visual & Performing Arts | 16 | 10.6% |
| Communications | 0 | 0.0% |
| Arts & Humanities | 1 | 0.7% |
| Total | 151 | 100.0% |
Transportation & Commute in Cave Junction
Vehicle Availability by Sex in Cave Junction
The most prevalent vehicle ownership categories in Cave Junction are males with 2 vehicles (87, accounting for 40.1%) and females with 2 vehicles (112, making up 25.2%).
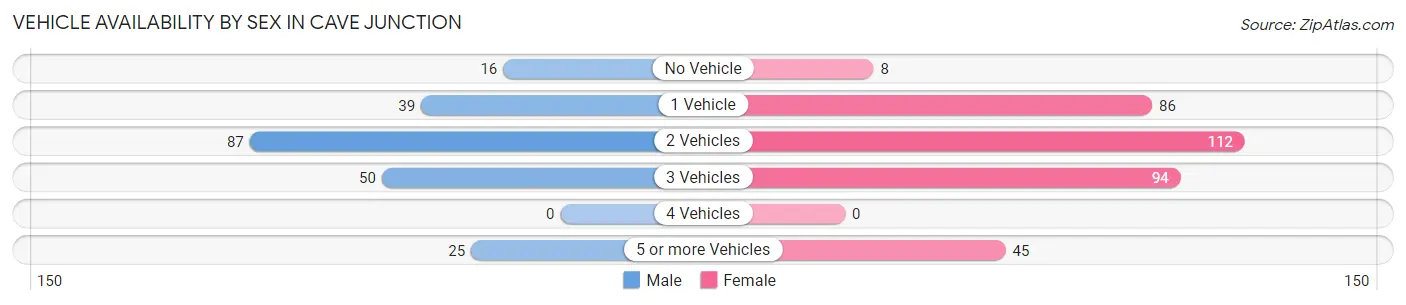
| Vehicles Available | Male | Female |
| No Vehicle | 16 (7.4%) | 8 (2.3%) |
| 1 Vehicle | 39 (18.0%) | 86 (24.9%) |
| 2 Vehicles | 87 (40.1%) | 112 (32.5%) |
| 3 Vehicles | 50 (23.0%) | 94 (27.3%) |
| 4 Vehicles | 0 (0.0%) | 0 (0.0%) |
| 5 or more Vehicles | 25 (11.5%) | 45 (13.0%) |
| Total | 217 (100.0%) | 345 (100.0%) |
Commute Time in Cave Junction
The most frequently occuring commute durations in Cave Junction are 45 to 59 minutes (115 commuters, 22.5%), 5 to 9 minutes (83 commuters, 16.2%), and 15 to 19 minutes (80 commuters, 15.6%).
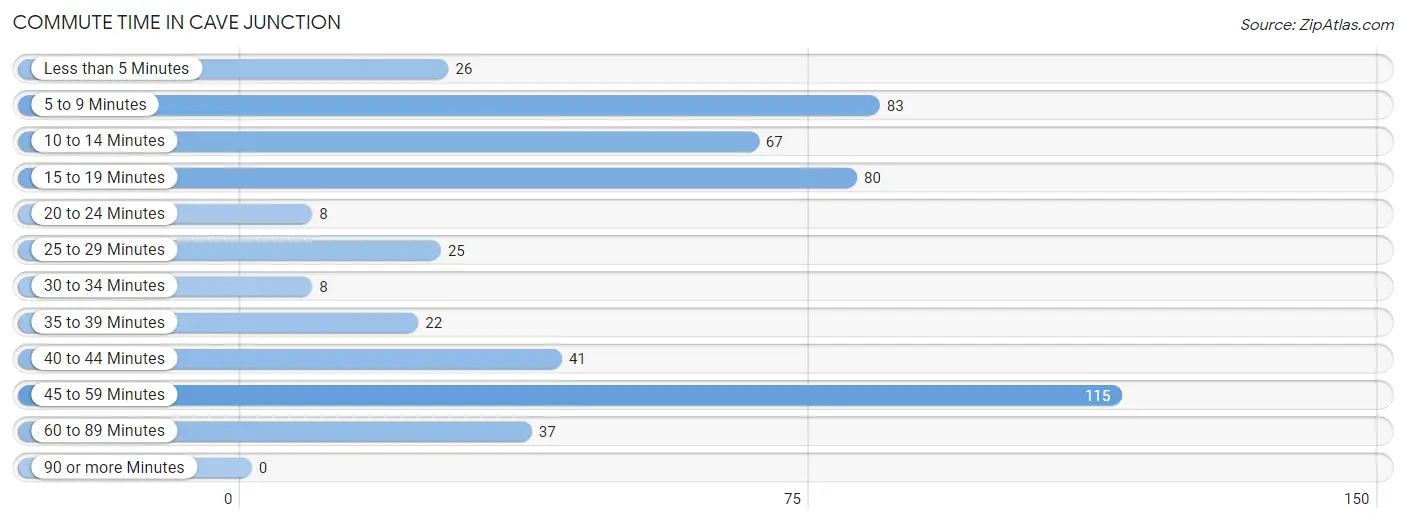
| Commute Time | # Commuters | % Commuters |
| Less than 5 Minutes | 26 | 5.1% |
| 5 to 9 Minutes | 83 | 16.2% |
| 10 to 14 Minutes | 67 | 13.1% |
| 15 to 19 Minutes | 80 | 15.6% |
| 20 to 24 Minutes | 8 | 1.6% |
| 25 to 29 Minutes | 25 | 4.9% |
| 30 to 34 Minutes | 8 | 1.6% |
| 35 to 39 Minutes | 22 | 4.3% |
| 40 to 44 Minutes | 41 | 8.0% |
| 45 to 59 Minutes | 115 | 22.5% |
| 60 to 89 Minutes | 37 | 7.2% |
| 90 or more Minutes | 0 | 0.0% |
Commute Time by Sex in Cave Junction
The most common commute times in Cave Junction are 10 to 14 minutes (48 commuters, 22.9%) for males and 45 to 59 minutes (87 commuters, 28.8%) for females.
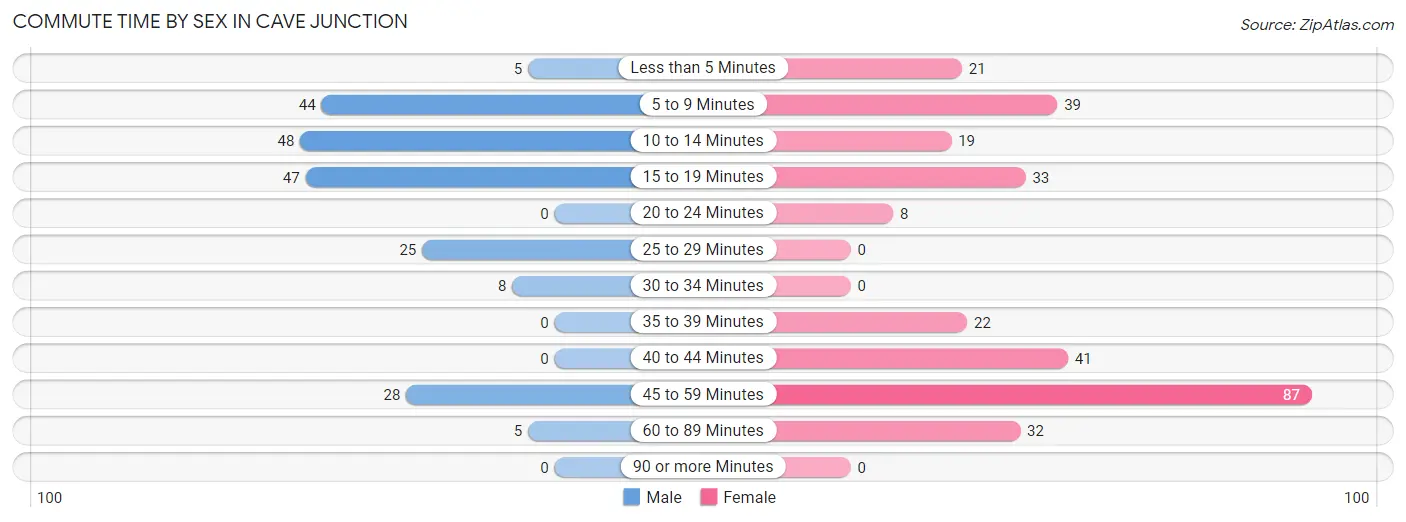
| Commute Time | Male | Female |
| Less than 5 Minutes | 5 (2.4%) | 21 (7.0%) |
| 5 to 9 Minutes | 44 (20.9%) | 39 (12.9%) |
| 10 to 14 Minutes | 48 (22.9%) | 19 (6.3%) |
| 15 to 19 Minutes | 47 (22.4%) | 33 (10.9%) |
| 20 to 24 Minutes | 0 (0.0%) | 8 (2.6%) |
| 25 to 29 Minutes | 25 (11.9%) | 0 (0.0%) |
| 30 to 34 Minutes | 8 (3.8%) | 0 (0.0%) |
| 35 to 39 Minutes | 0 (0.0%) | 22 (7.3%) |
| 40 to 44 Minutes | 0 (0.0%) | 41 (13.6%) |
| 45 to 59 Minutes | 28 (13.3%) | 87 (28.8%) |
| 60 to 89 Minutes | 5 (2.4%) | 32 (10.6%) |
| 90 or more Minutes | 0 (0.0%) | 0 (0.0%) |
Time of Departure to Work by Sex in Cave Junction
The most frequent times of departure to work in Cave Junction are 12:00 PM to 3:59 PM (58, 27.6%) for males and 4:00 PM to 11:59 PM (84, 27.8%) for females.
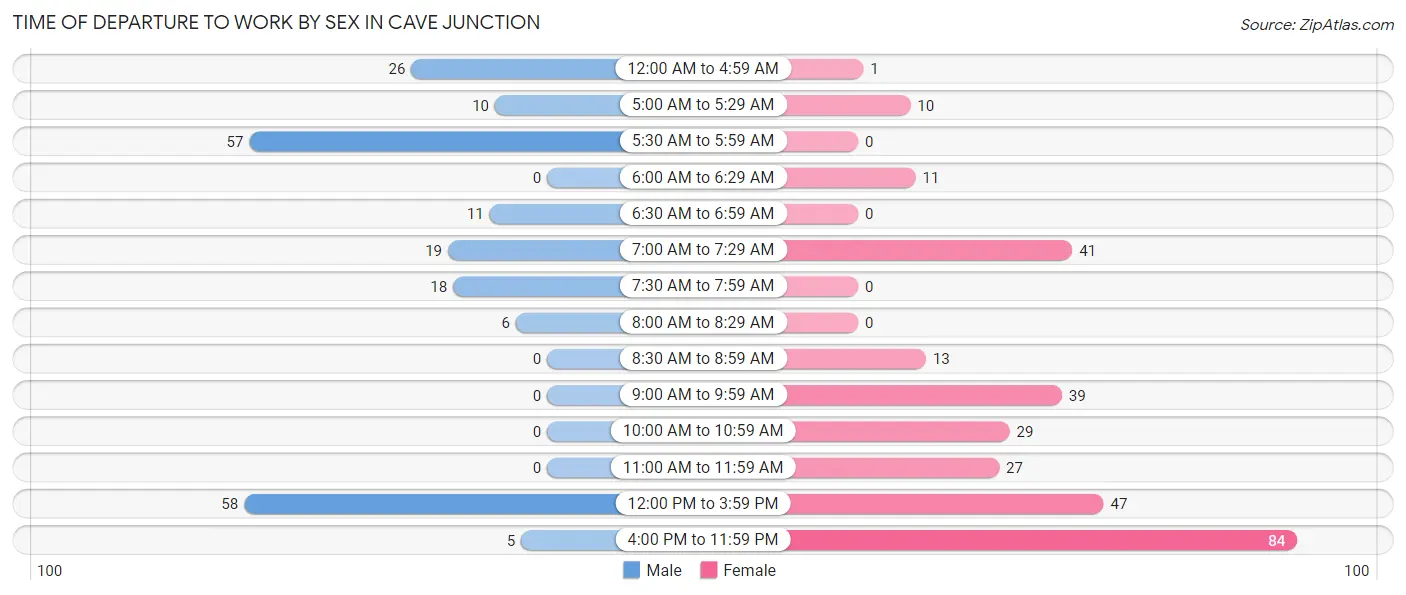
| Time of Departure | Male | Female |
| 12:00 AM to 4:59 AM | 26 (12.4%) | 1 (0.3%) |
| 5:00 AM to 5:29 AM | 10 (4.8%) | 10 (3.3%) |
| 5:30 AM to 5:59 AM | 57 (27.1%) | 0 (0.0%) |
| 6:00 AM to 6:29 AM | 0 (0.0%) | 11 (3.6%) |
| 6:30 AM to 6:59 AM | 11 (5.2%) | 0 (0.0%) |
| 7:00 AM to 7:29 AM | 19 (9.0%) | 41 (13.6%) |
| 7:30 AM to 7:59 AM | 18 (8.6%) | 0 (0.0%) |
| 8:00 AM to 8:29 AM | 6 (2.9%) | 0 (0.0%) |
| 8:30 AM to 8:59 AM | 0 (0.0%) | 13 (4.3%) |
| 9:00 AM to 9:59 AM | 0 (0.0%) | 39 (12.9%) |
| 10:00 AM to 10:59 AM | 0 (0.0%) | 29 (9.6%) |
| 11:00 AM to 11:59 AM | 0 (0.0%) | 27 (8.9%) |
| 12:00 PM to 3:59 PM | 58 (27.6%) | 47 (15.6%) |
| 4:00 PM to 11:59 PM | 5 (2.4%) | 84 (27.8%) |
| Total | 210 (100.0%) | 302 (100.0%) |
Housing Occupancy in Cave Junction
Occupancy by Ownership in Cave Junction
Of the total 859 dwellings in Cave Junction, owner-occupied units account for 625 (72.8%), while renter-occupied units make up 234 (27.2%).
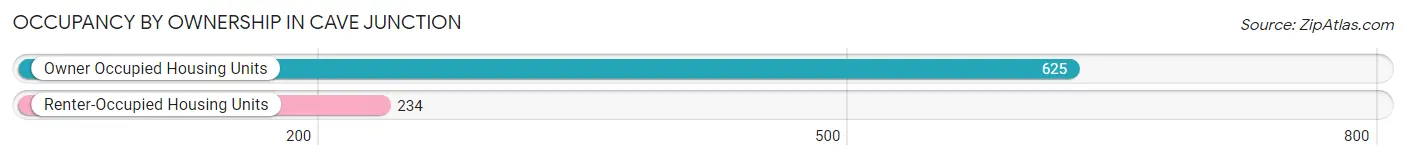
| Occupancy | # Housing Units | % Housing Units |
| Owner Occupied Housing Units | 625 | 72.8% |
| Renter-Occupied Housing Units | 234 | 27.2% |
| Total Occupied Housing Units | 859 | 100.0% |
Occupancy by Household Size in Cave Junction
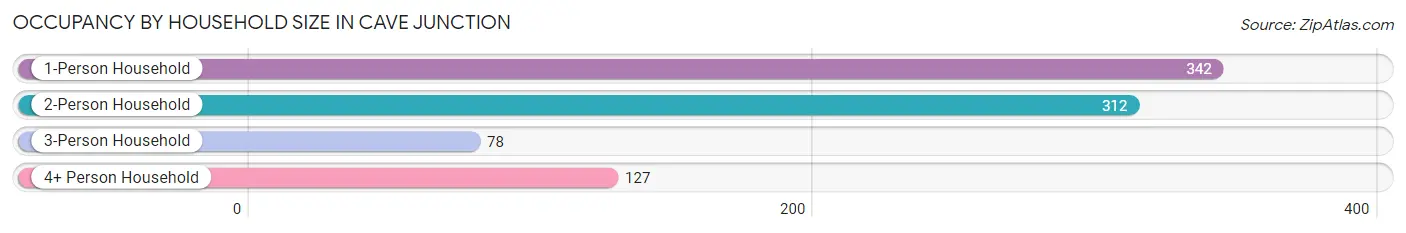
| Household Size | # Housing Units | % Housing Units |
| 1-Person Household | 342 | 39.8% |
| 2-Person Household | 312 | 36.3% |
| 3-Person Household | 78 | 9.1% |
| 4+ Person Household | 127 | 14.8% |
| Total Housing Units | 859 | 100.0% |
Occupancy by Ownership by Household Size in Cave Junction
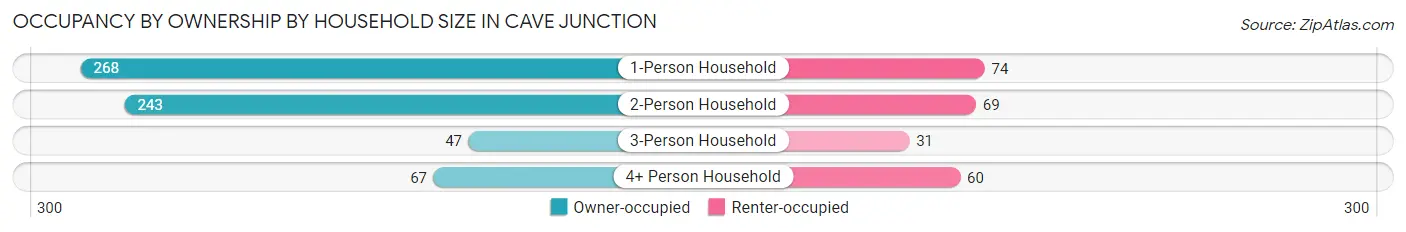
| Household Size | Owner-occupied | Renter-occupied |
| 1-Person Household | 268 (78.4%) | 74 (21.6%) |
| 2-Person Household | 243 (77.9%) | 69 (22.1%) |
| 3-Person Household | 47 (60.3%) | 31 (39.7%) |
| 4+ Person Household | 67 (52.8%) | 60 (47.2%) |
| Total Housing Units | 625 (72.8%) | 234 (27.2%) |
Occupancy by Educational Attainment in Cave Junction
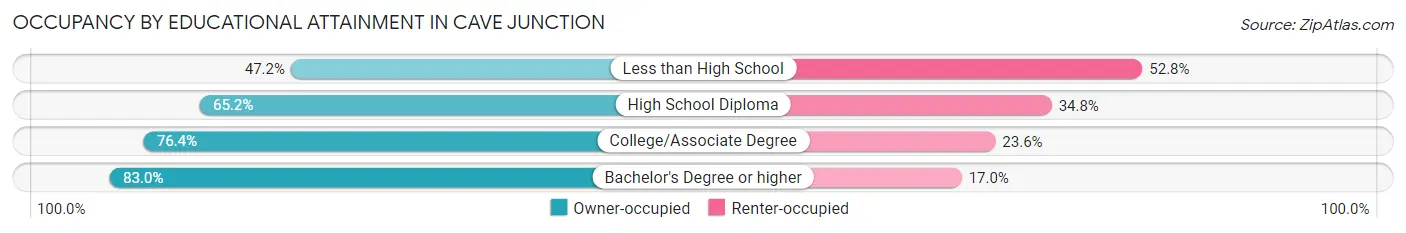
| Household Size | Owner-occupied | Renter-occupied |
| Less than High School | 17 (47.2%) | 19 (52.8%) |
| High School Diploma | 163 (65.2%) | 87 (34.8%) |
| College/Associate Degree | 352 (76.4%) | 109 (23.6%) |
| Bachelor's Degree or higher | 93 (83.0%) | 19 (17.0%) |
Occupancy by Age of Householder in Cave Junction
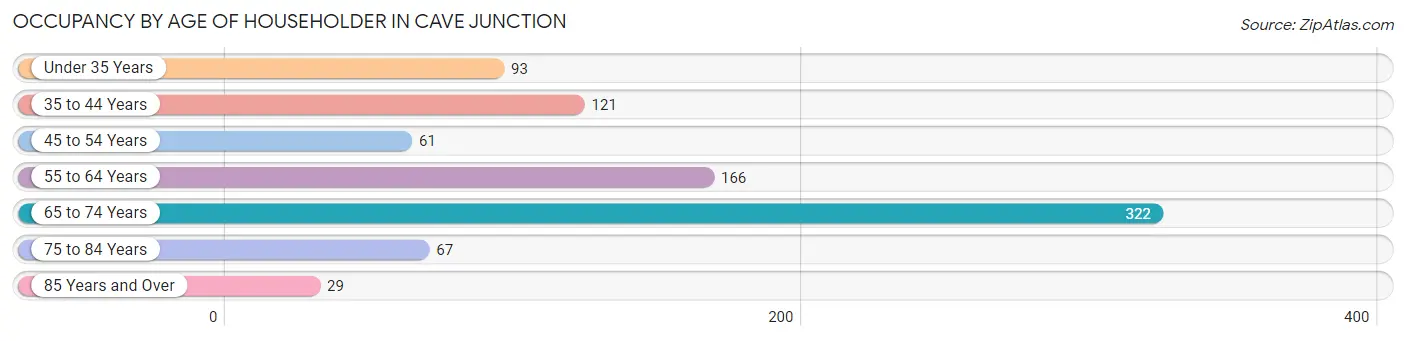
| Age Bracket | # Households | % Households |
| Under 35 Years | 93 | 10.8% |
| 35 to 44 Years | 121 | 14.1% |
| 45 to 54 Years | 61 | 7.1% |
| 55 to 64 Years | 166 | 19.3% |
| 65 to 74 Years | 322 | 37.5% |
| 75 to 84 Years | 67 | 7.8% |
| 85 Years and Over | 29 | 3.4% |
| Total | 859 | 100.0% |
Housing Finances in Cave Junction
Median Income by Occupancy in Cave Junction
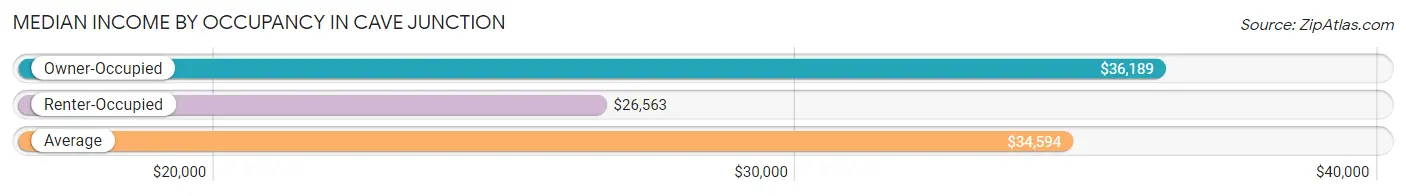
| Occupancy Type | # Households | Median Income |
| Owner-Occupied | 625 (72.8%) | $36,189 |
| Renter-Occupied | 234 (27.2%) | $26,563 |
| Average | 859 (100.0%) | $34,594 |
Occupancy by Householder Income Bracket in Cave Junction
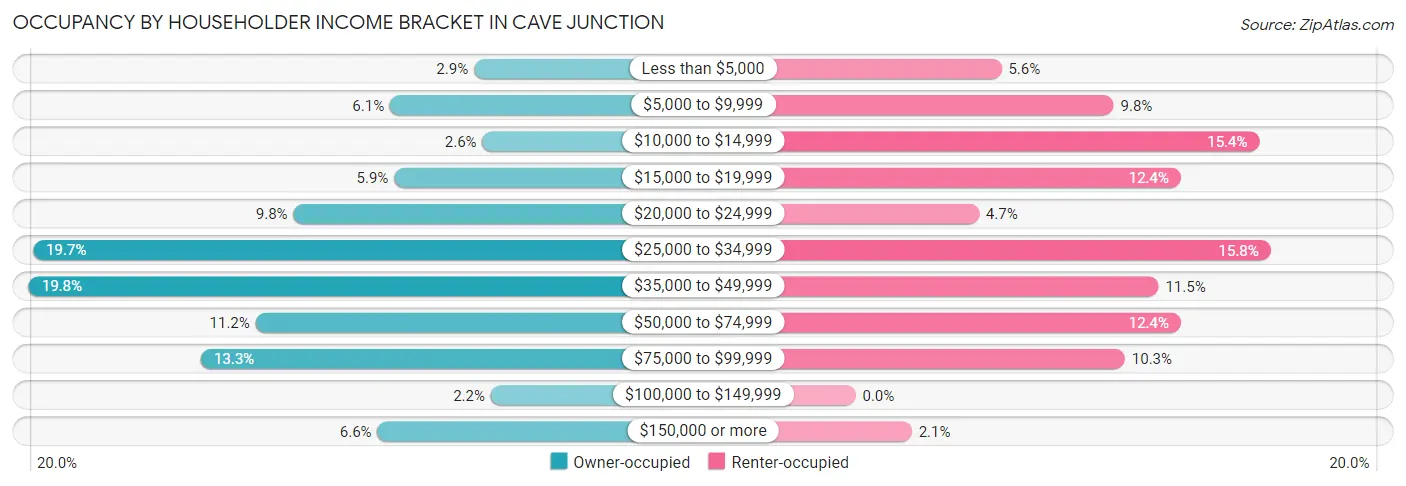
| Income Bracket | Owner-occupied | Renter-occupied |
| Less than $5,000 | 18 (2.9%) | 13 (5.6%) |
| $5,000 to $9,999 | 38 (6.1%) | 23 (9.8%) |
| $10,000 to $14,999 | 16 (2.6%) | 36 (15.4%) |
| $15,000 to $19,999 | 37 (5.9%) | 29 (12.4%) |
| $20,000 to $24,999 | 61 (9.8%) | 11 (4.7%) |
| $25,000 to $34,999 | 123 (19.7%) | 37 (15.8%) |
| $35,000 to $49,999 | 124 (19.8%) | 27 (11.5%) |
| $50,000 to $74,999 | 70 (11.2%) | 29 (12.4%) |
| $75,000 to $99,999 | 83 (13.3%) | 24 (10.3%) |
| $100,000 to $149,999 | 14 (2.2%) | 0 (0.0%) |
| $150,000 or more | 41 (6.6%) | 5 (2.1%) |
| Total | 625 (100.0%) | 234 (100.0%) |
Monthly Housing Cost Tiers in Cave Junction

| Monthly Cost | Owner-occupied | Renter-occupied |
| Less than $300 | 51 (8.2%) | 0 (0.0%) |
| $300 to $499 | 139 (22.2%) | 14 (6.0%) |
| $500 to $799 | 125 (20.0%) | 31 (13.3%) |
| $800 to $999 | 77 (12.3%) | 35 (15.0%) |
| $1,000 to $1,499 | 150 (24.0%) | 120 (51.3%) |
| $1,500 to $1,999 | 67 (10.7%) | 17 (7.3%) |
| $2,000 to $2,499 | 16 (2.6%) | 0 (0.0%) |
| $2,500 to $2,999 | 0 (0.0%) | 0 (0.0%) |
| $3,000 or more | 0 (0.0%) | 0 (0.0%) |
| Total | 625 (100.0%) | 234 (100.0%) |
Physical Housing Characteristics in Cave Junction
Housing Structures in Cave Junction
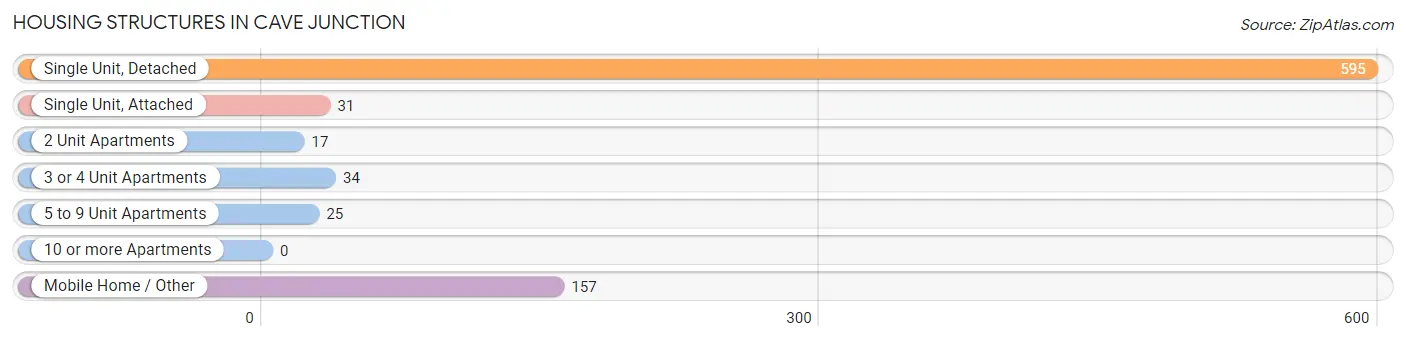
| Structure Type | # Housing Units | % Housing Units |
| Single Unit, Detached | 595 | 69.3% |
| Single Unit, Attached | 31 | 3.6% |
| 2 Unit Apartments | 17 | 2.0% |
| 3 or 4 Unit Apartments | 34 | 4.0% |
| 5 to 9 Unit Apartments | 25 | 2.9% |
| 10 or more Apartments | 0 | 0.0% |
| Mobile Home / Other | 157 | 18.3% |
| Total | 859 | 100.0% |
Housing Structures by Occupancy in Cave Junction
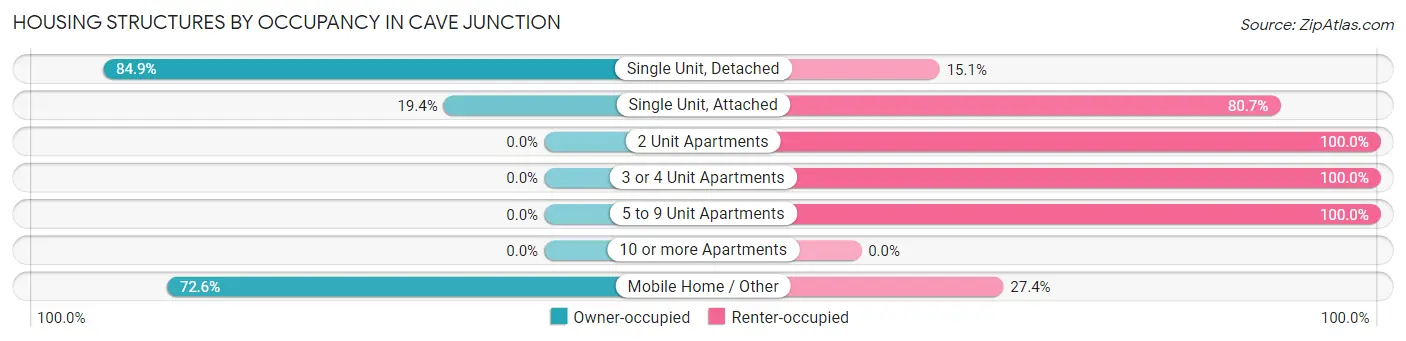
| Structure Type | Owner-occupied | Renter-occupied |
| Single Unit, Detached | 505 (84.9%) | 90 (15.1%) |
| Single Unit, Attached | 6 (19.4%) | 25 (80.6%) |
| 2 Unit Apartments | 0 (0.0%) | 17 (100.0%) |
| 3 or 4 Unit Apartments | 0 (0.0%) | 34 (100.0%) |
| 5 to 9 Unit Apartments | 0 (0.0%) | 25 (100.0%) |
| 10 or more Apartments | 0 (0.0%) | 0 (0.0%) |
| Mobile Home / Other | 114 (72.6%) | 43 (27.4%) |
| Total | 625 (72.8%) | 234 (27.2%) |
Housing Structures by Number of Rooms in Cave Junction
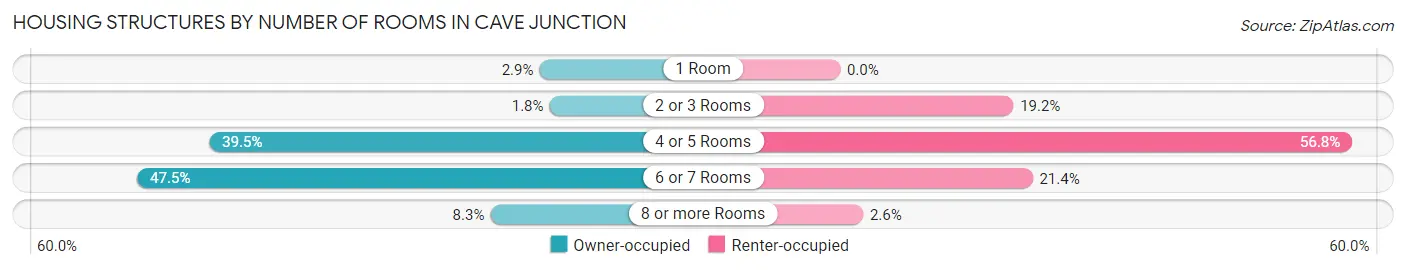
| Number of Rooms | Owner-occupied | Renter-occupied |
| 1 Room | 18 (2.9%) | 0 (0.0%) |
| 2 or 3 Rooms | 11 (1.8%) | 45 (19.2%) |
| 4 or 5 Rooms | 247 (39.5%) | 133 (56.8%) |
| 6 or 7 Rooms | 297 (47.5%) | 50 (21.4%) |
| 8 or more Rooms | 52 (8.3%) | 6 (2.6%) |
| Total | 625 (100.0%) | 234 (100.0%) |
Housing Structure by Heating Type in Cave Junction
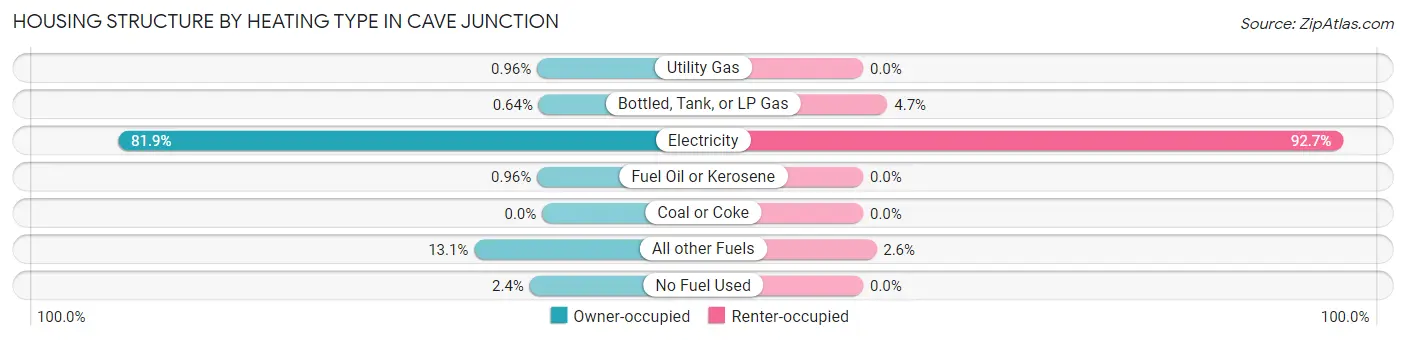
| Heating Type | Owner-occupied | Renter-occupied |
| Utility Gas | 6 (1.0%) | 0 (0.0%) |
| Bottled, Tank, or LP Gas | 4 (0.6%) | 11 (4.7%) |
| Electricity | 512 (81.9%) | 217 (92.7%) |
| Fuel Oil or Kerosene | 6 (1.0%) | 0 (0.0%) |
| Coal or Coke | 0 (0.0%) | 0 (0.0%) |
| All other Fuels | 82 (13.1%) | 6 (2.6%) |
| No Fuel Used | 15 (2.4%) | 0 (0.0%) |
| Total | 625 (100.0%) | 234 (100.0%) |
Household Vehicle Usage in Cave Junction
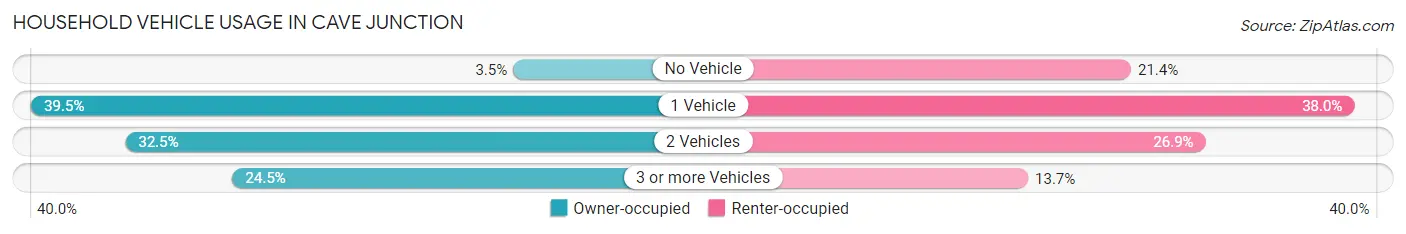
| Vehicles per Household | Owner-occupied | Renter-occupied |
| No Vehicle | 22 (3.5%) | 50 (21.4%) |
| 1 Vehicle | 247 (39.5%) | 89 (38.0%) |
| 2 Vehicles | 203 (32.5%) | 63 (26.9%) |
| 3 or more Vehicles | 153 (24.5%) | 32 (13.7%) |
| Total | 625 (100.0%) | 234 (100.0%) |
Real Estate & Mortgages in Cave Junction
Real Estate and Mortgage Overview in Cave Junction
| Characteristic | Without Mortgage | With Mortgage |
| Housing Units | 289 | 336 |
| Median Property Value | $245,400 | $272,800 |
| Median Household Income | $35,089 | $41 |
| Monthly Housing Costs | $456 | $0 |
| Real Estate Taxes | $1,430 | $0 |
Property Value by Mortgage Status in Cave Junction
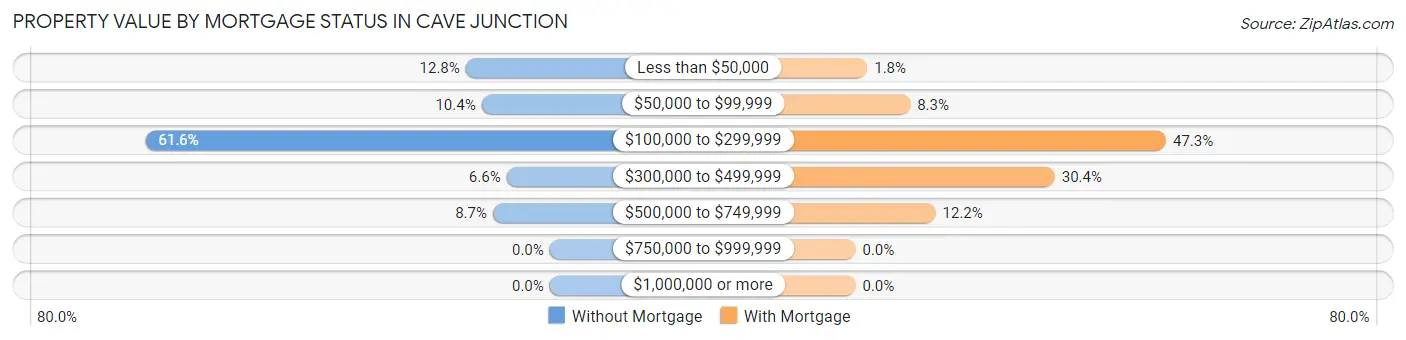
| Property Value | Without Mortgage | With Mortgage |
| Less than $50,000 | 37 (12.8%) | 6 (1.8%) |
| $50,000 to $99,999 | 30 (10.4%) | 28 (8.3%) |
| $100,000 to $299,999 | 178 (61.6%) | 159 (47.3%) |
| $300,000 to $499,999 | 19 (6.6%) | 102 (30.4%) |
| $500,000 to $749,999 | 25 (8.6%) | 41 (12.2%) |
| $750,000 to $999,999 | 0 (0.0%) | 0 (0.0%) |
| $1,000,000 or more | 0 (0.0%) | 0 (0.0%) |
| Total | 289 (100.0%) | 336 (100.0%) |
Household Income by Mortgage Status in Cave Junction
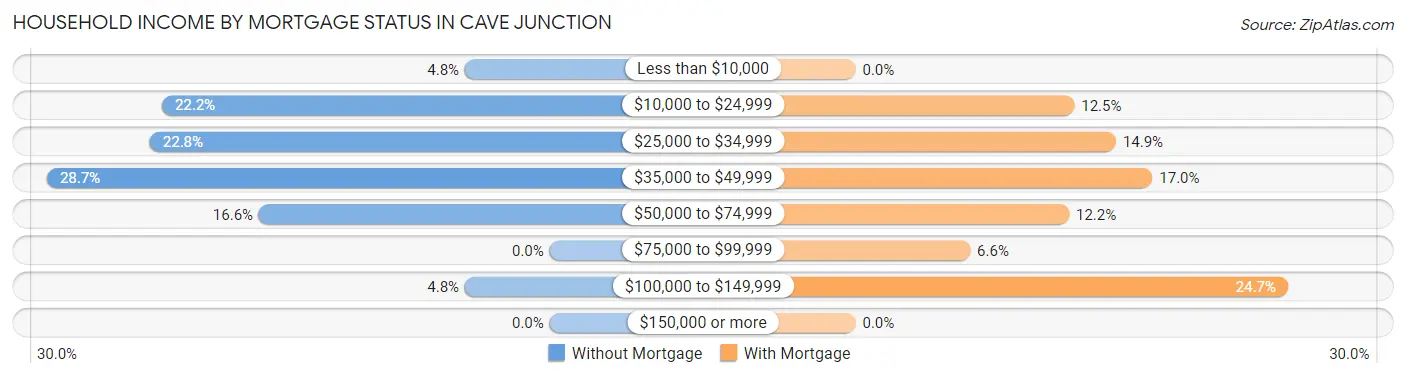
| Household Income | Without Mortgage | With Mortgage |
| Less than $10,000 | 14 (4.8%) | 0 (0.0%) |
| $10,000 to $24,999 | 64 (22.2%) | 42 (12.5%) |
| $25,000 to $34,999 | 66 (22.8%) | 50 (14.9%) |
| $35,000 to $49,999 | 83 (28.7%) | 57 (17.0%) |
| $50,000 to $74,999 | 48 (16.6%) | 41 (12.2%) |
| $75,000 to $99,999 | 0 (0.0%) | 22 (6.6%) |
| $100,000 to $149,999 | 14 (4.8%) | 83 (24.7%) |
| $150,000 or more | 0 (0.0%) | 0 (0.0%) |
| Total | 289 (100.0%) | 336 (100.0%) |
Property Value to Household Income Ratio in Cave Junction
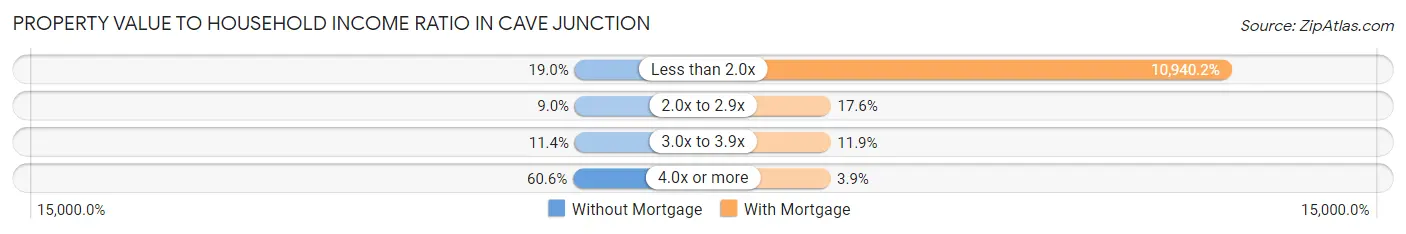
| Value-to-Income Ratio | Without Mortgage | With Mortgage |
| Less than 2.0x | 55 (19.0%) | 36,759 (10,940.2%) |
| 2.0x to 2.9x | 26 (9.0%) | 59 (17.6%) |
| 3.0x to 3.9x | 33 (11.4%) | 40 (11.9%) |
| 4.0x or more | 175 (60.6%) | 13 (3.9%) |
| Total | 289 (100.0%) | 336 (100.0%) |
Real Estate Taxes by Mortgage Status in Cave Junction
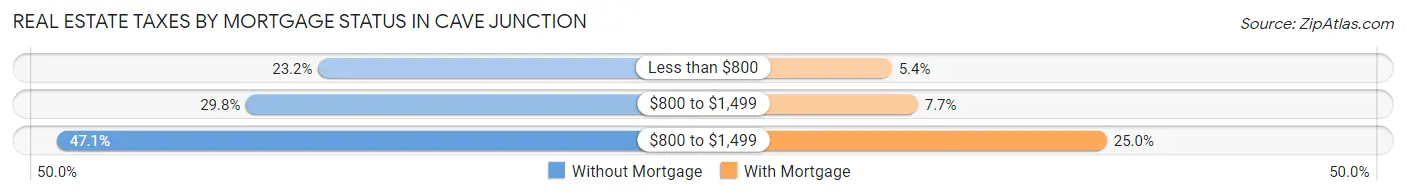
| Property Taxes | Without Mortgage | With Mortgage |
| Less than $800 | 67 (23.2%) | 18 (5.4%) |
| $800 to $1,499 | 86 (29.8%) | 26 (7.7%) |
| $800 to $1,499 | 136 (47.1%) | 84 (25.0%) |
| Total | 289 (100.0%) | 336 (100.0%) |
Health & Disability in Cave Junction
Health Insurance Coverage by Age in Cave Junction
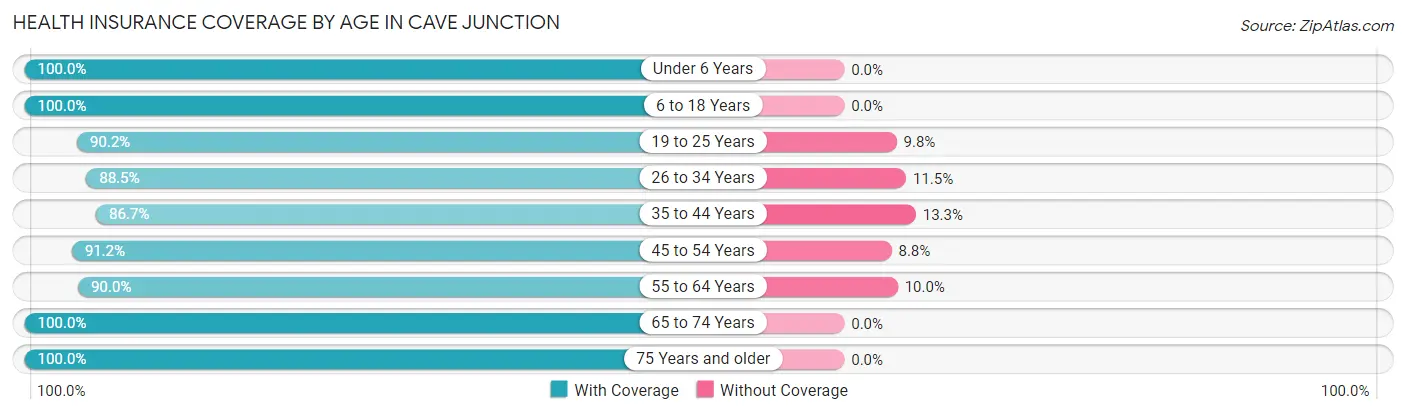
| Age Bracket | With Coverage | Without Coverage |
| Under 6 Years | 125 (100.0%) | 0 (0.0%) |
| 6 to 18 Years | 316 (100.0%) | 0 (0.0%) |
| 19 to 25 Years | 111 (90.2%) | 12 (9.8%) |
| 26 to 34 Years | 169 (88.5%) | 22 (11.5%) |
| 35 to 44 Years | 169 (86.7%) | 26 (13.3%) |
| 45 to 54 Years | 145 (91.2%) | 14 (8.8%) |
| 55 to 64 Years | 226 (90.0%) | 25 (10.0%) |
| 65 to 74 Years | 385 (100.0%) | 0 (0.0%) |
| 75 Years and older | 165 (100.0%) | 0 (0.0%) |
| Total | 1,811 (94.8%) | 99 (5.2%) |
Health Insurance Coverage by Citizenship Status in Cave Junction
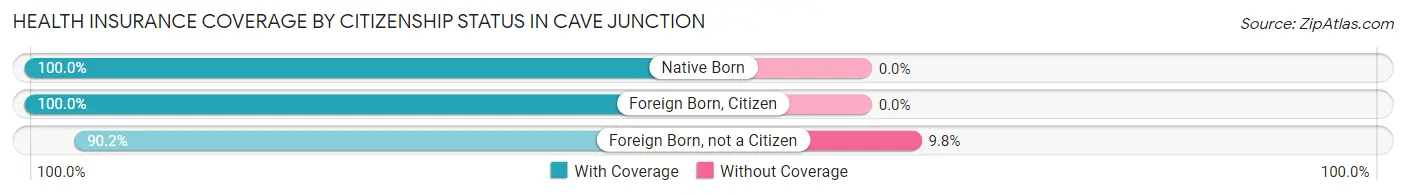
| Citizenship Status | With Coverage | Without Coverage |
| Native Born | 125 (100.0%) | 0 (0.0%) |
| Foreign Born, Citizen | 316 (100.0%) | 0 (0.0%) |
| Foreign Born, not a Citizen | 111 (90.2%) | 12 (9.8%) |
Health Insurance Coverage by Household Income in Cave Junction
| Household Income | With Coverage | Without Coverage |
| Under $25,000 | 512 (100.0%) | 0 (0.0%) |
| $25,000 to $49,999 | 726 (95.0%) | 38 (5.0%) |
| $50,000 to $74,999 | 229 (95.0%) | 12 (5.0%) |
| $75,000 to $99,999 | 204 (80.9%) | 48 (19.1%) |
| $100,000 and over | 133 (100.0%) | 0 (0.0%) |
Public vs Private Health Insurance Coverage by Age in Cave Junction
| Age Bracket | Public Insurance | Private Insurance |
| Under 6 | 125 (100.0%) | 0 (0.0%) |
| 6 to 18 Years | 303 (95.9%) | 13 (4.1%) |
| 19 to 25 Years | 41 (33.3%) | 70 (56.9%) |
| 25 to 34 Years | 123 (64.4%) | 80 (41.9%) |
| 35 to 44 Years | 93 (47.7%) | 81 (41.5%) |
| 45 to 54 Years | 106 (66.7%) | 49 (30.8%) |
| 55 to 64 Years | 109 (43.4%) | 147 (58.6%) |
| 65 to 74 Years | 385 (100.0%) | 204 (53.0%) |
| 75 Years and over | 165 (100.0%) | 136 (82.4%) |
| Total | 1,450 (75.9%) | 780 (40.8%) |
Disability Status by Sex by Age in Cave Junction
| Age Bracket | Male | Female |
| Under 5 Years | 0 (0.0%) | 0 (0.0%) |
| 5 to 17 Years | 17 (13.3%) | 20 (13.8%) |
| 18 to 34 Years | 22 (13.6%) | 21 (10.1%) |
| 35 to 64 Years | 123 (43.3%) | 63 (19.6%) |
| 65 to 74 Years | 25 (21.2%) | 78 (29.2%) |
| 75 Years and over | 48 (62.3%) | 47 (53.4%) |
Disability Class by Sex by Age in Cave Junction
Disability Class: Hearing Difficulty
| Age Bracket | Male | Female |
| Under 5 Years | 0 (0.0%) | 0 (0.0%) |
| 5 to 17 Years | 7 (5.5%) | 0 (0.0%) |
| 18 to 34 Years | 0 (0.0%) | 13 (6.2%) |
| 35 to 64 Years | 0 (0.0%) | 5 (1.6%) |
| 65 to 74 Years | 19 (16.1%) | 6 (2.2%) |
| 75 Years and over | 32 (41.6%) | 31 (35.2%) |
Disability Class: Vision Difficulty
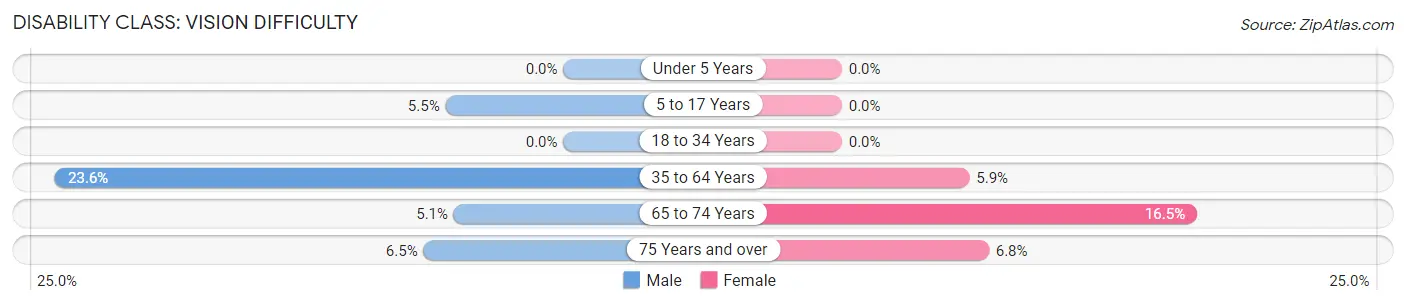
| Age Bracket | Male | Female |
| Under 5 Years | 0 (0.0%) | 0 (0.0%) |
| 5 to 17 Years | 7 (5.5%) | 0 (0.0%) |
| 18 to 34 Years | 0 (0.0%) | 0 (0.0%) |
| 35 to 64 Years | 67 (23.6%) | 19 (5.9%) |
| 65 to 74 Years | 6 (5.1%) | 44 (16.5%) |
| 75 Years and over | 5 (6.5%) | 6 (6.8%) |
Disability Class: Cognitive Difficulty
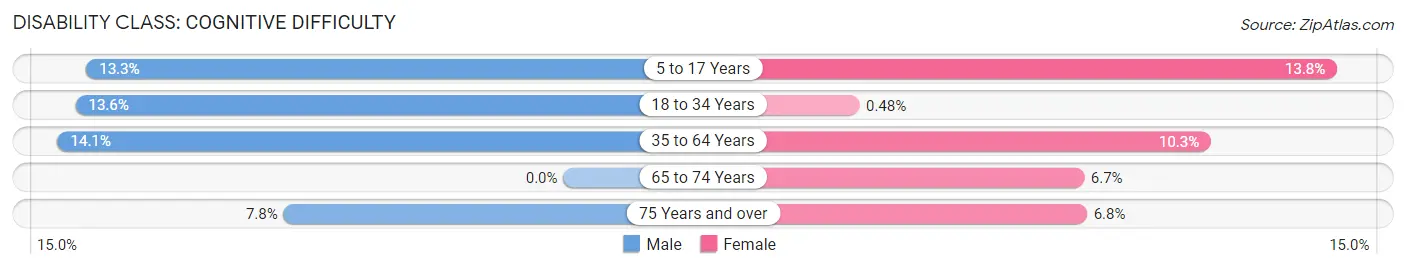
| Age Bracket | Male | Female |
| 5 to 17 Years | 17 (13.3%) | 20 (13.8%) |
| 18 to 34 Years | 22 (13.6%) | 1 (0.5%) |
| 35 to 64 Years | 40 (14.1%) | 33 (10.3%) |
| 65 to 74 Years | 0 (0.0%) | 18 (6.7%) |
| 75 Years and over | 6 (7.8%) | 6 (6.8%) |
Disability Class: Ambulatory Difficulty
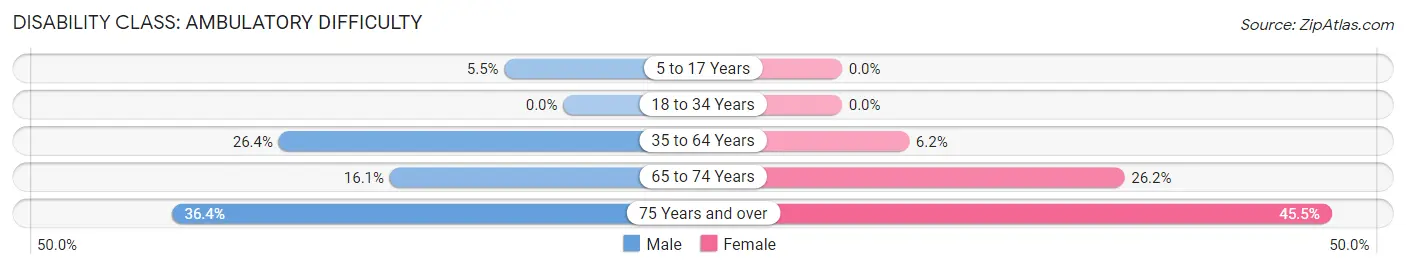
| Age Bracket | Male | Female |
| 5 to 17 Years | 7 (5.5%) | 0 (0.0%) |
| 18 to 34 Years | 0 (0.0%) | 0 (0.0%) |
| 35 to 64 Years | 75 (26.4%) | 20 (6.2%) |
| 65 to 74 Years | 19 (16.1%) | 70 (26.2%) |
| 75 Years and over | 28 (36.4%) | 40 (45.5%) |
Disability Class: Self-Care Difficulty
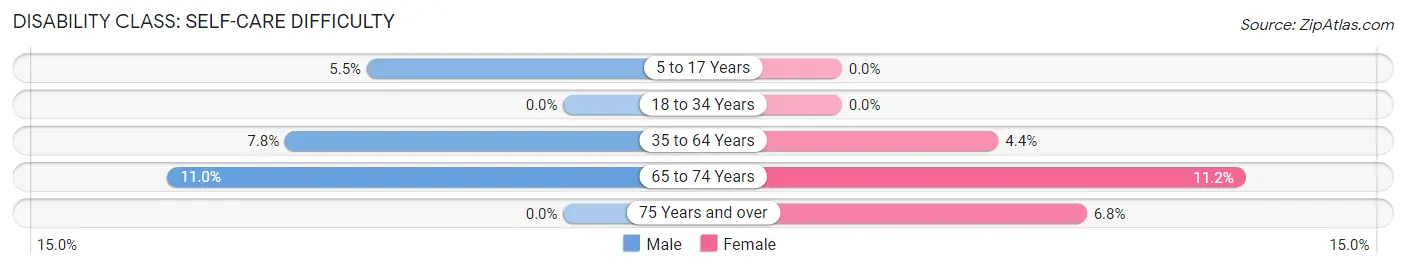
| Age Bracket | Male | Female |
| 5 to 17 Years | 7 (5.5%) | 0 (0.0%) |
| 18 to 34 Years | 0 (0.0%) | 0 (0.0%) |
| 35 to 64 Years | 22 (7.7%) | 14 (4.4%) |
| 65 to 74 Years | 13 (11.0%) | 30 (11.2%) |
| 75 Years and over | 0 (0.0%) | 6 (6.8%) |
Technology Access in Cave Junction
Computing Device Access in Cave Junction
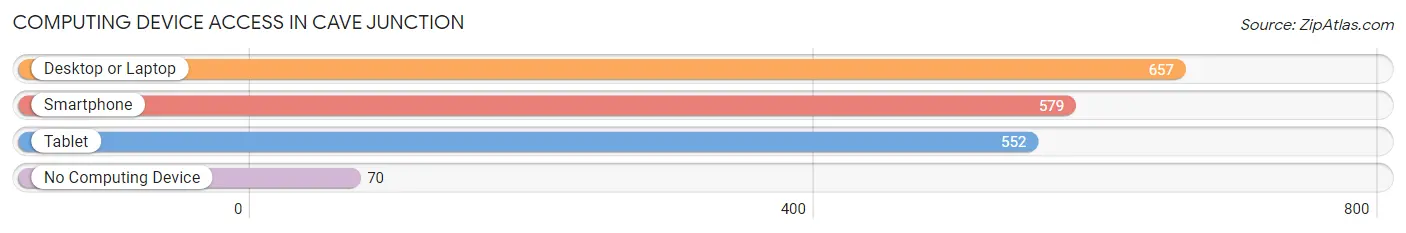
| Device Type | # Households | % Households |
| Desktop or Laptop | 657 | 76.5% |
| Smartphone | 579 | 67.4% |
| Tablet | 552 | 64.3% |
| No Computing Device | 70 | 8.2% |
| Total | 859 | 100.0% |
Internet Access in Cave Junction
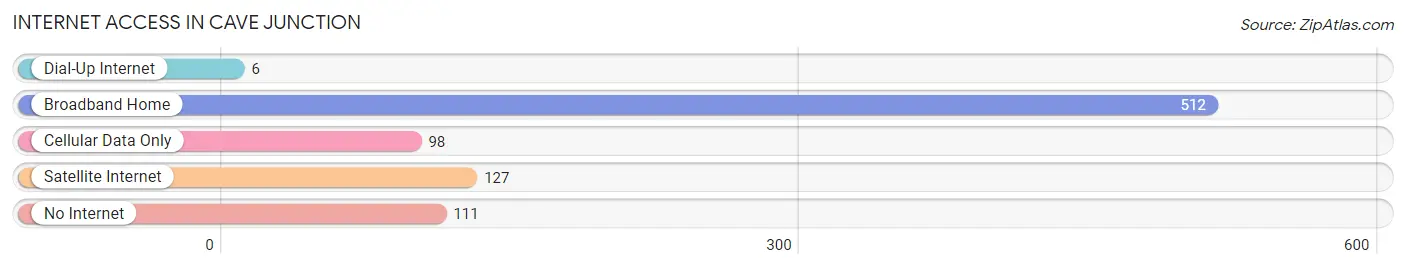
| Internet Type | # Households | % Households |
| Dial-Up Internet | 6 | 0.7% |
| Broadband Home | 512 | 59.6% |
| Cellular Data Only | 98 | 11.4% |
| Satellite Internet | 127 | 14.8% |
| No Internet | 111 | 12.9% |
| Total | 859 | 100.0% |
Cave Junction Summary
Cave Junction is a small city located in Josephine County, Oregon, United States. It is situated in the Illinois Valley, near the Oregon-California border. The city is known for its proximity to the Oregon Caves National Monument and the nearby Siskiyou National Forest. As of the 2010 census, the city had a population of 1,883.
History
The area around Cave Junction has been inhabited by Native Americans for thousands of years. The first European settlers arrived in the area in the late 1840s, and the first post office was established in 1887. The city was officially incorporated in 1948.
Cave Junction was named for the nearby Oregon Caves National Monument, which was discovered in 1874. The monument is a popular tourist destination, and the city has become a popular base for exploring the surrounding area.
Geography
Cave Junction is located in the Illinois Valley, near the Oregon-California border. It is situated at an elevation of 1,845 feet (562 m). The city is surrounded by the Siskiyou National Forest and is located near the Oregon Caves National Monument.
The climate in Cave Junction is mild and temperate, with warm summers and cool winters. The average annual temperature is 54°F (12°C). The average annual precipitation is 33 inches (84 cm).
Economy
The economy of Cave Junction is largely based on tourism. The city is a popular base for exploring the nearby Oregon Caves National Monument and the Siskiyou National Forest. The city also has a number of small businesses, including restaurants, shops, and lodging.
Demographics
As of the 2010 census, the population of Cave Junction was 1,883. The racial makeup of the city was 92.3% White, 0.3% African American, 1.2% Native American, 0.7% Asian, 0.1% Pacific Islander, 2.2% from other races, and 3.3% from two or more races. Hispanic or Latino of any race were 5.2% of the population.
The median household income in Cave Junction was $35,938, and the median family income was $41,250. The per capita income was $17,945. About 15.3% of the population was below the poverty line.
Common Questions
What is Per Capita Income in Cave Junction?
Per Capita income in Cave Junction is $21,408.
What is the Median Family Income in Cave Junction?
Median Family Income in Cave Junction is $44,926.
What is the Median Household income in Cave Junction?
Median Household Income in Cave Junction is $34,594.
What is Income or Wage Gap in Cave Junction?
Income or Wage Gap in Cave Junction is 8.0%.
Women in Cave Junction earn 92.0 cents for every dollar earned by a man.
What is Inequality or Gini Index in Cave Junction?
Inequality or Gini Index in Cave Junction is 0.45.
What is the Total Population of Cave Junction?
Total Population of Cave Junction is 1,910.
What is the Total Male Population of Cave Junction?
Total Male Population of Cave Junction is 851.
What is the Total Female Population of Cave Junction?
Total Female Population of Cave Junction is 1,059.
What is the Ratio of Males per 100 Females in Cave Junction?
There are 80.36 Males per 100 Females in Cave Junction.
What is the Ratio of Females per 100 Males in Cave Junction?
There are 124.44 Females per 100 Males in Cave Junction.
What is the Median Population Age in Cave Junction?
Median Population Age in Cave Junction is 45.2 Years.
What is the Average Family Size in Cave Junction
Average Family Size in Cave Junction is 3.0 People.
What is the Average Household Size in Cave Junction
Average Household Size in Cave Junction is 2.2 People.
How Large is the Labor Force in Cave Junction?
There are 638 People in the Labor Forcein in Cave Junction.
What is the Percentage of People in the Labor Force in Cave Junction?
41.1% of People are in the Labor Force in Cave Junction.
What is the Unemployment Rate in Cave Junction?
Unemployment Rate in Cave Junction is 10.3%.