Newport, OR Map & Demographics
Newport Map
Newport Overview
$33,541
PER CAPITA INCOME
$78,505
AVG FAMILY INCOME
$57,511
AVG HOUSEHOLD INCOME
9.1%
WAGE / INCOME GAP [ % ]
90.9¢/ $1
WAGE / INCOME GAP [ $ ]
$11,268
FAMILY INCOME DEFICIT
0.47
INEQUALITY / GINI INDEX
10,319
TOTAL POPULATION
4,963
MALE POPULATION
5,356
FEMALE POPULATION
92.66
MALES / 100 FEMALES
107.92
FEMALES / 100 MALES
47.9
MEDIAN AGE
2.9
AVG FAMILY SIZE
2.2
AVG HOUSEHOLD SIZE
4,530
LABOR FORCE [ PEOPLE ]
51.4%
PERCENT IN LABOR FORCE
6.8%
UNEMPLOYMENT RATE
Newport Zip Codes
Newport Area Codes
Income in Newport
Income Overview in Newport
Per Capita Income in Newport is $33,541, while median incomes of families and households are $78,505 and $57,511 respectively.
| Characteristic | Number | Measure |
| Per Capita Income | 10,319 | $33,541 |
| Median Family Income | 2,435 | $78,505 |
| Mean Family Income | 2,435 | $99,327 |
| Median Household Income | 4,551 | $57,511 |
| Mean Household Income | 4,551 | $78,806 |
| Income Deficit | 2,435 | $11,268 |
| Wage / Income Gap (%) | 10,319 | 9.12% |
| Wage / Income Gap ($) | 10,319 | 90.88¢ per $1 |
| Gini / Inequality Index | 10,319 | 0.47 |
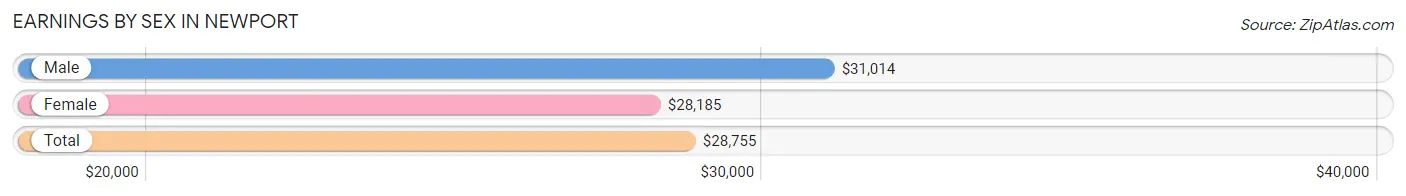
Earnings by Sex in Newport
Average Earnings in Newport are $28,755, $31,014 for men and $28,185 for women, a difference of 9.1%.
| Sex | Number | Average Earnings |
| Male | 2,411 (48.7%) | $31,014 |
| Female | 2,541 (51.3%) | $28,185 |
| Total | 4,952 (100.0%) | $28,755 |
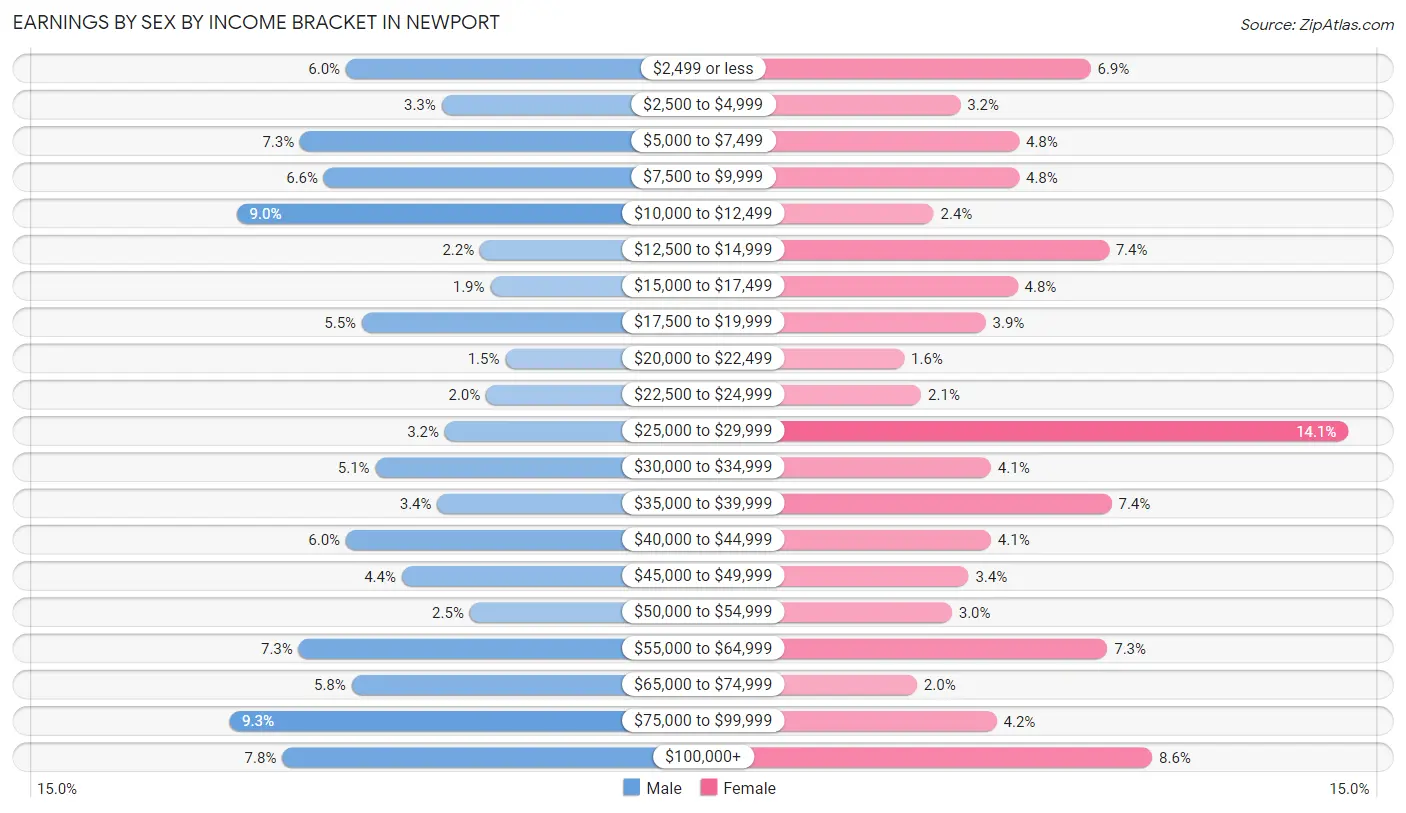
Earnings by Sex by Income Bracket in Newport
The most common earnings brackets in Newport are $75,000 to $99,999 for men (223 | 9.2%) and $25,000 to $29,999 for women (358 | 14.1%).
| Income | Male | Female |
| $2,499 or less | 144 (6.0%) | 174 (6.9%) |
| $2,500 to $4,999 | 79 (3.3%) | 81 (3.2%) |
| $5,000 to $7,499 | 175 (7.3%) | 123 (4.8%) |
| $7,500 to $9,999 | 159 (6.6%) | 123 (4.8%) |
| $10,000 to $12,499 | 218 (9.0%) | 62 (2.4%) |
| $12,500 to $14,999 | 53 (2.2%) | 187 (7.4%) |
| $15,000 to $17,499 | 46 (1.9%) | 122 (4.8%) |
| $17,500 to $19,999 | 133 (5.5%) | 99 (3.9%) |
| $20,000 to $22,499 | 36 (1.5%) | 41 (1.6%) |
| $22,500 to $24,999 | 49 (2.0%) | 53 (2.1%) |
| $25,000 to $29,999 | 77 (3.2%) | 358 (14.1%) |
| $30,000 to $34,999 | 124 (5.1%) | 103 (4.1%) |
| $35,000 to $39,999 | 82 (3.4%) | 189 (7.4%) |
| $40,000 to $44,999 | 144 (6.0%) | 103 (4.1%) |
| $45,000 to $49,999 | 106 (4.4%) | 87 (3.4%) |
| $50,000 to $54,999 | 60 (2.5%) | 75 (2.9%) |
| $55,000 to $64,999 | 176 (7.3%) | 186 (7.3%) |
| $65,000 to $74,999 | 140 (5.8%) | 50 (2.0%) |
| $75,000 to $99,999 | 223 (9.2%) | 107 (4.2%) |
| $100,000+ | 187 (7.8%) | 218 (8.6%) |
| Total | 2,411 (100.0%) | 2,541 (100.0%) |
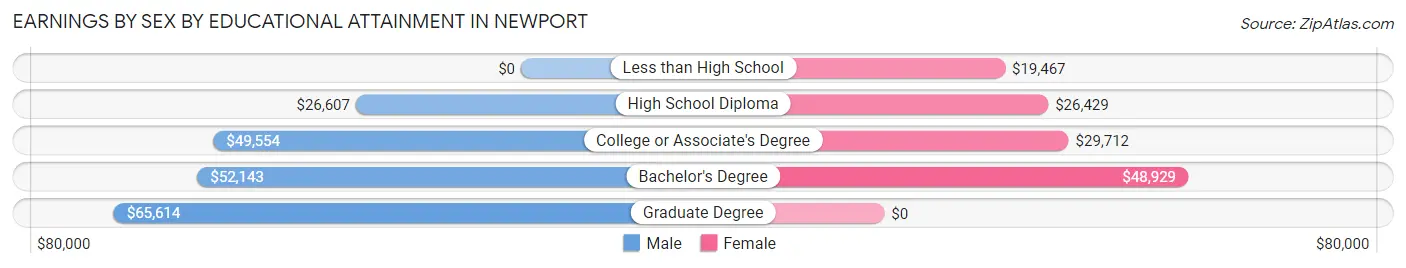
Earnings by Sex by Educational Attainment in Newport
Average earnings in Newport are $41,262 for men and $30,708 for women, a difference of 25.6%. Men with an educational attainment of graduate degree enjoy the highest average annual earnings of $65,614, while those with high school diploma education earn the least with $26,607. Women with an educational attainment of bachelor's degree earn the most with the average annual earnings of $48,929, while those with less than high school education have the smallest earnings of $19,467.
| Educational Attainment | Male Income | Female Income |
| Less than High School | - | - |
| High School Diploma | $26,607 | $26,429 |
| College or Associate's Degree | $49,554 | $29,712 |
| Bachelor's Degree | $52,143 | $48,929 |
| Graduate Degree | $65,614 | $0 |
| Total | $41,262 | $30,708 |
Family Income in Newport
Family Income Brackets in Newport
According to the Newport family income data, there are 633 families falling into the $100,000 to $149,999 income range, which is the most common income bracket and makes up 26.0% of all families. Conversely, the $15,000 to $24,999 income bracket is the least frequent group with only 54 families (2.2%) belonging to this category.
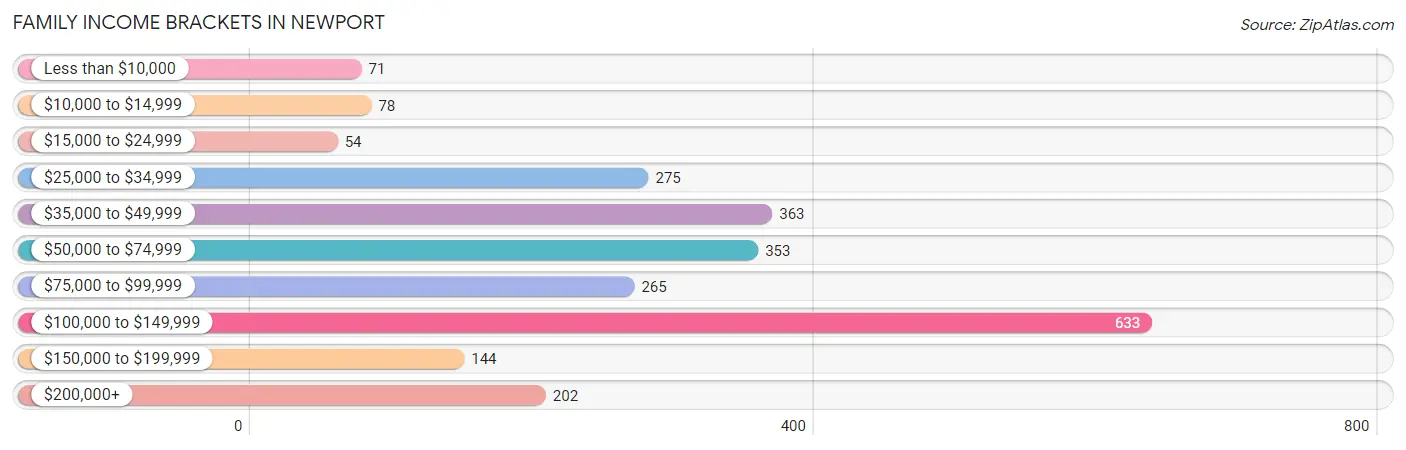
| Income Bracket | # Families | % Families |
| Less than $10,000 | 71 | 2.9% |
| $10,000 to $14,999 | 78 | 3.2% |
| $15,000 to $24,999 | 54 | 2.2% |
| $25,000 to $34,999 | 275 | 11.3% |
| $35,000 to $49,999 | 363 | 14.9% |
| $50,000 to $74,999 | 353 | 14.5% |
| $75,000 to $99,999 | 265 | 10.9% |
| $100,000 to $149,999 | 633 | 26.0% |
| $150,000 to $199,999 | 144 | 5.9% |
| $200,000+ | 202 | 8.3% |
Family Income by Famaliy Size in Newport
5-person families (90 | 3.7%) account for the highest median family income in Newport with $103,750 per family, while 3-person families (515 | 21.1%) have the highest median income of $33,449 per family member.
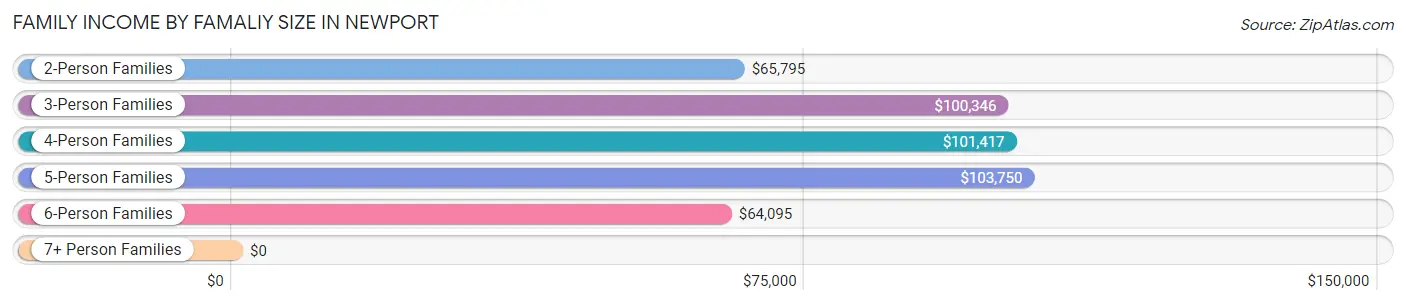
| Income Bracket | # Families | Median Income |
| 2-Person Families | 1,362 (55.9%) | $65,795 |
| 3-Person Families | 515 (21.1%) | $100,346 |
| 4-Person Families | 375 (15.4%) | $101,417 |
| 5-Person Families | 90 (3.7%) | $103,750 |
| 6-Person Families | 91 (3.7%) | $64,095 |
| 7+ Person Families | 2 (0.1%) | $0 |
| Total | 2,435 (100.0%) | $78,505 |
Family Income by Number of Earners in Newport
The median family income in Newport is $78,505, with families comprising 3+ earners (212) having the highest median family income of $127,500, while families with no earners (618) have the lowest median family income of $45,500, accounting for 8.7% and 25.4% of families, respectively.
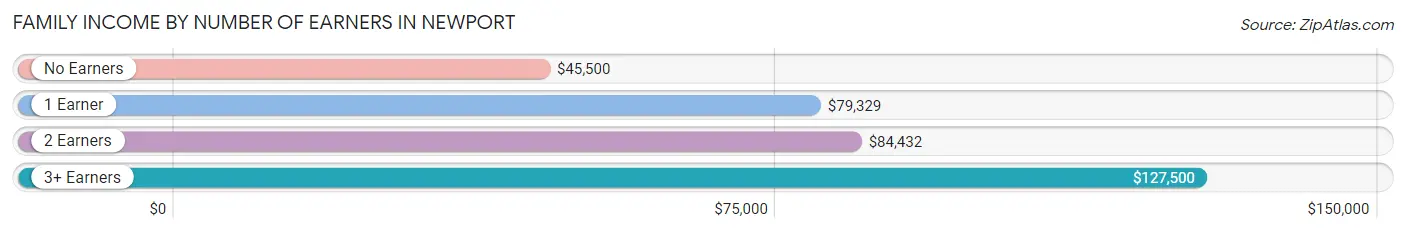
| Number of Earners | # Families | Median Income |
| No Earners | 618 (25.4%) | $45,500 |
| 1 Earner | 782 (32.1%) | $79,329 |
| 2 Earners | 823 (33.8%) | $84,432 |
| 3+ Earners | 212 (8.7%) | $127,500 |
| Total | 2,435 (100.0%) | $78,505 |
Household Income in Newport
Household Income Brackets in Newport
With 806 households falling in the category, the $35,000 to $49,999 income range is the most frequent in Newport, accounting for 17.7% of all households. In contrast, only 223 households (4.9%) fall into the $200,000+ income bracket, making it the least populous group.
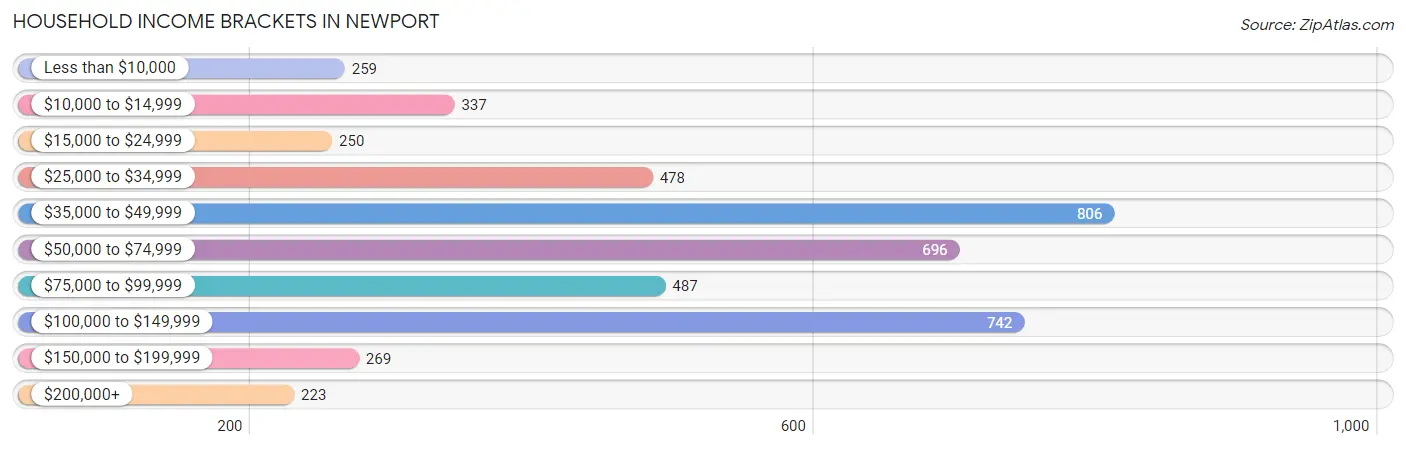
| Income Bracket | # Households | % Households |
| Less than $10,000 | 259 | 5.7% |
| $10,000 to $14,999 | 337 | 7.4% |
| $15,000 to $24,999 | 250 | 5.5% |
| $25,000 to $34,999 | 478 | 10.5% |
| $35,000 to $49,999 | 806 | 17.7% |
| $50,000 to $74,999 | 696 | 15.3% |
| $75,000 to $99,999 | 487 | 10.7% |
| $100,000 to $149,999 | 742 | 16.3% |
| $150,000 to $199,999 | 269 | 5.9% |
| $200,000+ | 223 | 4.9% |
Household Income by Householder Age in Newport
The median household income in Newport is $57,511, with the highest median household income of $70,102 found in the 25 to 44 years age bracket for the primary householder. A total of 1,143 households (25.1%) fall into this category. Meanwhile, the 15 to 24 years age bracket for the primary householder has the lowest median household income of $0, with 125 households (2.8%) in this group.
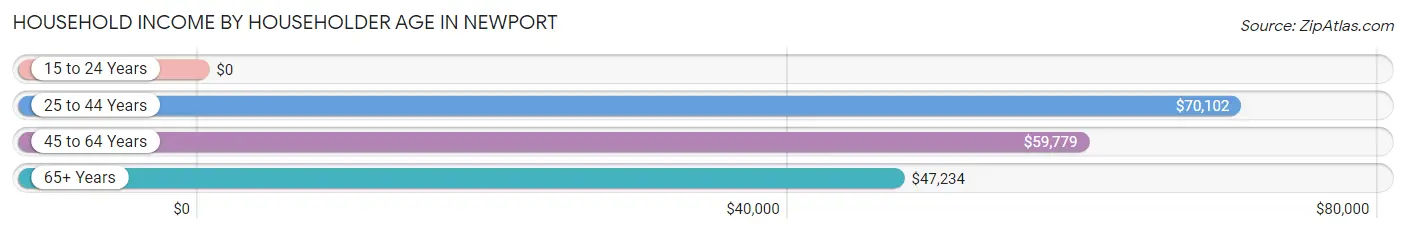
| Income Bracket | # Households | Median Income |
| 15 to 24 Years | 125 (2.8%) | $0 |
| 25 to 44 Years | 1,143 (25.1%) | $70,102 |
| 45 to 64 Years | 1,448 (31.8%) | $59,779 |
| 65+ Years | 1,835 (40.3%) | $47,234 |
| Total | 4,551 (100.0%) | $57,511 |
Poverty in Newport
Income Below Poverty by Sex and Age in Newport
With 16.5% poverty level for males and 14.6% for females among the residents of Newport, 18 to 24 year old males and 5 year old females are the most vulnerable to poverty, with 207 males (40.5%) and 27 females (69.2%) in their respective age groups living below the poverty level.
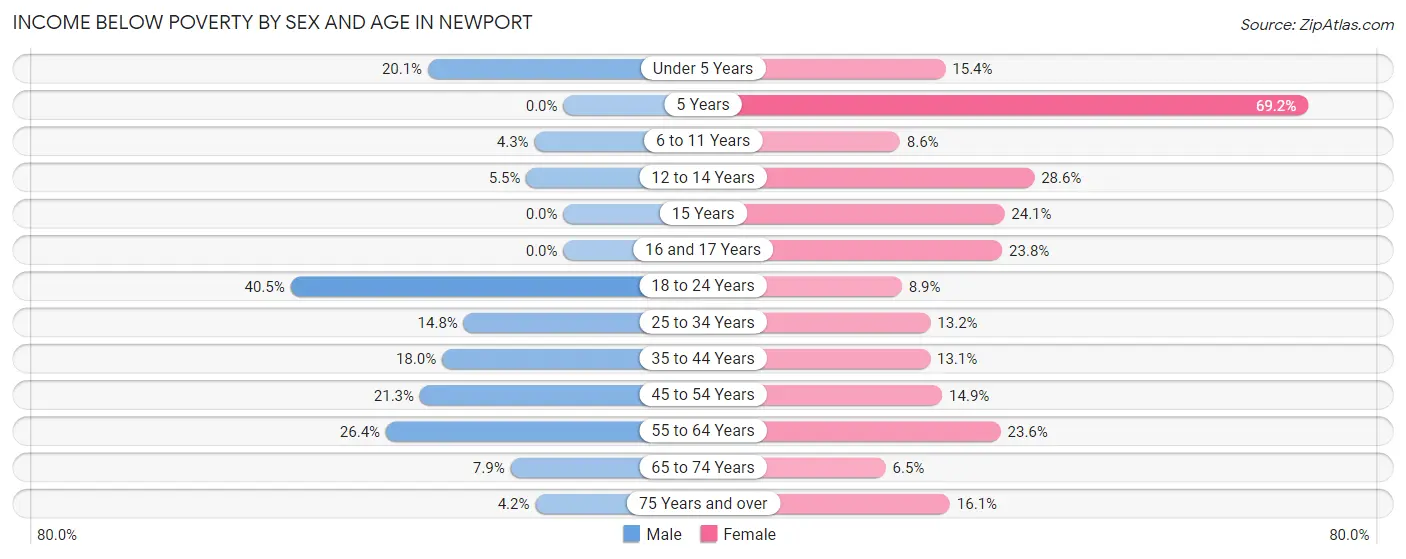
| Age Bracket | Male | Female |
| Under 5 Years | 38 (20.1%) | 32 (15.4%) |
| 5 Years | 0 (0.0%) | 27 (69.2%) |
| 6 to 11 Years | 16 (4.3%) | 20 (8.6%) |
| 12 to 14 Years | 9 (5.5%) | 38 (28.6%) |
| 15 Years | 0 (0.0%) | 7 (24.1%) |
| 16 and 17 Years | 0 (0.0%) | 30 (23.8%) |
| 18 to 24 Years | 207 (40.5%) | 36 (8.9%) |
| 25 to 34 Years | 58 (14.8%) | 62 (13.2%) |
| 35 to 44 Years | 122 (18.0%) | 85 (13.1%) |
| 45 to 54 Years | 91 (21.3%) | 86 (14.9%) |
| 55 to 64 Years | 166 (26.4%) | 179 (23.6%) |
| 65 to 74 Years | 53 (7.9%) | 65 (6.5%) |
| 75 Years and over | 23 (4.2%) | 108 (16.1%) |
| Total | 783 (16.5%) | 775 (14.6%) |
Income Above Poverty by Sex and Age in Newport
According to the poverty statistics in Newport, males aged 5 years and females aged 65 to 74 years are the age groups that are most secure financially, with 100.0% of males and 93.5% of females in these age groups living above the poverty line.
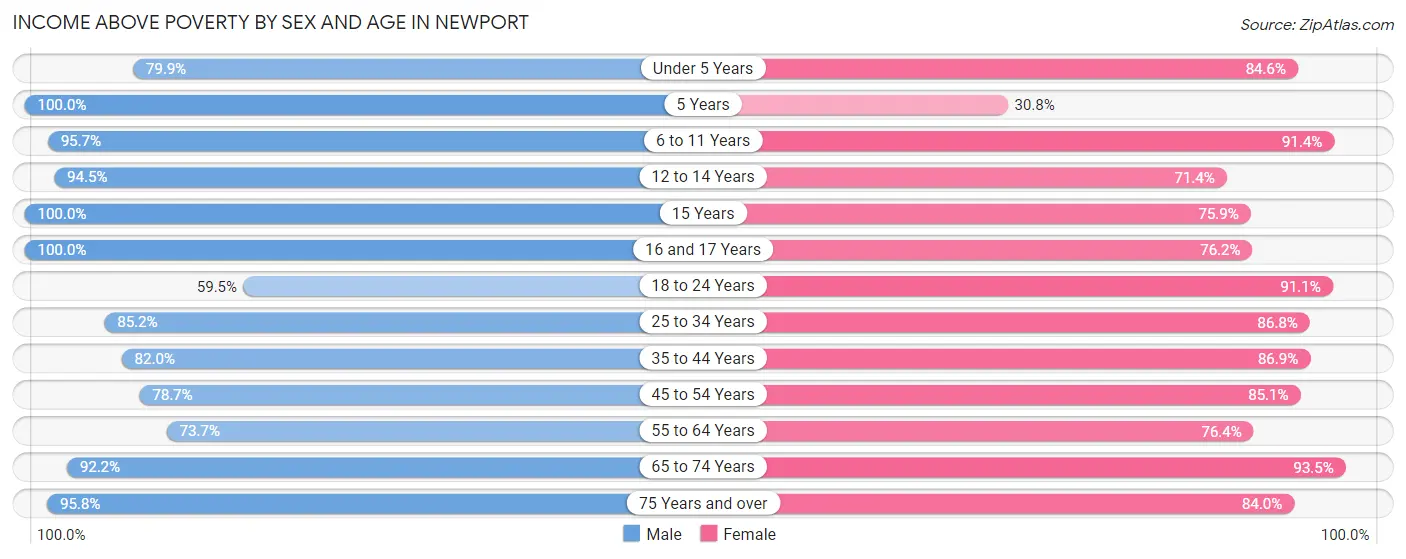
| Age Bracket | Male | Female |
| Under 5 Years | 151 (79.9%) | 176 (84.6%) |
| 5 Years | 26 (100.0%) | 12 (30.8%) |
| 6 to 11 Years | 356 (95.7%) | 212 (91.4%) |
| 12 to 14 Years | 155 (94.5%) | 95 (71.4%) |
| 15 Years | 75 (100.0%) | 22 (75.9%) |
| 16 and 17 Years | 60 (100.0%) | 96 (76.2%) |
| 18 to 24 Years | 304 (59.5%) | 368 (91.1%) |
| 25 to 34 Years | 334 (85.2%) | 409 (86.8%) |
| 35 to 44 Years | 555 (82.0%) | 564 (86.9%) |
| 45 to 54 Years | 336 (78.7%) | 491 (85.1%) |
| 55 to 64 Years | 464 (73.7%) | 580 (76.4%) |
| 65 to 74 Years | 622 (92.1%) | 934 (93.5%) |
| 75 Years and over | 528 (95.8%) | 565 (84.0%) |
| Total | 3,966 (83.5%) | 4,524 (85.4%) |
Income Below Poverty Among Married-Couple Families in Newport
The poverty statistics for married-couple families in Newport show that 2.5% or 42 of the total 1,651 families live below the poverty line. Families with 1 or 2 children have the highest poverty rate of 3.6%, comprising of 13 families. On the other hand, families with 3 or 4 children have the lowest poverty rate of 0.0%, which includes 0 families.
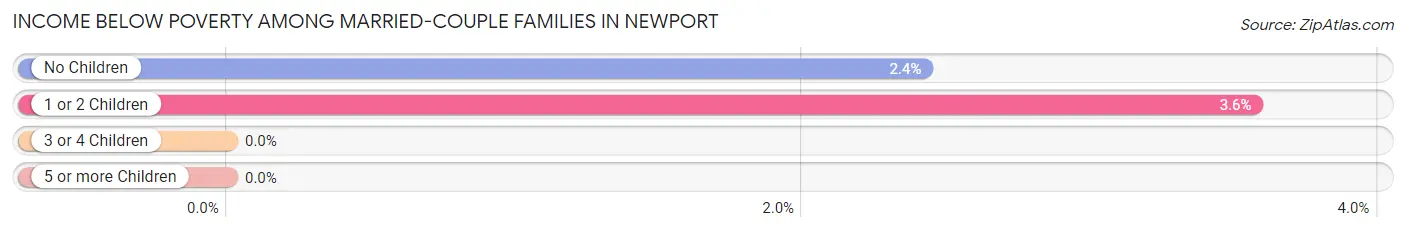
| Children | Above Poverty | Below Poverty |
| No Children | 1,167 (97.6%) | 29 (2.4%) |
| 1 or 2 Children | 351 (96.4%) | 13 (3.6%) |
| 3 or 4 Children | 91 (100.0%) | 0 (0.0%) |
| 5 or more Children | 0 (0.0%) | 0 (0.0%) |
| Total | 1,609 (97.5%) | 42 (2.5%) |
Income Below Poverty Among Single-Parent Households in Newport
According to the poverty data in Newport, 17.6% or 31 single-father households and 22.0% or 134 single-mother households are living below the poverty line. Among single-father households, those with 3 or 4 children have the highest poverty rate, with 15 households (78.9%) experiencing poverty. Likewise, among single-mother households, those with 1 or 2 children have the highest poverty rate, with 91 households (29.9%) falling below the poverty line.
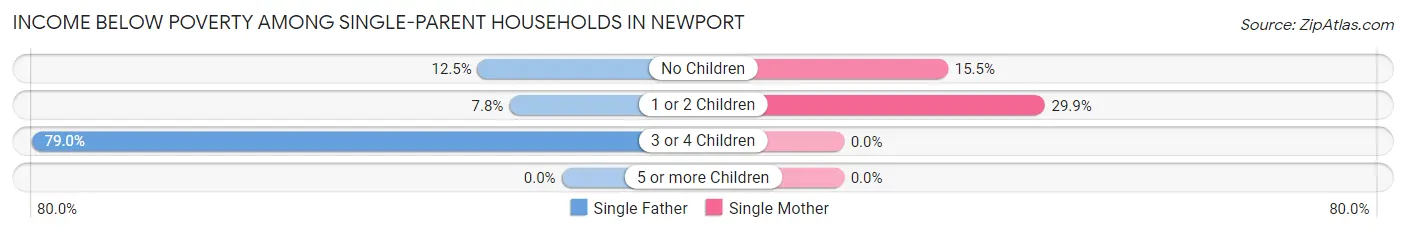
| Children | Single Father | Single Mother |
| No Children | 10 (12.5%) | 43 (15.5%) |
| 1 or 2 Children | 6 (7.8%) | 91 (29.9%) |
| 3 or 4 Children | 15 (78.9%) | 0 (0.0%) |
| 5 or more Children | 0 (0.0%) | 0 (0.0%) |
| Total | 31 (17.6%) | 134 (22.0%) |
Income Below Poverty Among Married-Couple vs Single-Parent Households in Newport
The poverty data for Newport shows that 42 of the married-couple family households (2.5%) and 165 of the single-parent households (21.0%) are living below the poverty level. Within the married-couple family households, those with 1 or 2 children have the highest poverty rate, with 13 households (3.6%) falling below the poverty line. Among the single-parent households, those with 3 or 4 children have the highest poverty rate, with 15 household (32.6%) living below poverty.
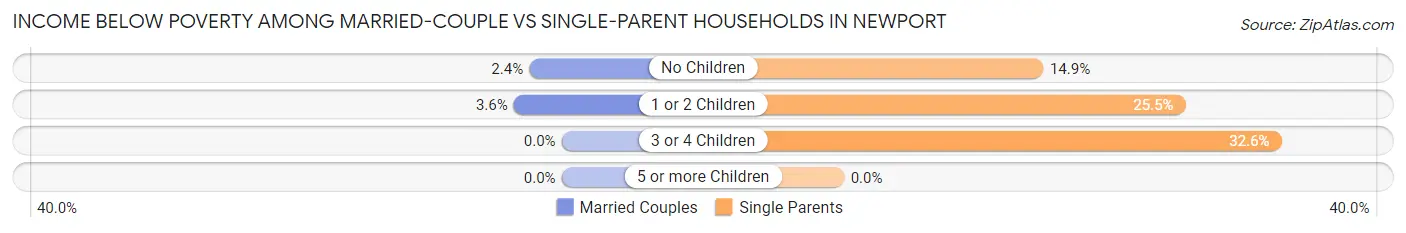
| Children | Married-Couple Families | Single-Parent Households |
| No Children | 29 (2.4%) | 53 (14.8%) |
| 1 or 2 Children | 13 (3.6%) | 97 (25.5%) |
| 3 or 4 Children | 0 (0.0%) | 15 (32.6%) |
| 5 or more Children | 0 (0.0%) | 0 (0.0%) |
| Total | 42 (2.5%) | 165 (21.0%) |
Race in Newport
The most populous races in Newport are White / Caucasian (8,248 | 79.9%), Hispanic or Latino (1,647 | 16.0%), and Some other Race (1,026 | 9.9%).
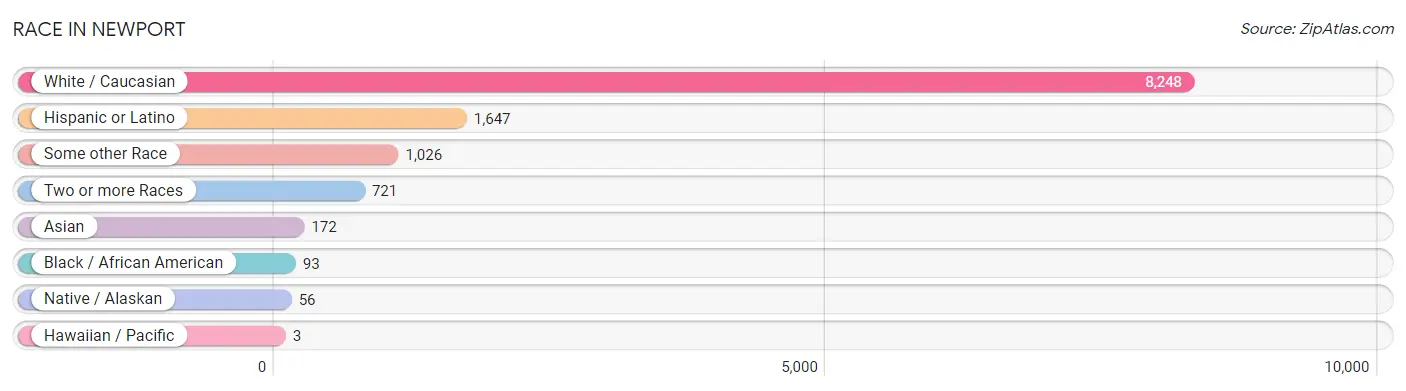
| Race | # Population | % Population |
| Asian | 172 | 1.7% |
| Black / African American | 93 | 0.9% |
| Hawaiian / Pacific | 3 | 0.0% |
| Hispanic or Latino | 1,647 | 16.0% |
| Native / Alaskan | 56 | 0.5% |
| White / Caucasian | 8,248 | 79.9% |
| Two or more Races | 721 | 7.0% |
| Some other Race | 1,026 | 9.9% |
| Total | 10,319 | 100.0% |
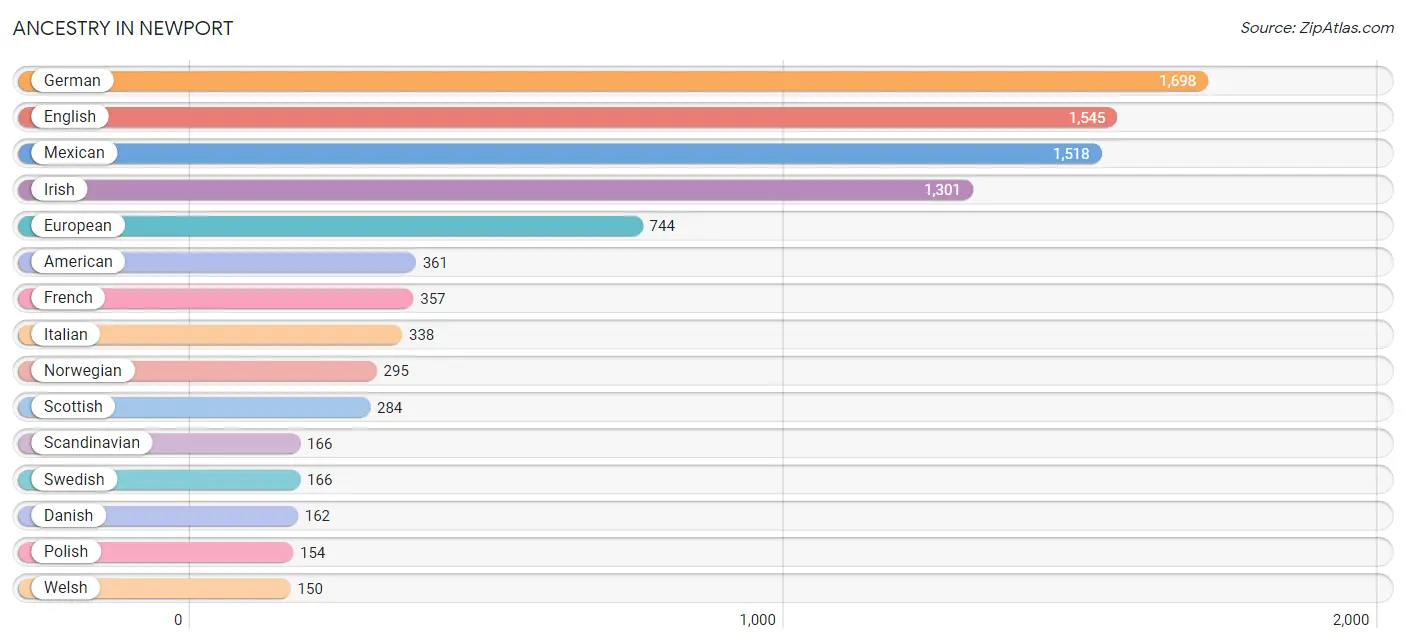
Ancestry in Newport
The most populous ancestries reported in Newport are German (1,698 | 16.5%), English (1,545 | 15.0%), Mexican (1,518 | 14.7%), Irish (1,301 | 12.6%), and European (744 | 7.2%), together accounting for 66.0% of all Newport residents.
| Ancestry | # Population | % Population |
| African | 8 | 0.1% |
| American | 361 | 3.5% |
| Apache | 8 | 0.1% |
| Arab | 11 | 0.1% |
| Belgian | 12 | 0.1% |
| Bhutanese | 69 | 0.7% |
| Blackfeet | 49 | 0.5% |
| British | 57 | 0.5% |
| Burmese | 118 | 1.1% |
| Celtic | 10 | 0.1% |
| Central American | 44 | 0.4% |
| Cherokee | 114 | 1.1% |
| Chickasaw | 12 | 0.1% |
| Chippewa | 10 | 0.1% |
| Choctaw | 16 | 0.2% |
| Comanche | 21 | 0.2% |
| Creek | 13 | 0.1% |
| Croatian | 8 | 0.1% |
| Cuban | 22 | 0.2% |
| Czech | 6 | 0.1% |
| Czechoslovakian | 10 | 0.1% |
| Danish | 162 | 1.6% |
| Dominican | 20 | 0.2% |
| Dutch | 115 | 1.1% |
| Eastern European | 76 | 0.7% |
| English | 1,545 | 15.0% |
| Ethiopian | 4 | 0.0% |
| European | 744 | 7.2% |
| Finnish | 77 | 0.7% |
| French | 357 | 3.5% |
| French American Indian | 16 | 0.2% |
| French Canadian | 80 | 0.8% |
| German | 1,698 | 16.5% |
| Greek | 23 | 0.2% |
| Guamanian / Chamorro | 23 | 0.2% |
| Guatemalan | 44 | 0.4% |
| Haitian | 4 | 0.0% |
| Hungarian | 22 | 0.2% |
| Indian (Asian) | 84 | 0.8% |
| Irish | 1,301 | 12.6% |
| Italian | 338 | 3.3% |
| Korean | 16 | 0.2% |
| Lithuanian | 4 | 0.0% |
| Mexican | 1,518 | 14.7% |
| Mexican American Indian | 7 | 0.1% |
| Moroccan | 11 | 0.1% |
| Native Hawaiian | 9 | 0.1% |
| Navajo | 4 | 0.0% |
| Northern European | 33 | 0.3% |
| Norwegian | 295 | 2.9% |
| Pakistani | 28 | 0.3% |
| Polish | 154 | 1.5% |
| Puerto Rican | 11 | 0.1% |
| Romanian | 3 | 0.0% |
| Russian | 38 | 0.4% |
| Samoan | 3 | 0.0% |
| Scandinavian | 166 | 1.6% |
| Scotch-Irish | 91 | 0.9% |
| Scottish | 284 | 2.8% |
| Sioux | 5 | 0.1% |
| Slavic | 32 | 0.3% |
| Spanish | 17 | 0.2% |
| Sri Lankan | 8 | 0.1% |
| Subsaharan African | 12 | 0.1% |
| Swedish | 166 | 1.6% |
| Swiss | 71 | 0.7% |
| Ukrainian | 88 | 0.9% |
| Vietnamese | 5 | 0.1% |
| Welsh | 150 | 1.5% | View All 69 Rows |
Immigrants in Newport
The most numerous immigrant groups reported in Newport came from Latin America (508 | 4.9%), Central America (497 | 4.8%), Mexico (465 | 4.5%), Asia (131 | 1.3%), and Eastern Asia (123 | 1.2%), together accounting for 16.7% of all Newport residents.
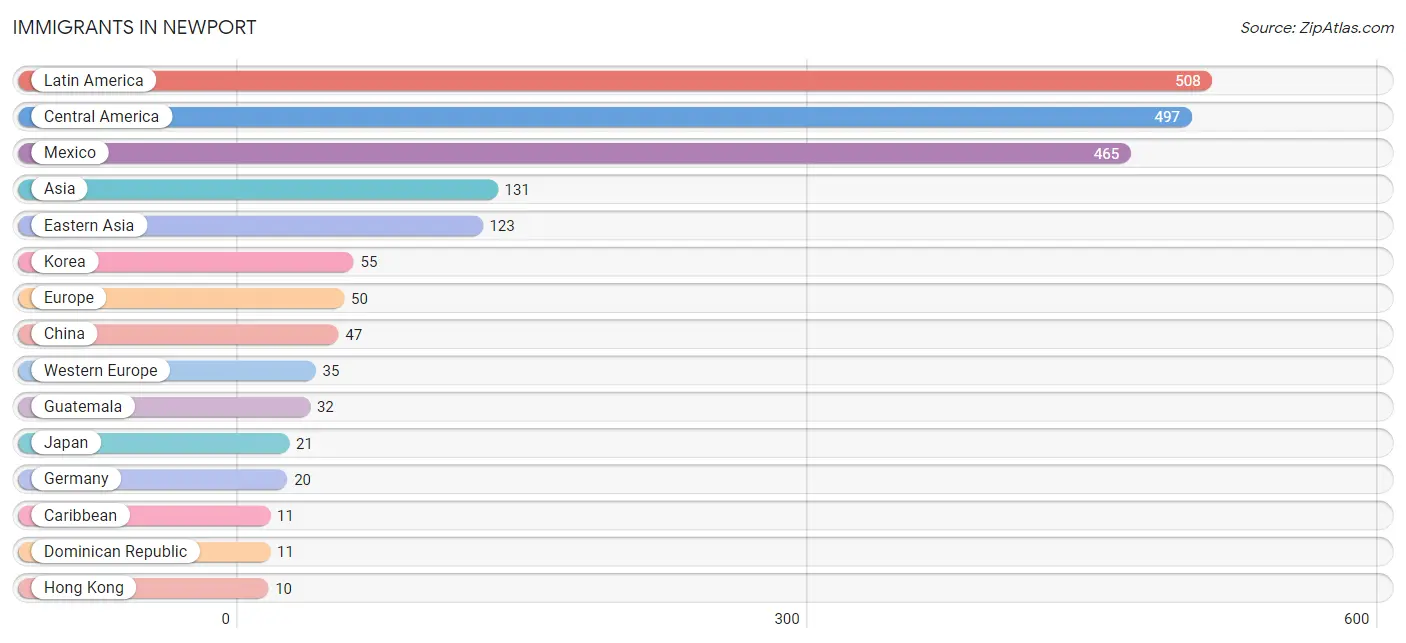
| Immigration Origin | # Population | % Population |
| Africa | 9 | 0.1% |
| Asia | 131 | 1.3% |
| Bangladesh | 2 | 0.0% |
| Caribbean | 11 | 0.1% |
| Central America | 497 | 4.8% |
| China | 47 | 0.5% |
| Dominican Republic | 11 | 0.1% |
| Eastern Africa | 9 | 0.1% |
| Eastern Asia | 123 | 1.2% |
| Eastern Europe | 8 | 0.1% |
| England | 7 | 0.1% |
| Europe | 50 | 0.5% |
| Germany | 20 | 0.2% |
| Guatemala | 32 | 0.3% |
| Hong Kong | 10 | 0.1% |
| Japan | 21 | 0.2% |
| Korea | 55 | 0.5% |
| Latin America | 508 | 4.9% |
| Mexico | 465 | 4.5% |
| Netherlands | 5 | 0.1% |
| Northern Europe | 7 | 0.1% |
| Poland | 8 | 0.1% |
| South Central Asia | 2 | 0.0% |
| South Eastern Asia | 6 | 0.1% |
| Switzerland | 10 | 0.1% |
| Thailand | 6 | 0.1% |
| Western Europe | 35 | 0.3% | View All 27 Rows |
Sex and Age in Newport
Sex and Age in Newport
The most populous age groups in Newport are 15 to 19 Years (404 | 8.1%) for men and 70 to 74 Years (519 | 9.7%) for women.
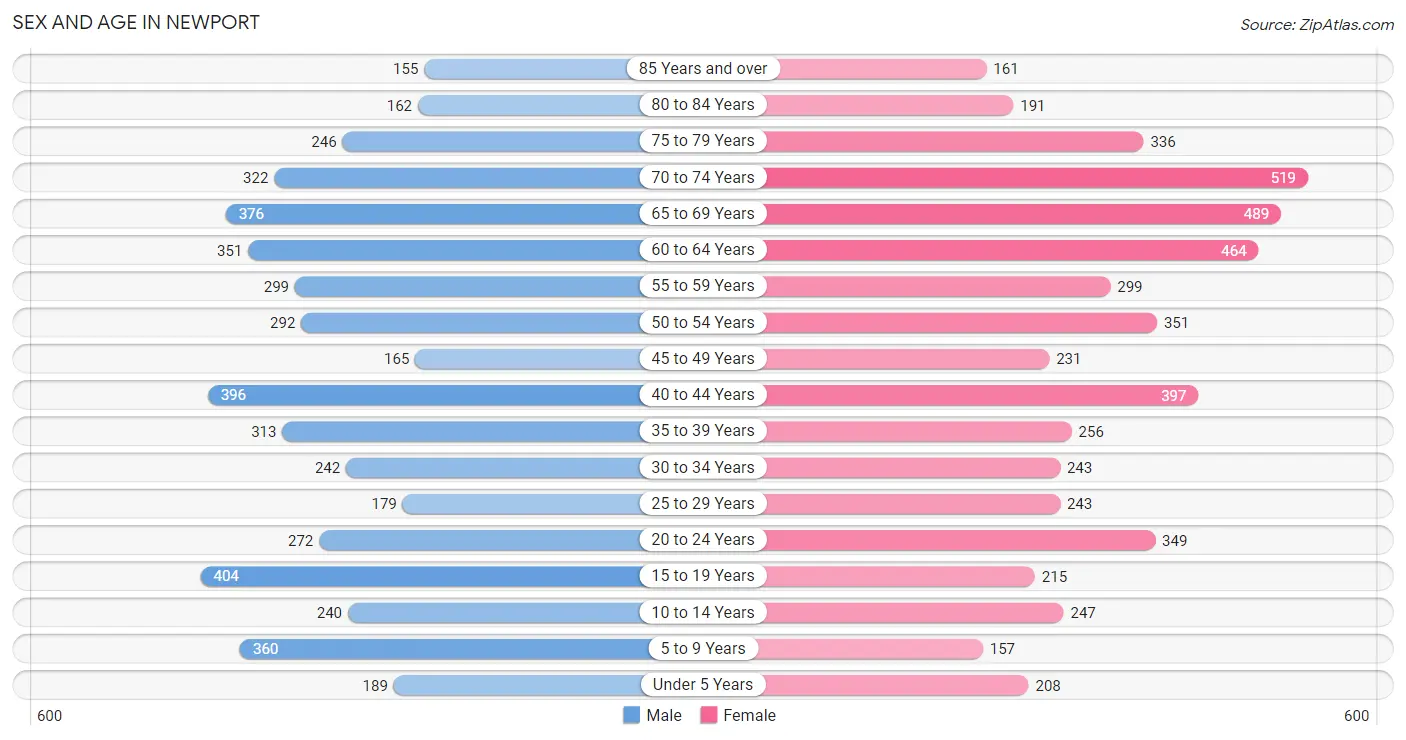
| Age Bracket | Male | Female |
| Under 5 Years | 189 (3.8%) | 208 (3.9%) |
| 5 to 9 Years | 360 (7.2%) | 157 (2.9%) |
| 10 to 14 Years | 240 (4.8%) | 247 (4.6%) |
| 15 to 19 Years | 404 (8.1%) | 215 (4.0%) |
| 20 to 24 Years | 272 (5.5%) | 349 (6.5%) |
| 25 to 29 Years | 179 (3.6%) | 243 (4.5%) |
| 30 to 34 Years | 242 (4.9%) | 243 (4.5%) |
| 35 to 39 Years | 313 (6.3%) | 256 (4.8%) |
| 40 to 44 Years | 396 (8.0%) | 397 (7.4%) |
| 45 to 49 Years | 165 (3.3%) | 231 (4.3%) |
| 50 to 54 Years | 292 (5.9%) | 351 (6.6%) |
| 55 to 59 Years | 299 (6.0%) | 299 (5.6%) |
| 60 to 64 Years | 351 (7.1%) | 464 (8.7%) |
| 65 to 69 Years | 376 (7.6%) | 489 (9.1%) |
| 70 to 74 Years | 322 (6.5%) | 519 (9.7%) |
| 75 to 79 Years | 246 (5.0%) | 336 (6.3%) |
| 80 to 84 Years | 162 (3.3%) | 191 (3.6%) |
| 85 Years and over | 155 (3.1%) | 161 (3.0%) |
| Total | 4,963 (100.0%) | 5,356 (100.0%) |
Families and Households in Newport
Median Family Size in Newport
The median family size in Newport is 2.86 persons per family, with single female/mother families (608 | 25.0%) accounting for the largest median family size of 2.99 persons per family. On the other hand, single male/father families (176 | 7.2%) represent the smallest median family size with 2.53 persons per family.
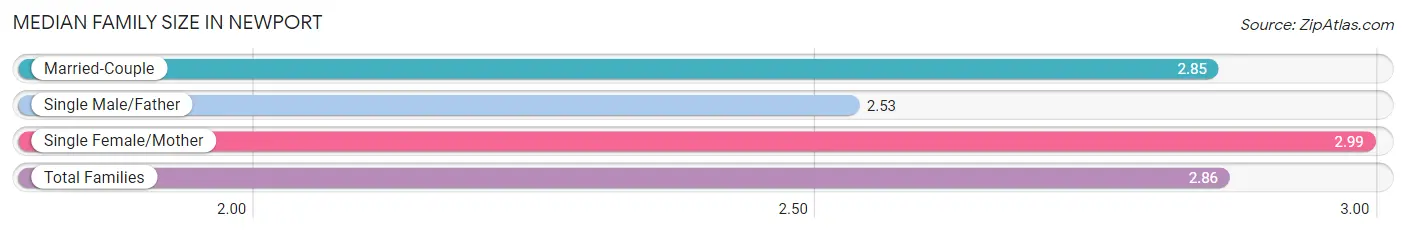
| Family Type | # Families | Family Size |
| Married-Couple | 1,651 (67.8%) | 2.85 |
| Single Male/Father | 176 (7.2%) | 2.53 |
| Single Female/Mother | 608 (25.0%) | 2.99 |
| Total Families | 2,435 (100.0%) | 2.86 |
Median Household Size in Newport
The median household size in Newport is 2.20 persons per household, with single female/mother households (608 | 13.4%) accounting for the largest median household size of 3.58 persons per household. non-family households (2,116 | 46.5%) represent the smallest median household size with 1.23 persons per household.
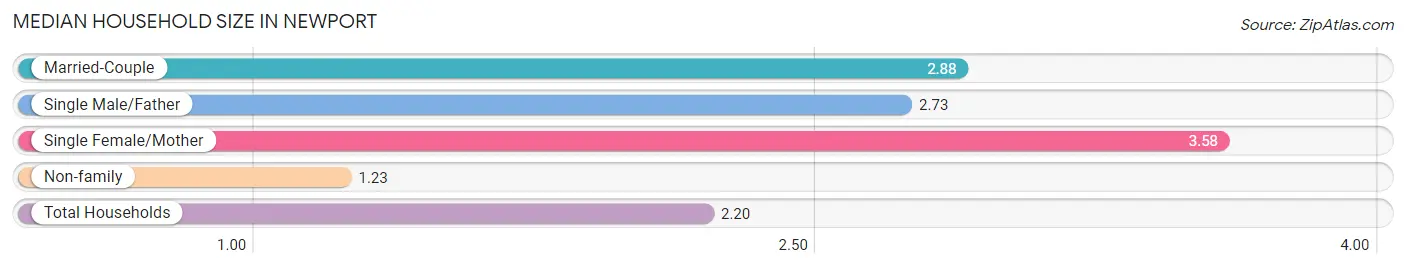
| Household Type | # Households | Household Size |
| Married-Couple | 1,651 (36.3%) | 2.88 |
| Single Male/Father | 176 (3.9%) | 2.73 |
| Single Female/Mother | 608 (13.4%) | 3.58 |
| Non-family | 2,116 (46.5%) | 1.23 |
| Total Households | 4,551 (100.0%) | 2.20 |
Household Size by Marriage Status in Newport
Out of a total of 4,551 households in Newport, 2,435 (53.5%) are family households, while 2,116 (46.5%) are nonfamily households. The most numerous type of family households are 2-person households, comprising 1,250, and the most common type of nonfamily households are 1-person households, comprising 1,786.
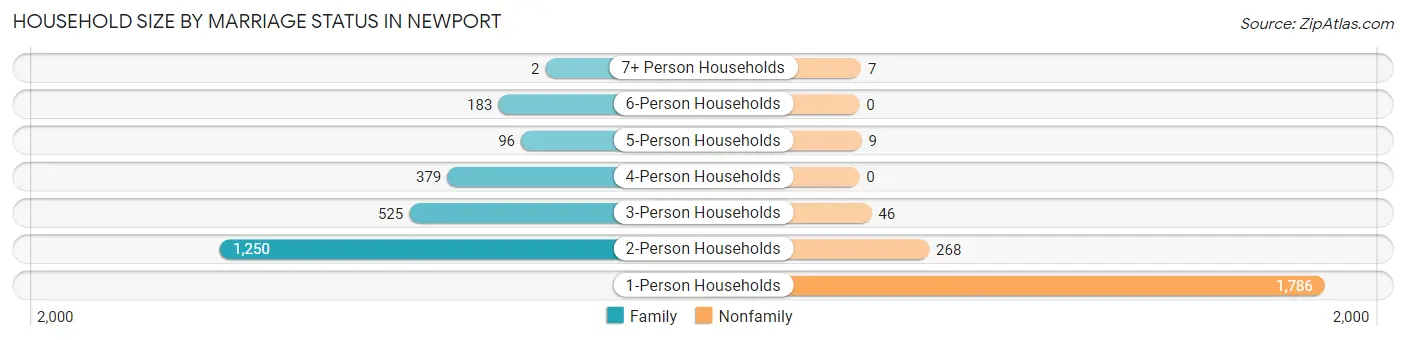
| Household Size | Family Households | Nonfamily Households |
| 1-Person Households | - | 1,786 (39.2%) |
| 2-Person Households | 1,250 (27.5%) | 268 (5.9%) |
| 3-Person Households | 525 (11.5%) | 46 (1.0%) |
| 4-Person Households | 379 (8.3%) | 0 (0.0%) |
| 5-Person Households | 96 (2.1%) | 9 (0.2%) |
| 6-Person Households | 183 (4.0%) | 0 (0.0%) |
| 7+ Person Households | 2 (0.0%) | 7 (0.2%) |
| Total | 2,435 (53.5%) | 2,116 (46.5%) |
Female Fertility in Newport
Fertility by Age in Newport
Average fertility rate in Newport is 55.0 births per 1,000 women. Women in the age bracket of 20 to 34 years have the highest fertility rate with 83.0 births per 1,000 women. Women in the age bracket of 20 to 34 years acount for 62.2% of all women with births.
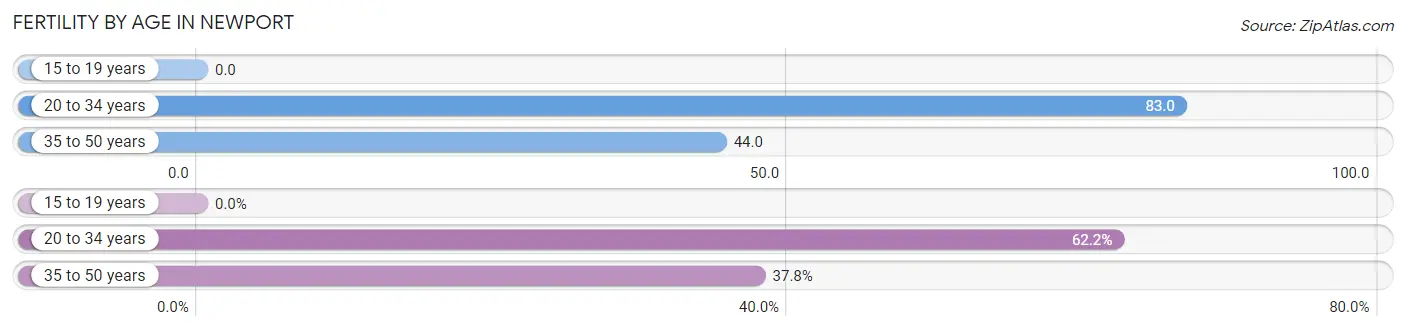
| Age Bracket | Women with Births | Births / 1,000 Women |
| 15 to 19 years | 0 (0.0%) | 0.0 |
| 20 to 34 years | 69 (62.2%) | 83.0 |
| 35 to 50 years | 42 (37.8%) | 44.0 |
| Total | 111 (100.0%) | 55.0 |
Fertility by Age by Marriage Status in Newport
9.9% of women with births (111) in Newport are married. The highest percentage of unmarried women with births falls into 35 to 50 years age bracket with 95.2% of them unmarried at the time of birth, while the lowest percentage of unmarried women with births belong to 20 to 34 years age bracket with 87.0% of them unmarried.
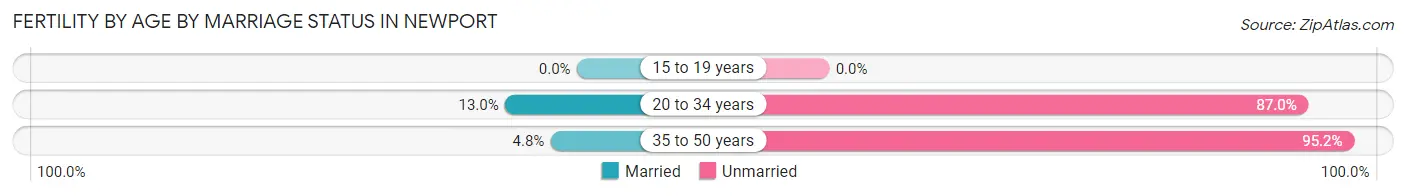
| Age Bracket | Married | Unmarried |
| 15 to 19 years | 0 (0.0%) | 0 (0.0%) |
| 20 to 34 years | 9 (13.0%) | 60 (87.0%) |
| 35 to 50 years | 2 (4.8%) | 40 (95.2%) |
| Total | 11 (9.9%) | 100 (90.1%) |
Fertility by Education in Newport
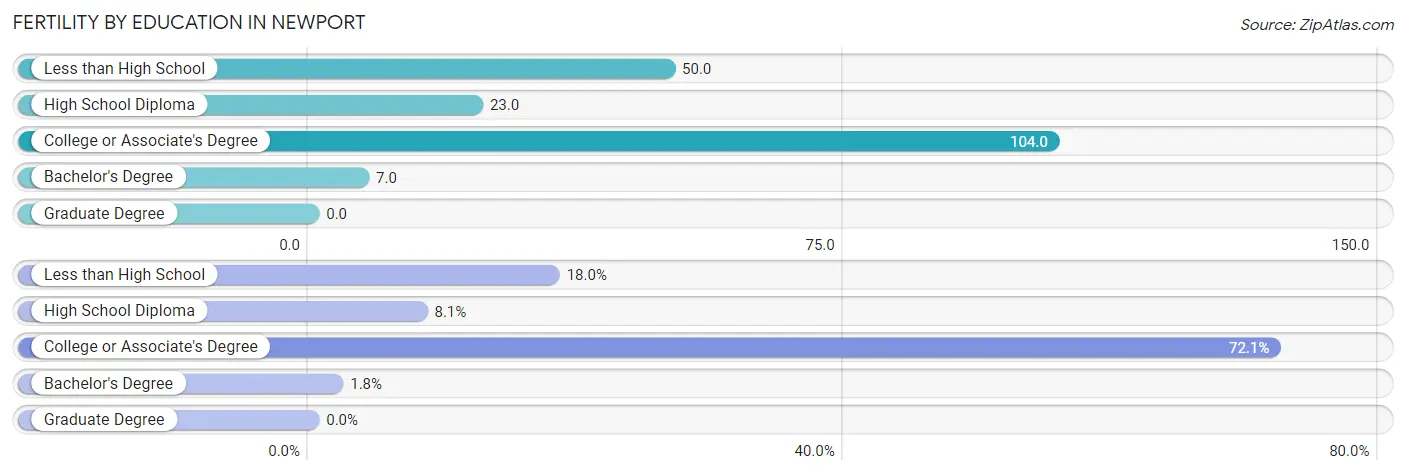
| Educational Attainment | Women with Births | Births / 1,000 Women |
| Less than High School | 20 (18.0%) | 50.0 |
| High School Diploma | 9 (8.1%) | 23.0 |
| College or Associate's Degree | 80 (72.1%) | 104.0 |
| Bachelor's Degree | 2 (1.8%) | 7.0 |
| Graduate Degree | 0 (0.0%) | 0.0 |
| Total | 111 (100.0%) | 55.0 |
Fertility by Education by Marriage Status in Newport
90.1% of women with births in Newport are unmarried. Women with the educational attainment of high school diploma are most likely to be married with 100.0% of them married at childbirth, while women with the educational attainment of less than high school are least likely to be married with 100.0% of them unmarried at childbirth.
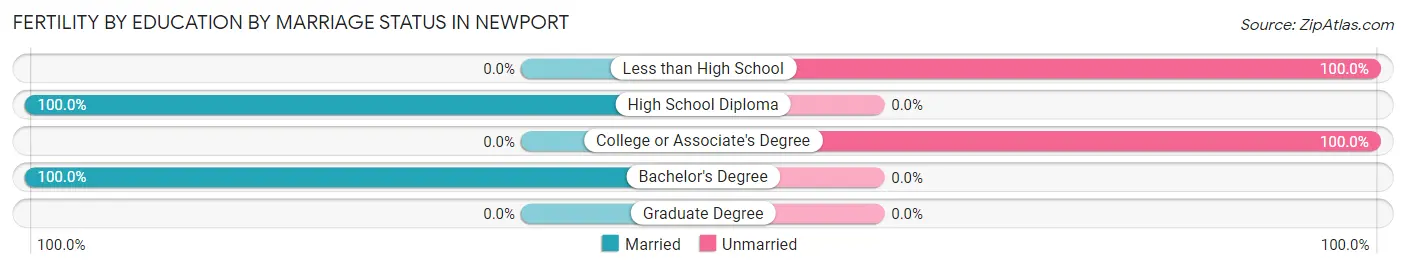
| Educational Attainment | Married | Unmarried |
| Less than High School | 0 (0.0%) | 20 (100.0%) |
| High School Diploma | 9 (100.0%) | 0 (0.0%) |
| College or Associate's Degree | 0 (0.0%) | 80 (100.0%) |
| Bachelor's Degree | 2 (100.0%) | 0 (0.0%) |
| Graduate Degree | 0 (0.0%) | 0 (0.0%) |
| Total | 11 (9.9%) | 100 (90.1%) |
Employment Characteristics in Newport
Employment by Class of Employer in Newport
Among the 4,142 employed individuals in Newport, private company employees (2,327 | 56.2%), local government employees (446 | 10.8%), and self-employed (not incorporated) (393 | 9.5%) make up the most common classes of employment.
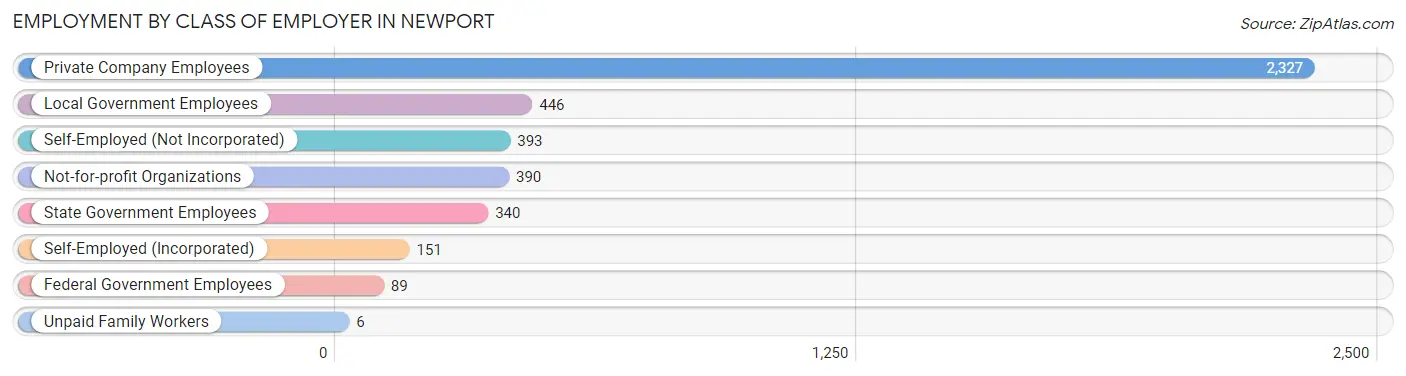
| Employer Class | # Employees | % Employees |
| Private Company Employees | 2,327 | 56.2% |
| Self-Employed (Incorporated) | 151 | 3.6% |
| Self-Employed (Not Incorporated) | 393 | 9.5% |
| Not-for-profit Organizations | 390 | 9.4% |
| Local Government Employees | 446 | 10.8% |
| State Government Employees | 340 | 8.2% |
| Federal Government Employees | 89 | 2.1% |
| Unpaid Family Workers | 6 | 0.1% |
| Total | 4,142 | 100.0% |
Employment Status by Age in Newport
According to the labor force statistics for Newport, out of the total population over 16 years of age (8,814), 51.4% or 4,530 individuals are in the labor force, with 6.8% or 308 of them unemployed. The age group with the highest labor force participation rate is 30 to 34 years, with 86.6% or 420 individuals in the labor force. Within the labor force, the 60 to 64 years age range has the highest percentage of unemployed individuals, with 15.7% or 69 of them being unemployed.
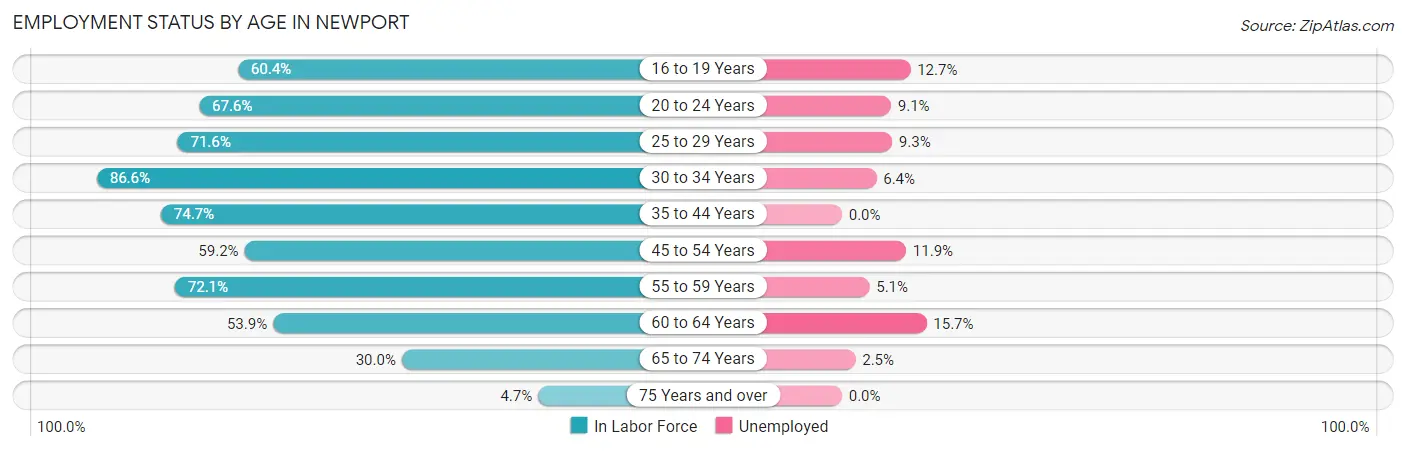
| Age Bracket | In Labor Force | Unemployed |
| 16 to 19 Years | 311 (60.4%) | 39 (12.7%) |
| 20 to 24 Years | 420 (67.6%) | 38 (9.1%) |
| 25 to 29 Years | 302 (71.6%) | 28 (9.3%) |
| 30 to 34 Years | 420 (86.6%) | 27 (6.4%) |
| 35 to 44 Years | 1,017 (74.7%) | 0 (0.0%) |
| 45 to 54 Years | 615 (59.2%) | 73 (11.9%) |
| 55 to 59 Years | 431 (72.1%) | 22 (5.1%) |
| 60 to 64 Years | 439 (53.9%) | 69 (15.7%) |
| 65 to 74 Years | 512 (30.0%) | 13 (2.5%) |
| 75 Years and over | 59 (4.7%) | 0 (0.0%) |
| Total | 4,530 (51.4%) | 308 (6.8%) |
Employment Status by Educational Attainment in Newport
According to labor force statistics for Newport, 68.3% of individuals (3,224) out of the total population between 25 and 64 years of age (4,721) are in the labor force, with 6.8% or 219 of them being unemployed. The group with the highest labor force participation rate are those with the educational attainment of bachelor's degree or higher, with 82.5% or 1,025 individuals in the labor force. Within the labor force, individuals with high school diploma education have the highest percentage of unemployment, with 11.3% or 72 of them being unemployed.
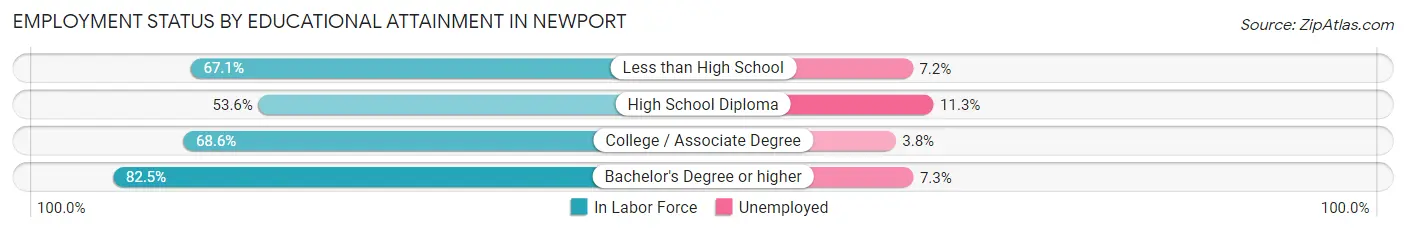
| Educational Attainment | In Labor Force | Unemployed |
| Less than High School | 375 (67.1%) | 40 (7.2%) |
| High School Diploma | 639 (53.6%) | 135 (11.3%) |
| College / Associate Degree | 1,185 (68.6%) | 66 (3.8%) |
| Bachelor's Degree or higher | 1,025 (82.5%) | 91 (7.3%) |
| Total | 3,224 (68.3%) | 321 (6.8%) |
Employment Occupations by Sex in Newport
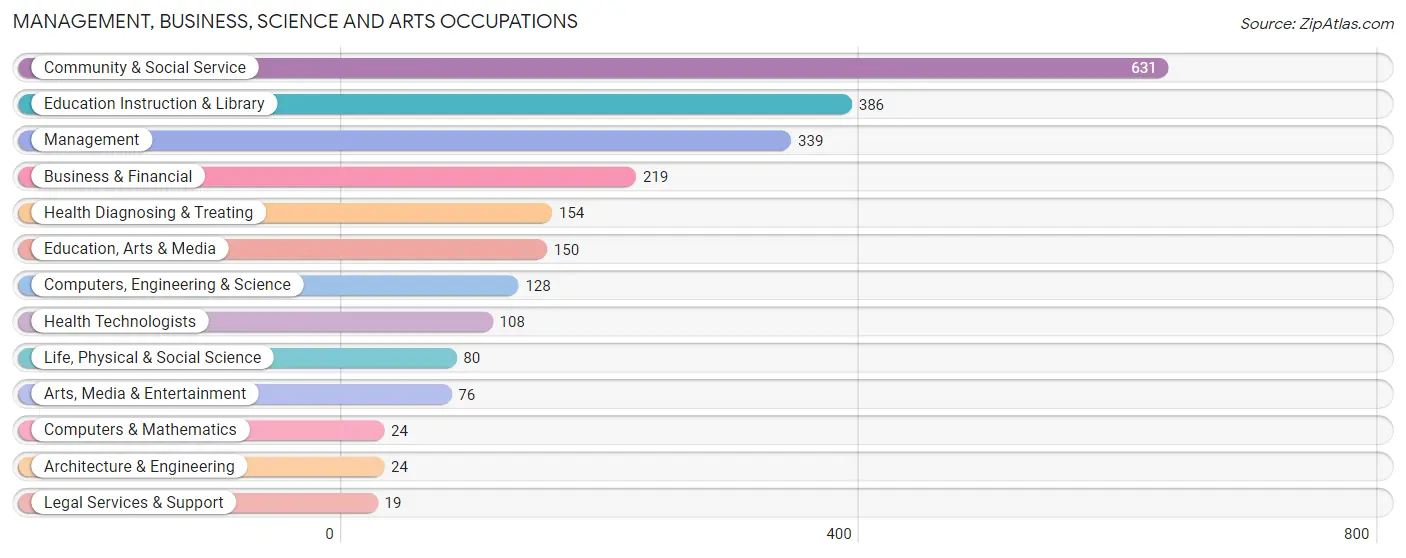
Management, Business, Science and Arts Occupations
The most common Management, Business, Science and Arts occupations in Newport are Community & Social Service (631 | 15.0%), Education Instruction & Library (386 | 9.2%), Management (339 | 8.1%), Business & Financial (219 | 5.2%), and Health Diagnosing & Treating (154 | 3.7%).
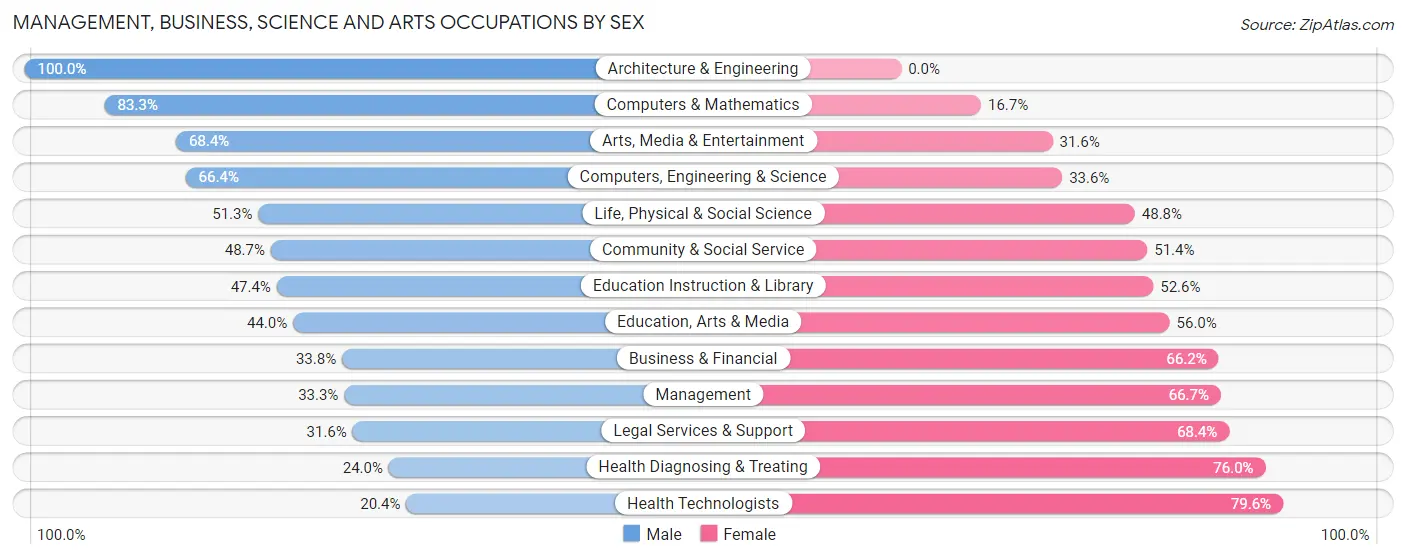
Management, Business, Science and Arts Occupations by Sex
Within the Management, Business, Science and Arts occupations in Newport, the most male-oriented occupations are Architecture & Engineering (100.0%), Computers & Mathematics (83.3%), and Arts, Media & Entertainment (68.4%), while the most female-oriented occupations are Health Technologists (79.6%), Health Diagnosing & Treating (76.0%), and Legal Services & Support (68.4%).
| Occupation | Male | Female |
| Management | 113 (33.3%) | 226 (66.7%) |
| Business & Financial | 74 (33.8%) | 145 (66.2%) |
| Computers, Engineering & Science | 85 (66.4%) | 43 (33.6%) |
| Computers & Mathematics | 20 (83.3%) | 4 (16.7%) |
| Architecture & Engineering | 24 (100.0%) | 0 (0.0%) |
| Life, Physical & Social Science | 41 (51.2%) | 39 (48.7%) |
| Community & Social Service | 307 (48.6%) | 324 (51.3%) |
| Education, Arts & Media | 66 (44.0%) | 84 (56.0%) |
| Legal Services & Support | 6 (31.6%) | 13 (68.4%) |
| Education Instruction & Library | 183 (47.4%) | 203 (52.6%) |
| Arts, Media & Entertainment | 52 (68.4%) | 24 (31.6%) |
| Health Diagnosing & Treating | 37 (24.0%) | 117 (76.0%) |
| Health Technologists | 22 (20.4%) | 86 (79.6%) |
| Total (Category) | 616 (41.9%) | 855 (58.1%) |
| Total (Overall) | 2,035 (48.4%) | 2,166 (51.6%) |
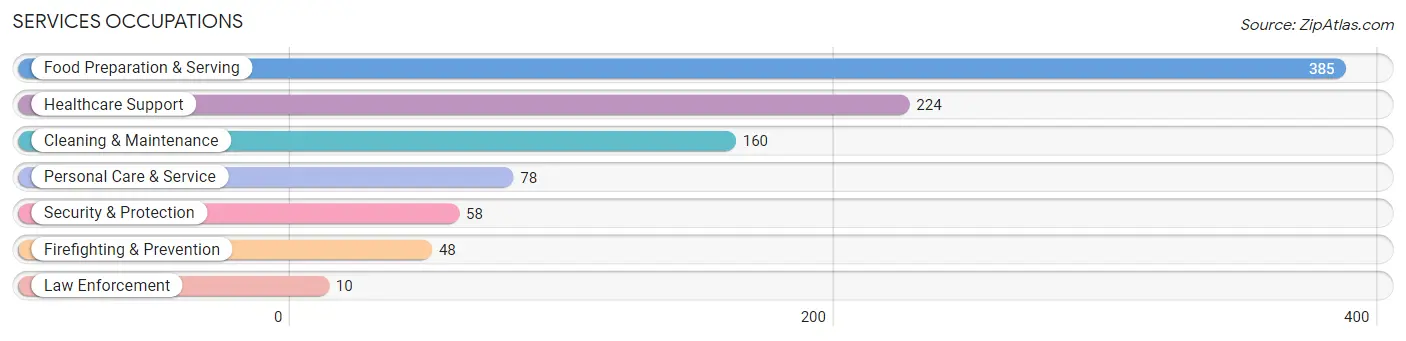
Services Occupations
The most common Services occupations in Newport are Food Preparation & Serving (385 | 9.2%), Healthcare Support (224 | 5.3%), Cleaning & Maintenance (160 | 3.8%), Personal Care & Service (78 | 1.9%), and Security & Protection (58 | 1.4%).
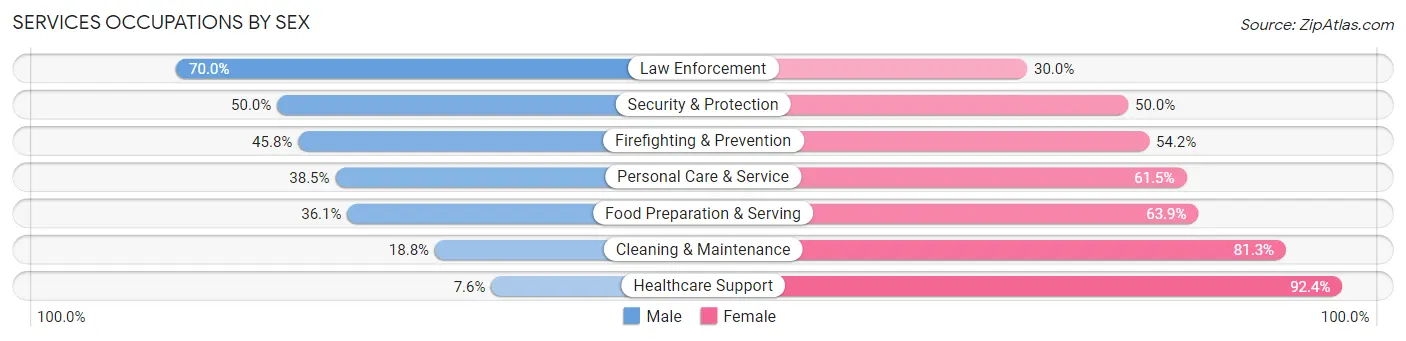
Services Occupations by Sex
Within the Services occupations in Newport, the most male-oriented occupations are Law Enforcement (70.0%), Security & Protection (50.0%), and Firefighting & Prevention (45.8%), while the most female-oriented occupations are Healthcare Support (92.4%), Cleaning & Maintenance (81.2%), and Food Preparation & Serving (63.9%).
| Occupation | Male | Female |
| Healthcare Support | 17 (7.6%) | 207 (92.4%) |
| Security & Protection | 29 (50.0%) | 29 (50.0%) |
| Firefighting & Prevention | 22 (45.8%) | 26 (54.2%) |
| Law Enforcement | 7 (70.0%) | 3 (30.0%) |
| Food Preparation & Serving | 139 (36.1%) | 246 (63.9%) |
| Cleaning & Maintenance | 30 (18.8%) | 130 (81.2%) |
| Personal Care & Service | 30 (38.5%) | 48 (61.5%) |
| Total (Category) | 245 (27.1%) | 660 (72.9%) |
| Total (Overall) | 2,035 (48.4%) | 2,166 (51.6%) |
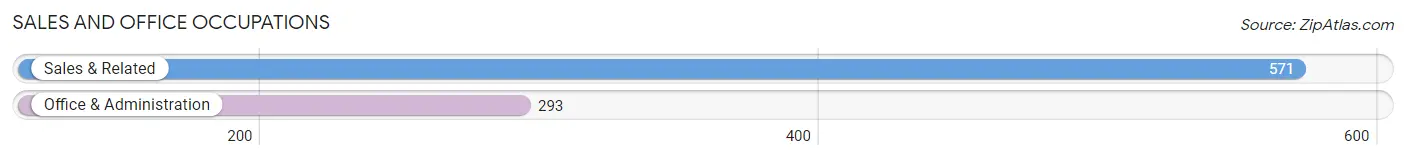
Sales and Office Occupations
The most common Sales and Office occupations in Newport are Sales & Related (571 | 13.6%), and Office & Administration (293 | 7.0%).
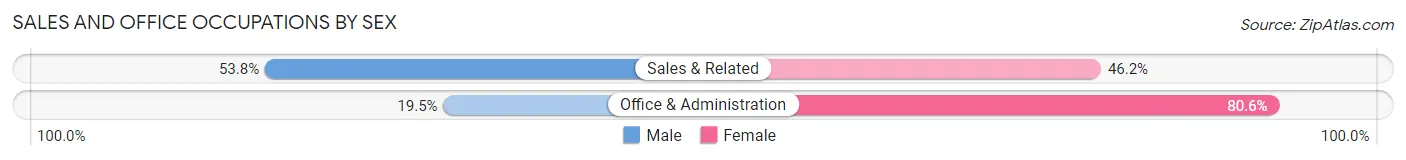
Sales and Office Occupations by Sex
| Occupation | Male | Female |
| Sales & Related | 307 (53.8%) | 264 (46.2%) |
| Office & Administration | 57 (19.5%) | 236 (80.5%) |
| Total (Category) | 364 (42.1%) | 500 (57.9%) |
| Total (Overall) | 2,035 (48.4%) | 2,166 (51.6%) |
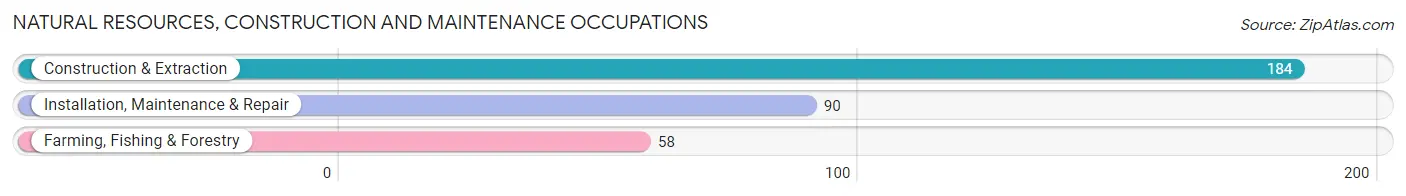
Natural Resources, Construction and Maintenance Occupations
The most common Natural Resources, Construction and Maintenance occupations in Newport are Construction & Extraction (184 | 4.4%), Installation, Maintenance & Repair (90 | 2.1%), and Farming, Fishing & Forestry (58 | 1.4%).
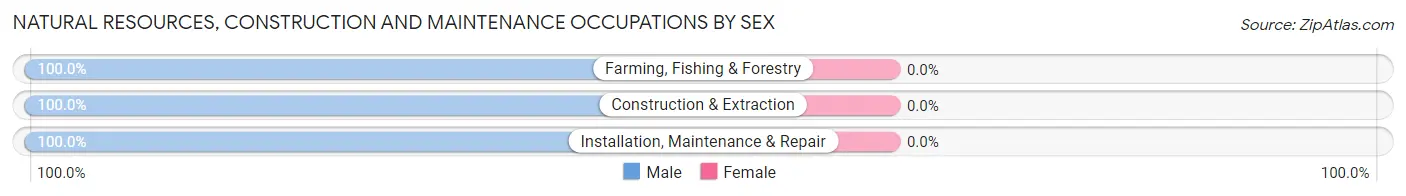
Natural Resources, Construction and Maintenance Occupations by Sex
| Occupation | Male | Female |
| Farming, Fishing & Forestry | 58 (100.0%) | 0 (0.0%) |
| Construction & Extraction | 184 (100.0%) | 0 (0.0%) |
| Installation, Maintenance & Repair | 90 (100.0%) | 0 (0.0%) |
| Total (Category) | 332 (100.0%) | 0 (0.0%) |
| Total (Overall) | 2,035 (48.4%) | 2,166 (51.6%) |
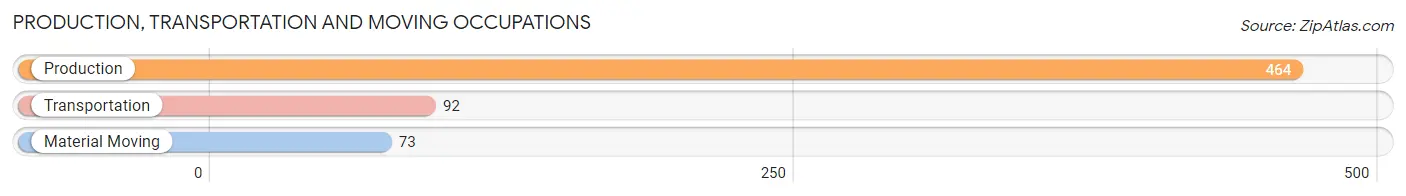
Production, Transportation and Moving Occupations
The most common Production, Transportation and Moving occupations in Newport are Production (464 | 11.0%), Transportation (92 | 2.2%), and Material Moving (73 | 1.7%).
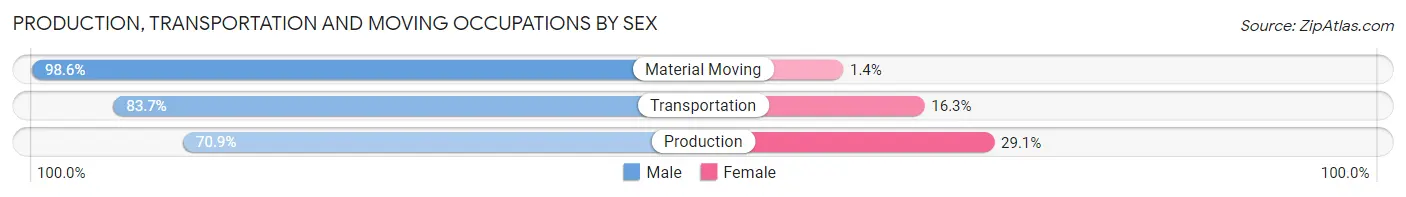
Production, Transportation and Moving Occupations by Sex
| Occupation | Male | Female |
| Production | 329 (70.9%) | 135 (29.1%) |
| Transportation | 77 (83.7%) | 15 (16.3%) |
| Material Moving | 72 (98.6%) | 1 (1.4%) |
| Total (Category) | 478 (76.0%) | 151 (24.0%) |
| Total (Overall) | 2,035 (48.4%) | 2,166 (51.6%) |
Employment Industries by Sex in Newport
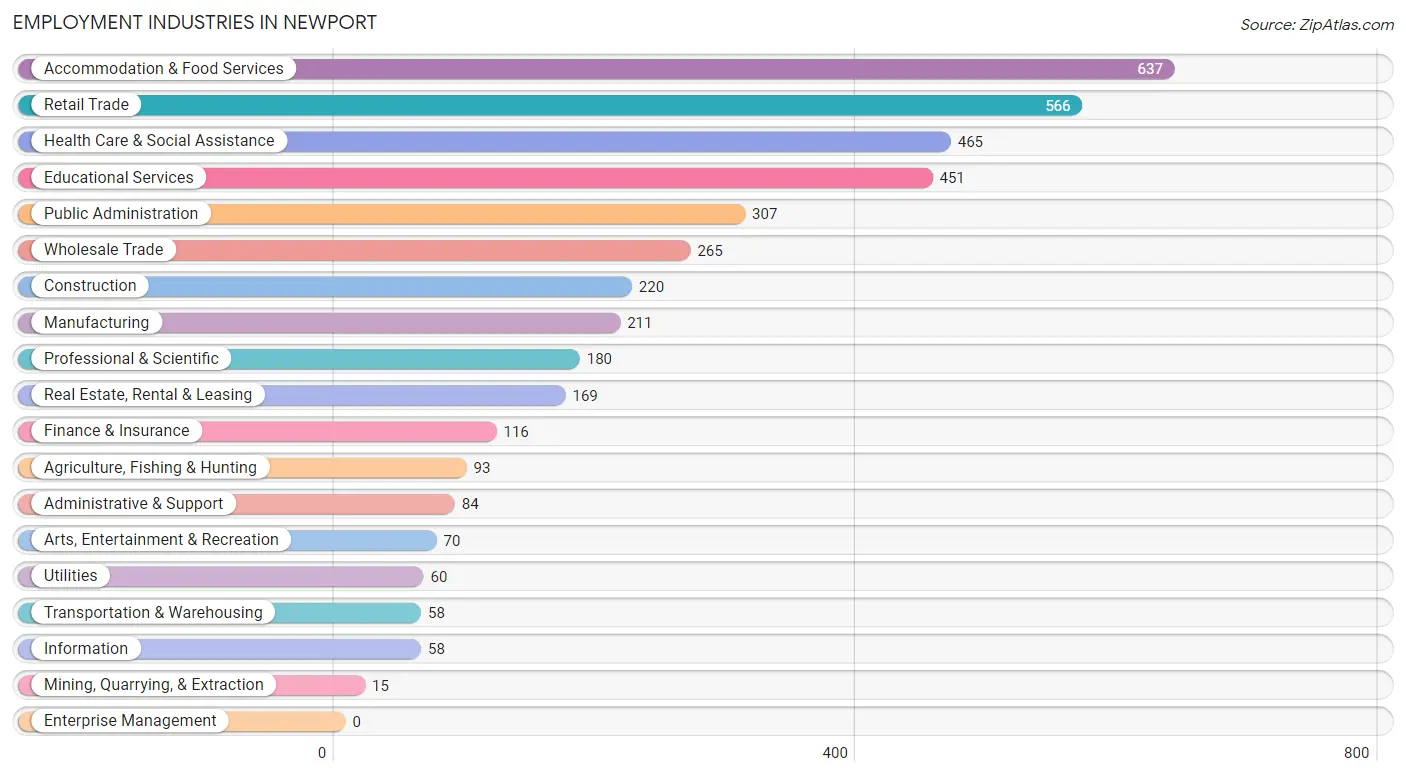
Employment Industries in Newport
The major employment industries in Newport include Accommodation & Food Services (637 | 15.2%), Retail Trade (566 | 13.5%), Health Care & Social Assistance (465 | 11.1%), Educational Services (451 | 10.7%), and Public Administration (307 | 7.3%).
Employment Industries by Sex in Newport
The Newport industries that see more men than women are Agriculture, Fishing & Hunting (100.0%), Mining, Quarrying, & Extraction (100.0%), and Construction (96.4%), whereas the industries that tend to have a higher number of women are Health Care & Social Assistance (83.7%), Transportation & Warehousing (79.3%), and Professional & Scientific (76.7%).
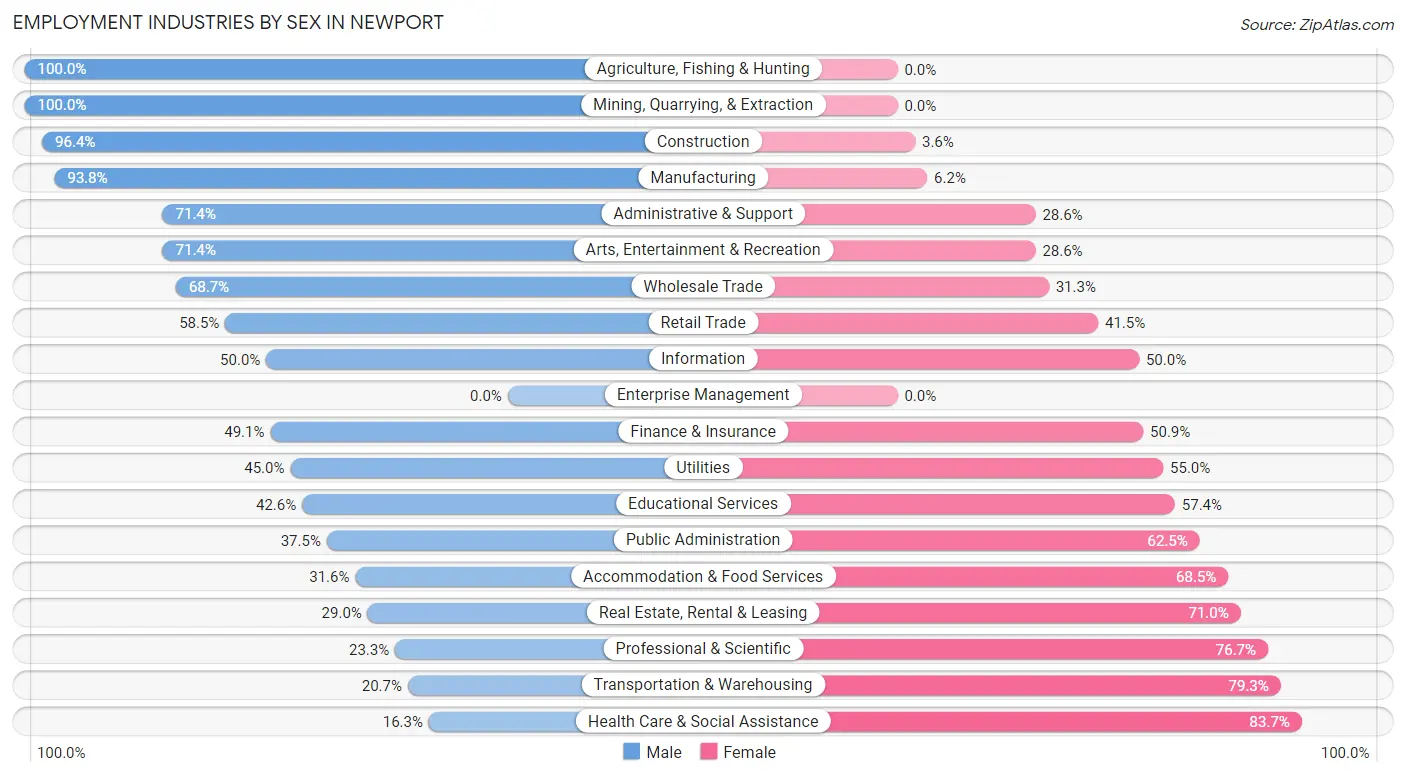
| Industry | Male | Female |
| Agriculture, Fishing & Hunting | 93 (100.0%) | 0 (0.0%) |
| Mining, Quarrying, & Extraction | 15 (100.0%) | 0 (0.0%) |
| Construction | 212 (96.4%) | 8 (3.6%) |
| Manufacturing | 198 (93.8%) | 13 (6.2%) |
| Wholesale Trade | 182 (68.7%) | 83 (31.3%) |
| Retail Trade | 331 (58.5%) | 235 (41.5%) |
| Transportation & Warehousing | 12 (20.7%) | 46 (79.3%) |
| Utilities | 27 (45.0%) | 33 (55.0%) |
| Information | 29 (50.0%) | 29 (50.0%) |
| Finance & Insurance | 57 (49.1%) | 59 (50.9%) |
| Real Estate, Rental & Leasing | 49 (29.0%) | 120 (71.0%) |
| Professional & Scientific | 42 (23.3%) | 138 (76.7%) |
| Enterprise Management | 0 (0.0%) | 0 (0.0%) |
| Administrative & Support | 60 (71.4%) | 24 (28.6%) |
| Educational Services | 192 (42.6%) | 259 (57.4%) |
| Health Care & Social Assistance | 76 (16.3%) | 389 (83.7%) |
| Arts, Entertainment & Recreation | 50 (71.4%) | 20 (28.6%) |
| Accommodation & Food Services | 201 (31.6%) | 436 (68.4%) |
| Public Administration | 115 (37.5%) | 192 (62.5%) |
| Total | 2,035 (48.4%) | 2,166 (51.6%) |
Education in Newport
School Enrollment in Newport
The most common levels of schooling among the 1,910 students in Newport are high school (545 | 28.5%), elementary school (477 | 25.0%), and middle school (367 | 19.2%).
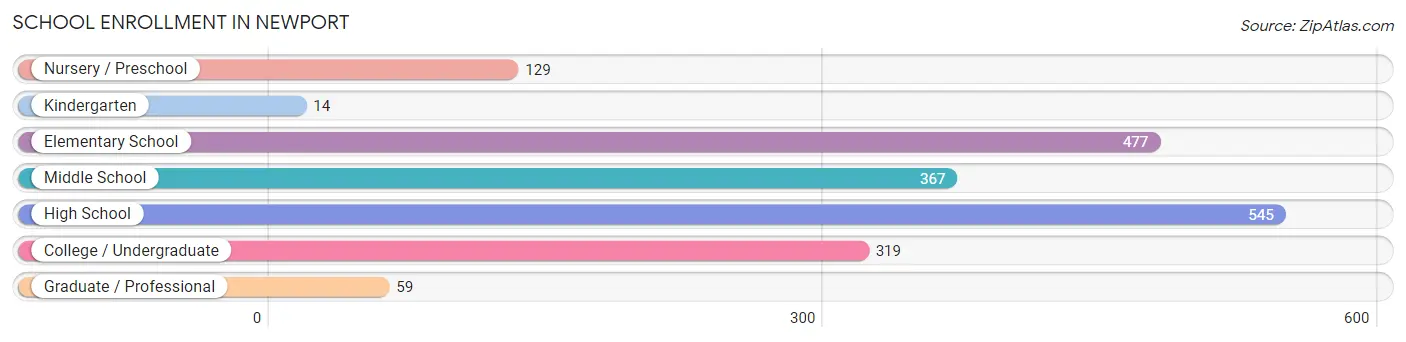
| School Level | # Students | % Students |
| Nursery / Preschool | 129 | 6.8% |
| Kindergarten | 14 | 0.7% |
| Elementary School | 477 | 25.0% |
| Middle School | 367 | 19.2% |
| High School | 545 | 28.5% |
| College / Undergraduate | 319 | 16.7% |
| Graduate / Professional | 59 | 3.1% |
| Total | 1,910 | 100.0% |
School Enrollment by Age by Funding Source in Newport
Out of a total of 1,910 students who are enrolled in schools in Newport, 330 (17.3%) attend a private institution, while the remaining 1,580 (82.7%) are enrolled in public schools. The age group of 3 to 4 year olds has the highest likelihood of being enrolled in private schools, with 31 (30.1% in the age bracket) enrolled. Conversely, the age group of 18 to 19 year olds has the lowest likelihood of being enrolled in a private school, with 187 (100.0% in the age bracket) attending a public institution.
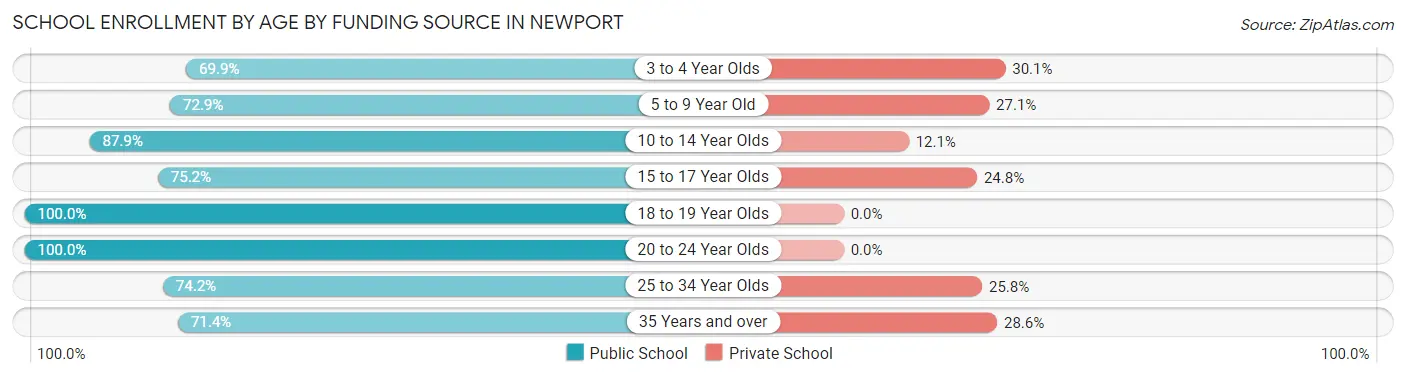
| Age Bracket | Public School | Private School |
| 3 to 4 Year Olds | 72 (69.9%) | 31 (30.1%) |
| 5 to 9 Year Old | 339 (72.9%) | 126 (27.1%) |
| 10 to 14 Year Olds | 428 (87.9%) | 59 (12.1%) |
| 15 to 17 Year Olds | 215 (75.2%) | 71 (24.8%) |
| 18 to 19 Year Olds | 187 (100.0%) | 0 (0.0%) |
| 20 to 24 Year Olds | 222 (100.0%) | 0 (0.0%) |
| 25 to 34 Year Olds | 72 (74.2%) | 25 (25.8%) |
| 35 Years and over | 45 (71.4%) | 18 (28.6%) |
| Total | 1,580 (82.7%) | 330 (17.3%) |
Educational Attainment by Field of Study in Newport
Business (360 | 14.8%), education (355 | 14.6%), bio, nature & agricultural (274 | 11.3%), science & technology (230 | 9.5%), and liberal arts & history (189 | 7.8%) are the most common fields of study among 2,429 individuals in Newport who have obtained a bachelor's degree or higher.
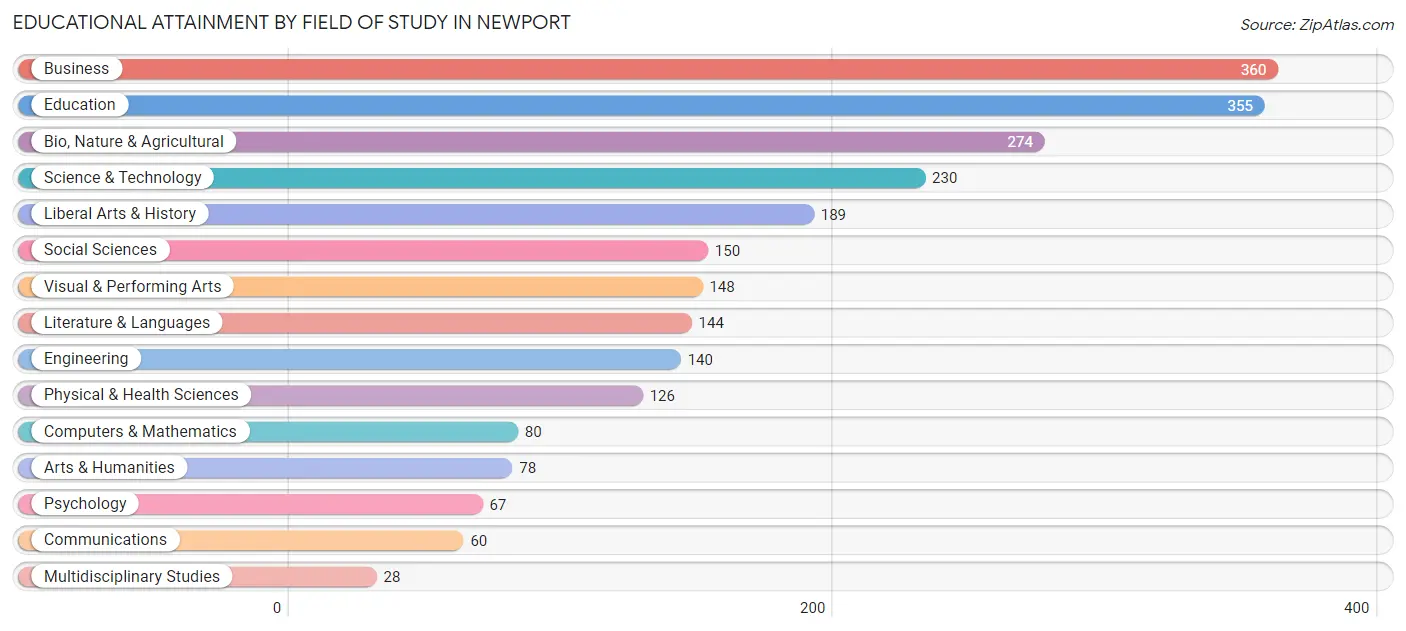
| Field of Study | # Graduates | % Graduates |
| Computers & Mathematics | 80 | 3.3% |
| Bio, Nature & Agricultural | 274 | 11.3% |
| Physical & Health Sciences | 126 | 5.2% |
| Psychology | 67 | 2.8% |
| Social Sciences | 150 | 6.2% |
| Engineering | 140 | 5.8% |
| Multidisciplinary Studies | 28 | 1.1% |
| Science & Technology | 230 | 9.5% |
| Business | 360 | 14.8% |
| Education | 355 | 14.6% |
| Literature & Languages | 144 | 5.9% |
| Liberal Arts & History | 189 | 7.8% |
| Visual & Performing Arts | 148 | 6.1% |
| Communications | 60 | 2.5% |
| Arts & Humanities | 78 | 3.2% |
| Total | 2,429 | 100.0% |
Transportation & Commute in Newport
Vehicle Availability by Sex in Newport
The most prevalent vehicle ownership categories in Newport are males with 2 vehicles (763, accounting for 38.0%) and females with 2 vehicles (808, making up 35.8%).
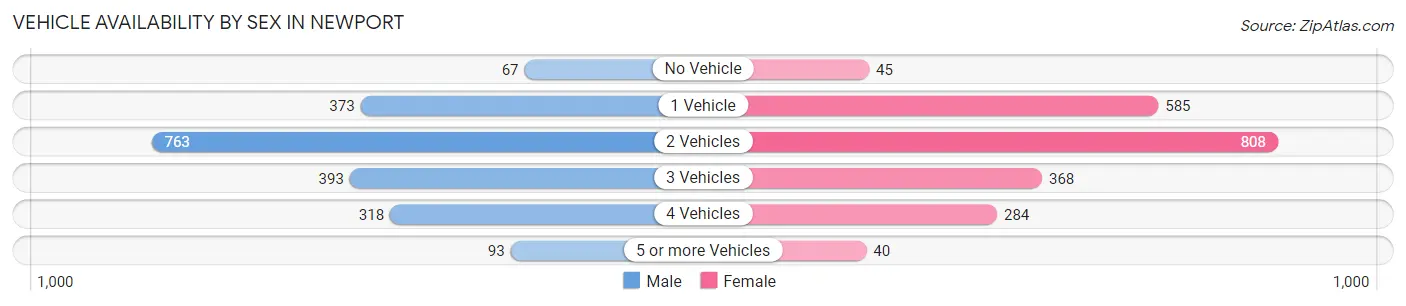
| Vehicles Available | Male | Female |
| No Vehicle | 67 (3.3%) | 45 (2.1%) |
| 1 Vehicle | 373 (18.6%) | 585 (27.5%) |
| 2 Vehicles | 763 (38.0%) | 808 (37.9%) |
| 3 Vehicles | 393 (19.6%) | 368 (17.3%) |
| 4 Vehicles | 318 (15.8%) | 284 (13.3%) |
| 5 or more Vehicles | 93 (4.6%) | 40 (1.9%) |
| Total | 2,007 (100.0%) | 2,130 (100.0%) |
Commute Time in Newport
The most frequently occuring commute durations in Newport are 5 to 9 minutes (1,128 commuters, 30.2%), 10 to 14 minutes (996 commuters, 26.7%), and 15 to 19 minutes (345 commuters, 9.2%).
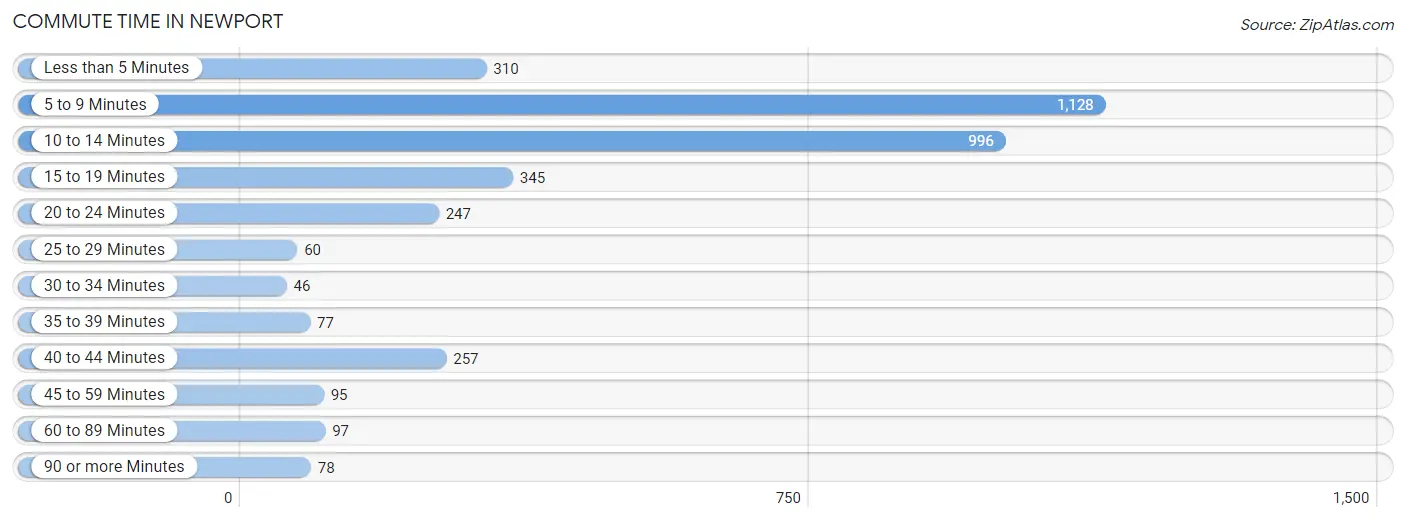
| Commute Time | # Commuters | % Commuters |
| Less than 5 Minutes | 310 | 8.3% |
| 5 to 9 Minutes | 1,128 | 30.2% |
| 10 to 14 Minutes | 996 | 26.7% |
| 15 to 19 Minutes | 345 | 9.2% |
| 20 to 24 Minutes | 247 | 6.6% |
| 25 to 29 Minutes | 60 | 1.6% |
| 30 to 34 Minutes | 46 | 1.2% |
| 35 to 39 Minutes | 77 | 2.1% |
| 40 to 44 Minutes | 257 | 6.9% |
| 45 to 59 Minutes | 95 | 2.5% |
| 60 to 89 Minutes | 97 | 2.6% |
| 90 or more Minutes | 78 | 2.1% |
Commute Time by Sex in Newport
The most common commute times in Newport are 5 to 9 minutes (612 commuters, 32.6%) for males and 10 to 14 minutes (538 commuters, 29.0%) for females.
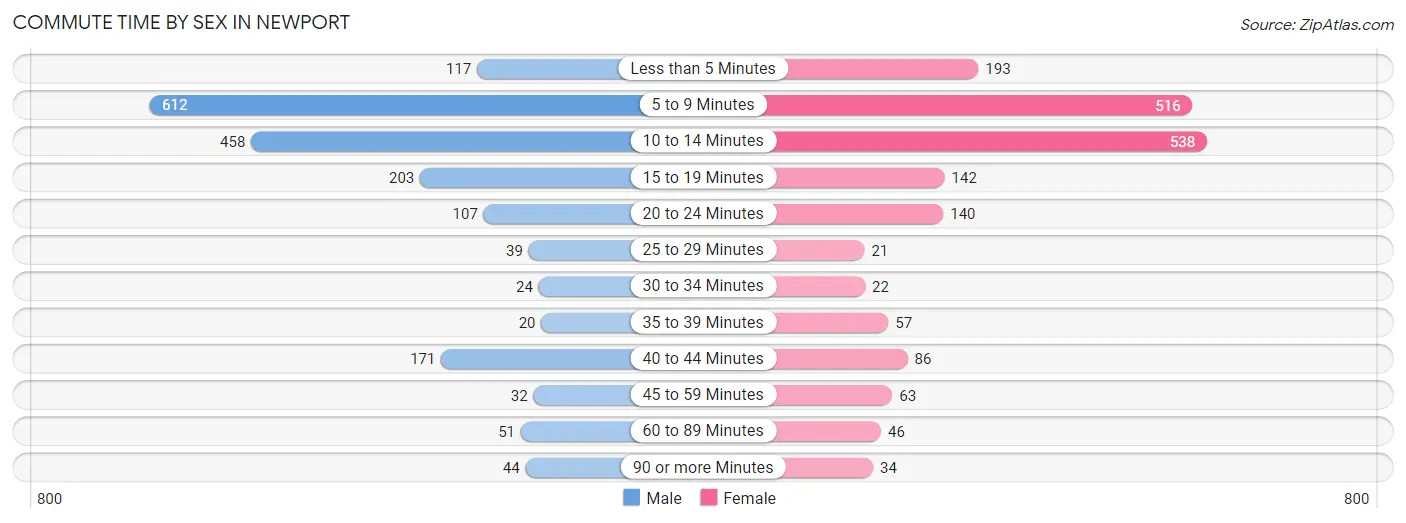
| Commute Time | Male | Female |
| Less than 5 Minutes | 117 (6.2%) | 193 (10.4%) |
| 5 to 9 Minutes | 612 (32.6%) | 516 (27.8%) |
| 10 to 14 Minutes | 458 (24.4%) | 538 (29.0%) |
| 15 to 19 Minutes | 203 (10.8%) | 142 (7.6%) |
| 20 to 24 Minutes | 107 (5.7%) | 140 (7.5%) |
| 25 to 29 Minutes | 39 (2.1%) | 21 (1.1%) |
| 30 to 34 Minutes | 24 (1.3%) | 22 (1.2%) |
| 35 to 39 Minutes | 20 (1.1%) | 57 (3.1%) |
| 40 to 44 Minutes | 171 (9.1%) | 86 (4.6%) |
| 45 to 59 Minutes | 32 (1.7%) | 63 (3.4%) |
| 60 to 89 Minutes | 51 (2.7%) | 46 (2.5%) |
| 90 or more Minutes | 44 (2.3%) | 34 (1.8%) |
Time of Departure to Work by Sex in Newport
The most frequent times of departure to work in Newport are 8:00 AM to 8:29 AM (335, 17.8%) for males and 8:30 AM to 8:59 AM (329, 17.7%) for females.
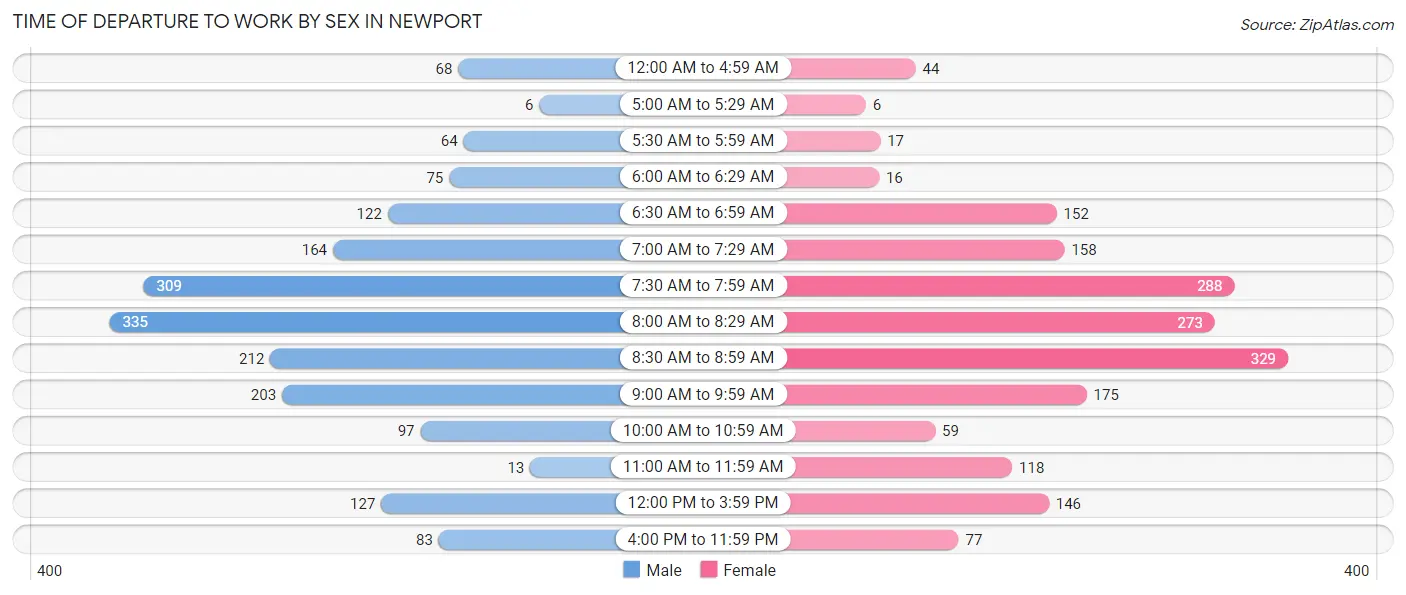
| Time of Departure | Male | Female |
| 12:00 AM to 4:59 AM | 68 (3.6%) | 44 (2.4%) |
| 5:00 AM to 5:29 AM | 6 (0.3%) | 6 (0.3%) |
| 5:30 AM to 5:59 AM | 64 (3.4%) | 17 (0.9%) |
| 6:00 AM to 6:29 AM | 75 (4.0%) | 16 (0.9%) |
| 6:30 AM to 6:59 AM | 122 (6.5%) | 152 (8.2%) |
| 7:00 AM to 7:29 AM | 164 (8.7%) | 158 (8.5%) |
| 7:30 AM to 7:59 AM | 309 (16.5%) | 288 (15.5%) |
| 8:00 AM to 8:29 AM | 335 (17.8%) | 273 (14.7%) |
| 8:30 AM to 8:59 AM | 212 (11.3%) | 329 (17.7%) |
| 9:00 AM to 9:59 AM | 203 (10.8%) | 175 (9.4%) |
| 10:00 AM to 10:59 AM | 97 (5.2%) | 59 (3.2%) |
| 11:00 AM to 11:59 AM | 13 (0.7%) | 118 (6.4%) |
| 12:00 PM to 3:59 PM | 127 (6.8%) | 146 (7.9%) |
| 4:00 PM to 11:59 PM | 83 (4.4%) | 77 (4.1%) |
| Total | 1,878 (100.0%) | 1,858 (100.0%) |
Housing Occupancy in Newport
Occupancy by Ownership in Newport
Of the total 4,551 dwellings in Newport, owner-occupied units account for 2,801 (61.6%), while renter-occupied units make up 1,750 (38.5%).
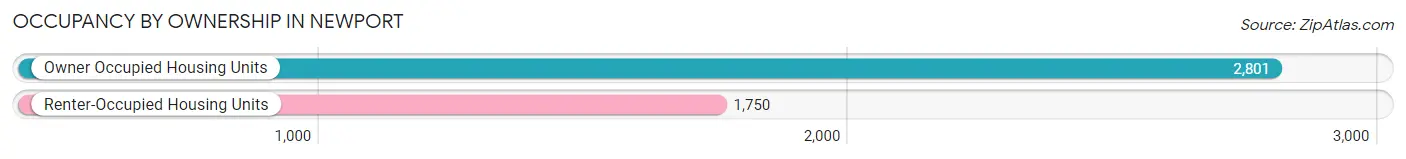
| Occupancy | # Housing Units | % Housing Units |
| Owner Occupied Housing Units | 2,801 | 61.6% |
| Renter-Occupied Housing Units | 1,750 | 38.5% |
| Total Occupied Housing Units | 4,551 | 100.0% |
Occupancy by Household Size in Newport
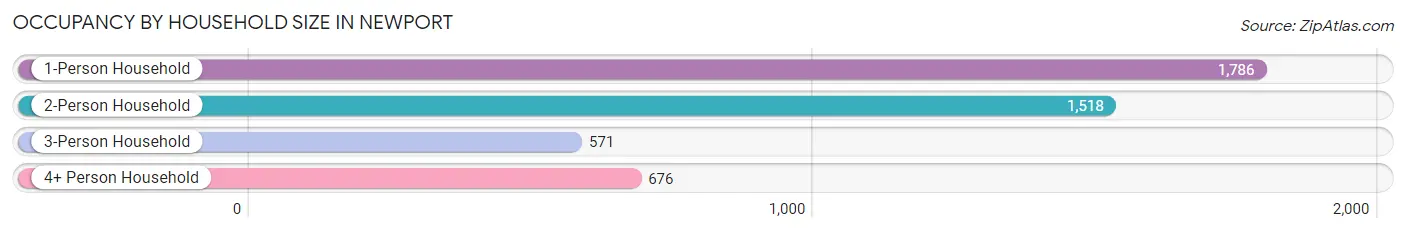
| Household Size | # Housing Units | % Housing Units |
| 1-Person Household | 1,786 | 39.2% |
| 2-Person Household | 1,518 | 33.4% |
| 3-Person Household | 571 | 12.6% |
| 4+ Person Household | 676 | 14.8% |
| Total Housing Units | 4,551 | 100.0% |
Occupancy by Ownership by Household Size in Newport
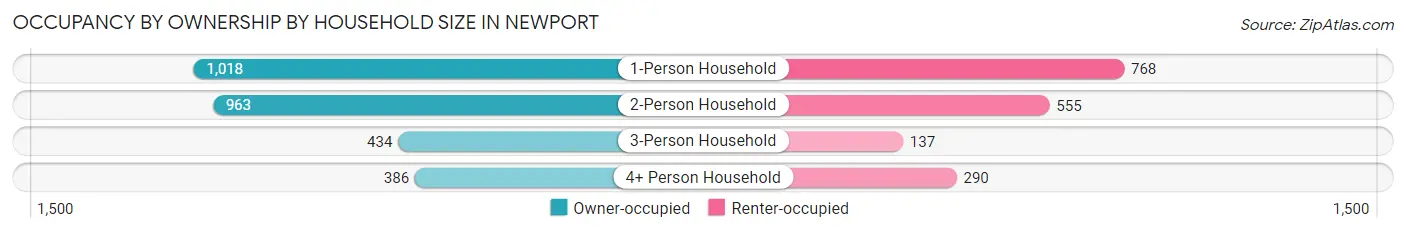
| Household Size | Owner-occupied | Renter-occupied |
| 1-Person Household | 1,018 (57.0%) | 768 (43.0%) |
| 2-Person Household | 963 (63.4%) | 555 (36.6%) |
| 3-Person Household | 434 (76.0%) | 137 (24.0%) |
| 4+ Person Household | 386 (57.1%) | 290 (42.9%) |
| Total Housing Units | 2,801 (61.6%) | 1,750 (38.5%) |
Occupancy by Educational Attainment in Newport
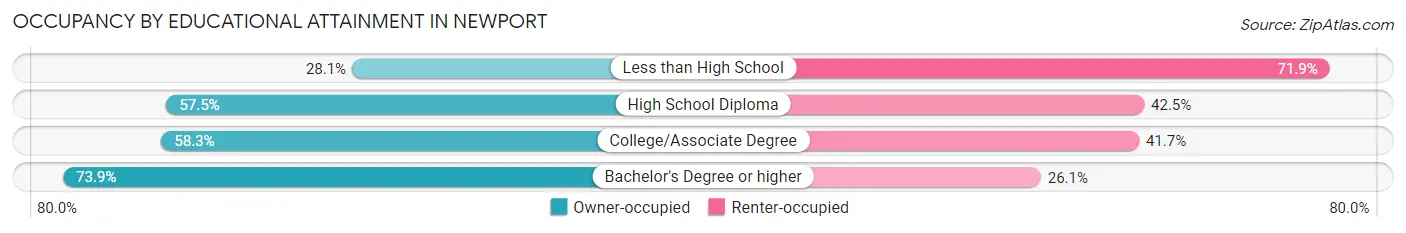
| Household Size | Owner-occupied | Renter-occupied |
| Less than High School | 82 (28.1%) | 210 (71.9%) |
| High School Diploma | 506 (57.5%) | 374 (42.5%) |
| College/Associate Degree | 1,061 (58.3%) | 759 (41.7%) |
| Bachelor's Degree or higher | 1,152 (73.9%) | 407 (26.1%) |
Occupancy by Age of Householder in Newport
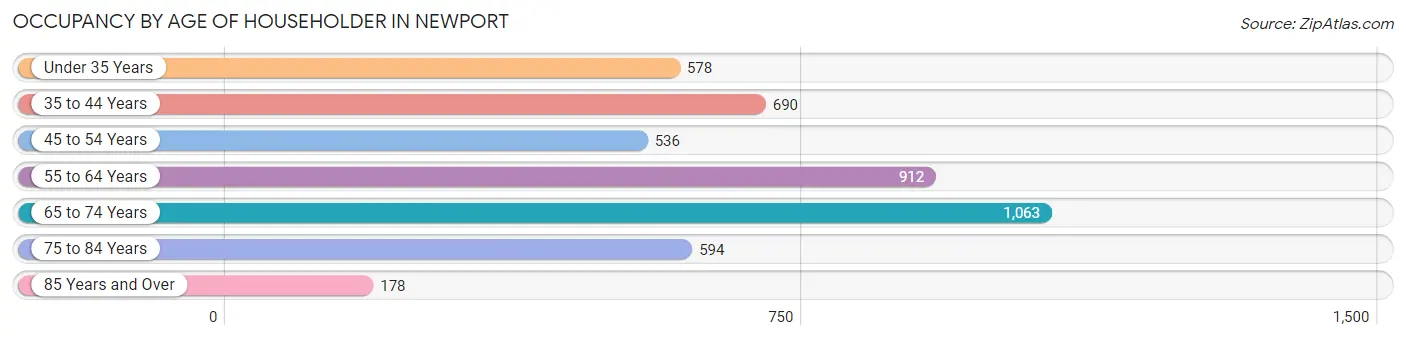
| Age Bracket | # Households | % Households |
| Under 35 Years | 578 | 12.7% |
| 35 to 44 Years | 690 | 15.2% |
| 45 to 54 Years | 536 | 11.8% |
| 55 to 64 Years | 912 | 20.0% |
| 65 to 74 Years | 1,063 | 23.4% |
| 75 to 84 Years | 594 | 13.1% |
| 85 Years and Over | 178 | 3.9% |
| Total | 4,551 | 100.0% |
Housing Finances in Newport
Median Income by Occupancy in Newport
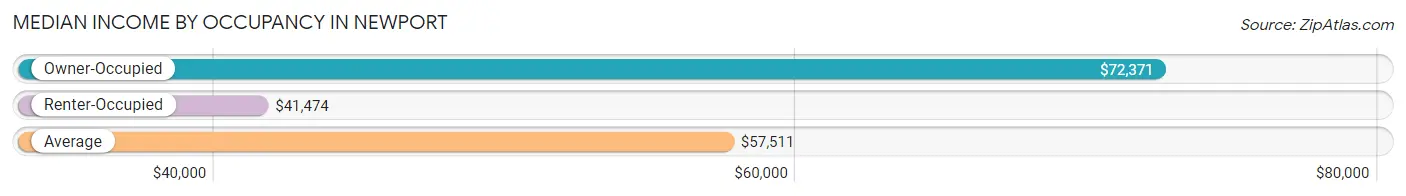
| Occupancy Type | # Households | Median Income |
| Owner-Occupied | 2,801 (61.6%) | $72,371 |
| Renter-Occupied | 1,750 (38.5%) | $41,474 |
| Average | 4,551 (100.0%) | $57,511 |
Occupancy by Householder Income Bracket in Newport
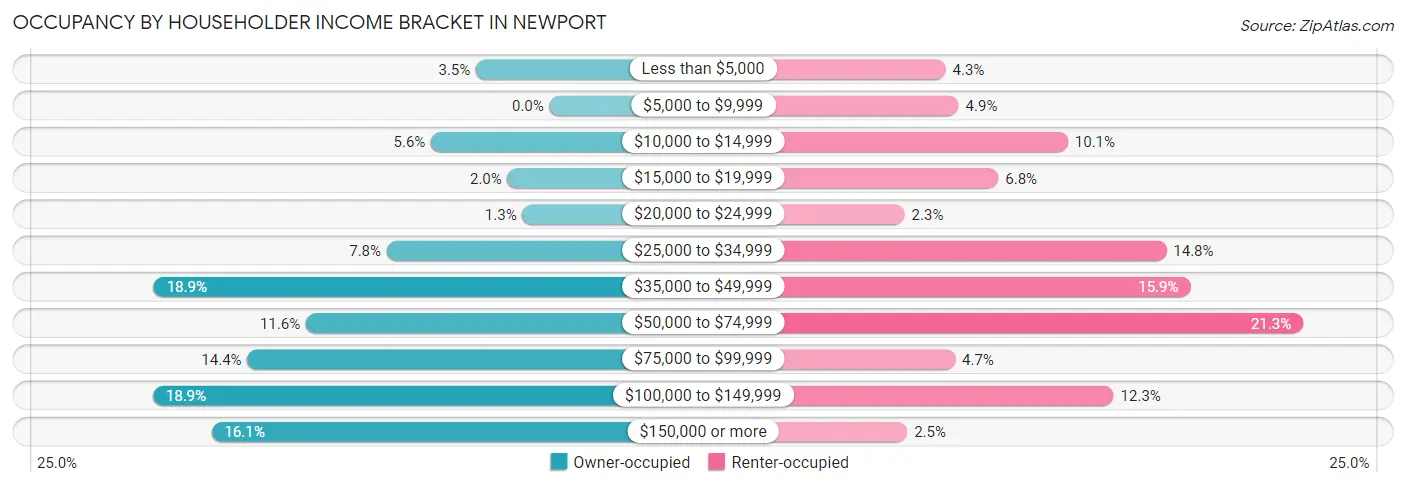
| Income Bracket | Owner-occupied | Renter-occupied |
| Less than $5,000 | 98 (3.5%) | 75 (4.3%) |
| $5,000 to $9,999 | 0 (0.0%) | 86 (4.9%) |
| $10,000 to $14,999 | 158 (5.6%) | 177 (10.1%) |
| $15,000 to $19,999 | 56 (2.0%) | 119 (6.8%) |
| $20,000 to $24,999 | 36 (1.3%) | 41 (2.3%) |
| $25,000 to $34,999 | 217 (7.7%) | 259 (14.8%) |
| $35,000 to $49,999 | 528 (18.9%) | 279 (15.9%) |
| $50,000 to $74,999 | 325 (11.6%) | 373 (21.3%) |
| $75,000 to $99,999 | 403 (14.4%) | 83 (4.7%) |
| $100,000 to $149,999 | 529 (18.9%) | 215 (12.3%) |
| $150,000 or more | 451 (16.1%) | 43 (2.5%) |
| Total | 2,801 (100.0%) | 1,750 (100.0%) |
Monthly Housing Cost Tiers in Newport
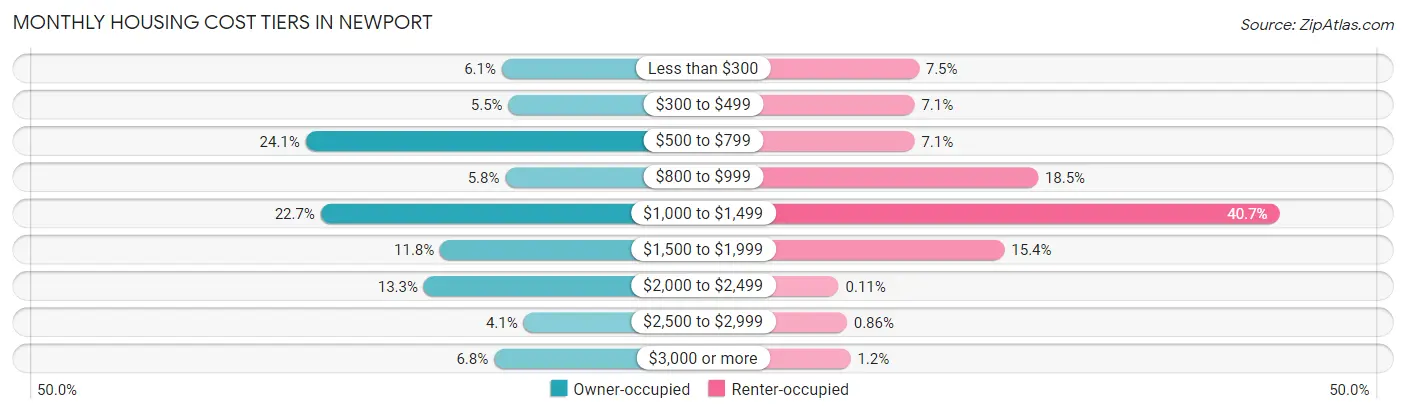
| Monthly Cost | Owner-occupied | Renter-occupied |
| Less than $300 | 170 (6.1%) | 131 (7.5%) |
| $300 to $499 | 153 (5.5%) | 124 (7.1%) |
| $500 to $799 | 676 (24.1%) | 124 (7.1%) |
| $800 to $999 | 161 (5.8%) | 323 (18.5%) |
| $1,000 to $1,499 | 637 (22.7%) | 712 (40.7%) |
| $1,500 to $1,999 | 329 (11.7%) | 269 (15.4%) |
| $2,000 to $2,499 | 371 (13.3%) | 2 (0.1%) |
| $2,500 to $2,999 | 114 (4.1%) | 15 (0.9%) |
| $3,000 or more | 190 (6.8%) | 21 (1.2%) |
| Total | 2,801 (100.0%) | 1,750 (100.0%) |
Physical Housing Characteristics in Newport
Housing Structures in Newport
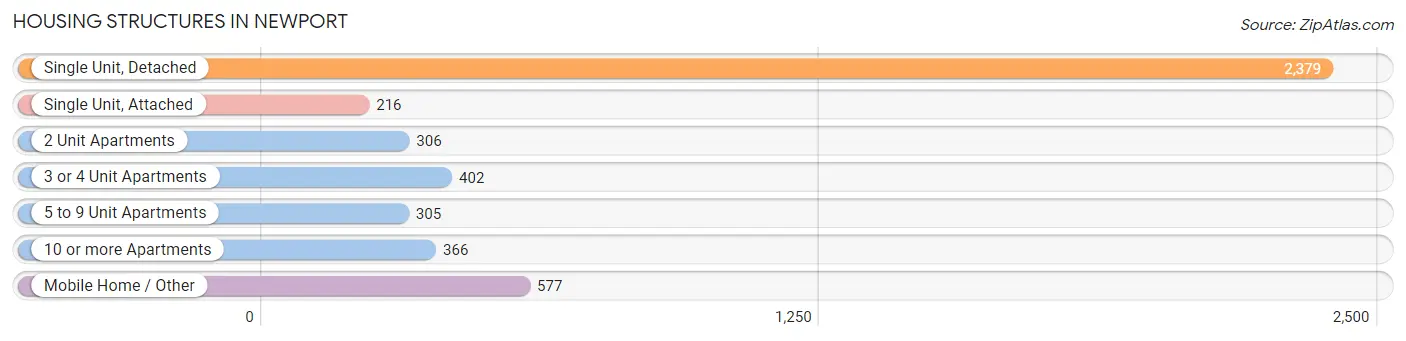
| Structure Type | # Housing Units | % Housing Units |
| Single Unit, Detached | 2,379 | 52.3% |
| Single Unit, Attached | 216 | 4.8% |
| 2 Unit Apartments | 306 | 6.7% |
| 3 or 4 Unit Apartments | 402 | 8.8% |
| 5 to 9 Unit Apartments | 305 | 6.7% |
| 10 or more Apartments | 366 | 8.0% |
| Mobile Home / Other | 577 | 12.7% |
| Total | 4,551 | 100.0% |
Housing Structures by Occupancy in Newport
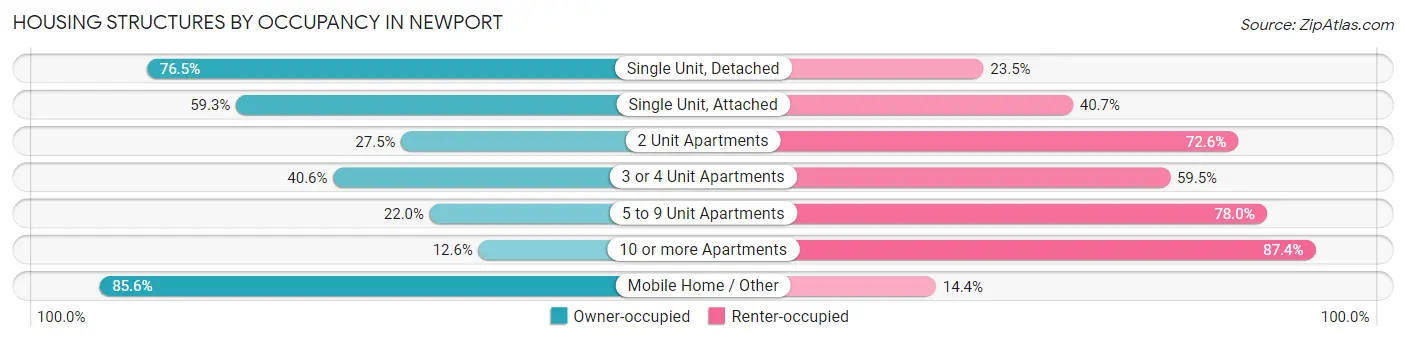
| Structure Type | Owner-occupied | Renter-occupied |
| Single Unit, Detached | 1,819 (76.5%) | 560 (23.5%) |
| Single Unit, Attached | 128 (59.3%) | 88 (40.7%) |
| 2 Unit Apartments | 84 (27.5%) | 222 (72.6%) |
| 3 or 4 Unit Apartments | 163 (40.6%) | 239 (59.5%) |
| 5 to 9 Unit Apartments | 67 (22.0%) | 238 (78.0%) |
| 10 or more Apartments | 46 (12.6%) | 320 (87.4%) |
| Mobile Home / Other | 494 (85.6%) | 83 (14.4%) |
| Total | 2,801 (61.6%) | 1,750 (38.5%) |
Housing Structures by Number of Rooms in Newport
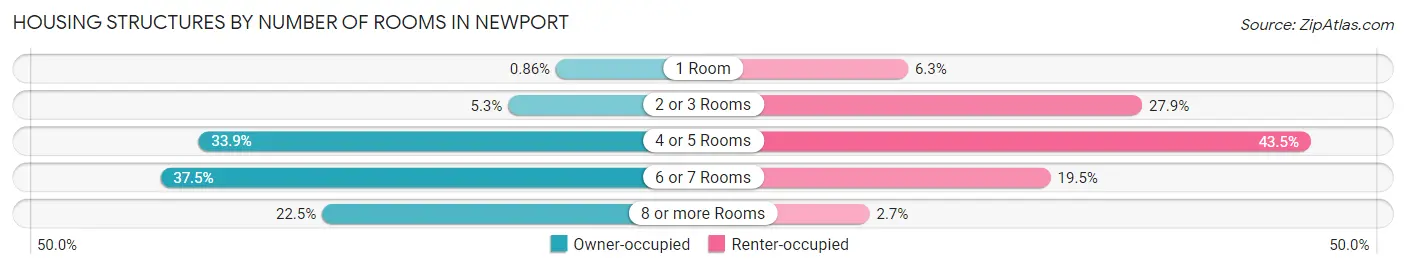
| Number of Rooms | Owner-occupied | Renter-occupied |
| 1 Room | 24 (0.9%) | 110 (6.3%) |
| 2 or 3 Rooms | 148 (5.3%) | 489 (27.9%) |
| 4 or 5 Rooms | 950 (33.9%) | 762 (43.5%) |
| 6 or 7 Rooms | 1,049 (37.4%) | 341 (19.5%) |
| 8 or more Rooms | 630 (22.5%) | 48 (2.7%) |
| Total | 2,801 (100.0%) | 1,750 (100.0%) |
Housing Structure by Heating Type in Newport

| Heating Type | Owner-occupied | Renter-occupied |
| Utility Gas | 997 (35.6%) | 195 (11.1%) |
| Bottled, Tank, or LP Gas | 21 (0.7%) | 20 (1.1%) |
| Electricity | 1,670 (59.6%) | 1,517 (86.7%) |
| Fuel Oil or Kerosene | 5 (0.2%) | 0 (0.0%) |
| Coal or Coke | 0 (0.0%) | 0 (0.0%) |
| All other Fuels | 100 (3.6%) | 0 (0.0%) |
| No Fuel Used | 8 (0.3%) | 18 (1.0%) |
| Total | 2,801 (100.0%) | 1,750 (100.0%) |
Household Vehicle Usage in Newport
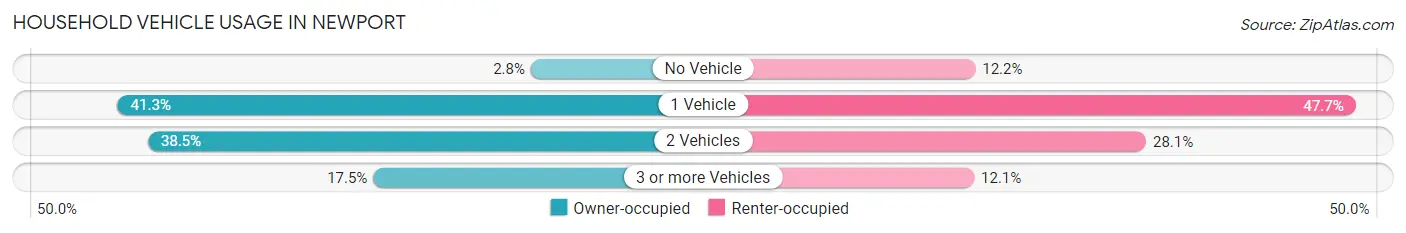
| Vehicles per Household | Owner-occupied | Renter-occupied |
| No Vehicle | 77 (2.8%) | 213 (12.2%) |
| 1 Vehicle | 1,157 (41.3%) | 834 (47.7%) |
| 2 Vehicles | 1,078 (38.5%) | 492 (28.1%) |
| 3 or more Vehicles | 489 (17.5%) | 211 (12.1%) |
| Total | 2,801 (100.0%) | 1,750 (100.0%) |
Real Estate & Mortgages in Newport
Real Estate and Mortgage Overview in Newport
| Characteristic | Without Mortgage | With Mortgage |
| Housing Units | 1,366 | 1,435 |
| Median Property Value | $341,300 | $392,500 |
| Median Household Income | $49,926 | $251 |
| Monthly Housing Costs | $707 | $190 |
| Real Estate Taxes | $3,859 | $6 |
Property Value by Mortgage Status in Newport
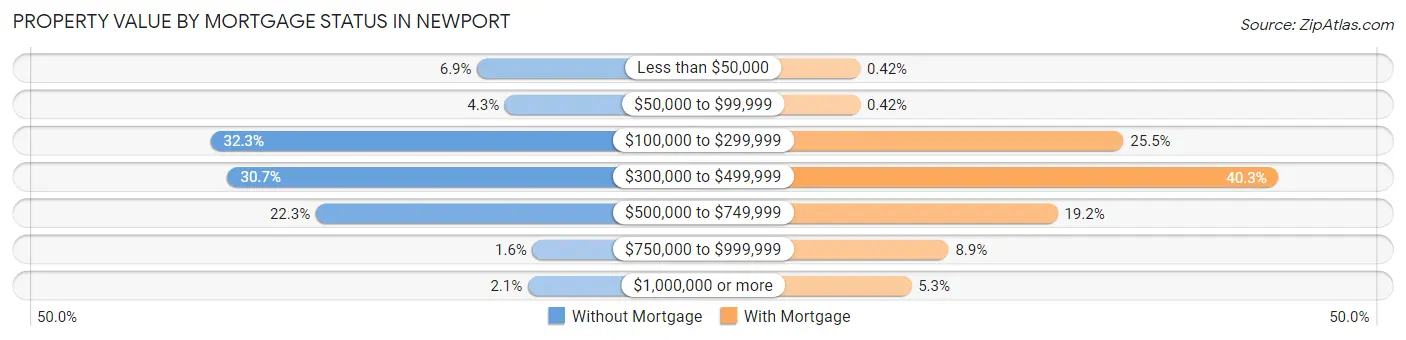
| Property Value | Without Mortgage | With Mortgage |
| Less than $50,000 | 94 (6.9%) | 6 (0.4%) |
| $50,000 to $99,999 | 58 (4.3%) | 6 (0.4%) |
| $100,000 to $299,999 | 441 (32.3%) | 366 (25.5%) |
| $300,000 to $499,999 | 419 (30.7%) | 578 (40.3%) |
| $500,000 to $749,999 | 304 (22.3%) | 276 (19.2%) |
| $750,000 to $999,999 | 22 (1.6%) | 127 (8.8%) |
| $1,000,000 or more | 28 (2.1%) | 76 (5.3%) |
| Total | 1,366 (100.0%) | 1,435 (100.0%) |
Household Income by Mortgage Status in Newport
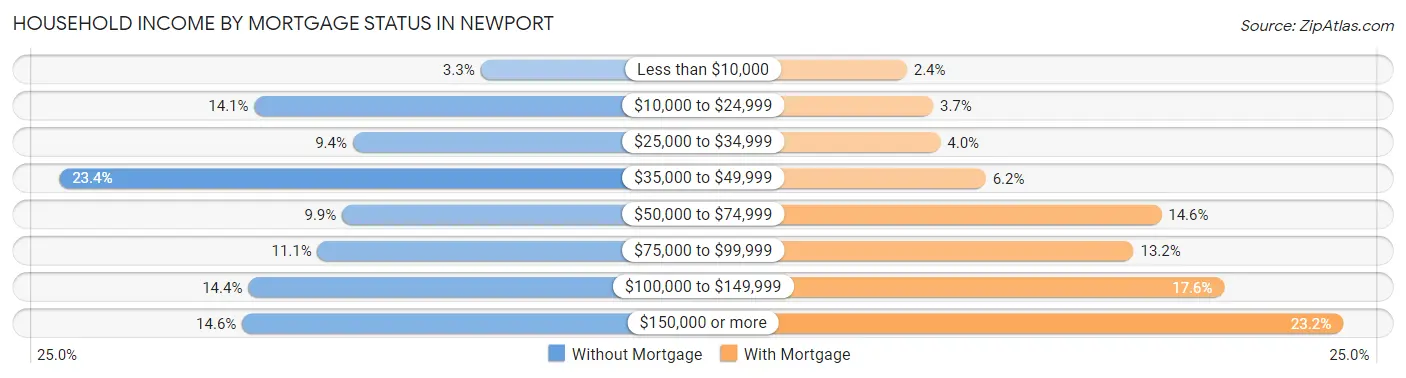
| Household Income | Without Mortgage | With Mortgage |
| Less than $10,000 | 45 (3.3%) | 35 (2.4%) |
| $10,000 to $24,999 | 192 (14.1%) | 53 (3.7%) |
| $25,000 to $34,999 | 128 (9.4%) | 58 (4.0%) |
| $35,000 to $49,999 | 319 (23.4%) | 89 (6.2%) |
| $50,000 to $74,999 | 135 (9.9%) | 209 (14.6%) |
| $75,000 to $99,999 | 151 (11.1%) | 190 (13.2%) |
| $100,000 to $149,999 | 196 (14.3%) | 252 (17.6%) |
| $150,000 or more | 200 (14.6%) | 333 (23.2%) |
| Total | 1,366 (100.0%) | 1,435 (100.0%) |
Property Value to Household Income Ratio in Newport
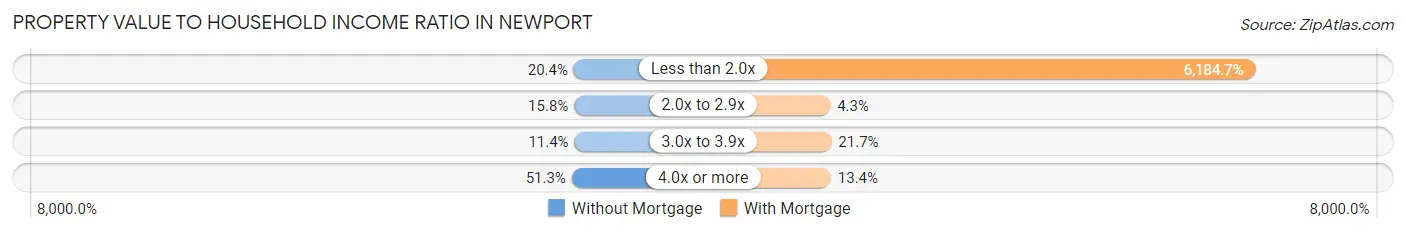
| Value-to-Income Ratio | Without Mortgage | With Mortgage |
| Less than 2.0x | 278 (20.3%) | 88,750 (6,184.7%) |
| 2.0x to 2.9x | 216 (15.8%) | 61 (4.3%) |
| 3.0x to 3.9x | 155 (11.4%) | 311 (21.7%) |
| 4.0x or more | 701 (51.3%) | 192 (13.4%) |
| Total | 1,366 (100.0%) | 1,435 (100.0%) |
Real Estate Taxes by Mortgage Status in Newport
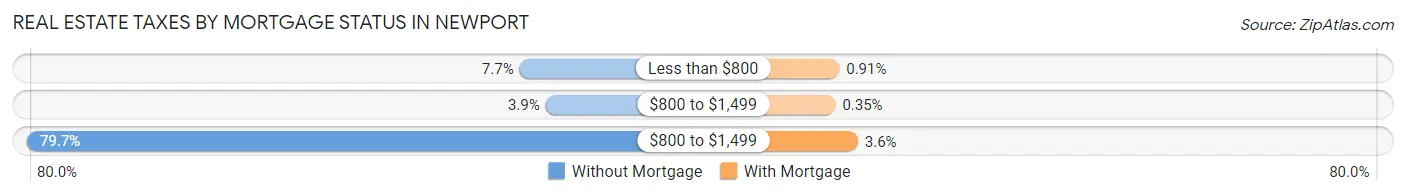
| Property Taxes | Without Mortgage | With Mortgage |
| Less than $800 | 105 (7.7%) | 13 (0.9%) |
| $800 to $1,499 | 53 (3.9%) | 5 (0.4%) |
| $800 to $1,499 | 1,088 (79.6%) | 52 (3.6%) |
| Total | 1,366 (100.0%) | 1,435 (100.0%) |
Health & Disability in Newport
Health Insurance Coverage by Age in Newport
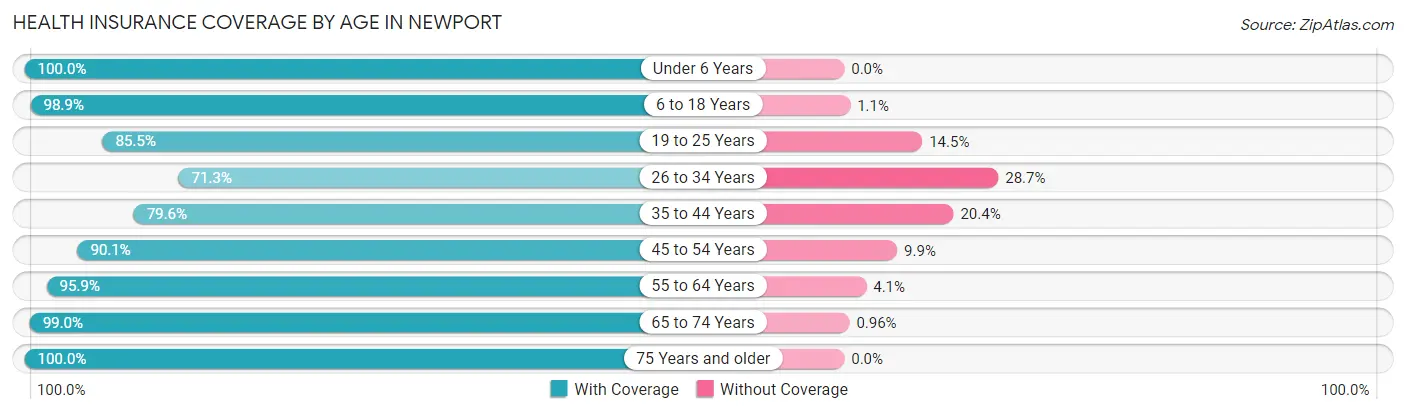
| Age Bracket | With Coverage | Without Coverage |
| Under 6 Years | 462 (100.0%) | 0 (0.0%) |
| 6 to 18 Years | 1,423 (98.9%) | 16 (1.1%) |
| 19 to 25 Years | 612 (85.5%) | 104 (14.5%) |
| 26 to 34 Years | 598 (71.3%) | 241 (28.7%) |
| 35 to 44 Years | 1,056 (79.6%) | 270 (20.4%) |
| 45 to 54 Years | 905 (90.1%) | 99 (9.9%) |
| 55 to 64 Years | 1,332 (95.9%) | 57 (4.1%) |
| 65 to 74 Years | 1,658 (99.0%) | 16 (1.0%) |
| 75 Years and older | 1,224 (100.0%) | 0 (0.0%) |
| Total | 9,270 (92.0%) | 803 (8.0%) |
Health Insurance Coverage by Citizenship Status in Newport
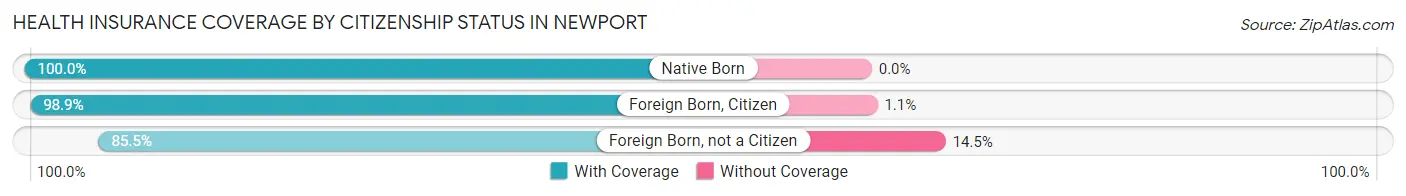
| Citizenship Status | With Coverage | Without Coverage |
| Native Born | 462 (100.0%) | 0 (0.0%) |
| Foreign Born, Citizen | 1,423 (98.9%) | 16 (1.1%) |
| Foreign Born, not a Citizen | 612 (85.5%) | 104 (14.5%) |
Health Insurance Coverage by Household Income in Newport
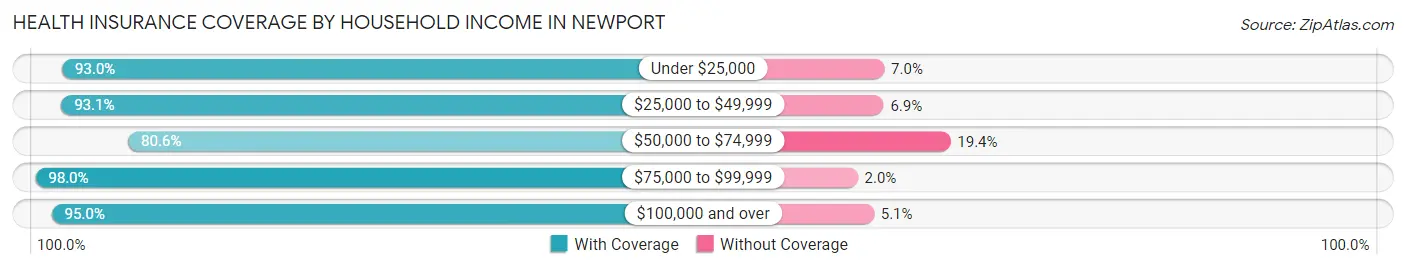
| Household Income | With Coverage | Without Coverage |
| Under $25,000 | 1,089 (93.0%) | 82 (7.0%) |
| $25,000 to $49,999 | 2,128 (93.1%) | 157 (6.9%) |
| $50,000 to $74,999 | 1,512 (80.6%) | 364 (19.4%) |
| $75,000 to $99,999 | 1,163 (98.0%) | 24 (2.0%) |
| $100,000 and over | 3,312 (95.0%) | 176 (5.1%) |
Public vs Private Health Insurance Coverage by Age in Newport
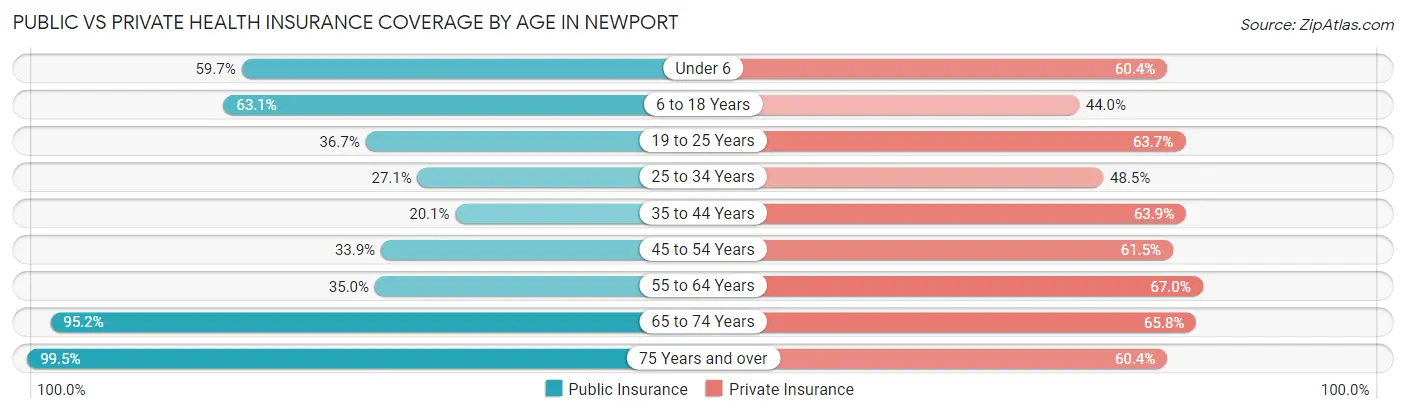
| Age Bracket | Public Insurance | Private Insurance |
| Under 6 | 276 (59.7%) | 279 (60.4%) |
| 6 to 18 Years | 908 (63.1%) | 633 (44.0%) |
| 19 to 25 Years | 263 (36.7%) | 456 (63.7%) |
| 25 to 34 Years | 227 (27.1%) | 407 (48.5%) |
| 35 to 44 Years | 266 (20.1%) | 847 (63.9%) |
| 45 to 54 Years | 340 (33.9%) | 617 (61.5%) |
| 55 to 64 Years | 486 (35.0%) | 930 (66.9%) |
| 65 to 74 Years | 1,594 (95.2%) | 1,101 (65.8%) |
| 75 Years and over | 1,218 (99.5%) | 739 (60.4%) |
| Total | 5,578 (55.4%) | 6,009 (59.7%) |
Disability Status by Sex by Age in Newport
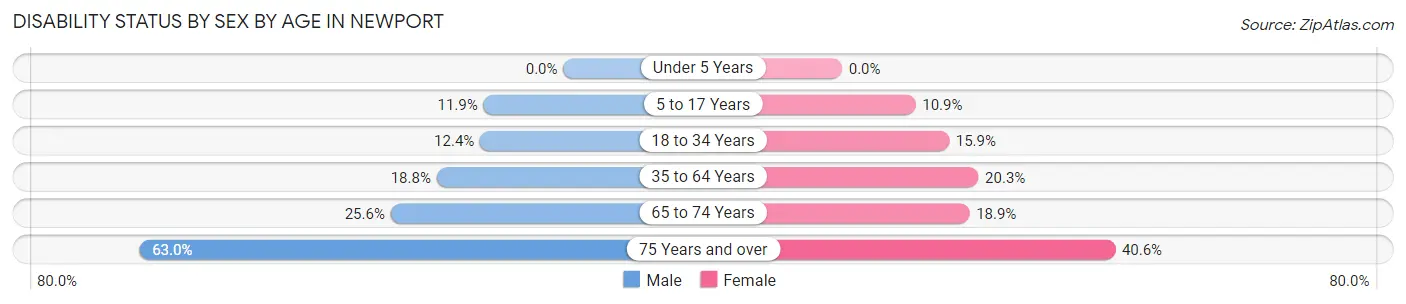
| Age Bracket | Male | Female |
| Under 5 Years | 0 (0.0%) | 0 (0.0%) |
| 5 to 17 Years | 87 (11.8%) | 61 (10.9%) |
| 18 to 34 Years | 110 (12.3%) | 139 (15.9%) |
| 35 to 64 Years | 326 (18.8%) | 402 (20.3%) |
| 65 to 74 Years | 173 (25.6%) | 189 (18.9%) |
| 75 Years and over | 347 (63.0%) | 273 (40.6%) |
Disability Class by Sex by Age in Newport
Disability Class: Hearing Difficulty
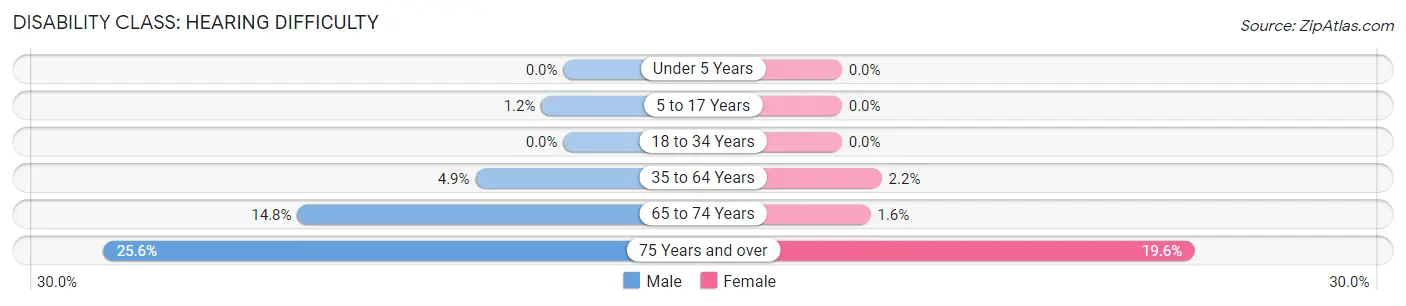
| Age Bracket | Male | Female |
| Under 5 Years | 0 (0.0%) | 0 (0.0%) |
| 5 to 17 Years | 9 (1.2%) | 0 (0.0%) |
| 18 to 34 Years | 0 (0.0%) | 0 (0.0%) |
| 35 to 64 Years | 85 (4.9%) | 44 (2.2%) |
| 65 to 74 Years | 100 (14.8%) | 16 (1.6%) |
| 75 Years and over | 141 (25.6%) | 132 (19.6%) |
Disability Class: Vision Difficulty
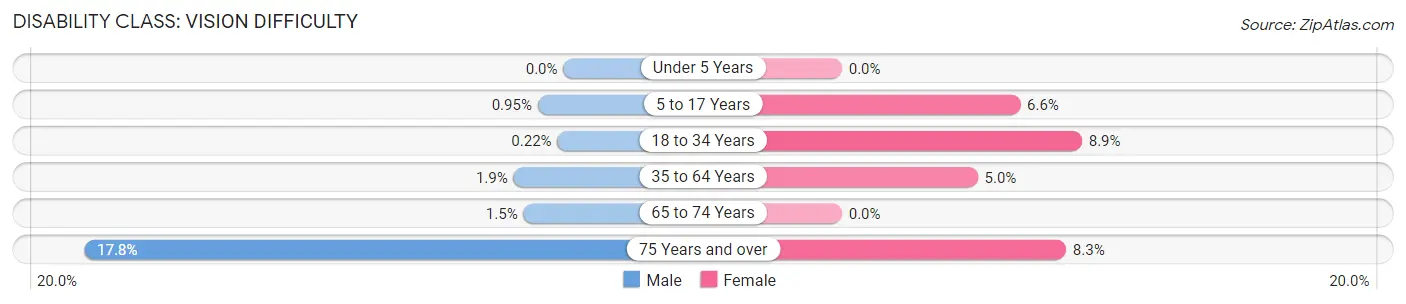
| Age Bracket | Male | Female |
| Under 5 Years | 0 (0.0%) | 0 (0.0%) |
| 5 to 17 Years | 7 (0.9%) | 37 (6.6%) |
| 18 to 34 Years | 2 (0.2%) | 78 (8.9%) |
| 35 to 64 Years | 32 (1.8%) | 100 (5.0%) |
| 65 to 74 Years | 10 (1.5%) | 0 (0.0%) |
| 75 Years and over | 98 (17.8%) | 56 (8.3%) |
Disability Class: Cognitive Difficulty
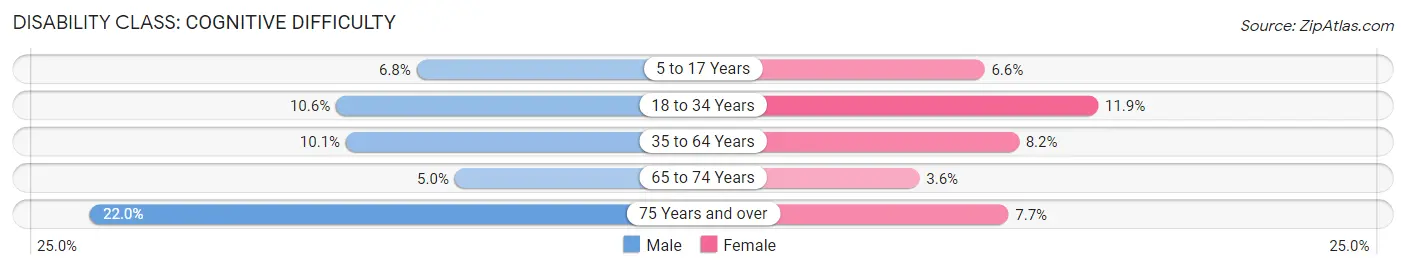
| Age Bracket | Male | Female |
| 5 to 17 Years | 50 (6.8%) | 37 (6.6%) |
| 18 to 34 Years | 94 (10.5%) | 104 (11.9%) |
| 35 to 64 Years | 175 (10.1%) | 163 (8.2%) |
| 65 to 74 Years | 34 (5.0%) | 36 (3.6%) |
| 75 Years and over | 121 (22.0%) | 52 (7.7%) |
Disability Class: Ambulatory Difficulty
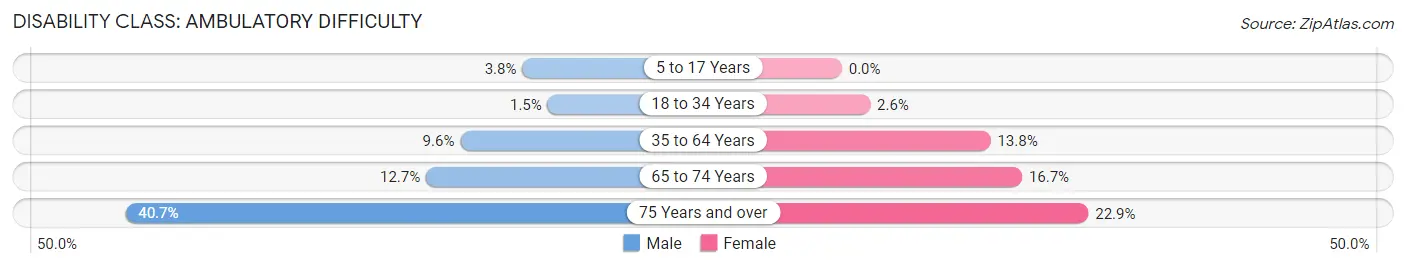
| Age Bracket | Male | Female |
| 5 to 17 Years | 28 (3.8%) | 0 (0.0%) |
| 18 to 34 Years | 13 (1.5%) | 23 (2.6%) |
| 35 to 64 Years | 166 (9.6%) | 274 (13.8%) |
| 65 to 74 Years | 86 (12.7%) | 167 (16.7%) |
| 75 Years and over | 224 (40.6%) | 154 (22.9%) |
Disability Class: Self-Care Difficulty
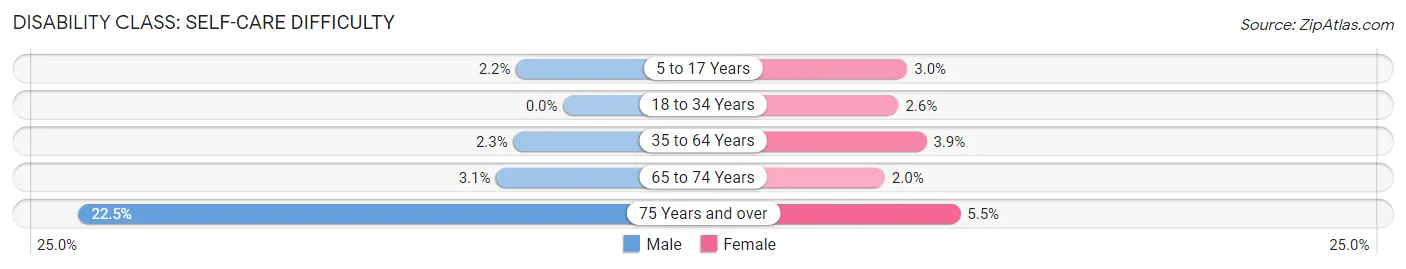
| Age Bracket | Male | Female |
| 5 to 17 Years | 16 (2.2%) | 17 (3.0%) |
| 18 to 34 Years | 0 (0.0%) | 23 (2.6%) |
| 35 to 64 Years | 40 (2.3%) | 78 (3.9%) |
| 65 to 74 Years | 21 (3.1%) | 20 (2.0%) |
| 75 Years and over | 124 (22.5%) | 37 (5.5%) |
Technology Access in Newport
Computing Device Access in Newport
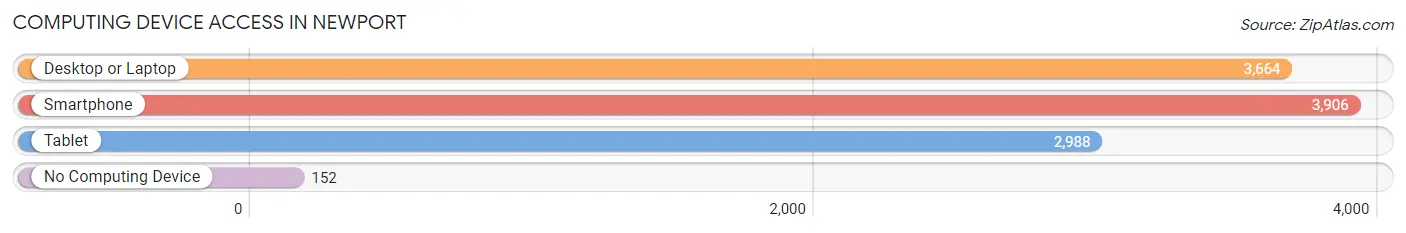
| Device Type | # Households | % Households |
| Desktop or Laptop | 3,664 | 80.5% |
| Smartphone | 3,906 | 85.8% |
| Tablet | 2,988 | 65.7% |
| No Computing Device | 152 | 3.3% |
| Total | 4,551 | 100.0% |
Internet Access in Newport
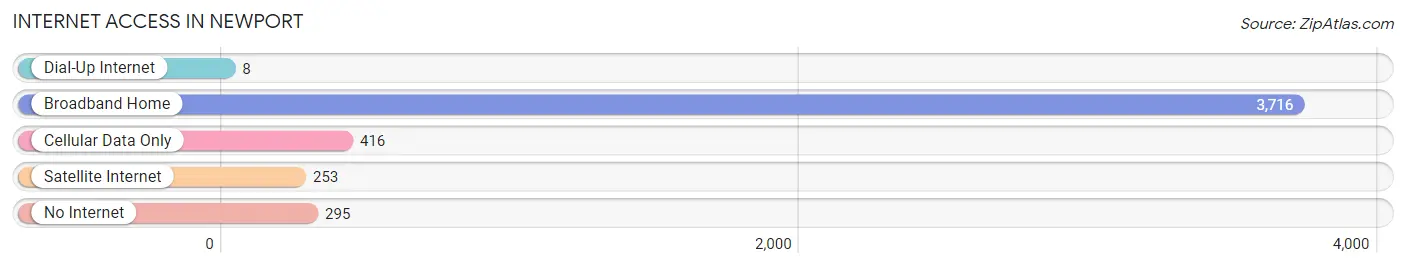
| Internet Type | # Households | % Households |
| Dial-Up Internet | 8 | 0.2% |
| Broadband Home | 3,716 | 81.7% |
| Cellular Data Only | 416 | 9.1% |
| Satellite Internet | 253 | 5.6% |
| No Internet | 295 | 6.5% |
| Total | 4,551 | 100.0% |
Newport Summary
Newport, Oregon is a coastal city located in Lincoln County, Oregon. It is the county seat and the largest city in the county. The city is situated on the central Oregon Coast, approximately 97 miles (156 km) west of Portland. The population of Newport was 9,989 at the 2010 census.
History
The area that is now Newport was first inhabited by the Siletz people, a Native American tribe. The first European settlers arrived in the area in the late 1840s. The city was officially incorporated in 1882.
In the late 19th century, Newport was a bustling port town, with a large fishing industry and a thriving lumber industry. The city was also a popular tourist destination, with many visitors coming to enjoy the beaches and the nearby Yaquina Bay Lighthouse.
In the early 20th century, Newport became a popular destination for sport fishing. The city was also home to a large canning industry, which processed fish and other seafood.
Geography
Newport is located on the central Oregon Coast, approximately 97 miles (156 km) west of Portland. The city is situated on the Yaquina Bay, which is part of the larger Yaquina Bay estuary. The city is surrounded by the Siletz Bay National Wildlife Refuge and the Yaquina Head Outstanding Natural Area.
The city has a total area of 8.3 square miles (21.5 km2), of which 8.2 square miles (21.3 km2) is land and 0.1 square miles (0.2 km2) is water.
Economy
The economy of Newport is largely based on tourism and fishing. The city is home to a large fishing fleet, which harvests a variety of seafood, including salmon, crab, and shrimp. The city is also home to a large canning industry, which processes fish and other seafood.
The city is also a popular tourist destination, with many visitors coming to enjoy the beaches and the nearby Yaquina Bay Lighthouse. The city is home to a variety of restaurants, shops, and other attractions.
Demographics
As of the 2010 census, the population of Newport was 9,989. The racial makeup of the city was 91.2% White, 0.7% African American, 1.2% Native American, 1.2% Asian, 0.2% Pacific Islander, 2.2% from other races, and 3.5% from two or more races. Hispanic or Latino of any race were 6.2% of the population.
The median income for a household in the city was $37,945, and the median income for a family was $45,945. The per capita income for the city was $20,945. About 11.2% of families and 14.2% of the population were below the poverty line, including 19.2% of those under age 18 and 8.2% of those age 65 or over.
Common Questions
What is Per Capita Income in Newport?
Per Capita income in Newport is $33,541.
What is the Median Family Income in Newport?
Median Family Income in Newport is $78,505.
What is the Median Household income in Newport?
Median Household Income in Newport is $57,511.
What is Income or Wage Gap in Newport?
Income or Wage Gap in Newport is 9.1%.
Women in Newport earn 90.9 cents for every dollar earned by a man.
What is Family Income Deficit in Newport?
Family Income Deficit in Newport is $11,268.
Families that are below poverty line in Newport earn $11,268 less on average than the poverty threshold level.
What is Inequality or Gini Index in Newport?
Inequality or Gini Index in Newport is 0.47.
What is the Total Population of Newport?
Total Population of Newport is 10,319.
What is the Total Male Population of Newport?
Total Male Population of Newport is 4,963.
What is the Total Female Population of Newport?
Total Female Population of Newport is 5,356.
What is the Ratio of Males per 100 Females in Newport?
There are 92.66 Males per 100 Females in Newport.
What is the Ratio of Females per 100 Males in Newport?
There are 107.92 Females per 100 Males in Newport.
What is the Median Population Age in Newport?
Median Population Age in Newport is 47.9 Years.
What is the Average Family Size in Newport
Average Family Size in Newport is 2.9 People.
What is the Average Household Size in Newport
Average Household Size in Newport is 2.2 People.
How Large is the Labor Force in Newport?
There are 4,530 People in the Labor Forcein in Newport.
What is the Percentage of People in the Labor Force in Newport?
51.4% of People are in the Labor Force in Newport.
What is the Unemployment Rate in Newport?
Unemployment Rate in Newport is 6.8%.