O Brien, OR Map & Demographics
O Brien Map
O Brien Overview
$18,201
PER CAPITA INCOME
$28,466
AVG HOUSEHOLD INCOME
0.39
INEQUALITY / GINI INDEX
619
TOTAL POPULATION
242
MALE POPULATION
377
FEMALE POPULATION
64.19
MALES / 100 FEMALES
155.79
FEMALES / 100 MALES
66.5
MEDIAN AGE
2.1
AVG FAMILY SIZE
1.9
AVG HOUSEHOLD SIZE
193
LABOR FORCE [ PEOPLE ]
31.2%
PERCENT IN LABOR FORCE
19.2%
UNEMPLOYMENT RATE
O Brien Zip Codes
O Brien Area Codes
Income in O Brien
Income Overview in O Brien
| Characteristic | Number | Measure |
| Per Capita Income | 619 | $18,201 |
| Median Family Income | 174 | $0 |
| Mean Family Income | 174 | $37,982 |
| Median Household Income | 334 | $28,466 |
| Mean Household Income | 334 | $34,692 |
| Income Deficit | 174 | $0 |
| Wage / Income Gap (%) | 619 | 0.00% |
| Wage / Income Gap ($) | 619 | 100.00¢ per $1 |
| Gini / Inequality Index | 619 | 0.39 |
Earnings by Sex in O Brien
| Sex | Number | Average Earnings |
| Male | 63 (40.4%) | $0 |
| Female | 93 (59.6%) | $0 |
| Total | 156 (100.0%) | $0 |
Earnings by Sex by Income Bracket in O Brien
The most common earnings brackets in O Brien are $12,500 to $14,999 for men (48 | 76.2%) and $5,000 to $7,499 for women (44 | 47.3%).
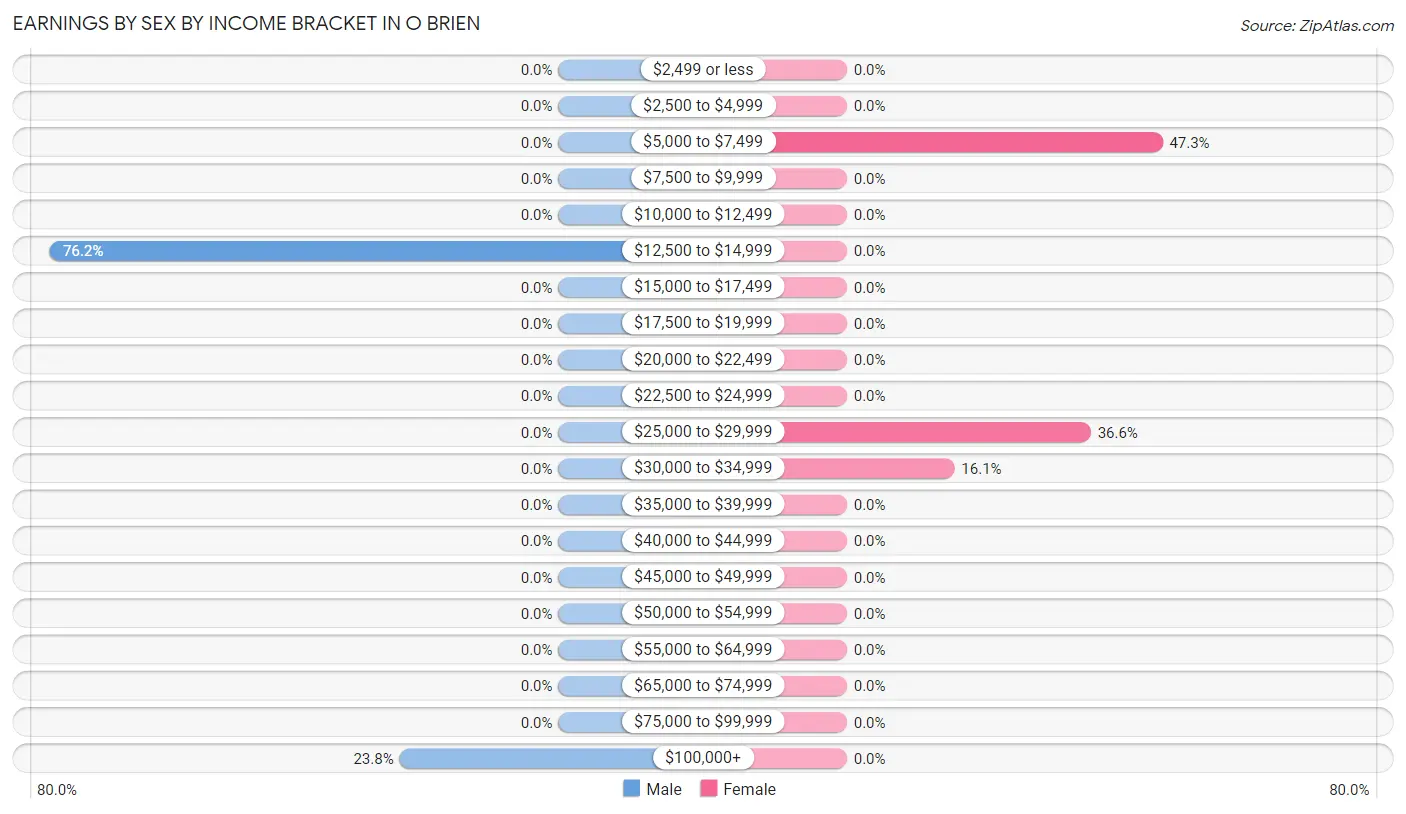
| Income | Male | Female |
| $2,499 or less | 0 (0.0%) | 0 (0.0%) |
| $2,500 to $4,999 | 0 (0.0%) | 0 (0.0%) |
| $5,000 to $7,499 | 0 (0.0%) | 44 (47.3%) |
| $7,500 to $9,999 | 0 (0.0%) | 0 (0.0%) |
| $10,000 to $12,499 | 0 (0.0%) | 0 (0.0%) |
| $12,500 to $14,999 | 48 (76.2%) | 0 (0.0%) |
| $15,000 to $17,499 | 0 (0.0%) | 0 (0.0%) |
| $17,500 to $19,999 | 0 (0.0%) | 0 (0.0%) |
| $20,000 to $22,499 | 0 (0.0%) | 0 (0.0%) |
| $22,500 to $24,999 | 0 (0.0%) | 0 (0.0%) |
| $25,000 to $29,999 | 0 (0.0%) | 34 (36.6%) |
| $30,000 to $34,999 | 0 (0.0%) | 15 (16.1%) |
| $35,000 to $39,999 | 0 (0.0%) | 0 (0.0%) |
| $40,000 to $44,999 | 0 (0.0%) | 0 (0.0%) |
| $45,000 to $49,999 | 0 (0.0%) | 0 (0.0%) |
| $50,000 to $54,999 | 0 (0.0%) | 0 (0.0%) |
| $55,000 to $64,999 | 0 (0.0%) | 0 (0.0%) |
| $65,000 to $74,999 | 0 (0.0%) | 0 (0.0%) |
| $75,000 to $99,999 | 0 (0.0%) | 0 (0.0%) |
| $100,000+ | 15 (23.8%) | 0 (0.0%) |
| Total | 63 (100.0%) | 93 (100.0%) |
Earnings by Sex by Educational Attainment in O Brien
| Educational Attainment | Male Income | Female Income |
| Less than High School | - | - |
| High School Diploma | - | - |
| College or Associate's Degree | - | - |
| Bachelor's Degree | - | - |
| Graduate Degree | - | - |
| Total | - | - |
Family Income in O Brien
Family Income Brackets in O Brien
According to the O Brien family income data, there are 111 families falling into the $25,000 to $34,999 income range, which is the most common income bracket and makes up 63.8% of all families.
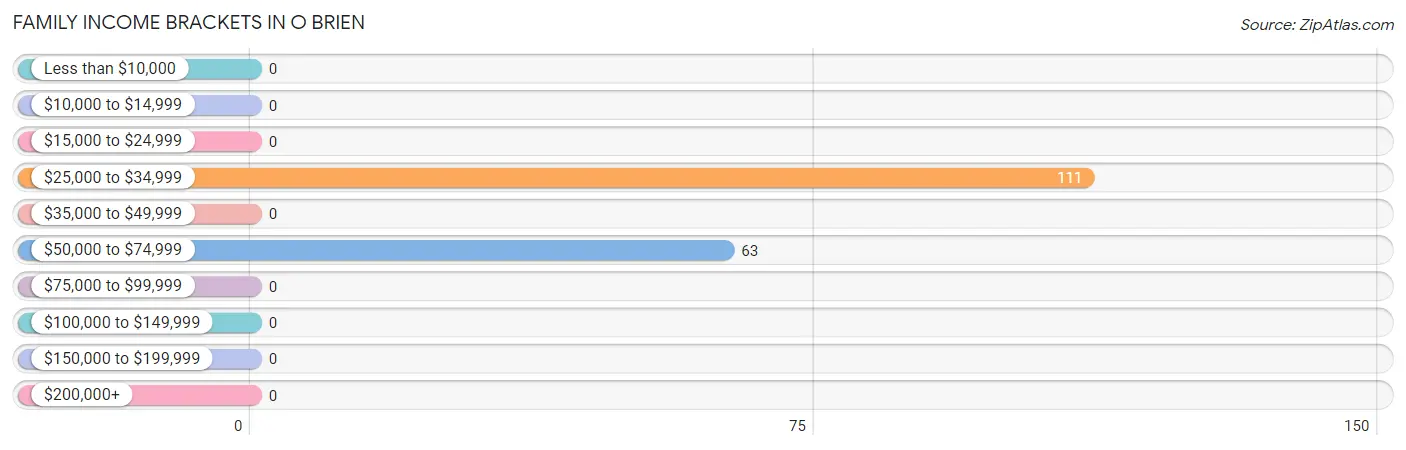
| Income Bracket | # Families | % Families |
| Less than $10,000 | 0 | 0.0% |
| $10,000 to $14,999 | 0 | 0.0% |
| $15,000 to $24,999 | 0 | 0.0% |
| $25,000 to $34,999 | 111 | 63.8% |
| $35,000 to $49,999 | 0 | 0.0% |
| $50,000 to $74,999 | 63 | 36.2% |
| $75,000 to $99,999 | 0 | 0.0% |
| $100,000 to $149,999 | 0 | 0.0% |
| $150,000 to $199,999 | 0 | 0.0% |
| $200,000+ | 0 | 0.0% |
Family Income by Famaliy Size in O Brien
| Income Bracket | # Families | Median Income |
| 2-Person Families | 130 (74.7%) | $0 |
| 3-Person Families | 44 (25.3%) | $0 |
| 4-Person Families | 0 (0.0%) | $0 |
| 5-Person Families | 0 (0.0%) | $0 |
| 6-Person Families | 0 (0.0%) | $0 |
| 7+ Person Families | 0 (0.0%) | $0 |
| Total | 174 (100.0%) | $0 |
Family Income by Number of Earners in O Brien
| Number of Earners | # Families | Median Income |
| No Earners | 130 (74.7%) | $0 |
| 1 Earner | 0 (0.0%) | $0 |
| 2 Earners | 44 (25.3%) | $0 |
| 3+ Earners | 0 (0.0%) | $0 |
| Total | 174 (100.0%) | $0 |
Household Income in O Brien
Household Income Brackets in O Brien
With 165 households falling in the category, the $25,000 to $34,999 income range is the most frequent in O Brien, accounting for 49.4% of all households.
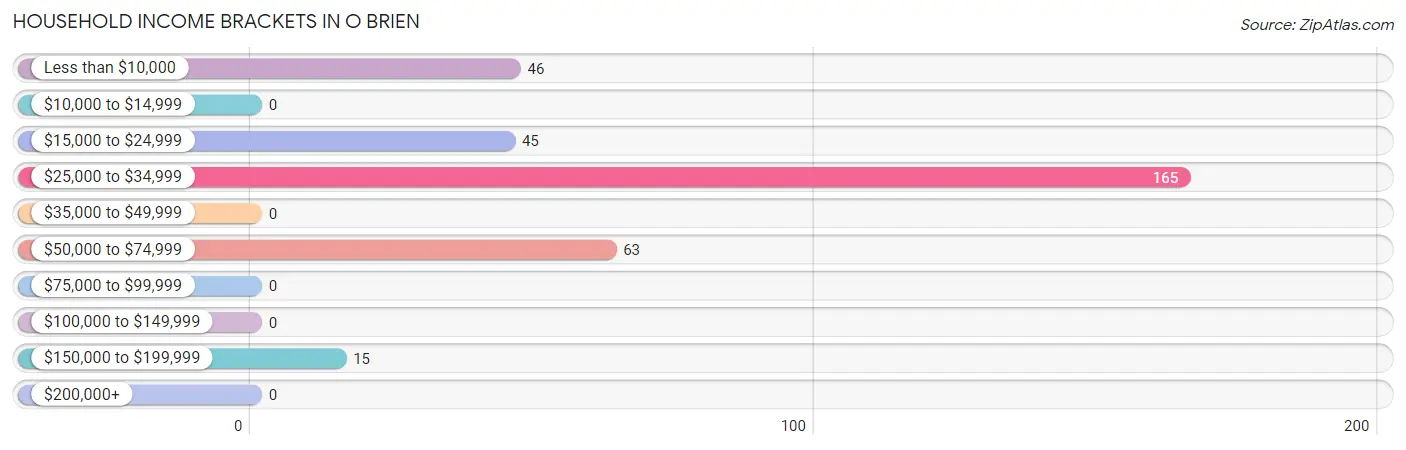
| Income Bracket | # Households | % Households |
| Less than $10,000 | 46 | 13.8% |
| $10,000 to $14,999 | 0 | 0.0% |
| $15,000 to $24,999 | 45 | 13.5% |
| $25,000 to $34,999 | 165 | 49.4% |
| $35,000 to $49,999 | 0 | 0.0% |
| $50,000 to $74,999 | 63 | 18.9% |
| $75,000 to $99,999 | 0 | 0.0% |
| $100,000 to $149,999 | 0 | 0.0% |
| $150,000 to $199,999 | 15 | 4.5% |
| $200,000+ | 0 | 0.0% |
Household Income by Householder Age in O Brien
The median household income in O Brien is $28,466, with the highest median household income of $28,953 found in the 65+ years age bracket for the primary householder. A total of 219 households (65.6%) fall into this category.
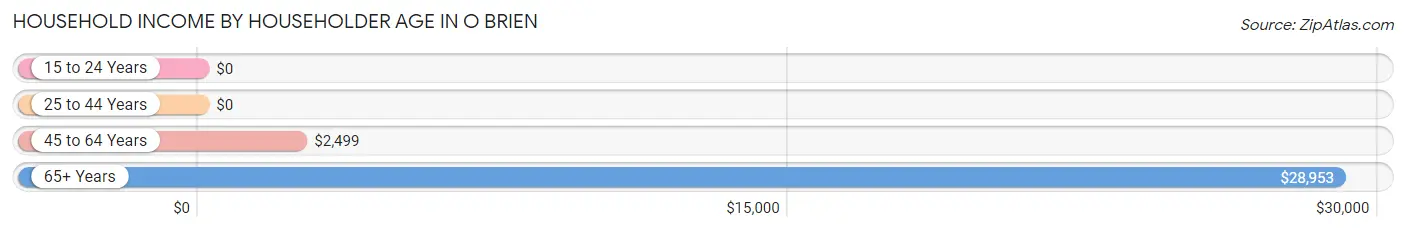
| Income Bracket | # Households | Median Income |
| 15 to 24 Years | 0 (0.0%) | $0 |
| 25 to 44 Years | 34 (10.2%) | $0 |
| 45 to 64 Years | 81 (24.2%) | $2,499 |
| 65+ Years | 219 (65.6%) | $28,953 |
| Total | 334 (100.0%) | $28,466 |
Poverty in O Brien
Income Below Poverty by Sex and Age in O Brien
With 31.4% poverty level for males and 12.2% for females among the residents of O Brien, 35 to 44 year old males and 55 to 64 year old females are the most vulnerable to poverty, with 37 males (100.0%) and 46 females (59.7%) in their respective age groups living below the poverty level.
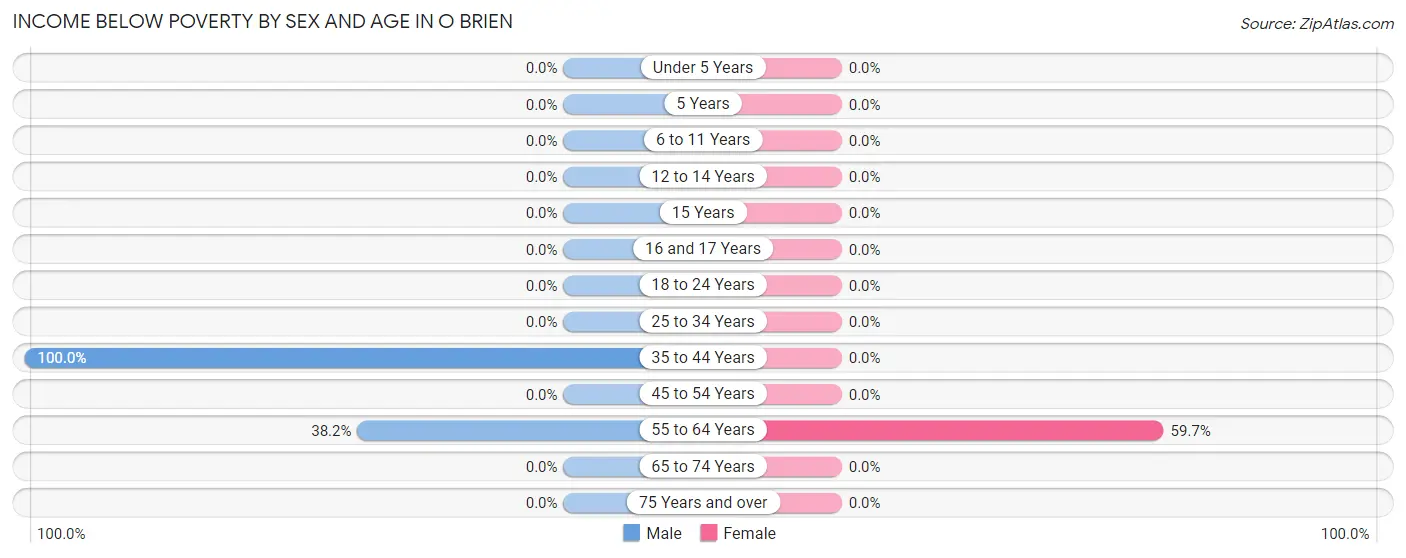
| Age Bracket | Male | Female |
| Under 5 Years | 0 (0.0%) | 0 (0.0%) |
| 5 Years | 0 (0.0%) | 0 (0.0%) |
| 6 to 11 Years | 0 (0.0%) | 0 (0.0%) |
| 12 to 14 Years | 0 (0.0%) | 0 (0.0%) |
| 15 Years | 0 (0.0%) | 0 (0.0%) |
| 16 and 17 Years | 0 (0.0%) | 0 (0.0%) |
| 18 to 24 Years | 0 (0.0%) | 0 (0.0%) |
| 25 to 34 Years | 0 (0.0%) | 0 (0.0%) |
| 35 to 44 Years | 37 (100.0%) | 0 (0.0%) |
| 45 to 54 Years | 0 (0.0%) | 0 (0.0%) |
| 55 to 64 Years | 39 (38.2%) | 46 (59.7%) |
| 65 to 74 Years | 0 (0.0%) | 0 (0.0%) |
| 75 Years and over | 0 (0.0%) | 0 (0.0%) |
| Total | 76 (31.4%) | 46 (12.2%) |
Income Above Poverty by Sex and Age in O Brien
According to the poverty statistics in O Brien, males aged 65 to 74 years and females aged 35 to 44 years are the age groups that are most secure financially, with 100.0% of males and 100.0% of females in these age groups living above the poverty line.
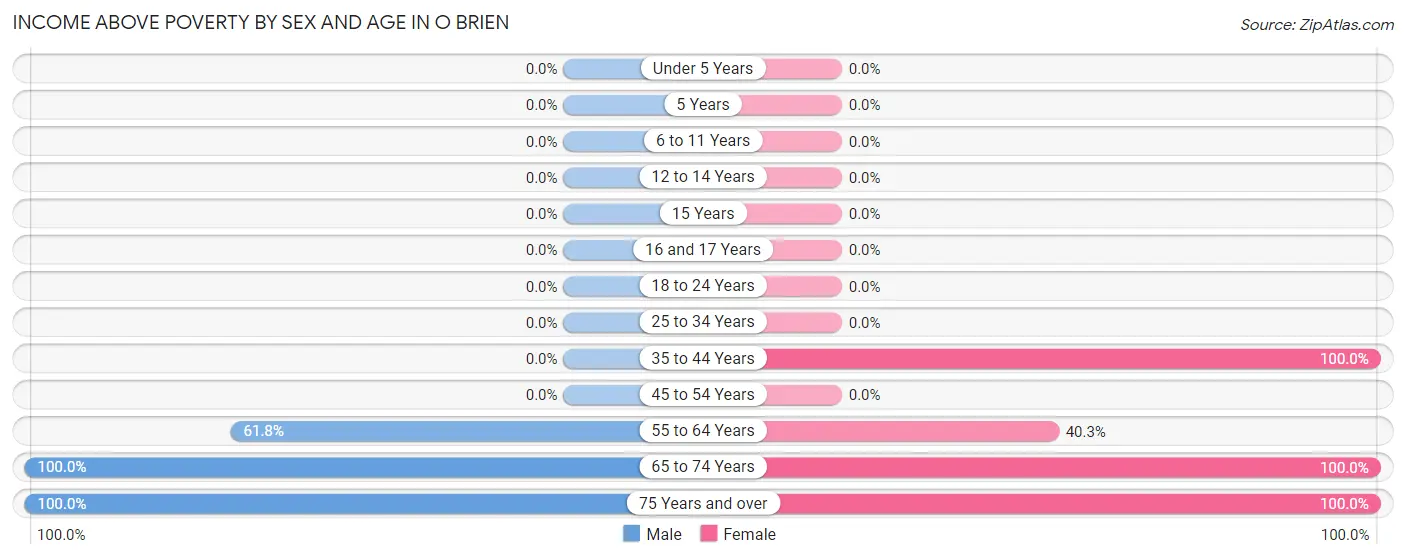
| Age Bracket | Male | Female |
| Under 5 Years | 0 (0.0%) | 0 (0.0%) |
| 5 Years | 0 (0.0%) | 0 (0.0%) |
| 6 to 11 Years | 0 (0.0%) | 0 (0.0%) |
| 12 to 14 Years | 0 (0.0%) | 0 (0.0%) |
| 15 Years | 0 (0.0%) | 0 (0.0%) |
| 16 and 17 Years | 0 (0.0%) | 0 (0.0%) |
| 18 to 24 Years | 0 (0.0%) | 0 (0.0%) |
| 25 to 34 Years | 0 (0.0%) | 0 (0.0%) |
| 35 to 44 Years | 0 (0.0%) | 34 (100.0%) |
| 45 to 54 Years | 0 (0.0%) | 0 (0.0%) |
| 55 to 64 Years | 63 (61.8%) | 31 (40.3%) |
| 65 to 74 Years | 86 (100.0%) | 177 (100.0%) |
| 75 Years and over | 17 (100.0%) | 89 (100.0%) |
| Total | 166 (68.6%) | 331 (87.8%) |
Income Below Poverty Among Married-Couple Families in O Brien
| Children | Above Poverty | Below Poverty |
| No Children | 130 (100.0%) | 0 (0.0%) |
| 1 or 2 Children | 0 (0.0%) | 0 (0.0%) |
| 3 or 4 Children | 0 (0.0%) | 0 (0.0%) |
| 5 or more Children | 0 (0.0%) | 0 (0.0%) |
| Total | 130 (100.0%) | 0 (0.0%) |
Income Below Poverty Among Single-Parent Households in O Brien
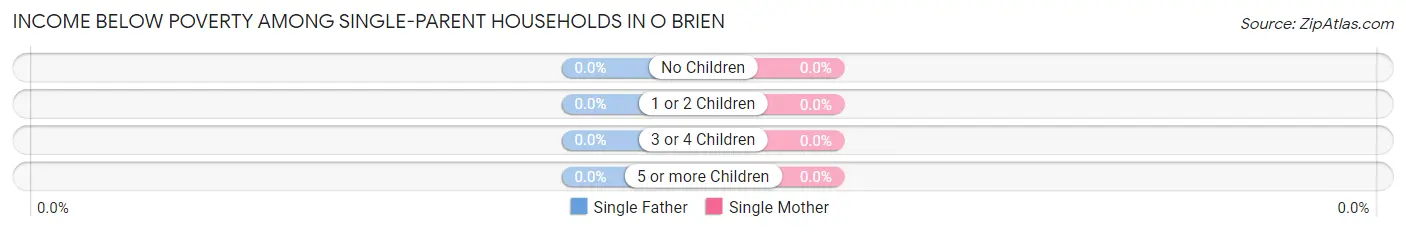
| Children | Single Father | Single Mother |
| No Children | 0 (0.0%) | 0 (0.0%) |
| 1 or 2 Children | 0 (0.0%) | 0 (0.0%) |
| 3 or 4 Children | 0 (0.0%) | 0 (0.0%) |
| 5 or more Children | 0 (0.0%) | 0 (0.0%) |
| Total | 0 (0.0%) | 0 (0.0%) |
Income Below Poverty Among Married-Couple vs Single-Parent Households in O Brien
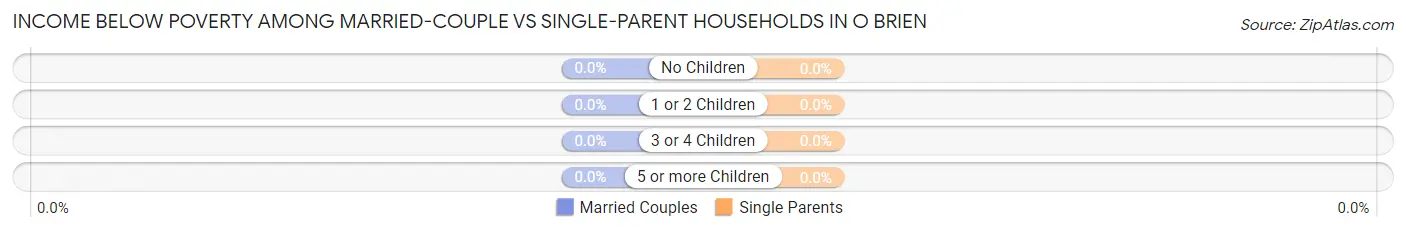
| Children | Married-Couple Families | Single-Parent Households |
| No Children | 0 (0.0%) | 0 (0.0%) |
| 1 or 2 Children | 0 (0.0%) | 0 (0.0%) |
| 3 or 4 Children | 0 (0.0%) | 0 (0.0%) |
| 5 or more Children | 0 (0.0%) | 0 (0.0%) |
| Total | 0 (0.0%) | 0 (0.0%) |
Race in O Brien
The most populous races in O Brien are White / Caucasian (589 | 95.2%), and Two or more Races (30 | 4.9%).
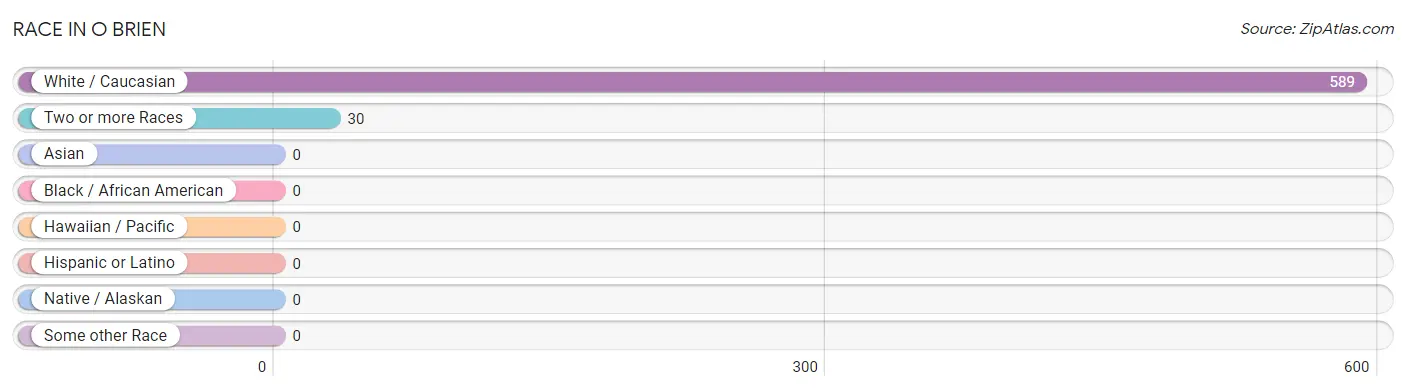
| Race | # Population | % Population |
| Asian | 0 | 0.0% |
| Black / African American | 0 | 0.0% |
| Hawaiian / Pacific | 0 | 0.0% |
| Hispanic or Latino | 0 | 0.0% |
| Native / Alaskan | 0 | 0.0% |
| White / Caucasian | 589 | 95.2% |
| Two or more Races | 30 | 4.9% |
| Some other Race | 0 | 0.0% |
| Total | 619 | 100.0% |
Ancestry in O Brien
The most populous ancestries reported in O Brien are American (323 | 52.2%), German (62 | 10.0%), Italian (53 | 8.6%), English (46 | 7.4%), and Norwegian (46 | 7.4%), together accounting for 85.6% of all O Brien residents.
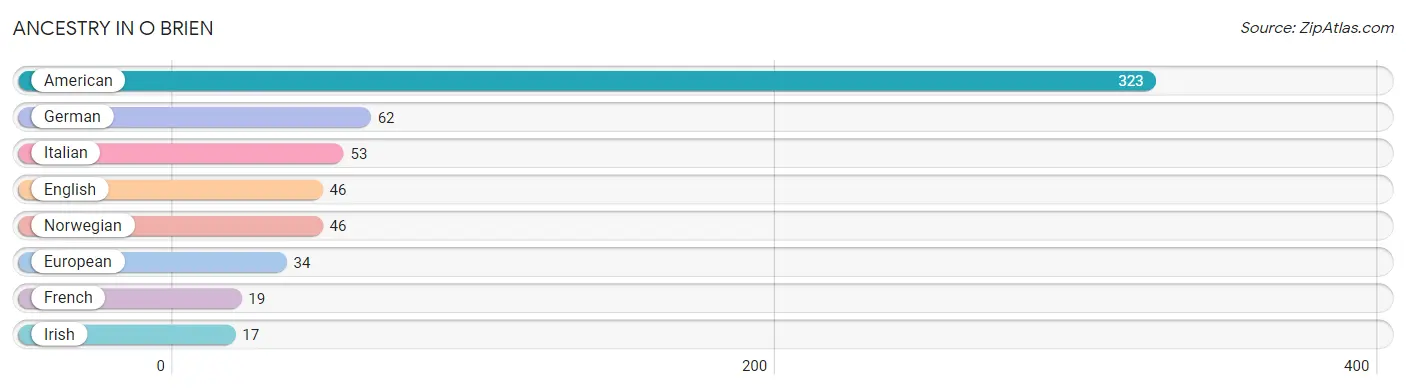
| Ancestry | # Population | % Population |
| American | 323 | 52.2% |
| English | 46 | 7.4% |
| European | 34 | 5.5% |
| French | 19 | 3.1% |
| German | 62 | 10.0% |
| Irish | 17 | 2.8% |
| Italian | 53 | 8.6% |
| Norwegian | 46 | 7.4% | View All 8 Rows |
Immigrants in O Brien
The most numerous immigrant groups reported in O Brien came from Africa (48 | 7.7%), and South Africa (48 | 7.7%), together accounting for 15.5% of all O Brien residents.
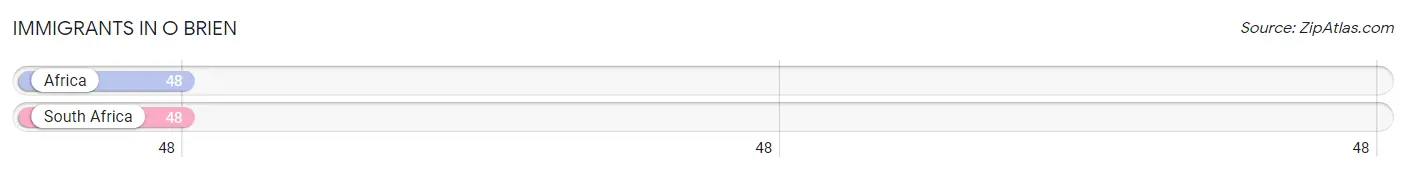
| Immigration Origin | # Population | % Population |
| Africa | 48 | 7.7% |
| South Africa | 48 | 7.7% | View All 2 Rows |
Sex and Age in O Brien
Sex and Age in O Brien
The most populous age groups in O Brien are 70 to 74 Years (86 | 35.5%) for men and 65 to 69 Years (130 | 34.5%) for women.
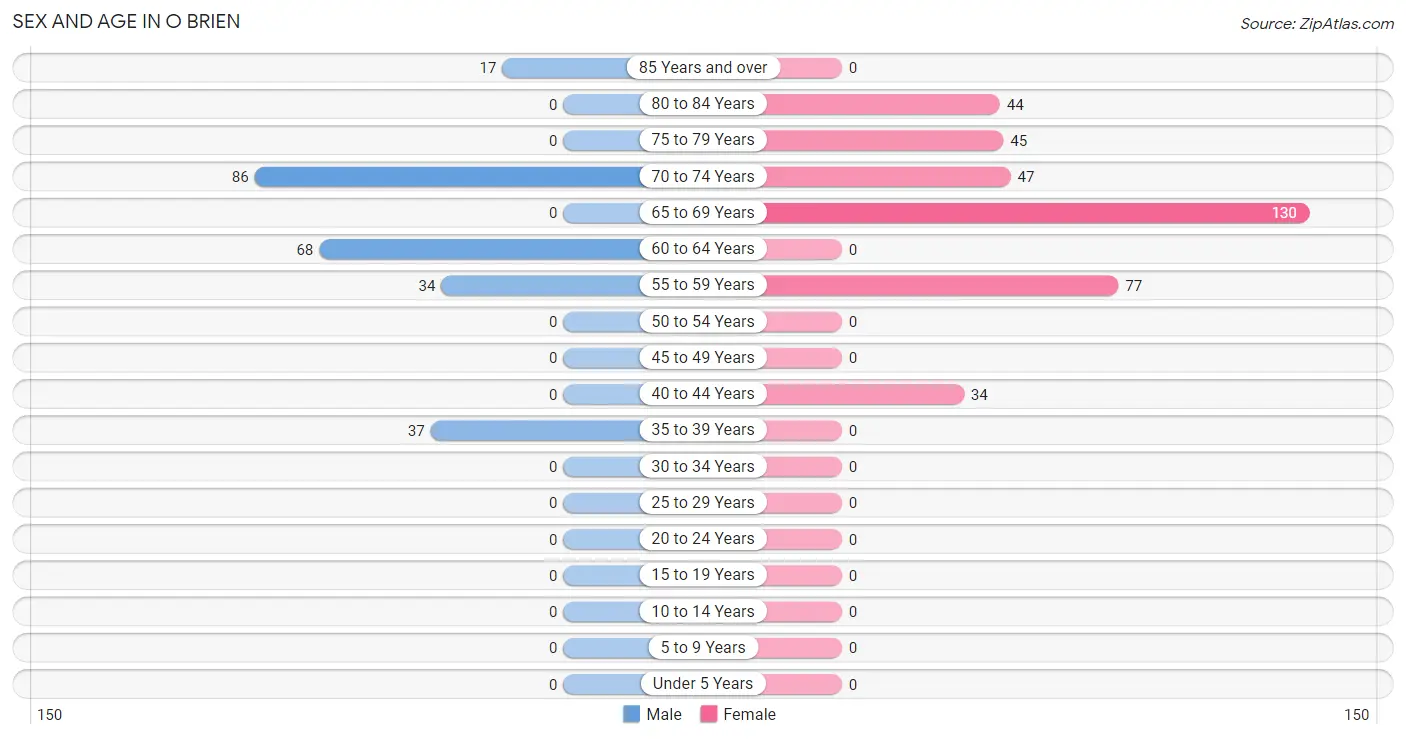
| Age Bracket | Male | Female |
| Under 5 Years | 0 (0.0%) | 0 (0.0%) |
| 5 to 9 Years | 0 (0.0%) | 0 (0.0%) |
| 10 to 14 Years | 0 (0.0%) | 0 (0.0%) |
| 15 to 19 Years | 0 (0.0%) | 0 (0.0%) |
| 20 to 24 Years | 0 (0.0%) | 0 (0.0%) |
| 25 to 29 Years | 0 (0.0%) | 0 (0.0%) |
| 30 to 34 Years | 0 (0.0%) | 0 (0.0%) |
| 35 to 39 Years | 37 (15.3%) | 0 (0.0%) |
| 40 to 44 Years | 0 (0.0%) | 34 (9.0%) |
| 45 to 49 Years | 0 (0.0%) | 0 (0.0%) |
| 50 to 54 Years | 0 (0.0%) | 0 (0.0%) |
| 55 to 59 Years | 34 (14.1%) | 77 (20.4%) |
| 60 to 64 Years | 68 (28.1%) | 0 (0.0%) |
| 65 to 69 Years | 0 (0.0%) | 130 (34.5%) |
| 70 to 74 Years | 86 (35.5%) | 47 (12.5%) |
| 75 to 79 Years | 0 (0.0%) | 45 (11.9%) |
| 80 to 84 Years | 0 (0.0%) | 44 (11.7%) |
| 85 Years and over | 17 (7.0%) | 0 (0.0%) |
| Total | 242 (100.0%) | 377 (100.0%) |
Families and Households in O Brien
Median Family Size in O Brien
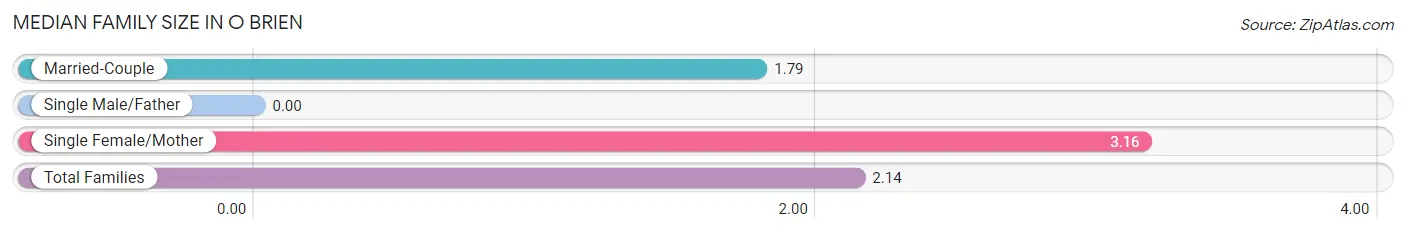
| Family Type | # Families | Family Size |
| Married-Couple | 130 (74.7%) | 1.79 |
| Single Male/Father | 0 (0.0%) | - |
| Single Female/Mother | 44 (25.3%) | 3.16 |
| Total Families | 174 (100.0%) | 2.14 |
Median Household Size in O Brien
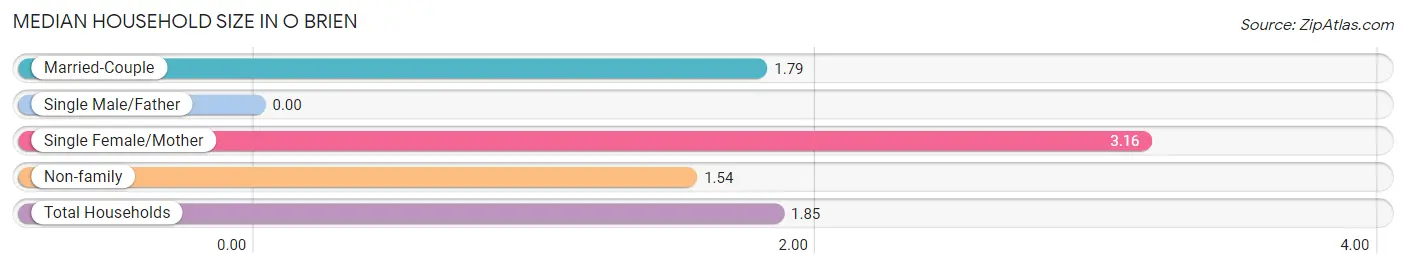
| Household Type | # Households | Household Size |
| Married-Couple | 130 (38.9%) | 1.79 |
| Single Male/Father | 0 (0.0%) | - |
| Single Female/Mother | 44 (13.2%) | 3.16 |
| Non-family | 160 (47.9%) | 1.54 |
| Total Households | 334 (100.0%) | 1.85 |
Household Size by Marriage Status in O Brien
Out of a total of 334 households in O Brien, 174 (52.1%) are family households, while 160 (47.9%) are nonfamily households. The most numerous type of family households are 2-person households, comprising 130, and the most common type of nonfamily households are 1-person households, comprising 91.
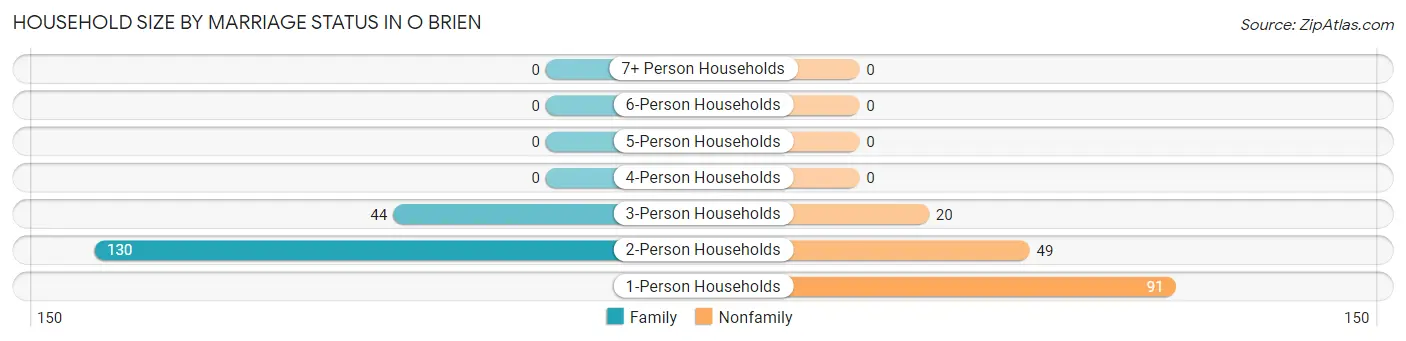
| Household Size | Family Households | Nonfamily Households |
| 1-Person Households | - | 91 (27.3%) |
| 2-Person Households | 130 (38.9%) | 49 (14.7%) |
| 3-Person Households | 44 (13.2%) | 20 (6.0%) |
| 4-Person Households | 0 (0.0%) | 0 (0.0%) |
| 5-Person Households | 0 (0.0%) | 0 (0.0%) |
| 6-Person Households | 0 (0.0%) | 0 (0.0%) |
| 7+ Person Households | 0 (0.0%) | 0 (0.0%) |
| Total | 174 (52.1%) | 160 (47.9%) |
Female Fertility in O Brien
Fertility by Age in O Brien
| Age Bracket | Women with Births | Births / 1,000 Women |
| 15 to 19 years | 0 (0.0%) | 0.0 |
| 20 to 34 years | 0 (0.0%) | 0.0 |
| 35 to 50 years | 0 (0.0%) | 0.0 |
| Total | 0 (0.0%) | 0.0 |
Fertility by Age by Marriage Status in O Brien
| Age Bracket | Married | Unmarried |
| 15 to 19 years | 0 (0.0%) | 0 (0.0%) |
| 20 to 34 years | 0 (0.0%) | 0 (0.0%) |
| 35 to 50 years | 0 (0.0%) | 0 (0.0%) |
| Total | 0 (0.0%) | 0 (0.0%) |
Fertility by Education in O Brien
| Educational Attainment | Women with Births | Births / 1,000 Women |
| Less than High School | 0 (0.0%) | 0.0 |
| High School Diploma | 0 (0.0%) | 0.0 |
| College or Associate's Degree | 0 (0.0%) | 0.0 |
| Bachelor's Degree | 0 (0.0%) | 0.0 |
| Graduate Degree | 0 (0.0%) | 0.0 |
| Total | 0 (0.0%) | 0.0 |
Fertility by Education by Marriage Status in O Brien
| Educational Attainment | Married | Unmarried |
| Less than High School | 0 (0.0%) | 0 (0.0%) |
| High School Diploma | 0 (0.0%) | 0 (0.0%) |
| College or Associate's Degree | 0 (0.0%) | 0 (0.0%) |
| Bachelor's Degree | 0 (0.0%) | 0 (0.0%) |
| Graduate Degree | 0 (0.0%) | 0 (0.0%) |
| Total | 0 (0.0%) | 0 (0.0%) |
Employment Characteristics in O Brien
Employment by Class of Employer in O Brien
Among the 156 employed individuals in O Brien, private company employees (112 | 71.8%), and state government employees (44 | 28.2%) make up the most common classes of employment.
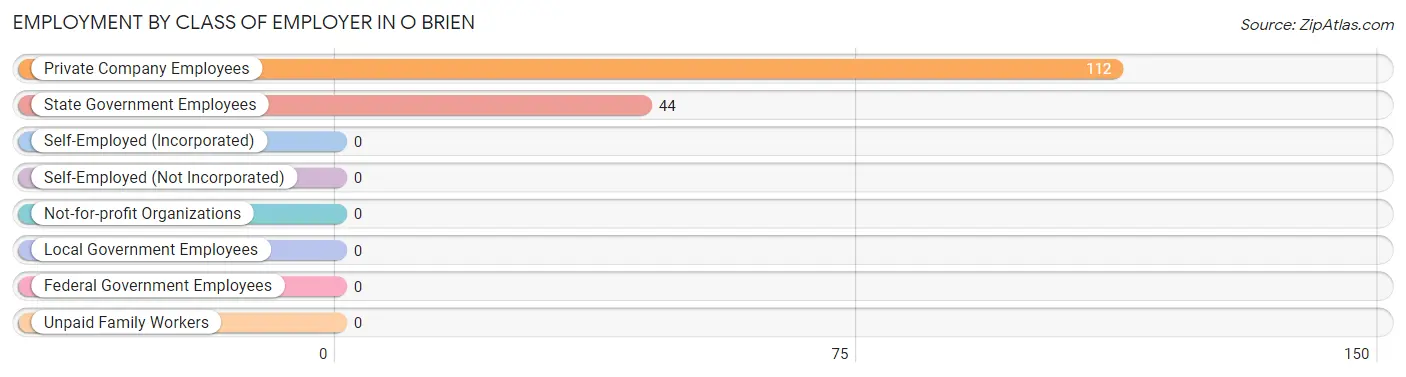
| Employer Class | # Employees | % Employees |
| Private Company Employees | 112 | 71.8% |
| Self-Employed (Incorporated) | 0 | 0.0% |
| Self-Employed (Not Incorporated) | 0 | 0.0% |
| Not-for-profit Organizations | 0 | 0.0% |
| Local Government Employees | 0 | 0.0% |
| State Government Employees | 44 | 28.2% |
| Federal Government Employees | 0 | 0.0% |
| Unpaid Family Workers | 0 | 0.0% |
| Total | 156 | 100.0% |
Employment Status by Age in O Brien
According to the labor force statistics for O Brien, out of the total population over 16 years of age (619), 31.2% or 193 individuals are in the labor force, with 19.2% or 37 of them unemployed. The age group with the highest labor force participation rate is 35 to 44 years, with 100.0% or 71 individuals in the labor force. Within the labor force, the 35 to 44 years age range has the highest percentage of unemployed individuals, with 52.1% or 37 of them being unemployed.
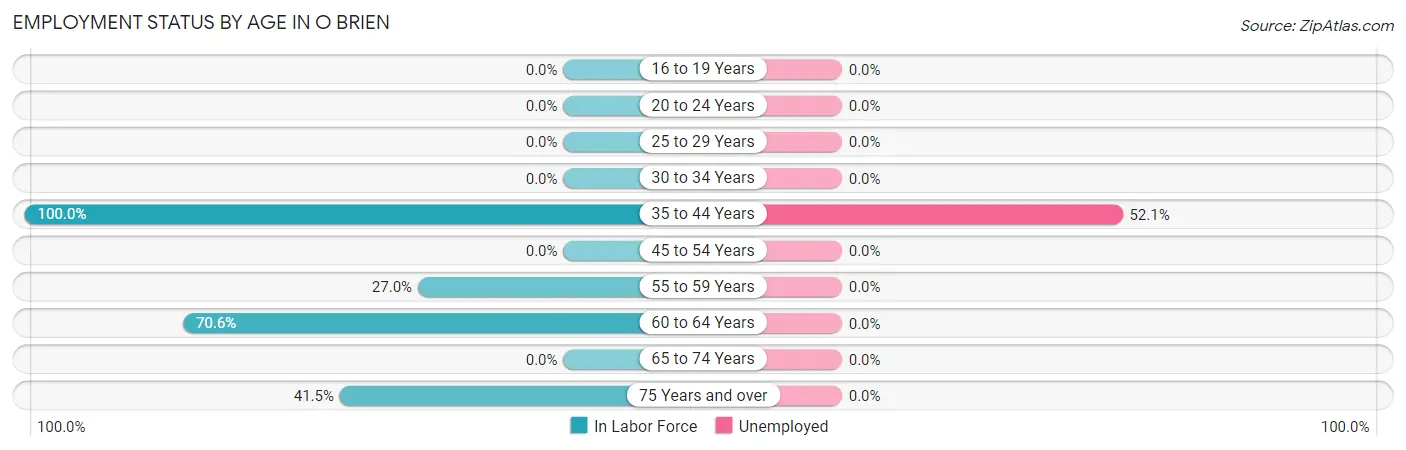
| Age Bracket | In Labor Force | Unemployed |
| 16 to 19 Years | 0 (0.0%) | 0 (0.0%) |
| 20 to 24 Years | 0 (0.0%) | 0 (0.0%) |
| 25 to 29 Years | 0 (0.0%) | 0 (0.0%) |
| 30 to 34 Years | 0 (0.0%) | 0 (0.0%) |
| 35 to 44 Years | 71 (100.0%) | 37 (52.1%) |
| 45 to 54 Years | 0 (0.0%) | 0 (0.0%) |
| 55 to 59 Years | 30 (27.0%) | 0 (0.0%) |
| 60 to 64 Years | 48 (70.6%) | 0 (0.0%) |
| 65 to 74 Years | 0 (0.0%) | 0 (0.0%) |
| 75 Years and over | 44 (41.5%) | 0 (0.0%) |
| Total | 193 (31.2%) | 37 (19.2%) |
Employment Status by Educational Attainment in O Brien
According to labor force statistics for O Brien, 59.6% of individuals (149) out of the total population between 25 and 64 years of age (250) are in the labor force, with 24.8% or 37 of them being unemployed. The group with the highest labor force participation rate are those with the educational attainment of college / associate degree, with 100.0% or 112 individuals in the labor force. Within the labor force, individuals with high school diploma education have the highest percentage of unemployment, with 100.0% or 37 of them being unemployed.
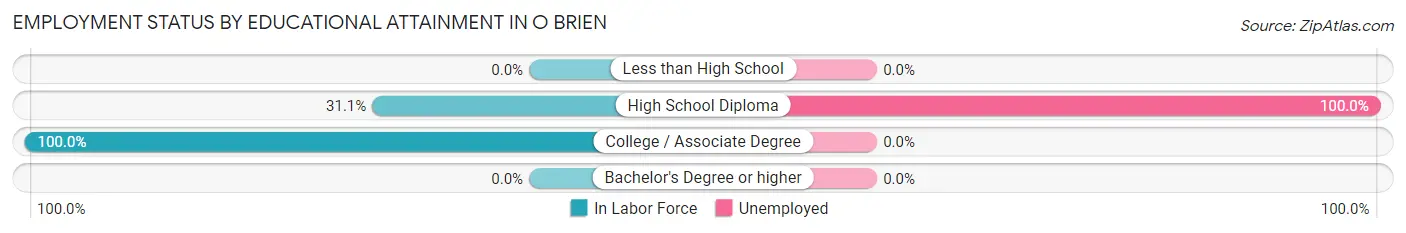
| Educational Attainment | In Labor Force | Unemployed |
| Less than High School | 0 (0.0%) | 0 (0.0%) |
| High School Diploma | 37 (31.1%) | 119 (100.0%) |
| College / Associate Degree | 112 (100.0%) | 0 (0.0%) |
| Bachelor's Degree or higher | 0 (0.0%) | 0 (0.0%) |
| Total | 149 (59.6%) | 62 (24.8%) |
Employment Occupations by Sex in O Brien
Management, Business, Science and Arts Occupations
Management, Business, Science and Arts Occupations by Sex
| Occupation | Male | Female |
| Management | 0 (0.0%) | 0 (0.0%) |
| Business & Financial | 0 (0.0%) | 0 (0.0%) |
| Computers, Engineering & Science | 0 (0.0%) | 0 (0.0%) |
| Computers & Mathematics | 0 (0.0%) | 0 (0.0%) |
| Architecture & Engineering | 0 (0.0%) | 0 (0.0%) |
| Life, Physical & Social Science | 0 (0.0%) | 0 (0.0%) |
| Community & Social Service | 0 (0.0%) | 0 (0.0%) |
| Education, Arts & Media | 0 (0.0%) | 0 (0.0%) |
| Legal Services & Support | 0 (0.0%) | 0 (0.0%) |
| Education Instruction & Library | 0 (0.0%) | 0 (0.0%) |
| Arts, Media & Entertainment | 0 (0.0%) | 0 (0.0%) |
| Health Diagnosing & Treating | 0 (0.0%) | 0 (0.0%) |
| Health Technologists | 0 (0.0%) | 0 (0.0%) |
| Total (Category) | 0 (0.0%) | 0 (0.0%) |
| Total (Overall) | 63 (40.4%) | 93 (59.6%) |
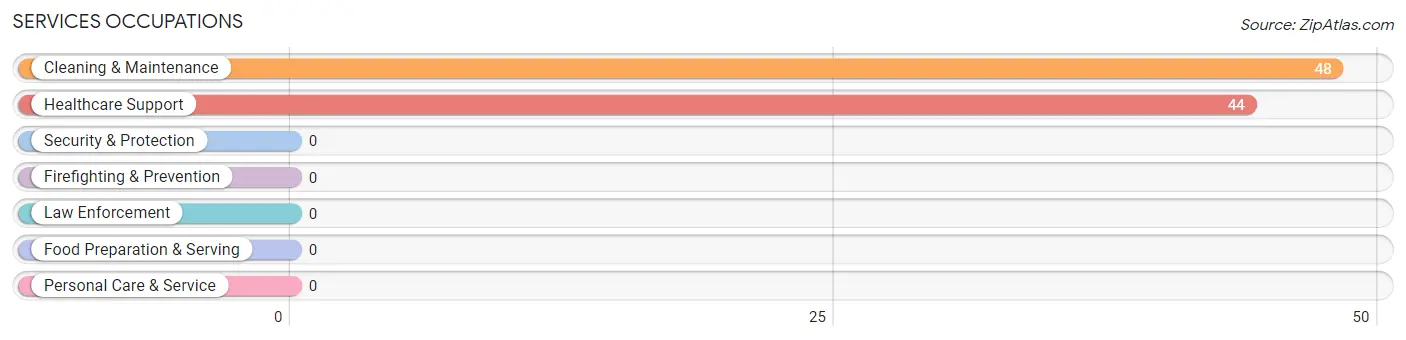
Services Occupations
The most common Services occupations in O Brien are Cleaning & Maintenance (48 | 30.8%), and Healthcare Support (44 | 28.2%).
Services Occupations by Sex
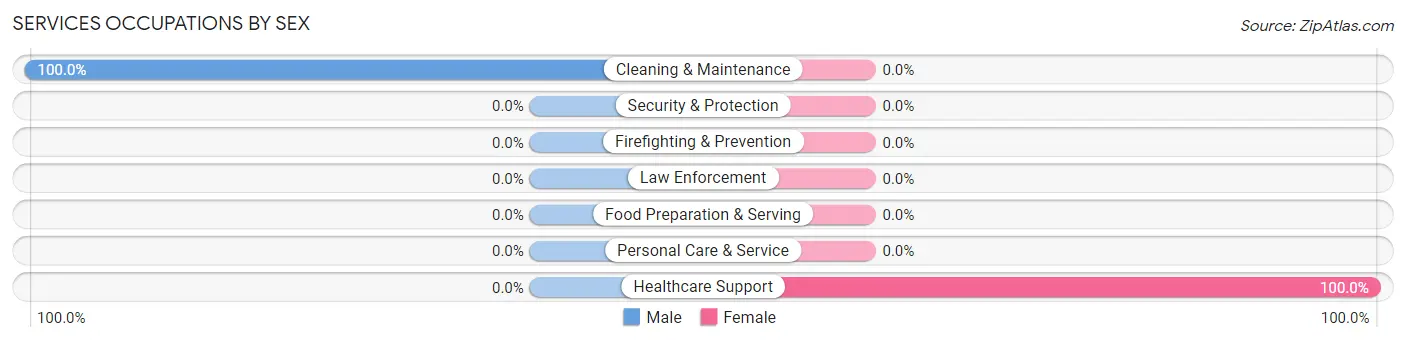
| Occupation | Male | Female |
| Healthcare Support | 0 (0.0%) | 44 (100.0%) |
| Security & Protection | 0 (0.0%) | 0 (0.0%) |
| Firefighting & Prevention | 0 (0.0%) | 0 (0.0%) |
| Law Enforcement | 0 (0.0%) | 0 (0.0%) |
| Food Preparation & Serving | 0 (0.0%) | 0 (0.0%) |
| Cleaning & Maintenance | 48 (100.0%) | 0 (0.0%) |
| Personal Care & Service | 0 (0.0%) | 0 (0.0%) |
| Total (Category) | 48 (52.2%) | 44 (47.8%) |
| Total (Overall) | 63 (40.4%) | 93 (59.6%) |
Sales and Office Occupations
The most common Sales and Office occupations in O Brien are Sales & Related (34 | 21.8%), and Office & Administration (15 | 9.6%).
Sales and Office Occupations by Sex
| Occupation | Male | Female |
| Sales & Related | 0 (0.0%) | 34 (100.0%) |
| Office & Administration | 0 (0.0%) | 15 (100.0%) |
| Total (Category) | 0 (0.0%) | 49 (100.0%) |
| Total (Overall) | 63 (40.4%) | 93 (59.6%) |
Natural Resources, Construction and Maintenance Occupations
The most common Natural Resources, Construction and Maintenance occupations in O Brien are , and Construction & Extraction (15 | 9.6%).
Natural Resources, Construction and Maintenance Occupations by Sex
| Occupation | Male | Female |
| Farming, Fishing & Forestry | 0 (0.0%) | 0 (0.0%) |
| Construction & Extraction | 15 (100.0%) | 0 (0.0%) |
| Installation, Maintenance & Repair | 0 (0.0%) | 0 (0.0%) |
| Total (Category) | 15 (100.0%) | 0 (0.0%) |
| Total (Overall) | 63 (40.4%) | 93 (59.6%) |
Production, Transportation and Moving Occupations
Production, Transportation and Moving Occupations by Sex
| Occupation | Male | Female |
| Production | 0 (0.0%) | 0 (0.0%) |
| Transportation | 0 (0.0%) | 0 (0.0%) |
| Material Moving | 0 (0.0%) | 0 (0.0%) |
| Total (Category) | 0 (0.0%) | 0 (0.0%) |
| Total (Overall) | 63 (40.4%) | 93 (59.6%) |
Employment Industries by Sex in O Brien
Employment Industries in O Brien
The major employment industries in O Brien include Retail Trade (49 | 31.4%), Administrative & Support (48 | 30.8%), Health Care & Social Assistance (44 | 28.2%), and Construction (15 | 9.6%).
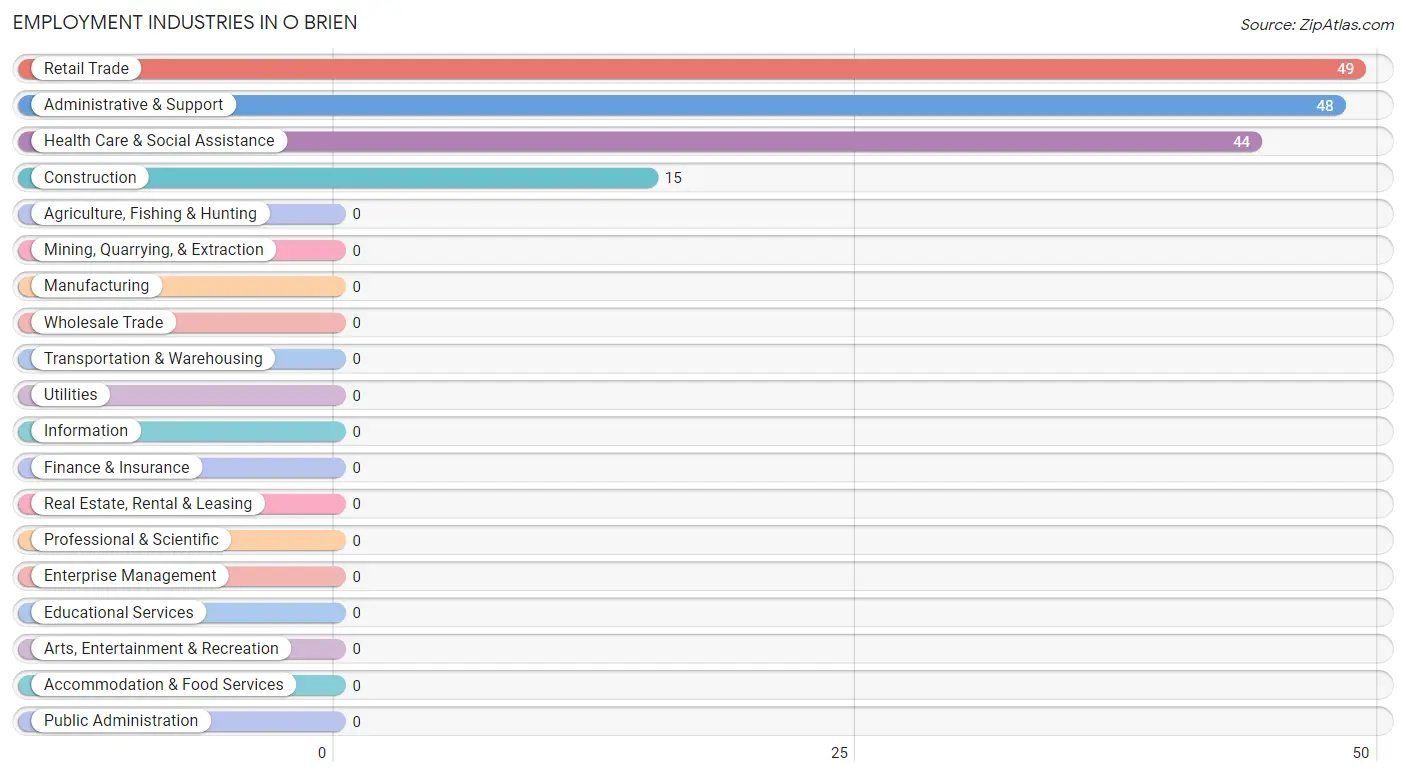
Employment Industries by Sex in O Brien
The O Brien industries that see more men than women are Construction (100.0%), and Administrative & Support (100.0%), whereas the industries that tend to have a higher number of women are Retail Trade (100.0%), and Health Care & Social Assistance (100.0%).
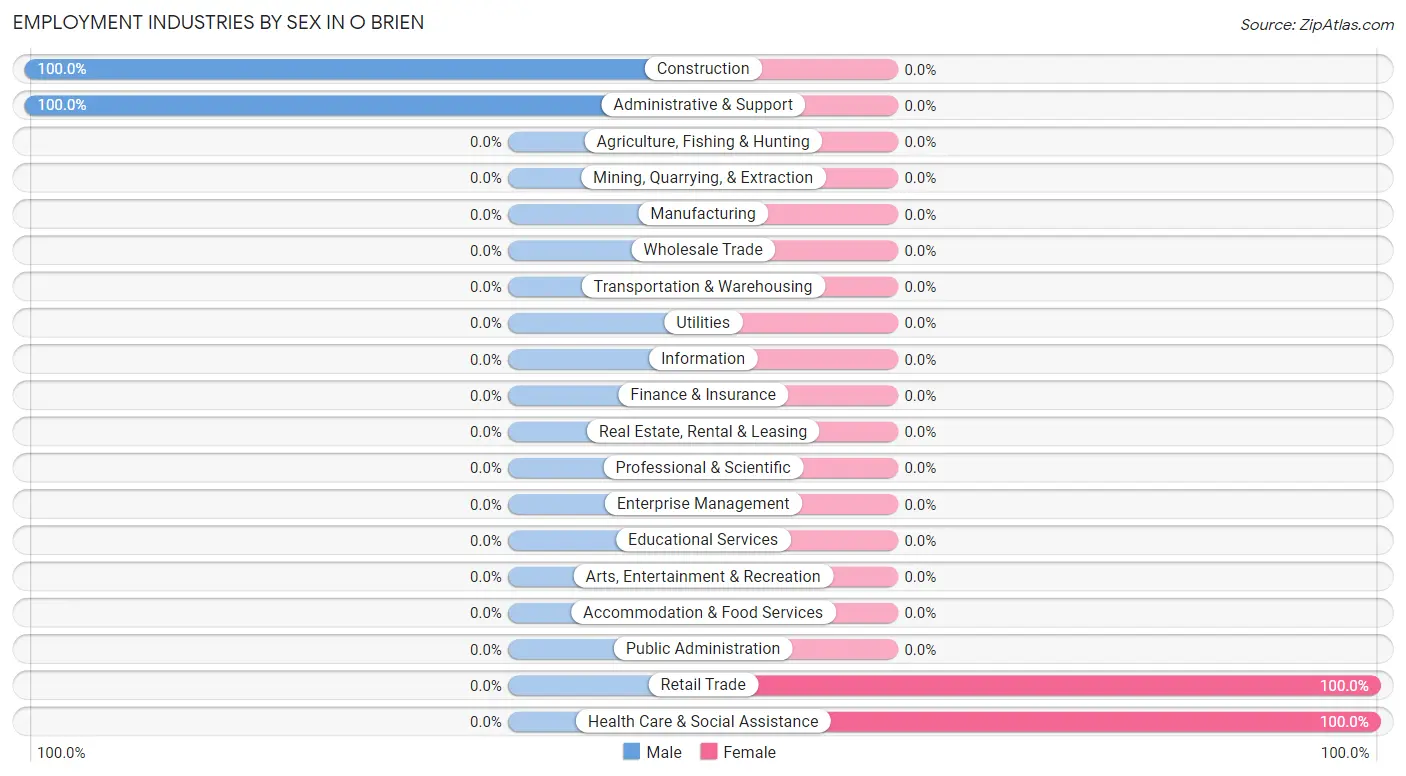
| Industry | Male | Female |
| Agriculture, Fishing & Hunting | 0 (0.0%) | 0 (0.0%) |
| Mining, Quarrying, & Extraction | 0 (0.0%) | 0 (0.0%) |
| Construction | 15 (100.0%) | 0 (0.0%) |
| Manufacturing | 0 (0.0%) | 0 (0.0%) |
| Wholesale Trade | 0 (0.0%) | 0 (0.0%) |
| Retail Trade | 0 (0.0%) | 49 (100.0%) |
| Transportation & Warehousing | 0 (0.0%) | 0 (0.0%) |
| Utilities | 0 (0.0%) | 0 (0.0%) |
| Information | 0 (0.0%) | 0 (0.0%) |
| Finance & Insurance | 0 (0.0%) | 0 (0.0%) |
| Real Estate, Rental & Leasing | 0 (0.0%) | 0 (0.0%) |
| Professional & Scientific | 0 (0.0%) | 0 (0.0%) |
| Enterprise Management | 0 (0.0%) | 0 (0.0%) |
| Administrative & Support | 48 (100.0%) | 0 (0.0%) |
| Educational Services | 0 (0.0%) | 0 (0.0%) |
| Health Care & Social Assistance | 0 (0.0%) | 44 (100.0%) |
| Arts, Entertainment & Recreation | 0 (0.0%) | 0 (0.0%) |
| Accommodation & Food Services | 0 (0.0%) | 0 (0.0%) |
| Public Administration | 0 (0.0%) | 0 (0.0%) |
| Total | 63 (40.4%) | 93 (59.6%) |
Education in O Brien
School Enrollment in O Brien
| School Level | # Students | % Students |
| Nursery / Preschool | 0 | 0.0% |
| Kindergarten | 0 | 0.0% |
| Elementary School | 0 | 0.0% |
| Middle School | 0 | 0.0% |
| High School | 0 | 0.0% |
| College / Undergraduate | 0 | 0.0% |
| Graduate / Professional | 0 | 0.0% |
| Total | 0 | 0.0% |
School Enrollment by Age by Funding Source in O Brien
| Age Bracket | Public School | Private School |
| 3 to 4 Year Olds | 0 (0.0%) | 0 (0.0%) |
| 5 to 9 Year Old | 0 (0.0%) | 0 (0.0%) |
| 10 to 14 Year Olds | 0 (0.0%) | 0 (0.0%) |
| 15 to 17 Year Olds | 0 (0.0%) | 0 (0.0%) |
| 18 to 19 Year Olds | 0 (0.0%) | 0 (0.0%) |
| 20 to 24 Year Olds | 0 (0.0%) | 0 (0.0%) |
| 25 to 34 Year Olds | 0 (0.0%) | 0 (0.0%) |
| 35 Years and over | 0 (0.0%) | 0 (0.0%) |
| Total | 0 (0.0%) | 0 (0.0%) |
Educational Attainment by Field of Study in O Brien
| Field of Study | # Graduates | % Graduates |
| Computers & Mathematics | 0 | 0.0% |
| Bio, Nature & Agricultural | 0 | 0.0% |
| Physical & Health Sciences | 0 | 0.0% |
| Psychology | 0 | 0.0% |
| Social Sciences | 0 | 0.0% |
| Engineering | 0 | 0.0% |
| Multidisciplinary Studies | 0 | 0.0% |
| Science & Technology | 0 | 0.0% |
| Business | 0 | 0.0% |
| Education | 0 | 0.0% |
| Literature & Languages | 0 | 0.0% |
| Liberal Arts & History | 0 | 0.0% |
| Visual & Performing Arts | 0 | 0.0% |
| Communications | 0 | 0.0% |
| Arts & Humanities | 0 | 0.0% |
| Total | 0 | 0.0% |
Transportation & Commute in O Brien
Vehicle Availability by Sex in O Brien
The most prevalent vehicle ownership categories in O Brien are males with 5 or more vehicles (48, accounting for 76.2%) and females with 5 or more vehicles (44, making up 51.6%).
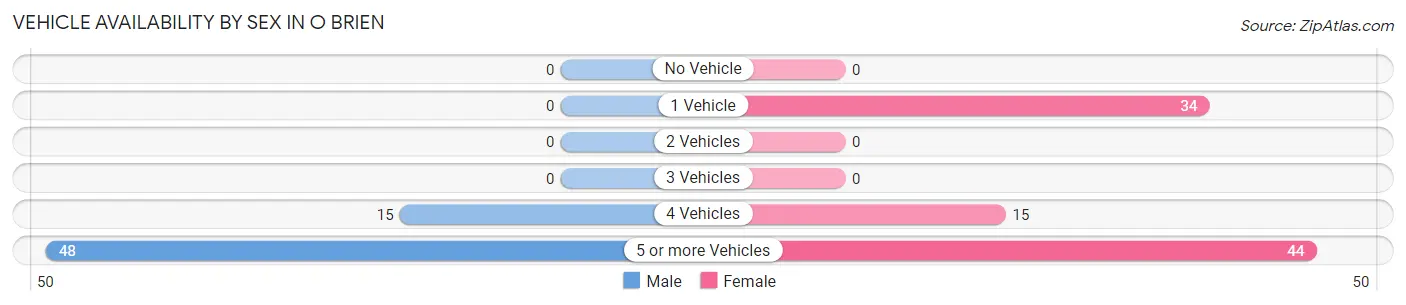
| Vehicles Available | Male | Female |
| No Vehicle | 0 (0.0%) | 0 (0.0%) |
| 1 Vehicle | 0 (0.0%) | 34 (36.6%) |
| 2 Vehicles | 0 (0.0%) | 0 (0.0%) |
| 3 Vehicles | 0 (0.0%) | 0 (0.0%) |
| 4 Vehicles | 15 (23.8%) | 15 (16.1%) |
| 5 or more Vehicles | 48 (76.2%) | 44 (47.3%) |
| Total | 63 (100.0%) | 93 (100.0%) |
Commute Time in O Brien
The most frequently occuring commute durations in O Brien are 40 to 44 minutes (48 commuters, 30.8%), 10 to 14 minutes (44 commuters, 28.2%), and 5 to 9 minutes (34 commuters, 21.8%).
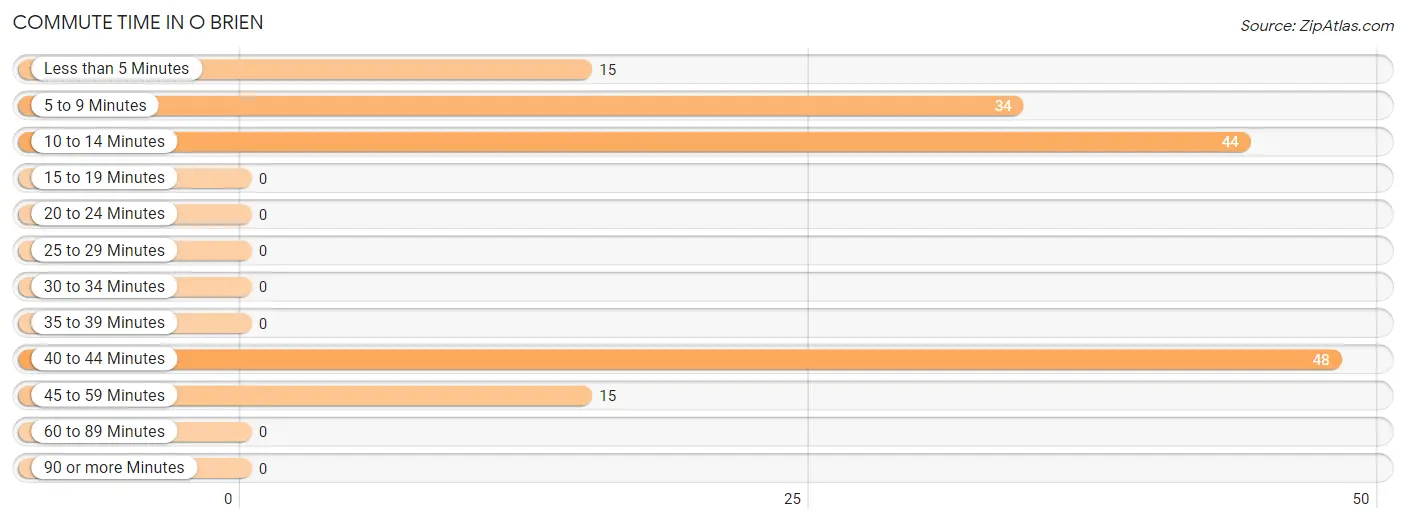
| Commute Time | # Commuters | % Commuters |
| Less than 5 Minutes | 15 | 9.6% |
| 5 to 9 Minutes | 34 | 21.8% |
| 10 to 14 Minutes | 44 | 28.2% |
| 15 to 19 Minutes | 0 | 0.0% |
| 20 to 24 Minutes | 0 | 0.0% |
| 25 to 29 Minutes | 0 | 0.0% |
| 30 to 34 Minutes | 0 | 0.0% |
| 35 to 39 Minutes | 0 | 0.0% |
| 40 to 44 Minutes | 48 | 30.8% |
| 45 to 59 Minutes | 15 | 9.6% |
| 60 to 89 Minutes | 0 | 0.0% |
| 90 or more Minutes | 0 | 0.0% |
Commute Time by Sex in O Brien
The most common commute times in O Brien are 40 to 44 minutes (48 commuters, 76.2%) for males and 10 to 14 minutes (44 commuters, 47.3%) for females.
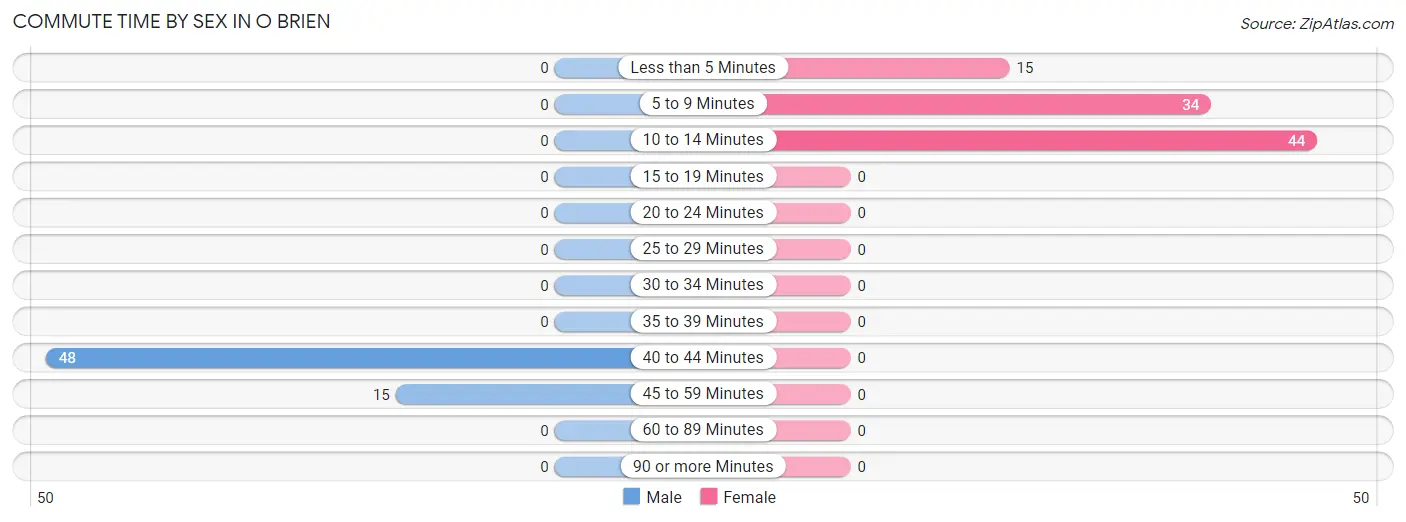
| Commute Time | Male | Female |
| Less than 5 Minutes | 0 (0.0%) | 15 (16.1%) |
| 5 to 9 Minutes | 0 (0.0%) | 34 (36.6%) |
| 10 to 14 Minutes | 0 (0.0%) | 44 (47.3%) |
| 15 to 19 Minutes | 0 (0.0%) | 0 (0.0%) |
| 20 to 24 Minutes | 0 (0.0%) | 0 (0.0%) |
| 25 to 29 Minutes | 0 (0.0%) | 0 (0.0%) |
| 30 to 34 Minutes | 0 (0.0%) | 0 (0.0%) |
| 35 to 39 Minutes | 0 (0.0%) | 0 (0.0%) |
| 40 to 44 Minutes | 48 (76.2%) | 0 (0.0%) |
| 45 to 59 Minutes | 15 (23.8%) | 0 (0.0%) |
| 60 to 89 Minutes | 0 (0.0%) | 0 (0.0%) |
| 90 or more Minutes | 0 (0.0%) | 0 (0.0%) |
Time of Departure to Work by Sex in O Brien
The most frequent times of departure to work in O Brien are 8:30 AM to 8:59 AM (48, 76.2%) for males and 12:00 PM to 3:59 PM (44, 47.3%) for females.
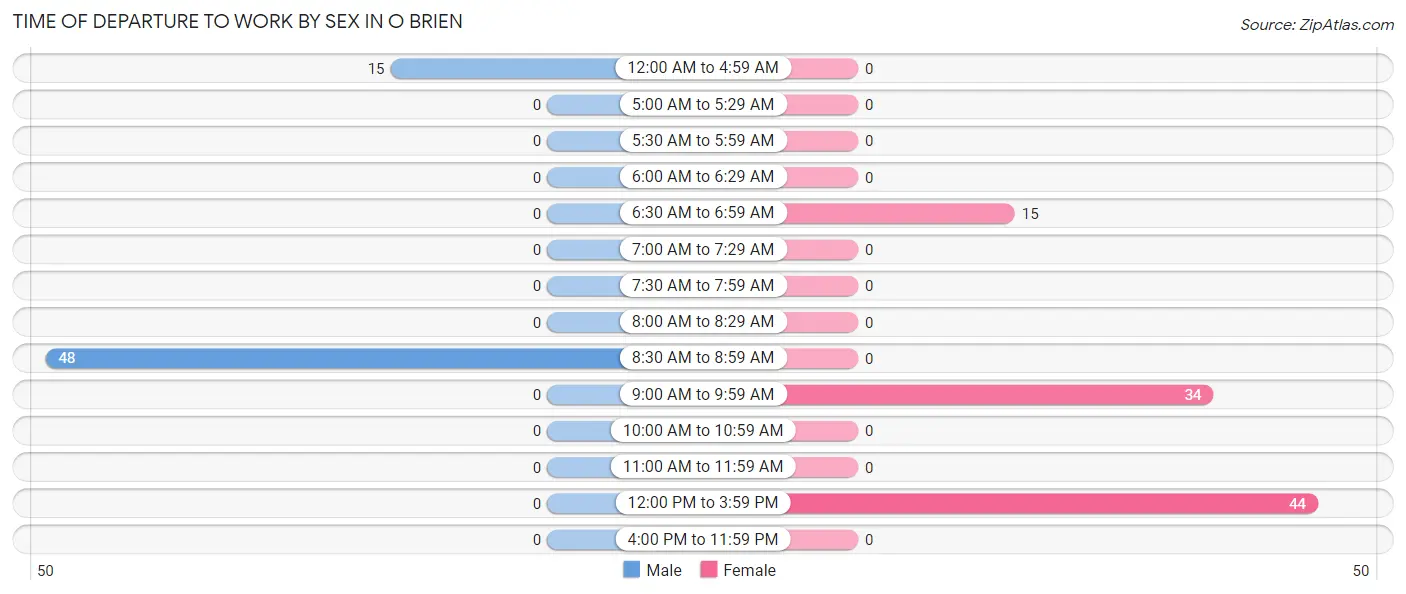
| Time of Departure | Male | Female |
| 12:00 AM to 4:59 AM | 15 (23.8%) | 0 (0.0%) |
| 5:00 AM to 5:29 AM | 0 (0.0%) | 0 (0.0%) |
| 5:30 AM to 5:59 AM | 0 (0.0%) | 0 (0.0%) |
| 6:00 AM to 6:29 AM | 0 (0.0%) | 0 (0.0%) |
| 6:30 AM to 6:59 AM | 0 (0.0%) | 15 (16.1%) |
| 7:00 AM to 7:29 AM | 0 (0.0%) | 0 (0.0%) |
| 7:30 AM to 7:59 AM | 0 (0.0%) | 0 (0.0%) |
| 8:00 AM to 8:29 AM | 0 (0.0%) | 0 (0.0%) |
| 8:30 AM to 8:59 AM | 48 (76.2%) | 0 (0.0%) |
| 9:00 AM to 9:59 AM | 0 (0.0%) | 34 (36.6%) |
| 10:00 AM to 10:59 AM | 0 (0.0%) | 0 (0.0%) |
| 11:00 AM to 11:59 AM | 0 (0.0%) | 0 (0.0%) |
| 12:00 PM to 3:59 PM | 0 (0.0%) | 44 (47.3%) |
| 4:00 PM to 11:59 PM | 0 (0.0%) | 0 (0.0%) |
| Total | 63 (100.0%) | 93 (100.0%) |
Housing Occupancy in O Brien
Occupancy by Ownership in O Brien
Of the total 334 dwellings in O Brien, owner-occupied units account for 334 (100.0%), while renter-occupied units make up 0 (0.0%).
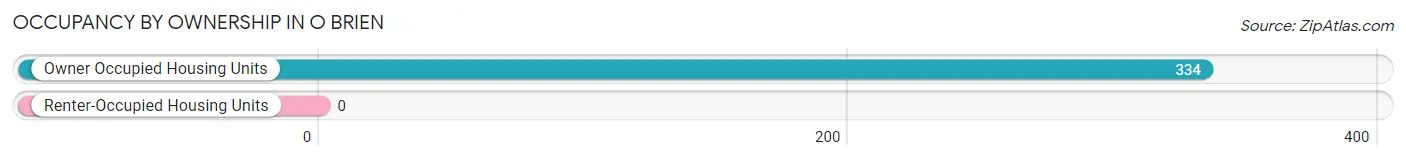
| Occupancy | # Housing Units | % Housing Units |
| Owner Occupied Housing Units | 334 | 100.0% |
| Renter-Occupied Housing Units | 0 | 0.0% |
| Total Occupied Housing Units | 334 | 100.0% |
Occupancy by Household Size in O Brien
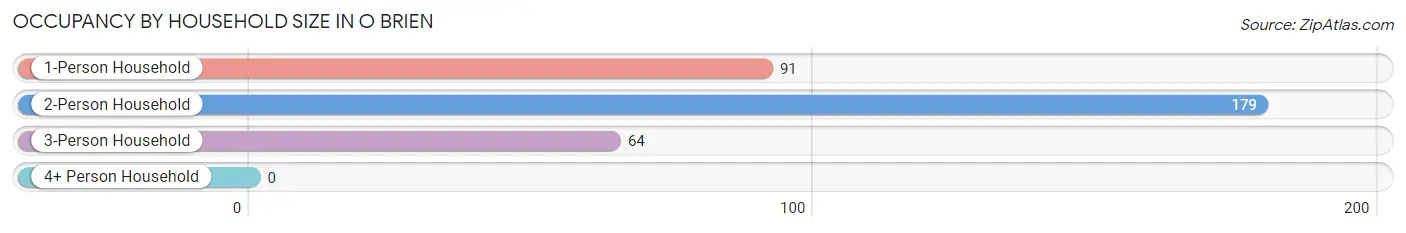
| Household Size | # Housing Units | % Housing Units |
| 1-Person Household | 91 | 27.3% |
| 2-Person Household | 179 | 53.6% |
| 3-Person Household | 64 | 19.2% |
| 4+ Person Household | 0 | 0.0% |
| Total Housing Units | 334 | 100.0% |
Occupancy by Ownership by Household Size in O Brien
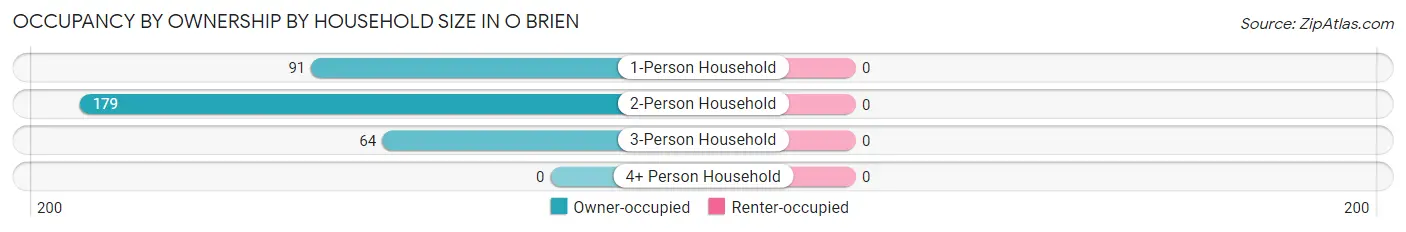
| Household Size | Owner-occupied | Renter-occupied |
| 1-Person Household | 91 (100.0%) | 0 (0.0%) |
| 2-Person Household | 179 (100.0%) | 0 (0.0%) |
| 3-Person Household | 64 (100.0%) | 0 (0.0%) |
| 4+ Person Household | 0 (0.0%) | 0 (0.0%) |
| Total Housing Units | 334 (100.0%) | 0 (0.0%) |
Occupancy by Educational Attainment in O Brien
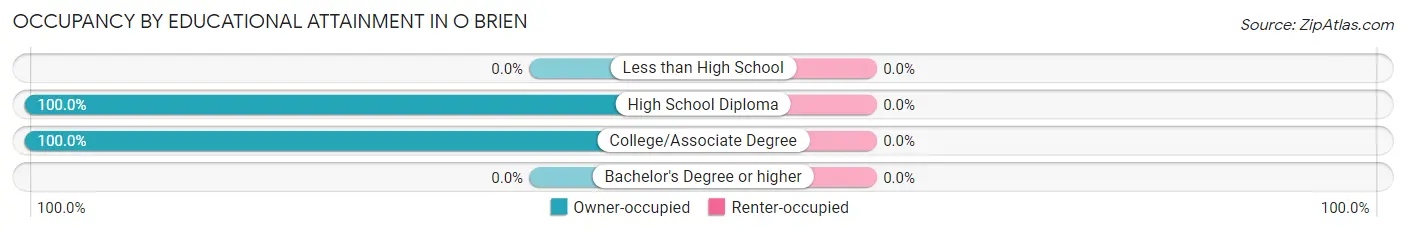
| Household Size | Owner-occupied | Renter-occupied |
| Less than High School | 0 (0.0%) | 0 (0.0%) |
| High School Diploma | 155 (100.0%) | 0 (0.0%) |
| College/Associate Degree | 179 (100.0%) | 0 (0.0%) |
| Bachelor's Degree or higher | 0 (0.0%) | 0 (0.0%) |
Occupancy by Age of Householder in O Brien
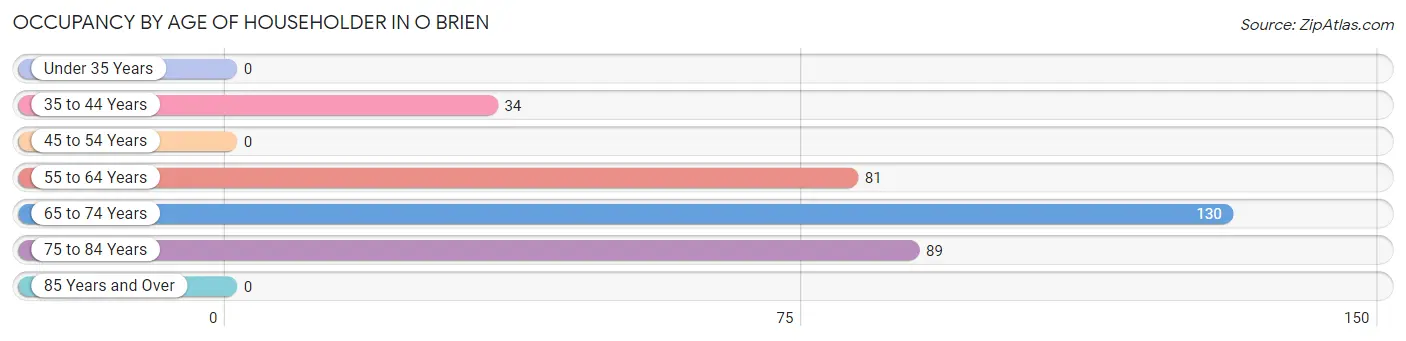
| Age Bracket | # Households | % Households |
| Under 35 Years | 0 | 0.0% |
| 35 to 44 Years | 34 | 10.2% |
| 45 to 54 Years | 0 | 0.0% |
| 55 to 64 Years | 81 | 24.2% |
| 65 to 74 Years | 130 | 38.9% |
| 75 to 84 Years | 89 | 26.7% |
| 85 Years and Over | 0 | 0.0% |
| Total | 334 | 100.0% |
Housing Finances in O Brien
Median Income by Occupancy in O Brien
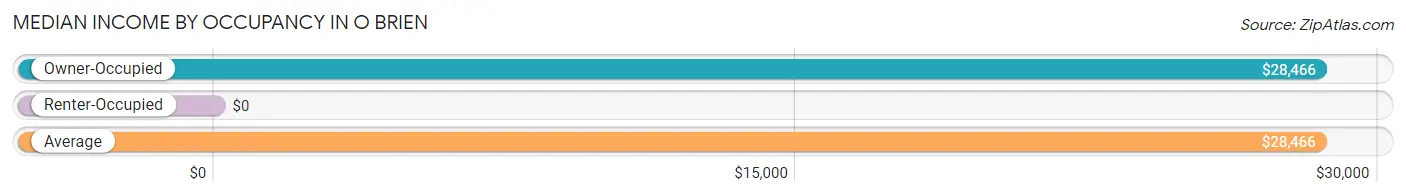
| Occupancy Type | # Households | Median Income |
| Owner-Occupied | 334 (100.0%) | $28,466 |
| Renter-Occupied | 0 (0.0%) | $0 |
| Average | 334 (100.0%) | $28,466 |
Occupancy by Householder Income Bracket in O Brien
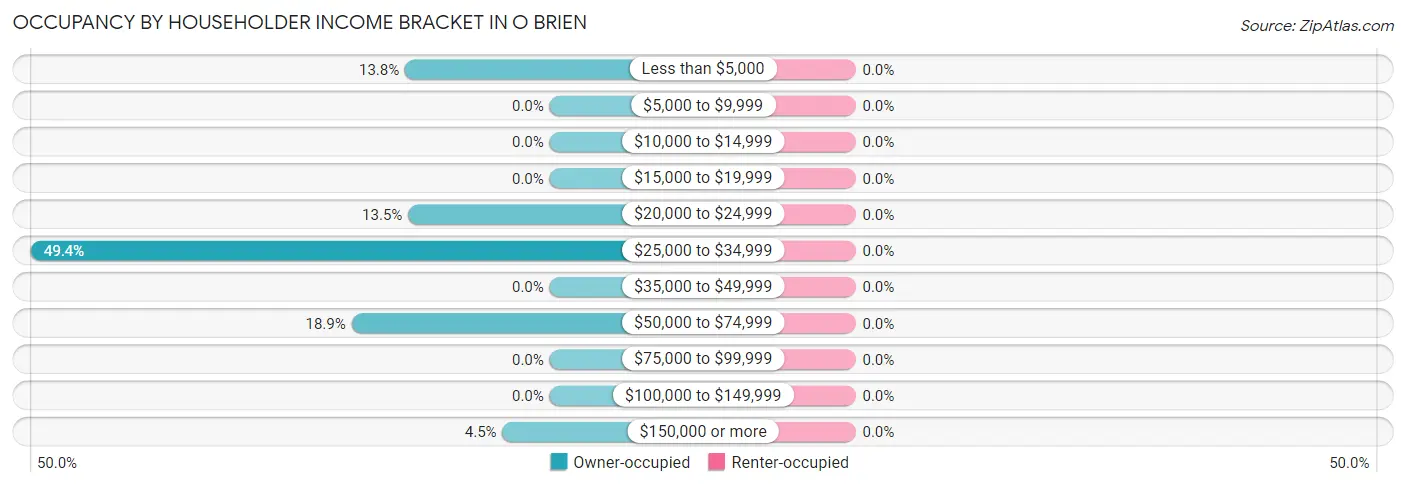
| Income Bracket | Owner-occupied | Renter-occupied |
| Less than $5,000 | 46 (13.8%) | 0 (0.0%) |
| $5,000 to $9,999 | 0 (0.0%) | 0 (0.0%) |
| $10,000 to $14,999 | 0 (0.0%) | 0 (0.0%) |
| $15,000 to $19,999 | 0 (0.0%) | 0 (0.0%) |
| $20,000 to $24,999 | 45 (13.5%) | 0 (0.0%) |
| $25,000 to $34,999 | 165 (49.4%) | 0 (0.0%) |
| $35,000 to $49,999 | 0 (0.0%) | 0 (0.0%) |
| $50,000 to $74,999 | 63 (18.9%) | 0 (0.0%) |
| $75,000 to $99,999 | 0 (0.0%) | 0 (0.0%) |
| $100,000 to $149,999 | 0 (0.0%) | 0 (0.0%) |
| $150,000 or more | 15 (4.5%) | 0 (0.0%) |
| Total | 334 (100.0%) | 0 (0.0%) |
Monthly Housing Cost Tiers in O Brien
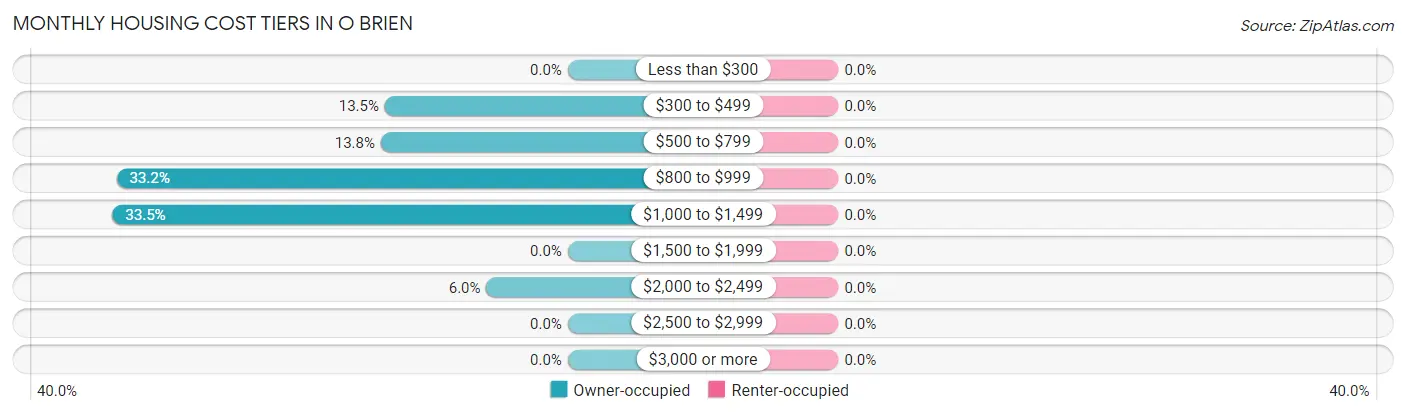
| Monthly Cost | Owner-occupied | Renter-occupied |
| Less than $300 | 0 (0.0%) | 0 (0.0%) |
| $300 to $499 | 45 (13.5%) | 0 (0.0%) |
| $500 to $799 | 46 (13.8%) | 0 (0.0%) |
| $800 to $999 | 111 (33.2%) | 0 (0.0%) |
| $1,000 to $1,499 | 112 (33.5%) | 0 (0.0%) |
| $1,500 to $1,999 | 0 (0.0%) | 0 (0.0%) |
| $2,000 to $2,499 | 20 (6.0%) | 0 (0.0%) |
| $2,500 to $2,999 | 0 (0.0%) | 0 (0.0%) |
| $3,000 or more | 0 (0.0%) | 0 (0.0%) |
| Total | 334 (100.0%) | 0 (0.0%) |
Physical Housing Characteristics in O Brien
Housing Structures in O Brien
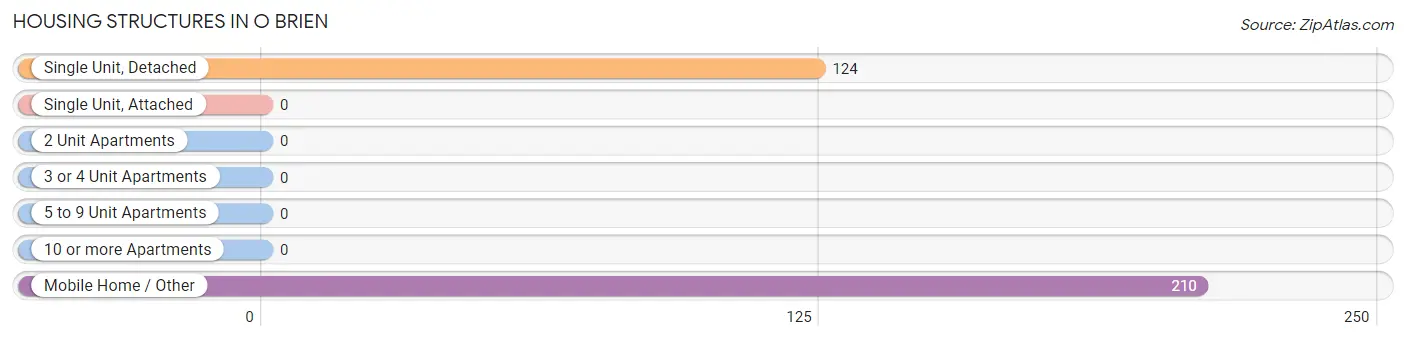
| Structure Type | # Housing Units | % Housing Units |
| Single Unit, Detached | 124 | 37.1% |
| Single Unit, Attached | 0 | 0.0% |
| 2 Unit Apartments | 0 | 0.0% |
| 3 or 4 Unit Apartments | 0 | 0.0% |
| 5 to 9 Unit Apartments | 0 | 0.0% |
| 10 or more Apartments | 0 | 0.0% |
| Mobile Home / Other | 210 | 62.9% |
| Total | 334 | 100.0% |
Housing Structures by Occupancy in O Brien
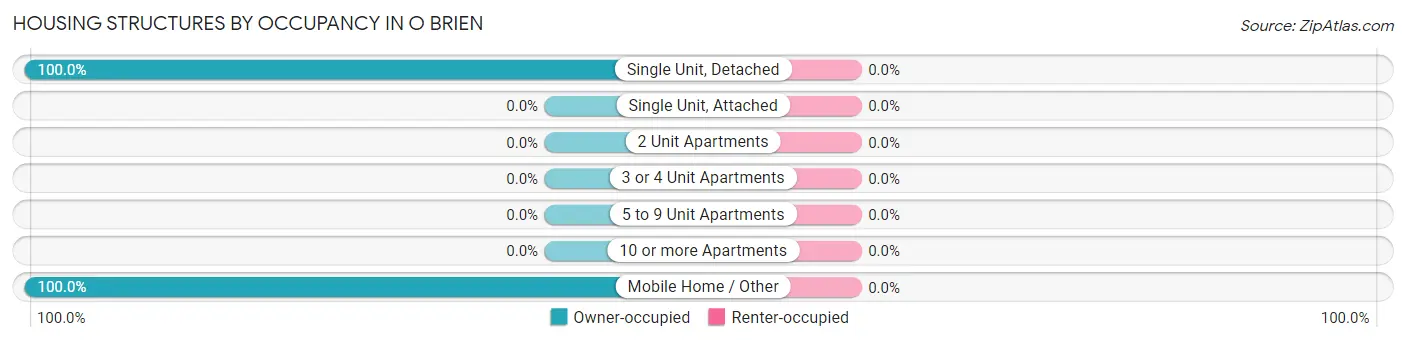
| Structure Type | Owner-occupied | Renter-occupied |
| Single Unit, Detached | 124 (100.0%) | 0 (0.0%) |
| Single Unit, Attached | 0 (0.0%) | 0 (0.0%) |
| 2 Unit Apartments | 0 (0.0%) | 0 (0.0%) |
| 3 or 4 Unit Apartments | 0 (0.0%) | 0 (0.0%) |
| 5 to 9 Unit Apartments | 0 (0.0%) | 0 (0.0%) |
| 10 or more Apartments | 0 (0.0%) | 0 (0.0%) |
| Mobile Home / Other | 210 (100.0%) | 0 (0.0%) |
| Total | 334 (100.0%) | 0 (0.0%) |
Housing Structures by Number of Rooms in O Brien
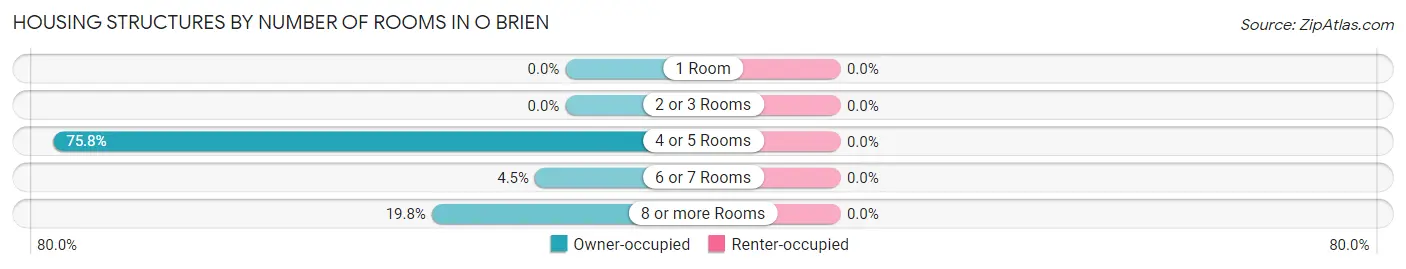
| Number of Rooms | Owner-occupied | Renter-occupied |
| 1 Room | 0 (0.0%) | 0 (0.0%) |
| 2 or 3 Rooms | 0 (0.0%) | 0 (0.0%) |
| 4 or 5 Rooms | 253 (75.7%) | 0 (0.0%) |
| 6 or 7 Rooms | 15 (4.5%) | 0 (0.0%) |
| 8 or more Rooms | 66 (19.8%) | 0 (0.0%) |
| Total | 334 (100.0%) | 0 (0.0%) |
Housing Structure by Heating Type in O Brien
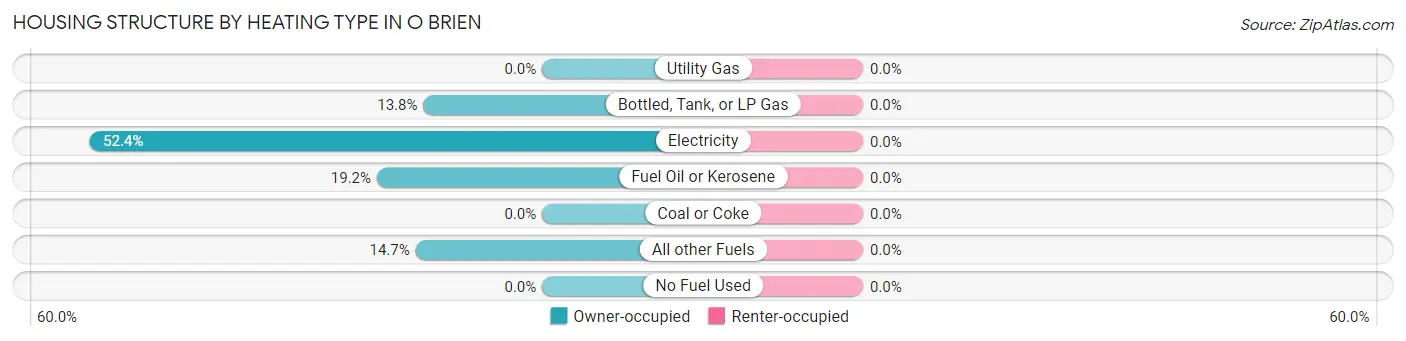
| Heating Type | Owner-occupied | Renter-occupied |
| Utility Gas | 0 (0.0%) | 0 (0.0%) |
| Bottled, Tank, or LP Gas | 46 (13.8%) | 0 (0.0%) |
| Electricity | 175 (52.4%) | 0 (0.0%) |
| Fuel Oil or Kerosene | 64 (19.2%) | 0 (0.0%) |
| Coal or Coke | 0 (0.0%) | 0 (0.0%) |
| All other Fuels | 49 (14.7%) | 0 (0.0%) |
| No Fuel Used | 0 (0.0%) | 0 (0.0%) |
| Total | 334 (100.0%) | 0 (0.0%) |
Household Vehicle Usage in O Brien
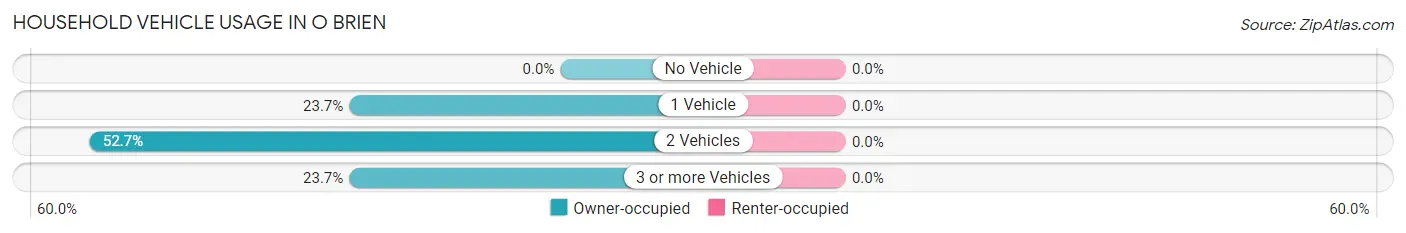
| Vehicles per Household | Owner-occupied | Renter-occupied |
| No Vehicle | 0 (0.0%) | 0 (0.0%) |
| 1 Vehicle | 79 (23.6%) | 0 (0.0%) |
| 2 Vehicles | 176 (52.7%) | 0 (0.0%) |
| 3 or more Vehicles | 79 (23.6%) | 0 (0.0%) |
| Total | 334 (100.0%) | 0 (0.0%) |
Real Estate & Mortgages in O Brien
Real Estate and Mortgage Overview in O Brien
| Characteristic | Without Mortgage | With Mortgage |
| Housing Units | 91 | 243 |
| Median Property Value | - | - |
| Median Household Income | - | - |
| Monthly Housing Costs | - | - |
| Real Estate Taxes | - | - |
Property Value by Mortgage Status in O Brien
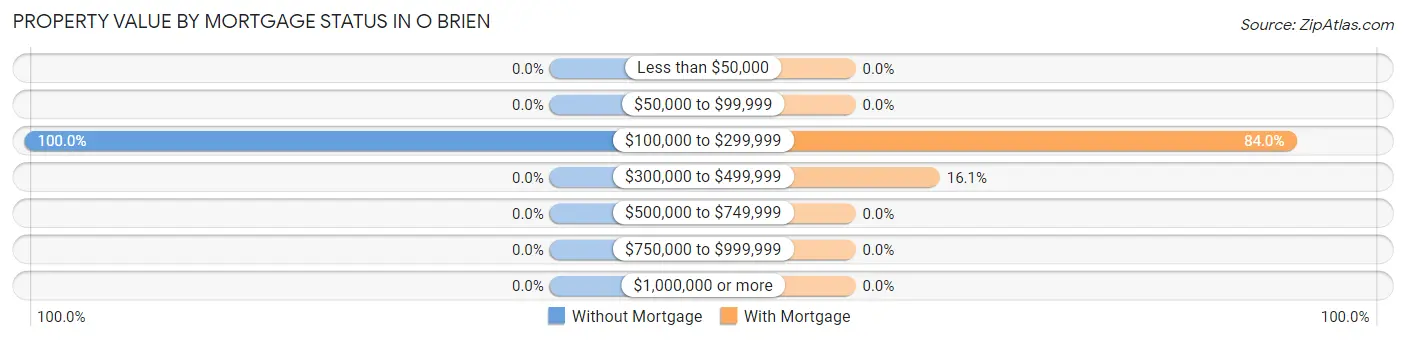
| Property Value | Without Mortgage | With Mortgage |
| Less than $50,000 | 0 (0.0%) | 0 (0.0%) |
| $50,000 to $99,999 | 0 (0.0%) | 0 (0.0%) |
| $100,000 to $299,999 | 91 (100.0%) | 204 (84.0%) |
| $300,000 to $499,999 | 0 (0.0%) | 39 (16.1%) |
| $500,000 to $749,999 | 0 (0.0%) | 0 (0.0%) |
| $750,000 to $999,999 | 0 (0.0%) | 0 (0.0%) |
| $1,000,000 or more | 0 (0.0%) | 0 (0.0%) |
| Total | 91 (100.0%) | 243 (100.0%) |
Household Income by Mortgage Status in O Brien
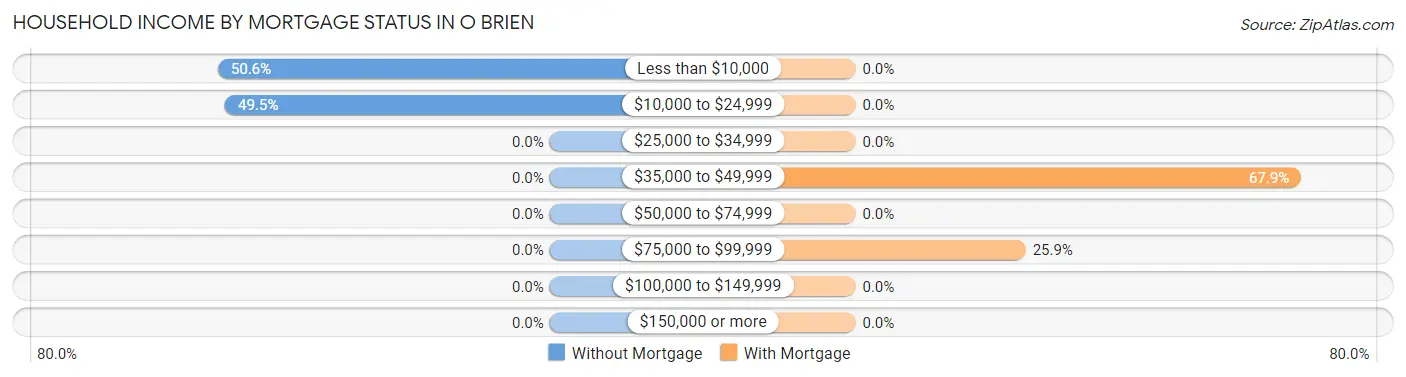
| Household Income | Without Mortgage | With Mortgage |
| Less than $10,000 | 46 (50.5%) | 0 (0.0%) |
| $10,000 to $24,999 | 45 (49.4%) | 0 (0.0%) |
| $25,000 to $34,999 | 0 (0.0%) | 0 (0.0%) |
| $35,000 to $49,999 | 0 (0.0%) | 165 (67.9%) |
| $50,000 to $74,999 | 0 (0.0%) | 0 (0.0%) |
| $75,000 to $99,999 | 0 (0.0%) | 63 (25.9%) |
| $100,000 to $149,999 | 0 (0.0%) | 0 (0.0%) |
| $150,000 or more | 0 (0.0%) | 0 (0.0%) |
| Total | 91 (100.0%) | 243 (100.0%) |
Property Value to Household Income Ratio in O Brien
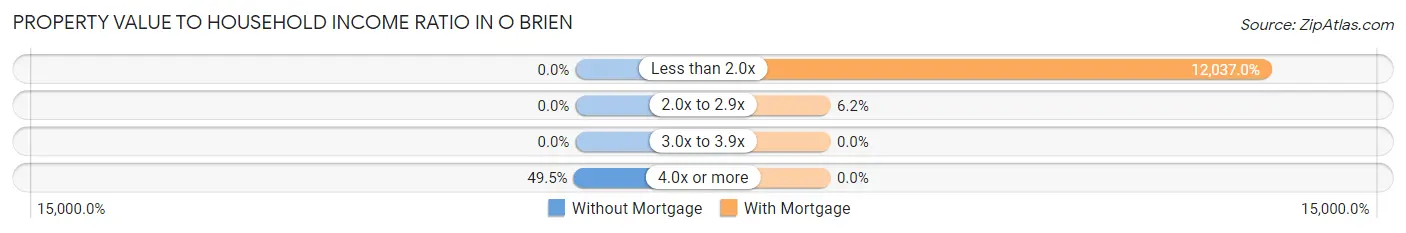
| Value-to-Income Ratio | Without Mortgage | With Mortgage |
| Less than 2.0x | 0 (0.0%) | 29,250 (12,037.0%) |
| 2.0x to 2.9x | 0 (0.0%) | 15 (6.2%) |
| 3.0x to 3.9x | 0 (0.0%) | 0 (0.0%) |
| 4.0x or more | 45 (49.4%) | 0 (0.0%) |
| Total | 91 (100.0%) | 243 (100.0%) |
Real Estate Taxes by Mortgage Status in O Brien
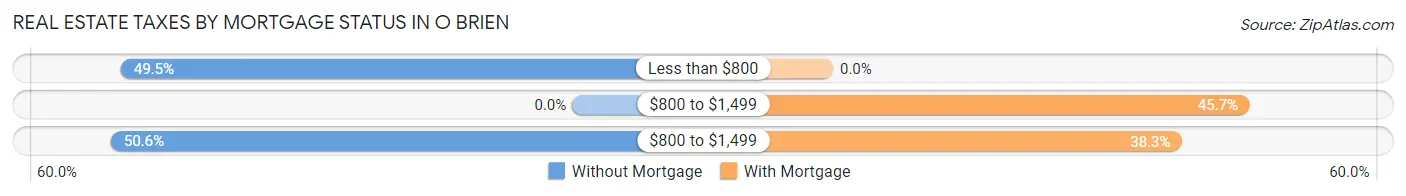
| Property Taxes | Without Mortgage | With Mortgage |
| Less than $800 | 45 (49.4%) | 0 (0.0%) |
| $800 to $1,499 | 0 (0.0%) | 111 (45.7%) |
| $800 to $1,499 | 46 (50.5%) | 93 (38.3%) |
| Total | 91 (100.0%) | 243 (100.0%) |
Health & Disability in O Brien
Health Insurance Coverage by Age in O Brien
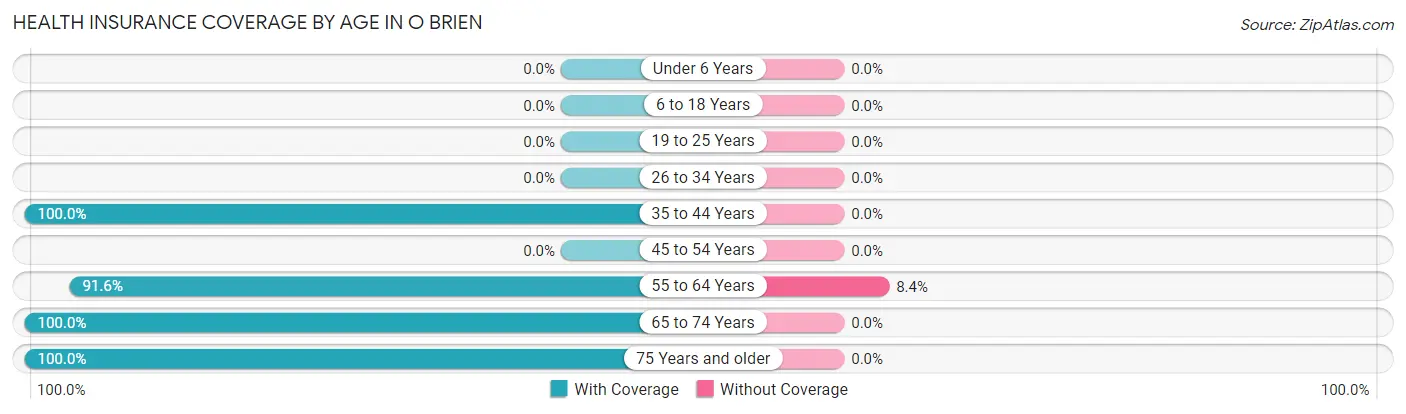
| Age Bracket | With Coverage | Without Coverage |
| Under 6 Years | 0 (0.0%) | 0 (0.0%) |
| 6 to 18 Years | 0 (0.0%) | 0 (0.0%) |
| 19 to 25 Years | 0 (0.0%) | 0 (0.0%) |
| 26 to 34 Years | 0 (0.0%) | 0 (0.0%) |
| 35 to 44 Years | 71 (100.0%) | 0 (0.0%) |
| 45 to 54 Years | 0 (0.0%) | 0 (0.0%) |
| 55 to 64 Years | 164 (91.6%) | 15 (8.4%) |
| 65 to 74 Years | 263 (100.0%) | 0 (0.0%) |
| 75 Years and older | 106 (100.0%) | 0 (0.0%) |
| Total | 604 (97.6%) | 15 (2.4%) |
Health Insurance Coverage by Citizenship Status in O Brien
| Citizenship Status | With Coverage | Without Coverage |
| Native Born | 0 (0.0%) | 0 (0.0%) |
| Foreign Born, Citizen | 0 (0.0%) | 0 (0.0%) |
| Foreign Born, not a Citizen | 0 (0.0%) | 0 (0.0%) |
Health Insurance Coverage by Household Income in O Brien
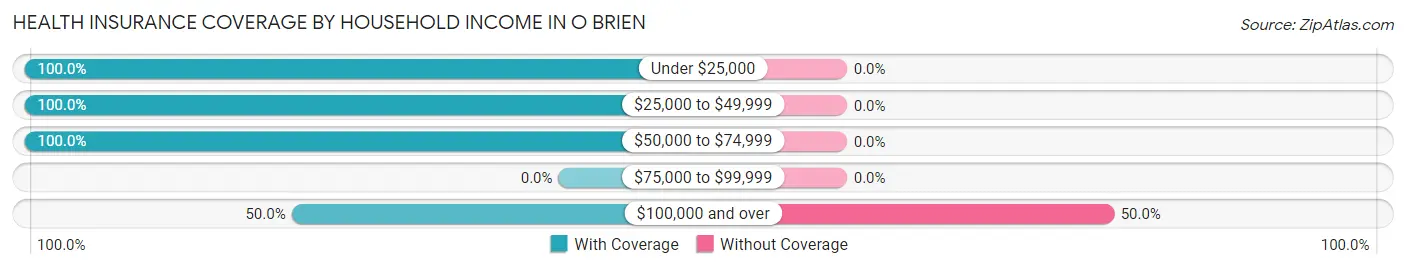
| Household Income | With Coverage | Without Coverage |
| Under $25,000 | 91 (100.0%) | 0 (0.0%) |
| $25,000 to $49,999 | 323 (100.0%) | 0 (0.0%) |
| $50,000 to $74,999 | 175 (100.0%) | 0 (0.0%) |
| $75,000 to $99,999 | 0 (0.0%) | 0 (0.0%) |
| $100,000 and over | 15 (50.0%) | 15 (50.0%) |
Public vs Private Health Insurance Coverage by Age in O Brien
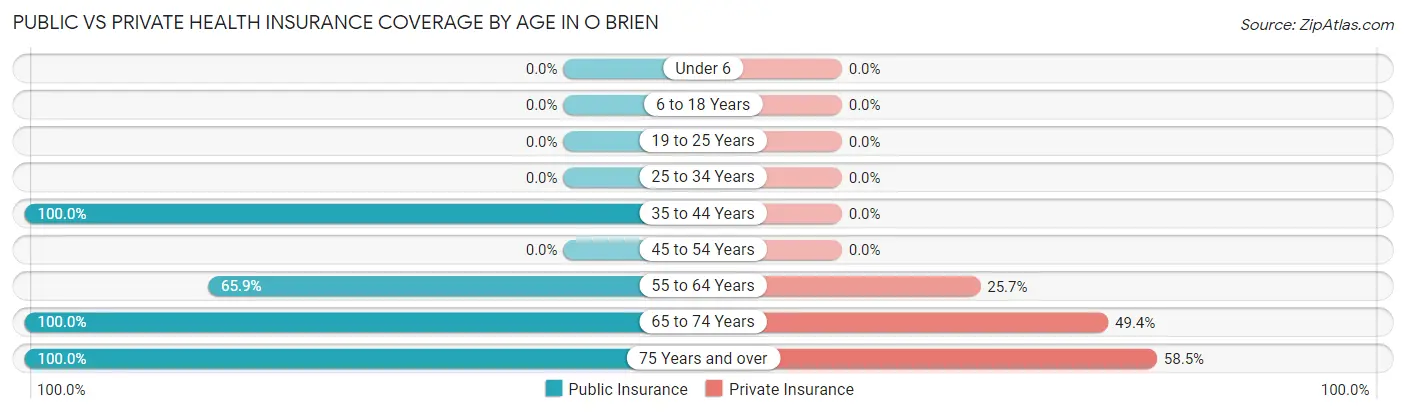
| Age Bracket | Public Insurance | Private Insurance |
| Under 6 | 0 (0.0%) | 0 (0.0%) |
| 6 to 18 Years | 0 (0.0%) | 0 (0.0%) |
| 19 to 25 Years | 0 (0.0%) | 0 (0.0%) |
| 25 to 34 Years | 0 (0.0%) | 0 (0.0%) |
| 35 to 44 Years | 71 (100.0%) | 0 (0.0%) |
| 45 to 54 Years | 0 (0.0%) | 0 (0.0%) |
| 55 to 64 Years | 118 (65.9%) | 46 (25.7%) |
| 65 to 74 Years | 263 (100.0%) | 130 (49.4%) |
| 75 Years and over | 106 (100.0%) | 62 (58.5%) |
| Total | 558 (90.1%) | 238 (38.5%) |
Disability Status by Sex by Age in O Brien
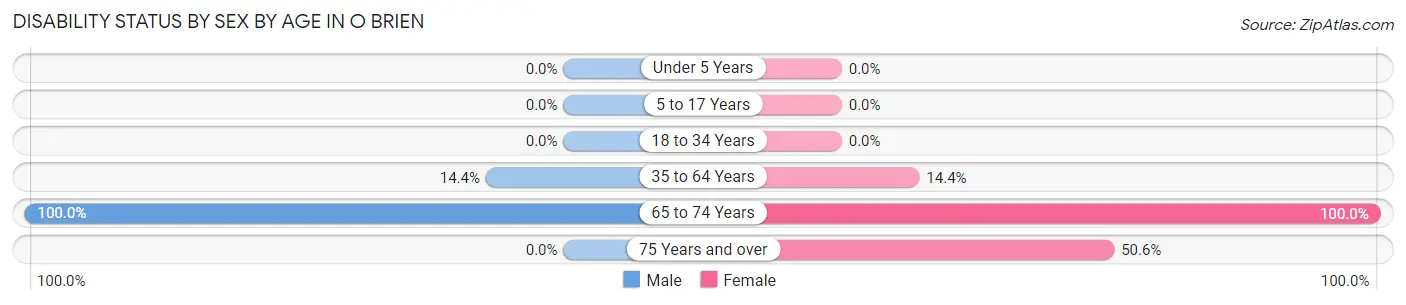
| Age Bracket | Male | Female |
| Under 5 Years | 0 (0.0%) | 0 (0.0%) |
| 5 to 17 Years | 0 (0.0%) | 0 (0.0%) |
| 18 to 34 Years | 0 (0.0%) | 0 (0.0%) |
| 35 to 64 Years | 20 (14.4%) | 16 (14.4%) |
| 65 to 74 Years | 86 (100.0%) | 177 (100.0%) |
| 75 Years and over | 0 (0.0%) | 45 (50.6%) |
Disability Class by Sex by Age in O Brien
Disability Class: Hearing Difficulty
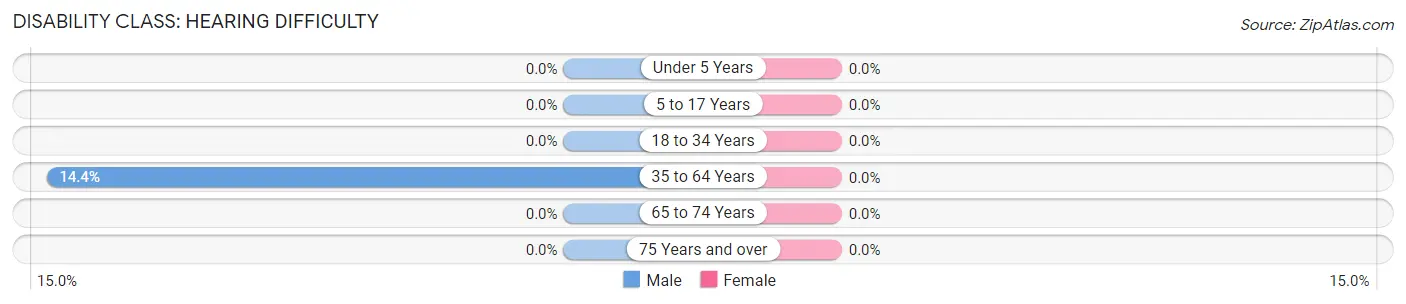
| Age Bracket | Male | Female |
| Under 5 Years | 0 (0.0%) | 0 (0.0%) |
| 5 to 17 Years | 0 (0.0%) | 0 (0.0%) |
| 18 to 34 Years | 0 (0.0%) | 0 (0.0%) |
| 35 to 64 Years | 20 (14.4%) | 0 (0.0%) |
| 65 to 74 Years | 0 (0.0%) | 0 (0.0%) |
| 75 Years and over | 0 (0.0%) | 0 (0.0%) |
Disability Class: Vision Difficulty
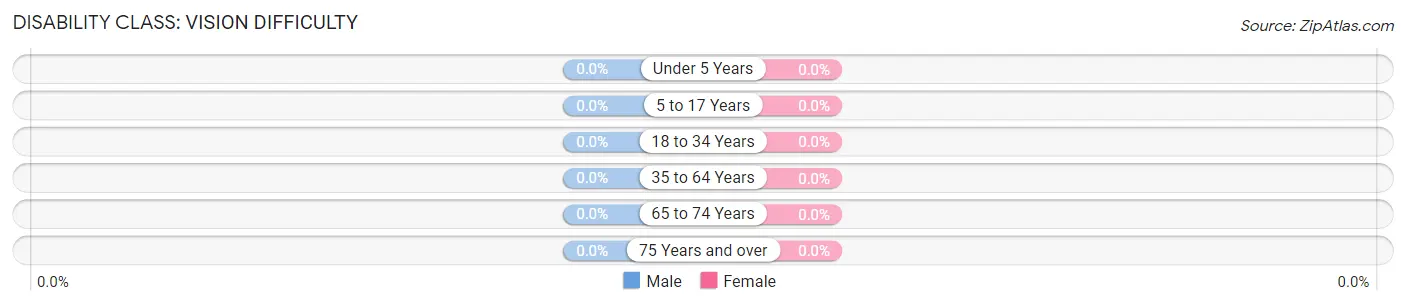
| Age Bracket | Male | Female |
| Under 5 Years | 0 (0.0%) | 0 (0.0%) |
| 5 to 17 Years | 0 (0.0%) | 0 (0.0%) |
| 18 to 34 Years | 0 (0.0%) | 0 (0.0%) |
| 35 to 64 Years | 0 (0.0%) | 0 (0.0%) |
| 65 to 74 Years | 0 (0.0%) | 0 (0.0%) |
| 75 Years and over | 0 (0.0%) | 0 (0.0%) |
Disability Class: Cognitive Difficulty
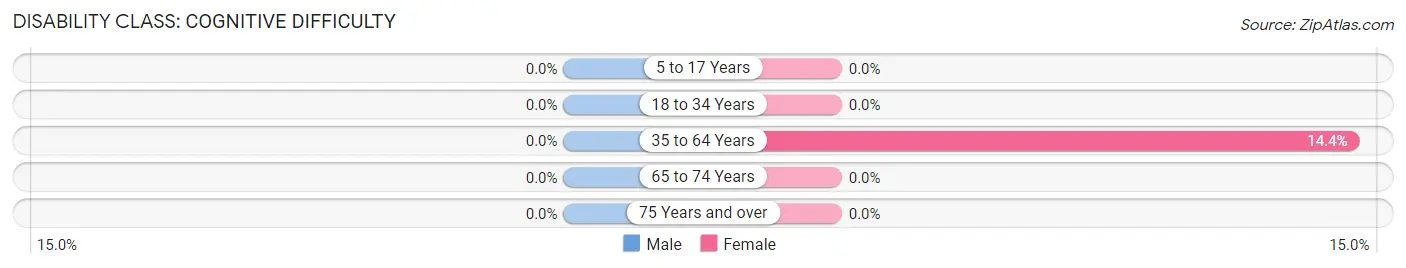
| Age Bracket | Male | Female |
| 5 to 17 Years | 0 (0.0%) | 0 (0.0%) |
| 18 to 34 Years | 0 (0.0%) | 0 (0.0%) |
| 35 to 64 Years | 0 (0.0%) | 16 (14.4%) |
| 65 to 74 Years | 0 (0.0%) | 0 (0.0%) |
| 75 Years and over | 0 (0.0%) | 0 (0.0%) |
Disability Class: Ambulatory Difficulty
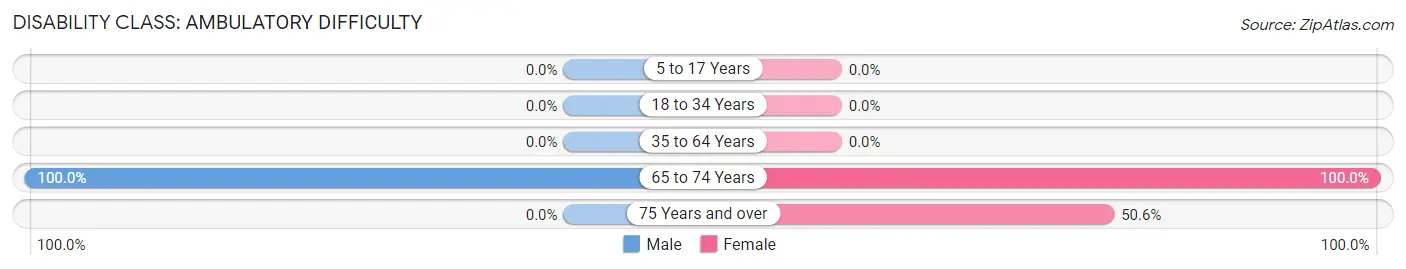
| Age Bracket | Male | Female |
| 5 to 17 Years | 0 (0.0%) | 0 (0.0%) |
| 18 to 34 Years | 0 (0.0%) | 0 (0.0%) |
| 35 to 64 Years | 0 (0.0%) | 0 (0.0%) |
| 65 to 74 Years | 86 (100.0%) | 177 (100.0%) |
| 75 Years and over | 0 (0.0%) | 45 (50.6%) |
Disability Class: Self-Care Difficulty
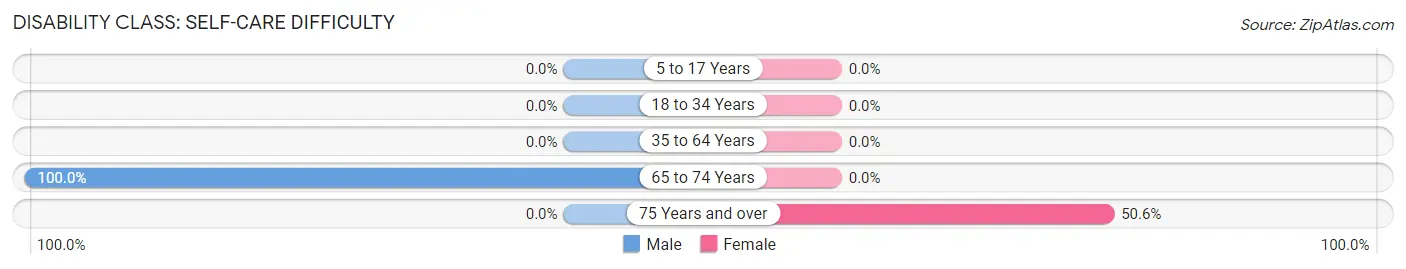
| Age Bracket | Male | Female |
| 5 to 17 Years | 0 (0.0%) | 0 (0.0%) |
| 18 to 34 Years | 0 (0.0%) | 0 (0.0%) |
| 35 to 64 Years | 0 (0.0%) | 0 (0.0%) |
| 65 to 74 Years | 86 (100.0%) | 0 (0.0%) |
| 75 Years and over | 0 (0.0%) | 45 (50.6%) |
Technology Access in O Brien
Computing Device Access in O Brien

| Device Type | # Households | % Households |
| Desktop or Laptop | 334 | 100.0% |
| Smartphone | 112 | 33.5% |
| Tablet | 112 | 33.5% |
| No Computing Device | 0 | 0.0% |
| Total | 334 | 100.0% |
Internet Access in O Brien
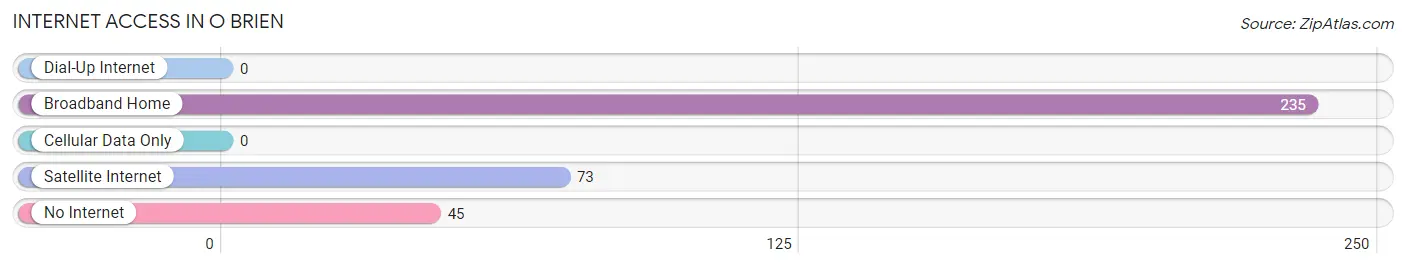
| Internet Type | # Households | % Households |
| Dial-Up Internet | 0 | 0.0% |
| Broadband Home | 235 | 70.4% |
| Cellular Data Only | 0 | 0.0% |
| Satellite Internet | 73 | 21.9% |
| No Internet | 45 | 13.5% |
| Total | 334 | 100.0% |
O Brien Summary
O'Brien is a small unincorporated community located in the U.S. state of Oregon. It is situated in the foothills of the Cascade Mountains, approximately 20 miles east of Roseburg. The town is named after the O'Brien family, who settled in the area in the late 1800s.
History
The first settlers in the area were the O'Brien family, who arrived in the late 1800s. The family established a homestead and began farming the land. The town was officially established in 1891, when the post office was opened. The town grew slowly over the years, and by the early 1900s, it had a population of around 200 people.
The town was primarily an agricultural community, with the main crops being wheat, oats, and hay. In the 1920s, the town began to experience a decline in population as people moved away to larger cities. By the 1950s, the population had dropped to around 100 people.
Geography
O'Brien is located in the foothills of the Cascade Mountains, approximately 20 miles east of Roseburg. The town is situated at an elevation of 1,400 feet above sea level. The climate is mild, with temperatures ranging from the mid-30s in the winter to the mid-80s in the summer.
The town is surrounded by rolling hills and forests, and is home to a variety of wildlife, including deer, elk, and black bears. The nearby Umpqua River provides a variety of recreational activities, including fishing, boating, and swimming.
Economy
The economy of O'Brien is primarily based on agriculture. The main crops are wheat, oats, and hay. The town also has a small lumber industry, with several sawmills located in the area.
In recent years, the town has seen an increase in tourism, with visitors coming to enjoy the area's natural beauty and outdoor activities. The town also has a few small businesses, including a general store, a cafe, and a gas station.
Demographics
As of the 2010 census, the population of O'Brien was estimated to be around 200 people. The racial makeup of the town was 97.5% White, 0.5% Native American, 0.5% Asian, and 1.5% from other races.
The median household income in O'Brien was estimated to be $37,500 in 2010. The median age of the population was estimated to be 44.5 years. The town has a high rate of homeownership, with around 75% of the population owning their own homes.
Common Questions
What is Per Capita Income in O Brien?
Per Capita income in O Brien is $18,201.
What is the Median Household income in O Brien?
Median Household Income in O Brien is $28,466.
What is Inequality or Gini Index in O Brien?
Inequality or Gini Index in O Brien is 0.39.
What is the Total Population of O Brien?
Total Population of O Brien is 619.
What is the Total Male Population of O Brien?
Total Male Population of O Brien is 242.
What is the Total Female Population of O Brien?
Total Female Population of O Brien is 377.
What is the Ratio of Males per 100 Females in O Brien?
There are 64.19 Males per 100 Females in O Brien.
What is the Ratio of Females per 100 Males in O Brien?
There are 155.79 Females per 100 Males in O Brien.
What is the Median Population Age in O Brien?
Median Population Age in O Brien is 66.5 Years.
What is the Average Family Size in O Brien
Average Family Size in O Brien is 2.1 People.
What is the Average Household Size in O Brien
Average Household Size in O Brien is 1.9 People.
How Large is the Labor Force in O Brien?
There are 193 People in the Labor Forcein in O Brien.
What is the Percentage of People in the Labor Force in O Brien?
31.2% of People are in the Labor Force in O Brien.
What is the Unemployment Rate in O Brien?
Unemployment Rate in O Brien is 19.2%.