Lebanon, OR Map & Demographics
Lebanon Map
Lebanon Overview
$29,832
PER CAPITA INCOME
$61,770
AVG FAMILY INCOME
$53,246
AVG HOUSEHOLD INCOME
20.7%
WAGE / INCOME GAP [ % ]
79.3¢/ $1
WAGE / INCOME GAP [ $ ]
0.44
INEQUALITY / GINI INDEX
18,587
TOTAL POPULATION
9,074
MALE POPULATION
9,513
FEMALE POPULATION
95.39
MALES / 100 FEMALES
104.84
FEMALES / 100 MALES
37.3
MEDIAN AGE
3.0
AVG FAMILY SIZE
2.5
AVG HOUSEHOLD SIZE
8,969
LABOR FORCE [ PEOPLE ]
59.8%
PERCENT IN LABOR FORCE
7.3%
UNEMPLOYMENT RATE
Lebanon Zip Codes
Lebanon Area Codes
Income in Lebanon
Income Overview in Lebanon
Per Capita Income in Lebanon is $29,832, while median incomes of families and households are $61,770 and $53,246 respectively.
| Characteristic | Number | Measure |
| Per Capita Income | 18,587 | $29,832 |
| Median Family Income | 4,516 | $61,770 |
| Mean Family Income | 4,516 | $78,451 |
| Median Household Income | 7,458 | $53,246 |
| Mean Household Income | 7,458 | $72,683 |
| Income Deficit | 4,516 | $0 |
| Wage / Income Gap (%) | 18,587 | 20.75% |
| Wage / Income Gap ($) | 18,587 | 79.25¢ per $1 |
| Gini / Inequality Index | 18,587 | 0.44 |
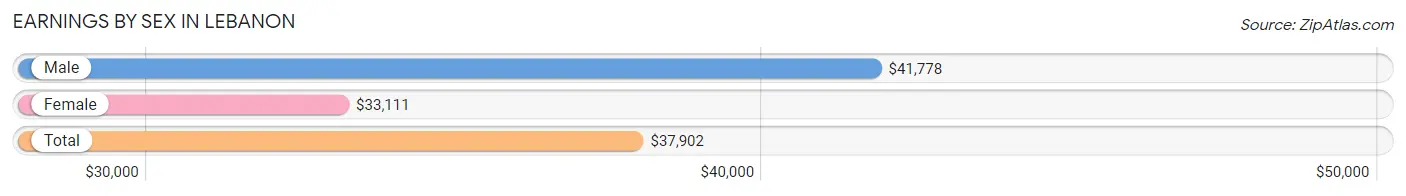
Earnings by Sex in Lebanon
Average Earnings in Lebanon are $37,902, $41,778 for men and $33,111 for women, a difference of 20.7%.
| Sex | Number | Average Earnings |
| Male | 4,825 (53.6%) | $41,778 |
| Female | 4,178 (46.4%) | $33,111 |
| Total | 9,003 (100.0%) | $37,902 |
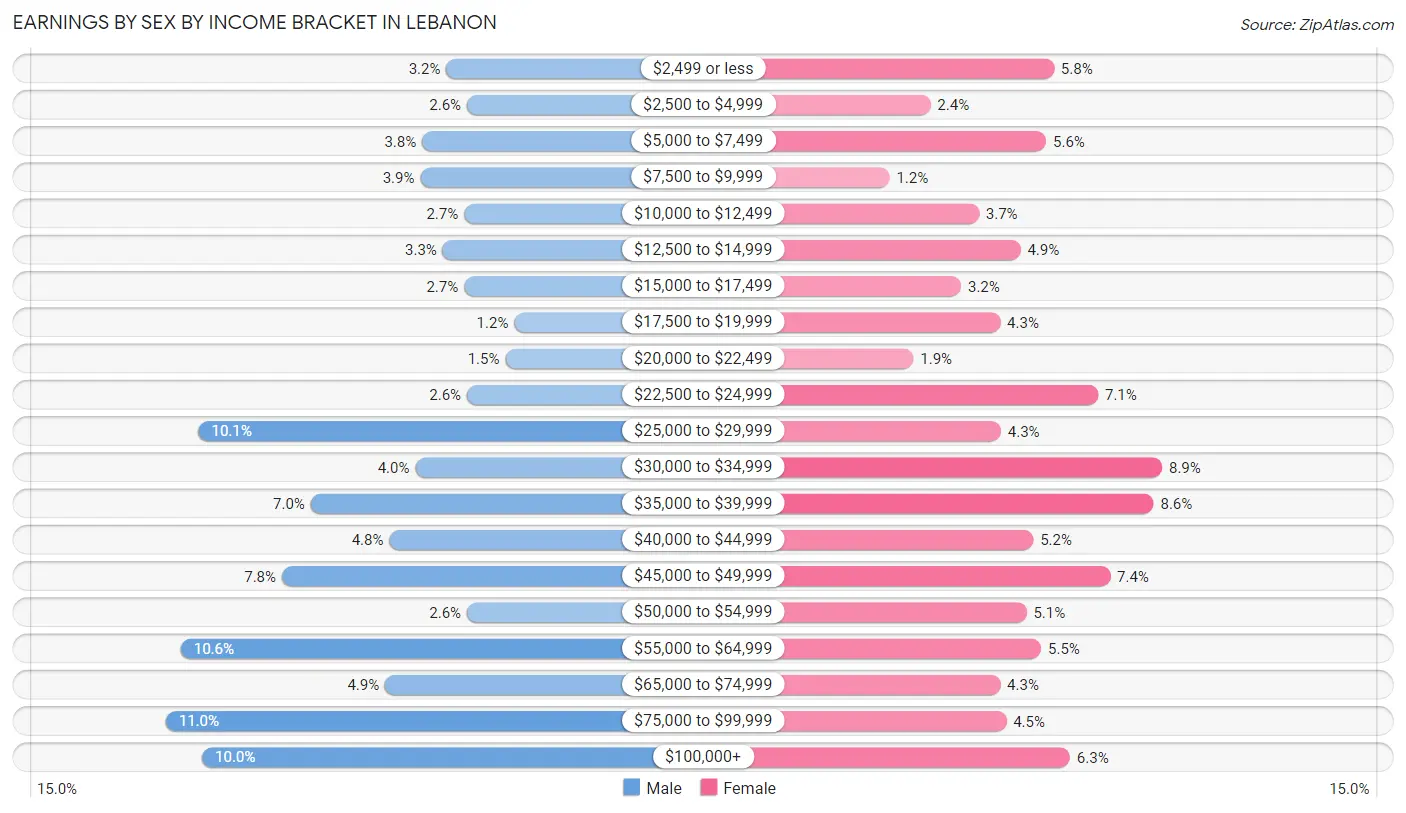
Earnings by Sex by Income Bracket in Lebanon
The most common earnings brackets in Lebanon are $75,000 to $99,999 for men (532 | 11.0%) and $30,000 to $34,999 for women (370 | 8.9%).
| Income | Male | Female |
| $2,499 or less | 152 (3.2%) | 243 (5.8%) |
| $2,500 to $4,999 | 124 (2.6%) | 98 (2.4%) |
| $5,000 to $7,499 | 185 (3.8%) | 234 (5.6%) |
| $7,500 to $9,999 | 187 (3.9%) | 50 (1.2%) |
| $10,000 to $12,499 | 128 (2.6%) | 155 (3.7%) |
| $12,500 to $14,999 | 157 (3.3%) | 204 (4.9%) |
| $15,000 to $17,499 | 128 (2.6%) | 134 (3.2%) |
| $17,500 to $19,999 | 60 (1.2%) | 180 (4.3%) |
| $20,000 to $22,499 | 72 (1.5%) | 78 (1.9%) |
| $22,500 to $24,999 | 124 (2.6%) | 295 (7.1%) |
| $25,000 to $29,999 | 488 (10.1%) | 181 (4.3%) |
| $30,000 to $34,999 | 194 (4.0%) | 370 (8.9%) |
| $35,000 to $39,999 | 336 (7.0%) | 360 (8.6%) |
| $40,000 to $44,999 | 229 (4.8%) | 219 (5.2%) |
| $45,000 to $49,999 | 375 (7.8%) | 309 (7.4%) |
| $50,000 to $54,999 | 124 (2.6%) | 211 (5.1%) |
| $55,000 to $64,999 | 512 (10.6%) | 228 (5.5%) |
| $65,000 to $74,999 | 235 (4.9%) | 180 (4.3%) |
| $75,000 to $99,999 | 532 (11.0%) | 187 (4.5%) |
| $100,000+ | 483 (10.0%) | 262 (6.3%) |
| Total | 4,825 (100.0%) | 4,178 (100.0%) |
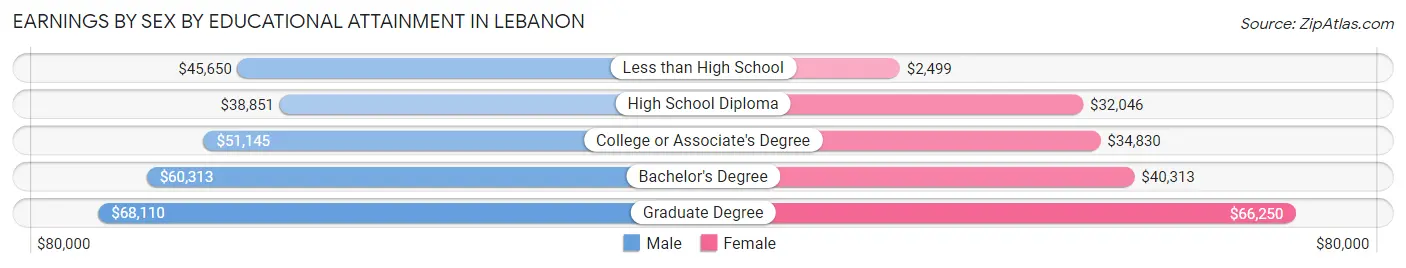
Earnings by Sex by Educational Attainment in Lebanon
Average earnings in Lebanon are $47,692 for men and $37,652 for women, a difference of 21.0%. Men with an educational attainment of graduate degree enjoy the highest average annual earnings of $68,110, while those with high school diploma education earn the least with $38,851. Women with an educational attainment of graduate degree earn the most with the average annual earnings of $66,250, while those with less than high school education have the smallest earnings of $2,499.
| Educational Attainment | Male Income | Female Income |
| Less than High School | $45,650 | $2,499 |
| High School Diploma | $38,851 | $32,046 |
| College or Associate's Degree | $51,145 | $34,830 |
| Bachelor's Degree | $60,313 | $40,313 |
| Graduate Degree | $68,110 | $66,250 |
| Total | $47,692 | $37,652 |
Family Income in Lebanon
Family Income Brackets in Lebanon
According to the Lebanon family income data, there are 885 families falling into the $50,000 to $74,999 income range, which is the most common income bracket and makes up 19.6% of all families. Conversely, the $10,000 to $14,999 income bracket is the least frequent group with only 86 families (1.9%) belonging to this category.
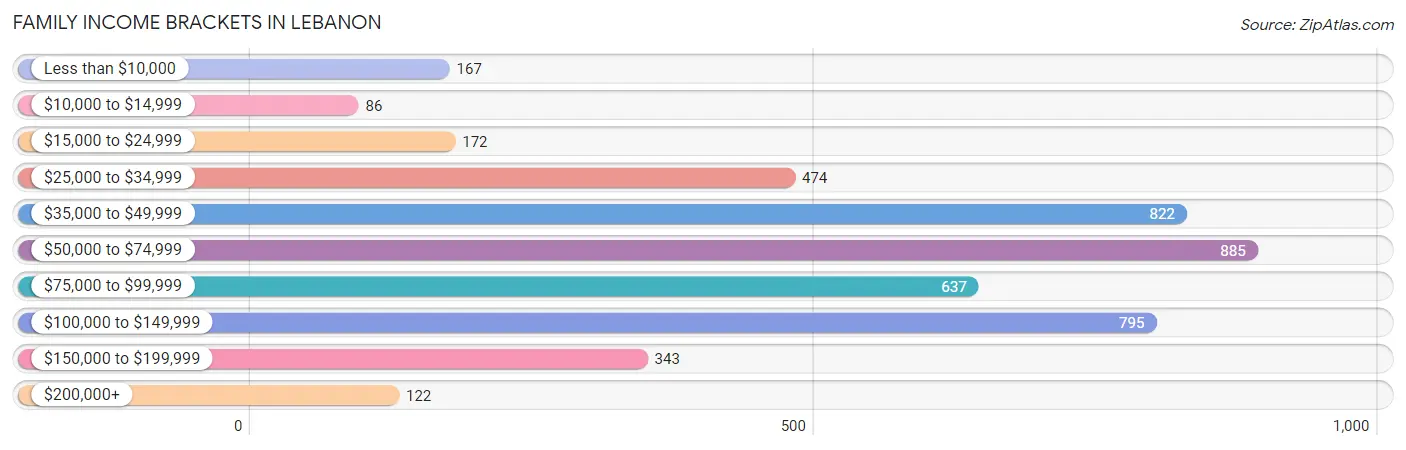
| Income Bracket | # Families | % Families |
| Less than $10,000 | 167 | 3.7% |
| $10,000 to $14,999 | 86 | 1.9% |
| $15,000 to $24,999 | 172 | 3.8% |
| $25,000 to $34,999 | 474 | 10.5% |
| $35,000 to $49,999 | 822 | 18.2% |
| $50,000 to $74,999 | 885 | 19.6% |
| $75,000 to $99,999 | 637 | 14.1% |
| $100,000 to $149,999 | 795 | 17.6% |
| $150,000 to $199,999 | 343 | 7.6% |
| $200,000+ | 122 | 2.7% |
Family Income by Famaliy Size in Lebanon
4-person families (599 | 13.3%) account for the highest median family income in Lebanon with $81,958 per family, while 2-person families (2,590 | 57.4%) have the highest median income of $31,428 per family member.
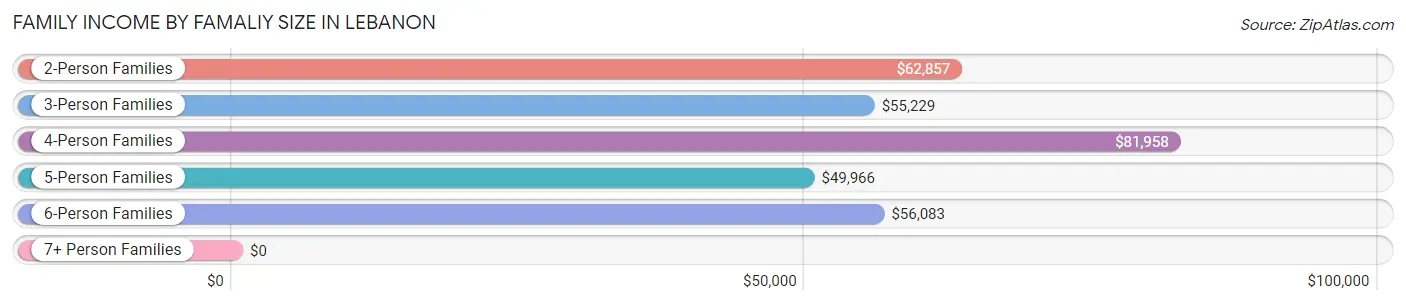
| Income Bracket | # Families | Median Income |
| 2-Person Families | 2,590 (57.4%) | $62,857 |
| 3-Person Families | 683 (15.1%) | $55,229 |
| 4-Person Families | 599 (13.3%) | $81,958 |
| 5-Person Families | 447 (9.9%) | $49,966 |
| 6-Person Families | 153 (3.4%) | $56,083 |
| 7+ Person Families | 44 (1.0%) | $0 |
| Total | 4,516 (100.0%) | $61,770 |
Family Income by Number of Earners in Lebanon
The median family income in Lebanon is $61,770, with families comprising 3+ earners (195) having the highest median family income of $120,875, while families with no earners (868) have the lowest median family income of $32,421, accounting for 4.3% and 19.2% of families, respectively.
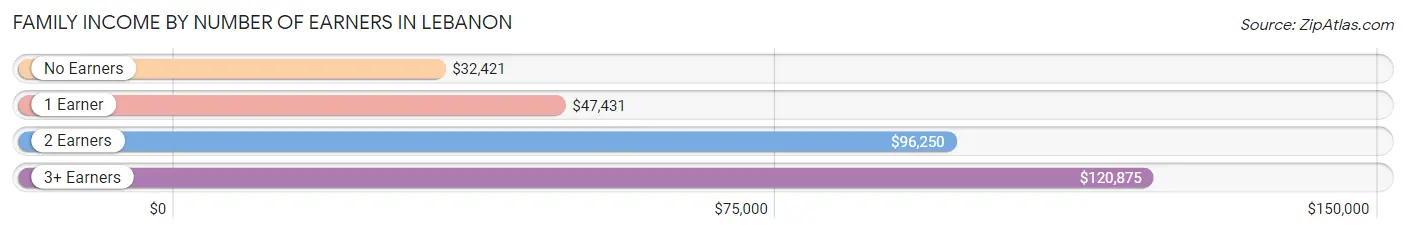
| Number of Earners | # Families | Median Income |
| No Earners | 868 (19.2%) | $32,421 |
| 1 Earner | 1,624 (36.0%) | $47,431 |
| 2 Earners | 1,829 (40.5%) | $96,250 |
| 3+ Earners | 195 (4.3%) | $120,875 |
| Total | 4,516 (100.0%) | $61,770 |
Household Income in Lebanon
Household Income Brackets in Lebanon
With 1,424 households falling in the category, the $35,000 to $49,999 income range is the most frequent in Lebanon, accounting for 19.1% of all households. In contrast, only 231 households (3.1%) fall into the $10,000 to $14,999 income bracket, making it the least populous group.
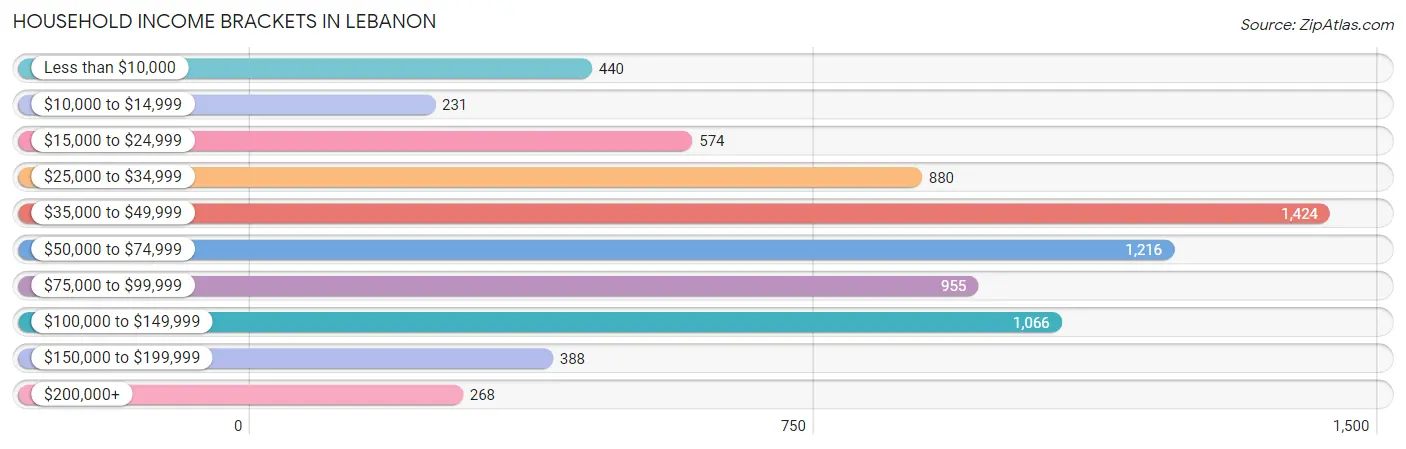
| Income Bracket | # Households | % Households |
| Less than $10,000 | 440 | 5.9% |
| $10,000 to $14,999 | 231 | 3.1% |
| $15,000 to $24,999 | 574 | 7.7% |
| $25,000 to $34,999 | 880 | 11.8% |
| $35,000 to $49,999 | 1,424 | 19.1% |
| $50,000 to $74,999 | 1,216 | 16.3% |
| $75,000 to $99,999 | 955 | 12.8% |
| $100,000 to $149,999 | 1,066 | 14.3% |
| $150,000 to $199,999 | 388 | 5.2% |
| $200,000+ | 268 | 3.6% |
Household Income by Householder Age in Lebanon
The median household income in Lebanon is $53,246, with the highest median household income of $66,610 found in the 25 to 44 years age bracket for the primary householder. A total of 2,403 households (32.2%) fall into this category. Meanwhile, the 65+ years age bracket for the primary householder has the lowest median household income of $38,578, with 2,193 households (29.4%) in this group.
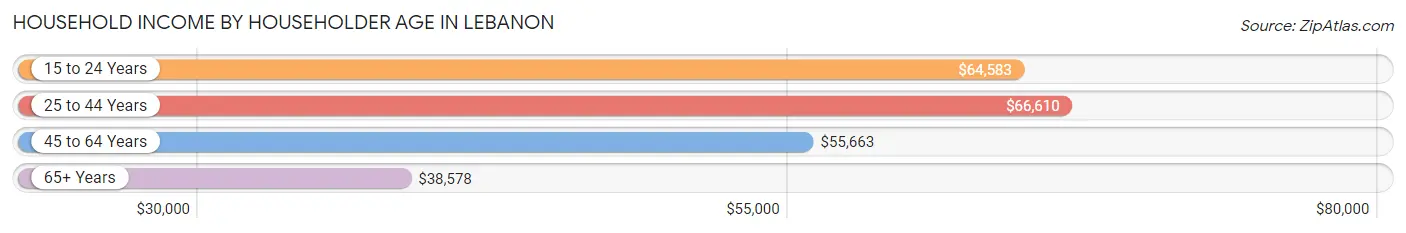
| Income Bracket | # Households | Median Income |
| 15 to 24 Years | 522 (7.0%) | $64,583 |
| 25 to 44 Years | 2,403 (32.2%) | $66,610 |
| 45 to 64 Years | 2,340 (31.4%) | $55,663 |
| 65+ Years | 2,193 (29.4%) | $38,578 |
| Total | 7,458 (100.0%) | $53,246 |
Poverty in Lebanon
Income Below Poverty by Sex and Age in Lebanon
With 12.0% poverty level for males and 17.1% for females among the residents of Lebanon, 18 to 24 year old males and 15 year old females are the most vulnerable to poverty, with 241 males (21.4%) and 99 females (50.0%) in their respective age groups living below the poverty level.
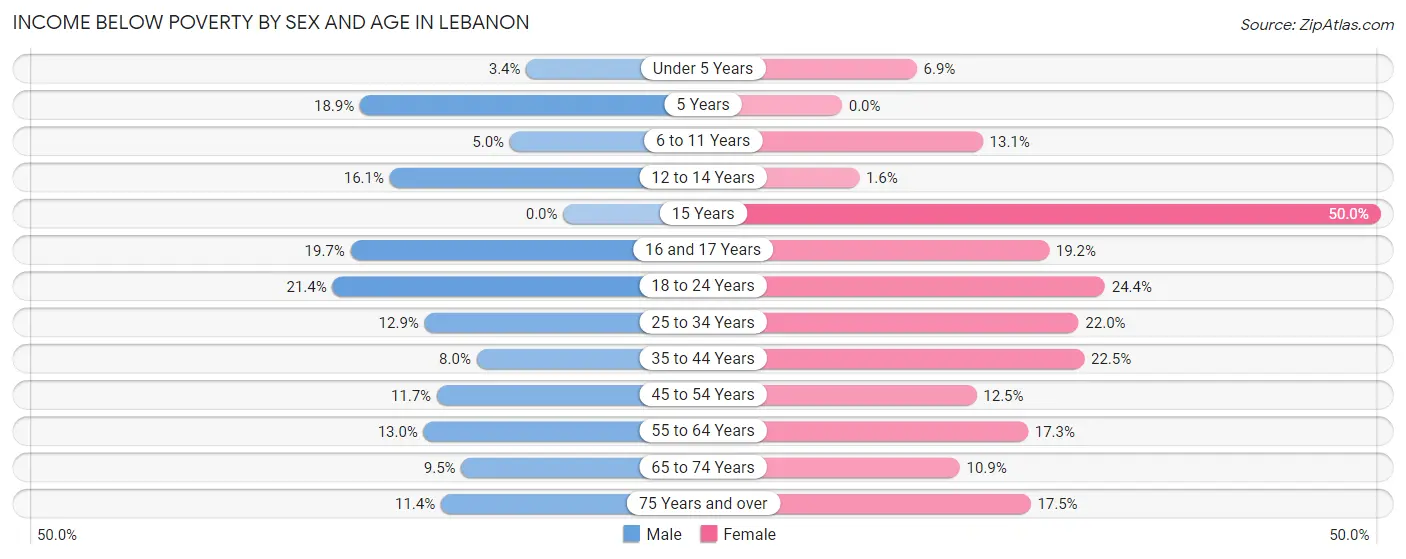
| Age Bracket | Male | Female |
| Under 5 Years | 13 (3.4%) | 29 (6.9%) |
| 5 Years | 20 (18.9%) | 0 (0.0%) |
| 6 to 11 Years | 28 (5.0%) | 95 (13.1%) |
| 12 to 14 Years | 53 (16.1%) | 7 (1.6%) |
| 15 Years | 0 (0.0%) | 99 (50.0%) |
| 16 and 17 Years | 46 (19.7%) | 29 (19.2%) |
| 18 to 24 Years | 241 (21.4%) | 175 (24.4%) |
| 25 to 34 Years | 179 (12.9%) | 330 (22.0%) |
| 35 to 44 Years | 95 (8.0%) | 221 (22.5%) |
| 45 to 54 Years | 111 (11.7%) | 125 (12.5%) |
| 55 to 64 Years | 140 (13.0%) | 208 (17.3%) |
| 65 to 74 Years | 65 (9.5%) | 107 (10.9%) |
| 75 Years and over | 75 (11.4%) | 169 (17.5%) |
| Total | 1,066 (12.0%) | 1,594 (17.1%) |
Income Above Poverty by Sex and Age in Lebanon
According to the poverty statistics in Lebanon, males aged 15 years and females aged 5 years are the age groups that are most secure financially, with 100.0% of males and 100.0% of females in these age groups living above the poverty line.
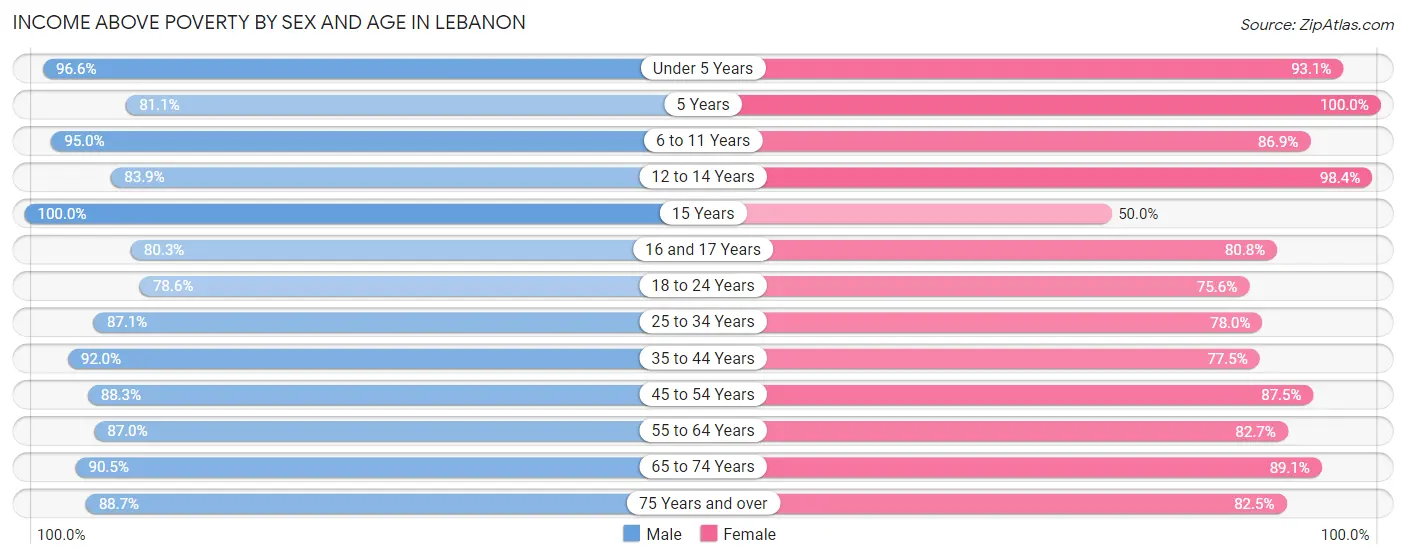
| Age Bracket | Male | Female |
| Under 5 Years | 366 (96.6%) | 389 (93.1%) |
| 5 Years | 86 (81.1%) | 61 (100.0%) |
| 6 to 11 Years | 537 (95.0%) | 632 (86.9%) |
| 12 to 14 Years | 276 (83.9%) | 432 (98.4%) |
| 15 Years | 179 (100.0%) | 99 (50.0%) |
| 16 and 17 Years | 187 (80.3%) | 122 (80.8%) |
| 18 to 24 Years | 884 (78.6%) | 542 (75.6%) |
| 25 to 34 Years | 1,212 (87.1%) | 1,173 (78.0%) |
| 35 to 44 Years | 1,086 (92.0%) | 762 (77.5%) |
| 45 to 54 Years | 835 (88.3%) | 876 (87.5%) |
| 55 to 64 Years | 940 (87.0%) | 997 (82.7%) |
| 65 to 74 Years | 622 (90.5%) | 872 (89.1%) |
| 75 Years and over | 586 (88.6%) | 796 (82.5%) |
| Total | 7,796 (88.0%) | 7,753 (83.0%) |
Income Below Poverty Among Married-Couple Families in Lebanon
The poverty statistics for married-couple families in Lebanon show that 9.8% or 294 of the total 3,009 families live below the poverty line. Families with 1 or 2 children have the highest poverty rate of 11.2%, comprising of 78 families. On the other hand, families with 3 or 4 children have the lowest poverty rate of 4.9%, which includes 21 families.
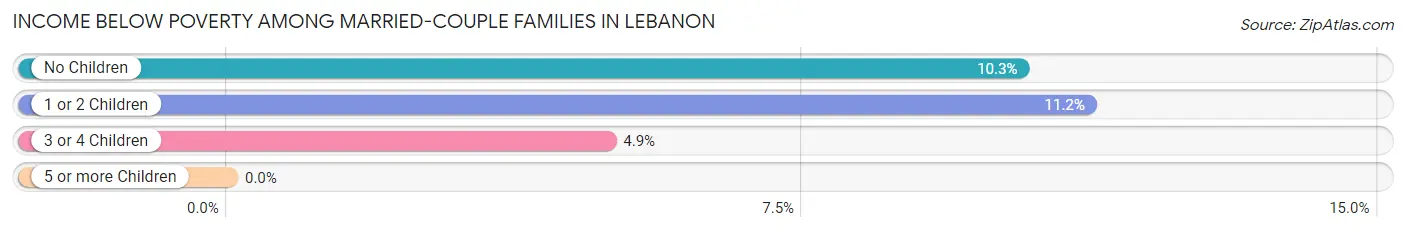
| Children | Above Poverty | Below Poverty |
| No Children | 1,693 (89.7%) | 195 (10.3%) |
| 1 or 2 Children | 618 (88.8%) | 78 (11.2%) |
| 3 or 4 Children | 404 (95.1%) | 21 (4.9%) |
| 5 or more Children | 0 (0.0%) | 0 (0.0%) |
| Total | 2,715 (90.2%) | 294 (9.8%) |
Income Below Poverty Among Single-Parent Households in Lebanon
According to the poverty data in Lebanon, 3.6% or 22 single-father households and 17.0% or 152 single-mother households are living below the poverty line. Among single-father households, those with no children have the highest poverty rate, with 14 households (3.9%) experiencing poverty. Likewise, among single-mother households, those with 5 or more children have the highest poverty rate, with 12 households (100.0%) falling below the poverty line.
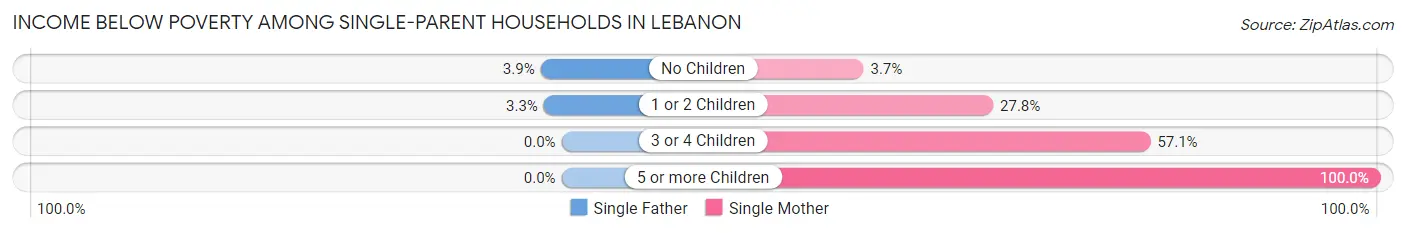
| Children | Single Father | Single Mother |
| No Children | 14 (3.9%) | 18 (3.7%) |
| 1 or 2 Children | 8 (3.3%) | 98 (27.8%) |
| 3 or 4 Children | 0 (0.0%) | 24 (57.1%) |
| 5 or more Children | 0 (0.0%) | 12 (100.0%) |
| Total | 22 (3.6%) | 152 (17.0%) |
Income Below Poverty Among Married-Couple vs Single-Parent Households in Lebanon
The poverty data for Lebanon shows that 294 of the married-couple family households (9.8%) and 174 of the single-parent households (11.6%) are living below the poverty level. Within the married-couple family households, those with 1 or 2 children have the highest poverty rate, with 78 households (11.2%) falling below the poverty line. Among the single-parent households, those with 5 or more children have the highest poverty rate, with 12 household (100.0%) living below poverty.
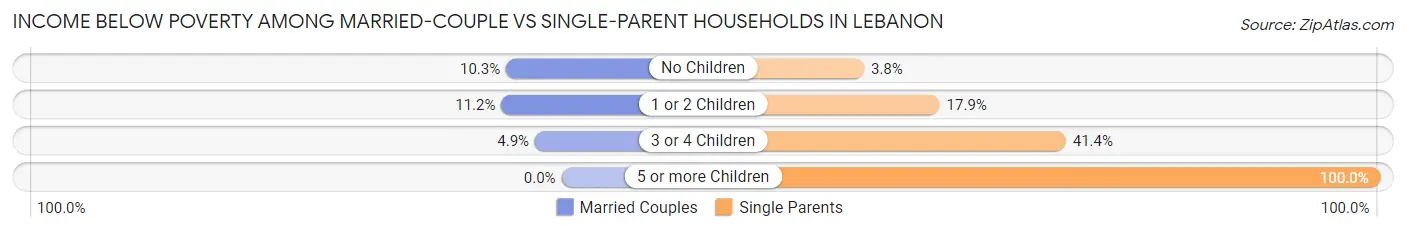
| Children | Married-Couple Families | Single-Parent Households |
| No Children | 195 (10.3%) | 32 (3.8%) |
| 1 or 2 Children | 78 (11.2%) | 106 (17.9%) |
| 3 or 4 Children | 21 (4.9%) | 24 (41.4%) |
| 5 or more Children | 0 (0.0%) | 12 (100.0%) |
| Total | 294 (9.8%) | 174 (11.6%) |
Race in Lebanon
The most populous races in Lebanon are White / Caucasian (16,421 | 88.3%), Hispanic or Latino (1,780 | 9.6%), and Two or more Races (1,459 | 7.9%).
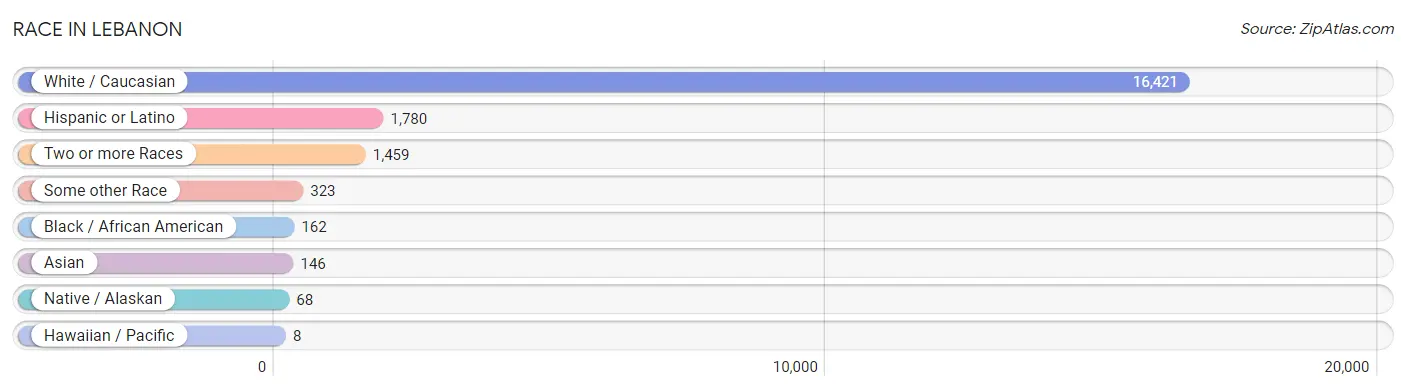
| Race | # Population | % Population |
| Asian | 146 | 0.8% |
| Black / African American | 162 | 0.9% |
| Hawaiian / Pacific | 8 | 0.0% |
| Hispanic or Latino | 1,780 | 9.6% |
| Native / Alaskan | 68 | 0.4% |
| White / Caucasian | 16,421 | 88.3% |
| Two or more Races | 1,459 | 7.9% |
| Some other Race | 323 | 1.7% |
| Total | 18,587 | 100.0% |
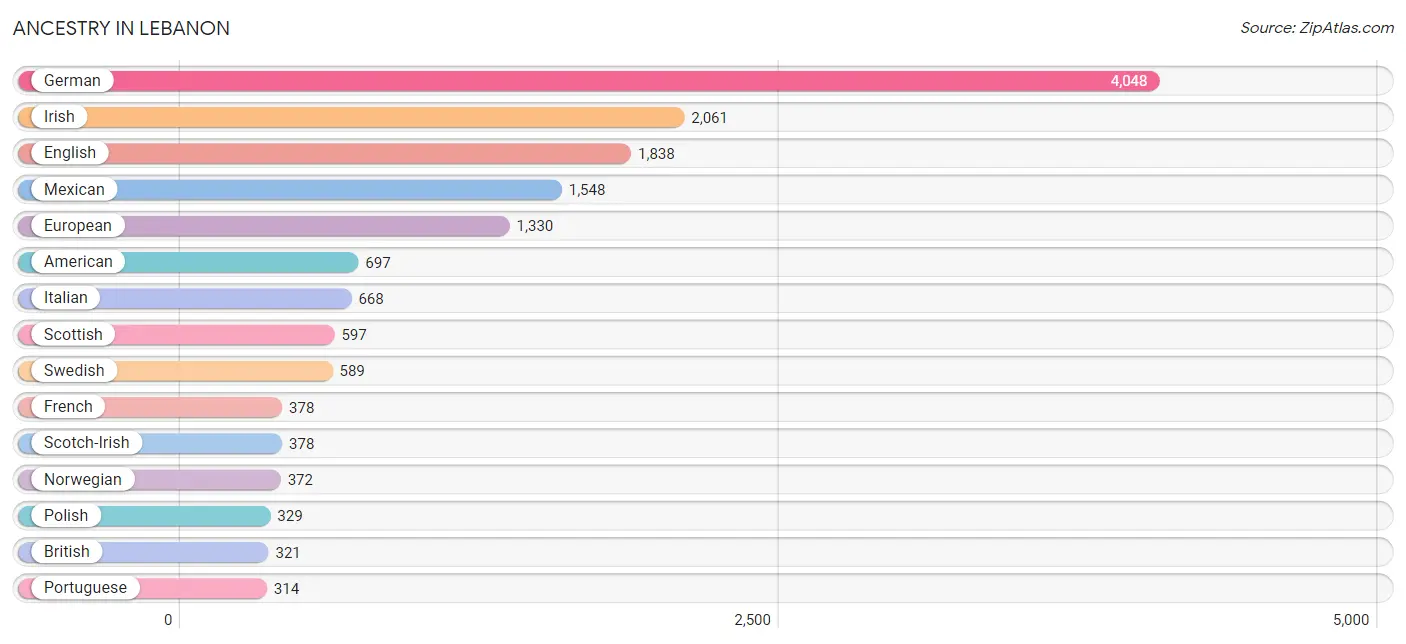
Ancestry in Lebanon
The most populous ancestries reported in Lebanon are German (4,048 | 21.8%), Irish (2,061 | 11.1%), English (1,838 | 9.9%), Mexican (1,548 | 8.3%), and European (1,330 | 7.2%), together accounting for 58.3% of all Lebanon residents.
| Ancestry | # Population | % Population |
| African | 10 | 0.1% |
| American | 697 | 3.7% |
| Arab | 18 | 0.1% |
| Austrian | 14 | 0.1% |
| Bangladeshi | 56 | 0.3% |
| Belgian | 27 | 0.2% |
| Bhutanese | 154 | 0.8% |
| British | 321 | 1.7% |
| Bulgarian | 4 | 0.0% |
| Burmese | 63 | 0.3% |
| Canadian | 59 | 0.3% |
| Central American | 10 | 0.1% |
| Cherokee | 309 | 1.7% |
| Choctaw | 19 | 0.1% |
| Czech | 71 | 0.4% |
| Danish | 86 | 0.5% |
| Dominican | 137 | 0.7% |
| Dutch | 297 | 1.6% |
| Eastern European | 44 | 0.2% |
| Ecuadorian | 30 | 0.2% |
| English | 1,838 | 9.9% |
| European | 1,330 | 7.2% |
| Finnish | 41 | 0.2% |
| French | 378 | 2.0% |
| French American Indian | 1 | 0.0% |
| French Canadian | 64 | 0.3% |
| German | 4,048 | 21.8% |
| Greek | 27 | 0.2% |
| Guamanian / Chamorro | 39 | 0.2% |
| Hungarian | 36 | 0.2% |
| Indian (Asian) | 102 | 0.5% |
| Irish | 2,061 | 11.1% |
| Italian | 668 | 3.6% |
| Kiowa | 26 | 0.1% |
| Korean | 177 | 0.9% |
| Lithuanian | 128 | 0.7% |
| Malaysian | 55 | 0.3% |
| Mexican | 1,548 | 8.3% |
| Native Hawaiian | 67 | 0.4% |
| Northern European | 163 | 0.9% |
| Norwegian | 372 | 2.0% |
| Polish | 329 | 1.8% |
| Portuguese | 314 | 1.7% |
| Puerto Rican | 25 | 0.1% |
| Romanian | 4 | 0.0% |
| Russian | 72 | 0.4% |
| Salvadoran | 10 | 0.1% |
| Samoan | 39 | 0.2% |
| Scandinavian | 275 | 1.5% |
| Scotch-Irish | 378 | 2.0% |
| Scottish | 597 | 3.2% |
| Serbian | 15 | 0.1% |
| Sioux | 10 | 0.1% |
| South African | 13 | 0.1% |
| South American | 30 | 0.2% |
| Spanish | 14 | 0.1% |
| Sri Lankan | 20 | 0.1% |
| Subsaharan African | 23 | 0.1% |
| Swedish | 589 | 3.2% |
| Swiss | 86 | 0.5% |
| Ukrainian | 127 | 0.7% |
| Welsh | 108 | 0.6% | View All 62 Rows |
Immigrants in Lebanon
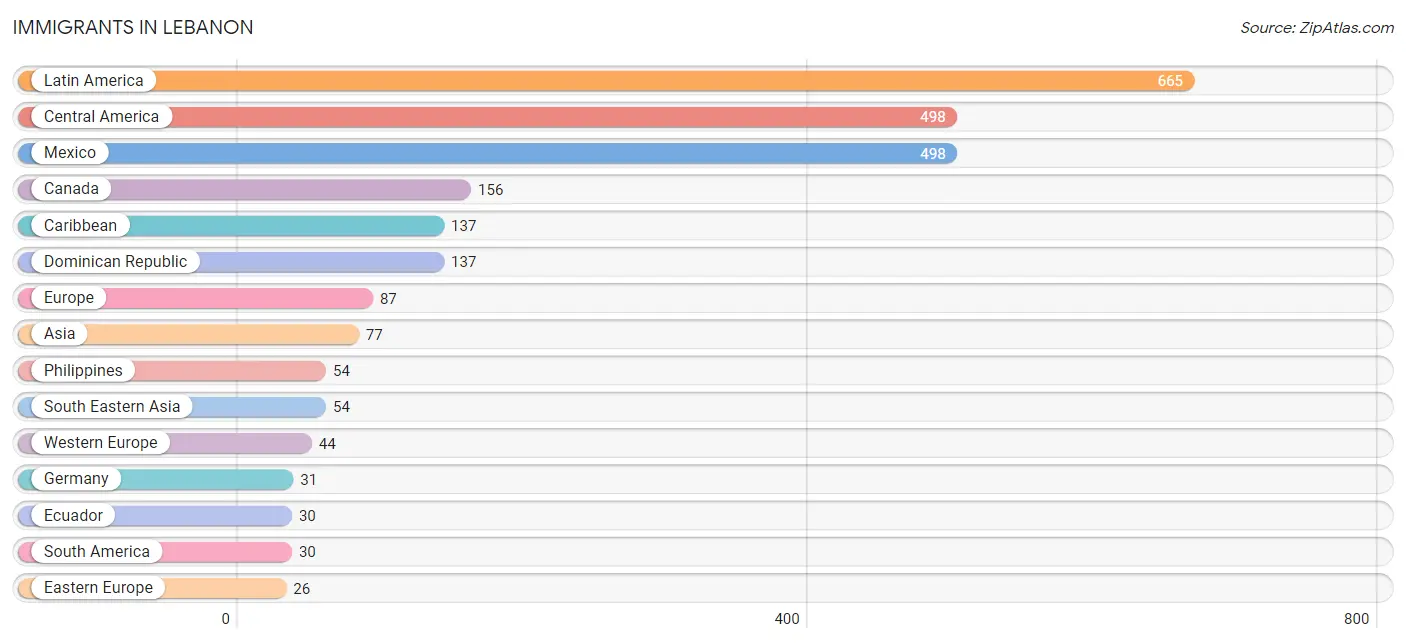
The most numerous immigrant groups reported in Lebanon came from Latin America (665 | 3.6%), Central America (498 | 2.7%), Mexico (498 | 2.7%), Canada (156 | 0.8%), and Caribbean (137 | 0.7%), together accounting for 10.5% of all Lebanon residents.
| Immigration Origin | # Population | % Population |
| Africa | 13 | 0.1% |
| Asia | 77 | 0.4% |
| Australia | 12 | 0.1% |
| Belgium | 13 | 0.1% |
| Bulgaria | 4 | 0.0% |
| Canada | 156 | 0.8% |
| Caribbean | 137 | 0.7% |
| Central America | 498 | 2.7% |
| Dominican Republic | 137 | 0.7% |
| Eastern Asia | 23 | 0.1% |
| Eastern Europe | 26 | 0.1% |
| Ecuador | 30 | 0.2% |
| England | 14 | 0.1% |
| Europe | 87 | 0.5% |
| Germany | 31 | 0.2% |
| Ireland | 3 | 0.0% |
| Korea | 23 | 0.1% |
| Latin America | 665 | 3.6% |
| Mexico | 498 | 2.7% |
| Northern Europe | 17 | 0.1% |
| Oceania | 12 | 0.1% |
| Philippines | 54 | 0.3% |
| South Africa | 13 | 0.1% |
| South America | 30 | 0.2% |
| South Eastern Asia | 54 | 0.3% |
| Ukraine | 22 | 0.1% |
| Western Europe | 44 | 0.2% | View All 27 Rows |
Sex and Age in Lebanon
Sex and Age in Lebanon
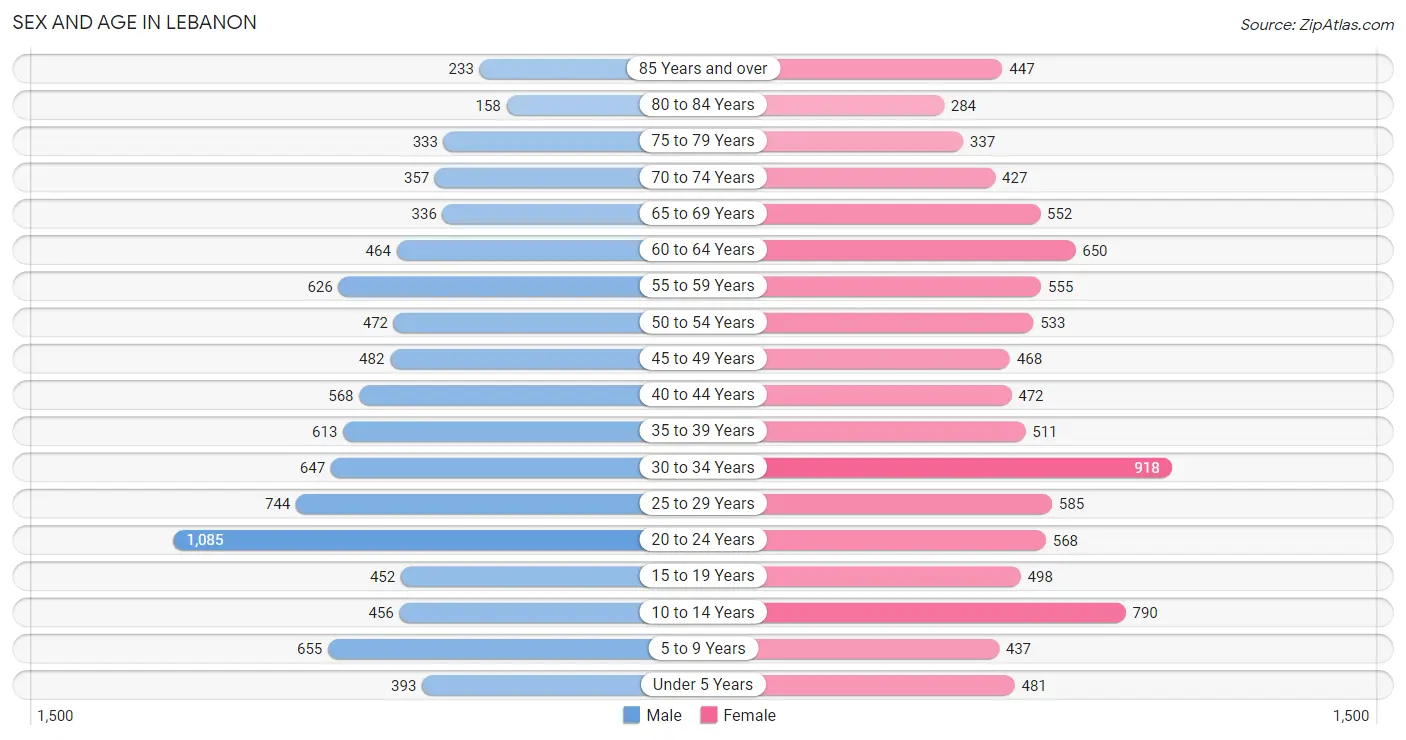
The most populous age groups in Lebanon are 20 to 24 Years (1,085 | 12.0%) for men and 30 to 34 Years (918 | 9.7%) for women.
| Age Bracket | Male | Female |
| Under 5 Years | 393 (4.3%) | 481 (5.1%) |
| 5 to 9 Years | 655 (7.2%) | 437 (4.6%) |
| 10 to 14 Years | 456 (5.0%) | 790 (8.3%) |
| 15 to 19 Years | 452 (5.0%) | 498 (5.2%) |
| 20 to 24 Years | 1,085 (12.0%) | 568 (6.0%) |
| 25 to 29 Years | 744 (8.2%) | 585 (6.1%) |
| 30 to 34 Years | 647 (7.1%) | 918 (9.7%) |
| 35 to 39 Years | 613 (6.8%) | 511 (5.4%) |
| 40 to 44 Years | 568 (6.3%) | 472 (5.0%) |
| 45 to 49 Years | 482 (5.3%) | 468 (4.9%) |
| 50 to 54 Years | 472 (5.2%) | 533 (5.6%) |
| 55 to 59 Years | 626 (6.9%) | 555 (5.8%) |
| 60 to 64 Years | 464 (5.1%) | 650 (6.8%) |
| 65 to 69 Years | 336 (3.7%) | 552 (5.8%) |
| 70 to 74 Years | 357 (3.9%) | 427 (4.5%) |
| 75 to 79 Years | 333 (3.7%) | 337 (3.5%) |
| 80 to 84 Years | 158 (1.7%) | 284 (3.0%) |
| 85 Years and over | 233 (2.6%) | 447 (4.7%) |
| Total | 9,074 (100.0%) | 9,513 (100.0%) |
Families and Households in Lebanon
Median Family Size in Lebanon
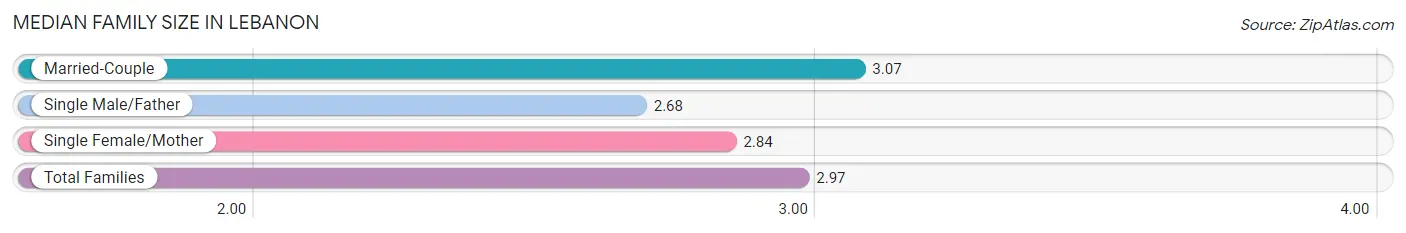
The median family size in Lebanon is 2.97 persons per family, with married-couple families (3,009 | 66.6%) accounting for the largest median family size of 3.07 persons per family. On the other hand, single male/father families (615 | 13.6%) represent the smallest median family size with 2.68 persons per family.
| Family Type | # Families | Family Size |
| Married-Couple | 3,009 (66.6%) | 3.07 |
| Single Male/Father | 615 (13.6%) | 2.68 |
| Single Female/Mother | 892 (19.8%) | 2.84 |
| Total Families | 4,516 (100.0%) | 2.97 |
Median Household Size in Lebanon
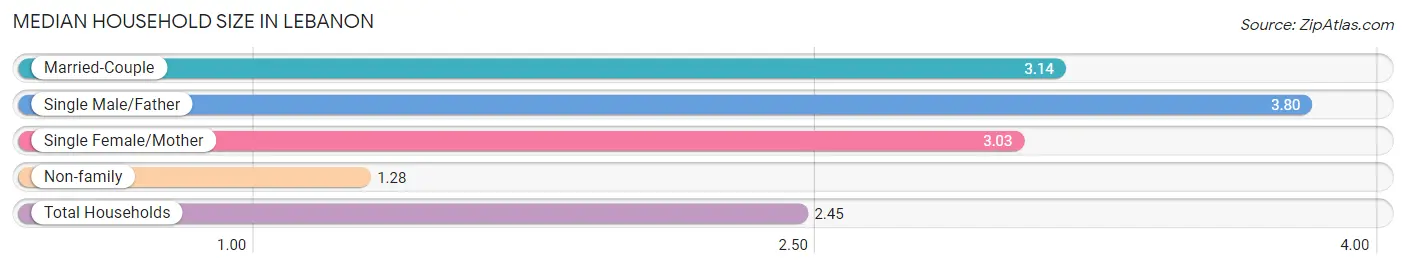
The median household size in Lebanon is 2.45 persons per household, with single male/father households (615 | 8.3%) accounting for the largest median household size of 3.8 persons per household. non-family households (2,942 | 39.5%) represent the smallest median household size with 1.28 persons per household.
| Household Type | # Households | Household Size |
| Married-Couple | 3,009 (40.4%) | 3.14 |
| Single Male/Father | 615 (8.3%) | 3.80 |
| Single Female/Mother | 892 (12.0%) | 3.03 |
| Non-family | 2,942 (39.5%) | 1.28 |
| Total Households | 7,458 (100.0%) | 2.45 |
Household Size by Marriage Status in Lebanon
Out of a total of 7,458 households in Lebanon, 4,516 (60.6%) are family households, while 2,942 (39.5%) are nonfamily households. The most numerous type of family households are 2-person households, comprising 2,191, and the most common type of nonfamily households are 1-person households, comprising 2,287.
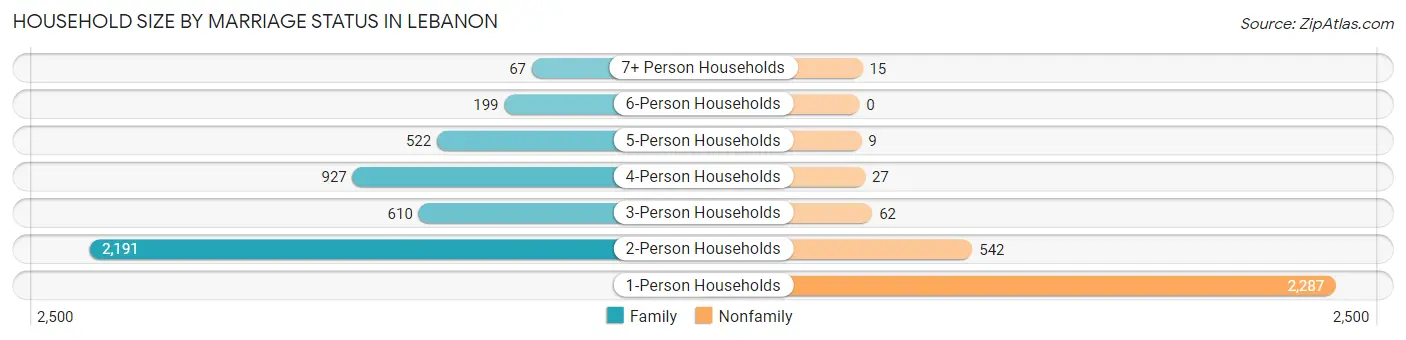
| Household Size | Family Households | Nonfamily Households |
| 1-Person Households | - | 2,287 (30.7%) |
| 2-Person Households | 2,191 (29.4%) | 542 (7.3%) |
| 3-Person Households | 610 (8.2%) | 62 (0.8%) |
| 4-Person Households | 927 (12.4%) | 27 (0.4%) |
| 5-Person Households | 522 (7.0%) | 9 (0.1%) |
| 6-Person Households | 199 (2.7%) | 0 (0.0%) |
| 7+ Person Households | 67 (0.9%) | 15 (0.2%) |
| Total | 4,516 (60.6%) | 2,942 (39.5%) |
Female Fertility in Lebanon
Fertility by Age in Lebanon
Average fertility rate in Lebanon is 54.0 births per 1,000 women. Women in the age bracket of 20 to 34 years have the highest fertility rate with 104.0 births per 1,000 women. Women in the age bracket of 20 to 34 years acount for 96.0% of all women with births.
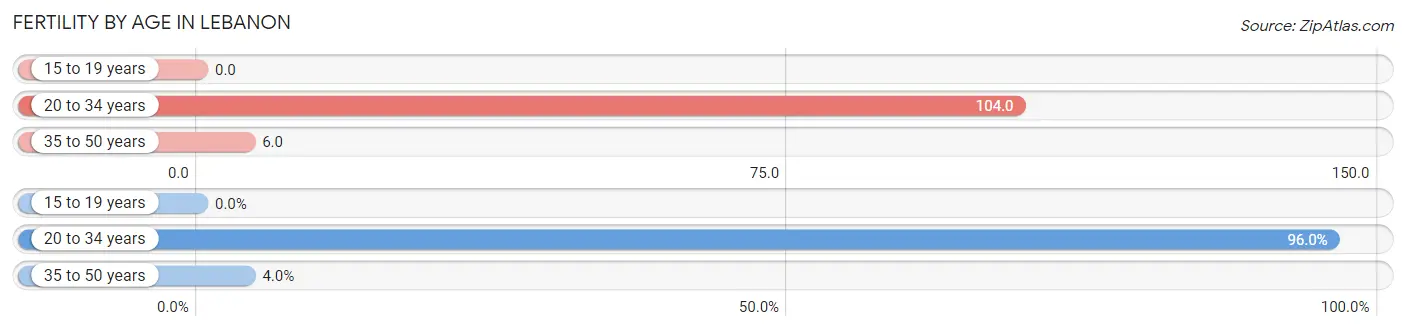
| Age Bracket | Women with Births | Births / 1,000 Women |
| 15 to 19 years | 0 (0.0%) | 0.0 |
| 20 to 34 years | 215 (96.0%) | 104.0 |
| 35 to 50 years | 9 (4.0%) | 6.0 |
| Total | 224 (100.0%) | 54.0 |
Fertility by Age by Marriage Status in Lebanon
83.9% of women with births (224) in Lebanon are married. The highest percentage of unmarried women with births falls into 20 to 34 years age bracket with 16.7% of them unmarried at the time of birth, while the lowest percentage of unmarried women with births belong to 35 to 50 years age bracket with 0.0% of them unmarried.
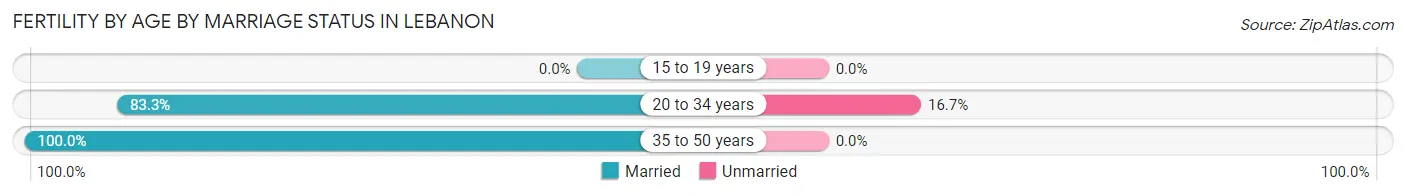
| Age Bracket | Married | Unmarried |
| 15 to 19 years | 0 (0.0%) | 0 (0.0%) |
| 20 to 34 years | 179 (83.3%) | 36 (16.7%) |
| 35 to 50 years | 9 (100.0%) | 0 (0.0%) |
| Total | 188 (83.9%) | 36 (16.1%) |
Fertility by Education in Lebanon
Average fertility rate in Lebanon is 54.0 births per 1,000 women. Women with the education attainment of college or associate's degree have the highest fertility rate of 99.0 births per 1,000 women, while women with the education attainment of high school diploma have the lowest fertility at 26.0 births per 1,000 women. Women with the education attainment of college or associate's degree represent 56.7% of all women with births.
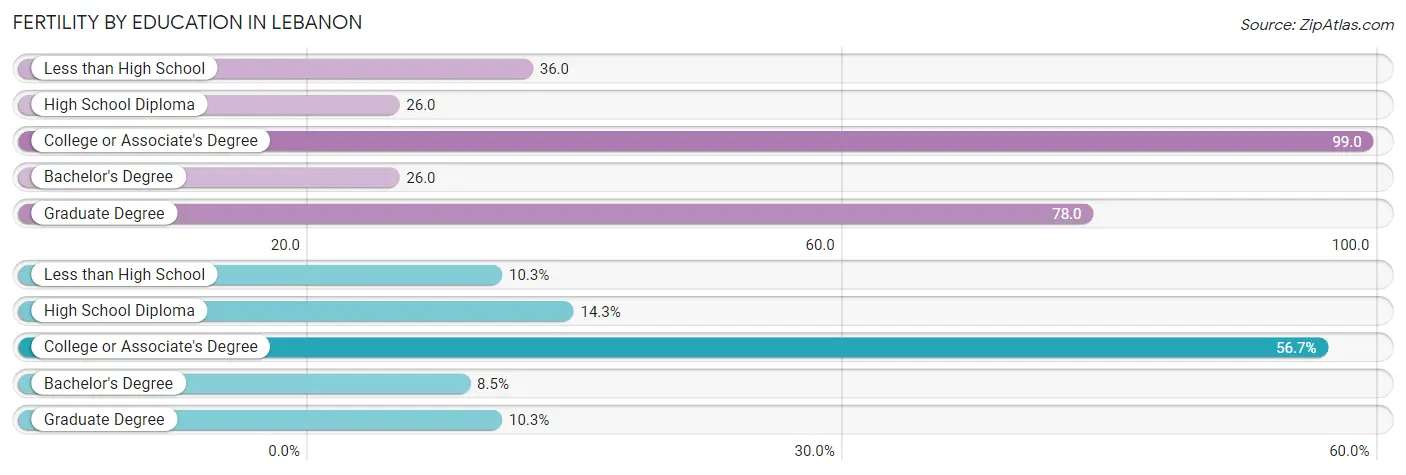
| Educational Attainment | Women with Births | Births / 1,000 Women |
| Less than High School | 23 (10.3%) | 36.0 |
| High School Diploma | 32 (14.3%) | 26.0 |
| College or Associate's Degree | 127 (56.7%) | 99.0 |
| Bachelor's Degree | 19 (8.5%) | 26.0 |
| Graduate Degree | 23 (10.3%) | 78.0 |
| Total | 224 (100.0%) | 54.0 |
Fertility by Education by Marriage Status in Lebanon
16.1% of women with births in Lebanon are unmarried. Women with the educational attainment of high school diploma are most likely to be married with 100.0% of them married at childbirth, while women with the educational attainment of less than high school are least likely to be married with 100.0% of them unmarried at childbirth.
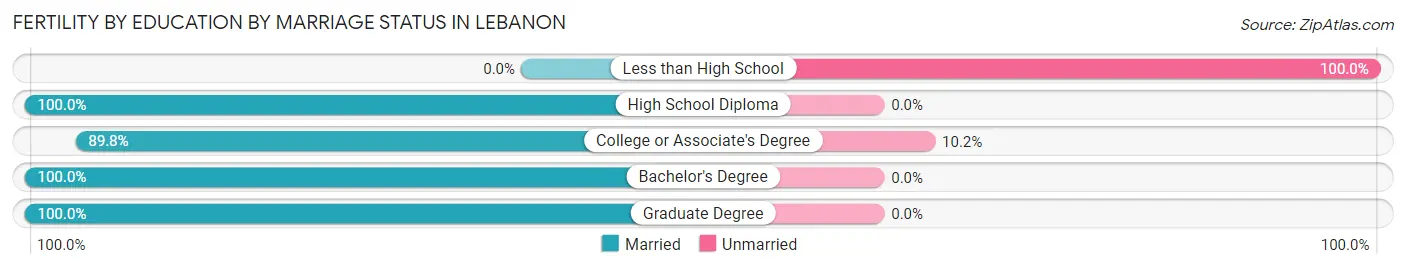
| Educational Attainment | Married | Unmarried |
| Less than High School | 0 (0.0%) | 23 (100.0%) |
| High School Diploma | 32 (100.0%) | 0 (0.0%) |
| College or Associate's Degree | 114 (89.8%) | 13 (10.2%) |
| Bachelor's Degree | 19 (100.0%) | 0 (0.0%) |
| Graduate Degree | 23 (100.0%) | 0 (0.0%) |
| Total | 188 (83.9%) | 36 (16.1%) |
Employment Characteristics in Lebanon
Employment by Class of Employer in Lebanon
Among the 8,195 employed individuals in Lebanon, private company employees (5,524 | 67.4%), not-for-profit organizations (764 | 9.3%), and local government employees (631 | 7.7%) make up the most common classes of employment.
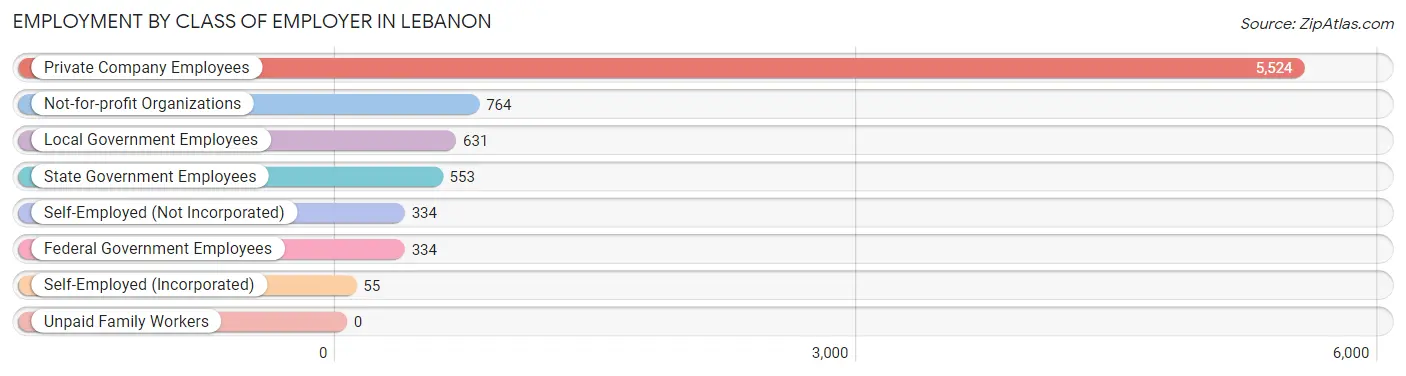
| Employer Class | # Employees | % Employees |
| Private Company Employees | 5,524 | 67.4% |
| Self-Employed (Incorporated) | 55 | 0.7% |
| Self-Employed (Not Incorporated) | 334 | 4.1% |
| Not-for-profit Organizations | 764 | 9.3% |
| Local Government Employees | 631 | 7.7% |
| State Government Employees | 553 | 6.8% |
| Federal Government Employees | 334 | 4.1% |
| Unpaid Family Workers | 0 | 0.0% |
| Total | 8,195 | 100.0% |
Employment Status by Age in Lebanon
According to the labor force statistics for Lebanon, out of the total population over 16 years of age (14,998), 59.8% or 8,969 individuals are in the labor force, with 7.3% or 655 of them unemployed. The age group with the highest labor force participation rate is 45 to 54 years, with 85.3% or 1,668 individuals in the labor force. Within the labor force, the 65 to 74 years age range has the highest percentage of unemployed individuals, with 25.1% or 88 of them being unemployed.
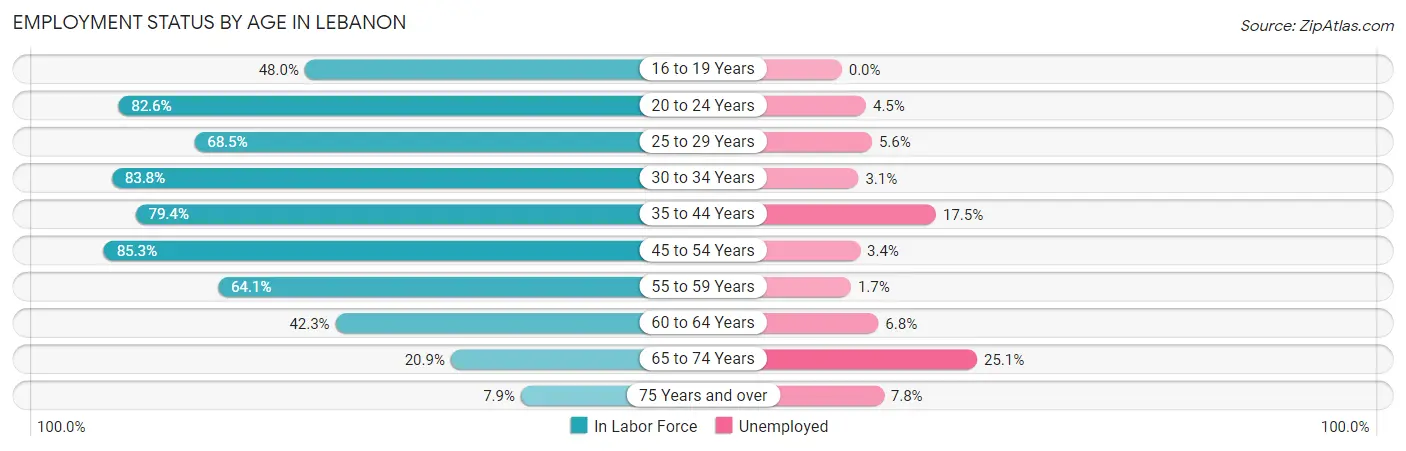
| Age Bracket | In Labor Force | Unemployed |
| 16 to 19 Years | 275 (48.0%) | 0 (0.0%) |
| 20 to 24 Years | 1,365 (82.6%) | 61 (4.5%) |
| 25 to 29 Years | 910 (68.5%) | 51 (5.6%) |
| 30 to 34 Years | 1,311 (83.8%) | 41 (3.1%) |
| 35 to 44 Years | 1,718 (79.4%) | 301 (17.5%) |
| 45 to 54 Years | 1,668 (85.3%) | 57 (3.4%) |
| 55 to 59 Years | 757 (64.1%) | 13 (1.7%) |
| 60 to 64 Years | 471 (42.3%) | 32 (6.8%) |
| 65 to 74 Years | 349 (20.9%) | 88 (25.1%) |
| 75 Years and over | 142 (7.9%) | 11 (7.8%) |
| Total | 8,969 (59.8%) | 655 (7.3%) |
Employment Status by Educational Attainment in Lebanon
According to labor force statistics for Lebanon, 73.5% of individuals (6,841) out of the total population between 25 and 64 years of age (9,308) are in the labor force, with 7.2% or 493 of them being unemployed. The group with the highest labor force participation rate are those with the educational attainment of college / associate degree, with 79.5% or 2,891 individuals in the labor force. Within the labor force, individuals with less than high school education have the highest percentage of unemployment, with 15.6% or 78 of them being unemployed.
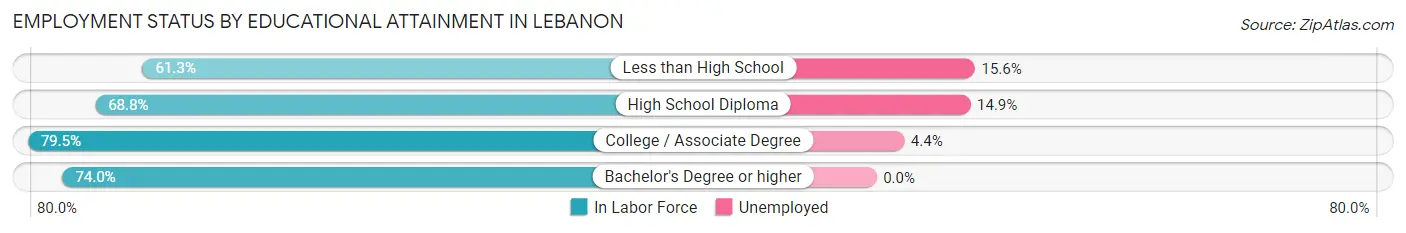
| Educational Attainment | In Labor Force | Unemployed |
| Less than High School | 501 (61.3%) | 127 (15.6%) |
| High School Diploma | 1,936 (68.8%) | 419 (14.9%) |
| College / Associate Degree | 2,891 (79.5%) | 160 (4.4%) |
| Bachelor's Degree or higher | 1,510 (74.0%) | 0 (0.0%) |
| Total | 6,841 (73.5%) | 670 (7.2%) |
Employment Occupations by Sex in Lebanon
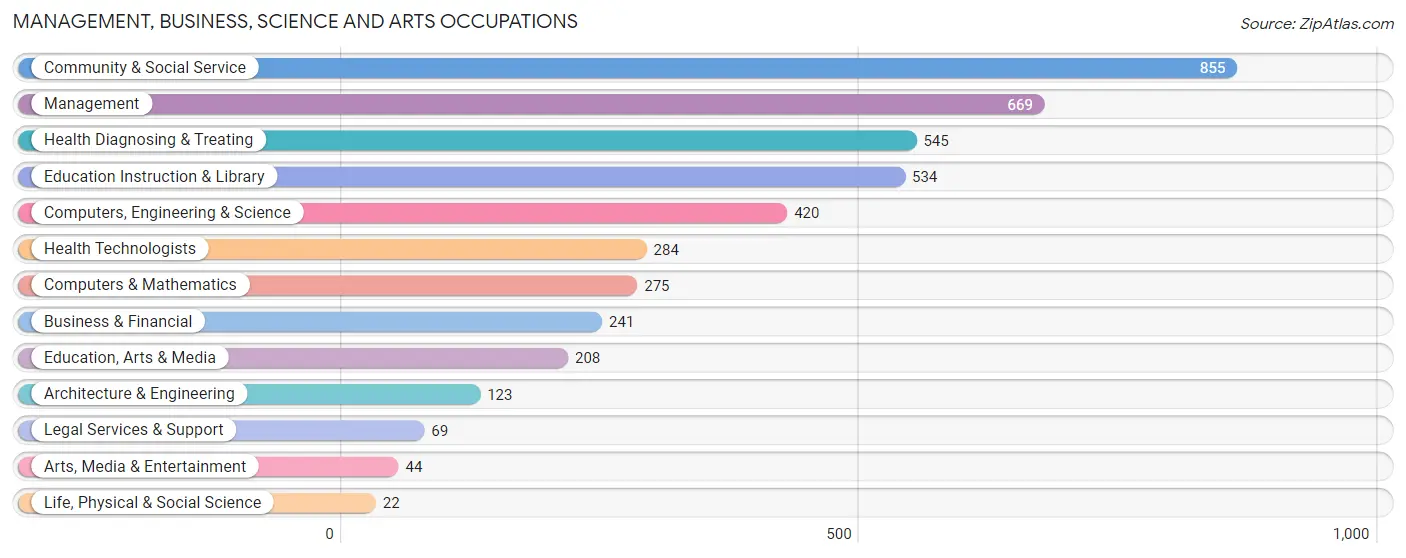
Management, Business, Science and Arts Occupations
The most common Management, Business, Science and Arts occupations in Lebanon are Community & Social Service (855 | 10.3%), Management (669 | 8.1%), Health Diagnosing & Treating (545 | 6.6%), Education Instruction & Library (534 | 6.4%), and Computers, Engineering & Science (420 | 5.1%).
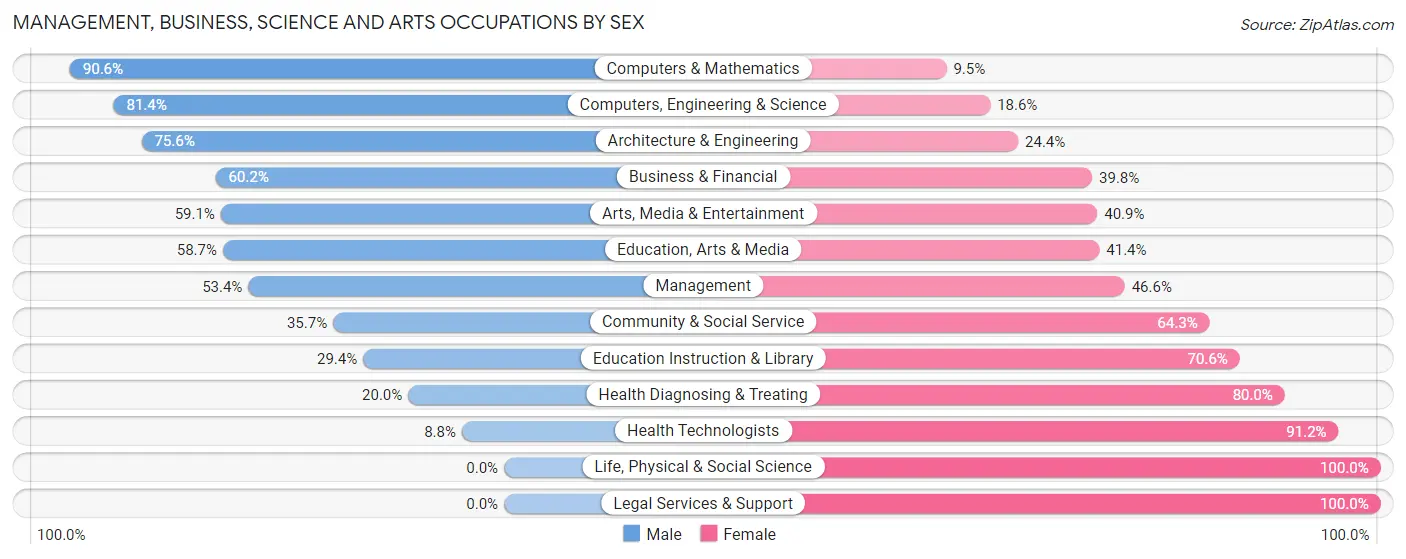
Management, Business, Science and Arts Occupations by Sex
Within the Management, Business, Science and Arts occupations in Lebanon, the most male-oriented occupations are Computers & Mathematics (90.5%), Computers, Engineering & Science (81.4%), and Architecture & Engineering (75.6%), while the most female-oriented occupations are Life, Physical & Social Science (100.0%), Legal Services & Support (100.0%), and Health Technologists (91.2%).
| Occupation | Male | Female |
| Management | 357 (53.4%) | 312 (46.6%) |
| Business & Financial | 145 (60.2%) | 96 (39.8%) |
| Computers, Engineering & Science | 342 (81.4%) | 78 (18.6%) |
| Computers & Mathematics | 249 (90.5%) | 26 (9.5%) |
| Architecture & Engineering | 93 (75.6%) | 30 (24.4%) |
| Life, Physical & Social Science | 0 (0.0%) | 22 (100.0%) |
| Community & Social Service | 305 (35.7%) | 550 (64.3%) |
| Education, Arts & Media | 122 (58.7%) | 86 (41.3%) |
| Legal Services & Support | 0 (0.0%) | 69 (100.0%) |
| Education Instruction & Library | 157 (29.4%) | 377 (70.6%) |
| Arts, Media & Entertainment | 26 (59.1%) | 18 (40.9%) |
| Health Diagnosing & Treating | 109 (20.0%) | 436 (80.0%) |
| Health Technologists | 25 (8.8%) | 259 (91.2%) |
| Total (Category) | 1,258 (46.1%) | 1,472 (53.9%) |
| Total (Overall) | 4,501 (54.1%) | 3,813 (45.9%) |
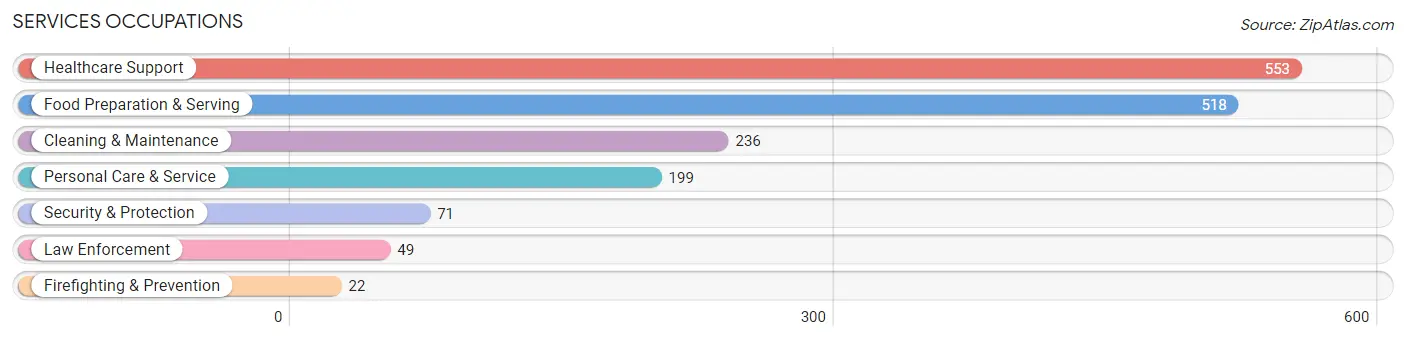
Services Occupations
The most common Services occupations in Lebanon are Healthcare Support (553 | 6.7%), Food Preparation & Serving (518 | 6.2%), Cleaning & Maintenance (236 | 2.8%), Personal Care & Service (199 | 2.4%), and Security & Protection (71 | 0.9%).
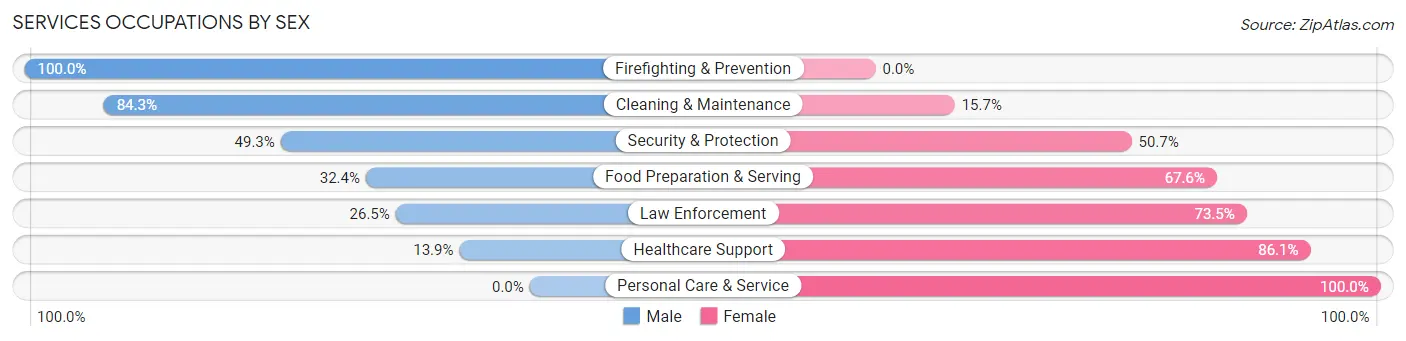
Services Occupations by Sex
Within the Services occupations in Lebanon, the most male-oriented occupations are Firefighting & Prevention (100.0%), Cleaning & Maintenance (84.3%), and Security & Protection (49.3%), while the most female-oriented occupations are Personal Care & Service (100.0%), Healthcare Support (86.1%), and Law Enforcement (73.5%).
| Occupation | Male | Female |
| Healthcare Support | 77 (13.9%) | 476 (86.1%) |
| Security & Protection | 35 (49.3%) | 36 (50.7%) |
| Firefighting & Prevention | 22 (100.0%) | 0 (0.0%) |
| Law Enforcement | 13 (26.5%) | 36 (73.5%) |
| Food Preparation & Serving | 168 (32.4%) | 350 (67.6%) |
| Cleaning & Maintenance | 199 (84.3%) | 37 (15.7%) |
| Personal Care & Service | 0 (0.0%) | 199 (100.0%) |
| Total (Category) | 479 (30.4%) | 1,098 (69.6%) |
| Total (Overall) | 4,501 (54.1%) | 3,813 (45.9%) |
Sales and Office Occupations
The most common Sales and Office occupations in Lebanon are Office & Administration (910 | 11.0%), and Sales & Related (470 | 5.7%).
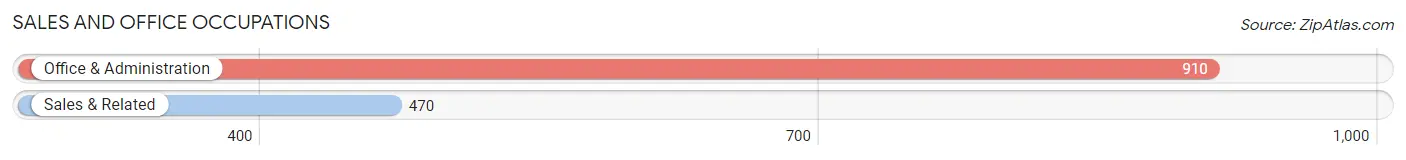
Sales and Office Occupations by Sex
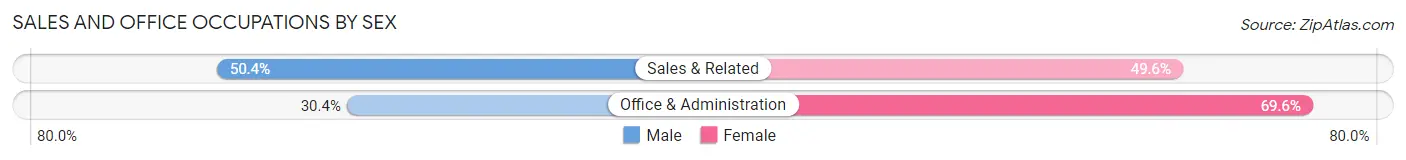
| Occupation | Male | Female |
| Sales & Related | 237 (50.4%) | 233 (49.6%) |
| Office & Administration | 277 (30.4%) | 633 (69.6%) |
| Total (Category) | 514 (37.2%) | 866 (62.7%) |
| Total (Overall) | 4,501 (54.1%) | 3,813 (45.9%) |
Natural Resources, Construction and Maintenance Occupations
The most common Natural Resources, Construction and Maintenance occupations in Lebanon are Construction & Extraction (383 | 4.6%), Farming, Fishing & Forestry (195 | 2.4%), and Installation, Maintenance & Repair (162 | 1.9%).
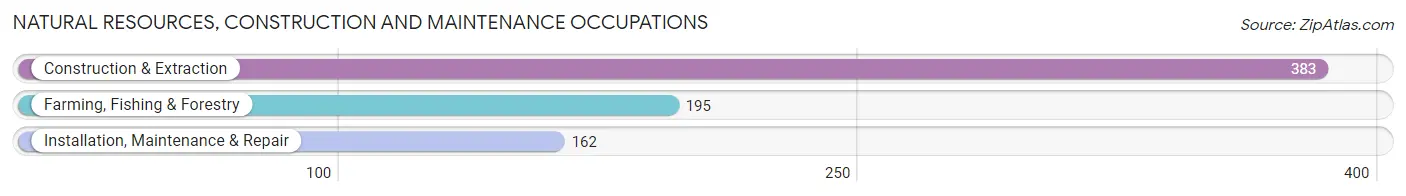
Natural Resources, Construction and Maintenance Occupations by Sex
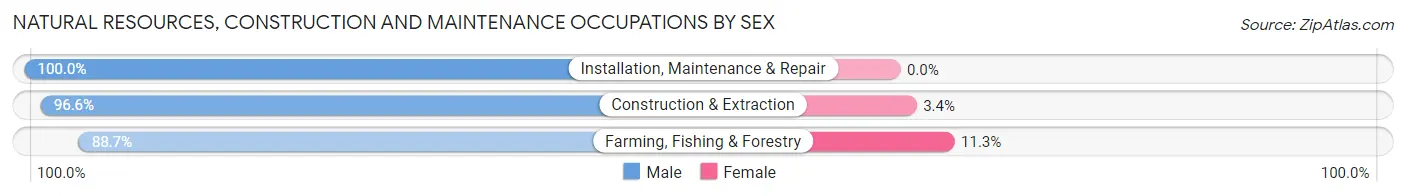
| Occupation | Male | Female |
| Farming, Fishing & Forestry | 173 (88.7%) | 22 (11.3%) |
| Construction & Extraction | 370 (96.6%) | 13 (3.4%) |
| Installation, Maintenance & Repair | 162 (100.0%) | 0 (0.0%) |
| Total (Category) | 705 (95.3%) | 35 (4.7%) |
| Total (Overall) | 4,501 (54.1%) | 3,813 (45.9%) |
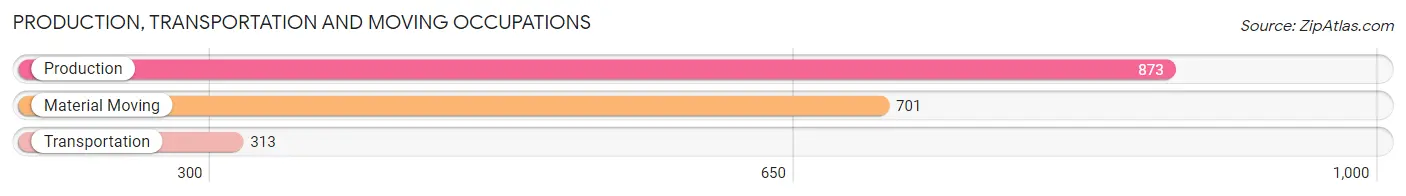
Production, Transportation and Moving Occupations
The most common Production, Transportation and Moving occupations in Lebanon are Production (873 | 10.5%), Material Moving (701 | 8.4%), and Transportation (313 | 3.8%).
Production, Transportation and Moving Occupations by Sex
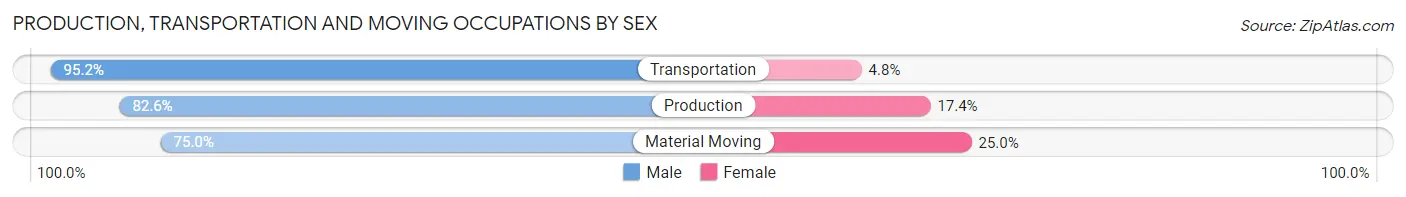
| Occupation | Male | Female |
| Production | 721 (82.6%) | 152 (17.4%) |
| Transportation | 298 (95.2%) | 15 (4.8%) |
| Material Moving | 526 (75.0%) | 175 (25.0%) |
| Total (Category) | 1,545 (81.9%) | 342 (18.1%) |
| Total (Overall) | 4,501 (54.1%) | 3,813 (45.9%) |
Employment Industries by Sex in Lebanon
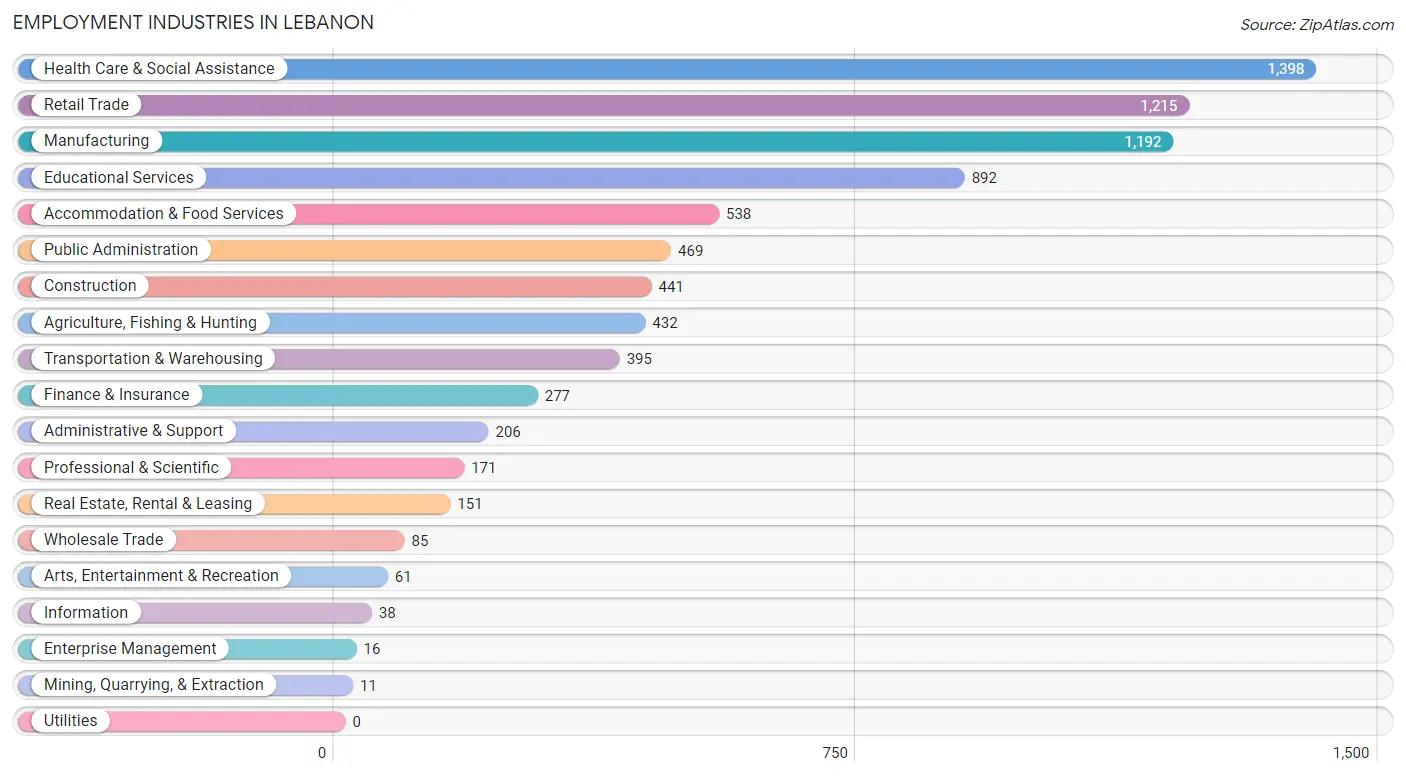
Employment Industries in Lebanon
The major employment industries in Lebanon include Health Care & Social Assistance (1,398 | 16.8%), Retail Trade (1,215 | 14.6%), Manufacturing (1,192 | 14.3%), Educational Services (892 | 10.7%), and Accommodation & Food Services (538 | 6.5%).
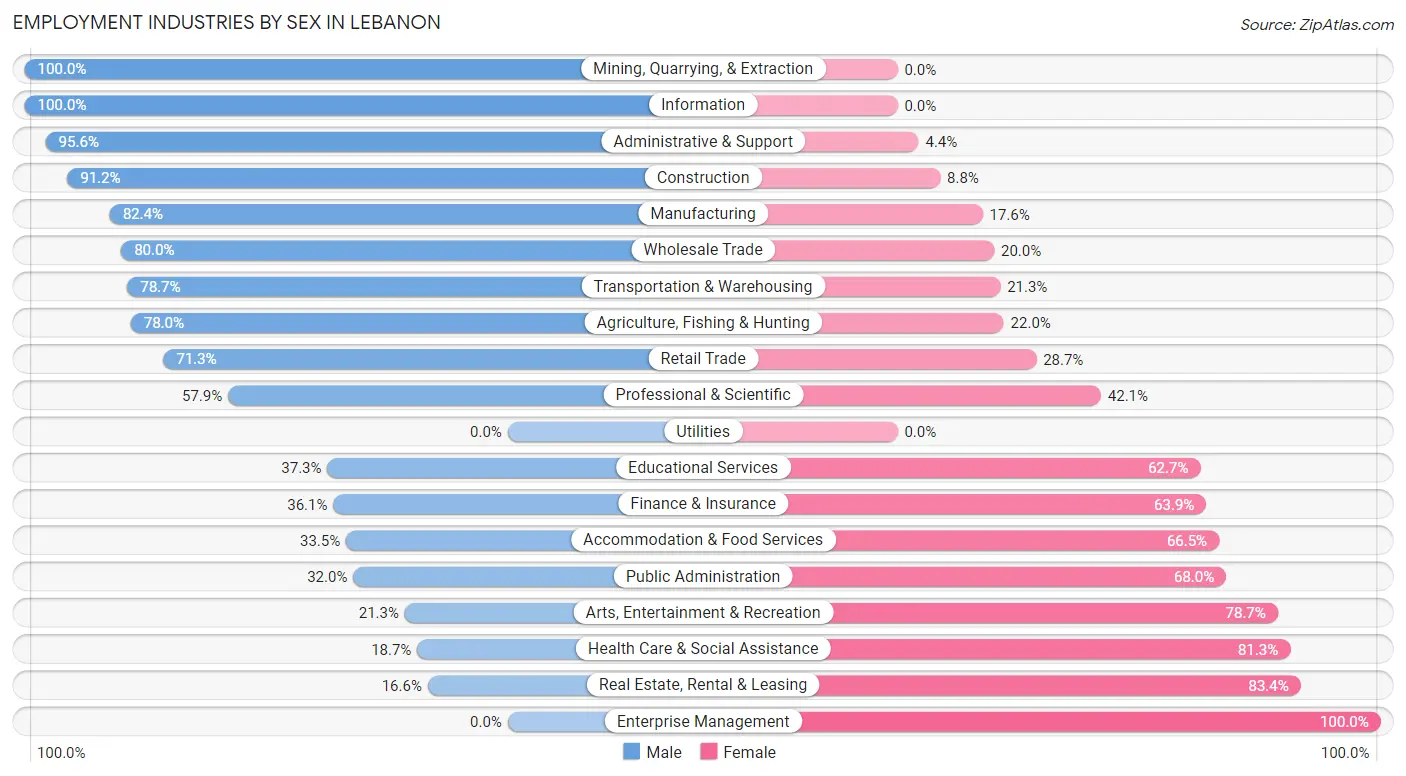
Employment Industries by Sex in Lebanon
The Lebanon industries that see more men than women are Mining, Quarrying, & Extraction (100.0%), Information (100.0%), and Administrative & Support (95.6%), whereas the industries that tend to have a higher number of women are Enterprise Management (100.0%), Real Estate, Rental & Leasing (83.4%), and Health Care & Social Assistance (81.3%).
| Industry | Male | Female |
| Agriculture, Fishing & Hunting | 337 (78.0%) | 95 (22.0%) |
| Mining, Quarrying, & Extraction | 11 (100.0%) | 0 (0.0%) |
| Construction | 402 (91.2%) | 39 (8.8%) |
| Manufacturing | 982 (82.4%) | 210 (17.6%) |
| Wholesale Trade | 68 (80.0%) | 17 (20.0%) |
| Retail Trade | 866 (71.3%) | 349 (28.7%) |
| Transportation & Warehousing | 311 (78.7%) | 84 (21.3%) |
| Utilities | 0 (0.0%) | 0 (0.0%) |
| Information | 38 (100.0%) | 0 (0.0%) |
| Finance & Insurance | 100 (36.1%) | 177 (63.9%) |
| Real Estate, Rental & Leasing | 25 (16.6%) | 126 (83.4%) |
| Professional & Scientific | 99 (57.9%) | 72 (42.1%) |
| Enterprise Management | 0 (0.0%) | 16 (100.0%) |
| Administrative & Support | 197 (95.6%) | 9 (4.4%) |
| Educational Services | 333 (37.3%) | 559 (62.7%) |
| Health Care & Social Assistance | 262 (18.7%) | 1,136 (81.3%) |
| Arts, Entertainment & Recreation | 13 (21.3%) | 48 (78.7%) |
| Accommodation & Food Services | 180 (33.5%) | 358 (66.5%) |
| Public Administration | 150 (32.0%) | 319 (68.0%) |
| Total | 4,501 (54.1%) | 3,813 (45.9%) |
Education in Lebanon
School Enrollment in Lebanon
The most common levels of schooling among the 3,936 students in Lebanon are middle school (1,098 | 27.9%), elementary school (874 | 22.2%), and high school (757 | 19.2%).
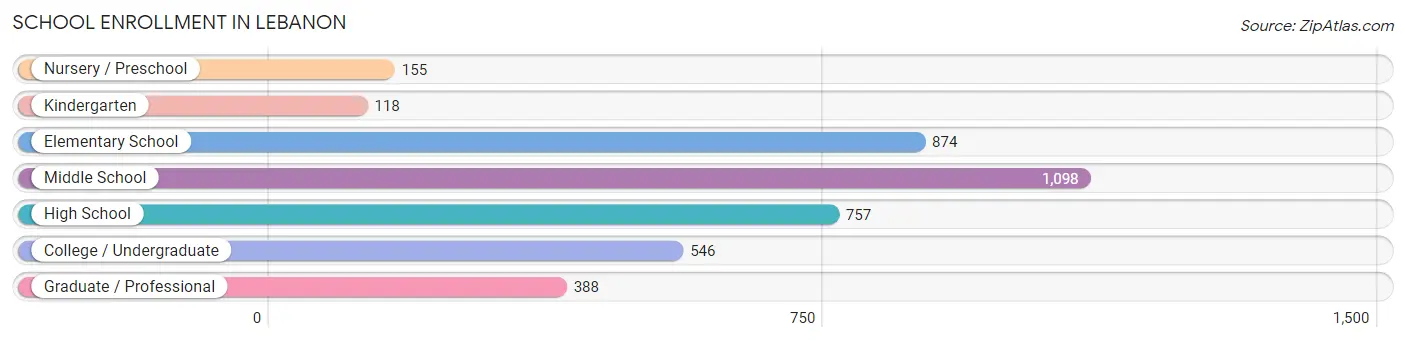
| School Level | # Students | % Students |
| Nursery / Preschool | 155 | 3.9% |
| Kindergarten | 118 | 3.0% |
| Elementary School | 874 | 22.2% |
| Middle School | 1,098 | 27.9% |
| High School | 757 | 19.2% |
| College / Undergraduate | 546 | 13.9% |
| Graduate / Professional | 388 | 9.9% |
| Total | 3,936 | 100.0% |
School Enrollment by Age by Funding Source in Lebanon
Out of a total of 3,936 students who are enrolled in schools in Lebanon, 925 (23.5%) attend a private institution, while the remaining 3,011 (76.5%) are enrolled in public schools. The age group of 35 years and over has the highest likelihood of being enrolled in private schools, with 22 (47.8% in the age bracket) enrolled. Conversely, the age group of 18 to 19 year olds has the lowest likelihood of being enrolled in a private school, with 56 (100.0% in the age bracket) attending a public institution.
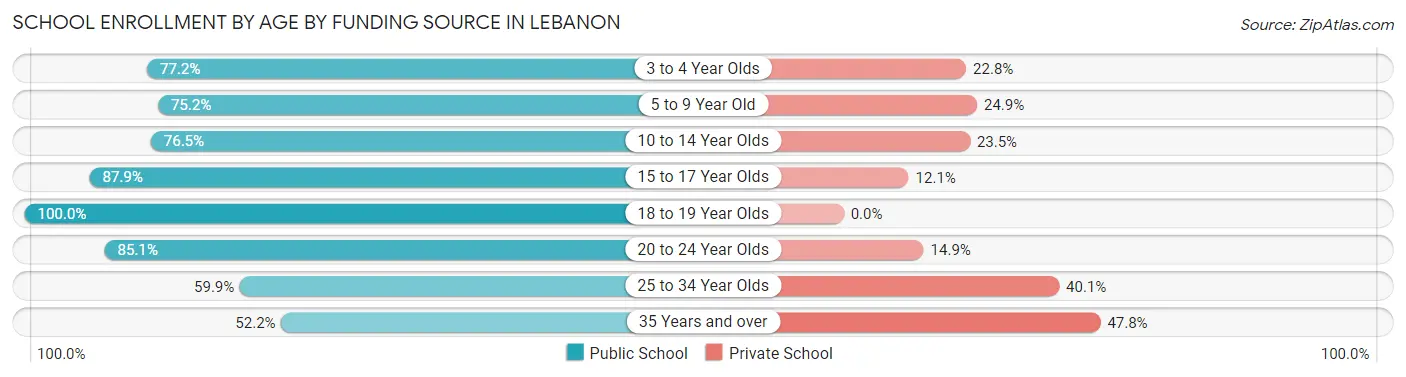
| Age Bracket | Public School | Private School |
| 3 to 4 Year Olds | 44 (77.2%) | 13 (22.8%) |
| 5 to 9 Year Old | 753 (75.1%) | 249 (24.8%) |
| 10 to 14 Year Olds | 907 (76.5%) | 279 (23.5%) |
| 15 to 17 Year Olds | 632 (87.9%) | 87 (12.1%) |
| 18 to 19 Year Olds | 56 (100.0%) | 0 (0.0%) |
| 20 to 24 Year Olds | 257 (85.1%) | 45 (14.9%) |
| 25 to 34 Year Olds | 340 (59.9%) | 228 (40.1%) |
| 35 Years and over | 24 (52.2%) | 22 (47.8%) |
| Total | 3,011 (76.5%) | 925 (23.5%) |
Educational Attainment by Field of Study in Lebanon
Education (551 | 19.6%), science & technology (350 | 12.4%), liberal arts & history (346 | 12.3%), business (272 | 9.7%), and arts & humanities (269 | 9.6%) are the most common fields of study among 2,816 individuals in Lebanon who have obtained a bachelor's degree or higher.
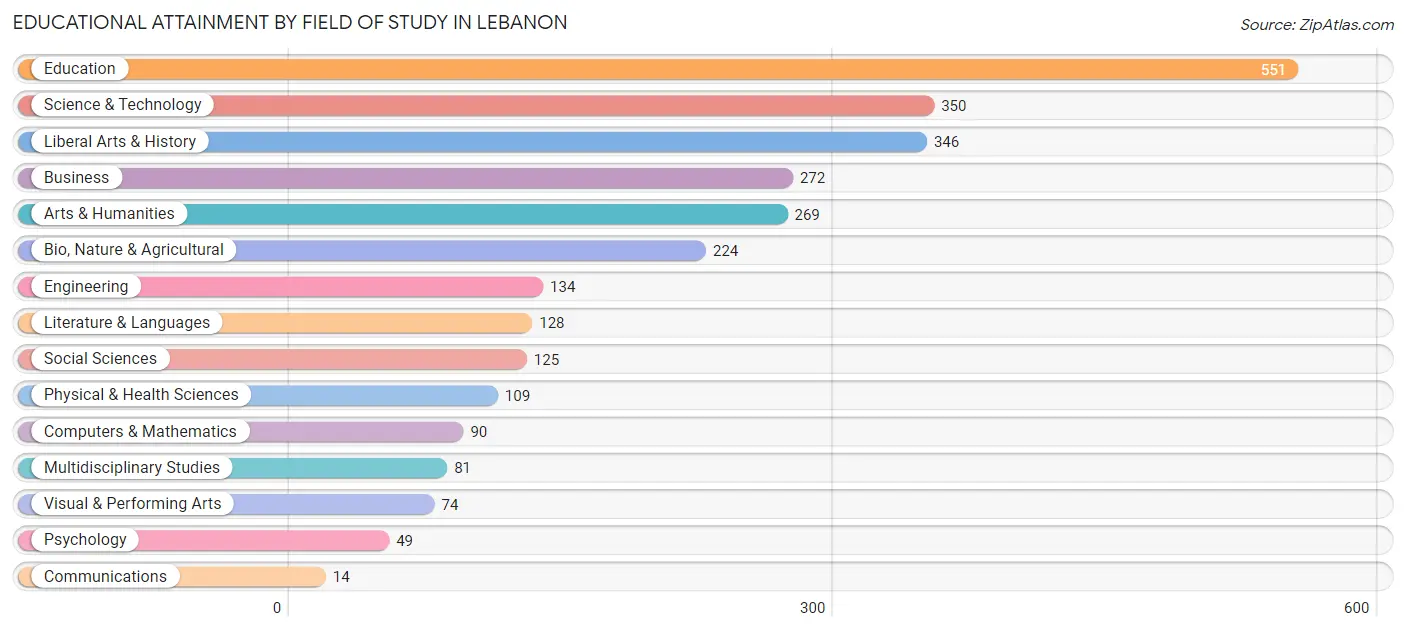
| Field of Study | # Graduates | % Graduates |
| Computers & Mathematics | 90 | 3.2% |
| Bio, Nature & Agricultural | 224 | 8.0% |
| Physical & Health Sciences | 109 | 3.9% |
| Psychology | 49 | 1.7% |
| Social Sciences | 125 | 4.4% |
| Engineering | 134 | 4.8% |
| Multidisciplinary Studies | 81 | 2.9% |
| Science & Technology | 350 | 12.4% |
| Business | 272 | 9.7% |
| Education | 551 | 19.6% |
| Literature & Languages | 128 | 4.5% |
| Liberal Arts & History | 346 | 12.3% |
| Visual & Performing Arts | 74 | 2.6% |
| Communications | 14 | 0.5% |
| Arts & Humanities | 269 | 9.6% |
| Total | 2,816 | 100.0% |
Transportation & Commute in Lebanon
Vehicle Availability by Sex in Lebanon
The most prevalent vehicle ownership categories in Lebanon are males with 2 vehicles (1,758, accounting for 39.6%) and females with 2 vehicles (1,315, making up 47.2%).
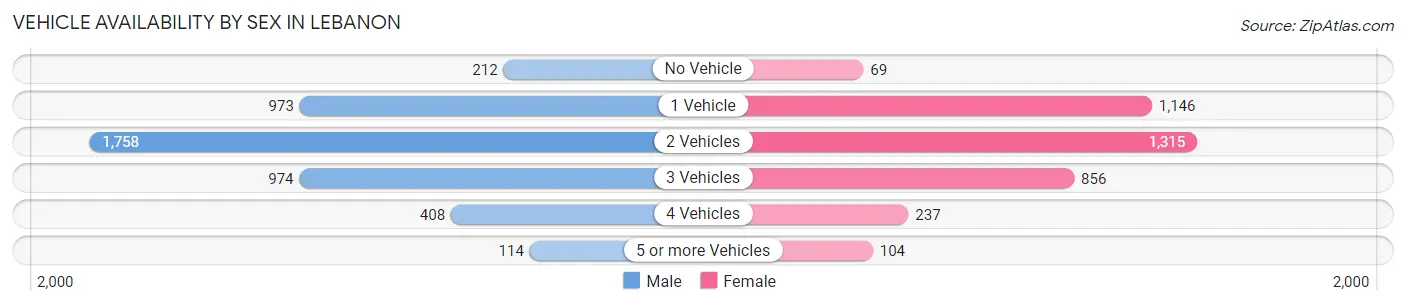
| Vehicles Available | Male | Female |
| No Vehicle | 212 (4.8%) | 69 (1.8%) |
| 1 Vehicle | 973 (21.9%) | 1,146 (30.7%) |
| 2 Vehicles | 1,758 (39.6%) | 1,315 (35.3%) |
| 3 Vehicles | 974 (21.9%) | 856 (23.0%) |
| 4 Vehicles | 408 (9.2%) | 237 (6.4%) |
| 5 or more Vehicles | 114 (2.6%) | 104 (2.8%) |
| Total | 4,439 (100.0%) | 3,727 (100.0%) |
Commute Time in Lebanon
The most frequently occuring commute durations in Lebanon are 5 to 9 minutes (1,481 commuters, 18.9%), 30 to 34 minutes (1,181 commuters, 15.1%), and 10 to 14 minutes (1,066 commuters, 13.6%).
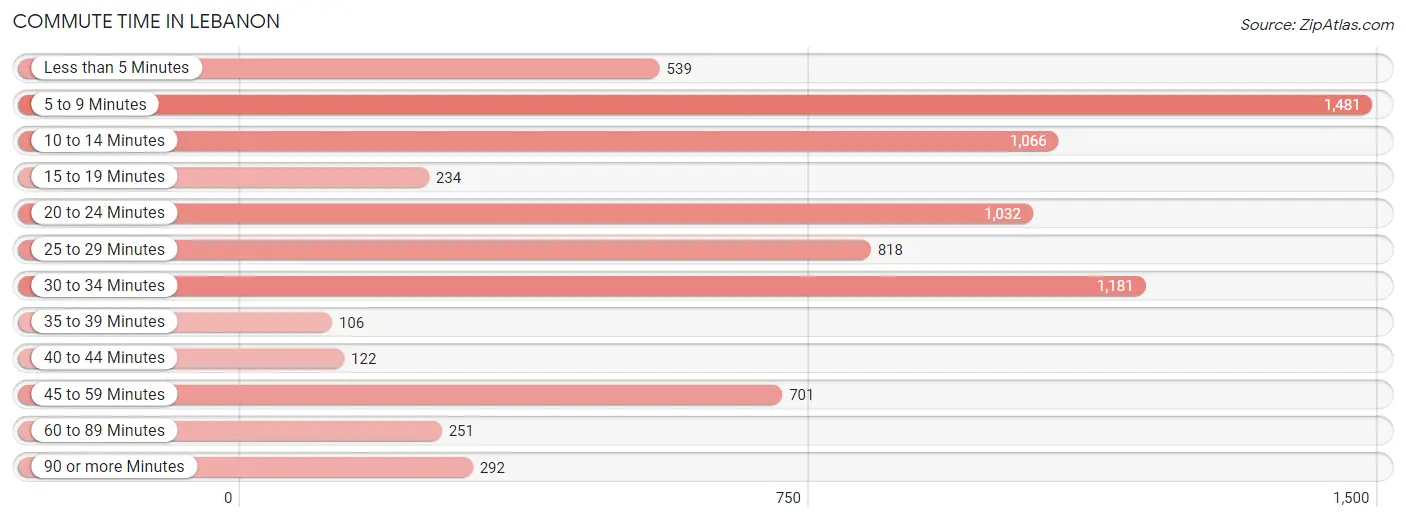
| Commute Time | # Commuters | % Commuters |
| Less than 5 Minutes | 539 | 6.9% |
| 5 to 9 Minutes | 1,481 | 18.9% |
| 10 to 14 Minutes | 1,066 | 13.6% |
| 15 to 19 Minutes | 234 | 3.0% |
| 20 to 24 Minutes | 1,032 | 13.2% |
| 25 to 29 Minutes | 818 | 10.5% |
| 30 to 34 Minutes | 1,181 | 15.1% |
| 35 to 39 Minutes | 106 | 1.3% |
| 40 to 44 Minutes | 122 | 1.6% |
| 45 to 59 Minutes | 701 | 9.0% |
| 60 to 89 Minutes | 251 | 3.2% |
| 90 or more Minutes | 292 | 3.7% |
Commute Time by Sex in Lebanon
The most common commute times in Lebanon are 20 to 24 minutes (692 commuters, 16.3%) for males and 5 to 9 minutes (803 commuters, 22.5%) for females.
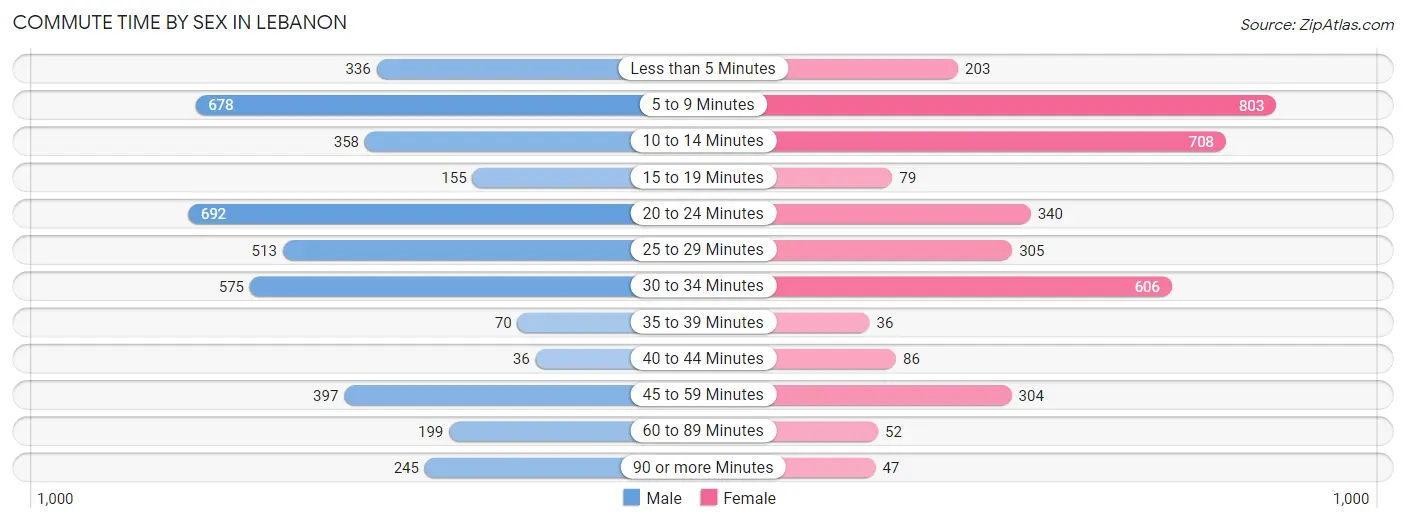
| Commute Time | Male | Female |
| Less than 5 Minutes | 336 (7.9%) | 203 (5.7%) |
| 5 to 9 Minutes | 678 (15.9%) | 803 (22.5%) |
| 10 to 14 Minutes | 358 (8.4%) | 708 (19.8%) |
| 15 to 19 Minutes | 155 (3.6%) | 79 (2.2%) |
| 20 to 24 Minutes | 692 (16.3%) | 340 (9.5%) |
| 25 to 29 Minutes | 513 (12.1%) | 305 (8.6%) |
| 30 to 34 Minutes | 575 (13.5%) | 606 (17.0%) |
| 35 to 39 Minutes | 70 (1.7%) | 36 (1.0%) |
| 40 to 44 Minutes | 36 (0.9%) | 86 (2.4%) |
| 45 to 59 Minutes | 397 (9.3%) | 304 (8.5%) |
| 60 to 89 Minutes | 199 (4.7%) | 52 (1.5%) |
| 90 or more Minutes | 245 (5.8%) | 47 (1.3%) |
Time of Departure to Work by Sex in Lebanon
The most frequent times of departure to work in Lebanon are 7:00 AM to 7:29 AM (640, 15.0%) for males and 5:30 AM to 5:59 AM (459, 12.9%) for females.
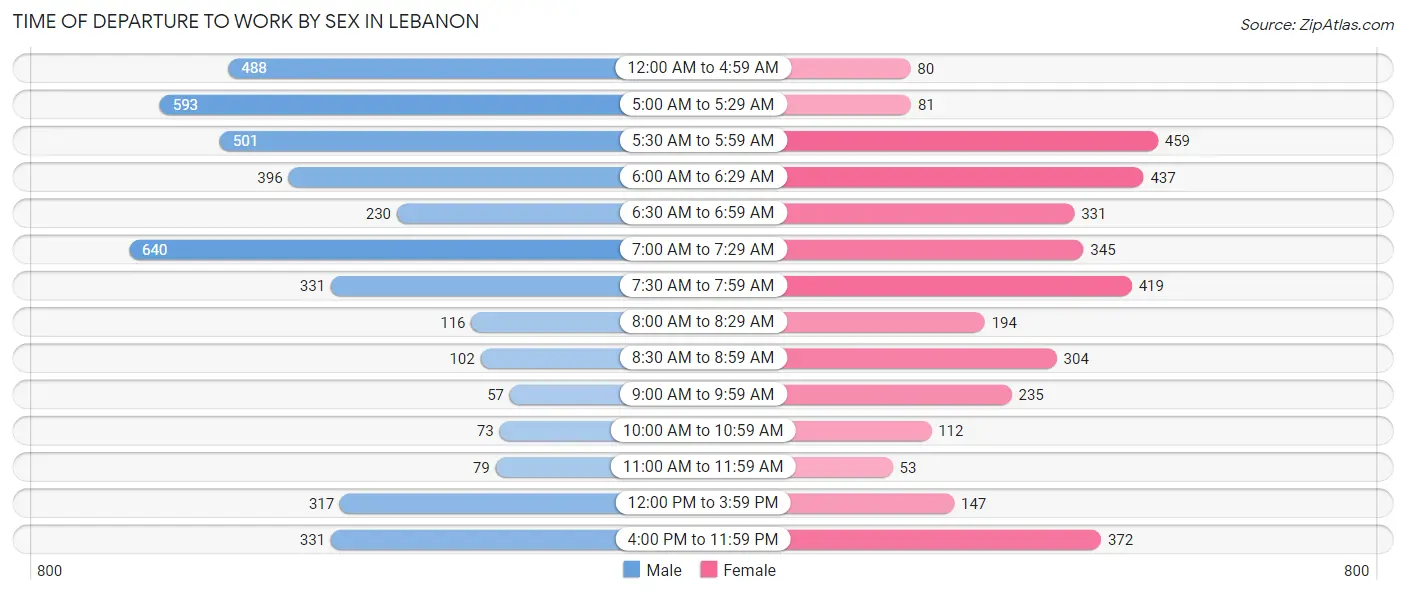
| Time of Departure | Male | Female |
| 12:00 AM to 4:59 AM | 488 (11.5%) | 80 (2.2%) |
| 5:00 AM to 5:29 AM | 593 (13.9%) | 81 (2.3%) |
| 5:30 AM to 5:59 AM | 501 (11.8%) | 459 (12.9%) |
| 6:00 AM to 6:29 AM | 396 (9.3%) | 437 (12.2%) |
| 6:30 AM to 6:59 AM | 230 (5.4%) | 331 (9.3%) |
| 7:00 AM to 7:29 AM | 640 (15.0%) | 345 (9.7%) |
| 7:30 AM to 7:59 AM | 331 (7.8%) | 419 (11.7%) |
| 8:00 AM to 8:29 AM | 116 (2.7%) | 194 (5.4%) |
| 8:30 AM to 8:59 AM | 102 (2.4%) | 304 (8.5%) |
| 9:00 AM to 9:59 AM | 57 (1.3%) | 235 (6.6%) |
| 10:00 AM to 10:59 AM | 73 (1.7%) | 112 (3.1%) |
| 11:00 AM to 11:59 AM | 79 (1.9%) | 53 (1.5%) |
| 12:00 PM to 3:59 PM | 317 (7.4%) | 147 (4.1%) |
| 4:00 PM to 11:59 PM | 331 (7.8%) | 372 (10.4%) |
| Total | 4,254 (100.0%) | 3,569 (100.0%) |
Housing Occupancy in Lebanon
Occupancy by Ownership in Lebanon
Of the total 7,458 dwellings in Lebanon, owner-occupied units account for 3,927 (52.6%), while renter-occupied units make up 3,531 (47.3%).
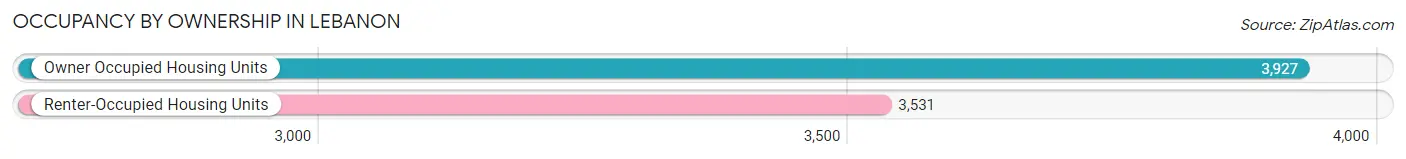
| Occupancy | # Housing Units | % Housing Units |
| Owner Occupied Housing Units | 3,927 | 52.6% |
| Renter-Occupied Housing Units | 3,531 | 47.3% |
| Total Occupied Housing Units | 7,458 | 100.0% |
Occupancy by Household Size in Lebanon
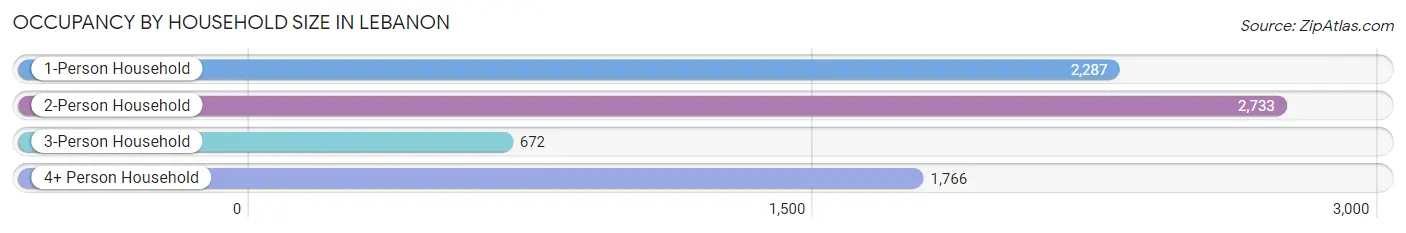
| Household Size | # Housing Units | % Housing Units |
| 1-Person Household | 2,287 | 30.7% |
| 2-Person Household | 2,733 | 36.6% |
| 3-Person Household | 672 | 9.0% |
| 4+ Person Household | 1,766 | 23.7% |
| Total Housing Units | 7,458 | 100.0% |
Occupancy by Ownership by Household Size in Lebanon
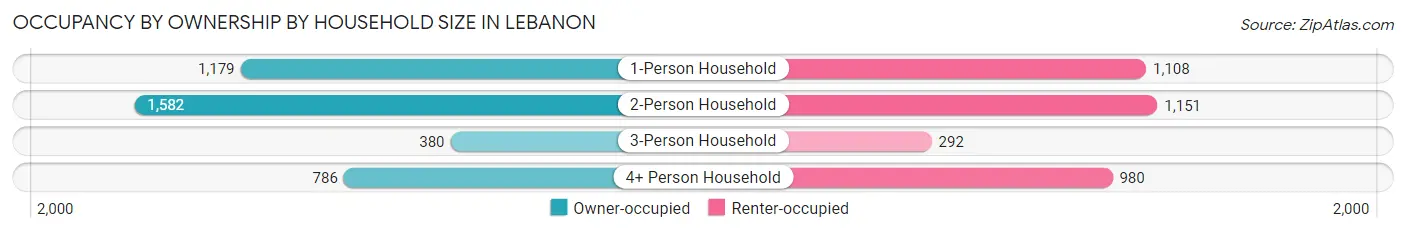
| Household Size | Owner-occupied | Renter-occupied |
| 1-Person Household | 1,179 (51.5%) | 1,108 (48.4%) |
| 2-Person Household | 1,582 (57.9%) | 1,151 (42.1%) |
| 3-Person Household | 380 (56.6%) | 292 (43.4%) |
| 4+ Person Household | 786 (44.5%) | 980 (55.5%) |
| Total Housing Units | 3,927 (52.6%) | 3,531 (47.3%) |
Occupancy by Educational Attainment in Lebanon
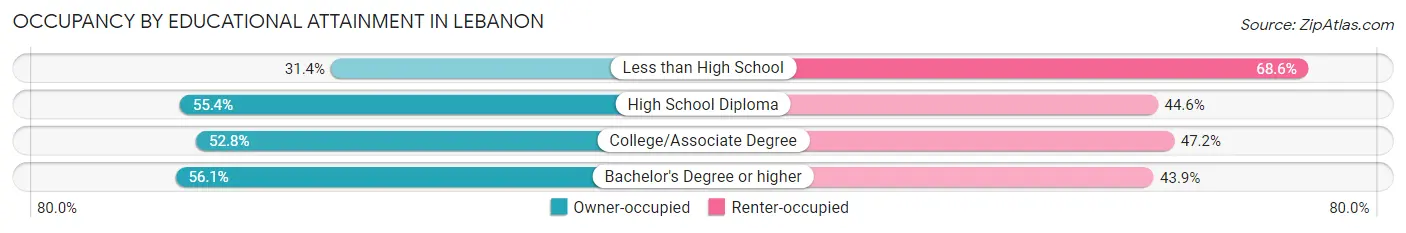
| Household Size | Owner-occupied | Renter-occupied |
| Less than High School | 186 (31.4%) | 406 (68.6%) |
| High School Diploma | 1,227 (55.4%) | 989 (44.6%) |
| College/Associate Degree | 1,503 (52.8%) | 1,344 (47.2%) |
| Bachelor's Degree or higher | 1,011 (56.1%) | 792 (43.9%) |
Occupancy by Age of Householder in Lebanon
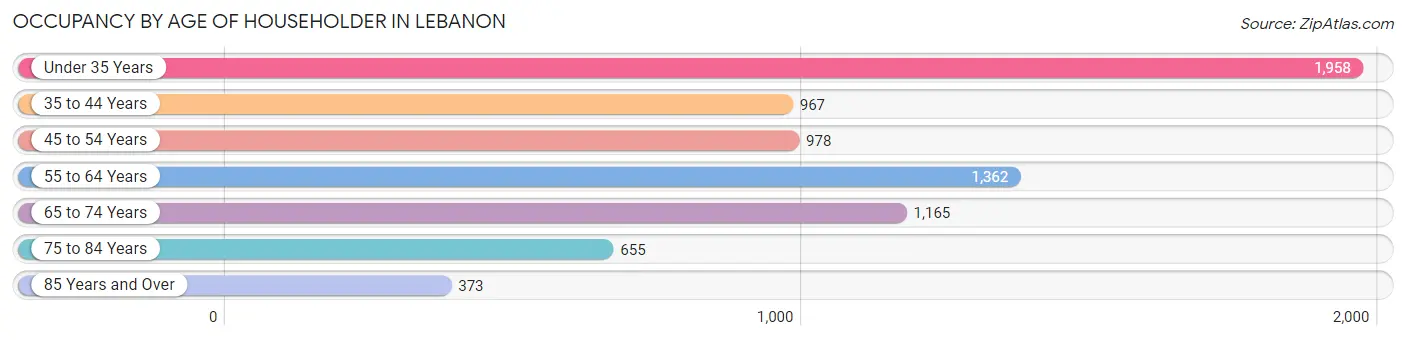
| Age Bracket | # Households | % Households |
| Under 35 Years | 1,958 | 26.3% |
| 35 to 44 Years | 967 | 13.0% |
| 45 to 54 Years | 978 | 13.1% |
| 55 to 64 Years | 1,362 | 18.3% |
| 65 to 74 Years | 1,165 | 15.6% |
| 75 to 84 Years | 655 | 8.8% |
| 85 Years and Over | 373 | 5.0% |
| Total | 7,458 | 100.0% |
Housing Finances in Lebanon
Median Income by Occupancy in Lebanon
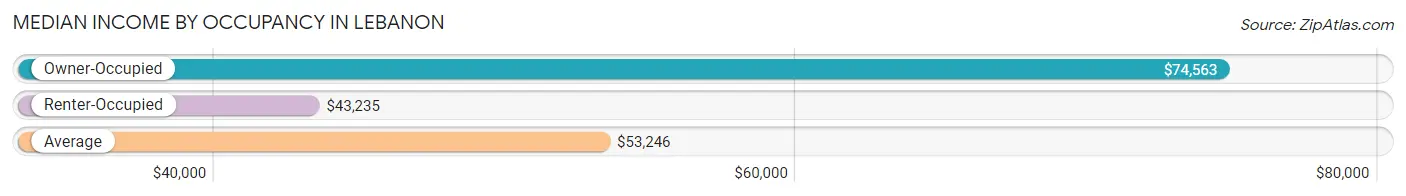
| Occupancy Type | # Households | Median Income |
| Owner-Occupied | 3,927 (52.6%) | $74,563 |
| Renter-Occupied | 3,531 (47.3%) | $43,235 |
| Average | 7,458 (100.0%) | $53,246 |
Occupancy by Householder Income Bracket in Lebanon
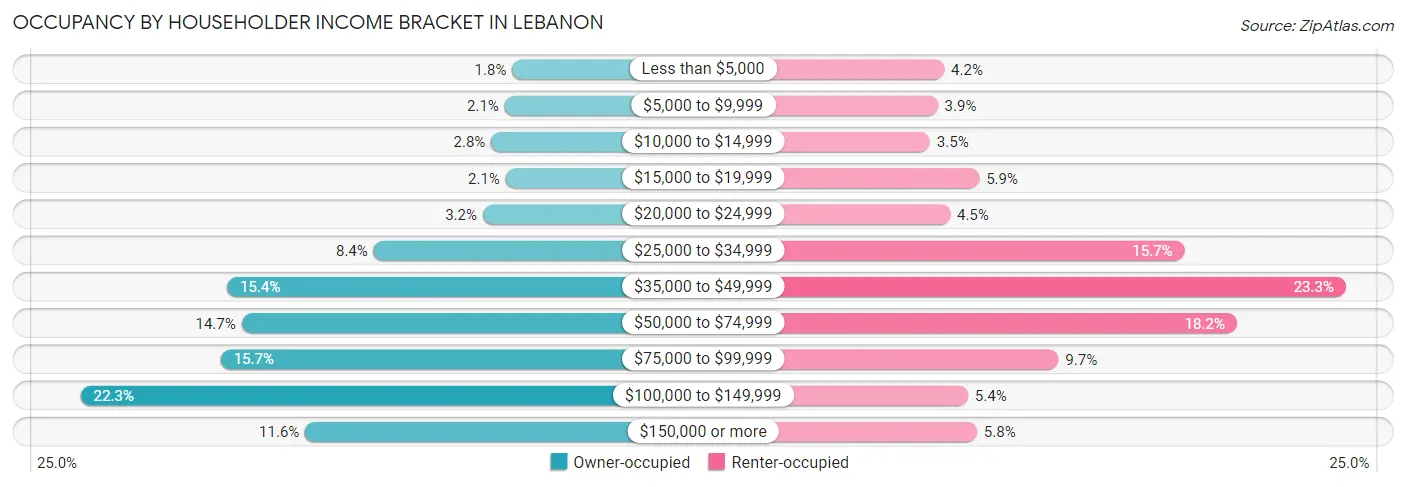
| Income Bracket | Owner-occupied | Renter-occupied |
| Less than $5,000 | 70 (1.8%) | 149 (4.2%) |
| $5,000 to $9,999 | 84 (2.1%) | 138 (3.9%) |
| $10,000 to $14,999 | 109 (2.8%) | 125 (3.5%) |
| $15,000 to $19,999 | 82 (2.1%) | 208 (5.9%) |
| $20,000 to $24,999 | 125 (3.2%) | 159 (4.5%) |
| $25,000 to $34,999 | 329 (8.4%) | 553 (15.7%) |
| $35,000 to $49,999 | 603 (15.4%) | 824 (23.3%) |
| $50,000 to $74,999 | 576 (14.7%) | 641 (18.1%) |
| $75,000 to $99,999 | 615 (15.7%) | 341 (9.7%) |
| $100,000 to $149,999 | 877 (22.3%) | 189 (5.3%) |
| $150,000 or more | 457 (11.6%) | 204 (5.8%) |
| Total | 3,927 (100.0%) | 3,531 (100.0%) |
Monthly Housing Cost Tiers in Lebanon
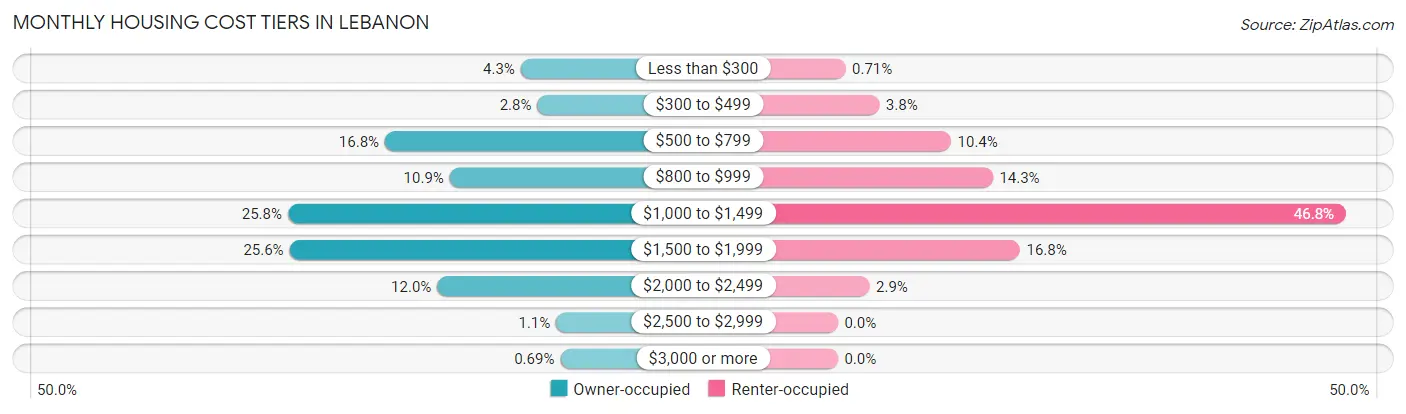
| Monthly Cost | Owner-occupied | Renter-occupied |
| Less than $300 | 170 (4.3%) | 25 (0.7%) |
| $300 to $499 | 110 (2.8%) | 135 (3.8%) |
| $500 to $799 | 661 (16.8%) | 368 (10.4%) |
| $800 to $999 | 427 (10.9%) | 504 (14.3%) |
| $1,000 to $1,499 | 1,012 (25.8%) | 1,653 (46.8%) |
| $1,500 to $1,999 | 1,006 (25.6%) | 592 (16.8%) |
| $2,000 to $2,499 | 472 (12.0%) | 103 (2.9%) |
| $2,500 to $2,999 | 42 (1.1%) | 0 (0.0%) |
| $3,000 or more | 27 (0.7%) | 0 (0.0%) |
| Total | 3,927 (100.0%) | 3,531 (100.0%) |
Physical Housing Characteristics in Lebanon
Housing Structures in Lebanon
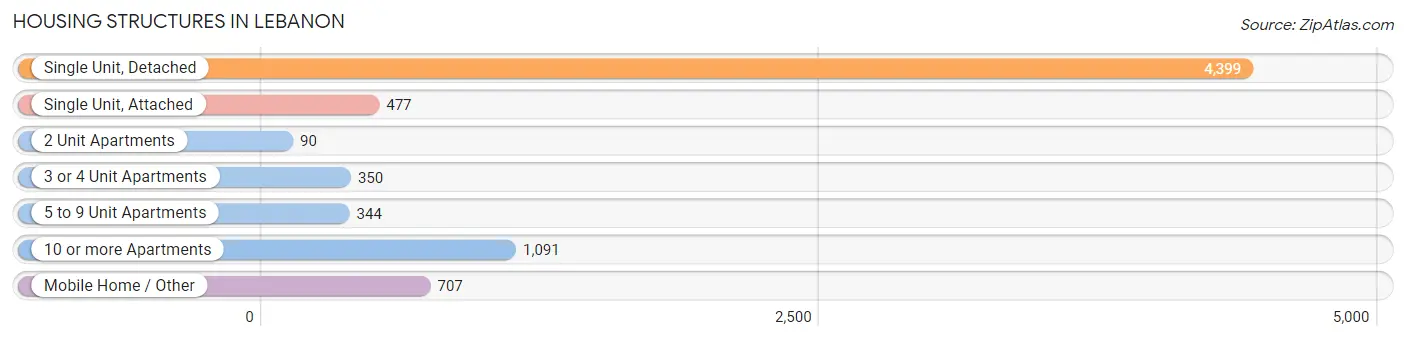
| Structure Type | # Housing Units | % Housing Units |
| Single Unit, Detached | 4,399 | 59.0% |
| Single Unit, Attached | 477 | 6.4% |
| 2 Unit Apartments | 90 | 1.2% |
| 3 or 4 Unit Apartments | 350 | 4.7% |
| 5 to 9 Unit Apartments | 344 | 4.6% |
| 10 or more Apartments | 1,091 | 14.6% |
| Mobile Home / Other | 707 | 9.5% |
| Total | 7,458 | 100.0% |
Housing Structures by Occupancy in Lebanon
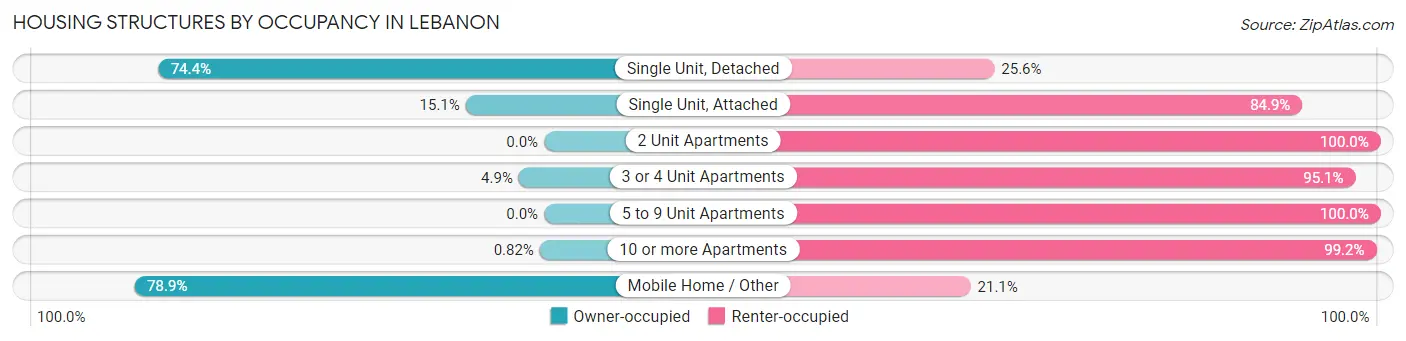
| Structure Type | Owner-occupied | Renter-occupied |
| Single Unit, Detached | 3,271 (74.4%) | 1,128 (25.6%) |
| Single Unit, Attached | 72 (15.1%) | 405 (84.9%) |
| 2 Unit Apartments | 0 (0.0%) | 90 (100.0%) |
| 3 or 4 Unit Apartments | 17 (4.9%) | 333 (95.1%) |
| 5 to 9 Unit Apartments | 0 (0.0%) | 344 (100.0%) |
| 10 or more Apartments | 9 (0.8%) | 1,082 (99.2%) |
| Mobile Home / Other | 558 (78.9%) | 149 (21.1%) |
| Total | 3,927 (52.6%) | 3,531 (47.3%) |
Housing Structures by Number of Rooms in Lebanon
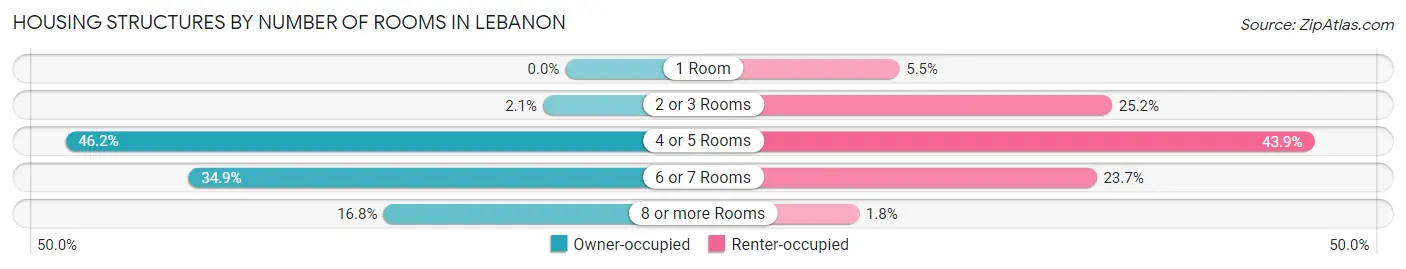
| Number of Rooms | Owner-occupied | Renter-occupied |
| 1 Room | 0 (0.0%) | 194 (5.5%) |
| 2 or 3 Rooms | 81 (2.1%) | 888 (25.2%) |
| 4 or 5 Rooms | 1,816 (46.2%) | 1,549 (43.9%) |
| 6 or 7 Rooms | 1,369 (34.9%) | 838 (23.7%) |
| 8 or more Rooms | 661 (16.8%) | 62 (1.8%) |
| Total | 3,927 (100.0%) | 3,531 (100.0%) |
Housing Structure by Heating Type in Lebanon
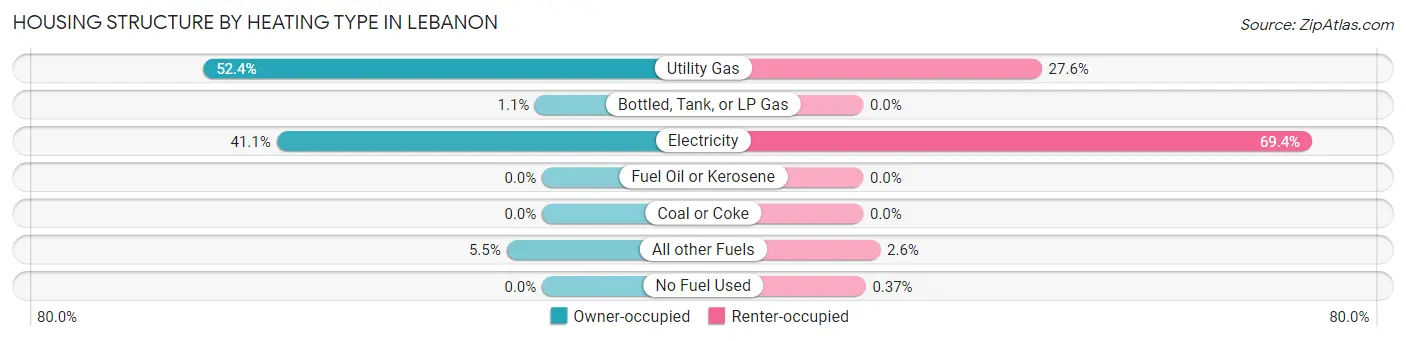
| Heating Type | Owner-occupied | Renter-occupied |
| Utility Gas | 2,057 (52.4%) | 975 (27.6%) |
| Bottled, Tank, or LP Gas | 42 (1.1%) | 0 (0.0%) |
| Electricity | 1,612 (41.0%) | 2,450 (69.4%) |
| Fuel Oil or Kerosene | 0 (0.0%) | 0 (0.0%) |
| Coal or Coke | 0 (0.0%) | 0 (0.0%) |
| All other Fuels | 216 (5.5%) | 93 (2.6%) |
| No Fuel Used | 0 (0.0%) | 13 (0.4%) |
| Total | 3,927 (100.0%) | 3,531 (100.0%) |
Household Vehicle Usage in Lebanon
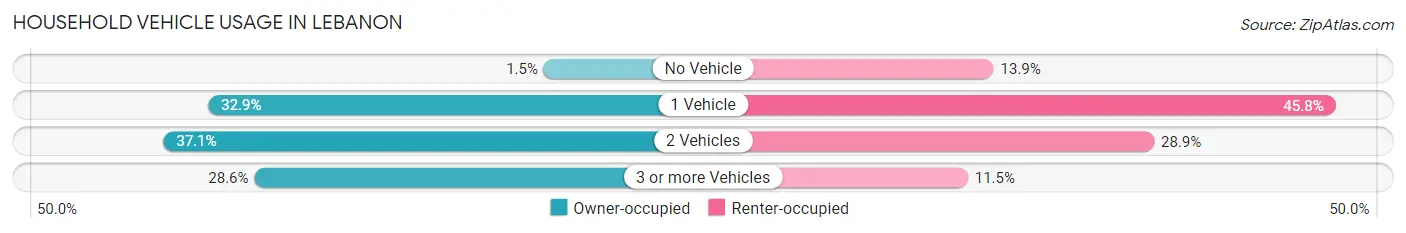
| Vehicles per Household | Owner-occupied | Renter-occupied |
| No Vehicle | 60 (1.5%) | 490 (13.9%) |
| 1 Vehicle | 1,291 (32.9%) | 1,617 (45.8%) |
| 2 Vehicles | 1,455 (37.0%) | 1,019 (28.9%) |
| 3 or more Vehicles | 1,121 (28.5%) | 405 (11.5%) |
| Total | 3,927 (100.0%) | 3,531 (100.0%) |
Real Estate & Mortgages in Lebanon
Real Estate and Mortgage Overview in Lebanon
| Characteristic | Without Mortgage | With Mortgage |
| Housing Units | 1,074 | 2,853 |
| Median Property Value | $197,600 | $276,000 |
| Median Household Income | $74,471 | $311 |
| Monthly Housing Costs | $590 | $27 |
| Real Estate Taxes | $2,553 | $70 |
Property Value by Mortgage Status in Lebanon
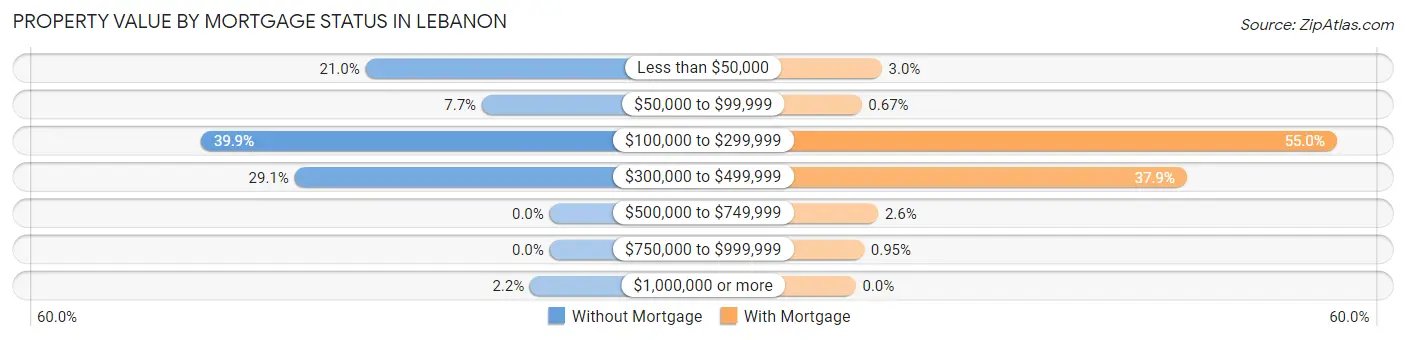
| Property Value | Without Mortgage | With Mortgage |
| Less than $50,000 | 226 (21.0%) | 85 (3.0%) |
| $50,000 to $99,999 | 83 (7.7%) | 19 (0.7%) |
| $100,000 to $299,999 | 428 (39.9%) | 1,569 (55.0%) |
| $300,000 to $499,999 | 313 (29.1%) | 1,080 (37.9%) |
| $500,000 to $749,999 | 0 (0.0%) | 73 (2.6%) |
| $750,000 to $999,999 | 0 (0.0%) | 27 (0.9%) |
| $1,000,000 or more | 24 (2.2%) | 0 (0.0%) |
| Total | 1,074 (100.0%) | 2,853 (100.0%) |
Household Income by Mortgage Status in Lebanon
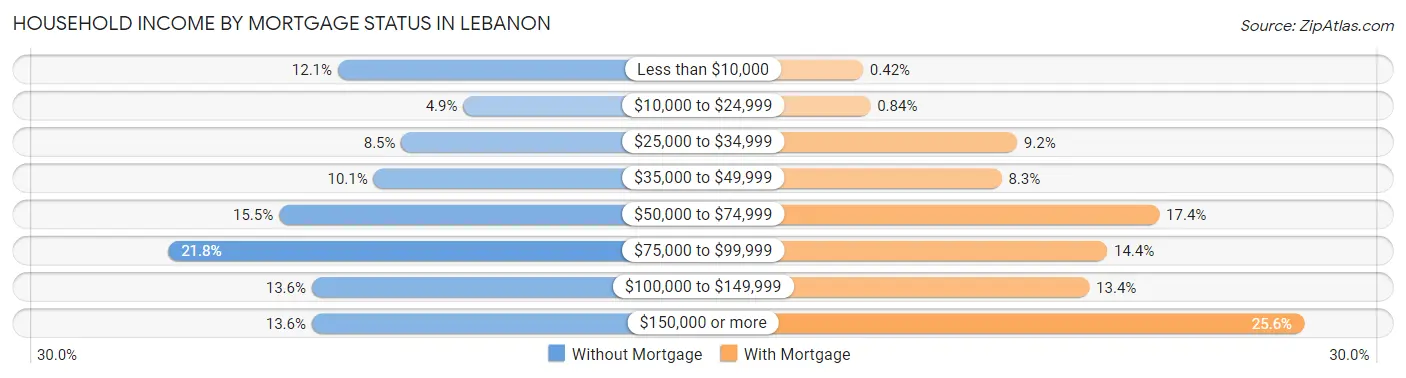
| Household Income | Without Mortgage | With Mortgage |
| Less than $10,000 | 130 (12.1%) | 12 (0.4%) |
| $10,000 to $24,999 | 53 (4.9%) | 24 (0.8%) |
| $25,000 to $34,999 | 91 (8.5%) | 263 (9.2%) |
| $35,000 to $49,999 | 108 (10.1%) | 238 (8.3%) |
| $50,000 to $74,999 | 166 (15.5%) | 495 (17.3%) |
| $75,000 to $99,999 | 234 (21.8%) | 410 (14.4%) |
| $100,000 to $149,999 | 146 (13.6%) | 381 (13.4%) |
| $150,000 or more | 146 (13.6%) | 731 (25.6%) |
| Total | 1,074 (100.0%) | 2,853 (100.0%) |
Property Value to Household Income Ratio in Lebanon
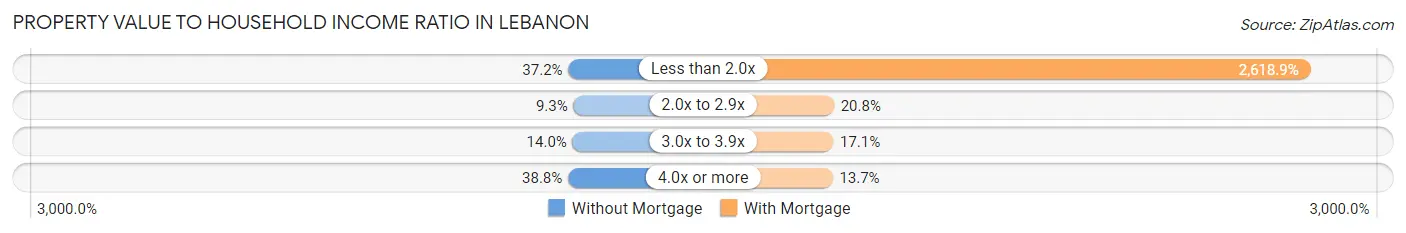
| Value-to-Income Ratio | Without Mortgage | With Mortgage |
| Less than 2.0x | 399 (37.1%) | 74,718 (2,618.9%) |
| 2.0x to 2.9x | 100 (9.3%) | 593 (20.8%) |
| 3.0x to 3.9x | 150 (14.0%) | 489 (17.1%) |
| 4.0x or more | 417 (38.8%) | 391 (13.7%) |
| Total | 1,074 (100.0%) | 2,853 (100.0%) |
Real Estate Taxes by Mortgage Status in Lebanon
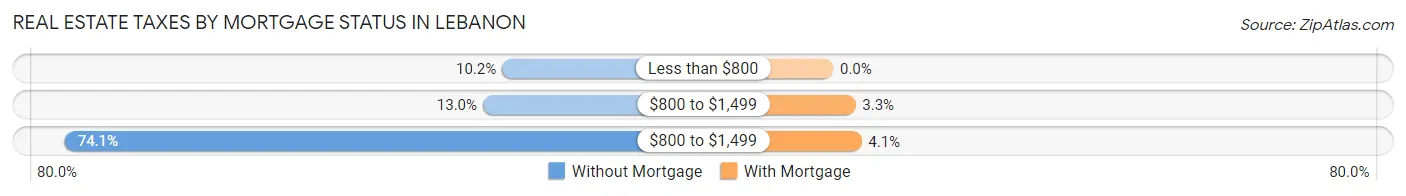
| Property Taxes | Without Mortgage | With Mortgage |
| Less than $800 | 110 (10.2%) | 0 (0.0%) |
| $800 to $1,499 | 140 (13.0%) | 93 (3.3%) |
| $800 to $1,499 | 796 (74.1%) | 118 (4.1%) |
| Total | 1,074 (100.0%) | 2,853 (100.0%) |
Health & Disability in Lebanon
Health Insurance Coverage by Age in Lebanon
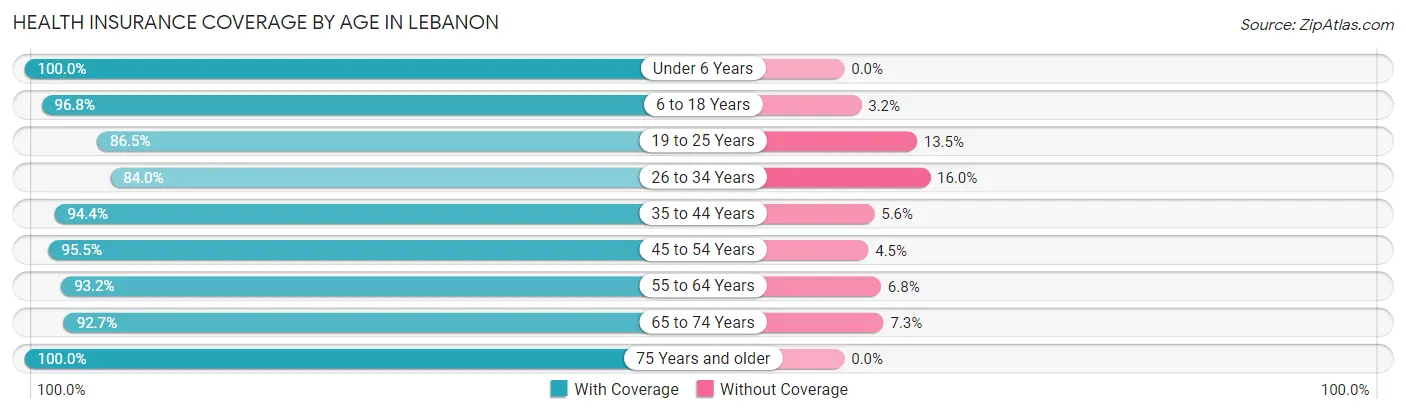
| Age Bracket | With Coverage | Without Coverage |
| Under 6 Years | 1,140 (100.0%) | 0 (0.0%) |
| 6 to 18 Years | 2,873 (96.8%) | 94 (3.2%) |
| 19 to 25 Years | 1,785 (86.5%) | 279 (13.5%) |
| 26 to 34 Years | 2,132 (84.0%) | 406 (16.0%) |
| 35 to 44 Years | 2,043 (94.4%) | 121 (5.6%) |
| 45 to 54 Years | 1,860 (95.5%) | 87 (4.5%) |
| 55 to 64 Years | 2,129 (93.2%) | 156 (6.8%) |
| 65 to 74 Years | 1,544 (92.7%) | 122 (7.3%) |
| 75 Years and older | 1,626 (100.0%) | 0 (0.0%) |
| Total | 17,132 (93.1%) | 1,265 (6.9%) |
Health Insurance Coverage by Citizenship Status in Lebanon
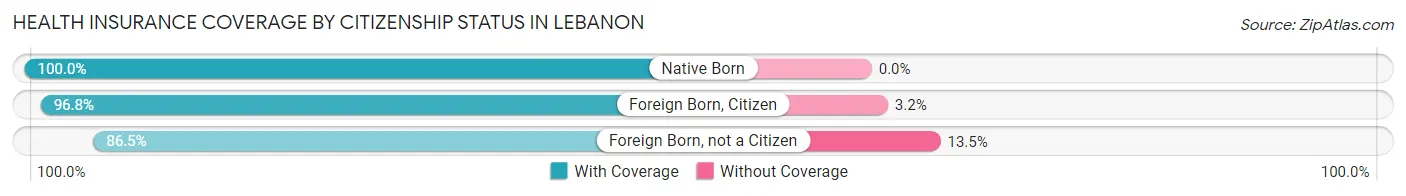
| Citizenship Status | With Coverage | Without Coverage |
| Native Born | 1,140 (100.0%) | 0 (0.0%) |
| Foreign Born, Citizen | 2,873 (96.8%) | 94 (3.2%) |
| Foreign Born, not a Citizen | 1,785 (86.5%) | 279 (13.5%) |
Health Insurance Coverage by Household Income in Lebanon
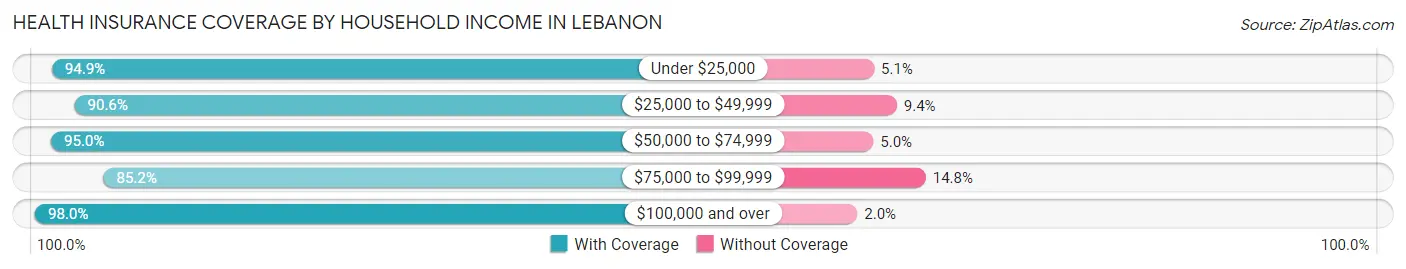
| Household Income | With Coverage | Without Coverage |
| Under $25,000 | 1,852 (94.9%) | 100 (5.1%) |
| $25,000 to $49,999 | 4,992 (90.6%) | 517 (9.4%) |
| $50,000 to $74,999 | 2,963 (95.0%) | 155 (5.0%) |
| $75,000 to $99,999 | 2,246 (85.2%) | 390 (14.8%) |
| $100,000 and over | 4,938 (98.0%) | 99 (2.0%) |
Public vs Private Health Insurance Coverage by Age in Lebanon
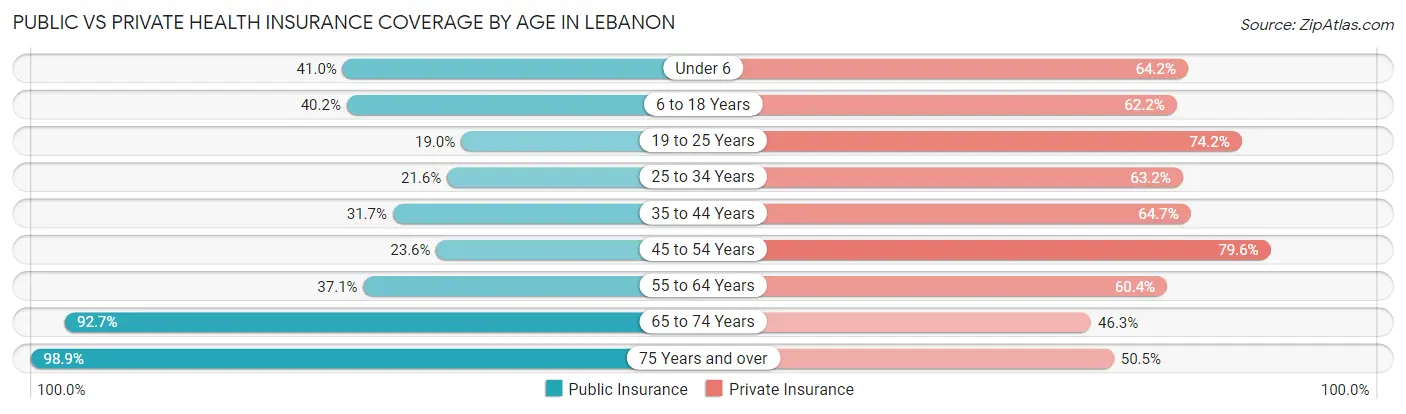
| Age Bracket | Public Insurance | Private Insurance |
| Under 6 | 467 (41.0%) | 732 (64.2%) |
| 6 to 18 Years | 1,193 (40.2%) | 1,844 (62.2%) |
| 19 to 25 Years | 392 (19.0%) | 1,531 (74.2%) |
| 25 to 34 Years | 548 (21.6%) | 1,605 (63.2%) |
| 35 to 44 Years | 685 (31.7%) | 1,401 (64.7%) |
| 45 to 54 Years | 459 (23.6%) | 1,549 (79.6%) |
| 55 to 64 Years | 848 (37.1%) | 1,379 (60.4%) |
| 65 to 74 Years | 1,544 (92.7%) | 771 (46.3%) |
| 75 Years and over | 1,608 (98.9%) | 821 (50.5%) |
| Total | 7,744 (42.1%) | 11,633 (63.2%) |
Disability Status by Sex by Age in Lebanon
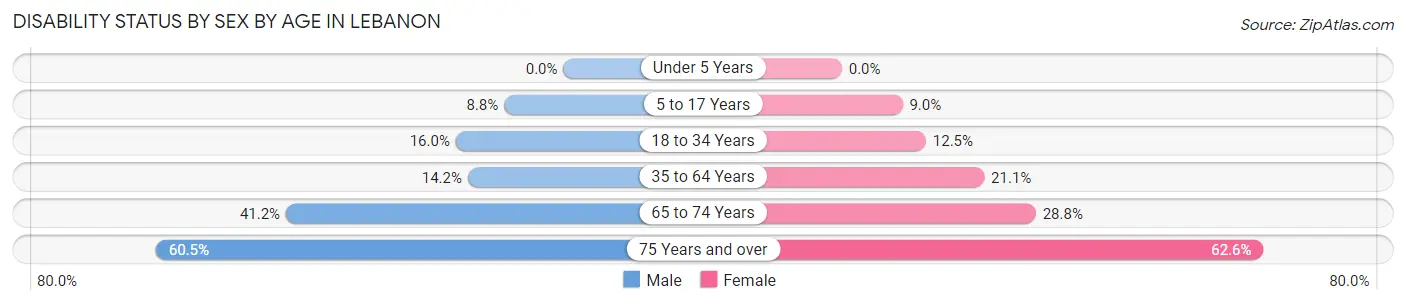
| Age Bracket | Male | Female |
| Under 5 Years | 0 (0.0%) | 0 (0.0%) |
| 5 to 17 Years | 134 (8.8%) | 142 (9.0%) |
| 18 to 34 Years | 402 (16.0%) | 277 (12.5%) |
| 35 to 64 Years | 455 (14.2%) | 674 (21.1%) |
| 65 to 74 Years | 283 (41.2%) | 282 (28.8%) |
| 75 Years and over | 400 (60.5%) | 604 (62.6%) |
Disability Class by Sex by Age in Lebanon
Disability Class: Hearing Difficulty
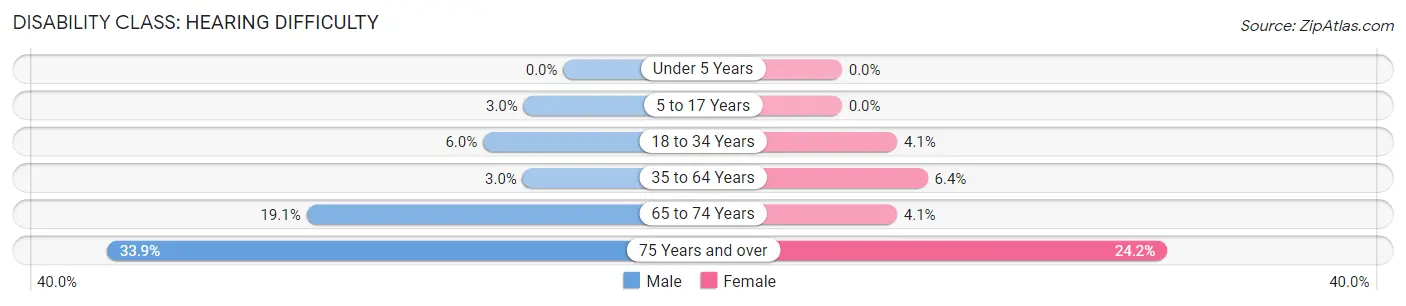
| Age Bracket | Male | Female |
| Under 5 Years | 0 (0.0%) | 0 (0.0%) |
| 5 to 17 Years | 45 (2.9%) | 0 (0.0%) |
| 18 to 34 Years | 150 (6.0%) | 91 (4.1%) |
| 35 to 64 Years | 97 (3.0%) | 203 (6.4%) |
| 65 to 74 Years | 131 (19.1%) | 40 (4.1%) |
| 75 Years and over | 224 (33.9%) | 233 (24.1%) |
Disability Class: Vision Difficulty
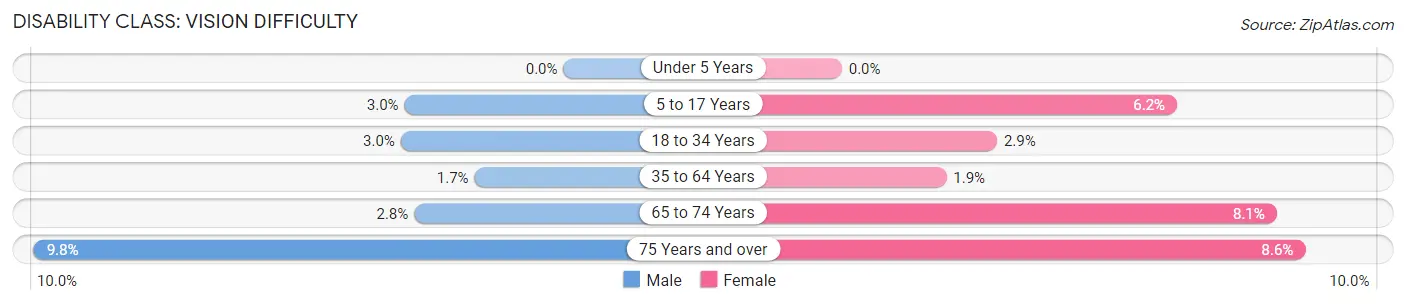
| Age Bracket | Male | Female |
| Under 5 Years | 0 (0.0%) | 0 (0.0%) |
| 5 to 17 Years | 45 (2.9%) | 98 (6.2%) |
| 18 to 34 Years | 76 (3.0%) | 64 (2.9%) |
| 35 to 64 Years | 53 (1.7%) | 62 (1.9%) |
| 65 to 74 Years | 19 (2.8%) | 79 (8.1%) |
| 75 Years and over | 65 (9.8%) | 83 (8.6%) |
Disability Class: Cognitive Difficulty
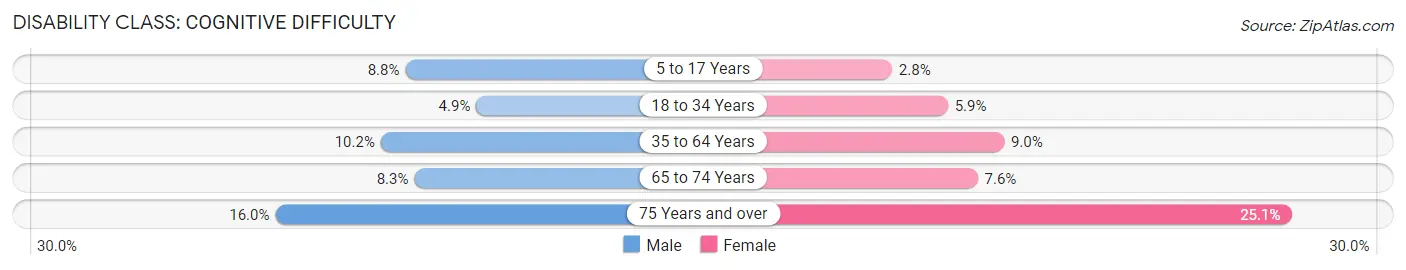
| Age Bracket | Male | Female |
| 5 to 17 Years | 134 (8.8%) | 44 (2.8%) |
| 18 to 34 Years | 122 (4.9%) | 131 (5.9%) |
| 35 to 64 Years | 326 (10.2%) | 288 (9.0%) |
| 65 to 74 Years | 57 (8.3%) | 74 (7.6%) |
| 75 Years and over | 106 (16.0%) | 242 (25.1%) |
Disability Class: Ambulatory Difficulty
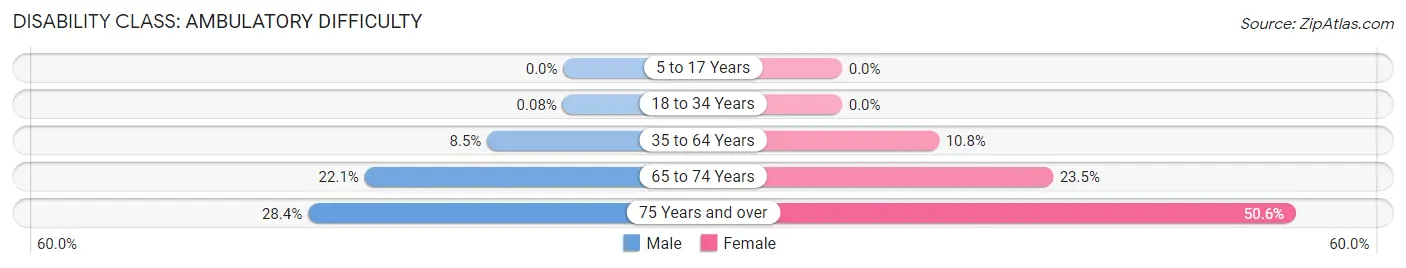
| Age Bracket | Male | Female |
| 5 to 17 Years | 0 (0.0%) | 0 (0.0%) |
| 18 to 34 Years | 2 (0.1%) | 0 (0.0%) |
| 35 to 64 Years | 272 (8.5%) | 344 (10.8%) |
| 65 to 74 Years | 152 (22.1%) | 230 (23.5%) |
| 75 Years and over | 188 (28.4%) | 488 (50.6%) |
Disability Class: Self-Care Difficulty
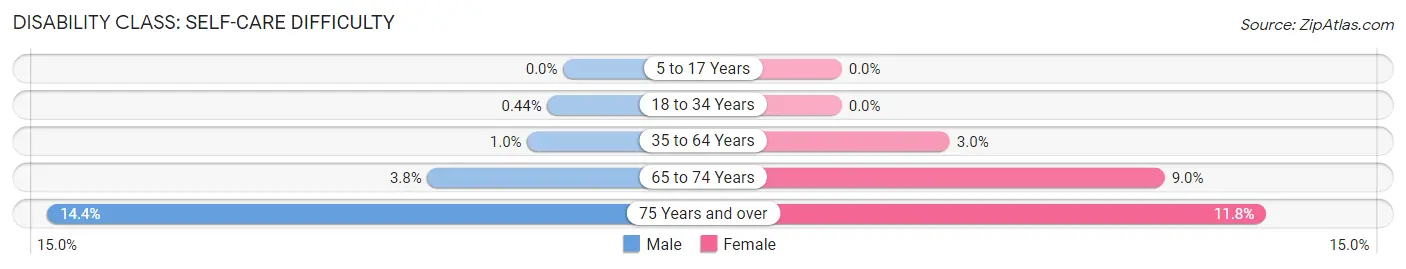
| Age Bracket | Male | Female |
| 5 to 17 Years | 0 (0.0%) | 0 (0.0%) |
| 18 to 34 Years | 11 (0.4%) | 0 (0.0%) |
| 35 to 64 Years | 32 (1.0%) | 96 (3.0%) |
| 65 to 74 Years | 26 (3.8%) | 88 (9.0%) |
| 75 Years and over | 95 (14.4%) | 114 (11.8%) |
Technology Access in Lebanon
Computing Device Access in Lebanon
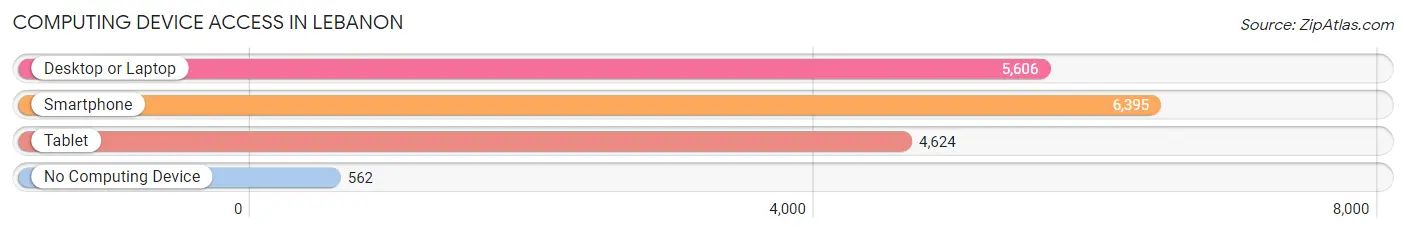
| Device Type | # Households | % Households |
| Desktop or Laptop | 5,606 | 75.2% |
| Smartphone | 6,395 | 85.8% |
| Tablet | 4,624 | 62.0% |
| No Computing Device | 562 | 7.5% |
| Total | 7,458 | 100.0% |
Internet Access in Lebanon
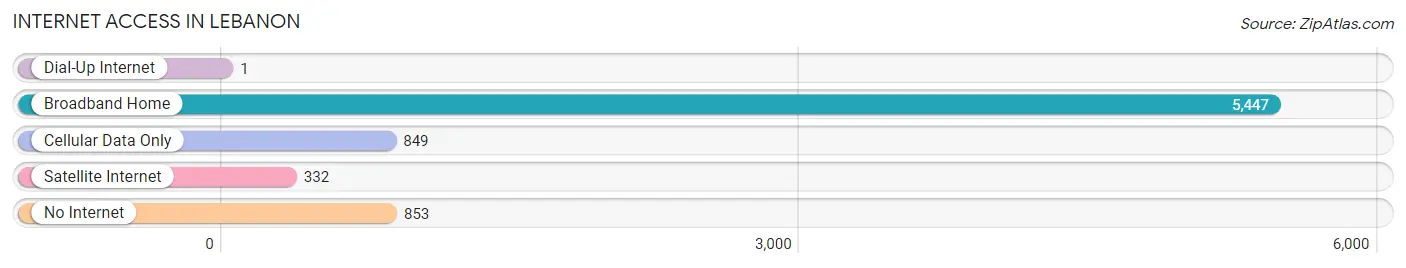
| Internet Type | # Households | % Households |
| Dial-Up Internet | 1 | 0.0% |
| Broadband Home | 5,447 | 73.0% |
| Cellular Data Only | 849 | 11.4% |
| Satellite Internet | 332 | 4.4% |
| No Internet | 853 | 11.4% |
| Total | 7,458 | 100.0% |
Lebanon Summary
Lebanon, Oregon is a city located in Linn County, Oregon, United States. It is situated in the Willamette Valley, approximately 25 miles south of Salem, the state capital. Lebanon is the county seat of Linn County and is part of the Albany-Lebanon metropolitan statistical area. The population of Lebanon was 15,518 at the 2010 census.
History
The area that is now Lebanon was originally inhabited by the Kalapuya Native American tribe. The first white settlers arrived in the area in the early 1840s. The city was founded in 1847 by Daniel C. Lee, who named it after the Biblical city of Lebanon. The city was incorporated in 1874.
In the late 19th century, Lebanon was a major center for the timber industry. The city was also home to several flour mills and other industries. In the early 20th century, the city was a major stop on the Oregon Electric Railway.
Geography
Lebanon is located in the Willamette Valley at the confluence of the South Santiam River and the Calapooia River. The city is situated at an elevation of 441 feet above sea level.
The city covers an area of 5.3 square miles, of which 5.2 square miles is land and 0.1 square miles is water. The city is located approximately 25 miles south of Salem, the state capital.
Climate
Lebanon has a humid continental climate, with warm summers and cool winters. The average annual temperature is 52.3°F, with an average high of 68.2°F in July and an average low of 36.4°F in January. The average annual precipitation is 37.2 inches.
Demographics
As of the 2010 census, there were 15,518 people, 6,072 households, and 3,945 families residing in the city. The population density was 2,945.3 people per square mile. The racial makeup of the city was 87.2% White, 0.7% African American, 1.2% Native American, 0.9% Asian, 0.1% Pacific Islander, 6.7% from other races, and 3.2% from two or more races. Hispanic or Latino of any race were 11.7% of the population.
Economy
Lebanon is a major center for the timber industry, with several lumber mills located in the city. The city is also home to several manufacturing companies, including a paper mill, a plastics factory, and a food processing plant. The city is also home to several retail stores, restaurants, and other businesses.
The city is served by the Lebanon Municipal Airport, which is located just outside the city limits. The airport is used for general aviation and is home to several corporate aircraft.
Conclusion
Lebanon, Oregon is a city located in Linn County, Oregon, United States. It is situated in the Willamette Valley, approximately 25 miles south of Salem, the state capital. Lebanon is the county seat of Linn County and is part of the Albany-Lebanon metropolitan statistical area. The population of Lebanon was 15,518 at the 2010 census. The city is a major center for the timber industry, with several lumber mills located in the city. The city is also home to several manufacturing companies, including a paper mill, a plastics factory, and a food processing plant. The city is served by the Lebanon Municipal Airport, which is located just outside the city limits.
Common Questions
What is Per Capita Income in Lebanon?
Per Capita income in Lebanon is $29,832.
What is the Median Family Income in Lebanon?
Median Family Income in Lebanon is $61,770.
What is the Median Household income in Lebanon?
Median Household Income in Lebanon is $53,246.
What is Income or Wage Gap in Lebanon?
Income or Wage Gap in Lebanon is 20.7%.
Women in Lebanon earn 79.3 cents for every dollar earned by a man.
What is Inequality or Gini Index in Lebanon?
Inequality or Gini Index in Lebanon is 0.44.
What is the Total Population of Lebanon?
Total Population of Lebanon is 18,587.
What is the Total Male Population of Lebanon?
Total Male Population of Lebanon is 9,074.
What is the Total Female Population of Lebanon?
Total Female Population of Lebanon is 9,513.
What is the Ratio of Males per 100 Females in Lebanon?
There are 95.39 Males per 100 Females in Lebanon.
What is the Ratio of Females per 100 Males in Lebanon?
There are 104.84 Females per 100 Males in Lebanon.
What is the Median Population Age in Lebanon?
Median Population Age in Lebanon is 37.3 Years.
What is the Average Family Size in Lebanon
Average Family Size in Lebanon is 3.0 People.
What is the Average Household Size in Lebanon
Average Household Size in Lebanon is 2.5 People.
How Large is the Labor Force in Lebanon?
There are 8,969 People in the Labor Forcein in Lebanon.
What is the Percentage of People in the Labor Force in Lebanon?
59.8% of People are in the Labor Force in Lebanon.
What is the Unemployment Rate in Lebanon?
Unemployment Rate in Lebanon is 7.3%.