Forest Grove, OR Map & Demographics
Forest Grove Map
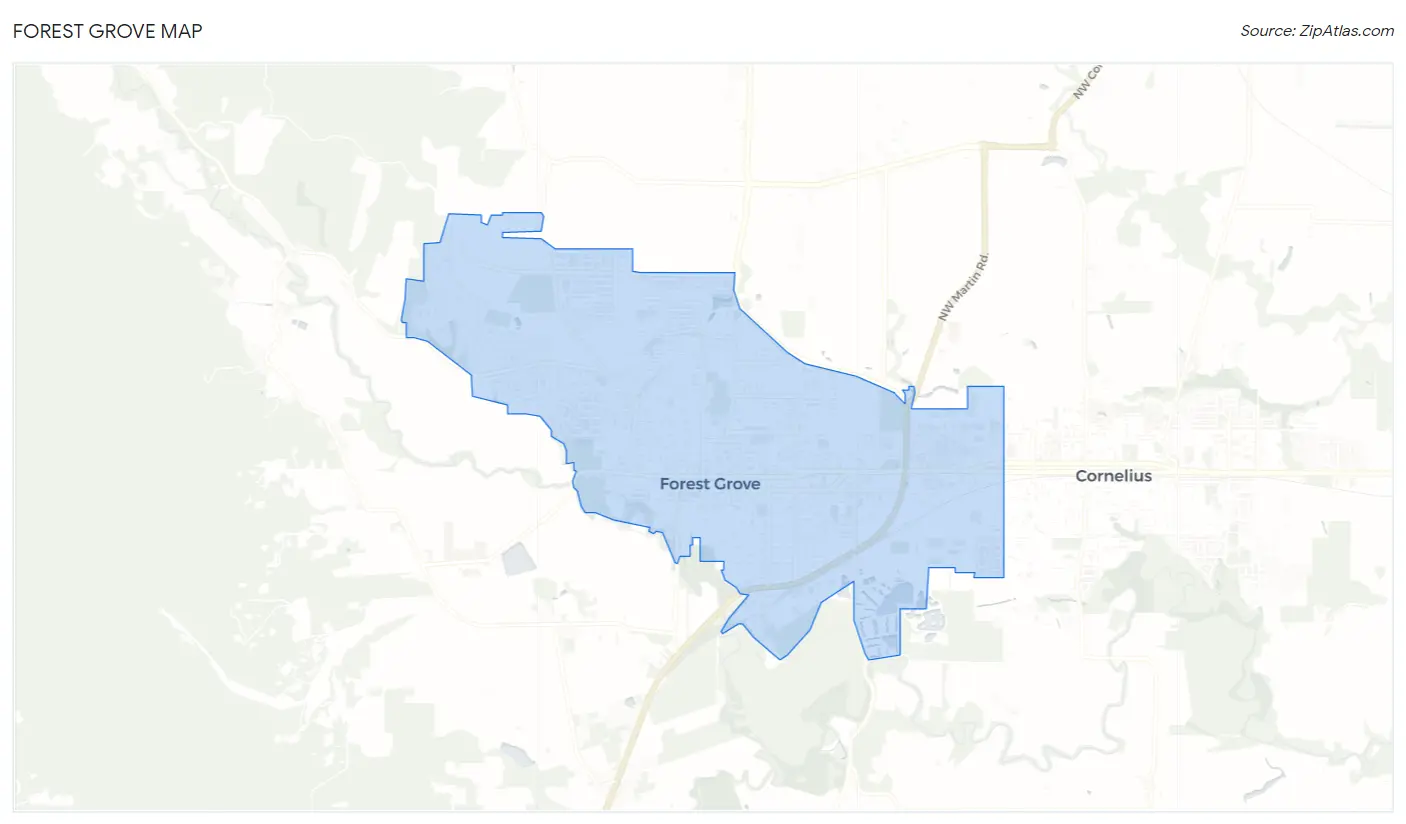
Forest Grove Overview
$33,147
PER CAPITA INCOME
$101,408
AVG FAMILY INCOME
$77,977
AVG HOUSEHOLD INCOME
34.6%
WAGE / INCOME GAP [ % ]
65.4¢/ $1
WAGE / INCOME GAP [ $ ]
$9,681
FAMILY INCOME DEFICIT
0.42
INEQUALITY / GINI INDEX
26,160
TOTAL POPULATION
12,385
MALE POPULATION
13,775
FEMALE POPULATION
89.91
MALES / 100 FEMALES
111.22
FEMALES / 100 MALES
35.4
MEDIAN AGE
3.4
AVG FAMILY SIZE
2.7
AVG HOUSEHOLD SIZE
13,373
LABOR FORCE [ PEOPLE ]
64.0%
PERCENT IN LABOR FORCE
4.3%
UNEMPLOYMENT RATE
Forest Grove Zip Codes
Forest Grove Area Codes
Income in Forest Grove
Income Overview in Forest Grove
Per Capita Income in Forest Grove is $33,147, while median incomes of families and households are $101,408 and $77,977 respectively.
| Characteristic | Number | Measure |
| Per Capita Income | 26,160 | $33,147 |
| Median Family Income | 5,776 | $101,408 |
| Mean Family Income | 5,776 | $108,098 |
| Median Household Income | 9,103 | $77,977 |
| Mean Household Income | 9,103 | $91,203 |
| Income Deficit | 5,776 | $9,681 |
| Wage / Income Gap (%) | 26,160 | 34.60% |
| Wage / Income Gap ($) | 26,160 | 65.40¢ per $1 |
| Gini / Inequality Index | 26,160 | 0.42 |
Earnings by Sex in Forest Grove
Average Earnings in Forest Grove are $40,014, $48,187 for men and $31,516 for women, a difference of 34.6%.
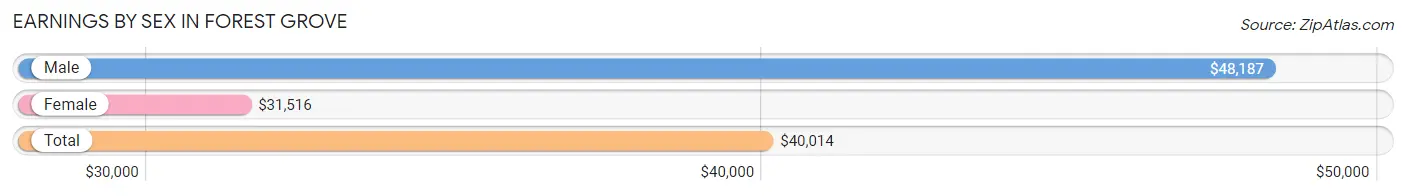
| Sex | Number | Average Earnings |
| Male | 7,244 (51.3%) | $48,187 |
| Female | 6,885 (48.7%) | $31,516 |
| Total | 14,129 (100.0%) | $40,014 |
Earnings by Sex by Income Bracket in Forest Grove
The most common earnings brackets in Forest Grove are $100,000+ for men (1,281 | 17.7%) and $75,000 to $99,999 for women (581 | 8.4%).
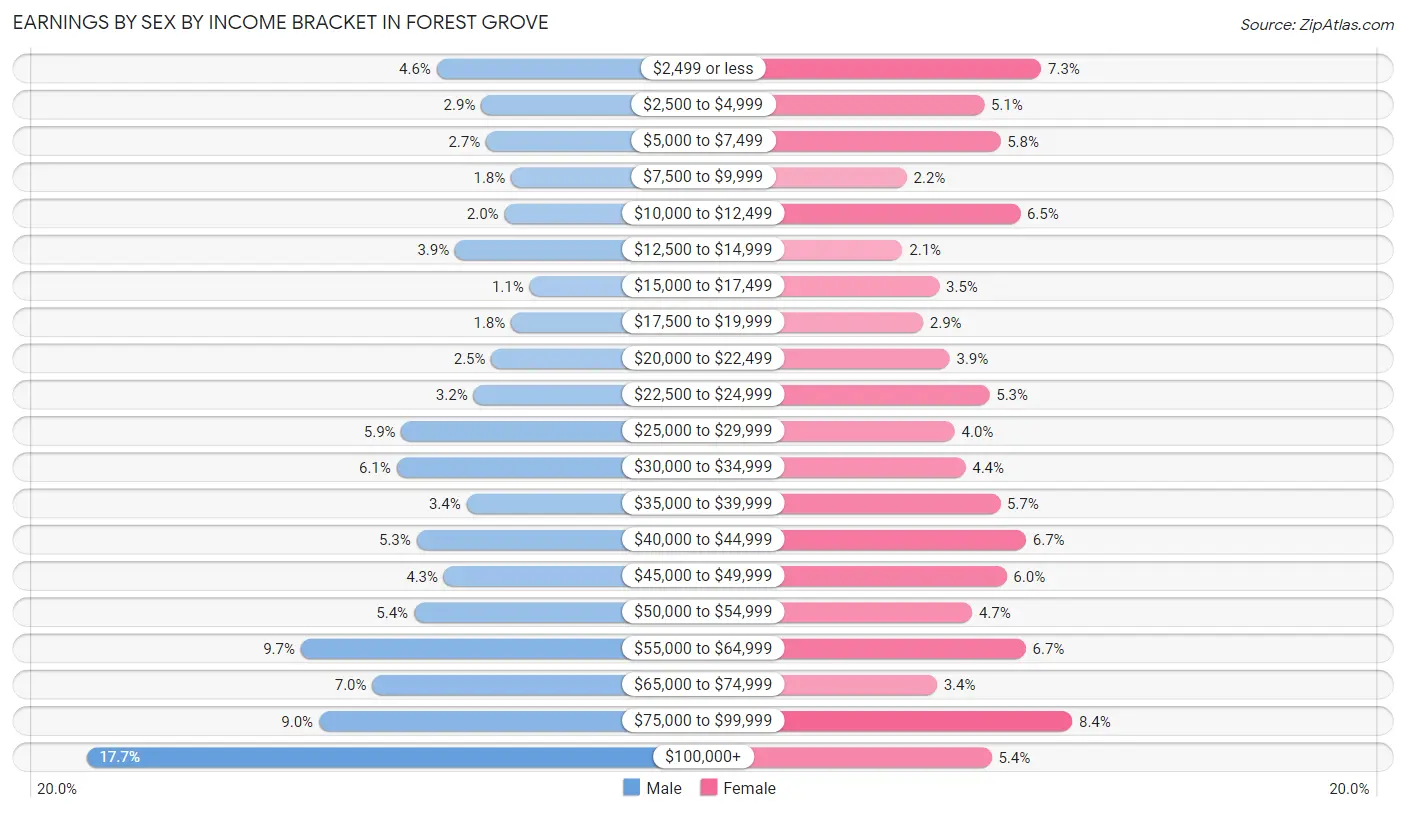
| Income | Male | Female |
| $2,499 or less | 330 (4.6%) | 501 (7.3%) |
| $2,500 to $4,999 | 209 (2.9%) | 354 (5.1%) |
| $5,000 to $7,499 | 196 (2.7%) | 396 (5.8%) |
| $7,500 to $9,999 | 128 (1.8%) | 154 (2.2%) |
| $10,000 to $12,499 | 146 (2.0%) | 447 (6.5%) |
| $12,500 to $14,999 | 280 (3.9%) | 143 (2.1%) |
| $15,000 to $17,499 | 78 (1.1%) | 238 (3.5%) |
| $17,500 to $19,999 | 128 (1.8%) | 196 (2.9%) |
| $20,000 to $22,499 | 182 (2.5%) | 265 (3.8%) |
| $22,500 to $24,999 | 230 (3.2%) | 368 (5.3%) |
| $25,000 to $29,999 | 426 (5.9%) | 278 (4.0%) |
| $30,000 to $34,999 | 439 (6.1%) | 306 (4.4%) |
| $35,000 to $39,999 | 249 (3.4%) | 395 (5.7%) |
| $40,000 to $44,999 | 385 (5.3%) | 462 (6.7%) |
| $45,000 to $49,999 | 311 (4.3%) | 412 (6.0%) |
| $50,000 to $54,999 | 392 (5.4%) | 323 (4.7%) |
| $55,000 to $64,999 | 699 (9.7%) | 461 (6.7%) |
| $65,000 to $74,999 | 505 (7.0%) | 232 (3.4%) |
| $75,000 to $99,999 | 650 (9.0%) | 581 (8.4%) |
| $100,000+ | 1,281 (17.7%) | 373 (5.4%) |
| Total | 7,244 (100.0%) | 6,885 (100.0%) |
Earnings by Sex by Educational Attainment in Forest Grove
Average earnings in Forest Grove are $56,644 for men and $41,283 for women, a difference of 27.1%. Men with an educational attainment of graduate degree enjoy the highest average annual earnings of $94,500, while those with high school diploma education earn the least with $41,114. Women with an educational attainment of graduate degree earn the most with the average annual earnings of $59,324, while those with less than high school education have the smallest earnings of $30,242.
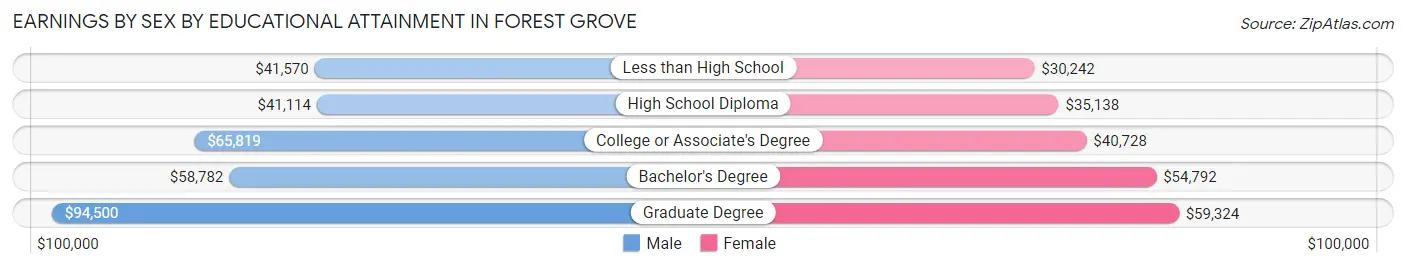
| Educational Attainment | Male Income | Female Income |
| Less than High School | $41,570 | $30,242 |
| High School Diploma | $41,114 | $35,138 |
| College or Associate's Degree | $65,819 | $40,728 |
| Bachelor's Degree | $58,782 | $54,792 |
| Graduate Degree | $94,500 | $59,324 |
| Total | $56,644 | $41,283 |
Family Income in Forest Grove
Family Income Brackets in Forest Grove
According to the Forest Grove family income data, there are 1,606 families falling into the $100,000 to $149,999 income range, which is the most common income bracket and makes up 27.8% of all families. Conversely, the $10,000 to $14,999 income bracket is the least frequent group with only 156 families (2.7%) belonging to this category.
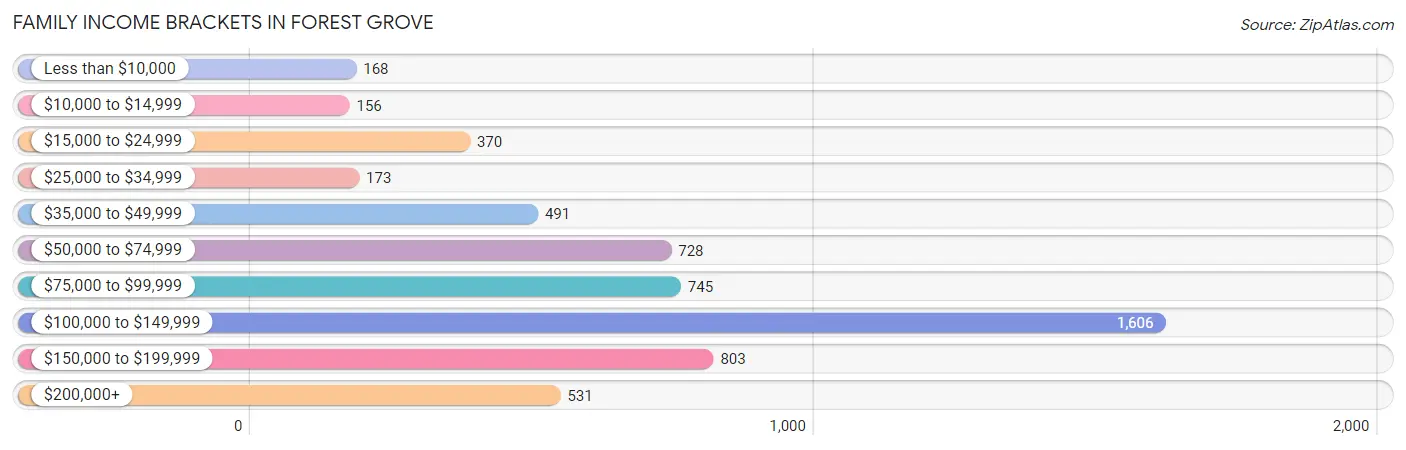
| Income Bracket | # Families | % Families |
| Less than $10,000 | 168 | 2.9% |
| $10,000 to $14,999 | 156 | 2.7% |
| $15,000 to $24,999 | 370 | 6.4% |
| $25,000 to $34,999 | 173 | 3.0% |
| $35,000 to $49,999 | 491 | 8.5% |
| $50,000 to $74,999 | 728 | 12.6% |
| $75,000 to $99,999 | 745 | 12.9% |
| $100,000 to $149,999 | 1,606 | 27.8% |
| $150,000 to $199,999 | 803 | 13.9% |
| $200,000+ | 531 | 9.2% |
Family Income by Famaliy Size in Forest Grove
4-person families (1,438 | 24.9%) account for the highest median family income in Forest Grove with $117,865 per family, while 2-person families (2,305 | 39.9%) have the highest median income of $42,766 per family member.
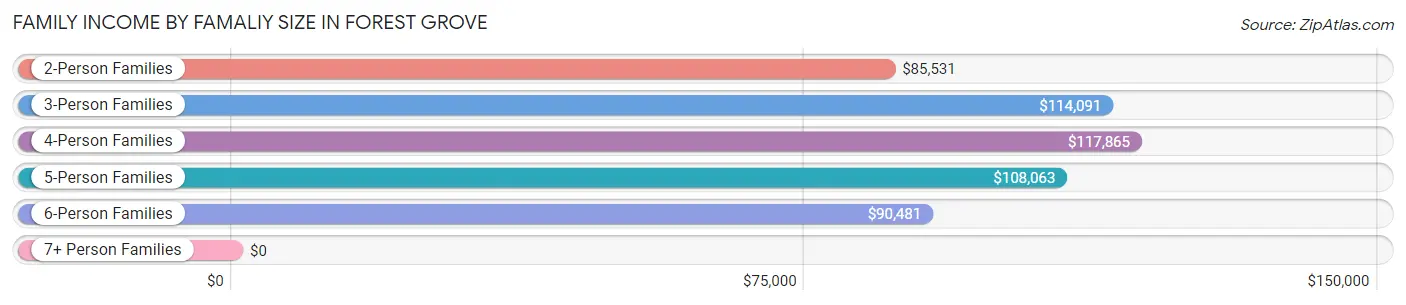
| Income Bracket | # Families | Median Income |
| 2-Person Families | 2,305 (39.9%) | $85,531 |
| 3-Person Families | 1,292 (22.4%) | $114,091 |
| 4-Person Families | 1,438 (24.9%) | $117,865 |
| 5-Person Families | 331 (5.7%) | $108,063 |
| 6-Person Families | 371 (6.4%) | $90,481 |
| 7+ Person Families | 39 (0.7%) | $0 |
| Total | 5,776 (100.0%) | $101,408 |
Family Income by Number of Earners in Forest Grove
The median family income in Forest Grove is $101,408, with families comprising 3+ earners (963) having the highest median family income of $146,146, while families with no earners (824) have the lowest median family income of $39,219, accounting for 16.7% and 14.3% of families, respectively.
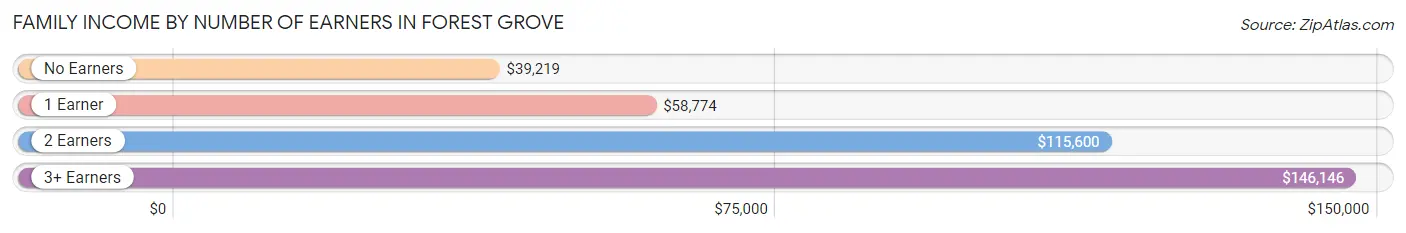
| Number of Earners | # Families | Median Income |
| No Earners | 824 (14.3%) | $39,219 |
| 1 Earner | 1,520 (26.3%) | $58,774 |
| 2 Earners | 2,469 (42.7%) | $115,600 |
| 3+ Earners | 963 (16.7%) | $146,146 |
| Total | 5,776 (100.0%) | $101,408 |
Household Income in Forest Grove
Household Income Brackets in Forest Grove
With 1,921 households falling in the category, the $100,000 to $149,999 income range is the most frequent in Forest Grove, accounting for 21.1% of all households. In contrast, only 291 households (3.2%) fall into the $10,000 to $14,999 income bracket, making it the least populous group.
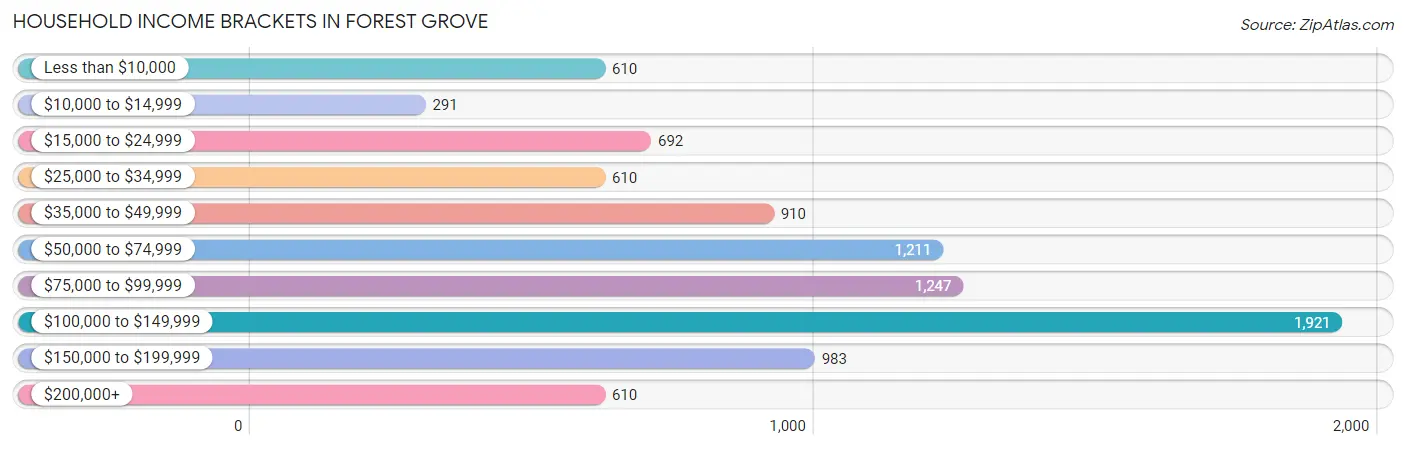
| Income Bracket | # Households | % Households |
| Less than $10,000 | 610 | 6.7% |
| $10,000 to $14,999 | 291 | 3.2% |
| $15,000 to $24,999 | 692 | 7.6% |
| $25,000 to $34,999 | 610 | 6.7% |
| $35,000 to $49,999 | 910 | 10.0% |
| $50,000 to $74,999 | 1,211 | 13.3% |
| $75,000 to $99,999 | 1,247 | 13.7% |
| $100,000 to $149,999 | 1,921 | 21.1% |
| $150,000 to $199,999 | 983 | 10.8% |
| $200,000+ | 610 | 6.7% |
Household Income by Householder Age in Forest Grove
The median household income in Forest Grove is $77,977, with the highest median household income of $116,701 found in the 45 to 64 years age bracket for the primary householder. A total of 3,073 households (33.8%) fall into this category. Meanwhile, the 65+ years age bracket for the primary householder has the lowest median household income of $43,300, with 2,646 households (29.1%) in this group.
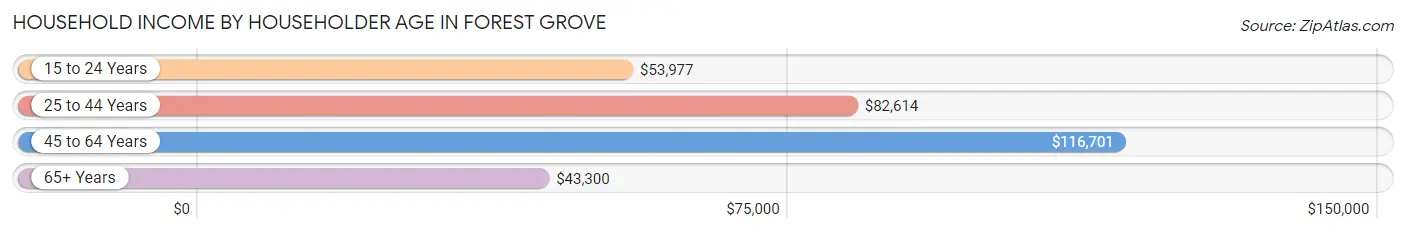
| Income Bracket | # Households | Median Income |
| 15 to 24 Years | 387 (4.3%) | $53,977 |
| 25 to 44 Years | 2,997 (32.9%) | $82,614 |
| 45 to 64 Years | 3,073 (33.8%) | $116,701 |
| 65+ Years | 2,646 (29.1%) | $43,300 |
| Total | 9,103 (100.0%) | $77,977 |
Poverty in Forest Grove
Income Below Poverty by Sex and Age in Forest Grove
With 10.7% poverty level for males and 16.3% for females among the residents of Forest Grove, 15 year old males and 16 and 17 year old females are the most vulnerable to poverty, with 110 males (52.9%) and 178 females (32.1%) in their respective age groups living below the poverty level.
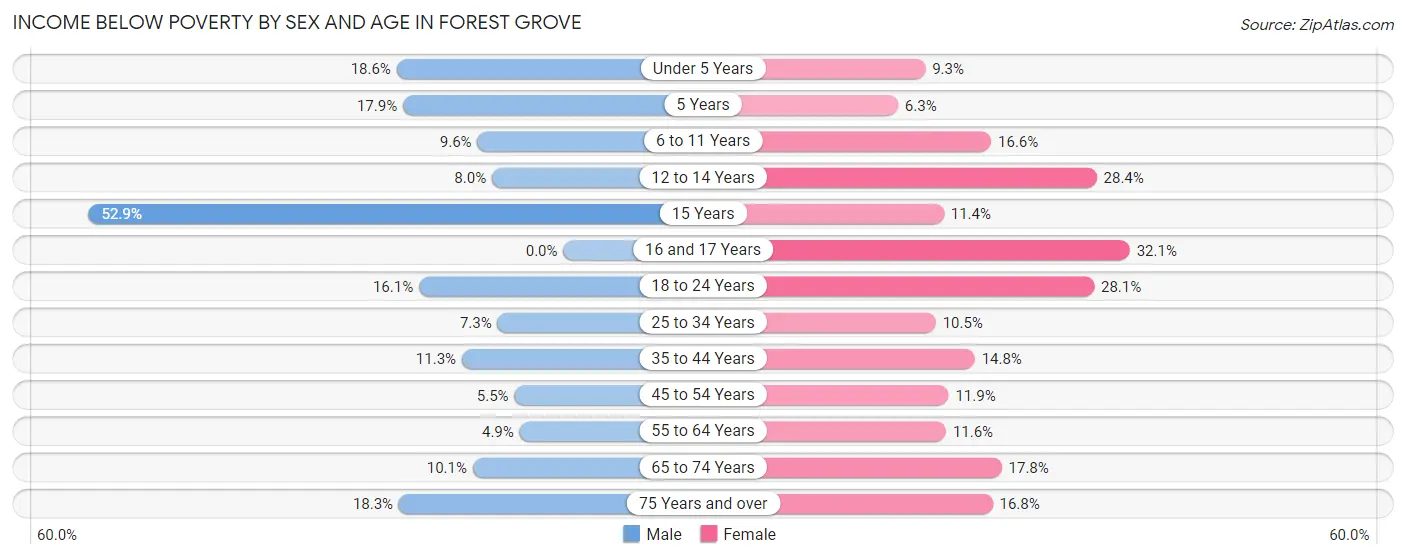
| Age Bracket | Male | Female |
| Under 5 Years | 134 (18.6%) | 83 (9.3%) |
| 5 Years | 30 (17.9%) | 17 (6.2%) |
| 6 to 11 Years | 92 (9.6%) | 153 (16.6%) |
| 12 to 14 Years | 36 (8.0%) | 145 (28.4%) |
| 15 Years | 110 (52.9%) | 15 (11.4%) |
| 16 and 17 Years | 0 (0.0%) | 178 (32.1%) |
| 18 to 24 Years | 198 (16.1%) | 393 (28.1%) |
| 25 to 34 Years | 129 (7.3%) | 156 (10.5%) |
| 35 to 44 Years | 174 (11.3%) | 279 (14.8%) |
| 45 to 54 Years | 76 (5.4%) | 179 (11.9%) |
| 55 to 64 Years | 68 (4.9%) | 171 (11.6%) |
| 65 to 74 Years | 95 (10.1%) | 241 (17.8%) |
| 75 Years and over | 145 (18.3%) | 136 (16.8%) |
| Total | 1,287 (10.7%) | 2,146 (16.3%) |
Income Above Poverty by Sex and Age in Forest Grove
According to the poverty statistics in Forest Grove, males aged 16 and 17 years and females aged 5 years are the age groups that are most secure financially, with 100.0% of males and 93.8% of females in these age groups living above the poverty line.
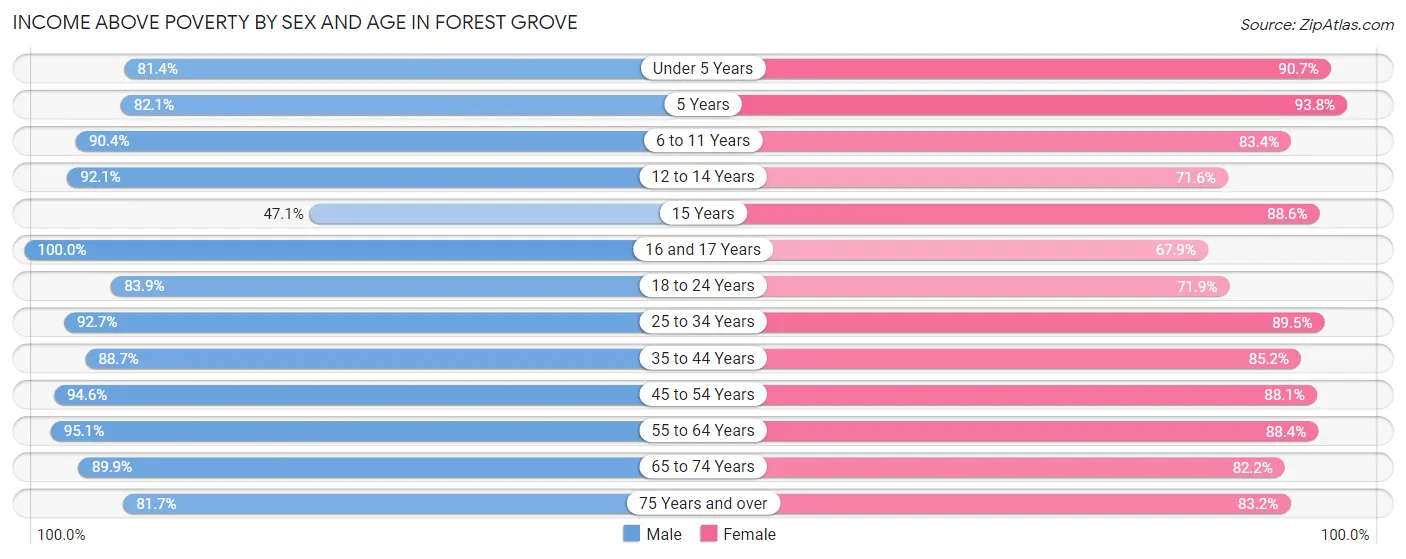
| Age Bracket | Male | Female |
| Under 5 Years | 588 (81.4%) | 810 (90.7%) |
| 5 Years | 138 (82.1%) | 255 (93.8%) |
| 6 to 11 Years | 869 (90.4%) | 767 (83.4%) |
| 12 to 14 Years | 417 (92.0%) | 366 (71.6%) |
| 15 Years | 98 (47.1%) | 117 (88.6%) |
| 16 and 17 Years | 408 (100.0%) | 377 (67.9%) |
| 18 to 24 Years | 1,033 (83.9%) | 1,006 (71.9%) |
| 25 to 34 Years | 1,631 (92.7%) | 1,335 (89.5%) |
| 35 to 44 Years | 1,366 (88.7%) | 1,606 (85.2%) |
| 45 to 54 Years | 1,318 (94.6%) | 1,328 (88.1%) |
| 55 to 64 Years | 1,328 (95.1%) | 1,303 (88.4%) |
| 65 to 74 Years | 847 (89.9%) | 1,113 (82.2%) |
| 75 Years and over | 647 (81.7%) | 674 (83.2%) |
| Total | 10,688 (89.2%) | 11,057 (83.8%) |
Income Below Poverty Among Married-Couple Families in Forest Grove
The poverty statistics for married-couple families in Forest Grove show that 4.2% or 187 of the total 4,428 families live below the poverty line. Families with no children have the highest poverty rate of 5.8%, comprising of 128 families. On the other hand, families with 3 or 4 children have the lowest poverty rate of 0.0%, which includes 0 families.
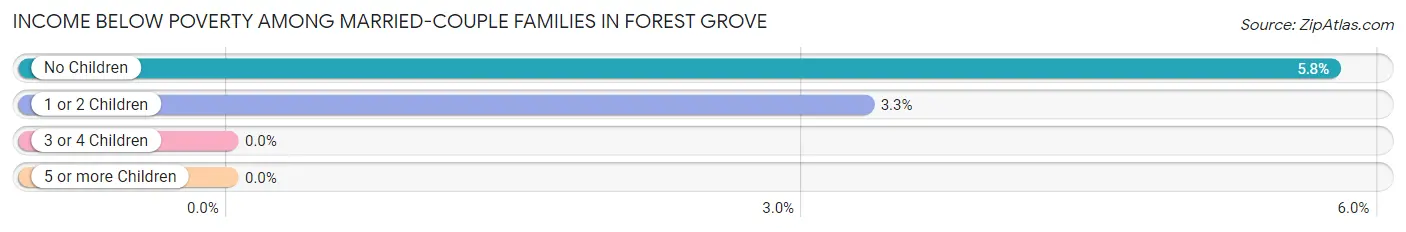
| Children | Above Poverty | Below Poverty |
| No Children | 2,094 (94.2%) | 128 (5.8%) |
| 1 or 2 Children | 1,720 (96.7%) | 59 (3.3%) |
| 3 or 4 Children | 427 (100.0%) | 0 (0.0%) |
| 5 or more Children | 0 (0.0%) | 0 (0.0%) |
| Total | 4,241 (95.8%) | 187 (4.2%) |
Income Below Poverty Among Single-Parent Households in Forest Grove
According to the poverty data in Forest Grove, 23.9% or 88 single-father households and 35.2% or 345 single-mother households are living below the poverty line. Among single-father households, those with 3 or 4 children have the highest poverty rate, with 31 households (100.0%) experiencing poverty. Likewise, among single-mother households, those with 3 or 4 children have the highest poverty rate, with 59 households (67.8%) falling below the poverty line.
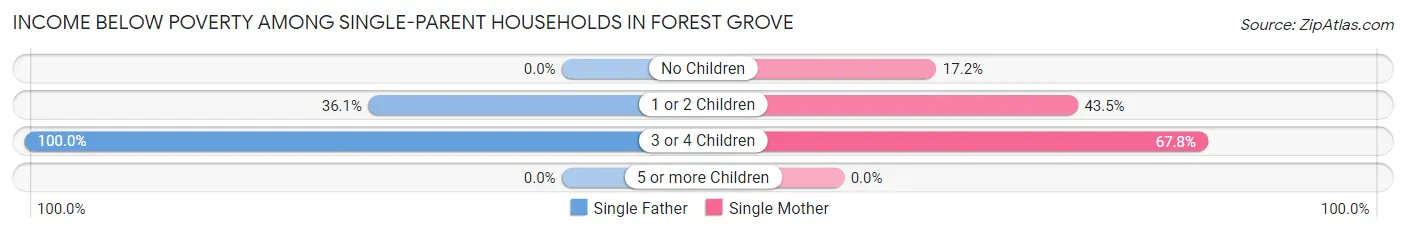
| Children | Single Father | Single Mother |
| No Children | 0 (0.0%) | 67 (17.2%) |
| 1 or 2 Children | 57 (36.1%) | 219 (43.5%) |
| 3 or 4 Children | 31 (100.0%) | 59 (67.8%) |
| 5 or more Children | 0 (0.0%) | 0 (0.0%) |
| Total | 88 (23.9%) | 345 (35.2%) |
Income Below Poverty Among Married-Couple vs Single-Parent Households in Forest Grove
The poverty data for Forest Grove shows that 187 of the married-couple family households (4.2%) and 433 of the single-parent households (32.1%) are living below the poverty level. Within the married-couple family households, those with no children have the highest poverty rate, with 128 households (5.8%) falling below the poverty line. Among the single-parent households, those with 3 or 4 children have the highest poverty rate, with 90 household (76.3%) living below poverty.
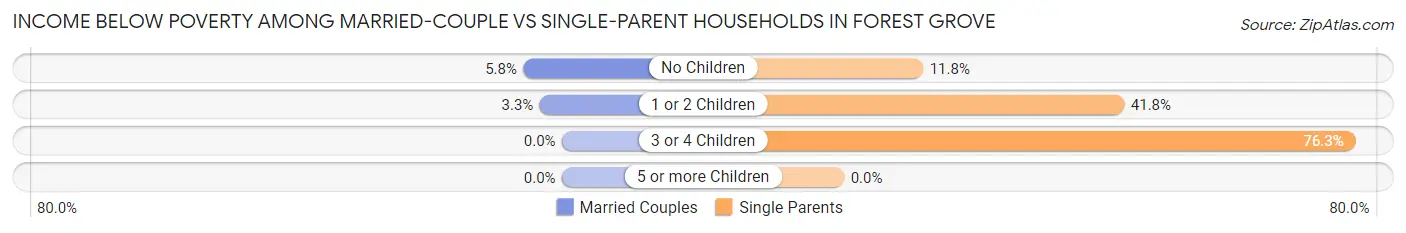
| Children | Married-Couple Families | Single-Parent Households |
| No Children | 128 (5.8%) | 67 (11.8%) |
| 1 or 2 Children | 59 (3.3%) | 276 (41.7%) |
| 3 or 4 Children | 0 (0.0%) | 90 (76.3%) |
| 5 or more Children | 0 (0.0%) | 0 (0.0%) |
| Total | 187 (4.2%) | 433 (32.1%) |
Race in Forest Grove
The most populous races in Forest Grove are White / Caucasian (18,973 | 72.5%), Hispanic or Latino (7,701 | 29.4%), and Two or more Races (3,272 | 12.5%).
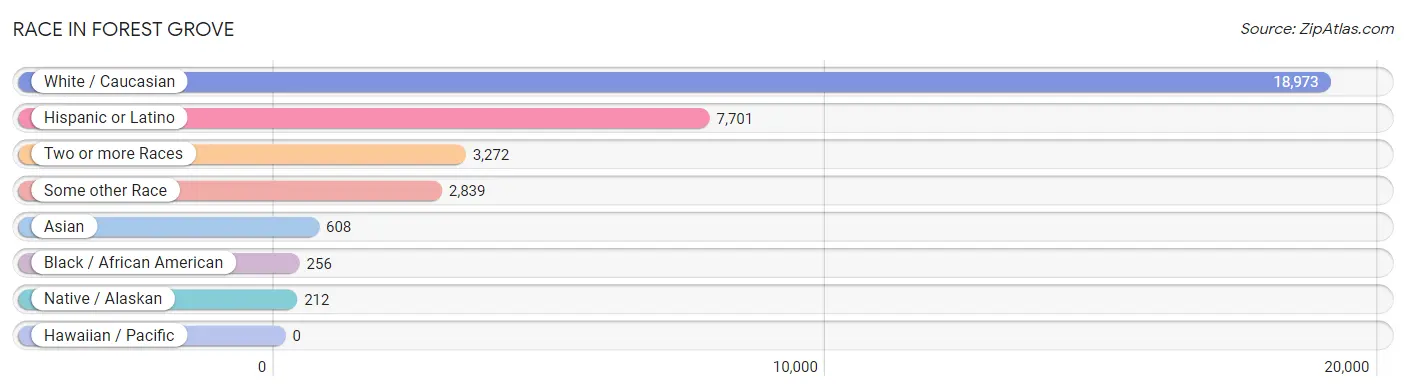
| Race | # Population | % Population |
| Asian | 608 | 2.3% |
| Black / African American | 256 | 1.0% |
| Hawaiian / Pacific | 0 | 0.0% |
| Hispanic or Latino | 7,701 | 29.4% |
| Native / Alaskan | 212 | 0.8% |
| White / Caucasian | 18,973 | 72.5% |
| Two or more Races | 3,272 | 12.5% |
| Some other Race | 2,839 | 10.8% |
| Total | 26,160 | 100.0% |
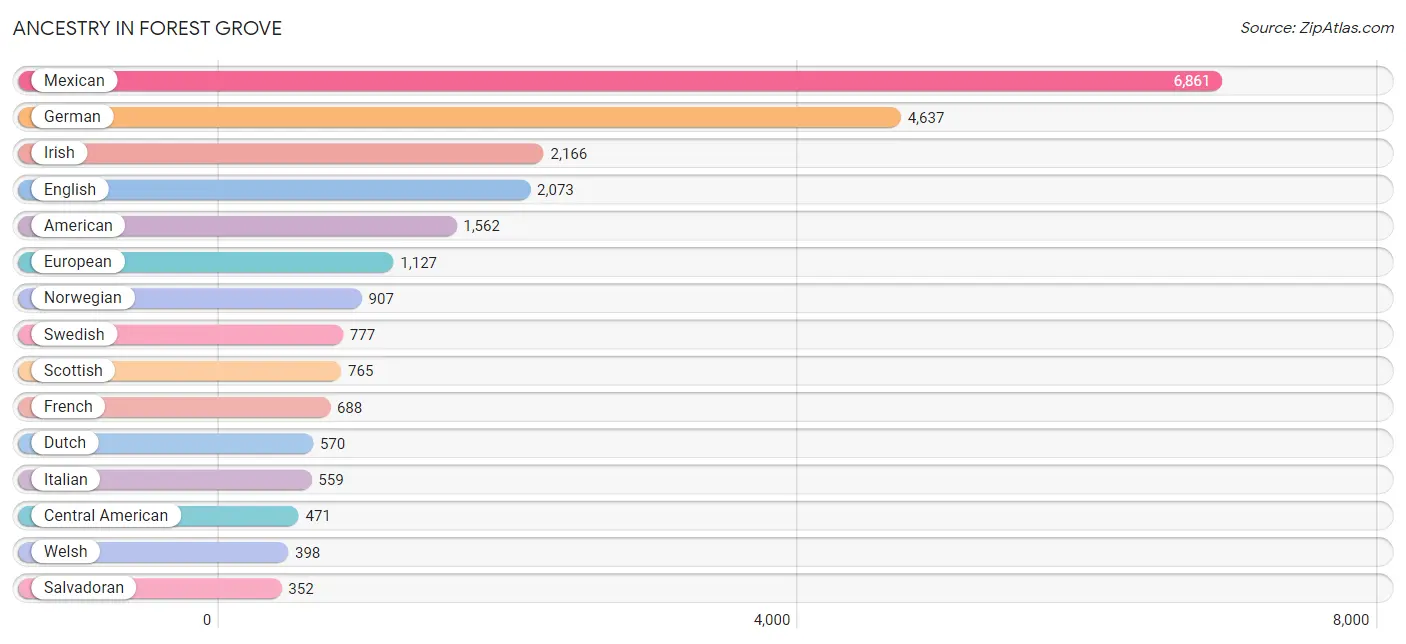
Ancestry in Forest Grove
The most populous ancestries reported in Forest Grove are Mexican (6,861 | 26.2%), German (4,637 | 17.7%), Irish (2,166 | 8.3%), English (2,073 | 7.9%), and American (1,562 | 6.0%), together accounting for 66.1% of all Forest Grove residents.
| Ancestry | # Population | % Population |
| American | 1,562 | 6.0% |
| Arab | 88 | 0.3% |
| Austrian | 46 | 0.2% |
| Belgian | 77 | 0.3% |
| Bhutanese | 244 | 0.9% |
| Blackfeet | 65 | 0.3% |
| Brazilian | 10 | 0.0% |
| British | 236 | 0.9% |
| Burmese | 186 | 0.7% |
| Canadian | 119 | 0.4% |
| Central American | 471 | 1.8% |
| Central American Indian | 38 | 0.2% |
| Cherokee | 32 | 0.1% |
| Cheyenne | 56 | 0.2% |
| Chilean | 46 | 0.2% |
| Chippewa | 12 | 0.1% |
| Croatian | 68 | 0.3% |
| Cuban | 8 | 0.0% |
| Czech | 49 | 0.2% |
| Czechoslovakian | 201 | 0.8% |
| Danish | 231 | 0.9% |
| Dutch | 570 | 2.2% |
| Eastern European | 78 | 0.3% |
| English | 2,073 | 7.9% |
| Estonian | 5 | 0.0% |
| European | 1,127 | 4.3% |
| Filipino | 36 | 0.1% |
| Finnish | 76 | 0.3% |
| French | 688 | 2.6% |
| French Canadian | 85 | 0.3% |
| German | 4,637 | 17.7% |
| German Russian | 4 | 0.0% |
| Greek | 20 | 0.1% |
| Guatemalan | 79 | 0.3% |
| Honduran | 21 | 0.1% |
| Hungarian | 49 | 0.2% |
| Icelander | 15 | 0.1% |
| Indian (Asian) | 293 | 1.1% |
| Irish | 2,166 | 8.3% |
| Israeli | 15 | 0.1% |
| Italian | 559 | 2.1% |
| Jamaican | 12 | 0.1% |
| Japanese | 87 | 0.3% |
| Korean | 233 | 0.9% |
| Luxembourger | 3 | 0.0% |
| Mexican | 6,861 | 26.2% |
| Mexican American Indian | 305 | 1.2% |
| Native Hawaiian | 43 | 0.2% |
| New Zealander | 15 | 0.1% |
| Nicaraguan | 19 | 0.1% |
| Northern European | 12 | 0.1% |
| Norwegian | 907 | 3.5% |
| Pakistani | 4 | 0.0% |
| Peruvian | 12 | 0.1% |
| Polish | 229 | 0.9% |
| Portuguese | 80 | 0.3% |
| Pueblo | 9 | 0.0% |
| Puerto Rican | 95 | 0.4% |
| Romanian | 107 | 0.4% |
| Russian | 102 | 0.4% |
| Salvadoran | 352 | 1.3% |
| Scandinavian | 275 | 1.1% |
| Scotch-Irish | 342 | 1.3% |
| Scottish | 765 | 2.9% |
| Sioux | 58 | 0.2% |
| Slavic | 18 | 0.1% |
| Slovene | 92 | 0.4% |
| South African | 6 | 0.0% |
| South American | 91 | 0.4% |
| Spaniard | 24 | 0.1% |
| Spanish | 31 | 0.1% |
| Sri Lankan | 31 | 0.1% |
| Subsaharan African | 6 | 0.0% |
| Swedish | 777 | 3.0% |
| Swiss | 206 | 0.8% |
| Thai | 60 | 0.2% |
| Tlingit-Haida | 11 | 0.0% |
| Ukrainian | 29 | 0.1% |
| Venezuelan | 33 | 0.1% |
| Welsh | 398 | 1.5% |
| Yakama | 13 | 0.1% |
| Yaqui | 61 | 0.2% |
| Yugoslavian | 38 | 0.2% | View All 83 Rows |
Immigrants in Forest Grove
The most numerous immigrant groups reported in Forest Grove came from Latin America (2,543 | 9.7%), Central America (2,516 | 9.6%), Mexico (2,300 | 8.8%), Asia (340 | 1.3%), and El Salvador (188 | 0.7%), together accounting for 30.1% of all Forest Grove residents.
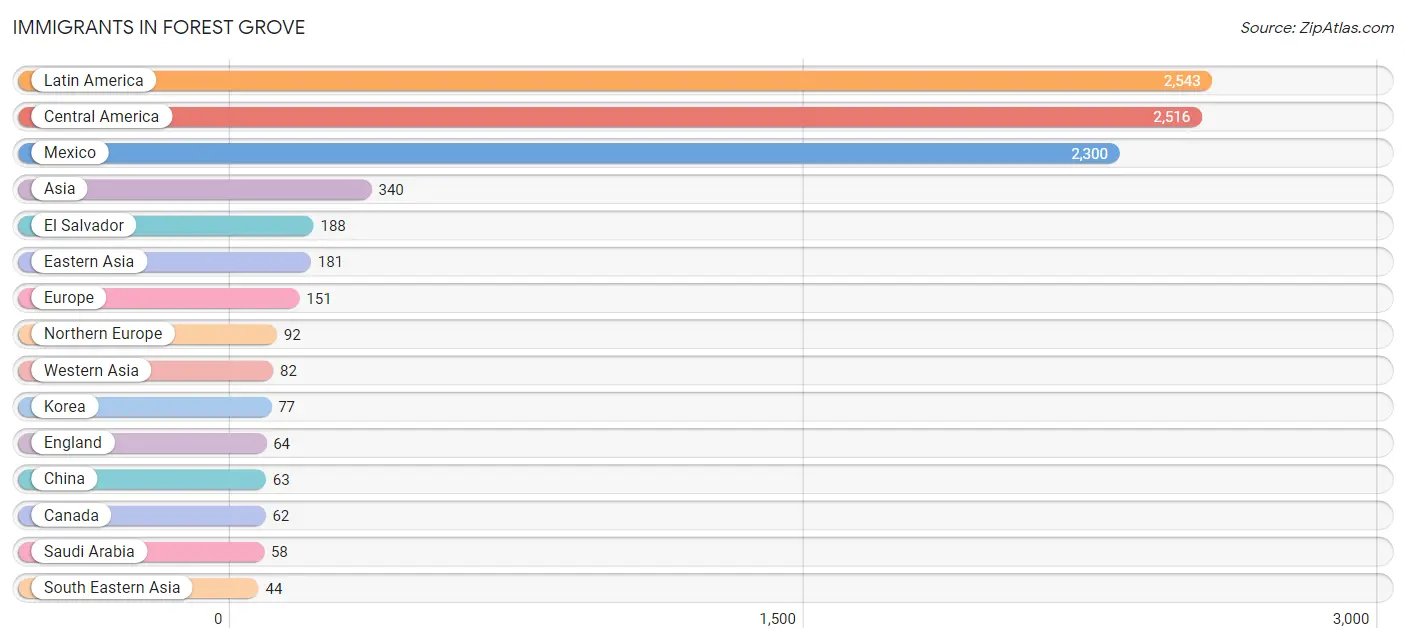
| Immigration Origin | # Population | % Population |
| Africa | 18 | 0.1% |
| Asia | 340 | 1.3% |
| Brazil | 10 | 0.0% |
| Canada | 62 | 0.2% |
| Caribbean | 8 | 0.0% |
| Central America | 2,516 | 9.6% |
| Chile | 2 | 0.0% |
| China | 63 | 0.2% |
| Czechoslovakia | 21 | 0.1% |
| Eastern Africa | 18 | 0.1% |
| Eastern Asia | 181 | 0.7% |
| Eastern Europe | 21 | 0.1% |
| El Salvador | 188 | 0.7% |
| England | 64 | 0.2% |
| Ethiopia | 18 | 0.1% |
| Europe | 151 | 0.6% |
| Germany | 36 | 0.1% |
| Guatemala | 20 | 0.1% |
| India | 21 | 0.1% |
| Israel | 24 | 0.1% |
| Japan | 41 | 0.2% |
| Kazakhstan | 12 | 0.1% |
| Korea | 77 | 0.3% |
| Latin America | 2,543 | 9.7% |
| Mexico | 2,300 | 8.8% |
| Netherlands | 2 | 0.0% |
| Nicaragua | 8 | 0.0% |
| Northern Europe | 92 | 0.4% |
| Oceania | 5 | 0.0% |
| Saudi Arabia | 58 | 0.2% |
| South America | 19 | 0.1% |
| South Central Asia | 33 | 0.1% |
| South Eastern Asia | 44 | 0.2% |
| Taiwan | 36 | 0.1% |
| Thailand | 40 | 0.2% |
| Trinidad and Tobago | 8 | 0.0% |
| Venezuela | 7 | 0.0% |
| Vietnam | 4 | 0.0% |
| Western Asia | 82 | 0.3% |
| Western Europe | 38 | 0.2% | View All 40 Rows |
Sex and Age in Forest Grove
Sex and Age in Forest Grove
The most populous age groups in Forest Grove are 20 to 24 Years (1,181 | 9.5%) for men and 15 to 19 Years (1,501 | 10.9%) for women.
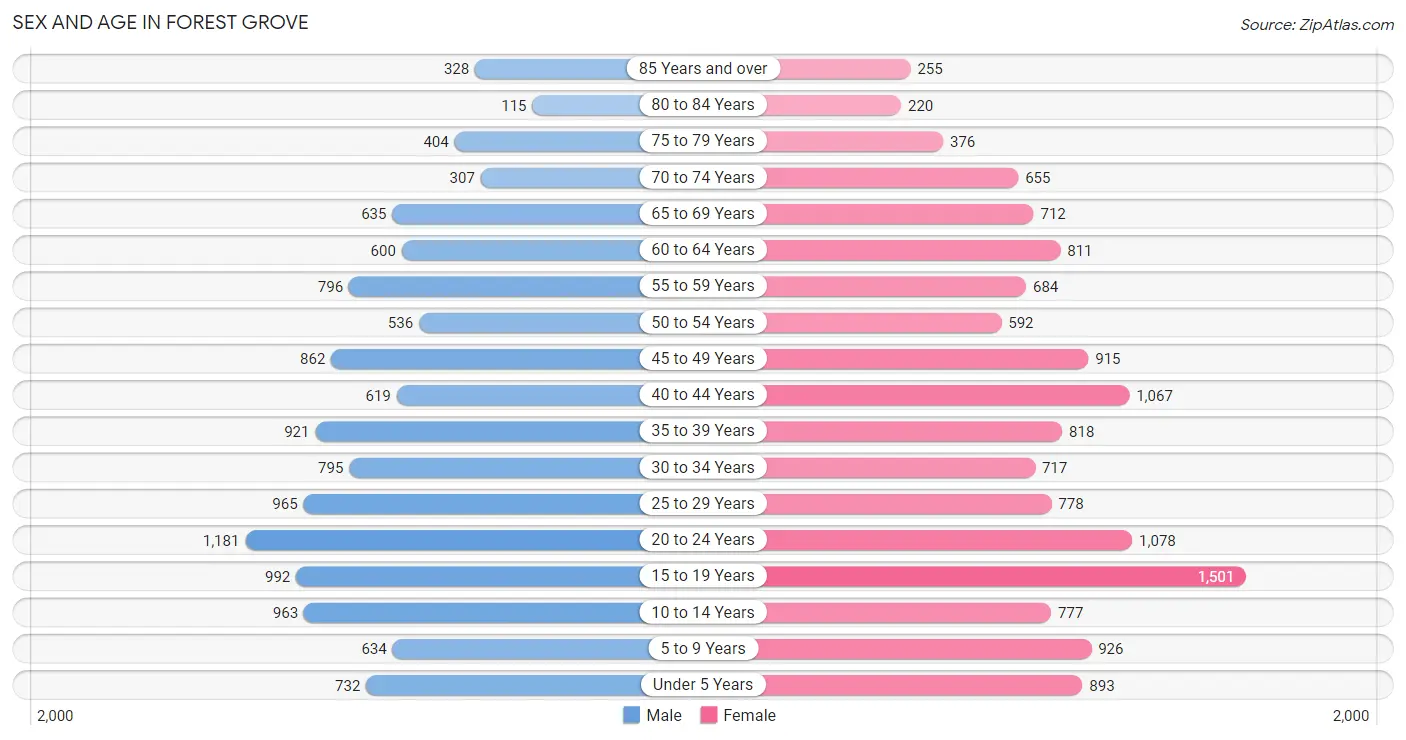
| Age Bracket | Male | Female |
| Under 5 Years | 732 (5.9%) | 893 (6.5%) |
| 5 to 9 Years | 634 (5.1%) | 926 (6.7%) |
| 10 to 14 Years | 963 (7.8%) | 777 (5.6%) |
| 15 to 19 Years | 992 (8.0%) | 1,501 (10.9%) |
| 20 to 24 Years | 1,181 (9.5%) | 1,078 (7.8%) |
| 25 to 29 Years | 965 (7.8%) | 778 (5.7%) |
| 30 to 34 Years | 795 (6.4%) | 717 (5.2%) |
| 35 to 39 Years | 921 (7.4%) | 818 (5.9%) |
| 40 to 44 Years | 619 (5.0%) | 1,067 (7.7%) |
| 45 to 49 Years | 862 (7.0%) | 915 (6.6%) |
| 50 to 54 Years | 536 (4.3%) | 592 (4.3%) |
| 55 to 59 Years | 796 (6.4%) | 684 (5.0%) |
| 60 to 64 Years | 600 (4.8%) | 811 (5.9%) |
| 65 to 69 Years | 635 (5.1%) | 712 (5.2%) |
| 70 to 74 Years | 307 (2.5%) | 655 (4.8%) |
| 75 to 79 Years | 404 (3.3%) | 376 (2.7%) |
| 80 to 84 Years | 115 (0.9%) | 220 (1.6%) |
| 85 Years and over | 328 (2.6%) | 255 (1.8%) |
| Total | 12,385 (100.0%) | 13,775 (100.0%) |
Families and Households in Forest Grove
Median Family Size in Forest Grove
The median family size in Forest Grove is 3.41 persons per family, with married-couple families (4,428 | 76.7%) accounting for the largest median family size of 3.51 persons per family. On the other hand, single female/mother families (980 | 17.0%) represent the smallest median family size with 3.04 persons per family.
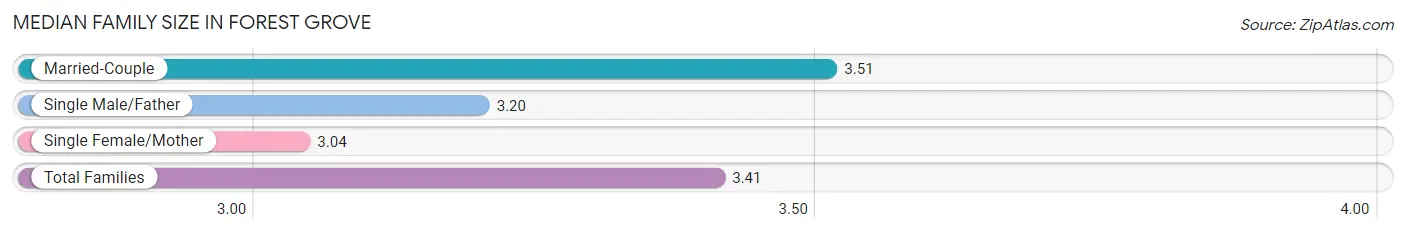
| Family Type | # Families | Family Size |
| Married-Couple | 4,428 (76.7%) | 3.51 |
| Single Male/Father | 368 (6.4%) | 3.20 |
| Single Female/Mother | 980 (17.0%) | 3.04 |
| Total Families | 5,776 (100.0%) | 3.41 |
Median Household Size in Forest Grove
The median household size in Forest Grove is 2.74 persons per household, with single male/father households (368 | 4.0%) accounting for the largest median household size of 3.77 persons per household. non-family households (3,327 | 36.5%) represent the smallest median household size with 1.39 persons per household.
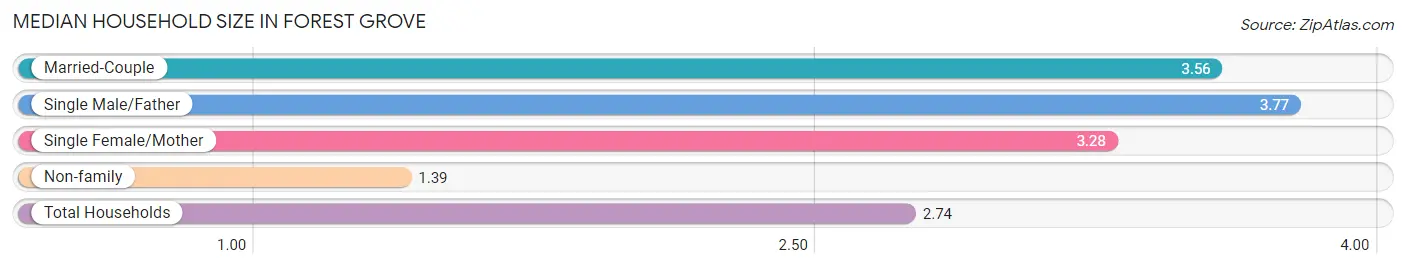
| Household Type | # Households | Household Size |
| Married-Couple | 4,428 (48.6%) | 3.56 |
| Single Male/Father | 368 (4.0%) | 3.77 |
| Single Female/Mother | 980 (10.8%) | 3.28 |
| Non-family | 3,327 (36.5%) | 1.39 |
| Total Households | 9,103 (100.0%) | 2.74 |
Household Size by Marriage Status in Forest Grove
Out of a total of 9,103 households in Forest Grove, 5,776 (63.4%) are family households, while 3,327 (36.5%) are nonfamily households. The most numerous type of family households are 2-person households, comprising 2,150, and the most common type of nonfamily households are 1-person households, comprising 2,567.
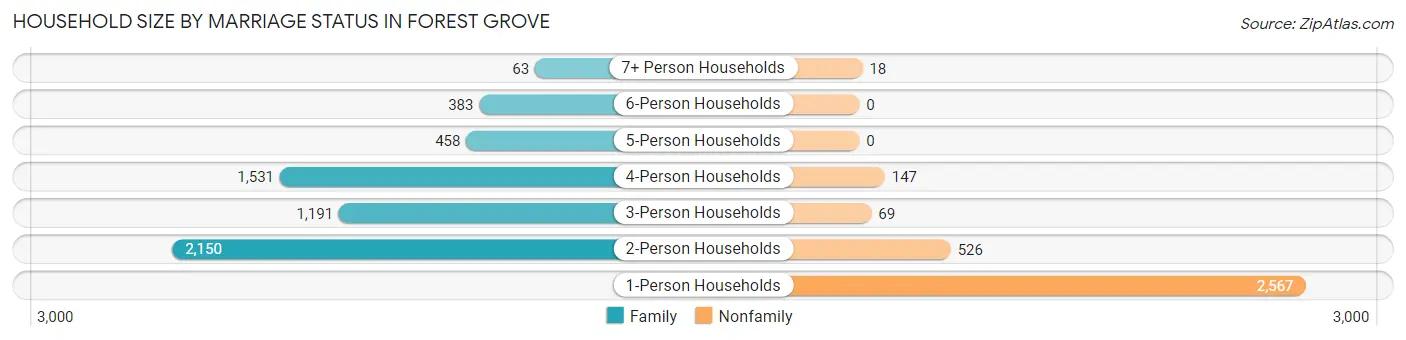
| Household Size | Family Households | Nonfamily Households |
| 1-Person Households | - | 2,567 (28.2%) |
| 2-Person Households | 2,150 (23.6%) | 526 (5.8%) |
| 3-Person Households | 1,191 (13.1%) | 69 (0.8%) |
| 4-Person Households | 1,531 (16.8%) | 147 (1.6%) |
| 5-Person Households | 458 (5.0%) | 0 (0.0%) |
| 6-Person Households | 383 (4.2%) | 0 (0.0%) |
| 7+ Person Households | 63 (0.7%) | 18 (0.2%) |
| Total | 5,776 (63.4%) | 3,327 (36.5%) |
Female Fertility in Forest Grove
Fertility by Age in Forest Grove
Average fertility rate in Forest Grove is 64.0 births per 1,000 women. Women in the age bracket of 20 to 34 years have the highest fertility rate with 80.0 births per 1,000 women. Women in the age bracket of 20 to 34 years acount for 46.3% of all women with births.
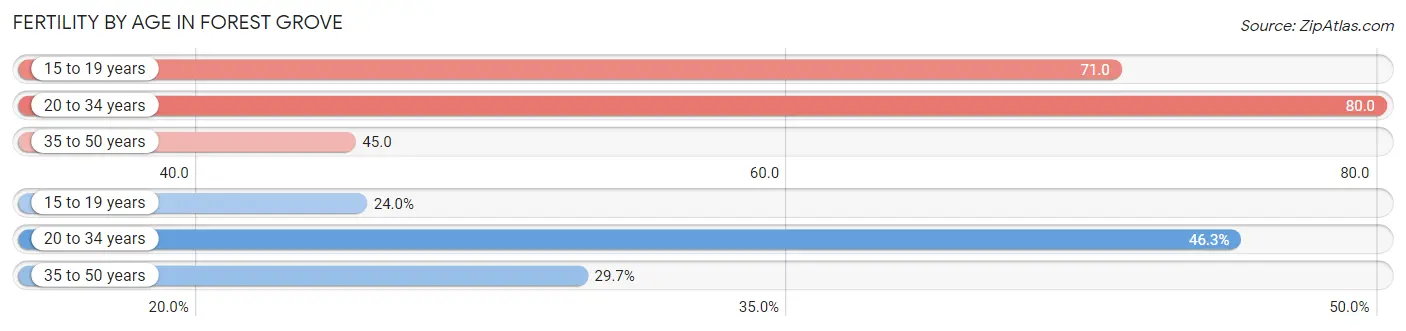
| Age Bracket | Women with Births | Births / 1,000 Women |
| 15 to 19 years | 107 (24.0%) | 71.0 |
| 20 to 34 years | 206 (46.3%) | 80.0 |
| 35 to 50 years | 132 (29.7%) | 45.0 |
| Total | 445 (100.0%) | 64.0 |
Fertility by Age by Marriage Status in Forest Grove
60.4% of women with births (445) in Forest Grove are married. The highest percentage of unmarried women with births falls into 15 to 19 years age bracket with 100.0% of them unmarried at the time of birth, while the lowest percentage of unmarried women with births belong to 20 to 34 years age bracket with 11.7% of them unmarried.
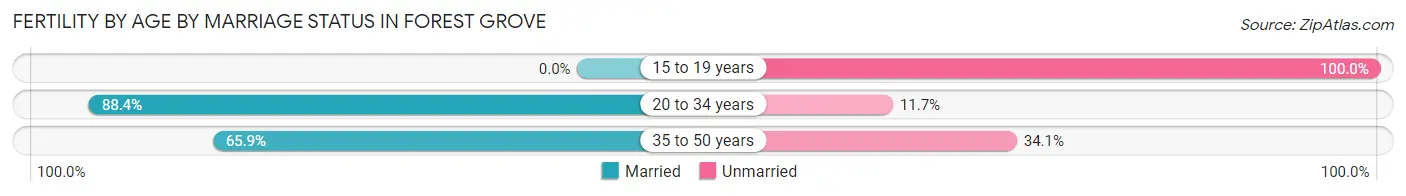
| Age Bracket | Married | Unmarried |
| 15 to 19 years | 0 (0.0%) | 107 (100.0%) |
| 20 to 34 years | 182 (88.3%) | 24 (11.7%) |
| 35 to 50 years | 87 (65.9%) | 45 (34.1%) |
| Total | 269 (60.5%) | 176 (39.6%) |
Fertility by Education in Forest Grove
Average fertility rate in Forest Grove is 64.0 births per 1,000 women. Women with the education attainment of graduate degree have the highest fertility rate of 135.0 births per 1,000 women, while women with the education attainment of college or associate's degree have the lowest fertility at 33.0 births per 1,000 women. Women with the education attainment of less than high school represent 37.3% of all women with births.
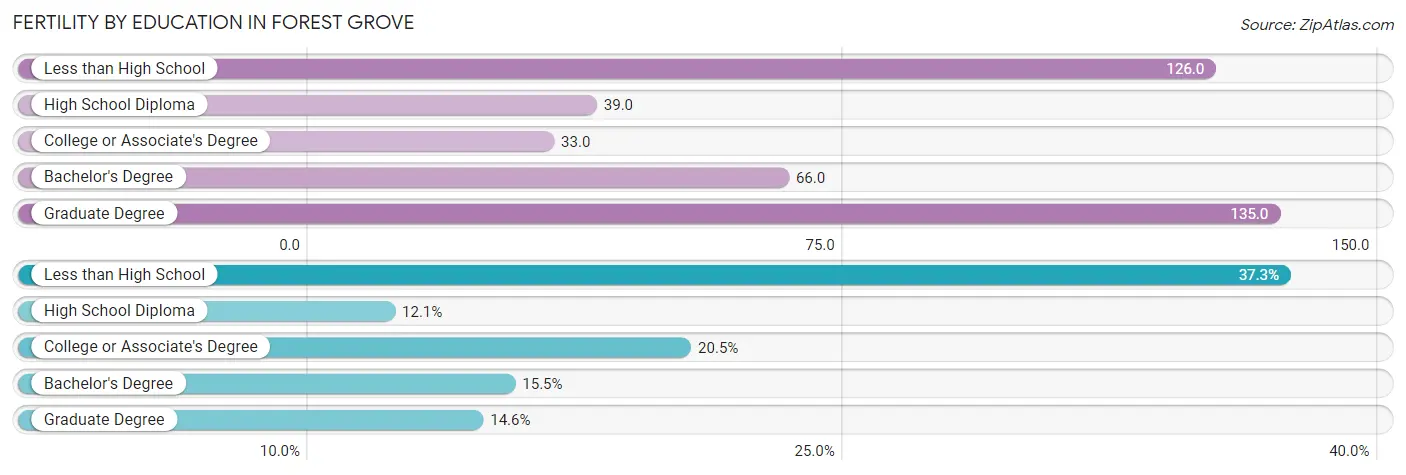
| Educational Attainment | Women with Births | Births / 1,000 Women |
| Less than High School | 166 (37.3%) | 126.0 |
| High School Diploma | 54 (12.1%) | 39.0 |
| College or Associate's Degree | 91 (20.4%) | 33.0 |
| Bachelor's Degree | 69 (15.5%) | 66.0 |
| Graduate Degree | 65 (14.6%) | 135.0 |
| Total | 445 (100.0%) | 64.0 |
Fertility by Education by Marriage Status in Forest Grove
39.6% of women with births in Forest Grove are unmarried. Women with the educational attainment of college or associate's degree are most likely to be married with 100.0% of them married at childbirth, while women with the educational attainment of less than high school are least likely to be married with 91.6% of them unmarried at childbirth.
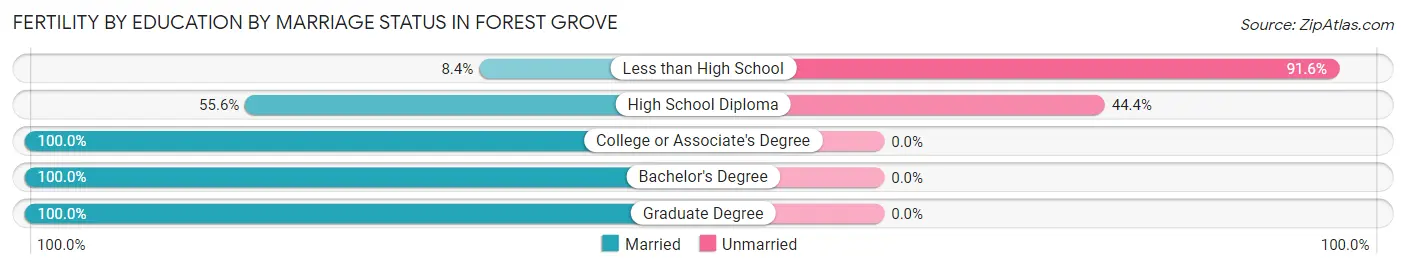
| Educational Attainment | Married | Unmarried |
| Less than High School | 14 (8.4%) | 152 (91.6%) |
| High School Diploma | 30 (55.6%) | 24 (44.4%) |
| College or Associate's Degree | 91 (100.0%) | 0 (0.0%) |
| Bachelor's Degree | 69 (100.0%) | 0 (0.0%) |
| Graduate Degree | 65 (100.0%) | 0 (0.0%) |
| Total | 269 (60.5%) | 176 (39.6%) |
Employment Characteristics in Forest Grove
Employment by Class of Employer in Forest Grove
Among the 12,578 employed individuals in Forest Grove, private company employees (8,632 | 68.6%), local government employees (1,384 | 11.0%), and not-for-profit organizations (1,108 | 8.8%) make up the most common classes of employment.
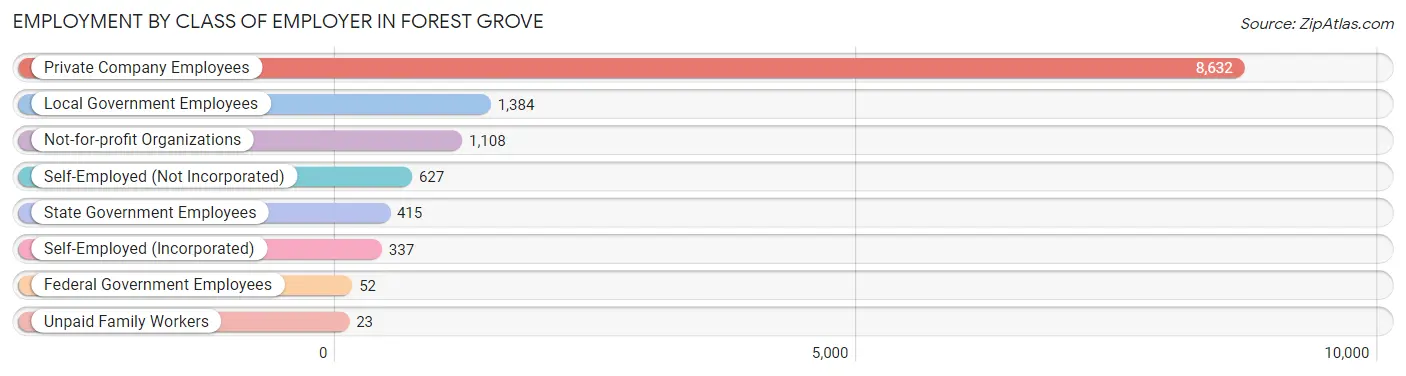
| Employer Class | # Employees | % Employees |
| Private Company Employees | 8,632 | 68.6% |
| Self-Employed (Incorporated) | 337 | 2.7% |
| Self-Employed (Not Incorporated) | 627 | 5.0% |
| Not-for-profit Organizations | 1,108 | 8.8% |
| Local Government Employees | 1,384 | 11.0% |
| State Government Employees | 415 | 3.3% |
| Federal Government Employees | 52 | 0.4% |
| Unpaid Family Workers | 23 | 0.2% |
| Total | 12,578 | 100.0% |
Employment Status by Age in Forest Grove
According to the labor force statistics for Forest Grove, out of the total population over 16 years of age (20,895), 64.0% or 13,373 individuals are in the labor force, with 4.3% or 575 of them unemployed. The age group with the highest labor force participation rate is 45 to 54 years, with 86.6% or 2,516 individuals in the labor force. Within the labor force, the 16 to 19 years age range has the highest percentage of unemployed individuals, with 12.8% or 109 of them being unemployed.
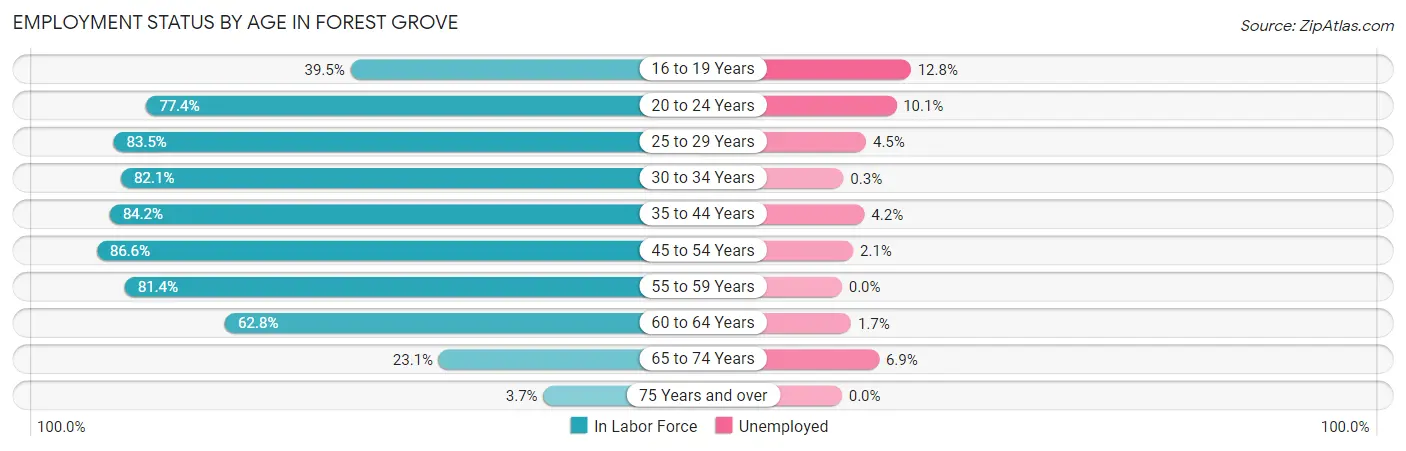
| Age Bracket | In Labor Force | Unemployed |
| 16 to 19 Years | 850 (39.5%) | 109 (12.8%) |
| 20 to 24 Years | 1,748 (77.4%) | 177 (10.1%) |
| 25 to 29 Years | 1,455 (83.5%) | 65 (4.5%) |
| 30 to 34 Years | 1,241 (82.1%) | 4 (0.3%) |
| 35 to 44 Years | 2,884 (84.2%) | 121 (4.2%) |
| 45 to 54 Years | 2,516 (86.6%) | 53 (2.1%) |
| 55 to 59 Years | 1,205 (81.4%) | 0 (0.0%) |
| 60 to 64 Years | 886 (62.8%) | 15 (1.7%) |
| 65 to 74 Years | 533 (23.1%) | 37 (6.9%) |
| 75 Years and over | 63 (3.7%) | 0 (0.0%) |
| Total | 13,373 (64.0%) | 575 (4.3%) |
Employment Status by Educational Attainment in Forest Grove
According to labor force statistics for Forest Grove, 81.7% of individuals (10,193) out of the total population between 25 and 64 years of age (12,476) are in the labor force, with 2.5% or 255 of them being unemployed. The group with the highest labor force participation rate are those with the educational attainment of bachelor's degree or higher, with 85.3% or 3,470 individuals in the labor force. Within the labor force, individuals with high school diploma education have the highest percentage of unemployment, with 5.5% or 126 of them being unemployed.
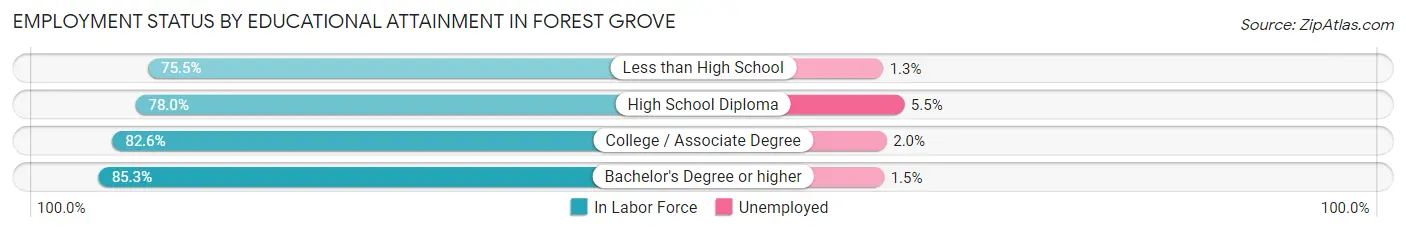
| Educational Attainment | In Labor Force | Unemployed |
| Less than High School | 993 (75.5%) | 17 (1.3%) |
| High School Diploma | 2,284 (78.0%) | 161 (5.5%) |
| College / Associate Degree | 3,440 (82.6%) | 83 (2.0%) |
| Bachelor's Degree or higher | 3,470 (85.3%) | 61 (1.5%) |
| Total | 10,193 (81.7%) | 312 (2.5%) |
Employment Occupations by Sex in Forest Grove
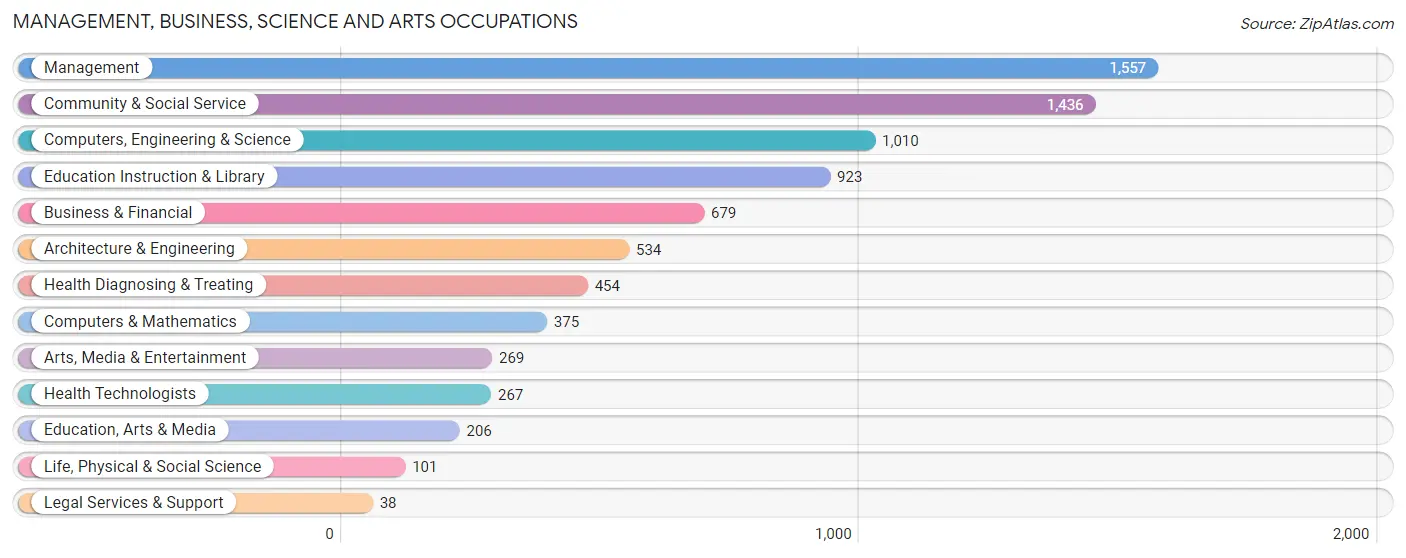
Management, Business, Science and Arts Occupations
The most common Management, Business, Science and Arts occupations in Forest Grove are Management (1,557 | 12.2%), Community & Social Service (1,436 | 11.2%), Computers, Engineering & Science (1,010 | 7.9%), Education Instruction & Library (923 | 7.2%), and Business & Financial (679 | 5.3%).
Management, Business, Science and Arts Occupations by Sex
Within the Management, Business, Science and Arts occupations in Forest Grove, the most male-oriented occupations are Computers & Mathematics (84.5%), Architecture & Engineering (75.1%), and Computers, Engineering & Science (74.1%), while the most female-oriented occupations are Health Technologists (80.9%), Education, Arts & Media (73.3%), and Health Diagnosing & Treating (70.9%).
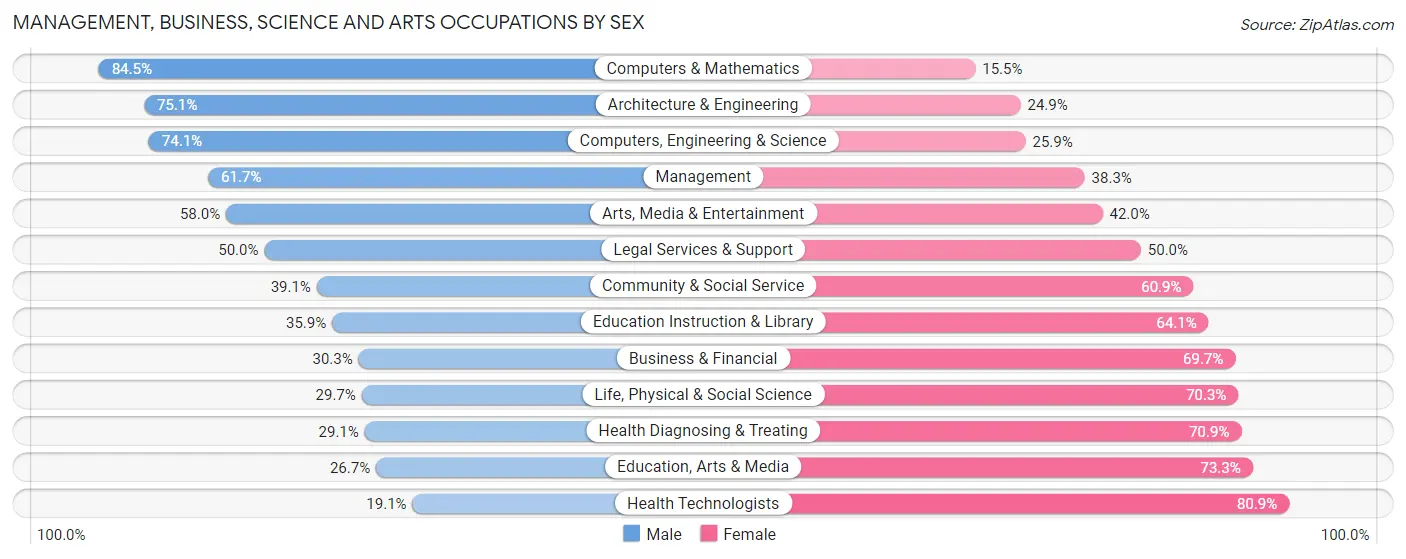
| Occupation | Male | Female |
| Management | 961 (61.7%) | 596 (38.3%) |
| Business & Financial | 206 (30.3%) | 473 (69.7%) |
| Computers, Engineering & Science | 748 (74.1%) | 262 (25.9%) |
| Computers & Mathematics | 317 (84.5%) | 58 (15.5%) |
| Architecture & Engineering | 401 (75.1%) | 133 (24.9%) |
| Life, Physical & Social Science | 30 (29.7%) | 71 (70.3%) |
| Community & Social Service | 561 (39.1%) | 875 (60.9%) |
| Education, Arts & Media | 55 (26.7%) | 151 (73.3%) |
| Legal Services & Support | 19 (50.0%) | 19 (50.0%) |
| Education Instruction & Library | 331 (35.9%) | 592 (64.1%) |
| Arts, Media & Entertainment | 156 (58.0%) | 113 (42.0%) |
| Health Diagnosing & Treating | 132 (29.1%) | 322 (70.9%) |
| Health Technologists | 51 (19.1%) | 216 (80.9%) |
| Total (Category) | 2,608 (50.8%) | 2,528 (49.2%) |
| Total (Overall) | 6,649 (52.0%) | 6,133 (48.0%) |
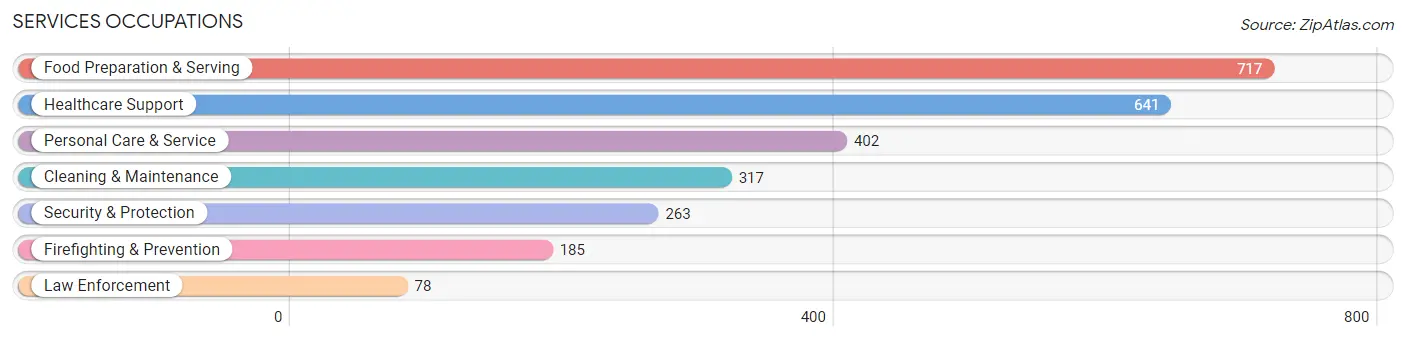
Services Occupations
The most common Services occupations in Forest Grove are Food Preparation & Serving (717 | 5.6%), Healthcare Support (641 | 5.0%), Personal Care & Service (402 | 3.2%), Cleaning & Maintenance (317 | 2.5%), and Security & Protection (263 | 2.1%).
Services Occupations by Sex
Within the Services occupations in Forest Grove, the most male-oriented occupations are Law Enforcement (100.0%), Security & Protection (82.9%), and Firefighting & Prevention (75.7%), while the most female-oriented occupations are Personal Care & Service (84.1%), Healthcare Support (75.0%), and Food Preparation & Serving (69.7%).
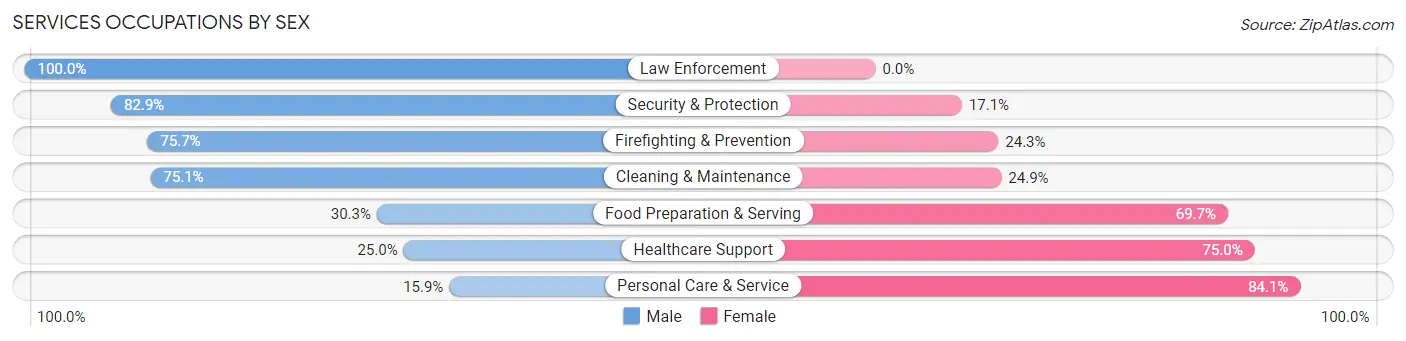
| Occupation | Male | Female |
| Healthcare Support | 160 (25.0%) | 481 (75.0%) |
| Security & Protection | 218 (82.9%) | 45 (17.1%) |
| Firefighting & Prevention | 140 (75.7%) | 45 (24.3%) |
| Law Enforcement | 78 (100.0%) | 0 (0.0%) |
| Food Preparation & Serving | 217 (30.3%) | 500 (69.7%) |
| Cleaning & Maintenance | 238 (75.1%) | 79 (24.9%) |
| Personal Care & Service | 64 (15.9%) | 338 (84.1%) |
| Total (Category) | 897 (38.3%) | 1,443 (61.7%) |
| Total (Overall) | 6,649 (52.0%) | 6,133 (48.0%) |
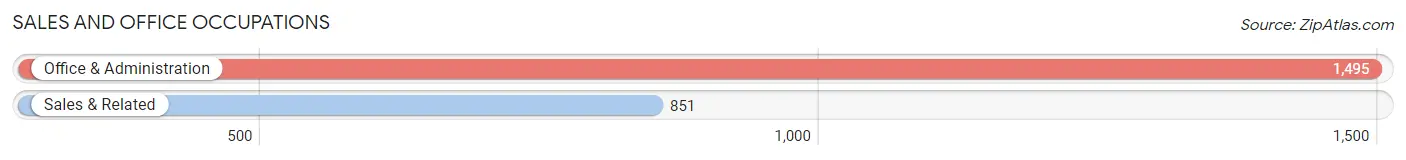
Sales and Office Occupations
The most common Sales and Office occupations in Forest Grove are Office & Administration (1,495 | 11.7%), and Sales & Related (851 | 6.7%).
Sales and Office Occupations by Sex
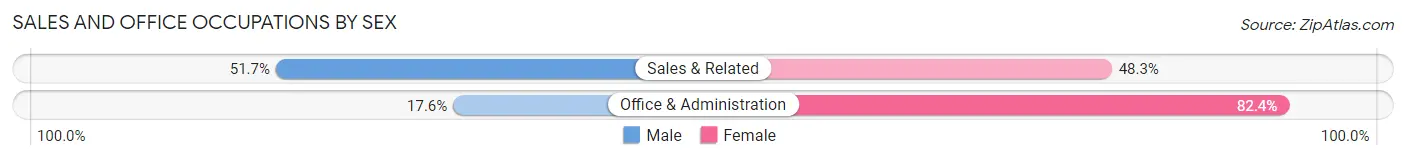
| Occupation | Male | Female |
| Sales & Related | 440 (51.7%) | 411 (48.3%) |
| Office & Administration | 263 (17.6%) | 1,232 (82.4%) |
| Total (Category) | 703 (30.0%) | 1,643 (70.0%) |
| Total (Overall) | 6,649 (52.0%) | 6,133 (48.0%) |
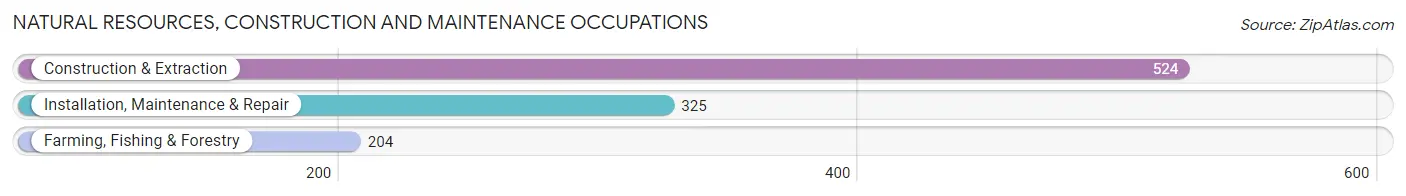
Natural Resources, Construction and Maintenance Occupations
The most common Natural Resources, Construction and Maintenance occupations in Forest Grove are Construction & Extraction (524 | 4.1%), Installation, Maintenance & Repair (325 | 2.5%), and Farming, Fishing & Forestry (204 | 1.6%).
Natural Resources, Construction and Maintenance Occupations by Sex
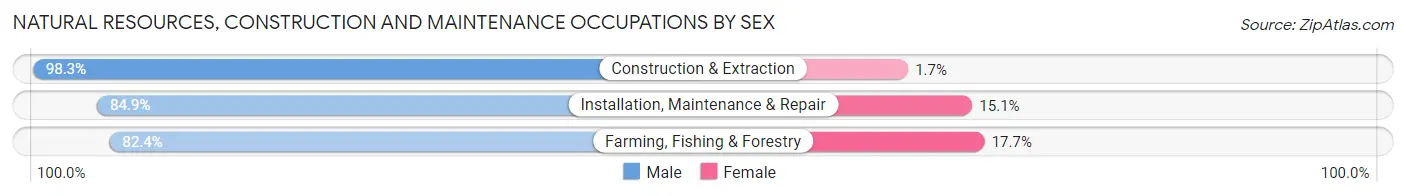
| Occupation | Male | Female |
| Farming, Fishing & Forestry | 168 (82.4%) | 36 (17.6%) |
| Construction & Extraction | 515 (98.3%) | 9 (1.7%) |
| Installation, Maintenance & Repair | 276 (84.9%) | 49 (15.1%) |
| Total (Category) | 959 (91.1%) | 94 (8.9%) |
| Total (Overall) | 6,649 (52.0%) | 6,133 (48.0%) |
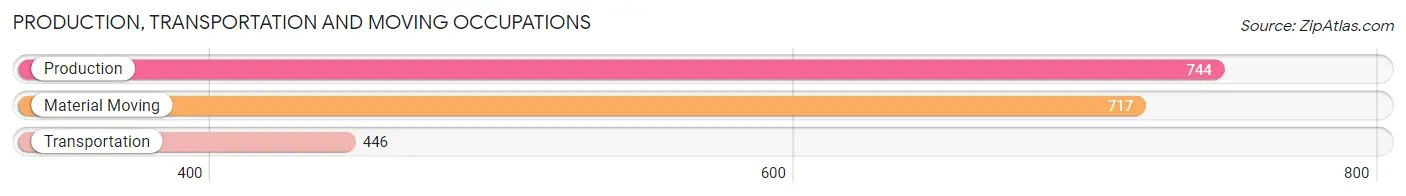
Production, Transportation and Moving Occupations
The most common Production, Transportation and Moving occupations in Forest Grove are Production (744 | 5.8%), Material Moving (717 | 5.6%), and Transportation (446 | 3.5%).
Production, Transportation and Moving Occupations by Sex
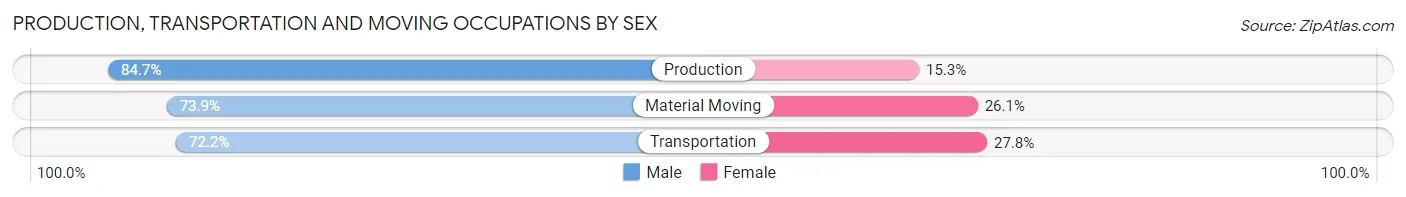
| Occupation | Male | Female |
| Production | 630 (84.7%) | 114 (15.3%) |
| Transportation | 322 (72.2%) | 124 (27.8%) |
| Material Moving | 530 (73.9%) | 187 (26.1%) |
| Total (Category) | 1,482 (77.7%) | 425 (22.3%) |
| Total (Overall) | 6,649 (52.0%) | 6,133 (48.0%) |
Employment Industries by Sex in Forest Grove
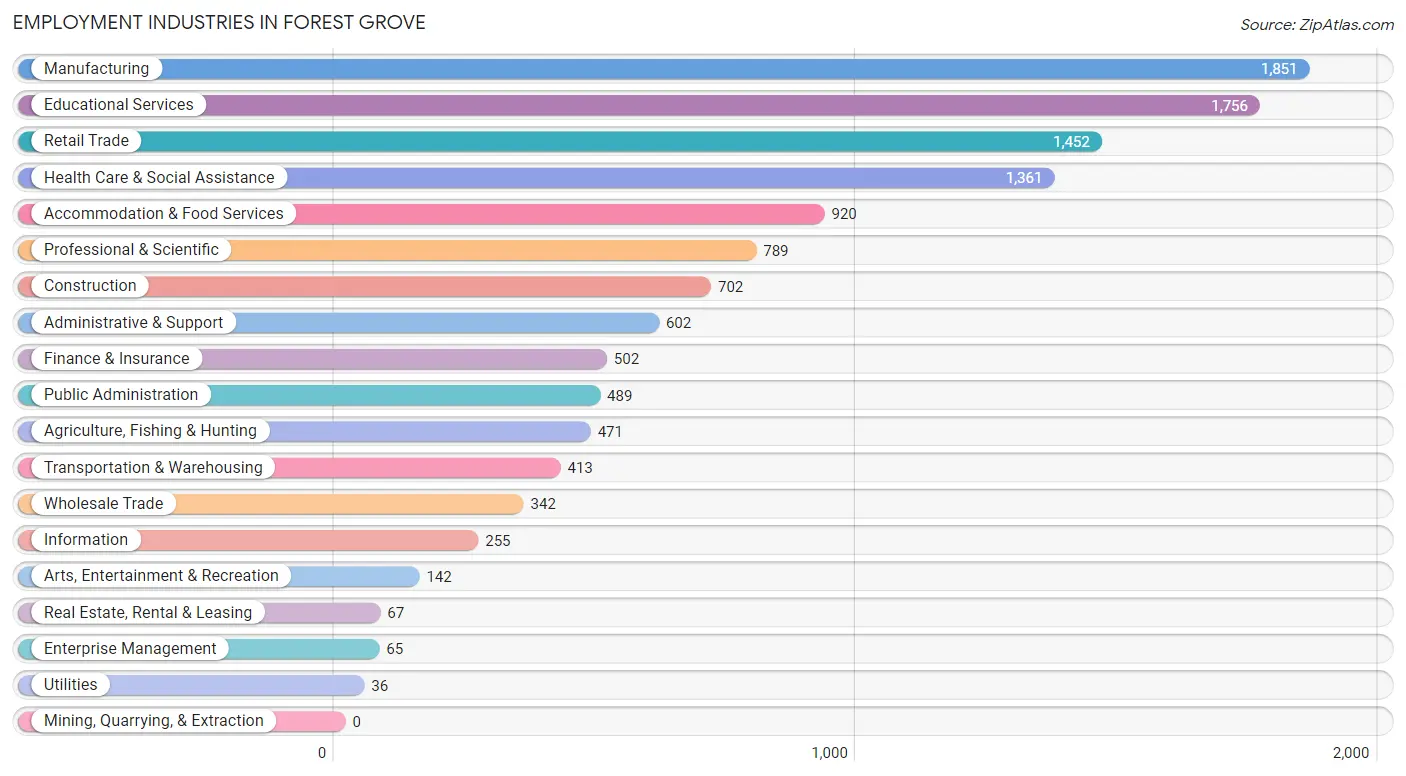
Employment Industries in Forest Grove
The major employment industries in Forest Grove include Manufacturing (1,851 | 14.5%), Educational Services (1,756 | 13.7%), Retail Trade (1,452 | 11.4%), Health Care & Social Assistance (1,361 | 10.6%), and Accommodation & Food Services (920 | 7.2%).
Employment Industries by Sex in Forest Grove
The Forest Grove industries that see more men than women are Utilities (100.0%), Wholesale Trade (95.3%), and Agriculture, Fishing & Hunting (86.8%), whereas the industries that tend to have a higher number of women are Health Care & Social Assistance (77.4%), Finance & Insurance (74.3%), and Accommodation & Food Services (70.8%).
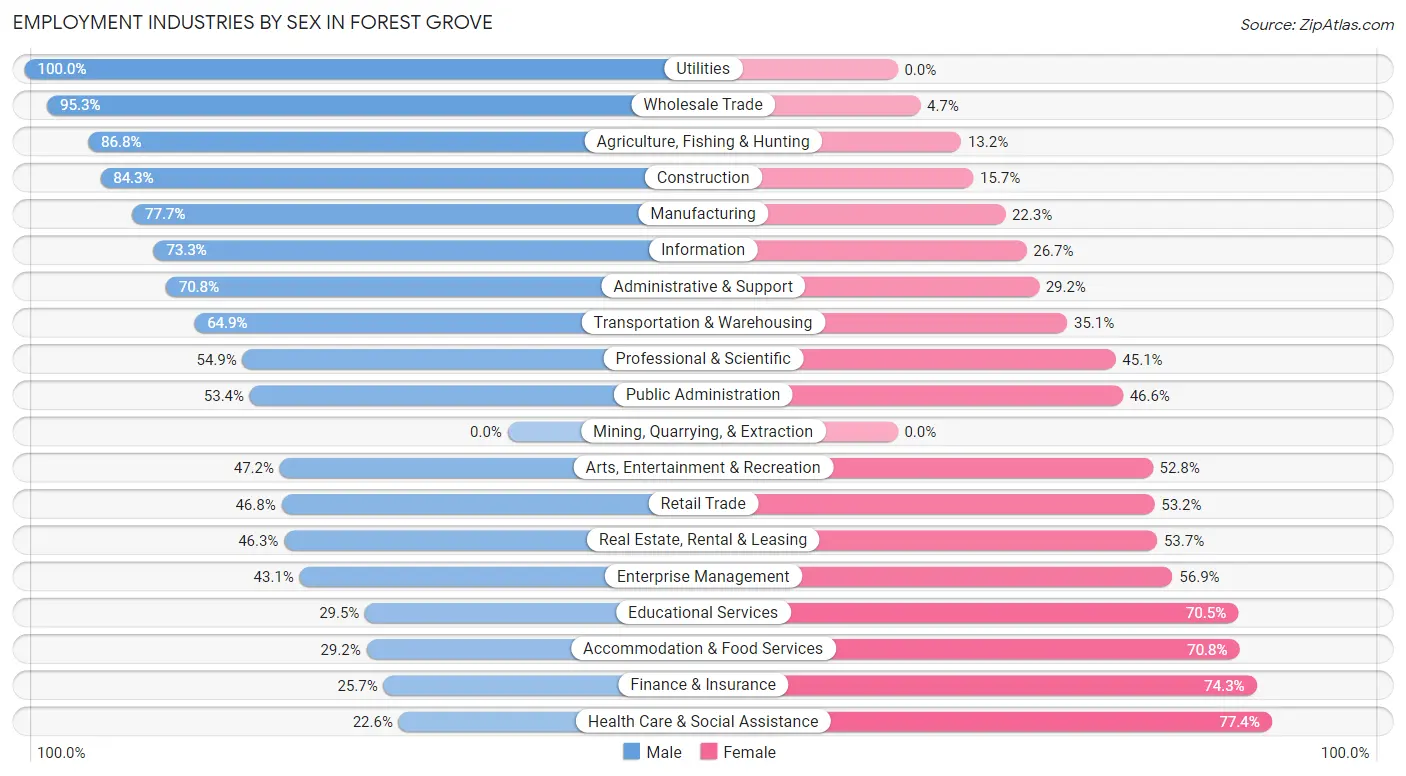
| Industry | Male | Female |
| Agriculture, Fishing & Hunting | 409 (86.8%) | 62 (13.2%) |
| Mining, Quarrying, & Extraction | 0 (0.0%) | 0 (0.0%) |
| Construction | 592 (84.3%) | 110 (15.7%) |
| Manufacturing | 1,439 (77.7%) | 412 (22.3%) |
| Wholesale Trade | 326 (95.3%) | 16 (4.7%) |
| Retail Trade | 680 (46.8%) | 772 (53.2%) |
| Transportation & Warehousing | 268 (64.9%) | 145 (35.1%) |
| Utilities | 36 (100.0%) | 0 (0.0%) |
| Information | 187 (73.3%) | 68 (26.7%) |
| Finance & Insurance | 129 (25.7%) | 373 (74.3%) |
| Real Estate, Rental & Leasing | 31 (46.3%) | 36 (53.7%) |
| Professional & Scientific | 433 (54.9%) | 356 (45.1%) |
| Enterprise Management | 28 (43.1%) | 37 (56.9%) |
| Administrative & Support | 426 (70.8%) | 176 (29.2%) |
| Educational Services | 518 (29.5%) | 1,238 (70.5%) |
| Health Care & Social Assistance | 307 (22.6%) | 1,054 (77.4%) |
| Arts, Entertainment & Recreation | 67 (47.2%) | 75 (52.8%) |
| Accommodation & Food Services | 269 (29.2%) | 651 (70.8%) |
| Public Administration | 261 (53.4%) | 228 (46.6%) |
| Total | 6,649 (52.0%) | 6,133 (48.0%) |
Education in Forest Grove
School Enrollment in Forest Grove
The most common levels of schooling among the 7,328 students in Forest Grove are college / undergraduate (2,093 | 28.6%), high school (1,616 | 22.1%), and middle school (1,429 | 19.5%).
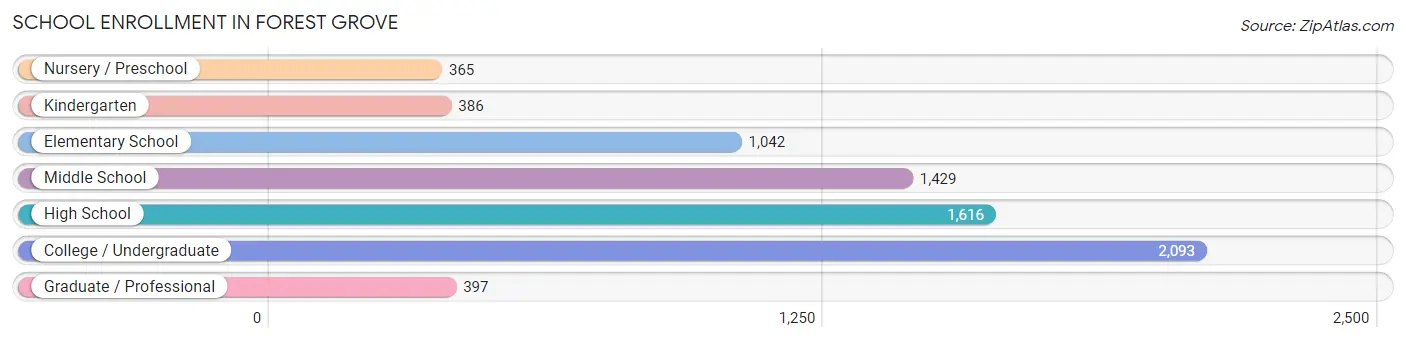
| School Level | # Students | % Students |
| Nursery / Preschool | 365 | 5.0% |
| Kindergarten | 386 | 5.3% |
| Elementary School | 1,042 | 14.2% |
| Middle School | 1,429 | 19.5% |
| High School | 1,616 | 22.1% |
| College / Undergraduate | 2,093 | 28.6% |
| Graduate / Professional | 397 | 5.4% |
| Total | 7,328 | 100.0% |
School Enrollment by Age by Funding Source in Forest Grove
Out of a total of 7,328 students who are enrolled in schools in Forest Grove, 2,294 (31.3%) attend a private institution, while the remaining 5,034 (68.7%) are enrolled in public schools. The age group of 20 to 24 year olds has the highest likelihood of being enrolled in private schools, with 795 (69.1% in the age bracket) enrolled. Conversely, the age group of 15 to 17 year olds has the lowest likelihood of being enrolled in a private school, with 1,222 (93.4% in the age bracket) attending a public institution.
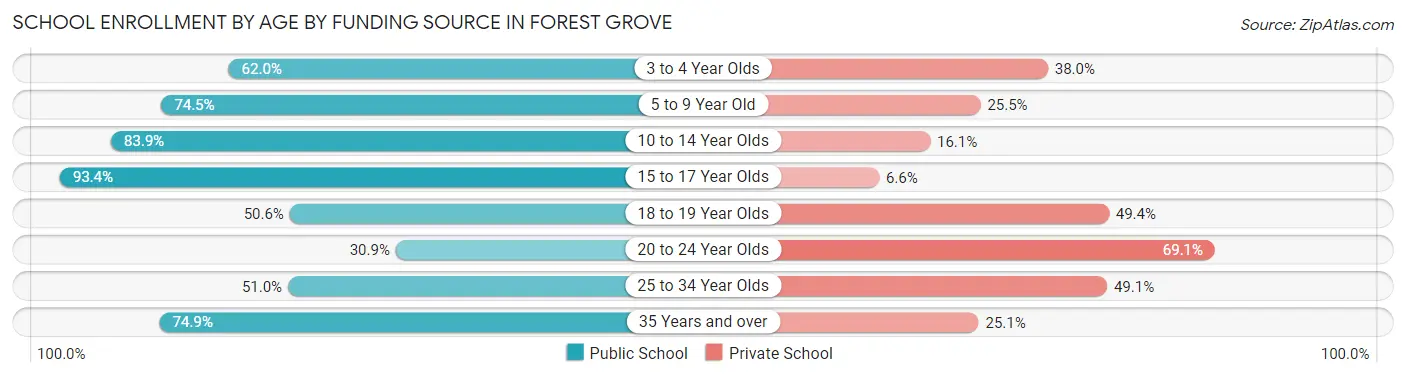
| Age Bracket | Public School | Private School |
| 3 to 4 Year Olds | 119 (62.0%) | 73 (38.0%) |
| 5 to 9 Year Old | 1,123 (74.5%) | 384 (25.5%) |
| 10 to 14 Year Olds | 1,414 (83.9%) | 271 (16.1%) |
| 15 to 17 Year Olds | 1,222 (93.4%) | 86 (6.6%) |
| 18 to 19 Year Olds | 411 (50.6%) | 401 (49.4%) |
| 20 to 24 Year Olds | 355 (30.9%) | 795 (69.1%) |
| 25 to 34 Year Olds | 242 (50.9%) | 233 (49.0%) |
| 35 Years and over | 149 (74.9%) | 50 (25.1%) |
| Total | 5,034 (68.7%) | 2,294 (31.3%) |
Educational Attainment by Field of Study in Forest Grove
Business (835 | 14.0%), education (800 | 13.4%), social sciences (544 | 9.1%), bio, nature & agricultural (536 | 9.0%), and science & technology (488 | 8.2%) are the most common fields of study among 5,951 individuals in Forest Grove who have obtained a bachelor's degree or higher.
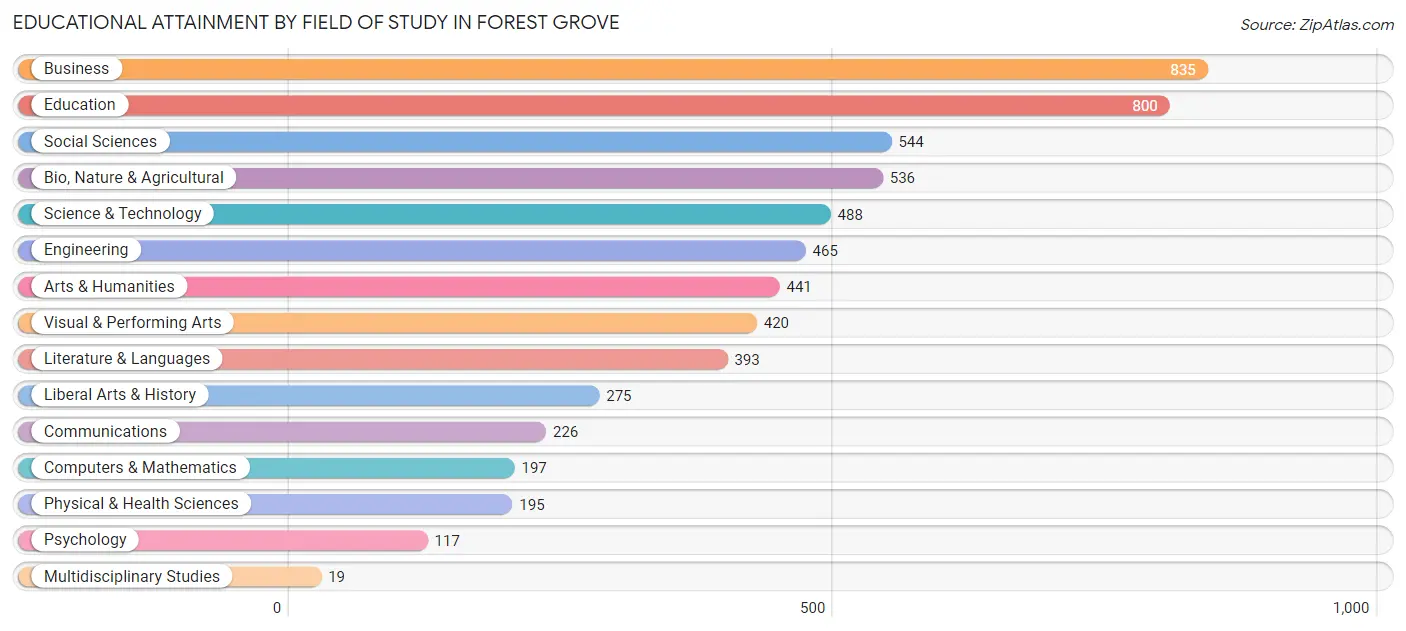
| Field of Study | # Graduates | % Graduates |
| Computers & Mathematics | 197 | 3.3% |
| Bio, Nature & Agricultural | 536 | 9.0% |
| Physical & Health Sciences | 195 | 3.3% |
| Psychology | 117 | 2.0% |
| Social Sciences | 544 | 9.1% |
| Engineering | 465 | 7.8% |
| Multidisciplinary Studies | 19 | 0.3% |
| Science & Technology | 488 | 8.2% |
| Business | 835 | 14.0% |
| Education | 800 | 13.4% |
| Literature & Languages | 393 | 6.6% |
| Liberal Arts & History | 275 | 4.6% |
| Visual & Performing Arts | 420 | 7.1% |
| Communications | 226 | 3.8% |
| Arts & Humanities | 441 | 7.4% |
| Total | 5,951 | 100.0% |
Transportation & Commute in Forest Grove
Vehicle Availability by Sex in Forest Grove
The most prevalent vehicle ownership categories in Forest Grove are males with 2 vehicles (3,154, accounting for 48.4%) and females with 2 vehicles (2,400, making up 54.9%).
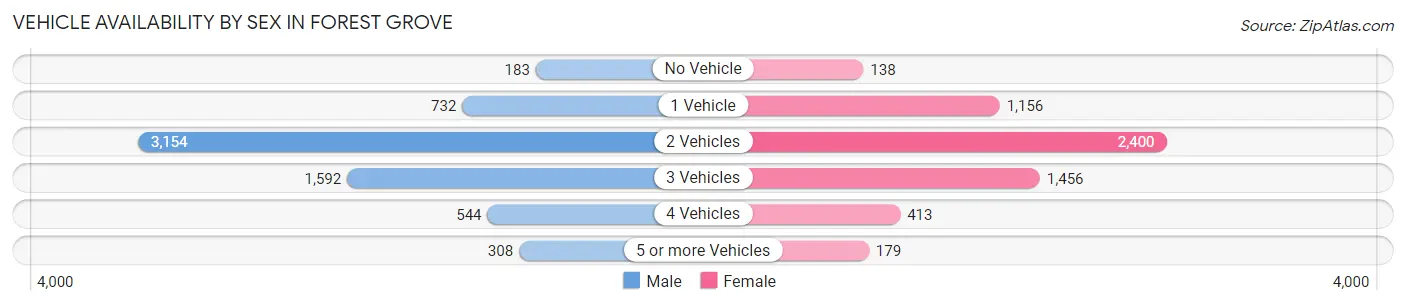
| Vehicles Available | Male | Female |
| No Vehicle | 183 (2.8%) | 138 (2.4%) |
| 1 Vehicle | 732 (11.2%) | 1,156 (20.1%) |
| 2 Vehicles | 3,154 (48.4%) | 2,400 (41.8%) |
| 3 Vehicles | 1,592 (24.4%) | 1,456 (25.4%) |
| 4 Vehicles | 544 (8.4%) | 413 (7.2%) |
| 5 or more Vehicles | 308 (4.7%) | 179 (3.1%) |
| Total | 6,513 (100.0%) | 5,742 (100.0%) |
Commute Time in Forest Grove
The most frequently occuring commute durations in Forest Grove are 10 to 14 minutes (1,912 commuters, 16.7%), 5 to 9 minutes (1,721 commuters, 15.0%), and 30 to 34 minutes (1,625 commuters, 14.2%).
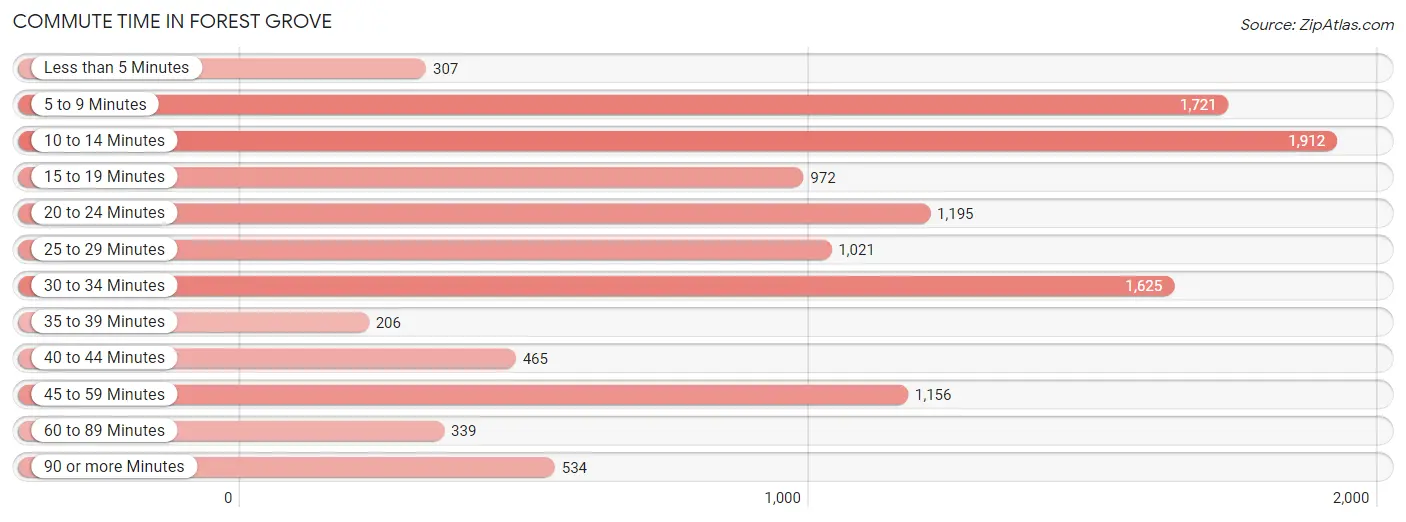
| Commute Time | # Commuters | % Commuters |
| Less than 5 Minutes | 307 | 2.7% |
| 5 to 9 Minutes | 1,721 | 15.0% |
| 10 to 14 Minutes | 1,912 | 16.7% |
| 15 to 19 Minutes | 972 | 8.5% |
| 20 to 24 Minutes | 1,195 | 10.4% |
| 25 to 29 Minutes | 1,021 | 8.9% |
| 30 to 34 Minutes | 1,625 | 14.2% |
| 35 to 39 Minutes | 206 | 1.8% |
| 40 to 44 Minutes | 465 | 4.1% |
| 45 to 59 Minutes | 1,156 | 10.1% |
| 60 to 89 Minutes | 339 | 3.0% |
| 90 or more Minutes | 534 | 4.7% |
Commute Time by Sex in Forest Grove
The most common commute times in Forest Grove are 10 to 14 minutes (1,060 commuters, 17.5%) for males and 5 to 9 minutes (926 commuters, 17.2%) for females.
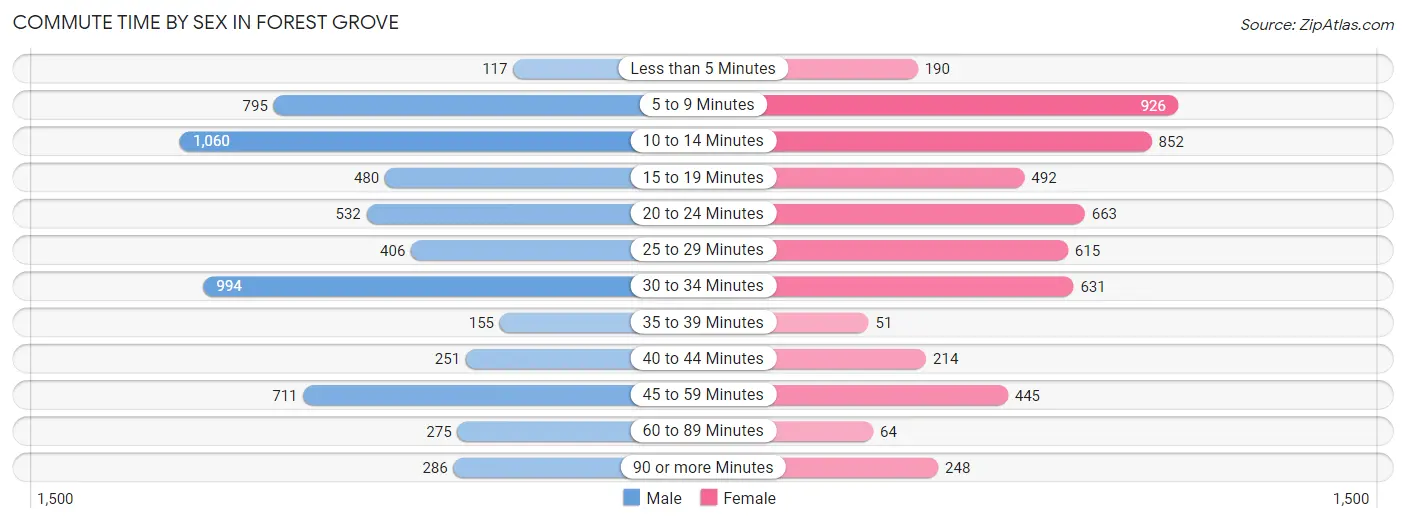
| Commute Time | Male | Female |
| Less than 5 Minutes | 117 (1.9%) | 190 (3.5%) |
| 5 to 9 Minutes | 795 (13.1%) | 926 (17.2%) |
| 10 to 14 Minutes | 1,060 (17.5%) | 852 (15.8%) |
| 15 to 19 Minutes | 480 (7.9%) | 492 (9.1%) |
| 20 to 24 Minutes | 532 (8.8%) | 663 (12.3%) |
| 25 to 29 Minutes | 406 (6.7%) | 615 (11.4%) |
| 30 to 34 Minutes | 994 (16.4%) | 631 (11.7%) |
| 35 to 39 Minutes | 155 (2.6%) | 51 (0.9%) |
| 40 to 44 Minutes | 251 (4.1%) | 214 (4.0%) |
| 45 to 59 Minutes | 711 (11.7%) | 445 (8.3%) |
| 60 to 89 Minutes | 275 (4.5%) | 64 (1.2%) |
| 90 or more Minutes | 286 (4.7%) | 248 (4.6%) |
Time of Departure to Work by Sex in Forest Grove
The most frequent times of departure to work in Forest Grove are 6:30 AM to 6:59 AM (864, 14.2%) for males and 7:00 AM to 7:29 AM (748, 13.9%) for females.
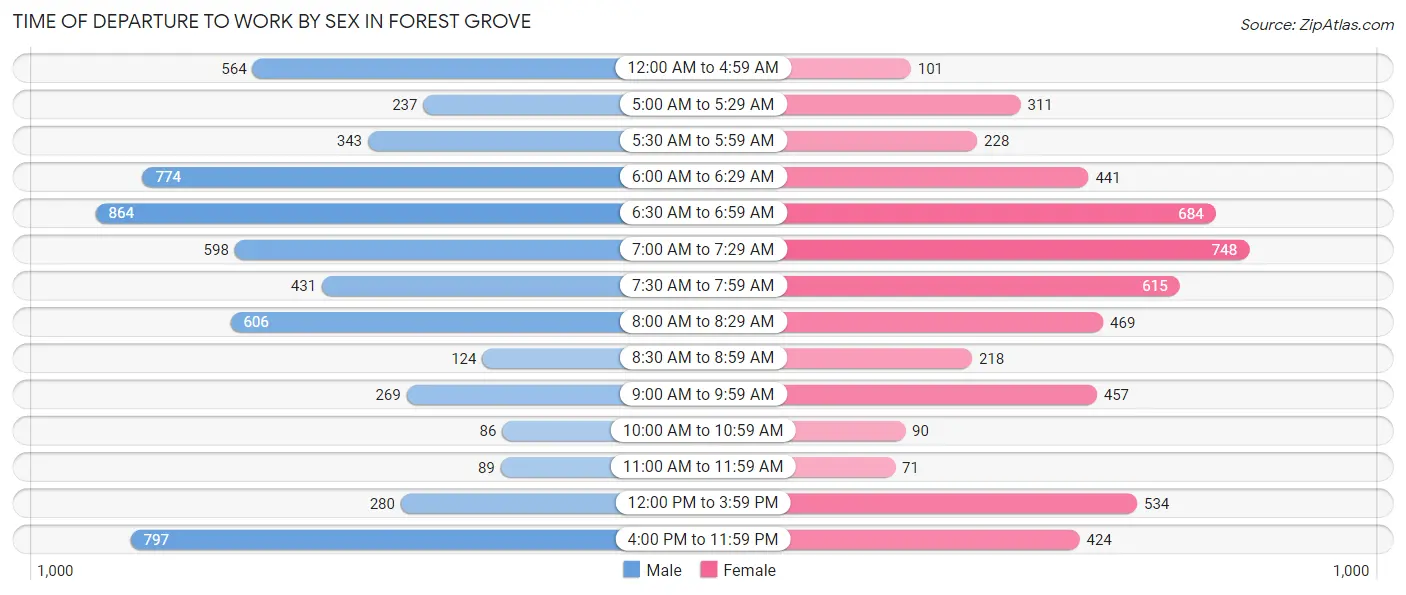
| Time of Departure | Male | Female |
| 12:00 AM to 4:59 AM | 564 (9.3%) | 101 (1.9%) |
| 5:00 AM to 5:29 AM | 237 (3.9%) | 311 (5.8%) |
| 5:30 AM to 5:59 AM | 343 (5.7%) | 228 (4.2%) |
| 6:00 AM to 6:29 AM | 774 (12.8%) | 441 (8.2%) |
| 6:30 AM to 6:59 AM | 864 (14.2%) | 684 (12.7%) |
| 7:00 AM to 7:29 AM | 598 (9.9%) | 748 (13.9%) |
| 7:30 AM to 7:59 AM | 431 (7.1%) | 615 (11.4%) |
| 8:00 AM to 8:29 AM | 606 (10.0%) | 469 (8.7%) |
| 8:30 AM to 8:59 AM | 124 (2.1%) | 218 (4.0%) |
| 9:00 AM to 9:59 AM | 269 (4.4%) | 457 (8.5%) |
| 10:00 AM to 10:59 AM | 86 (1.4%) | 90 (1.7%) |
| 11:00 AM to 11:59 AM | 89 (1.5%) | 71 (1.3%) |
| 12:00 PM to 3:59 PM | 280 (4.6%) | 534 (9.9%) |
| 4:00 PM to 11:59 PM | 797 (13.2%) | 424 (7.9%) |
| Total | 6,062 (100.0%) | 5,391 (100.0%) |
Housing Occupancy in Forest Grove
Occupancy by Ownership in Forest Grove
Of the total 9,103 dwellings in Forest Grove, owner-occupied units account for 5,666 (62.2%), while renter-occupied units make up 3,437 (37.8%).
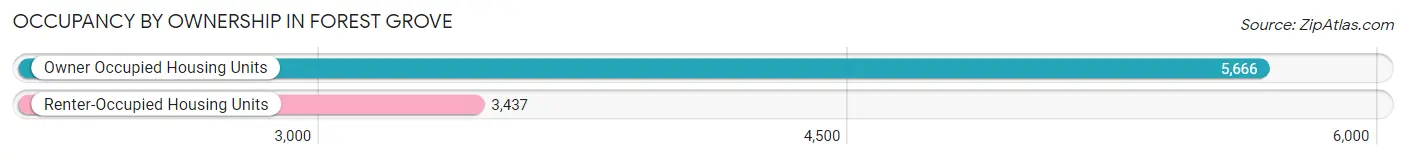
| Occupancy | # Housing Units | % Housing Units |
| Owner Occupied Housing Units | 5,666 | 62.2% |
| Renter-Occupied Housing Units | 3,437 | 37.8% |
| Total Occupied Housing Units | 9,103 | 100.0% |
Occupancy by Household Size in Forest Grove
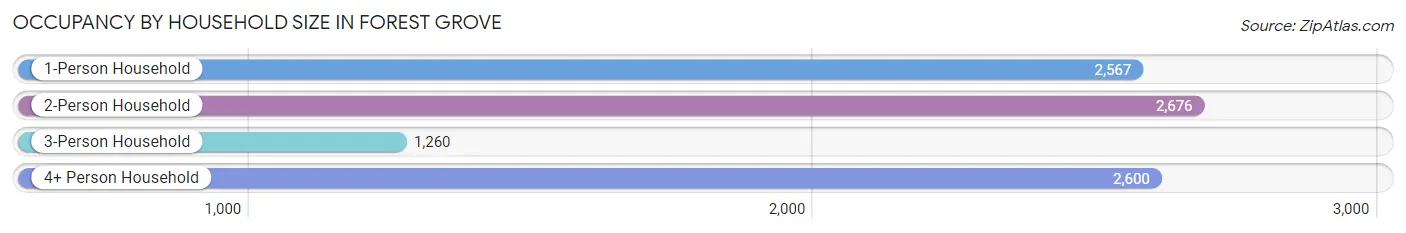
| Household Size | # Housing Units | % Housing Units |
| 1-Person Household | 2,567 | 28.2% |
| 2-Person Household | 2,676 | 29.4% |
| 3-Person Household | 1,260 | 13.8% |
| 4+ Person Household | 2,600 | 28.6% |
| Total Housing Units | 9,103 | 100.0% |
Occupancy by Ownership by Household Size in Forest Grove
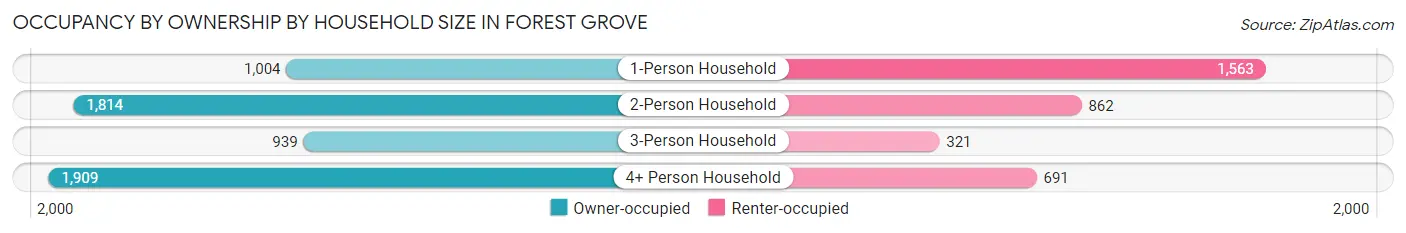
| Household Size | Owner-occupied | Renter-occupied |
| 1-Person Household | 1,004 (39.1%) | 1,563 (60.9%) |
| 2-Person Household | 1,814 (67.8%) | 862 (32.2%) |
| 3-Person Household | 939 (74.5%) | 321 (25.5%) |
| 4+ Person Household | 1,909 (73.4%) | 691 (26.6%) |
| Total Housing Units | 5,666 (62.2%) | 3,437 (37.8%) |
Occupancy by Educational Attainment in Forest Grove
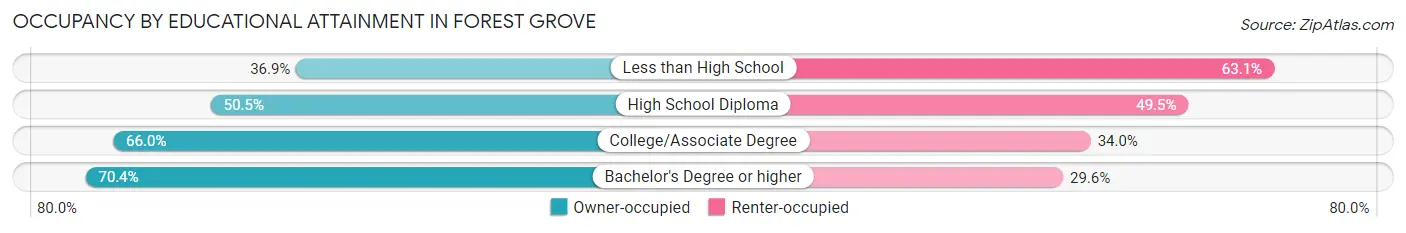
| Household Size | Owner-occupied | Renter-occupied |
| Less than High School | 329 (36.9%) | 562 (63.1%) |
| High School Diploma | 762 (50.5%) | 747 (49.5%) |
| College/Associate Degree | 2,121 (66.0%) | 1,094 (34.0%) |
| Bachelor's Degree or higher | 2,454 (70.4%) | 1,034 (29.6%) |
Occupancy by Age of Householder in Forest Grove
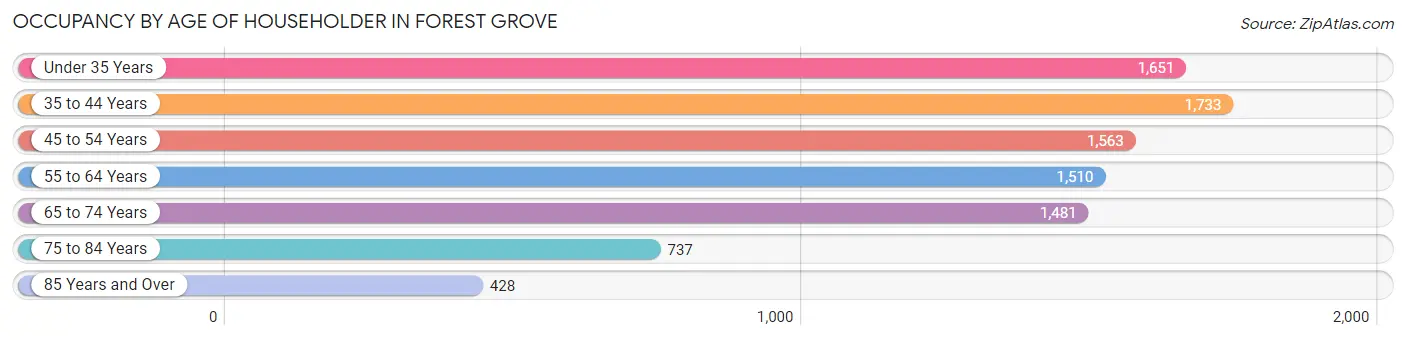
| Age Bracket | # Households | % Households |
| Under 35 Years | 1,651 | 18.1% |
| 35 to 44 Years | 1,733 | 19.0% |
| 45 to 54 Years | 1,563 | 17.2% |
| 55 to 64 Years | 1,510 | 16.6% |
| 65 to 74 Years | 1,481 | 16.3% |
| 75 to 84 Years | 737 | 8.1% |
| 85 Years and Over | 428 | 4.7% |
| Total | 9,103 | 100.0% |
Housing Finances in Forest Grove
Median Income by Occupancy in Forest Grove
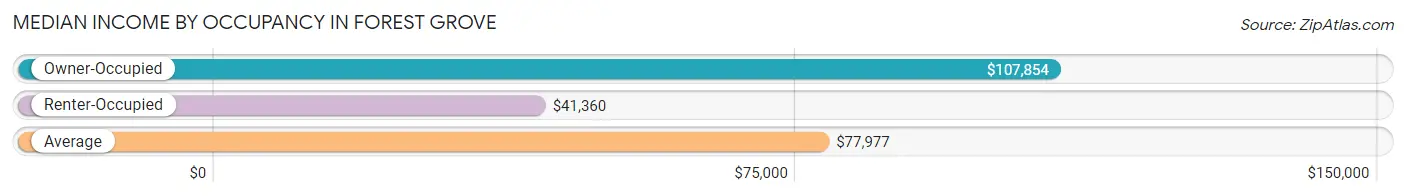
| Occupancy Type | # Households | Median Income |
| Owner-Occupied | 5,666 (62.2%) | $107,854 |
| Renter-Occupied | 3,437 (37.8%) | $41,360 |
| Average | 9,103 (100.0%) | $77,977 |
Occupancy by Householder Income Bracket in Forest Grove
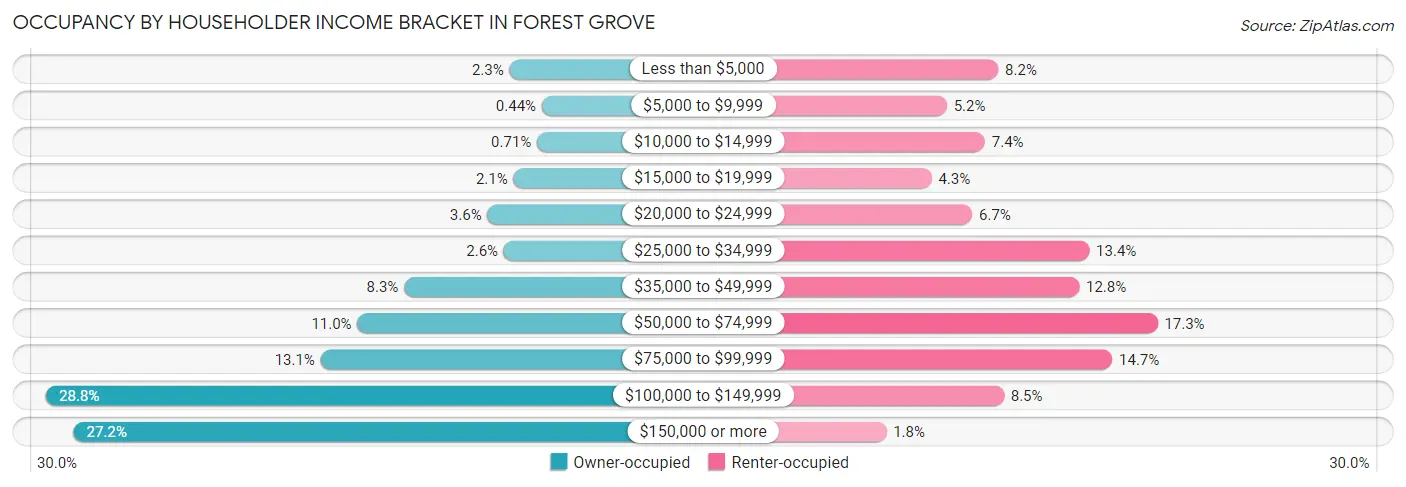
| Income Bracket | Owner-occupied | Renter-occupied |
| Less than $5,000 | 130 (2.3%) | 280 (8.2%) |
| $5,000 to $9,999 | 25 (0.4%) | 179 (5.2%) |
| $10,000 to $14,999 | 40 (0.7%) | 254 (7.4%) |
| $15,000 to $19,999 | 117 (2.1%) | 149 (4.3%) |
| $20,000 to $24,999 | 201 (3.5%) | 229 (6.7%) |
| $25,000 to $34,999 | 148 (2.6%) | 459 (13.4%) |
| $35,000 to $49,999 | 471 (8.3%) | 439 (12.8%) |
| $50,000 to $74,999 | 622 (11.0%) | 593 (17.2%) |
| $75,000 to $99,999 | 741 (13.1%) | 504 (14.7%) |
| $100,000 to $149,999 | 1,630 (28.8%) | 291 (8.5%) |
| $150,000 or more | 1,541 (27.2%) | 60 (1.8%) |
| Total | 5,666 (100.0%) | 3,437 (100.0%) |
Monthly Housing Cost Tiers in Forest Grove
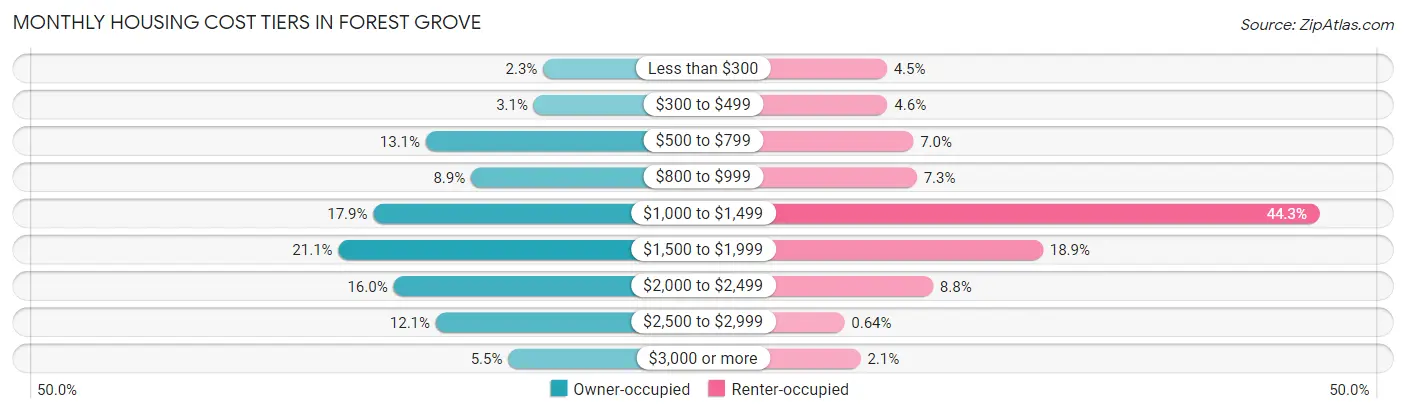
| Monthly Cost | Owner-occupied | Renter-occupied |
| Less than $300 | 128 (2.3%) | 156 (4.5%) |
| $300 to $499 | 177 (3.1%) | 158 (4.6%) |
| $500 to $799 | 740 (13.1%) | 240 (7.0%) |
| $800 to $999 | 504 (8.9%) | 251 (7.3%) |
| $1,000 to $1,499 | 1,014 (17.9%) | 1,523 (44.3%) |
| $1,500 to $1,999 | 1,196 (21.1%) | 650 (18.9%) |
| $2,000 to $2,499 | 909 (16.0%) | 302 (8.8%) |
| $2,500 to $2,999 | 688 (12.1%) | 22 (0.6%) |
| $3,000 or more | 310 (5.5%) | 73 (2.1%) |
| Total | 5,666 (100.0%) | 3,437 (100.0%) |
Physical Housing Characteristics in Forest Grove
Housing Structures in Forest Grove
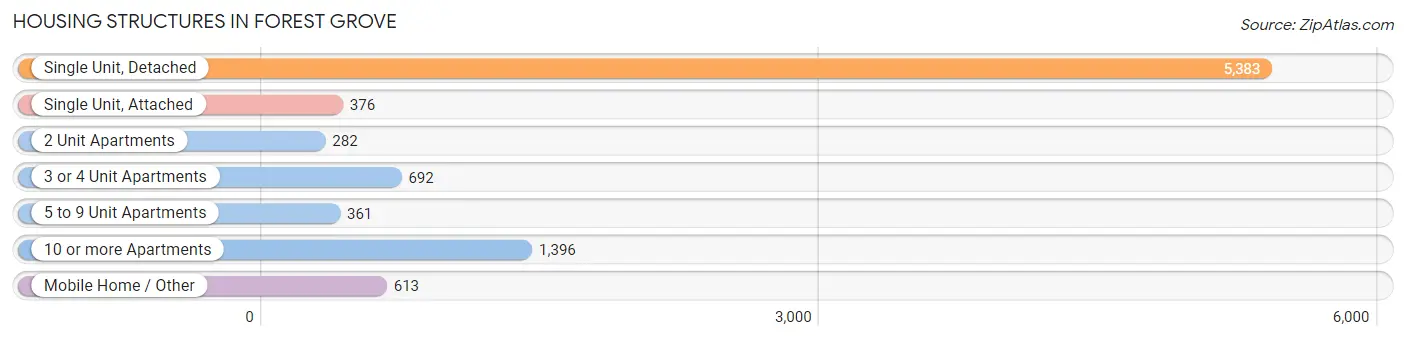
| Structure Type | # Housing Units | % Housing Units |
| Single Unit, Detached | 5,383 | 59.1% |
| Single Unit, Attached | 376 | 4.1% |
| 2 Unit Apartments | 282 | 3.1% |
| 3 or 4 Unit Apartments | 692 | 7.6% |
| 5 to 9 Unit Apartments | 361 | 4.0% |
| 10 or more Apartments | 1,396 | 15.3% |
| Mobile Home / Other | 613 | 6.7% |
| Total | 9,103 | 100.0% |
Housing Structures by Occupancy in Forest Grove
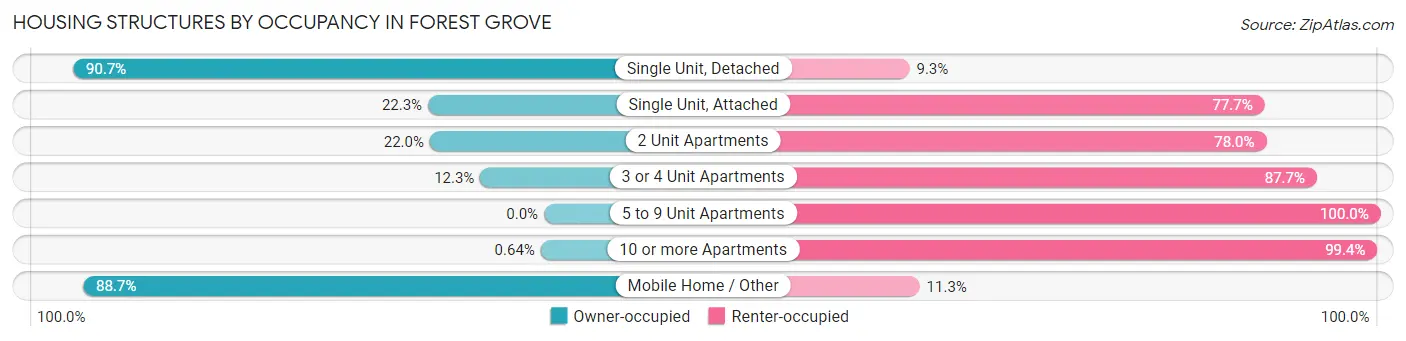
| Structure Type | Owner-occupied | Renter-occupied |
| Single Unit, Detached | 4,882 (90.7%) | 501 (9.3%) |
| Single Unit, Attached | 84 (22.3%) | 292 (77.7%) |
| 2 Unit Apartments | 62 (22.0%) | 220 (78.0%) |
| 3 or 4 Unit Apartments | 85 (12.3%) | 607 (87.7%) |
| 5 to 9 Unit Apartments | 0 (0.0%) | 361 (100.0%) |
| 10 or more Apartments | 9 (0.6%) | 1,387 (99.4%) |
| Mobile Home / Other | 544 (88.7%) | 69 (11.3%) |
| Total | 5,666 (62.2%) | 3,437 (37.8%) |
Housing Structures by Number of Rooms in Forest Grove
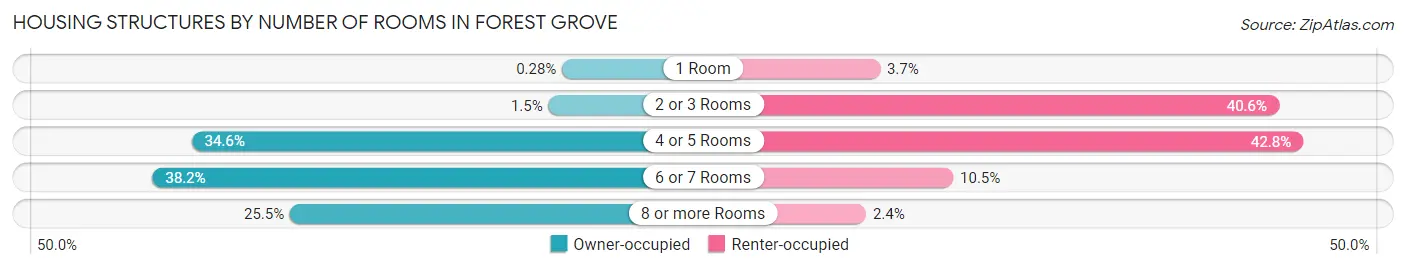
| Number of Rooms | Owner-occupied | Renter-occupied |
| 1 Room | 16 (0.3%) | 127 (3.7%) |
| 2 or 3 Rooms | 87 (1.5%) | 1,395 (40.6%) |
| 4 or 5 Rooms | 1,958 (34.6%) | 1,472 (42.8%) |
| 6 or 7 Rooms | 2,163 (38.2%) | 360 (10.5%) |
| 8 or more Rooms | 1,442 (25.5%) | 83 (2.4%) |
| Total | 5,666 (100.0%) | 3,437 (100.0%) |
Housing Structure by Heating Type in Forest Grove
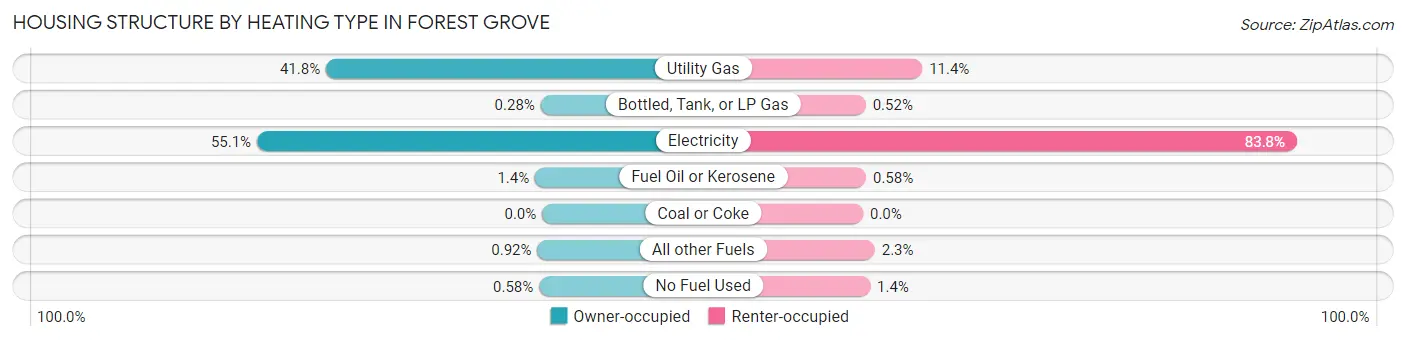
| Heating Type | Owner-occupied | Renter-occupied |
| Utility Gas | 2,366 (41.8%) | 393 (11.4%) |
| Bottled, Tank, or LP Gas | 16 (0.3%) | 18 (0.5%) |
| Electricity | 3,122 (55.1%) | 2,881 (83.8%) |
| Fuel Oil or Kerosene | 77 (1.4%) | 20 (0.6%) |
| Coal or Coke | 0 (0.0%) | 0 (0.0%) |
| All other Fuels | 52 (0.9%) | 78 (2.3%) |
| No Fuel Used | 33 (0.6%) | 47 (1.4%) |
| Total | 5,666 (100.0%) | 3,437 (100.0%) |
Household Vehicle Usage in Forest Grove
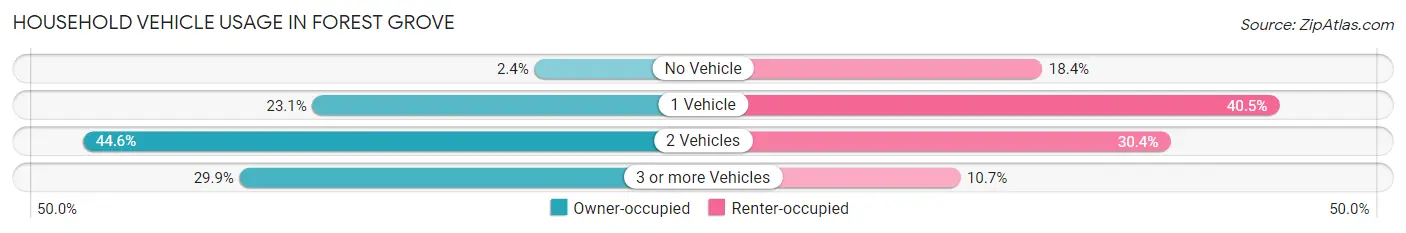
| Vehicles per Household | Owner-occupied | Renter-occupied |
| No Vehicle | 136 (2.4%) | 632 (18.4%) |
| 1 Vehicle | 1,310 (23.1%) | 1,393 (40.5%) |
| 2 Vehicles | 2,525 (44.6%) | 1,043 (30.3%) |
| 3 or more Vehicles | 1,695 (29.9%) | 369 (10.7%) |
| Total | 5,666 (100.0%) | 3,437 (100.0%) |
Real Estate & Mortgages in Forest Grove
Real Estate and Mortgage Overview in Forest Grove
| Characteristic | Without Mortgage | With Mortgage |
| Housing Units | 1,819 | 3,847 |
| Median Property Value | $424,100 | $446,000 |
| Median Household Income | $93,934 | $1,109 |
| Monthly Housing Costs | $751 | $310 |
| Real Estate Taxes | $3,769 | $43 |
Property Value by Mortgage Status in Forest Grove
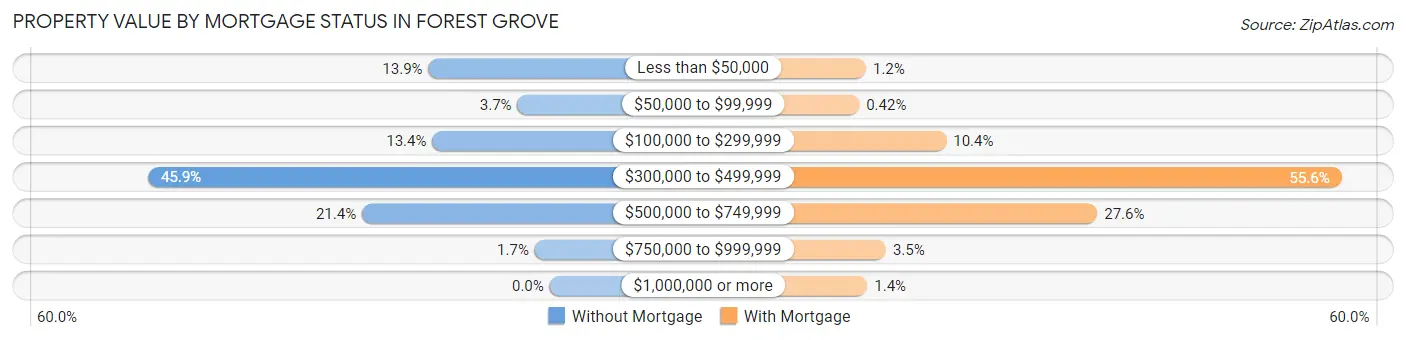
| Property Value | Without Mortgage | With Mortgage |
| Less than $50,000 | 252 (13.9%) | 46 (1.2%) |
| $50,000 to $99,999 | 67 (3.7%) | 16 (0.4%) |
| $100,000 to $299,999 | 244 (13.4%) | 399 (10.4%) |
| $300,000 to $499,999 | 835 (45.9%) | 2,137 (55.5%) |
| $500,000 to $749,999 | 390 (21.4%) | 1,063 (27.6%) |
| $750,000 to $999,999 | 31 (1.7%) | 134 (3.5%) |
| $1,000,000 or more | 0 (0.0%) | 52 (1.3%) |
| Total | 1,819 (100.0%) | 3,847 (100.0%) |
Household Income by Mortgage Status in Forest Grove
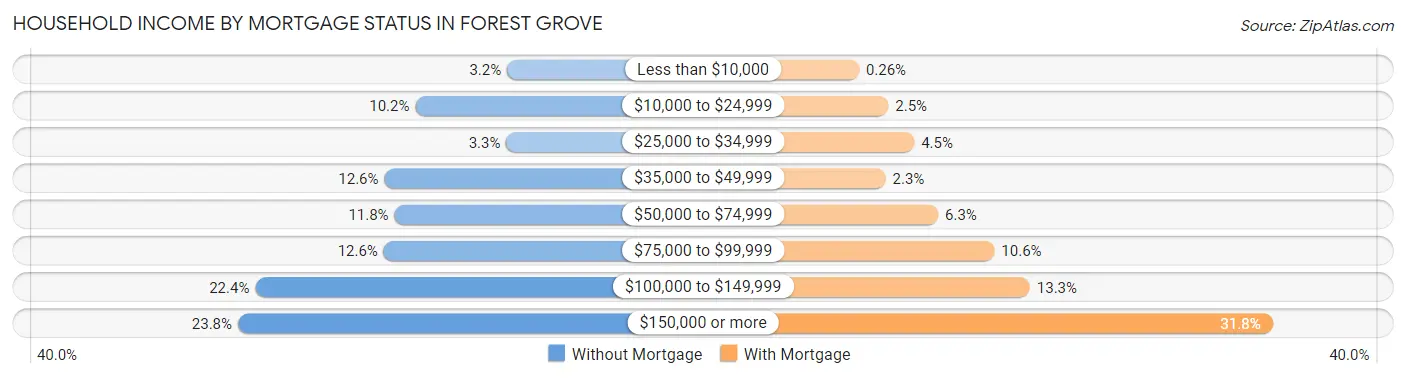
| Household Income | Without Mortgage | With Mortgage |
| Less than $10,000 | 59 (3.2%) | 10 (0.3%) |
| $10,000 to $24,999 | 186 (10.2%) | 96 (2.5%) |
| $25,000 to $34,999 | 60 (3.3%) | 172 (4.5%) |
| $35,000 to $49,999 | 229 (12.6%) | 88 (2.3%) |
| $50,000 to $74,999 | 215 (11.8%) | 242 (6.3%) |
| $75,000 to $99,999 | 230 (12.6%) | 407 (10.6%) |
| $100,000 to $149,999 | 408 (22.4%) | 511 (13.3%) |
| $150,000 or more | 432 (23.7%) | 1,222 (31.8%) |
| Total | 1,819 (100.0%) | 3,847 (100.0%) |
Property Value to Household Income Ratio in Forest Grove
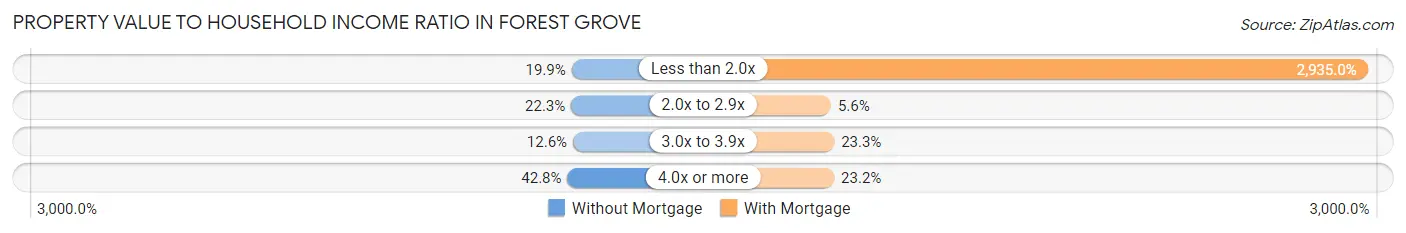
| Value-to-Income Ratio | Without Mortgage | With Mortgage |
| Less than 2.0x | 362 (19.9%) | 112,910 (2,935.0%) |
| 2.0x to 2.9x | 405 (22.3%) | 215 (5.6%) |
| 3.0x to 3.9x | 229 (12.6%) | 896 (23.3%) |
| 4.0x or more | 779 (42.8%) | 891 (23.2%) |
| Total | 1,819 (100.0%) | 3,847 (100.0%) |
Real Estate Taxes by Mortgage Status in Forest Grove
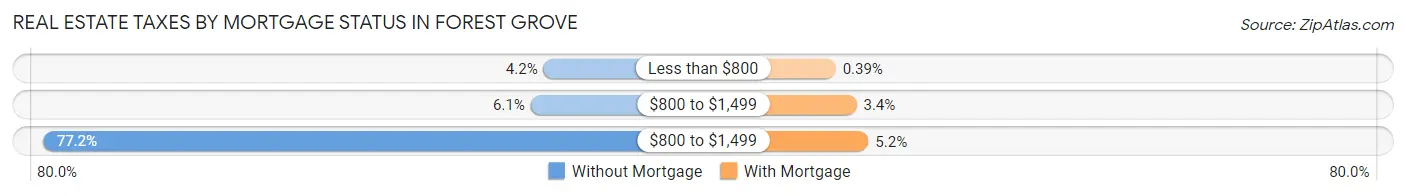
| Property Taxes | Without Mortgage | With Mortgage |
| Less than $800 | 76 (4.2%) | 15 (0.4%) |
| $800 to $1,499 | 110 (6.0%) | 132 (3.4%) |
| $800 to $1,499 | 1,404 (77.2%) | 199 (5.2%) |
| Total | 1,819 (100.0%) | 3,847 (100.0%) |
Health & Disability in Forest Grove
Health Insurance Coverage by Age in Forest Grove
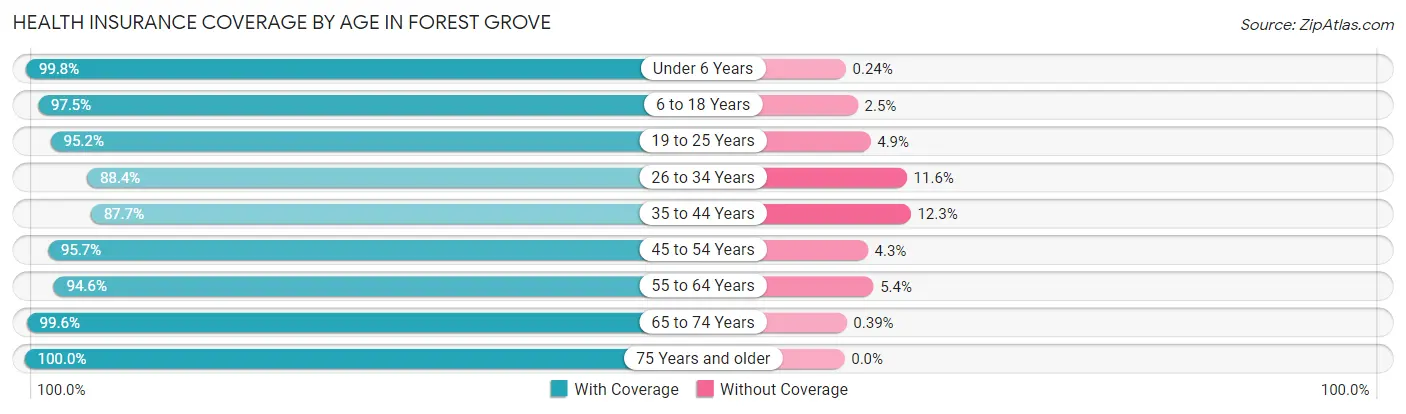
| Age Bracket | With Coverage | Without Coverage |
| Under 6 Years | 2,060 (99.8%) | 5 (0.2%) |
| 6 to 18 Years | 4,756 (97.5%) | 121 (2.5%) |
| 19 to 25 Years | 2,999 (95.2%) | 153 (4.9%) |
| 26 to 34 Years | 2,507 (88.4%) | 330 (11.6%) |
| 35 to 44 Years | 2,984 (87.7%) | 420 (12.3%) |
| 45 to 54 Years | 2,775 (95.7%) | 126 (4.3%) |
| 55 to 64 Years | 2,715 (94.6%) | 155 (5.4%) |
| 65 to 74 Years | 2,287 (99.6%) | 9 (0.4%) |
| 75 Years and older | 1,602 (100.0%) | 0 (0.0%) |
| Total | 24,685 (94.9%) | 1,319 (5.1%) |
Health Insurance Coverage by Citizenship Status in Forest Grove
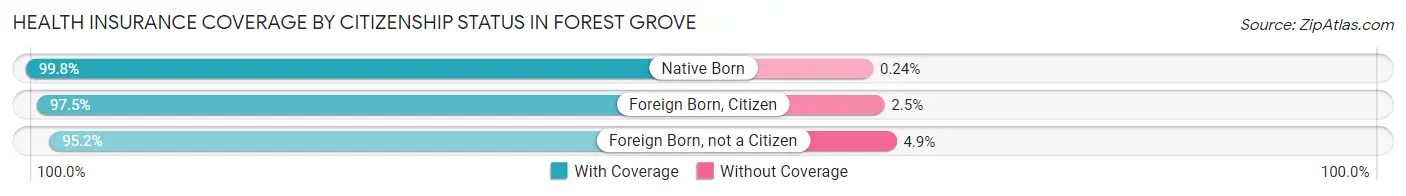
| Citizenship Status | With Coverage | Without Coverage |
| Native Born | 2,060 (99.8%) | 5 (0.2%) |
| Foreign Born, Citizen | 4,756 (97.5%) | 121 (2.5%) |
| Foreign Born, not a Citizen | 2,999 (95.2%) | 153 (4.9%) |
Health Insurance Coverage by Household Income in Forest Grove
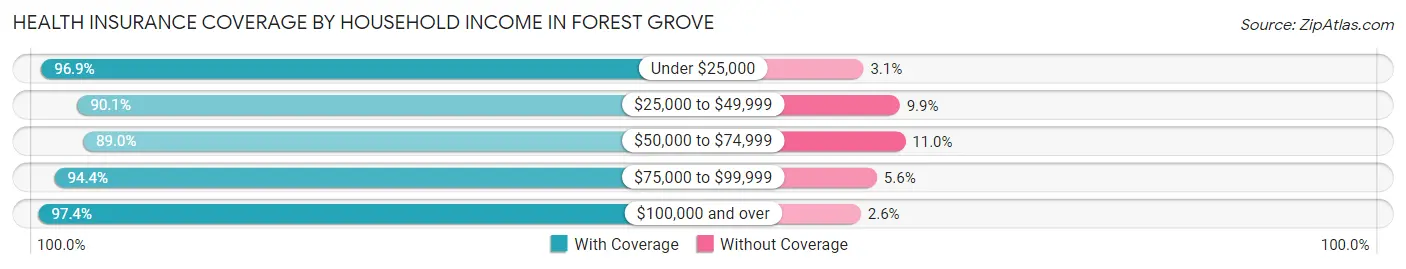
| Household Income | With Coverage | Without Coverage |
| Under $25,000 | 2,848 (96.9%) | 92 (3.1%) |
| $25,000 to $49,999 | 2,623 (90.1%) | 289 (9.9%) |
| $50,000 to $74,999 | 3,329 (89.0%) | 410 (11.0%) |
| $75,000 to $99,999 | 3,579 (94.4%) | 214 (5.6%) |
| $100,000 and over | 11,258 (97.4%) | 304 (2.6%) |
Public vs Private Health Insurance Coverage by Age in Forest Grove
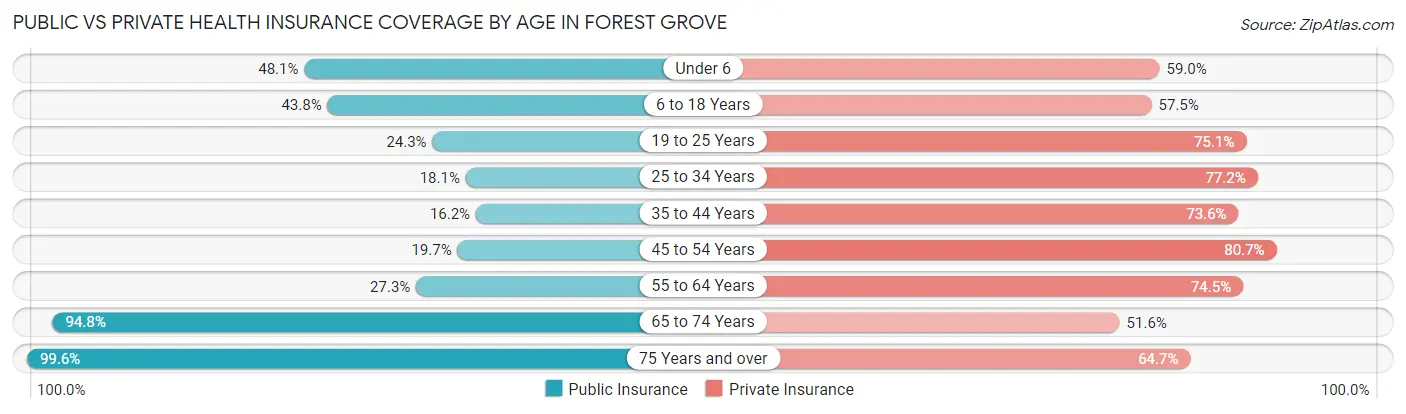
| Age Bracket | Public Insurance | Private Insurance |
| Under 6 | 993 (48.1%) | 1,218 (59.0%) |
| 6 to 18 Years | 2,135 (43.8%) | 2,804 (57.5%) |
| 19 to 25 Years | 766 (24.3%) | 2,366 (75.1%) |
| 25 to 34 Years | 514 (18.1%) | 2,189 (77.2%) |
| 35 to 44 Years | 552 (16.2%) | 2,506 (73.6%) |
| 45 to 54 Years | 570 (19.7%) | 2,340 (80.7%) |
| 55 to 64 Years | 784 (27.3%) | 2,137 (74.5%) |
| 65 to 74 Years | 2,177 (94.8%) | 1,184 (51.6%) |
| 75 Years and over | 1,595 (99.6%) | 1,036 (64.7%) |
| Total | 10,086 (38.8%) | 17,780 (68.4%) |
Disability Status by Sex by Age in Forest Grove
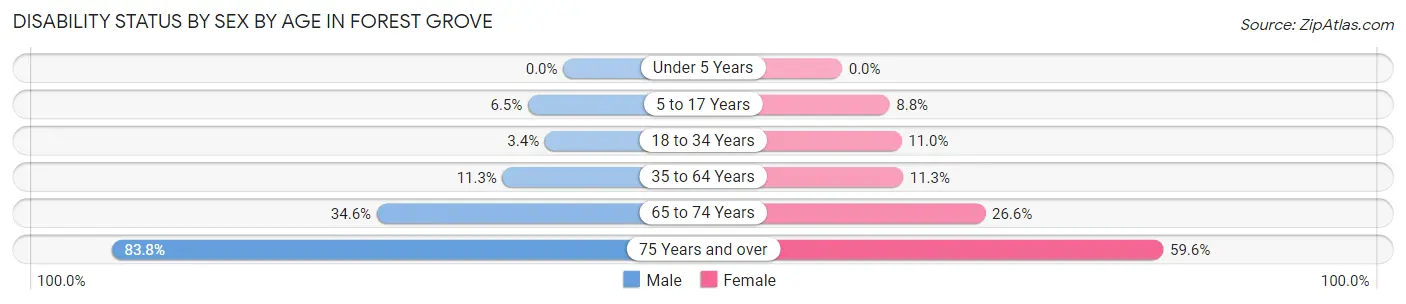
| Age Bracket | Male | Female |
| Under 5 Years | 0 (0.0%) | 0 (0.0%) |
| 5 to 17 Years | 145 (6.5%) | 211 (8.8%) |
| 18 to 34 Years | 113 (3.4%) | 374 (11.0%) |
| 35 to 64 Years | 485 (11.3%) | 551 (11.3%) |
| 65 to 74 Years | 326 (34.6%) | 360 (26.6%) |
| 75 Years and over | 664 (83.8%) | 483 (59.6%) |
Disability Class by Sex by Age in Forest Grove
Disability Class: Hearing Difficulty
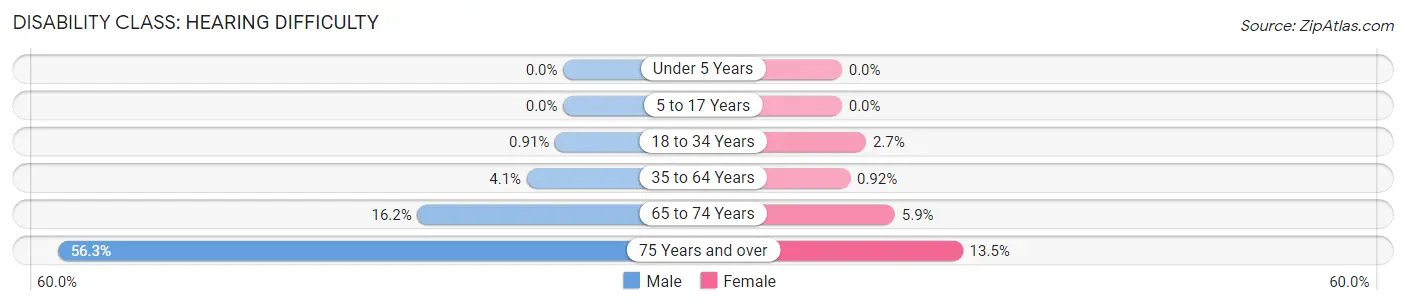
| Age Bracket | Male | Female |
| Under 5 Years | 0 (0.0%) | 0 (0.0%) |
| 5 to 17 Years | 0 (0.0%) | 0 (0.0%) |
| 18 to 34 Years | 30 (0.9%) | 91 (2.7%) |
| 35 to 64 Years | 175 (4.1%) | 45 (0.9%) |
| 65 to 74 Years | 153 (16.2%) | 80 (5.9%) |
| 75 Years and over | 446 (56.3%) | 109 (13.5%) |
Disability Class: Vision Difficulty
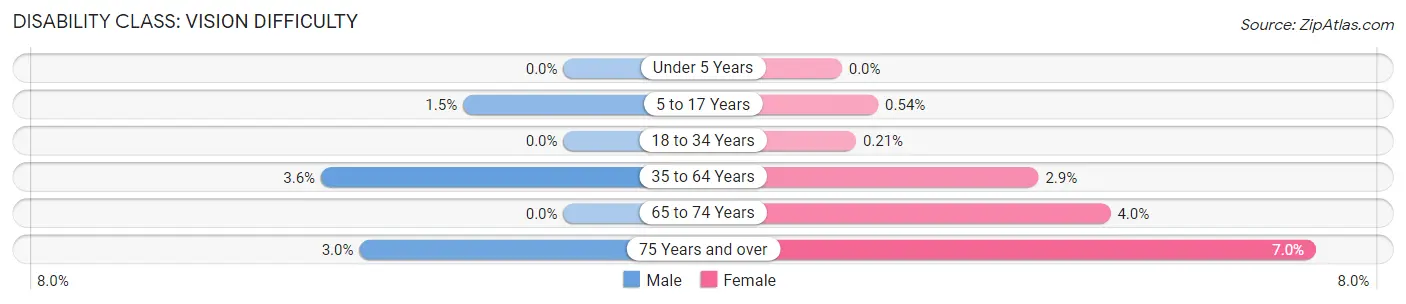
| Age Bracket | Male | Female |
| Under 5 Years | 0 (0.0%) | 0 (0.0%) |
| 5 to 17 Years | 33 (1.5%) | 13 (0.5%) |
| 18 to 34 Years | 0 (0.0%) | 7 (0.2%) |
| 35 to 64 Years | 155 (3.6%) | 142 (2.9%) |
| 65 to 74 Years | 0 (0.0%) | 54 (4.0%) |
| 75 Years and over | 24 (3.0%) | 57 (7.0%) |
Disability Class: Cognitive Difficulty
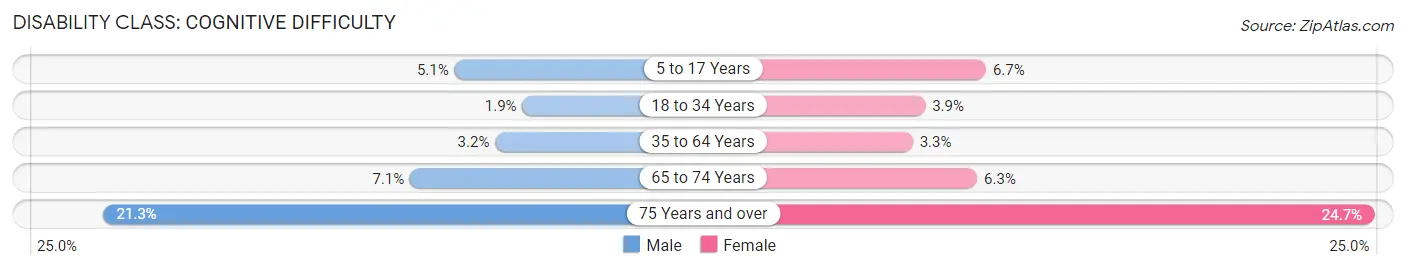
| Age Bracket | Male | Female |
| 5 to 17 Years | 112 (5.1%) | 160 (6.7%) |
| 18 to 34 Years | 63 (1.9%) | 131 (3.9%) |
| 35 to 64 Years | 136 (3.2%) | 160 (3.3%) |
| 65 to 74 Years | 67 (7.1%) | 85 (6.3%) |
| 75 Years and over | 169 (21.3%) | 200 (24.7%) |
Disability Class: Ambulatory Difficulty
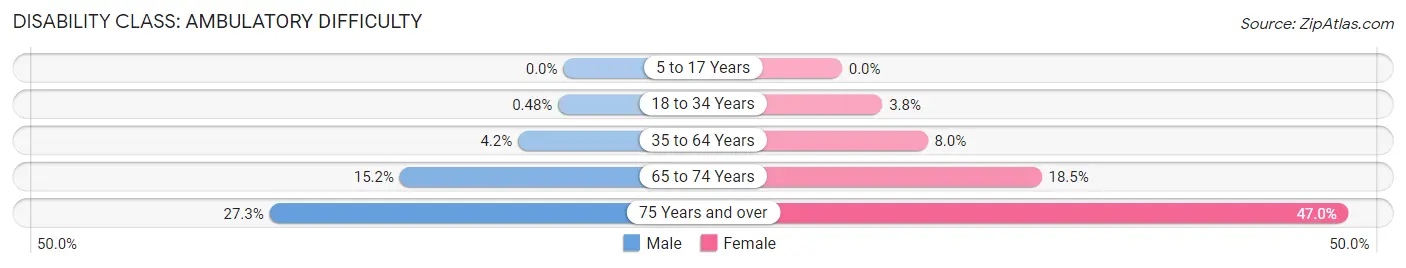
| Age Bracket | Male | Female |
| 5 to 17 Years | 0 (0.0%) | 0 (0.0%) |
| 18 to 34 Years | 16 (0.5%) | 127 (3.7%) |
| 35 to 64 Years | 181 (4.2%) | 387 (8.0%) |
| 65 to 74 Years | 143 (15.2%) | 251 (18.5%) |
| 75 Years and over | 216 (27.3%) | 381 (47.0%) |
Disability Class: Self-Care Difficulty
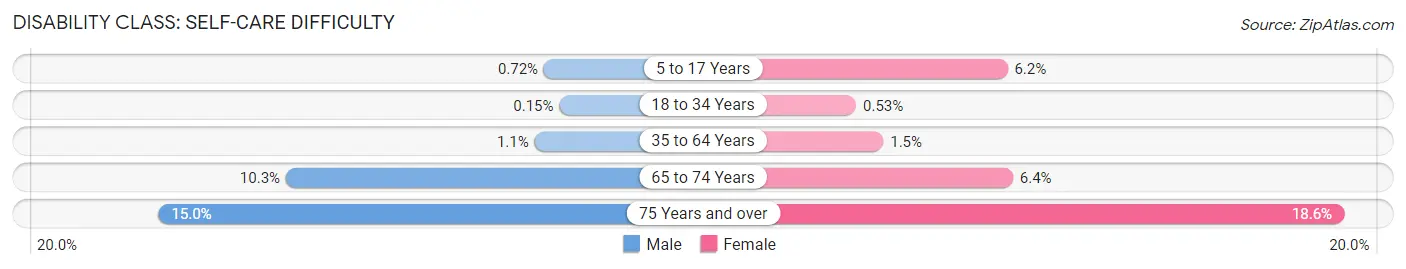
| Age Bracket | Male | Female |
| 5 to 17 Years | 16 (0.7%) | 147 (6.1%) |
| 18 to 34 Years | 5 (0.2%) | 18 (0.5%) |
| 35 to 64 Years | 46 (1.1%) | 75 (1.5%) |
| 65 to 74 Years | 97 (10.3%) | 86 (6.4%) |
| 75 Years and over | 119 (15.0%) | 151 (18.6%) |
Technology Access in Forest Grove
Computing Device Access in Forest Grove
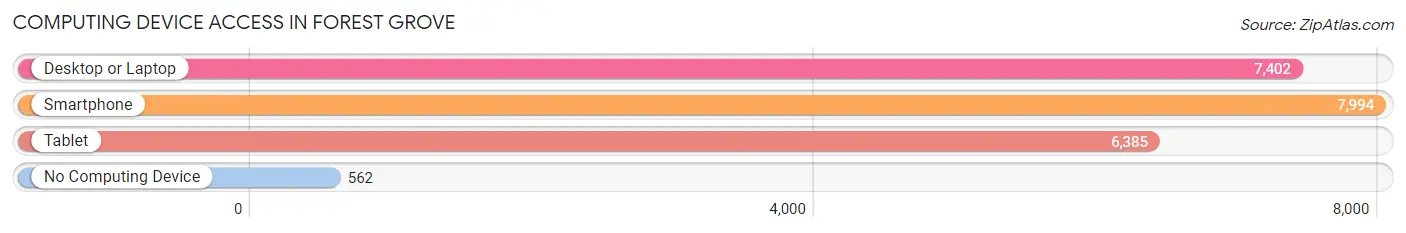
| Device Type | # Households | % Households |
| Desktop or Laptop | 7,402 | 81.3% |
| Smartphone | 7,994 | 87.8% |
| Tablet | 6,385 | 70.1% |
| No Computing Device | 562 | 6.2% |
| Total | 9,103 | 100.0% |
Internet Access in Forest Grove
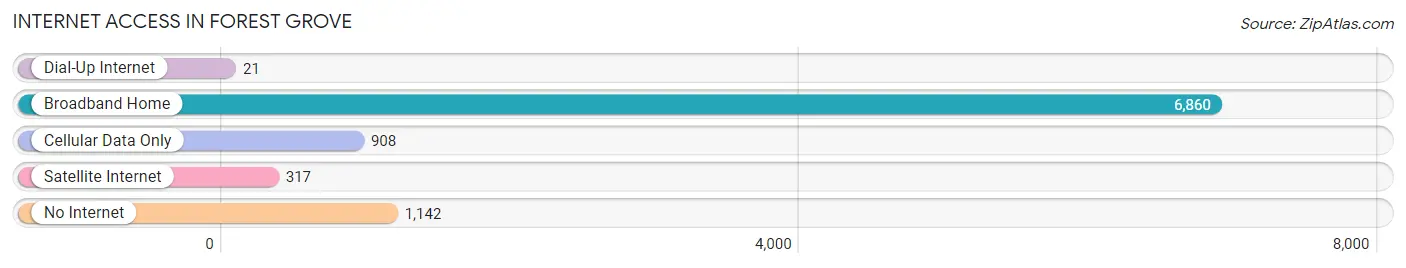
| Internet Type | # Households | % Households |
| Dial-Up Internet | 21 | 0.2% |
| Broadband Home | 6,860 | 75.4% |
| Cellular Data Only | 908 | 10.0% |
| Satellite Internet | 317 | 3.5% |
| No Internet | 1,142 | 12.6% |
| Total | 9,103 | 100.0% |
Forest Grove Summary
History
The history of Forest Grove, Oregon dates back to the mid-1800s when the first settlers arrived in the area. The first settlers were primarily of German and English descent, and they established the first farms in the area. The town was officially founded in 1851 and was named after the nearby grove of trees. The town quickly grew and by the late 1800s, it had become a thriving agricultural community.
The town was also home to a number of industries, including a sawmill, a flour mill, and a brickyard. The town was also home to a number of churches, including the First Presbyterian Church, which was founded in 1853.
In the early 1900s, the town began to experience a period of growth and development. The town was home to a number of businesses, including a bank, a hotel, and a number of stores. The town also had a number of schools, including a high school, which opened in 1910.
In the 1950s, the town began to experience a period of decline. The sawmill and flour mill closed, and the brickyard moved away. The town also experienced a population decline, as many of the town’s residents moved away to larger cities.
In the late 1970s, the town began to experience a period of revitalization. The town was home to a number of new businesses, including a winery, a brewery, and a number of restaurants. The town also experienced a population increase, as many of the town’s former residents returned to the area.
Today, Forest Grove is a thriving community with a population of over 21,000. The town is home to a number of businesses, including a number of restaurants, shops, and other businesses. The town is also home to a number of parks, including the Forest Grove City Park, which is home to a number of recreational activities.
Geography
Forest Grove is located in Washington County, Oregon, in the Tualatin Valley. The town is situated on the banks of the Tualatin River, and is located approximately 25 miles west of Portland. The town is located at an elevation of approximately 500 feet above sea level.
The town is located in a temperate climate, with warm summers and mild winters. The average annual temperature is approximately 50 degrees Fahrenheit. The town receives an average of approximately 40 inches of precipitation per year.
The town is located in a rural area, and is surrounded by a number of small towns and villages. The town is also located near a number of recreational areas, including the Tualatin National Wildlife Refuge and the Willamette National Forest.
Economy
The economy of Forest Grove is primarily based on agriculture and tourism. The town is home to a number of farms, which produce a variety of crops, including wheat, corn, and hay. The town is also home to a number of wineries, breweries, and other businesses related to the production of alcoholic beverages.
The town is also home to a number of businesses related to tourism, including hotels, restaurants, and other businesses related to the hospitality industry. The town is also home to a number of retail stores, including a number of antique stores.
Demographics
As of the 2010 census, the population of Forest Grove was 21,083. The town has a population density of approximately 1,400 people per square mile. The town is approximately 79% white, 8% Hispanic, 5% Asian, and 4% African American. The median household income in the town is approximately $50,000. The median age in the town is approximately 38 years old.
Common Questions
What is Per Capita Income in Forest Grove?
Per Capita income in Forest Grove is $33,147.
What is the Median Family Income in Forest Grove?
Median Family Income in Forest Grove is $101,408.
What is the Median Household income in Forest Grove?
Median Household Income in Forest Grove is $77,977.
What is Income or Wage Gap in Forest Grove?
Income or Wage Gap in Forest Grove is 34.6%.
Women in Forest Grove earn 65.4 cents for every dollar earned by a man.
What is Family Income Deficit in Forest Grove?
Family Income Deficit in Forest Grove is $9,681.
Families that are below poverty line in Forest Grove earn $9,681 less on average than the poverty threshold level.
What is Inequality or Gini Index in Forest Grove?
Inequality or Gini Index in Forest Grove is 0.42.
What is the Total Population of Forest Grove?
Total Population of Forest Grove is 26,160.
What is the Total Male Population of Forest Grove?
Total Male Population of Forest Grove is 12,385.
What is the Total Female Population of Forest Grove?
Total Female Population of Forest Grove is 13,775.
What is the Ratio of Males per 100 Females in Forest Grove?
There are 89.91 Males per 100 Females in Forest Grove.
What is the Ratio of Females per 100 Males in Forest Grove?
There are 111.22 Females per 100 Males in Forest Grove.
What is the Median Population Age in Forest Grove?
Median Population Age in Forest Grove is 35.4 Years.
What is the Average Family Size in Forest Grove
Average Family Size in Forest Grove is 3.4 People.
What is the Average Household Size in Forest Grove
Average Household Size in Forest Grove is 2.7 People.
How Large is the Labor Force in Forest Grove?
There are 13,373 People in the Labor Forcein in Forest Grove.
What is the Percentage of People in the Labor Force in Forest Grove?
64.0% of People are in the Labor Force in Forest Grove.
What is the Unemployment Rate in Forest Grove?
Unemployment Rate in Forest Grove is 4.3%.