Newberg, OR Map & Demographics
Newberg Map
Newberg Overview
$38,099
PER CAPITA INCOME
$104,399
AVG FAMILY INCOME
$87,873
AVG HOUSEHOLD INCOME
50.6%
WAGE / INCOME GAP [ % ]
49.4¢/ $1
WAGE / INCOME GAP [ $ ]
$8,571
FAMILY INCOME DEFICIT
0.39
INEQUALITY / GINI INDEX
25,379
TOTAL POPULATION
12,319
MALE POPULATION
13,060
FEMALE POPULATION
94.33
MALES / 100 FEMALES
106.02
FEMALES / 100 MALES
34.2
MEDIAN AGE
3.0
AVG FAMILY SIZE
2.6
AVG HOUSEHOLD SIZE
13,920
LABOR FORCE [ PEOPLE ]
68.3%
PERCENT IN LABOR FORCE
3.3%
UNEMPLOYMENT RATE
Newberg Zip Codes
Income in Newberg
Income Overview in Newberg
Per Capita Income in Newberg is $38,099, while median incomes of families and households are $104,399 and $87,873 respectively.
| Characteristic | Number | Measure |
| Per Capita Income | 25,379 | $38,099 |
| Median Family Income | 6,355 | $104,399 |
| Mean Family Income | 6,355 | $116,489 |
| Median Household Income | 9,210 | $87,873 |
| Mean Household Income | 9,210 | $100,181 |
| Income Deficit | 6,355 | $8,571 |
| Wage / Income Gap (%) | 25,379 | 50.57% |
| Wage / Income Gap ($) | 25,379 | 49.43¢ per $1 |
| Gini / Inequality Index | 25,379 | 0.39 |
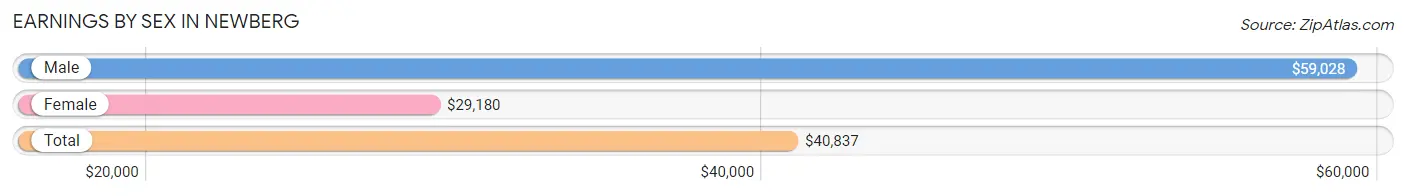
Earnings by Sex in Newberg
Average Earnings in Newberg are $40,837, $59,028 for men and $29,180 for women, a difference of 50.6%.
| Sex | Number | Average Earnings |
| Male | 7,804 (52.8%) | $59,028 |
| Female | 6,979 (47.2%) | $29,180 |
| Total | 14,783 (100.0%) | $40,837 |
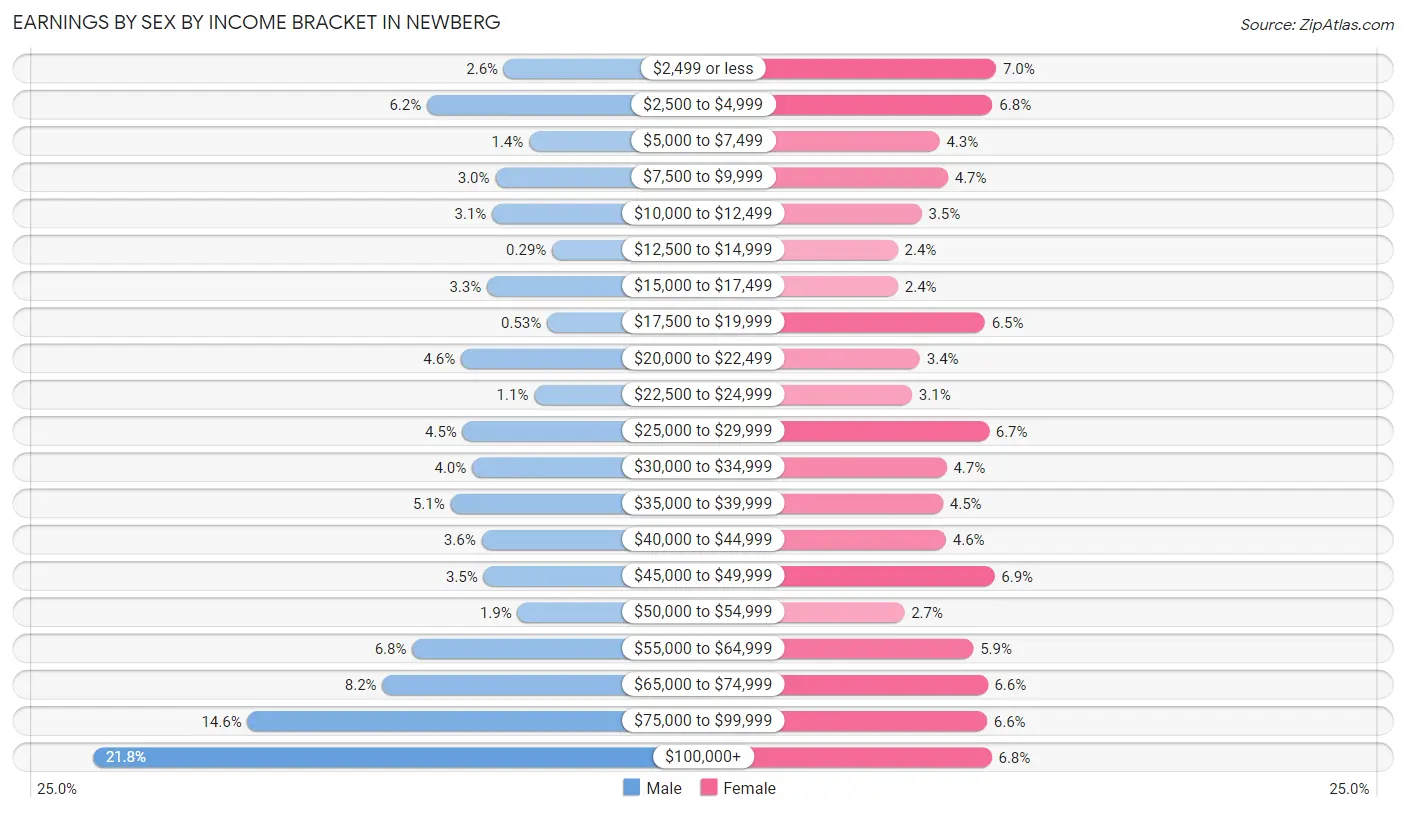
Earnings by Sex by Income Bracket in Newberg
The most common earnings brackets in Newberg are $100,000+ for men (1,702 | 21.8%) and $2,499 or less for women (488 | 7.0%).
| Income | Male | Female |
| $2,499 or less | 199 (2.5%) | 488 (7.0%) |
| $2,500 to $4,999 | 480 (6.1%) | 476 (6.8%) |
| $5,000 to $7,499 | 107 (1.4%) | 303 (4.3%) |
| $7,500 to $9,999 | 230 (2.9%) | 330 (4.7%) |
| $10,000 to $12,499 | 242 (3.1%) | 244 (3.5%) |
| $12,500 to $14,999 | 23 (0.3%) | 166 (2.4%) |
| $15,000 to $17,499 | 261 (3.3%) | 167 (2.4%) |
| $17,500 to $19,999 | 41 (0.5%) | 451 (6.5%) |
| $20,000 to $22,499 | 356 (4.6%) | 239 (3.4%) |
| $22,500 to $24,999 | 88 (1.1%) | 213 (3.0%) |
| $25,000 to $29,999 | 350 (4.5%) | 464 (6.7%) |
| $30,000 to $34,999 | 315 (4.0%) | 326 (4.7%) |
| $35,000 to $39,999 | 394 (5.1%) | 314 (4.5%) |
| $40,000 to $44,999 | 281 (3.6%) | 324 (4.6%) |
| $45,000 to $49,999 | 273 (3.5%) | 482 (6.9%) |
| $50,000 to $54,999 | 149 (1.9%) | 188 (2.7%) |
| $55,000 to $64,999 | 534 (6.8%) | 413 (5.9%) |
| $65,000 to $74,999 | 643 (8.2%) | 460 (6.6%) |
| $75,000 to $99,999 | 1,136 (14.6%) | 458 (6.6%) |
| $100,000+ | 1,702 (21.8%) | 473 (6.8%) |
| Total | 7,804 (100.0%) | 6,979 (100.0%) |
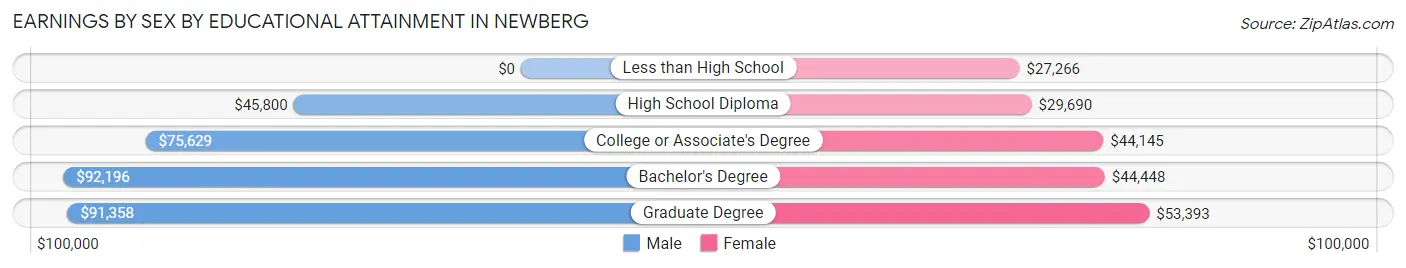
Earnings by Sex by Educational Attainment in Newberg
Average earnings in Newberg are $70,092 for men and $40,377 for women, a difference of 42.4%. Men with an educational attainment of bachelor's degree enjoy the highest average annual earnings of $92,196, while those with high school diploma education earn the least with $45,800. Women with an educational attainment of graduate degree earn the most with the average annual earnings of $53,393, while those with less than high school education have the smallest earnings of $27,266.
| Educational Attainment | Male Income | Female Income |
| Less than High School | - | - |
| High School Diploma | $45,800 | $29,690 |
| College or Associate's Degree | $75,629 | $44,145 |
| Bachelor's Degree | $92,196 | $44,448 |
| Graduate Degree | $91,358 | $53,393 |
| Total | $70,092 | $40,377 |
Family Income in Newberg
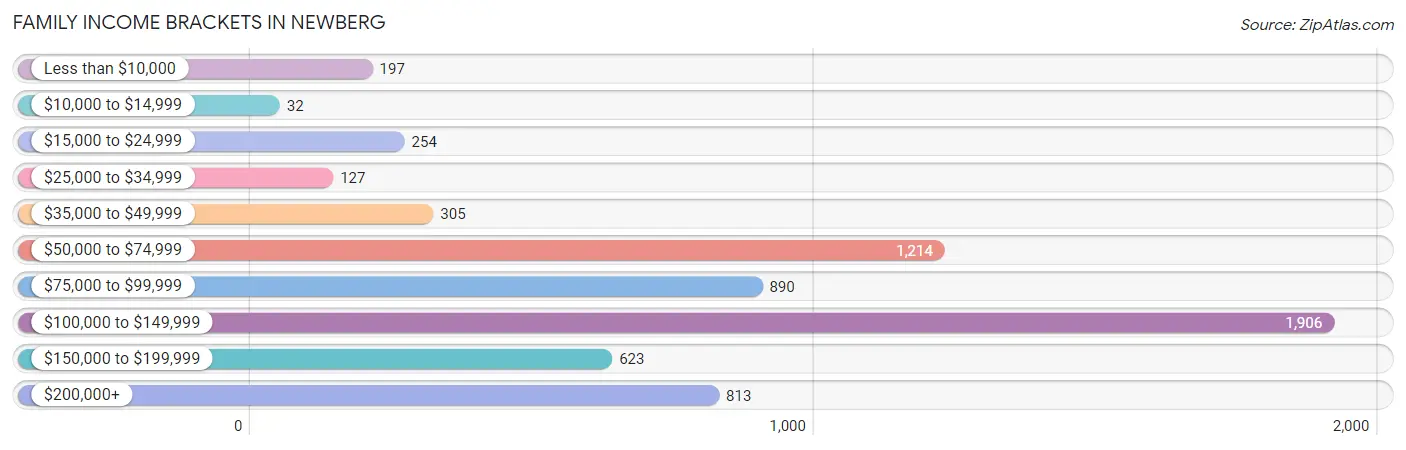
Family Income Brackets in Newberg
According to the Newberg family income data, there are 1,906 families falling into the $100,000 to $149,999 income range, which is the most common income bracket and makes up 30.0% of all families. Conversely, the $10,000 to $14,999 income bracket is the least frequent group with only 32 families (0.5%) belonging to this category.
| Income Bracket | # Families | % Families |
| Less than $10,000 | 197 | 3.1% |
| $10,000 to $14,999 | 32 | 0.5% |
| $15,000 to $24,999 | 254 | 4.0% |
| $25,000 to $34,999 | 127 | 2.0% |
| $35,000 to $49,999 | 305 | 4.8% |
| $50,000 to $74,999 | 1,214 | 19.1% |
| $75,000 to $99,999 | 890 | 14.0% |
| $100,000 to $149,999 | 1,906 | 30.0% |
| $150,000 to $199,999 | 623 | 9.8% |
| $200,000+ | 813 | 12.8% |
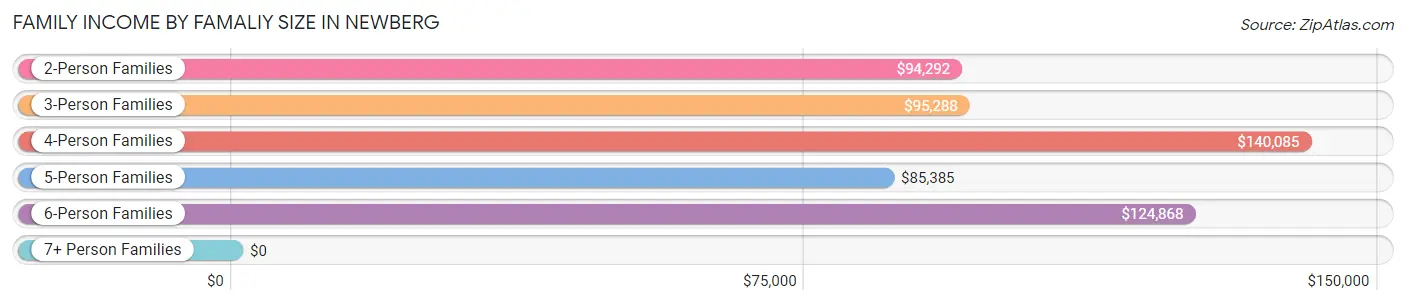
Family Income by Famaliy Size in Newberg
4-person families (1,161 | 18.3%) account for the highest median family income in Newberg with $140,085 per family, while 2-person families (3,192 | 50.2%) have the highest median income of $47,146 per family member.
| Income Bracket | # Families | Median Income |
| 2-Person Families | 3,192 (50.2%) | $94,292 |
| 3-Person Families | 1,326 (20.9%) | $95,288 |
| 4-Person Families | 1,161 (18.3%) | $140,085 |
| 5-Person Families | 558 (8.8%) | $85,385 |
| 6-Person Families | 94 (1.5%) | $124,868 |
| 7+ Person Families | 24 (0.4%) | $0 |
| Total | 6,355 (100.0%) | $104,399 |
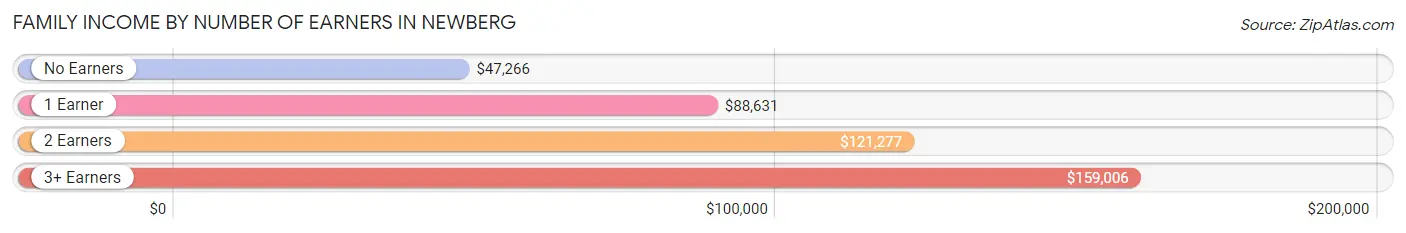
Family Income by Number of Earners in Newberg
The median family income in Newberg is $104,399, with families comprising 3+ earners (467) having the highest median family income of $159,006, while families with no earners (807) have the lowest median family income of $47,266, accounting for 7.3% and 12.7% of families, respectively.
| Number of Earners | # Families | Median Income |
| No Earners | 807 (12.7%) | $47,266 |
| 1 Earner | 1,803 (28.4%) | $88,631 |
| 2 Earners | 3,278 (51.6%) | $121,277 |
| 3+ Earners | 467 (7.3%) | $159,006 |
| Total | 6,355 (100.0%) | $104,399 |
Household Income in Newberg
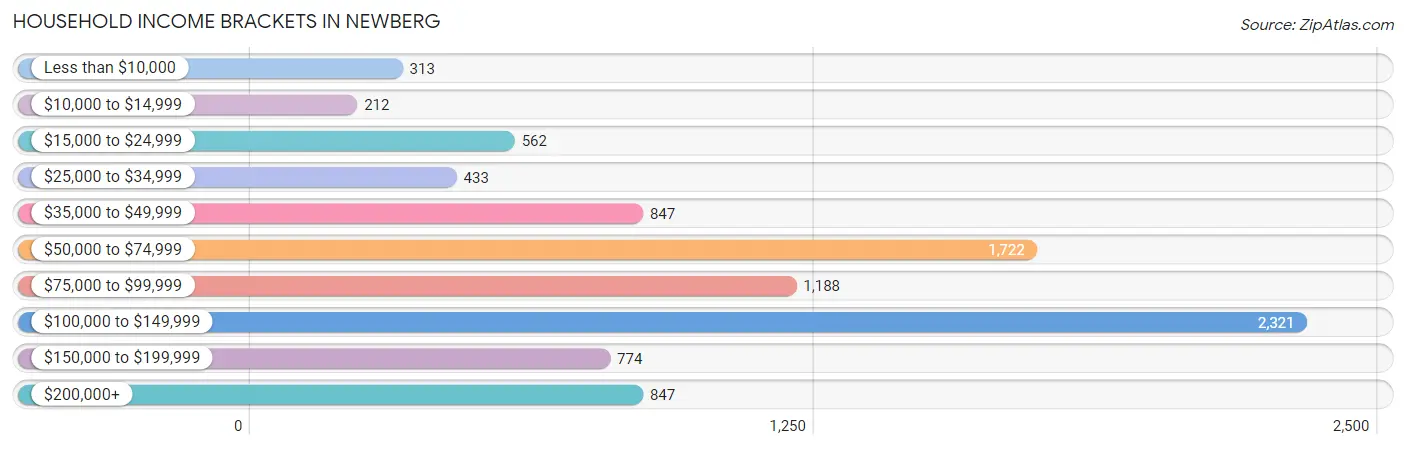
Household Income Brackets in Newberg
With 2,321 households falling in the category, the $100,000 to $149,999 income range is the most frequent in Newberg, accounting for 25.2% of all households. In contrast, only 212 households (2.3%) fall into the $10,000 to $14,999 income bracket, making it the least populous group.
| Income Bracket | # Households | % Households |
| Less than $10,000 | 313 | 3.4% |
| $10,000 to $14,999 | 212 | 2.3% |
| $15,000 to $24,999 | 562 | 6.1% |
| $25,000 to $34,999 | 433 | 4.7% |
| $35,000 to $49,999 | 847 | 9.2% |
| $50,000 to $74,999 | 1,722 | 18.7% |
| $75,000 to $99,999 | 1,188 | 12.9% |
| $100,000 to $149,999 | 2,321 | 25.2% |
| $150,000 to $199,999 | 774 | 8.4% |
| $200,000+ | 847 | 9.2% |
Household Income by Householder Age in Newberg
The median household income in Newberg is $87,873, with the highest median household income of $102,500 found in the 45 to 64 years age bracket for the primary householder. A total of 2,564 households (27.8%) fall into this category. Meanwhile, the 15 to 24 years age bracket for the primary householder has the lowest median household income of $0, with 310 households (3.4%) in this group.
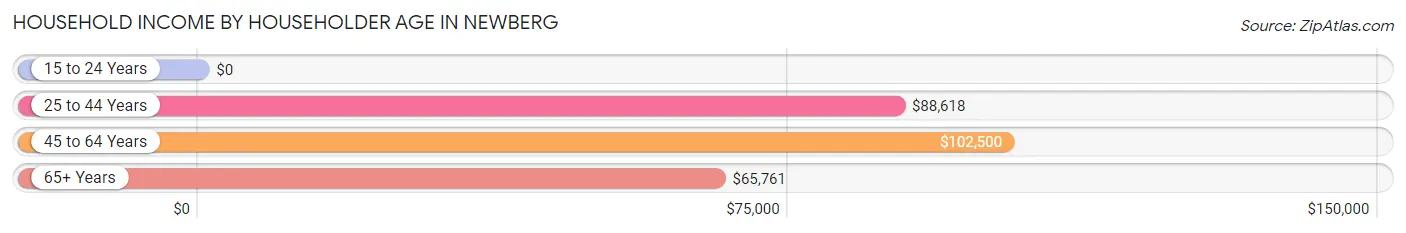
| Income Bracket | # Households | Median Income |
| 15 to 24 Years | 310 (3.4%) | $0 |
| 25 to 44 Years | 4,012 (43.6%) | $88,618 |
| 45 to 64 Years | 2,564 (27.8%) | $102,500 |
| 65+ Years | 2,324 (25.2%) | $65,761 |
| Total | 9,210 (100.0%) | $87,873 |
Poverty in Newberg
Income Below Poverty by Sex and Age in Newberg
With 6.2% poverty level for males and 9.9% for females among the residents of Newberg, 15 year old males and 16 and 17 year old females are the most vulnerable to poverty, with 31 males (58.5%) and 82 females (30.0%) in their respective age groups living below the poverty level.
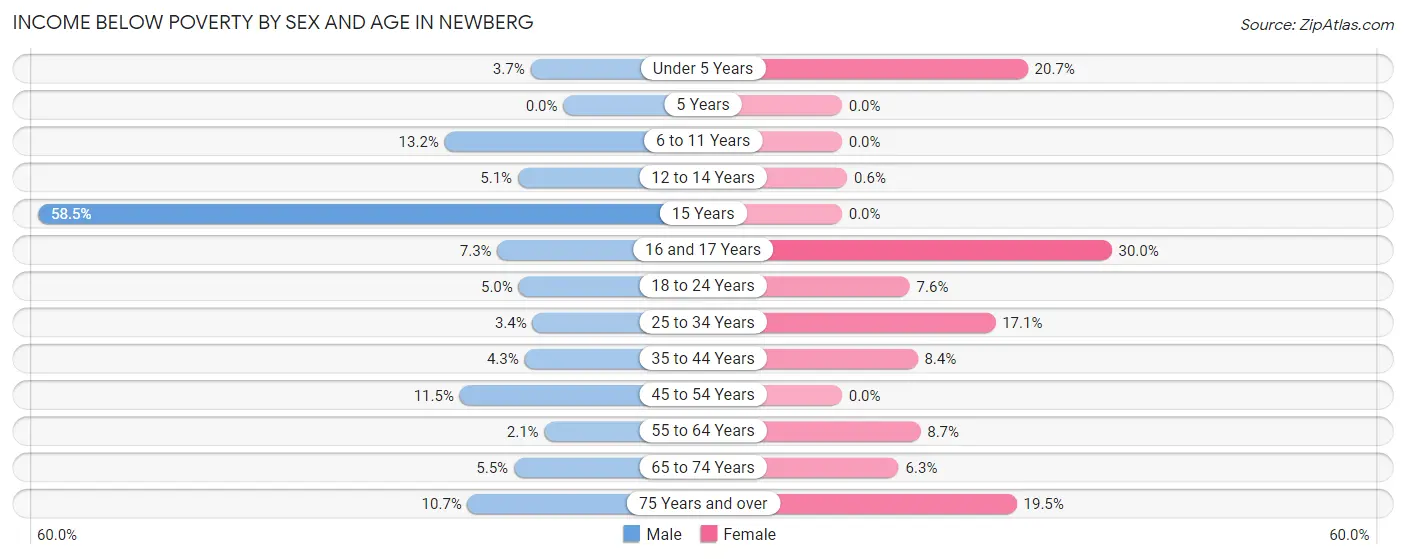
| Age Bracket | Male | Female |
| Under 5 Years | 33 (3.7%) | 188 (20.7%) |
| 5 Years | 0 (0.0%) | 0 (0.0%) |
| 6 to 11 Years | 105 (13.2%) | 0 (0.0%) |
| 12 to 14 Years | 25 (5.1%) | 3 (0.6%) |
| 15 Years | 31 (58.5%) | 0 (0.0%) |
| 16 and 17 Years | 32 (7.3%) | 82 (30.0%) |
| 18 to 24 Years | 59 (5.0%) | 48 (7.6%) |
| 25 to 34 Years | 71 (3.4%) | 362 (17.1%) |
| 35 to 44 Years | 76 (4.3%) | 155 (8.4%) |
| 45 to 54 Years | 145 (11.5%) | 0 (0.0%) |
| 55 to 64 Years | 23 (2.1%) | 122 (8.7%) |
| 65 to 74 Years | 51 (5.5%) | 75 (6.3%) |
| 75 Years and over | 78 (10.7%) | 139 (19.5%) |
| Total | 729 (6.2%) | 1,174 (9.9%) |
Income Above Poverty by Sex and Age in Newberg
According to the poverty statistics in Newberg, males aged 5 years and females aged 5 years are the age groups that are most secure financially, with 100.0% of males and 100.0% of females in these age groups living above the poverty line.
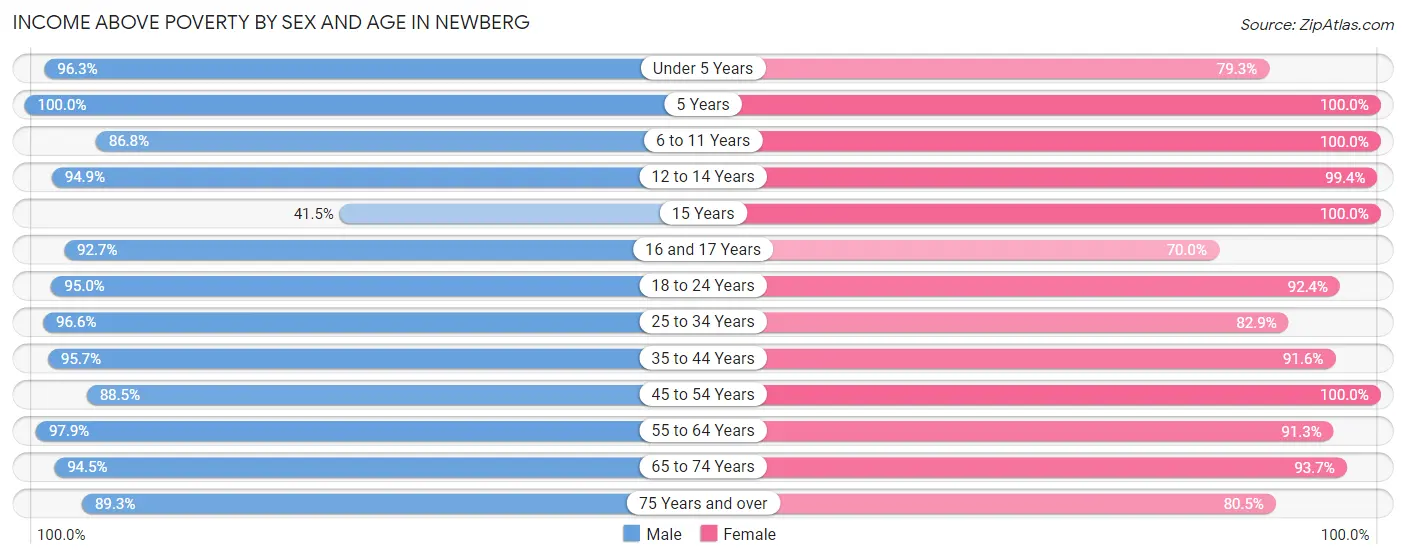
| Age Bracket | Male | Female |
| Under 5 Years | 868 (96.3%) | 720 (79.3%) |
| 5 Years | 97 (100.0%) | 207 (100.0%) |
| 6 to 11 Years | 689 (86.8%) | 768 (100.0%) |
| 12 to 14 Years | 469 (94.9%) | 500 (99.4%) |
| 15 Years | 22 (41.5%) | 219 (100.0%) |
| 16 and 17 Years | 404 (92.7%) | 191 (70.0%) |
| 18 to 24 Years | 1,125 (95.0%) | 587 (92.4%) |
| 25 to 34 Years | 2,000 (96.6%) | 1,756 (82.9%) |
| 35 to 44 Years | 1,683 (95.7%) | 1,683 (91.6%) |
| 45 to 54 Years | 1,111 (88.5%) | 1,160 (100.0%) |
| 55 to 64 Years | 1,069 (97.9%) | 1,274 (91.3%) |
| 65 to 74 Years | 877 (94.5%) | 1,110 (93.7%) |
| 75 Years and over | 654 (89.3%) | 575 (80.5%) |
| Total | 11,068 (93.8%) | 10,750 (90.1%) |
Income Below Poverty Among Married-Couple Families in Newberg
The poverty statistics for married-couple families in Newberg show that 2.6% or 126 of the total 4,915 families live below the poverty line. Families with no children have the highest poverty rate of 4.3%, comprising of 122 families. On the other hand, families with 1 or 2 children have the lowest poverty rate of 0.0%, which includes 0 families.
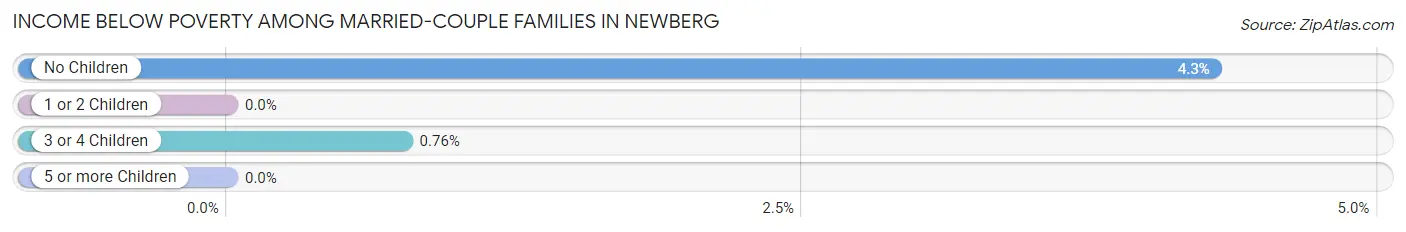
| Children | Above Poverty | Below Poverty |
| No Children | 2,729 (95.7%) | 122 (4.3%) |
| 1 or 2 Children | 1,517 (100.0%) | 0 (0.0%) |
| 3 or 4 Children | 519 (99.2%) | 4 (0.8%) |
| 5 or more Children | 24 (100.0%) | 0 (0.0%) |
| Total | 4,789 (97.4%) | 126 (2.6%) |
Income Below Poverty Among Single-Parent Households in Newberg
According to the poverty data in Newberg, 21.7% or 76 single-father households and 22.8% or 249 single-mother households are living below the poverty line. Among single-father households, those with 1 or 2 children have the highest poverty rate, with 66 households (29.1%) experiencing poverty. Likewise, among single-mother households, those with 1 or 2 children have the highest poverty rate, with 174 households (26.6%) falling below the poverty line.
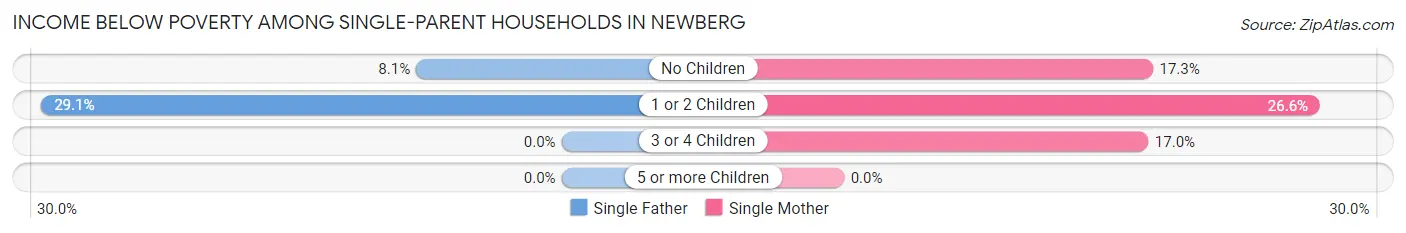
| Children | Single Father | Single Mother |
| No Children | 10 (8.1%) | 58 (17.3%) |
| 1 or 2 Children | 66 (29.1%) | 174 (26.6%) |
| 3 or 4 Children | 0 (0.0%) | 17 (17.0%) |
| 5 or more Children | 0 (0.0%) | 0 (0.0%) |
| Total | 76 (21.7%) | 249 (22.8%) |
Income Below Poverty Among Married-Couple vs Single-Parent Households in Newberg
The poverty data for Newberg shows that 126 of the married-couple family households (2.6%) and 325 of the single-parent households (22.6%) are living below the poverty level. Within the married-couple family households, those with no children have the highest poverty rate, with 122 households (4.3%) falling below the poverty line. Among the single-parent households, those with 1 or 2 children have the highest poverty rate, with 240 household (27.2%) living below poverty.
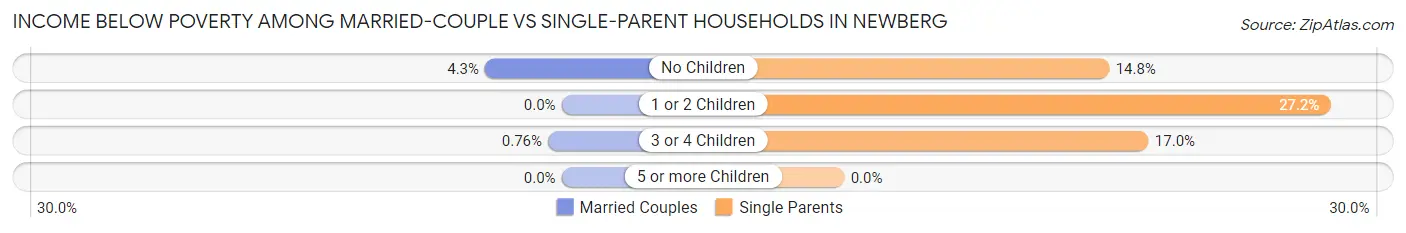
| Children | Married-Couple Families | Single-Parent Households |
| No Children | 122 (4.3%) | 68 (14.8%) |
| 1 or 2 Children | 0 (0.0%) | 240 (27.2%) |
| 3 or 4 Children | 4 (0.8%) | 17 (17.0%) |
| 5 or more Children | 0 (0.0%) | 0 (0.0%) |
| Total | 126 (2.6%) | 325 (22.6%) |
Race in Newberg
The most populous races in Newberg are White / Caucasian (20,351 | 80.2%), Hispanic or Latino (4,156 | 16.4%), and Two or more Races (2,928 | 11.5%).
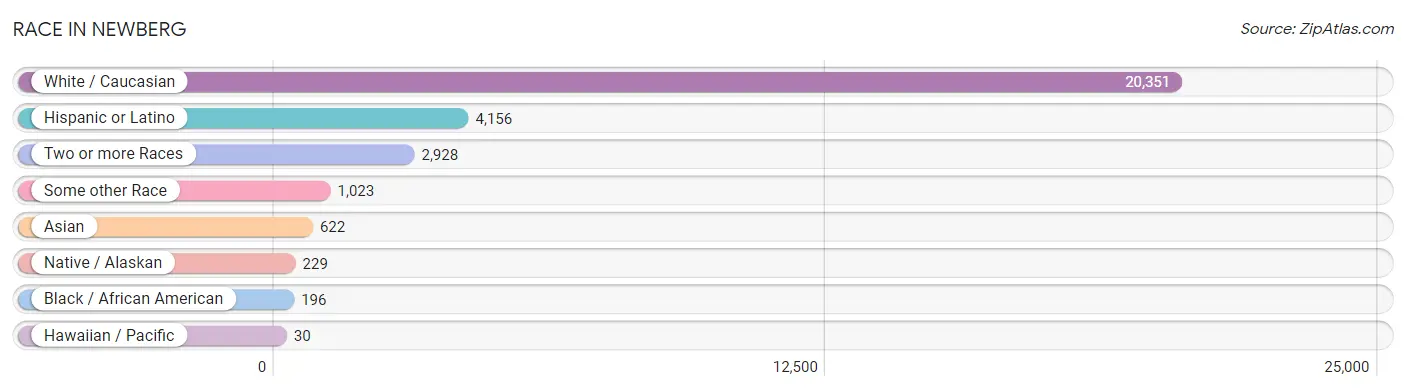
| Race | # Population | % Population |
| Asian | 622 | 2.5% |
| Black / African American | 196 | 0.8% |
| Hawaiian / Pacific | 30 | 0.1% |
| Hispanic or Latino | 4,156 | 16.4% |
| Native / Alaskan | 229 | 0.9% |
| White / Caucasian | 20,351 | 80.2% |
| Two or more Races | 2,928 | 11.5% |
| Some other Race | 1,023 | 4.0% |
| Total | 25,379 | 100.0% |
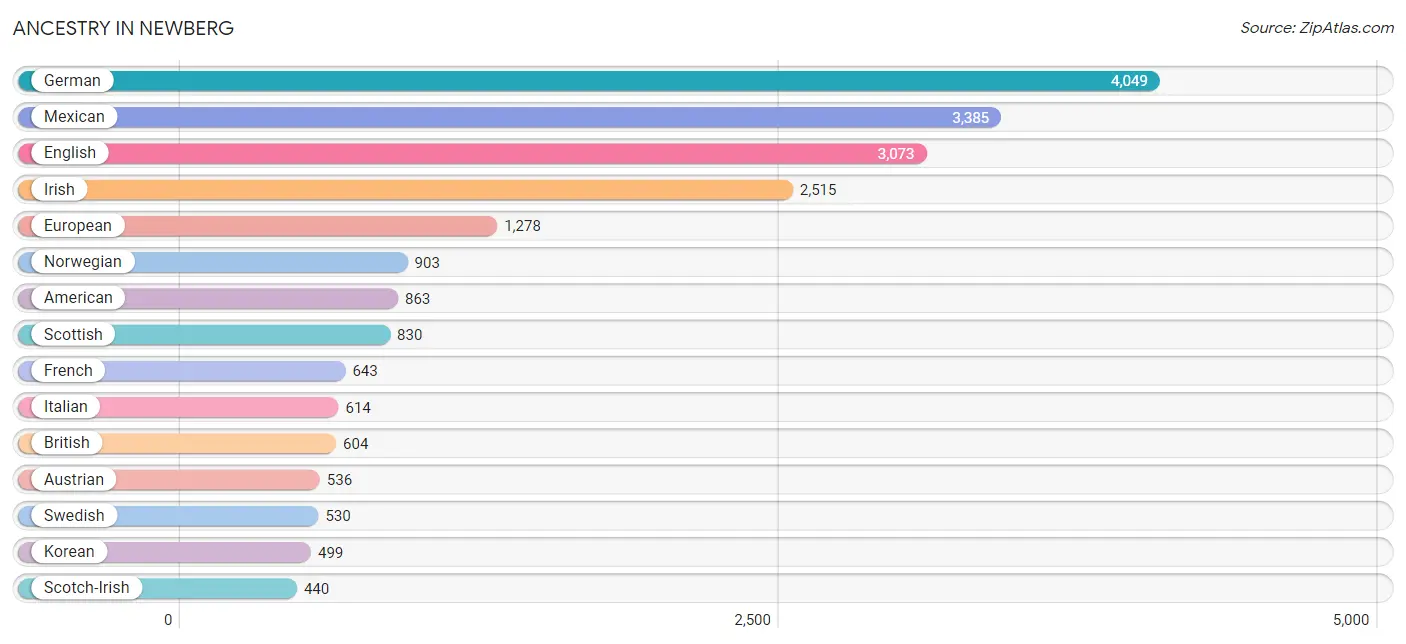
Ancestry in Newberg
The most populous ancestries reported in Newberg are German (4,049 | 16.0%), Mexican (3,385 | 13.3%), English (3,073 | 12.1%), Irish (2,515 | 9.9%), and European (1,278 | 5.0%), together accounting for 56.4% of all Newberg residents.
| Ancestry | # Population | % Population |
| American | 863 | 3.4% |
| Arab | 64 | 0.3% |
| Austrian | 536 | 2.1% |
| Belgian | 24 | 0.1% |
| Bhutanese | 357 | 1.4% |
| Blackfeet | 31 | 0.1% |
| British | 604 | 2.4% |
| Burmese | 75 | 0.3% |
| Canadian | 13 | 0.1% |
| Central American | 205 | 0.8% |
| Cherokee | 69 | 0.3% |
| Chinese | 3 | 0.0% |
| Choctaw | 15 | 0.1% |
| Creek | 16 | 0.1% |
| Croatian | 28 | 0.1% |
| Cuban | 24 | 0.1% |
| Czech | 36 | 0.1% |
| Danish | 289 | 1.1% |
| Dutch | 264 | 1.0% |
| Eastern European | 212 | 0.8% |
| English | 3,073 | 12.1% |
| Ethiopian | 134 | 0.5% |
| European | 1,278 | 5.0% |
| Finnish | 78 | 0.3% |
| French | 643 | 2.5% |
| French American Indian | 10 | 0.0% |
| French Canadian | 249 | 1.0% |
| German | 4,049 | 16.0% |
| Greek | 74 | 0.3% |
| Guatemalan | 3 | 0.0% |
| Hopi | 12 | 0.1% |
| Hungarian | 10 | 0.0% |
| Icelander | 67 | 0.3% |
| Indian (Asian) | 230 | 0.9% |
| Inupiat | 10 | 0.0% |
| Iranian | 21 | 0.1% |
| Irish | 2,515 | 9.9% |
| Italian | 614 | 2.4% |
| Kenyan | 107 | 0.4% |
| Korean | 499 | 2.0% |
| Laotian | 18 | 0.1% |
| Lithuanian | 16 | 0.1% |
| Malaysian | 22 | 0.1% |
| Mexican | 3,385 | 13.3% |
| Mexican American Indian | 226 | 0.9% |
| Native Hawaiian | 35 | 0.1% |
| Nicaraguan | 174 | 0.7% |
| Northern European | 153 | 0.6% |
| Norwegian | 903 | 3.6% |
| Peruvian | 13 | 0.1% |
| Polish | 343 | 1.3% |
| Portuguese | 96 | 0.4% |
| Puerto Rican | 210 | 0.8% |
| Puget Sound Salish | 26 | 0.1% |
| Romanian | 17 | 0.1% |
| Russian | 68 | 0.3% |
| Salvadoran | 28 | 0.1% |
| Samoan | 7 | 0.0% |
| Scandinavian | 176 | 0.7% |
| Scotch-Irish | 440 | 1.7% |
| Scottish | 830 | 3.3% |
| Shoshone | 4 | 0.0% |
| Slavic | 6 | 0.0% |
| South American | 33 | 0.1% |
| Spaniard | 141 | 0.6% |
| Spanish | 1 | 0.0% |
| Spanish American | 21 | 0.1% |
| Sri Lankan | 114 | 0.4% |
| Subsaharan African | 241 | 0.9% |
| Swedish | 530 | 2.1% |
| Swiss | 84 | 0.3% |
| Thai | 3 | 0.0% |
| Ukrainian | 31 | 0.1% |
| Uruguayan | 20 | 0.1% |
| Welsh | 224 | 0.9% | View All 75 Rows |
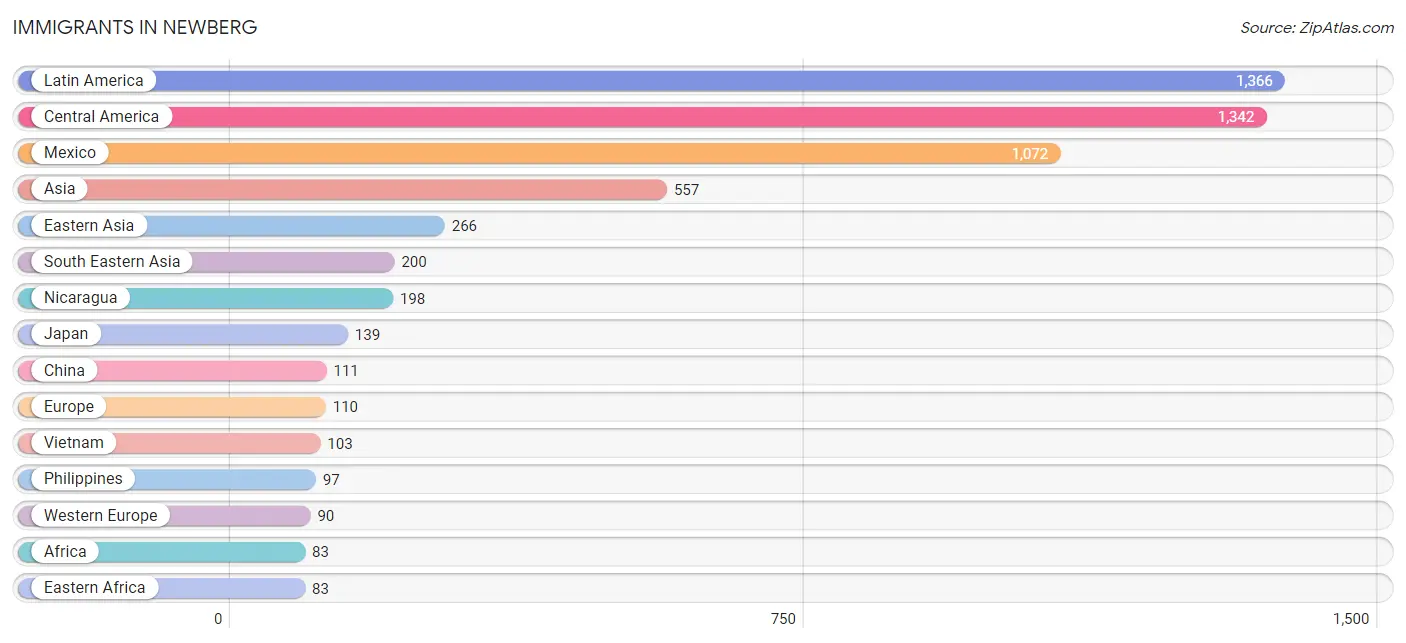
Immigrants in Newberg
The most numerous immigrant groups reported in Newberg came from Latin America (1,366 | 5.4%), Central America (1,342 | 5.3%), Mexico (1,072 | 4.2%), Asia (557 | 2.2%), and Eastern Asia (266 | 1.1%), together accounting for 18.1% of all Newberg residents.
| Immigration Origin | # Population | % Population |
| Africa | 83 | 0.3% |
| Asia | 557 | 2.2% |
| Australia | 82 | 0.3% |
| Austria | 36 | 0.1% |
| Canada | 71 | 0.3% |
| Caribbean | 24 | 0.1% |
| Central America | 1,342 | 5.3% |
| China | 111 | 0.4% |
| Cuba | 24 | 0.1% |
| Denmark | 1 | 0.0% |
| Eastern Africa | 83 | 0.3% |
| Eastern Asia | 266 | 1.1% |
| Eastern Europe | 4 | 0.0% |
| El Salvador | 72 | 0.3% |
| Ethiopia | 69 | 0.3% |
| Europe | 110 | 0.4% |
| Germany | 15 | 0.1% |
| Hong Kong | 34 | 0.1% |
| India | 19 | 0.1% |
| Japan | 139 | 0.5% |
| Korea | 16 | 0.1% |
| Latin America | 1,366 | 5.4% |
| Lithuania | 4 | 0.0% |
| Mexico | 1,072 | 4.2% |
| Netherlands | 32 | 0.1% |
| Nicaragua | 198 | 0.8% |
| Northern Europe | 16 | 0.1% |
| Oceania | 82 | 0.3% |
| Philippines | 97 | 0.4% |
| Saudi Arabia | 21 | 0.1% |
| South Central Asia | 70 | 0.3% |
| South Eastern Asia | 200 | 0.8% |
| Switzerland | 7 | 0.0% |
| Taiwan | 14 | 0.1% |
| Uzbekistan | 51 | 0.2% |
| Vietnam | 103 | 0.4% |
| Western Asia | 21 | 0.1% |
| Western Europe | 90 | 0.4% |
| Zimbabwe | 14 | 0.1% | View All 39 Rows |
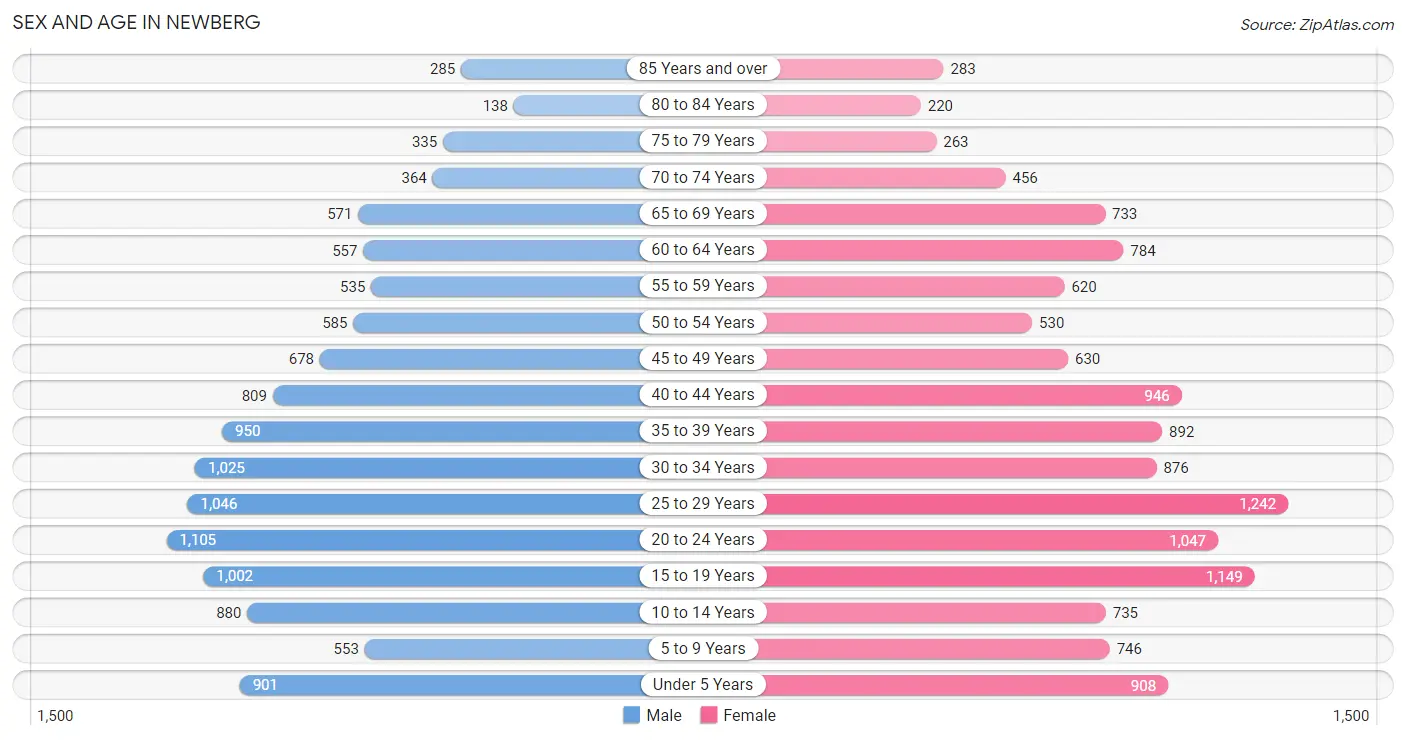
Sex and Age in Newberg
Sex and Age in Newberg
The most populous age groups in Newberg are 20 to 24 Years (1,105 | 9.0%) for men and 25 to 29 Years (1,242 | 9.5%) for women.
| Age Bracket | Male | Female |
| Under 5 Years | 901 (7.3%) | 908 (7.0%) |
| 5 to 9 Years | 553 (4.5%) | 746 (5.7%) |
| 10 to 14 Years | 880 (7.1%) | 735 (5.6%) |
| 15 to 19 Years | 1,002 (8.1%) | 1,149 (8.8%) |
| 20 to 24 Years | 1,105 (9.0%) | 1,047 (8.0%) |
| 25 to 29 Years | 1,046 (8.5%) | 1,242 (9.5%) |
| 30 to 34 Years | 1,025 (8.3%) | 876 (6.7%) |
| 35 to 39 Years | 950 (7.7%) | 892 (6.8%) |
| 40 to 44 Years | 809 (6.6%) | 946 (7.2%) |
| 45 to 49 Years | 678 (5.5%) | 630 (4.8%) |
| 50 to 54 Years | 585 (4.8%) | 530 (4.1%) |
| 55 to 59 Years | 535 (4.3%) | 620 (4.8%) |
| 60 to 64 Years | 557 (4.5%) | 784 (6.0%) |
| 65 to 69 Years | 571 (4.6%) | 733 (5.6%) |
| 70 to 74 Years | 364 (2.9%) | 456 (3.5%) |
| 75 to 79 Years | 335 (2.7%) | 263 (2.0%) |
| 80 to 84 Years | 138 (1.1%) | 220 (1.7%) |
| 85 Years and over | 285 (2.3%) | 283 (2.2%) |
| Total | 12,319 (100.0%) | 13,060 (100.0%) |
Families and Households in Newberg
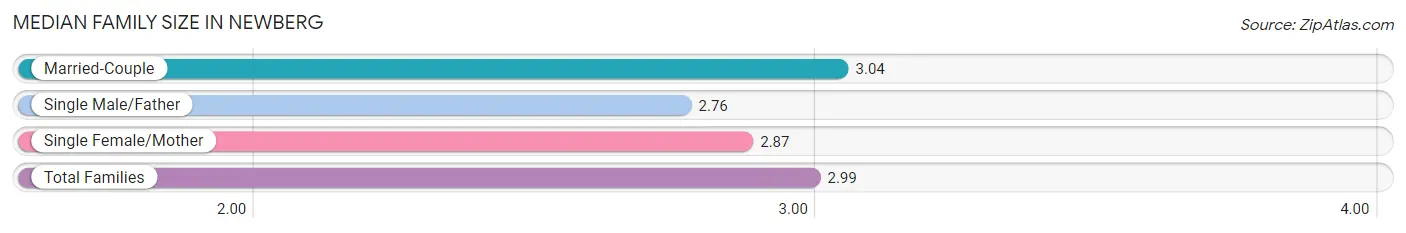
Median Family Size in Newberg
The median family size in Newberg is 2.99 persons per family, with married-couple families (4,915 | 77.3%) accounting for the largest median family size of 3.04 persons per family. On the other hand, single male/father families (350 | 5.5%) represent the smallest median family size with 2.76 persons per family.
| Family Type | # Families | Family Size |
| Married-Couple | 4,915 (77.3%) | 3.04 |
| Single Male/Father | 350 (5.5%) | 2.76 |
| Single Female/Mother | 1,090 (17.2%) | 2.87 |
| Total Families | 6,355 (100.0%) | 2.99 |
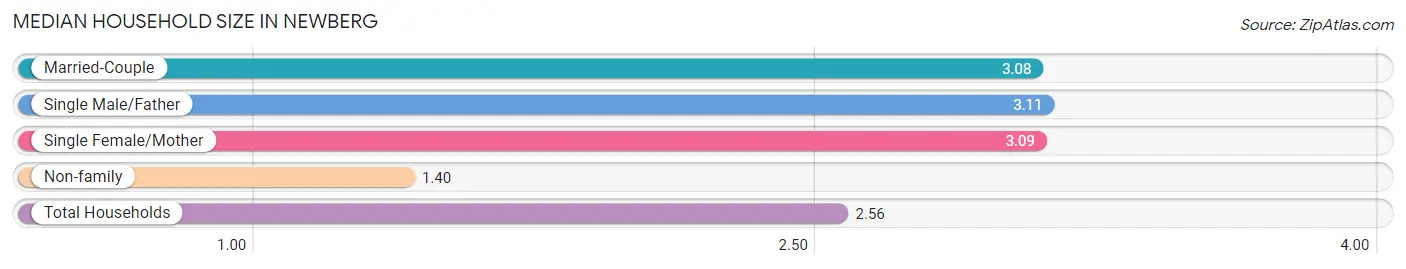
Median Household Size in Newberg
The median household size in Newberg is 2.56 persons per household, with single male/father households (350 | 3.8%) accounting for the largest median household size of 3.11 persons per household. non-family households (2,855 | 31.0%) represent the smallest median household size with 1.40 persons per household.
| Household Type | # Households | Household Size |
| Married-Couple | 4,915 (53.4%) | 3.08 |
| Single Male/Father | 350 (3.8%) | 3.11 |
| Single Female/Mother | 1,090 (11.8%) | 3.09 |
| Non-family | 2,855 (31.0%) | 1.40 |
| Total Households | 9,210 (100.0%) | 2.56 |
Household Size by Marriage Status in Newberg
Out of a total of 9,210 households in Newberg, 6,355 (69.0%) are family households, while 2,855 (31.0%) are nonfamily households. The most numerous type of family households are 2-person households, comprising 2,840, and the most common type of nonfamily households are 1-person households, comprising 2,209.
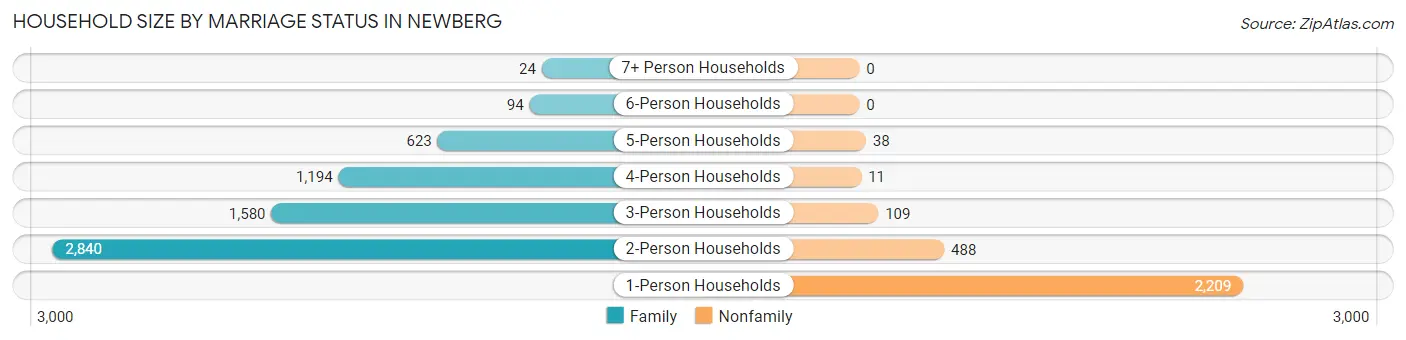
| Household Size | Family Households | Nonfamily Households |
| 1-Person Households | - | 2,209 (24.0%) |
| 2-Person Households | 2,840 (30.8%) | 488 (5.3%) |
| 3-Person Households | 1,580 (17.2%) | 109 (1.2%) |
| 4-Person Households | 1,194 (13.0%) | 11 (0.1%) |
| 5-Person Households | 623 (6.8%) | 38 (0.4%) |
| 6-Person Households | 94 (1.0%) | 0 (0.0%) |
| 7+ Person Households | 24 (0.3%) | 0 (0.0%) |
| Total | 6,355 (69.0%) | 2,855 (31.0%) |
Female Fertility in Newberg
Fertility by Age in Newberg
Average fertility rate in Newberg is 43.0 births per 1,000 women. Women in the age bracket of 20 to 34 years have the highest fertility rate with 71.0 births per 1,000 women. Women in the age bracket of 20 to 34 years acount for 75.2% of all women with births.
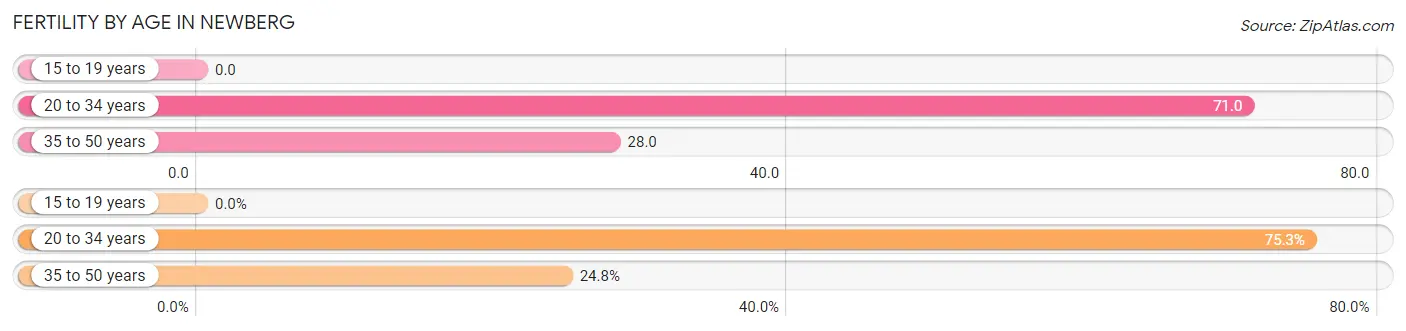
| Age Bracket | Women with Births | Births / 1,000 Women |
| 15 to 19 years | 0 (0.0%) | 0.0 |
| 20 to 34 years | 225 (75.2%) | 71.0 |
| 35 to 50 years | 74 (24.7%) | 28.0 |
| Total | 299 (100.0%) | 43.0 |
Fertility by Age by Marriage Status in Newberg
72.9% of women with births (299) in Newberg are married. The highest percentage of unmarried women with births falls into 35 to 50 years age bracket with 41.9% of them unmarried at the time of birth, while the lowest percentage of unmarried women with births belong to 20 to 34 years age bracket with 22.2% of them unmarried.
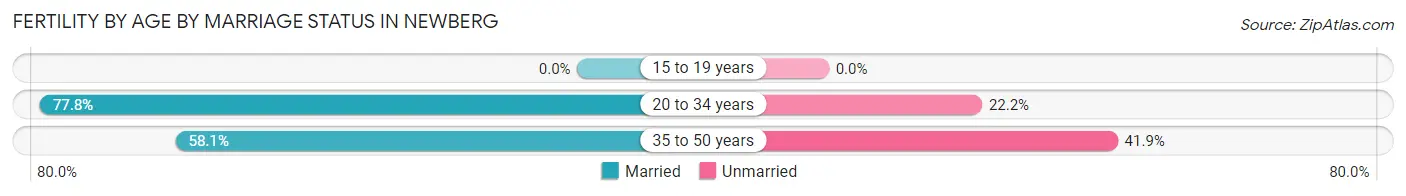
| Age Bracket | Married | Unmarried |
| 15 to 19 years | 0 (0.0%) | 0 (0.0%) |
| 20 to 34 years | 175 (77.8%) | 50 (22.2%) |
| 35 to 50 years | 43 (58.1%) | 31 (41.9%) |
| Total | 218 (72.9%) | 81 (27.1%) |
Fertility by Education in Newberg
Average fertility rate in Newberg is 43.0 births per 1,000 women. Women with the education attainment of graduate degree have the highest fertility rate of 77.0 births per 1,000 women, while women with the education attainment of high school diploma have the lowest fertility at 9.0 births per 1,000 women. Women with the education attainment of college or associate's degree represent 40.5% of all women with births.
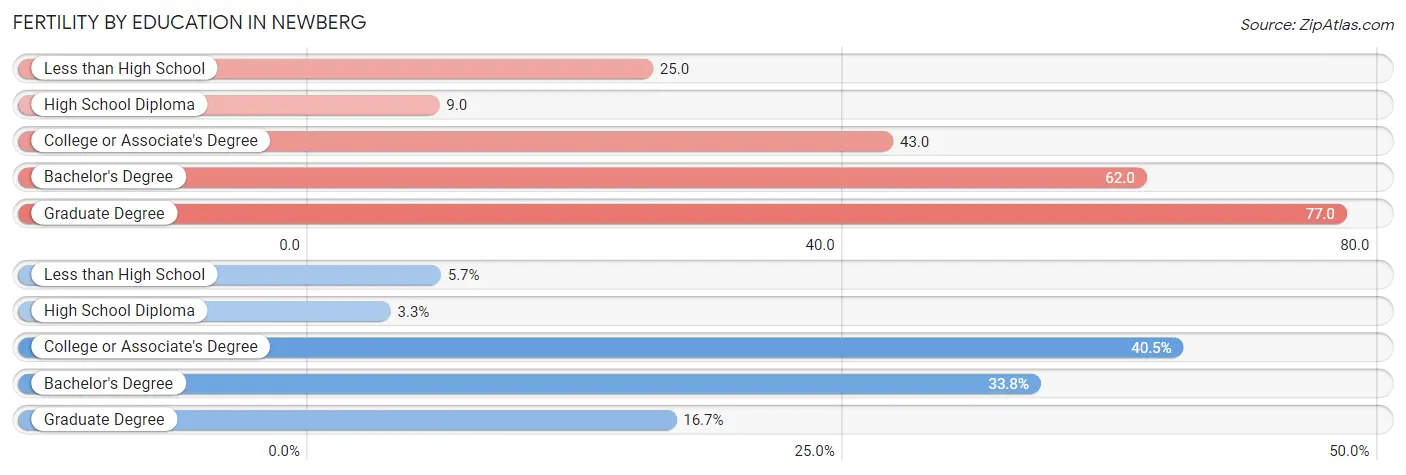
| Educational Attainment | Women with Births | Births / 1,000 Women |
| Less than High School | 17 (5.7%) | 25.0 |
| High School Diploma | 10 (3.3%) | 9.0 |
| College or Associate's Degree | 121 (40.5%) | 43.0 |
| Bachelor's Degree | 101 (33.8%) | 62.0 |
| Graduate Degree | 50 (16.7%) | 77.0 |
| Total | 299 (100.0%) | 43.0 |
Fertility by Education by Marriage Status in Newberg
27.1% of women with births in Newberg are unmarried. Women with the educational attainment of high school diploma are most likely to be married with 100.0% of them married at childbirth, while women with the educational attainment of less than high school are least likely to be married with 100.0% of them unmarried at childbirth.
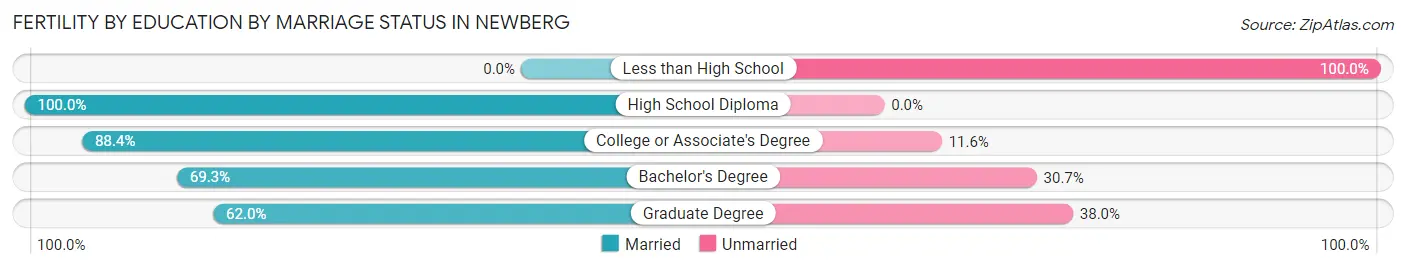
| Educational Attainment | Married | Unmarried |
| Less than High School | 0 (0.0%) | 17 (100.0%) |
| High School Diploma | 10 (100.0%) | 0 (0.0%) |
| College or Associate's Degree | 107 (88.4%) | 14 (11.6%) |
| Bachelor's Degree | 70 (69.3%) | 31 (30.7%) |
| Graduate Degree | 31 (62.0%) | 19 (38.0%) |
| Total | 218 (72.9%) | 81 (27.1%) |
Employment Characteristics in Newberg
Employment by Class of Employer in Newberg
Among the 13,269 employed individuals in Newberg, private company employees (9,188 | 69.2%), not-for-profit organizations (1,907 | 14.4%), and local government employees (762 | 5.7%) make up the most common classes of employment.
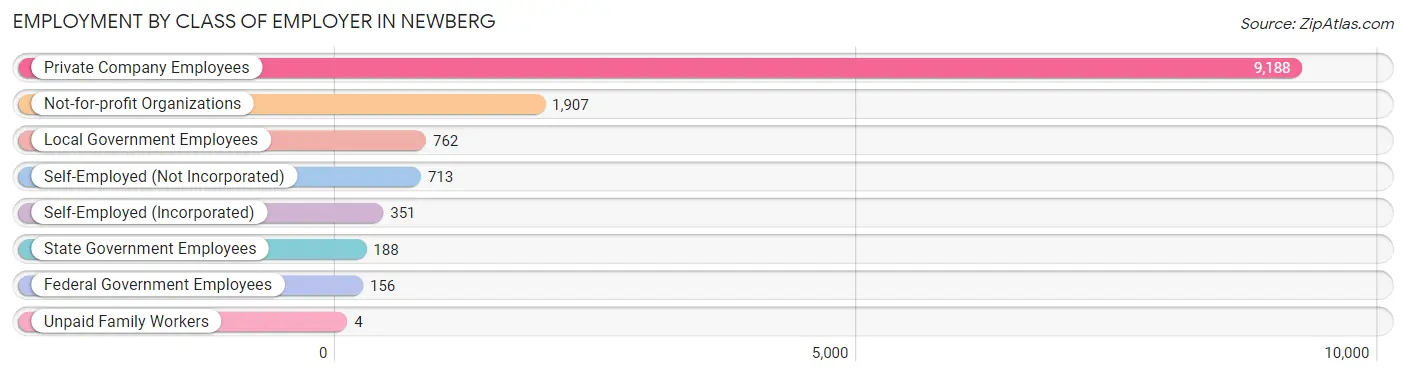
| Employer Class | # Employees | % Employees |
| Private Company Employees | 9,188 | 69.2% |
| Self-Employed (Incorporated) | 351 | 2.6% |
| Self-Employed (Not Incorporated) | 713 | 5.4% |
| Not-for-profit Organizations | 1,907 | 14.4% |
| Local Government Employees | 762 | 5.7% |
| State Government Employees | 188 | 1.4% |
| Federal Government Employees | 156 | 1.2% |
| Unpaid Family Workers | 4 | 0.0% |
| Total | 13,269 | 100.0% |
Employment Status by Age in Newberg
According to the labor force statistics for Newberg, out of the total population over 16 years of age (20,380), 68.3% or 13,920 individuals are in the labor force, with 3.3% or 459 of them unemployed. The age group with the highest labor force participation rate is 30 to 34 years, with 94.6% or 1,798 individuals in the labor force. Within the labor force, the 20 to 24 years age range has the highest percentage of unemployed individuals, with 11.7% or 167 of them being unemployed.
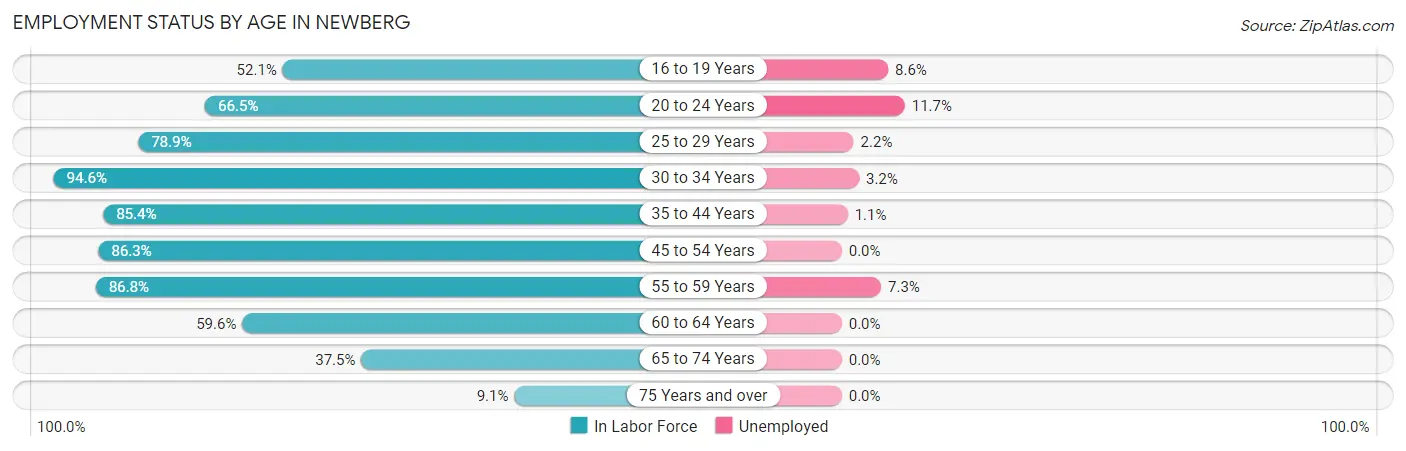
| Age Bracket | In Labor Force | Unemployed |
| 16 to 19 Years | 977 (52.1%) | 84 (8.6%) |
| 20 to 24 Years | 1,431 (66.5%) | 167 (11.7%) |
| 25 to 29 Years | 1,805 (78.9%) | 40 (2.2%) |
| 30 to 34 Years | 1,798 (94.6%) | 58 (3.2%) |
| 35 to 44 Years | 3,072 (85.4%) | 34 (1.1%) |
| 45 to 54 Years | 2,091 (86.3%) | 0 (0.0%) |
| 55 to 59 Years | 1,003 (86.8%) | 73 (7.3%) |
| 60 to 64 Years | 799 (59.6%) | 0 (0.0%) |
| 65 to 74 Years | 796 (37.5%) | 0 (0.0%) |
| 75 Years and over | 139 (9.1%) | 0 (0.0%) |
| Total | 13,920 (68.3%) | 459 (3.3%) |
Employment Status by Educational Attainment in Newberg
According to labor force statistics for Newberg, 83.2% of individuals (10,571) out of the total population between 25 and 64 years of age (12,705) are in the labor force, with 1.9% or 201 of them being unemployed. The group with the highest labor force participation rate are those with the educational attainment of bachelor's degree or higher, with 89.7% or 4,386 individuals in the labor force. Within the labor force, individuals with less than high school education have the highest percentage of unemployment, with 4.8% or 44 of them being unemployed.
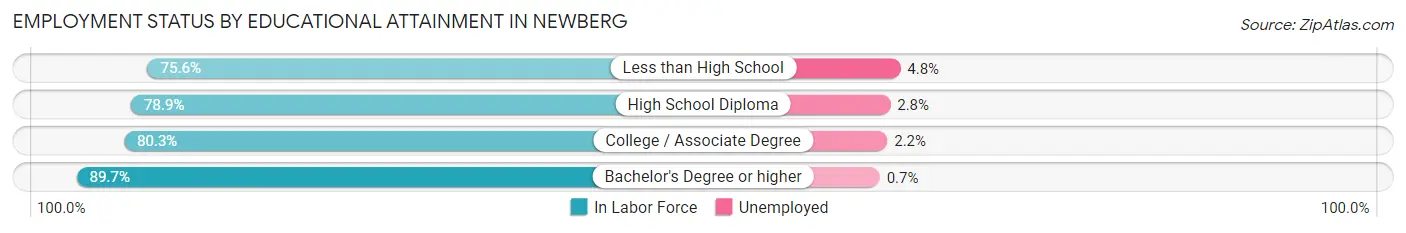
| Educational Attainment | In Labor Force | Unemployed |
| Less than High School | 919 (75.6%) | 58 (4.8%) |
| High School Diploma | 2,186 (78.9%) | 78 (2.8%) |
| College / Associate Degree | 3,075 (80.3%) | 84 (2.2%) |
| Bachelor's Degree or higher | 4,386 (89.7%) | 34 (0.7%) |
| Total | 10,571 (83.2%) | 241 (1.9%) |
Employment Occupations by Sex in Newberg
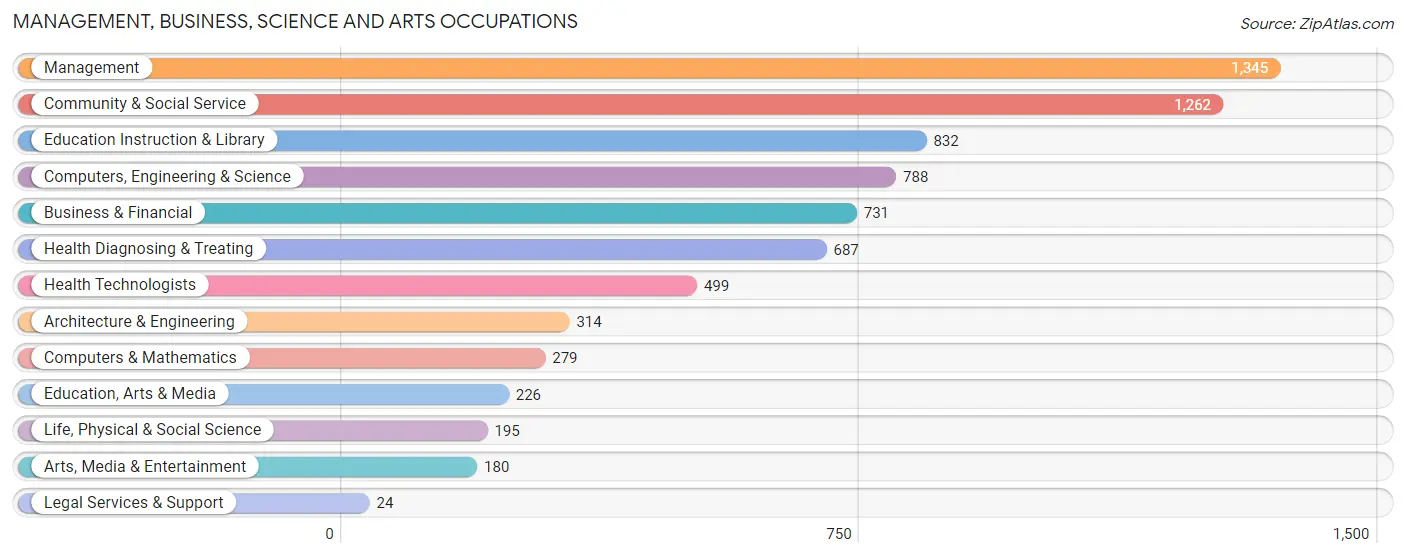
Management, Business, Science and Arts Occupations
The most common Management, Business, Science and Arts occupations in Newberg are Management (1,345 | 10.0%), Community & Social Service (1,262 | 9.4%), Education Instruction & Library (832 | 6.2%), Computers, Engineering & Science (788 | 5.9%), and Business & Financial (731 | 5.4%).
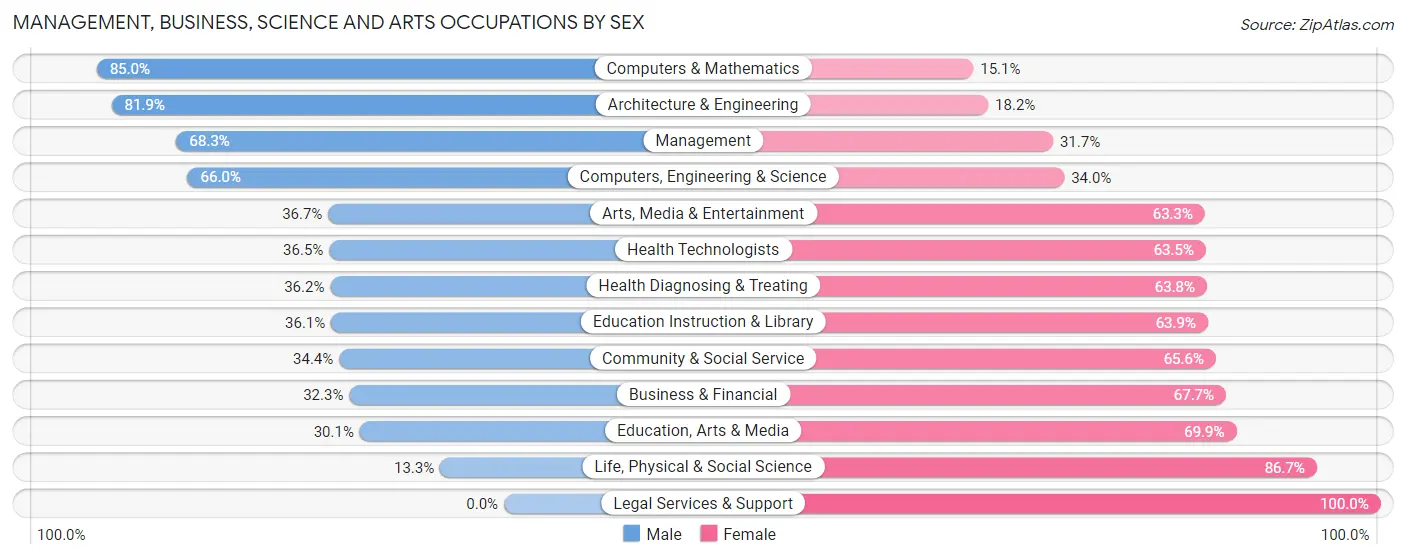
Management, Business, Science and Arts Occupations by Sex
Within the Management, Business, Science and Arts occupations in Newberg, the most male-oriented occupations are Computers & Mathematics (85.0%), Architecture & Engineering (81.9%), and Management (68.3%), while the most female-oriented occupations are Legal Services & Support (100.0%), Life, Physical & Social Science (86.7%), and Education, Arts & Media (69.9%).
| Occupation | Male | Female |
| Management | 919 (68.3%) | 426 (31.7%) |
| Business & Financial | 236 (32.3%) | 495 (67.7%) |
| Computers, Engineering & Science | 520 (66.0%) | 268 (34.0%) |
| Computers & Mathematics | 237 (85.0%) | 42 (15.0%) |
| Architecture & Engineering | 257 (81.9%) | 57 (18.1%) |
| Life, Physical & Social Science | 26 (13.3%) | 169 (86.7%) |
| Community & Social Service | 434 (34.4%) | 828 (65.6%) |
| Education, Arts & Media | 68 (30.1%) | 158 (69.9%) |
| Legal Services & Support | 0 (0.0%) | 24 (100.0%) |
| Education Instruction & Library | 300 (36.1%) | 532 (63.9%) |
| Arts, Media & Entertainment | 66 (36.7%) | 114 (63.3%) |
| Health Diagnosing & Treating | 249 (36.2%) | 438 (63.8%) |
| Health Technologists | 182 (36.5%) | 317 (63.5%) |
| Total (Category) | 2,358 (49.0%) | 2,455 (51.0%) |
| Total (Overall) | 7,236 (53.9%) | 6,190 (46.1%) |
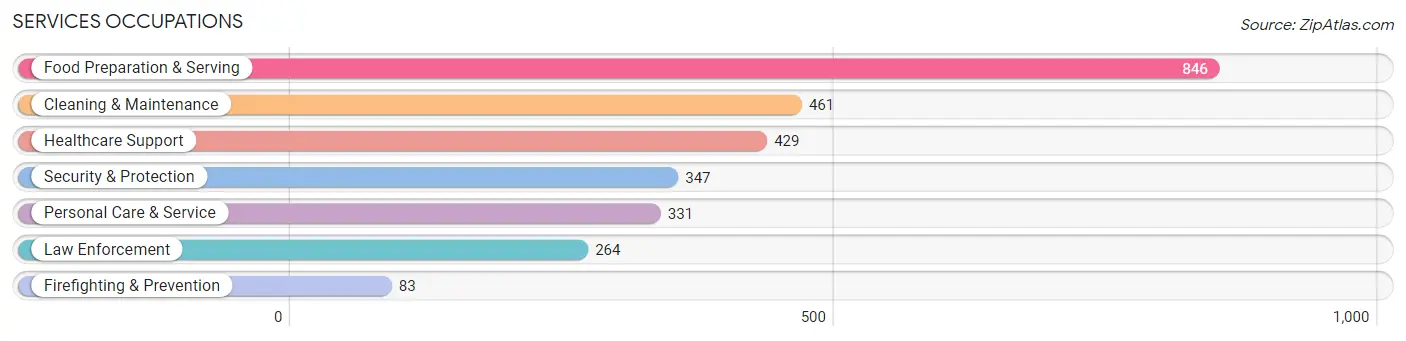
Services Occupations
The most common Services occupations in Newberg are Food Preparation & Serving (846 | 6.3%), Cleaning & Maintenance (461 | 3.4%), Healthcare Support (429 | 3.2%), Security & Protection (347 | 2.6%), and Personal Care & Service (331 | 2.5%).
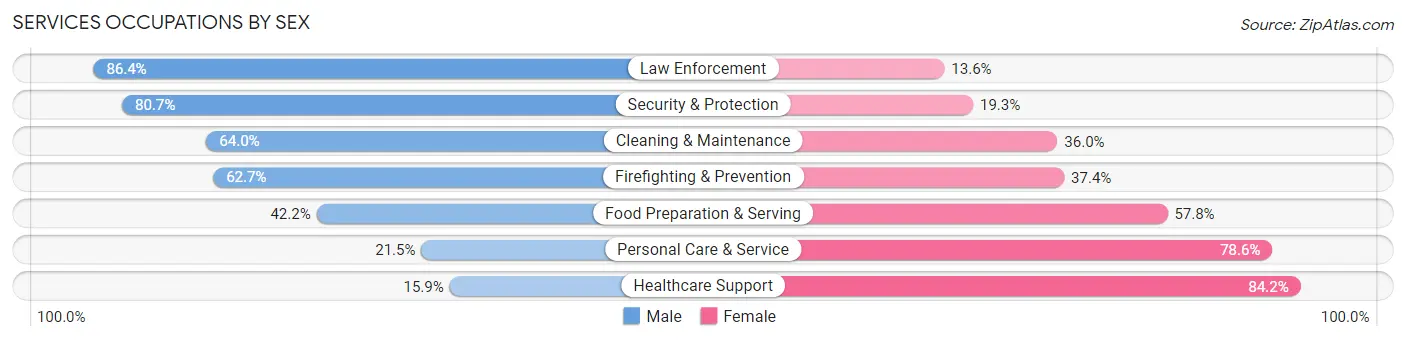
Services Occupations by Sex
Within the Services occupations in Newberg, the most male-oriented occupations are Law Enforcement (86.4%), Security & Protection (80.7%), and Cleaning & Maintenance (64.0%), while the most female-oriented occupations are Healthcare Support (84.2%), Personal Care & Service (78.5%), and Food Preparation & Serving (57.8%).
| Occupation | Male | Female |
| Healthcare Support | 68 (15.9%) | 361 (84.2%) |
| Security & Protection | 280 (80.7%) | 67 (19.3%) |
| Firefighting & Prevention | 52 (62.6%) | 31 (37.3%) |
| Law Enforcement | 228 (86.4%) | 36 (13.6%) |
| Food Preparation & Serving | 357 (42.2%) | 489 (57.8%) |
| Cleaning & Maintenance | 295 (64.0%) | 166 (36.0%) |
| Personal Care & Service | 71 (21.4%) | 260 (78.5%) |
| Total (Category) | 1,071 (44.4%) | 1,343 (55.6%) |
| Total (Overall) | 7,236 (53.9%) | 6,190 (46.1%) |
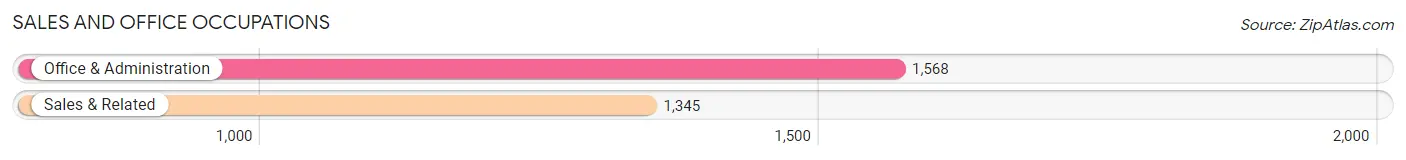
Sales and Office Occupations
The most common Sales and Office occupations in Newberg are Office & Administration (1,568 | 11.7%), and Sales & Related (1,345 | 10.0%).
Sales and Office Occupations by Sex
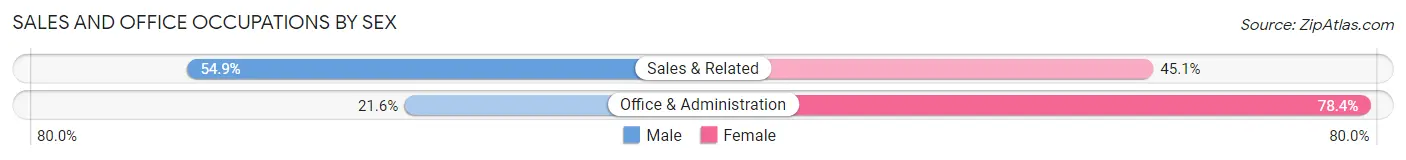
| Occupation | Male | Female |
| Sales & Related | 739 (54.9%) | 606 (45.1%) |
| Office & Administration | 339 (21.6%) | 1,229 (78.4%) |
| Total (Category) | 1,078 (37.0%) | 1,835 (63.0%) |
| Total (Overall) | 7,236 (53.9%) | 6,190 (46.1%) |
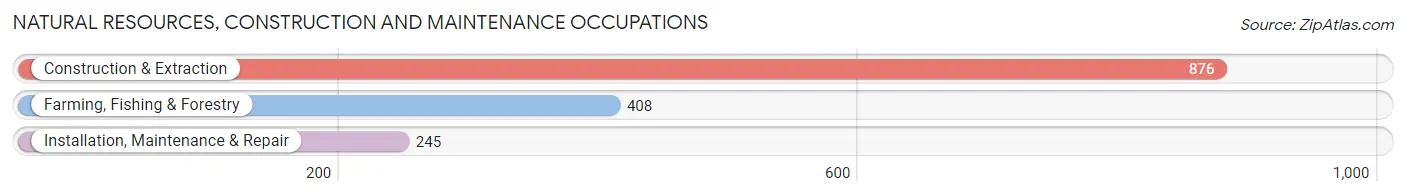
Natural Resources, Construction and Maintenance Occupations
The most common Natural Resources, Construction and Maintenance occupations in Newberg are Construction & Extraction (876 | 6.5%), Farming, Fishing & Forestry (408 | 3.0%), and Installation, Maintenance & Repair (245 | 1.8%).
Natural Resources, Construction and Maintenance Occupations by Sex
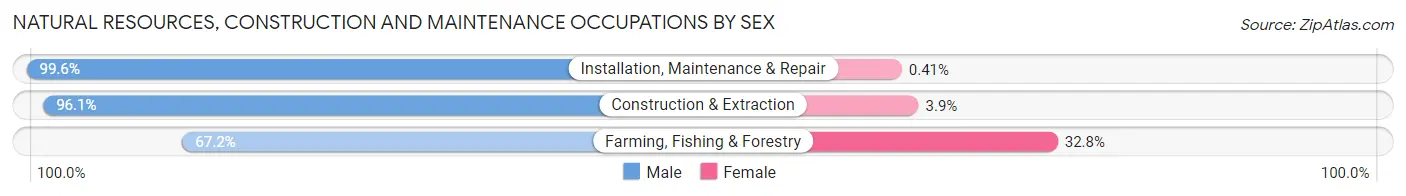
| Occupation | Male | Female |
| Farming, Fishing & Forestry | 274 (67.2%) | 134 (32.8%) |
| Construction & Extraction | 842 (96.1%) | 34 (3.9%) |
| Installation, Maintenance & Repair | 244 (99.6%) | 1 (0.4%) |
| Total (Category) | 1,360 (88.9%) | 169 (11.1%) |
| Total (Overall) | 7,236 (53.9%) | 6,190 (46.1%) |
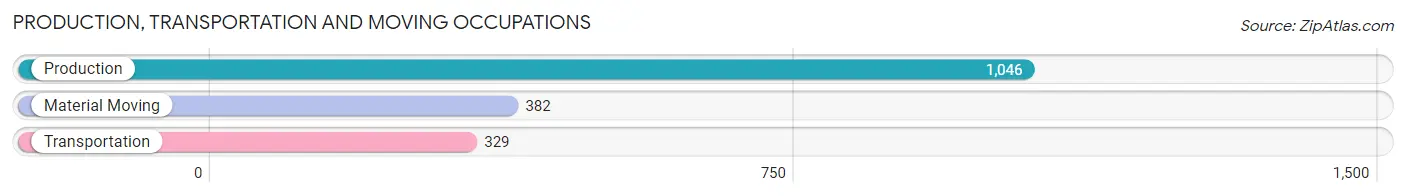
Production, Transportation and Moving Occupations
The most common Production, Transportation and Moving occupations in Newberg are Production (1,046 | 7.8%), Material Moving (382 | 2.9%), and Transportation (329 | 2.5%).
Production, Transportation and Moving Occupations by Sex
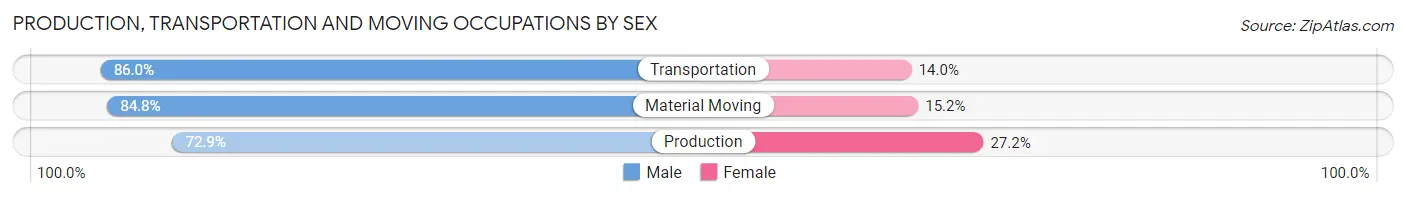
| Occupation | Male | Female |
| Production | 762 (72.9%) | 284 (27.2%) |
| Transportation | 283 (86.0%) | 46 (14.0%) |
| Material Moving | 324 (84.8%) | 58 (15.2%) |
| Total (Category) | 1,369 (77.9%) | 388 (22.1%) |
| Total (Overall) | 7,236 (53.9%) | 6,190 (46.1%) |
Employment Industries by Sex in Newberg
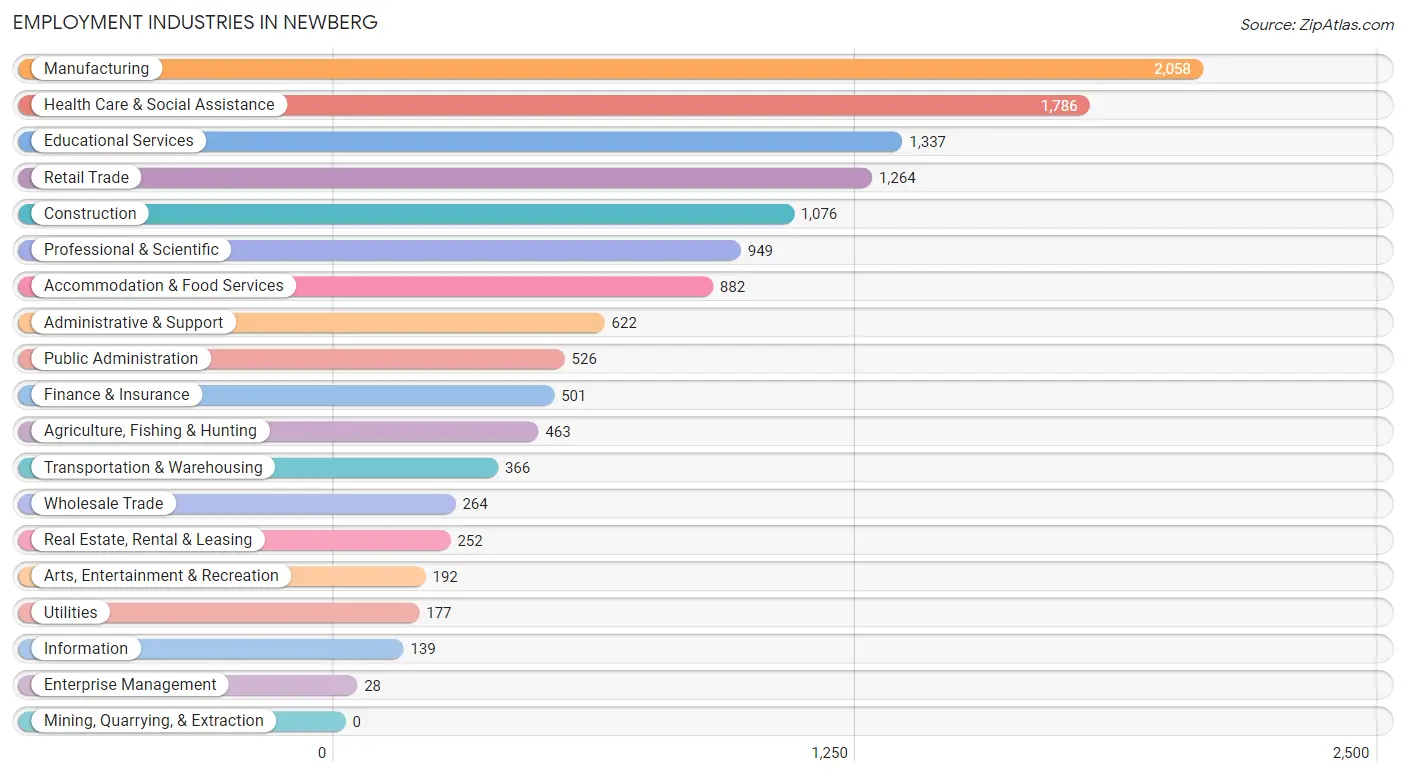
Employment Industries in Newberg
The major employment industries in Newberg include Manufacturing (2,058 | 15.3%), Health Care & Social Assistance (1,786 | 13.3%), Educational Services (1,337 | 10.0%), Retail Trade (1,264 | 9.4%), and Construction (1,076 | 8.0%).
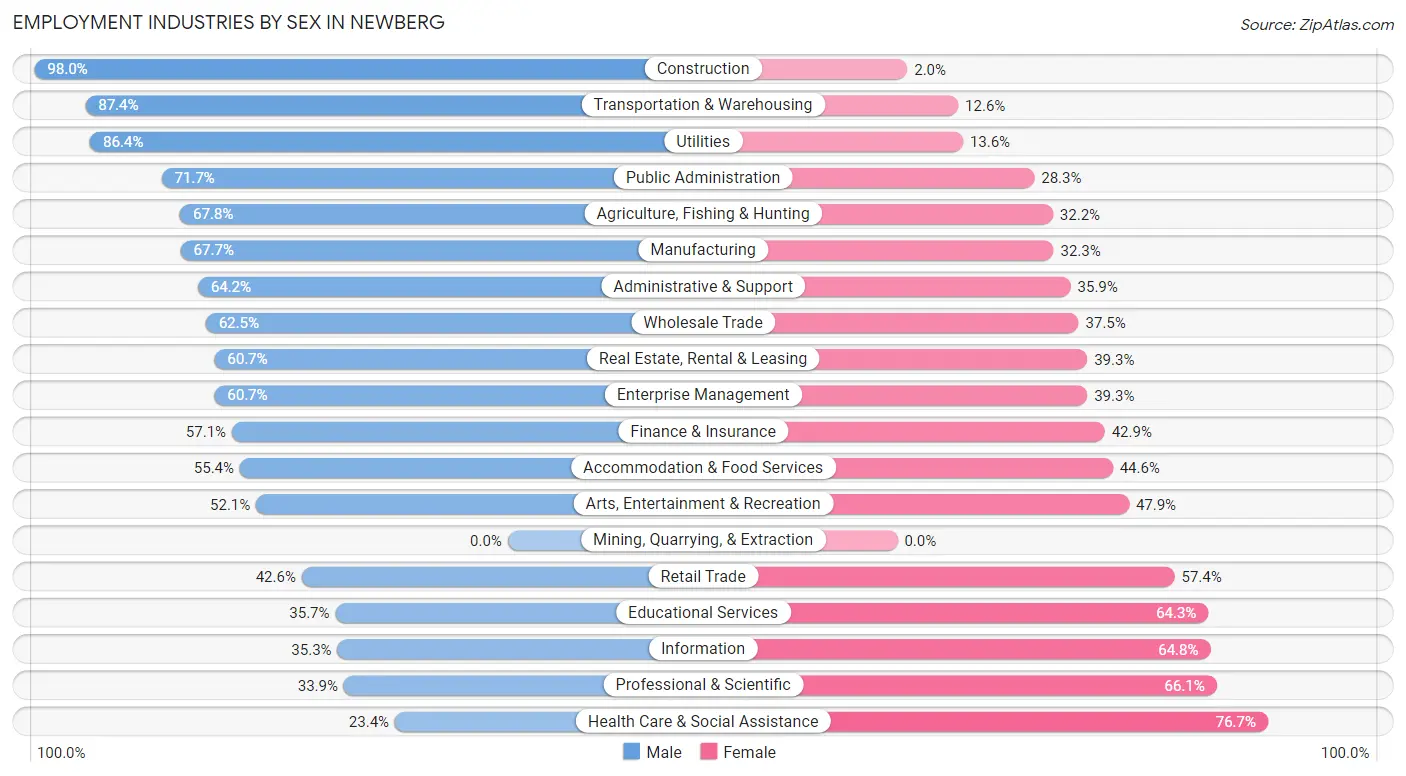
Employment Industries by Sex in Newberg
The Newberg industries that see more men than women are Construction (98.0%), Transportation & Warehousing (87.4%), and Utilities (86.4%), whereas the industries that tend to have a higher number of women are Health Care & Social Assistance (76.6%), Professional & Scientific (66.1%), and Information (64.7%).
| Industry | Male | Female |
| Agriculture, Fishing & Hunting | 314 (67.8%) | 149 (32.2%) |
| Mining, Quarrying, & Extraction | 0 (0.0%) | 0 (0.0%) |
| Construction | 1,054 (98.0%) | 22 (2.0%) |
| Manufacturing | 1,393 (67.7%) | 665 (32.3%) |
| Wholesale Trade | 165 (62.5%) | 99 (37.5%) |
| Retail Trade | 539 (42.6%) | 725 (57.4%) |
| Transportation & Warehousing | 320 (87.4%) | 46 (12.6%) |
| Utilities | 153 (86.4%) | 24 (13.6%) |
| Information | 49 (35.2%) | 90 (64.7%) |
| Finance & Insurance | 286 (57.1%) | 215 (42.9%) |
| Real Estate, Rental & Leasing | 153 (60.7%) | 99 (39.3%) |
| Professional & Scientific | 322 (33.9%) | 627 (66.1%) |
| Enterprise Management | 17 (60.7%) | 11 (39.3%) |
| Administrative & Support | 399 (64.1%) | 223 (35.8%) |
| Educational Services | 477 (35.7%) | 860 (64.3%) |
| Health Care & Social Assistance | 417 (23.4%) | 1,369 (76.6%) |
| Arts, Entertainment & Recreation | 100 (52.1%) | 92 (47.9%) |
| Accommodation & Food Services | 489 (55.4%) | 393 (44.6%) |
| Public Administration | 377 (71.7%) | 149 (28.3%) |
| Total | 7,236 (53.9%) | 6,190 (46.1%) |
Education in Newberg
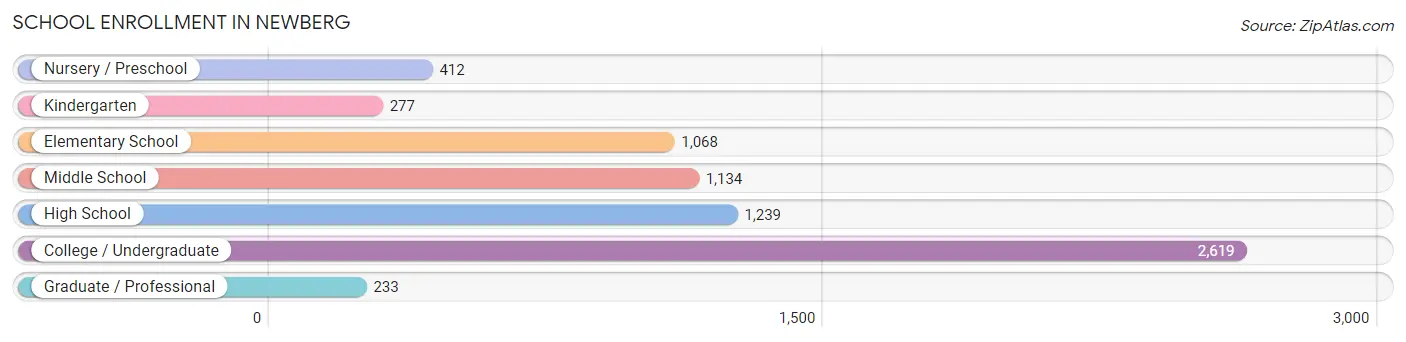
School Enrollment in Newberg
The most common levels of schooling among the 6,982 students in Newberg are college / undergraduate (2,619 | 37.5%), high school (1,239 | 17.7%), and middle school (1,134 | 16.2%).
| School Level | # Students | % Students |
| Nursery / Preschool | 412 | 5.9% |
| Kindergarten | 277 | 4.0% |
| Elementary School | 1,068 | 15.3% |
| Middle School | 1,134 | 16.2% |
| High School | 1,239 | 17.7% |
| College / Undergraduate | 2,619 | 37.5% |
| Graduate / Professional | 233 | 3.3% |
| Total | 6,982 | 100.0% |
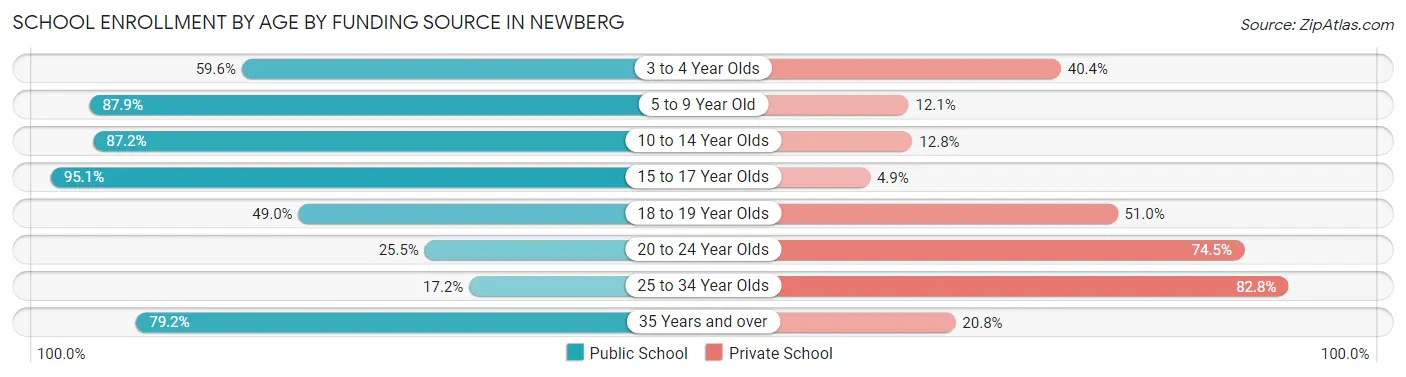
School Enrollment by Age by Funding Source in Newberg
Out of a total of 6,982 students who are enrolled in schools in Newberg, 2,409 (34.5%) attend a private institution, while the remaining 4,573 (65.5%) are enrolled in public schools. The age group of 25 to 34 year olds has the highest likelihood of being enrolled in private schools, with 308 (82.8% in the age bracket) enrolled. Conversely, the age group of 15 to 17 year olds has the lowest likelihood of being enrolled in a private school, with 875 (95.1% in the age bracket) attending a public institution.
| Age Bracket | Public School | Private School |
| 3 to 4 Year Olds | 218 (59.6%) | 148 (40.4%) |
| 5 to 9 Year Old | 1,033 (87.9%) | 142 (12.1%) |
| 10 to 14 Year Olds | 1,356 (87.2%) | 199 (12.8%) |
| 15 to 17 Year Olds | 875 (95.1%) | 45 (4.9%) |
| 18 to 19 Year Olds | 538 (49.0%) | 560 (51.0%) |
| 20 to 24 Year Olds | 331 (25.5%) | 968 (74.5%) |
| 25 to 34 Year Olds | 64 (17.2%) | 308 (82.8%) |
| 35 Years and over | 156 (79.2%) | 41 (20.8%) |
| Total | 4,573 (65.5%) | 2,409 (34.5%) |
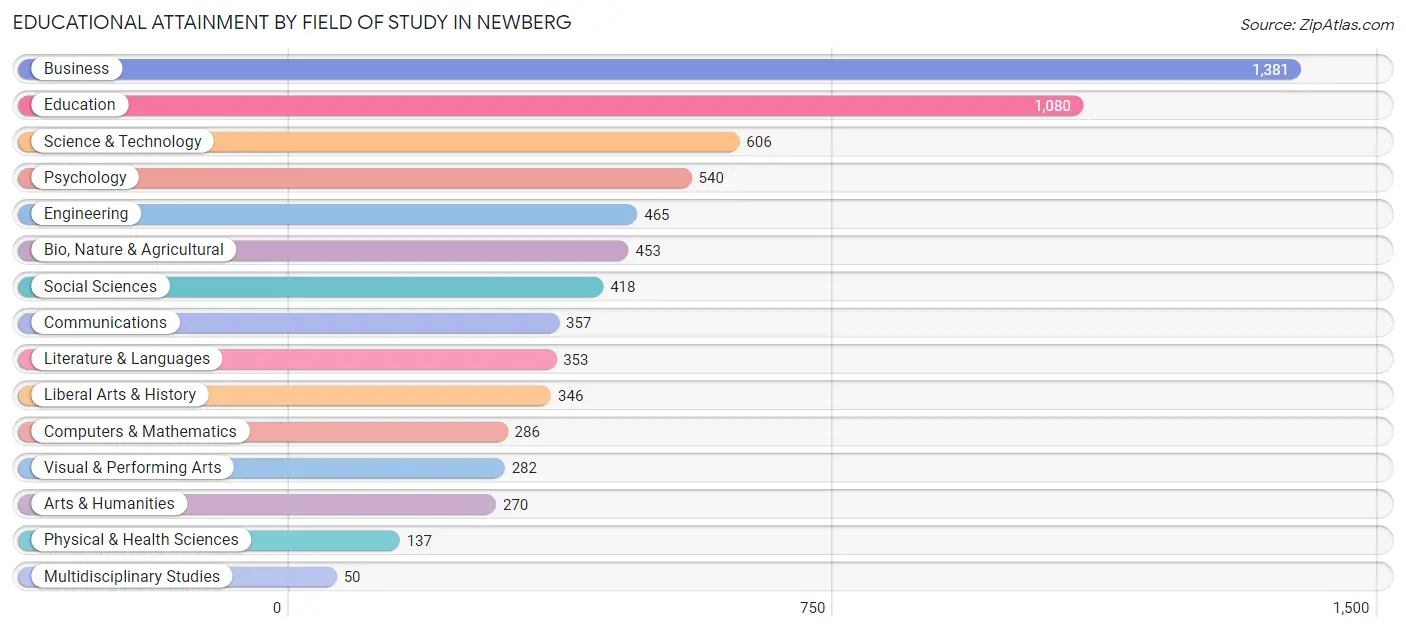
Educational Attainment by Field of Study in Newberg
Business (1,381 | 19.7%), education (1,080 | 15.4%), science & technology (606 | 8.6%), psychology (540 | 7.7%), and engineering (465 | 6.6%) are the most common fields of study among 7,024 individuals in Newberg who have obtained a bachelor's degree or higher.
| Field of Study | # Graduates | % Graduates |
| Computers & Mathematics | 286 | 4.1% |
| Bio, Nature & Agricultural | 453 | 6.5% |
| Physical & Health Sciences | 137 | 1.9% |
| Psychology | 540 | 7.7% |
| Social Sciences | 418 | 5.9% |
| Engineering | 465 | 6.6% |
| Multidisciplinary Studies | 50 | 0.7% |
| Science & Technology | 606 | 8.6% |
| Business | 1,381 | 19.7% |
| Education | 1,080 | 15.4% |
| Literature & Languages | 353 | 5.0% |
| Liberal Arts & History | 346 | 4.9% |
| Visual & Performing Arts | 282 | 4.0% |
| Communications | 357 | 5.1% |
| Arts & Humanities | 270 | 3.8% |
| Total | 7,024 | 100.0% |
Transportation & Commute in Newberg
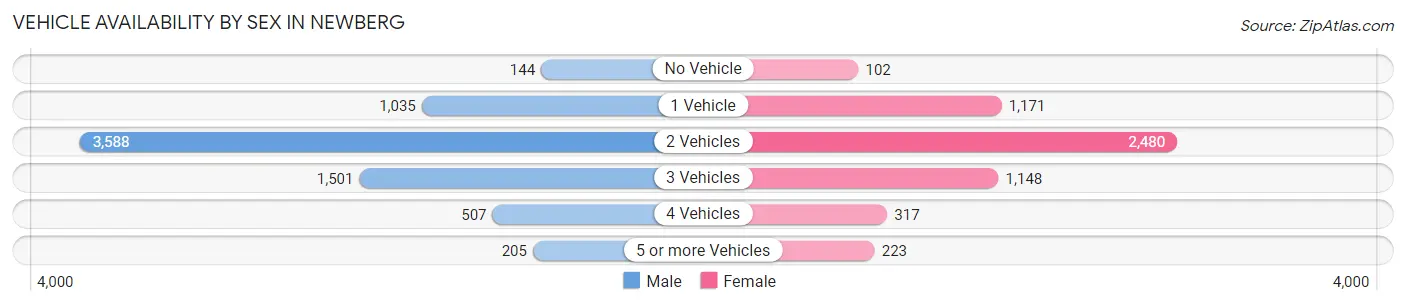
Vehicle Availability by Sex in Newberg
The most prevalent vehicle ownership categories in Newberg are males with 2 vehicles (3,588, accounting for 51.4%) and females with 2 vehicles (2,480, making up 65.9%).
| Vehicles Available | Male | Female |
| No Vehicle | 144 (2.1%) | 102 (1.9%) |
| 1 Vehicle | 1,035 (14.8%) | 1,171 (21.5%) |
| 2 Vehicles | 3,588 (51.4%) | 2,480 (45.6%) |
| 3 Vehicles | 1,501 (21.5%) | 1,148 (21.1%) |
| 4 Vehicles | 507 (7.3%) | 317 (5.8%) |
| 5 or more Vehicles | 205 (2.9%) | 223 (4.1%) |
| Total | 6,980 (100.0%) | 5,441 (100.0%) |
Commute Time in Newberg
The most frequently occuring commute durations in Newberg are 5 to 9 minutes (2,144 commuters, 18.5%), 30 to 34 minutes (1,578 commuters, 13.6%), and 10 to 14 minutes (1,355 commuters, 11.7%).
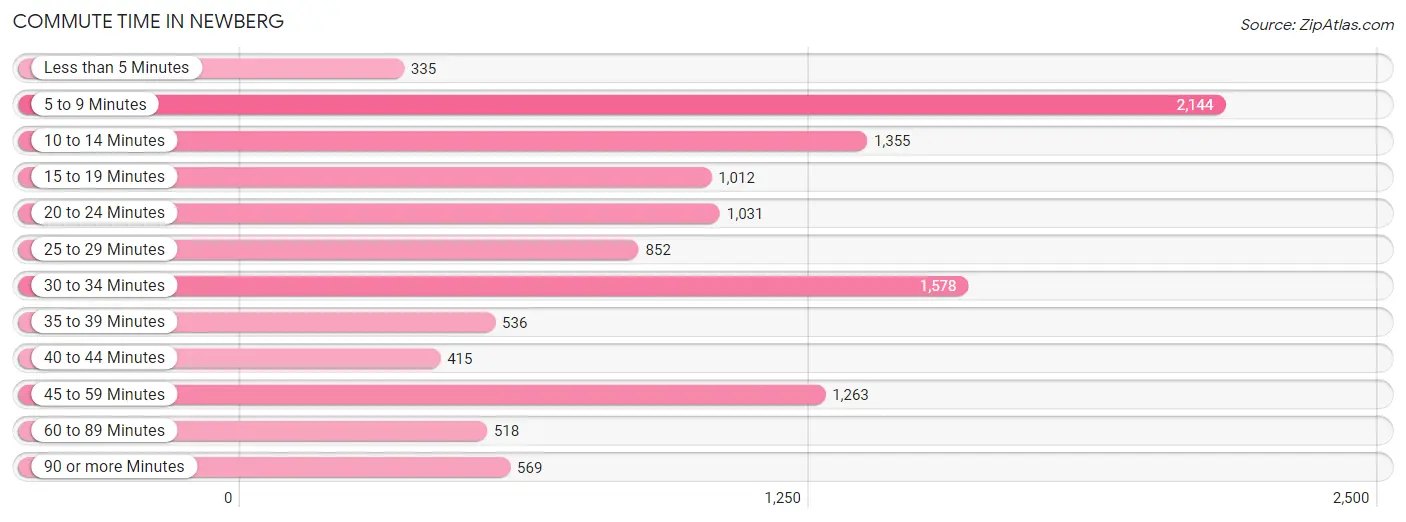
| Commute Time | # Commuters | % Commuters |
| Less than 5 Minutes | 335 | 2.9% |
| 5 to 9 Minutes | 2,144 | 18.5% |
| 10 to 14 Minutes | 1,355 | 11.7% |
| 15 to 19 Minutes | 1,012 | 8.7% |
| 20 to 24 Minutes | 1,031 | 8.9% |
| 25 to 29 Minutes | 852 | 7.3% |
| 30 to 34 Minutes | 1,578 | 13.6% |
| 35 to 39 Minutes | 536 | 4.6% |
| 40 to 44 Minutes | 415 | 3.6% |
| 45 to 59 Minutes | 1,263 | 10.9% |
| 60 to 89 Minutes | 518 | 4.5% |
| 90 or more Minutes | 569 | 4.9% |
Commute Time by Sex in Newberg
The most common commute times in Newberg are 30 to 34 minutes (1,023 commuters, 15.9%) for males and 5 to 9 minutes (1,208 commuters, 23.3%) for females.
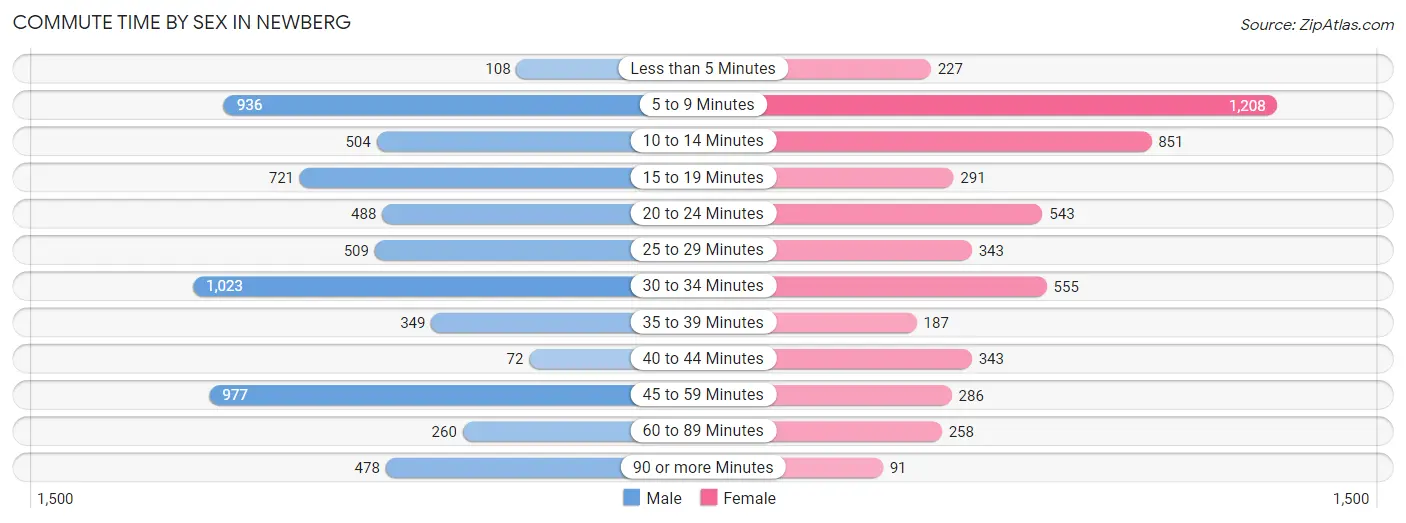
| Commute Time | Male | Female |
| Less than 5 Minutes | 108 (1.7%) | 227 (4.4%) |
| 5 to 9 Minutes | 936 (14.6%) | 1,208 (23.3%) |
| 10 to 14 Minutes | 504 (7.8%) | 851 (16.4%) |
| 15 to 19 Minutes | 721 (11.2%) | 291 (5.6%) |
| 20 to 24 Minutes | 488 (7.6%) | 543 (10.5%) |
| 25 to 29 Minutes | 509 (7.9%) | 343 (6.6%) |
| 30 to 34 Minutes | 1,023 (15.9%) | 555 (10.7%) |
| 35 to 39 Minutes | 349 (5.4%) | 187 (3.6%) |
| 40 to 44 Minutes | 72 (1.1%) | 343 (6.6%) |
| 45 to 59 Minutes | 977 (15.2%) | 286 (5.5%) |
| 60 to 89 Minutes | 260 (4.1%) | 258 (5.0%) |
| 90 or more Minutes | 478 (7.4%) | 91 (1.8%) |
Time of Departure to Work by Sex in Newberg
The most frequent times of departure to work in Newberg are 8:00 AM to 8:29 AM (772, 12.0%) for males and 8:00 AM to 8:29 AM (887, 17.1%) for females.
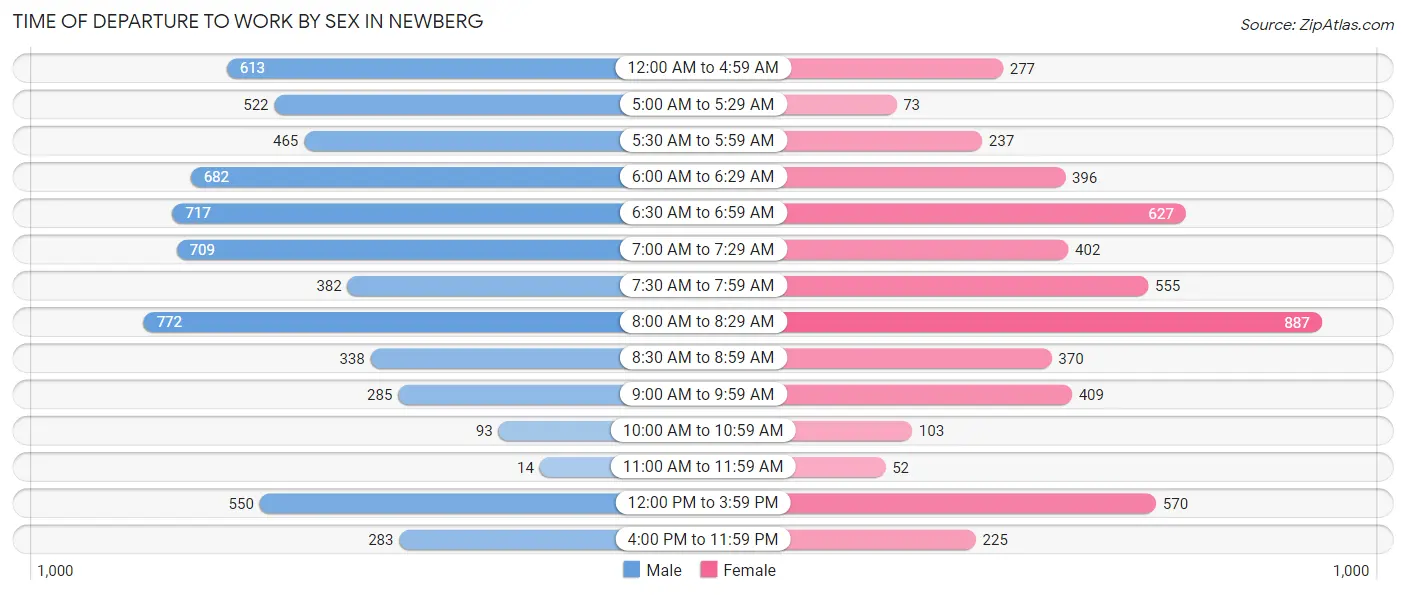
| Time of Departure | Male | Female |
| 12:00 AM to 4:59 AM | 613 (9.5%) | 277 (5.3%) |
| 5:00 AM to 5:29 AM | 522 (8.1%) | 73 (1.4%) |
| 5:30 AM to 5:59 AM | 465 (7.2%) | 237 (4.6%) |
| 6:00 AM to 6:29 AM | 682 (10.6%) | 396 (7.6%) |
| 6:30 AM to 6:59 AM | 717 (11.2%) | 627 (12.1%) |
| 7:00 AM to 7:29 AM | 709 (11.0%) | 402 (7.8%) |
| 7:30 AM to 7:59 AM | 382 (5.9%) | 555 (10.7%) |
| 8:00 AM to 8:29 AM | 772 (12.0%) | 887 (17.1%) |
| 8:30 AM to 8:59 AM | 338 (5.3%) | 370 (7.1%) |
| 9:00 AM to 9:59 AM | 285 (4.4%) | 409 (7.9%) |
| 10:00 AM to 10:59 AM | 93 (1.5%) | 103 (2.0%) |
| 11:00 AM to 11:59 AM | 14 (0.2%) | 52 (1.0%) |
| 12:00 PM to 3:59 PM | 550 (8.6%) | 570 (11.0%) |
| 4:00 PM to 11:59 PM | 283 (4.4%) | 225 (4.3%) |
| Total | 6,425 (100.0%) | 5,183 (100.0%) |
Housing Occupancy in Newberg
Occupancy by Ownership in Newberg
Of the total 9,210 dwellings in Newberg, owner-occupied units account for 5,839 (63.4%), while renter-occupied units make up 3,371 (36.6%).
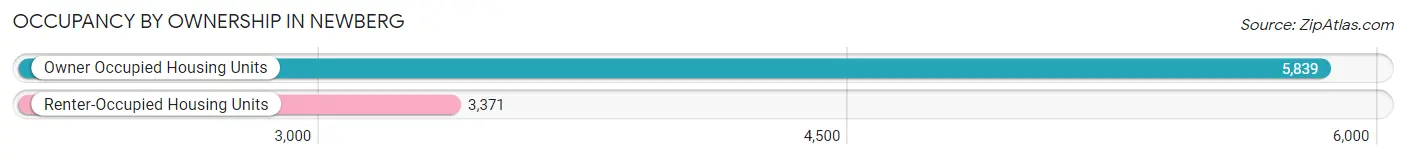
| Occupancy | # Housing Units | % Housing Units |
| Owner Occupied Housing Units | 5,839 | 63.4% |
| Renter-Occupied Housing Units | 3,371 | 36.6% |
| Total Occupied Housing Units | 9,210 | 100.0% |
Occupancy by Household Size in Newberg
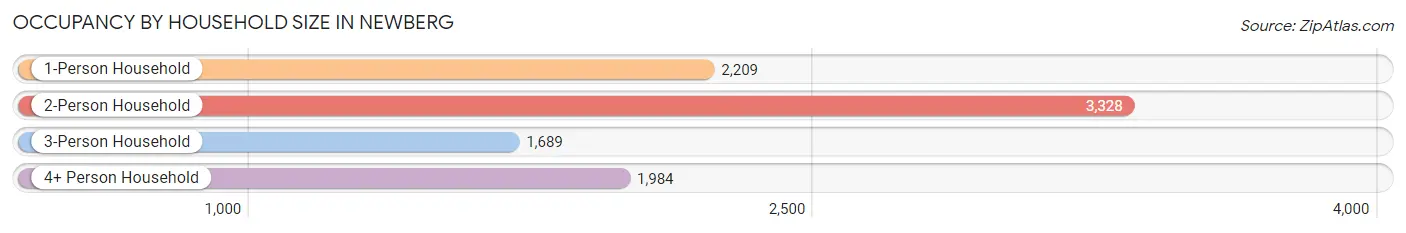
| Household Size | # Housing Units | % Housing Units |
| 1-Person Household | 2,209 | 24.0% |
| 2-Person Household | 3,328 | 36.1% |
| 3-Person Household | 1,689 | 18.3% |
| 4+ Person Household | 1,984 | 21.5% |
| Total Housing Units | 9,210 | 100.0% |
Occupancy by Ownership by Household Size in Newberg
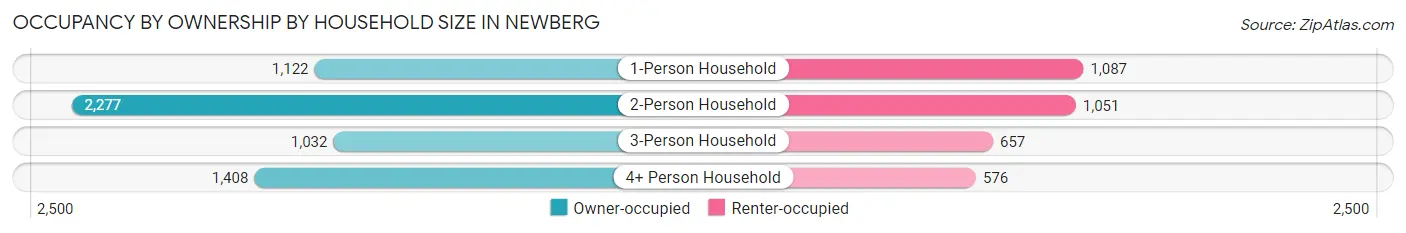
| Household Size | Owner-occupied | Renter-occupied |
| 1-Person Household | 1,122 (50.8%) | 1,087 (49.2%) |
| 2-Person Household | 2,277 (68.4%) | 1,051 (31.6%) |
| 3-Person Household | 1,032 (61.1%) | 657 (38.9%) |
| 4+ Person Household | 1,408 (71.0%) | 576 (29.0%) |
| Total Housing Units | 5,839 (63.4%) | 3,371 (36.6%) |
Occupancy by Educational Attainment in Newberg
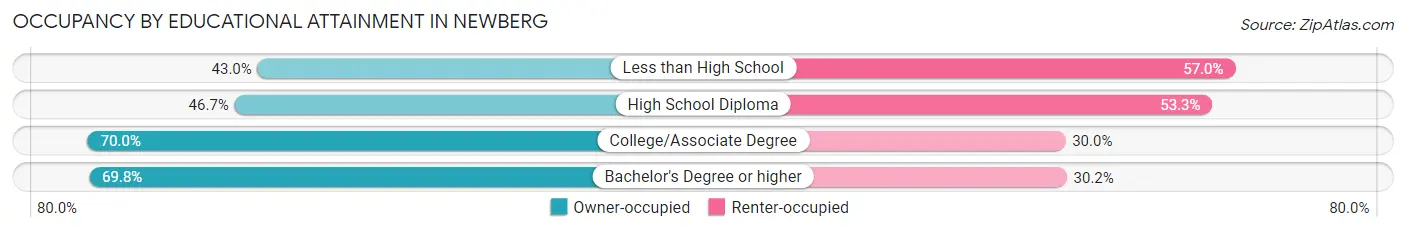
| Household Size | Owner-occupied | Renter-occupied |
| Less than High School | 263 (43.0%) | 348 (57.0%) |
| High School Diploma | 873 (46.7%) | 997 (53.3%) |
| College/Associate Degree | 2,152 (70.0%) | 922 (30.0%) |
| Bachelor's Degree or higher | 2,551 (69.8%) | 1,104 (30.2%) |
Occupancy by Age of Householder in Newberg
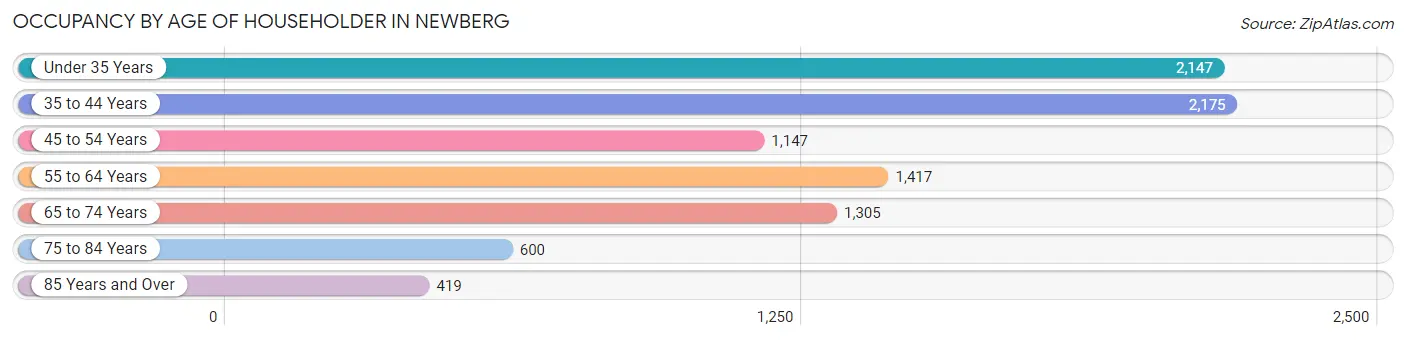
| Age Bracket | # Households | % Households |
| Under 35 Years | 2,147 | 23.3% |
| 35 to 44 Years | 2,175 | 23.6% |
| 45 to 54 Years | 1,147 | 12.4% |
| 55 to 64 Years | 1,417 | 15.4% |
| 65 to 74 Years | 1,305 | 14.2% |
| 75 to 84 Years | 600 | 6.5% |
| 85 Years and Over | 419 | 4.5% |
| Total | 9,210 | 100.0% |
Housing Finances in Newberg
Median Income by Occupancy in Newberg
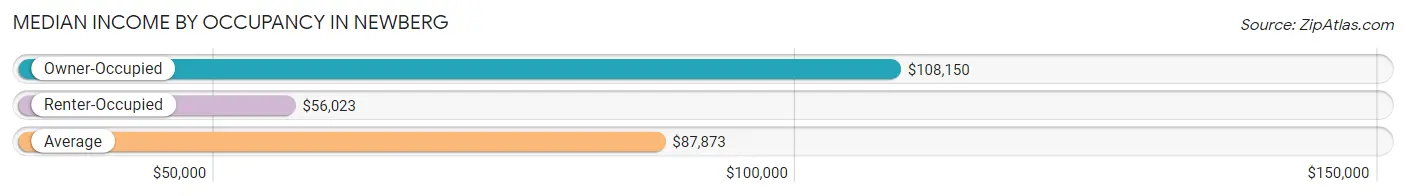
| Occupancy Type | # Households | Median Income |
| Owner-Occupied | 5,839 (63.4%) | $108,150 |
| Renter-Occupied | 3,371 (36.6%) | $56,023 |
| Average | 9,210 (100.0%) | $87,873 |
Occupancy by Householder Income Bracket in Newberg
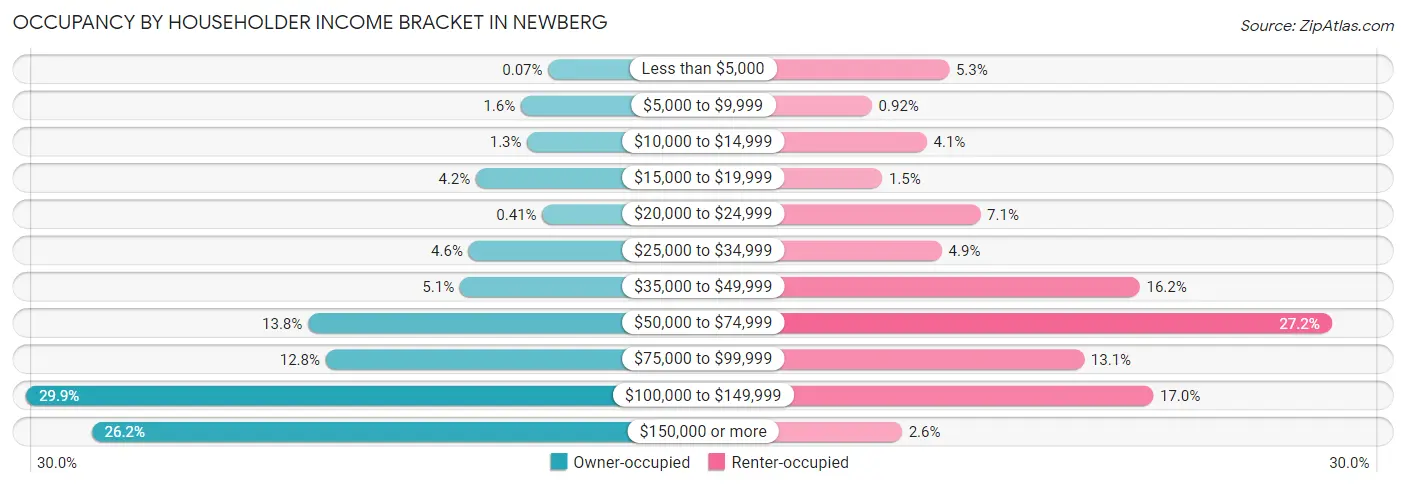
| Income Bracket | Owner-occupied | Renter-occupied |
| Less than $5,000 | 4 (0.1%) | 180 (5.3%) |
| $5,000 to $9,999 | 95 (1.6%) | 31 (0.9%) |
| $10,000 to $14,999 | 74 (1.3%) | 137 (4.1%) |
| $15,000 to $19,999 | 245 (4.2%) | 51 (1.5%) |
| $20,000 to $24,999 | 24 (0.4%) | 240 (7.1%) |
| $25,000 to $34,999 | 270 (4.6%) | 166 (4.9%) |
| $35,000 to $49,999 | 299 (5.1%) | 547 (16.2%) |
| $50,000 to $74,999 | 806 (13.8%) | 917 (27.2%) |
| $75,000 to $99,999 | 747 (12.8%) | 440 (13.1%) |
| $100,000 to $149,999 | 1,747 (29.9%) | 573 (17.0%) |
| $150,000 or more | 1,528 (26.2%) | 89 (2.6%) |
| Total | 5,839 (100.0%) | 3,371 (100.0%) |
Monthly Housing Cost Tiers in Newberg
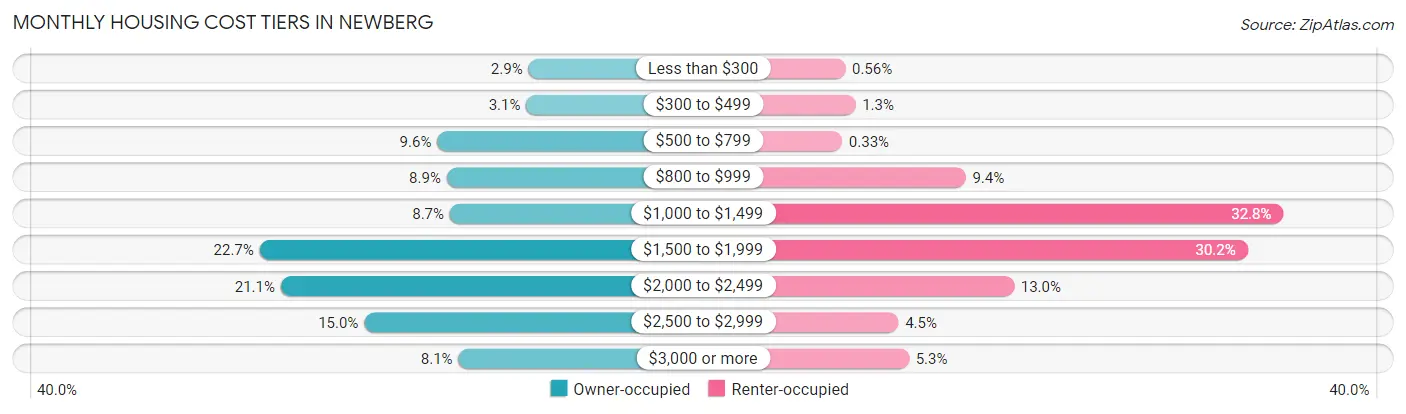
| Monthly Cost | Owner-occupied | Renter-occupied |
| Less than $300 | 169 (2.9%) | 19 (0.6%) |
| $300 to $499 | 178 (3.0%) | 44 (1.3%) |
| $500 to $799 | 561 (9.6%) | 11 (0.3%) |
| $800 to $999 | 520 (8.9%) | 318 (9.4%) |
| $1,000 to $1,499 | 507 (8.7%) | 1,107 (32.8%) |
| $1,500 to $1,999 | 1,325 (22.7%) | 1,018 (30.2%) |
| $2,000 to $2,499 | 1,234 (21.1%) | 438 (13.0%) |
| $2,500 to $2,999 | 875 (15.0%) | 151 (4.5%) |
| $3,000 or more | 470 (8.1%) | 177 (5.2%) |
| Total | 5,839 (100.0%) | 3,371 (100.0%) |
Physical Housing Characteristics in Newberg
Housing Structures in Newberg
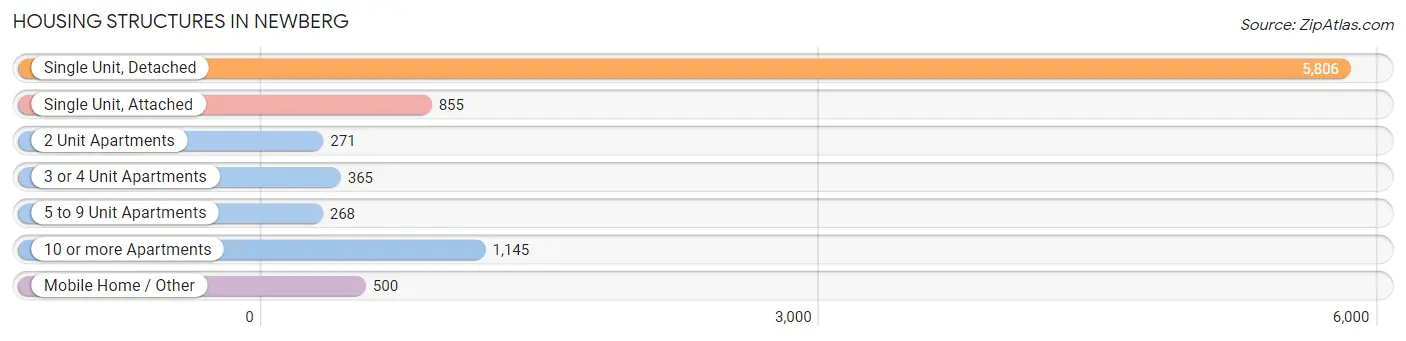
| Structure Type | # Housing Units | % Housing Units |
| Single Unit, Detached | 5,806 | 63.0% |
| Single Unit, Attached | 855 | 9.3% |
| 2 Unit Apartments | 271 | 2.9% |
| 3 or 4 Unit Apartments | 365 | 4.0% |
| 5 to 9 Unit Apartments | 268 | 2.9% |
| 10 or more Apartments | 1,145 | 12.4% |
| Mobile Home / Other | 500 | 5.4% |
| Total | 9,210 | 100.0% |
Housing Structures by Occupancy in Newberg
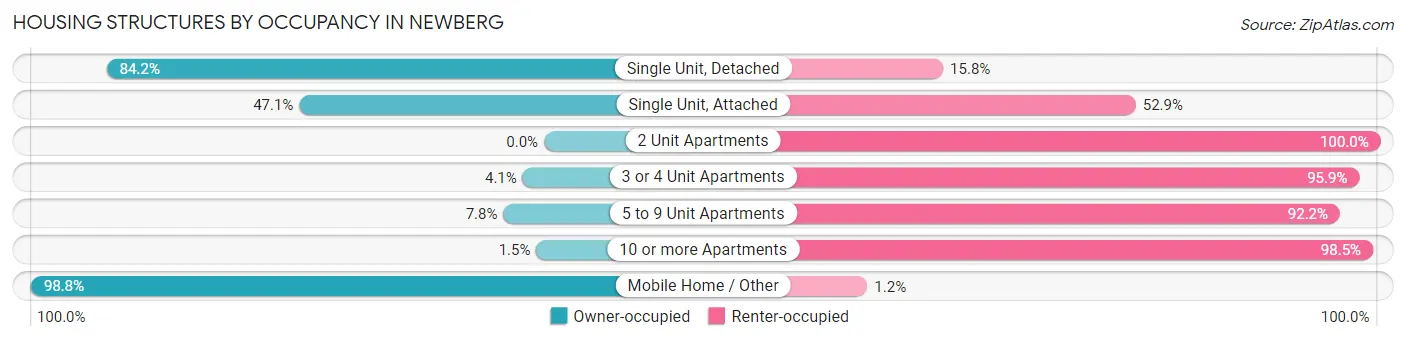
| Structure Type | Owner-occupied | Renter-occupied |
| Single Unit, Detached | 4,889 (84.2%) | 917 (15.8%) |
| Single Unit, Attached | 403 (47.1%) | 452 (52.9%) |
| 2 Unit Apartments | 0 (0.0%) | 271 (100.0%) |
| 3 or 4 Unit Apartments | 15 (4.1%) | 350 (95.9%) |
| 5 to 9 Unit Apartments | 21 (7.8%) | 247 (92.2%) |
| 10 or more Apartments | 17 (1.5%) | 1,128 (98.5%) |
| Mobile Home / Other | 494 (98.8%) | 6 (1.2%) |
| Total | 5,839 (63.4%) | 3,371 (36.6%) |
Housing Structures by Number of Rooms in Newberg
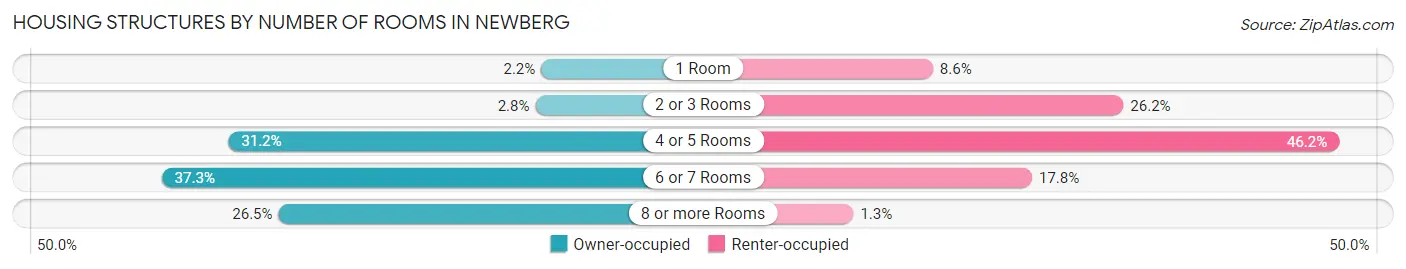
| Number of Rooms | Owner-occupied | Renter-occupied |
| 1 Room | 130 (2.2%) | 290 (8.6%) |
| 2 or 3 Rooms | 162 (2.8%) | 884 (26.2%) |
| 4 or 5 Rooms | 1,819 (31.1%) | 1,556 (46.2%) |
| 6 or 7 Rooms | 2,179 (37.3%) | 599 (17.8%) |
| 8 or more Rooms | 1,549 (26.5%) | 42 (1.3%) |
| Total | 5,839 (100.0%) | 3,371 (100.0%) |
Housing Structure by Heating Type in Newberg
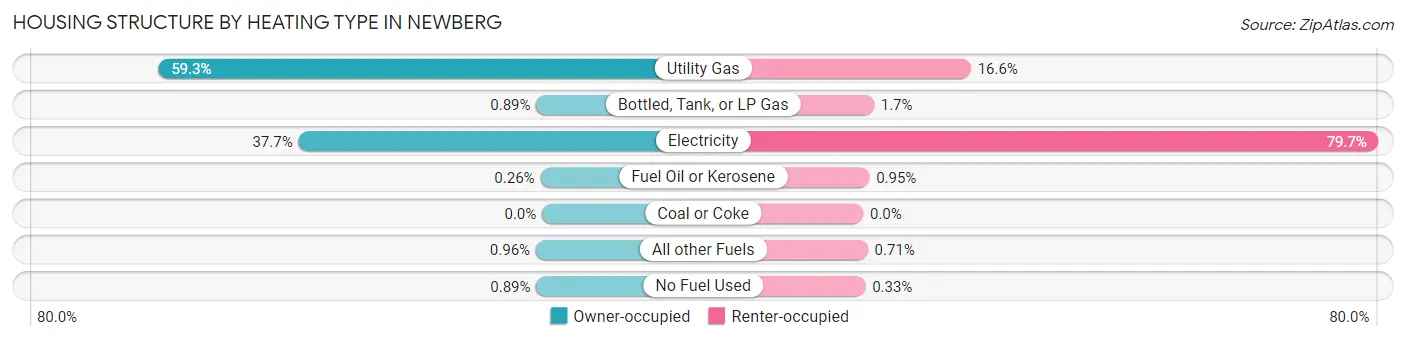
| Heating Type | Owner-occupied | Renter-occupied |
| Utility Gas | 3,465 (59.3%) | 561 (16.6%) |
| Bottled, Tank, or LP Gas | 52 (0.9%) | 56 (1.7%) |
| Electricity | 2,199 (37.7%) | 2,687 (79.7%) |
| Fuel Oil or Kerosene | 15 (0.3%) | 32 (0.9%) |
| Coal or Coke | 0 (0.0%) | 0 (0.0%) |
| All other Fuels | 56 (1.0%) | 24 (0.7%) |
| No Fuel Used | 52 (0.9%) | 11 (0.3%) |
| Total | 5,839 (100.0%) | 3,371 (100.0%) |
Household Vehicle Usage in Newberg
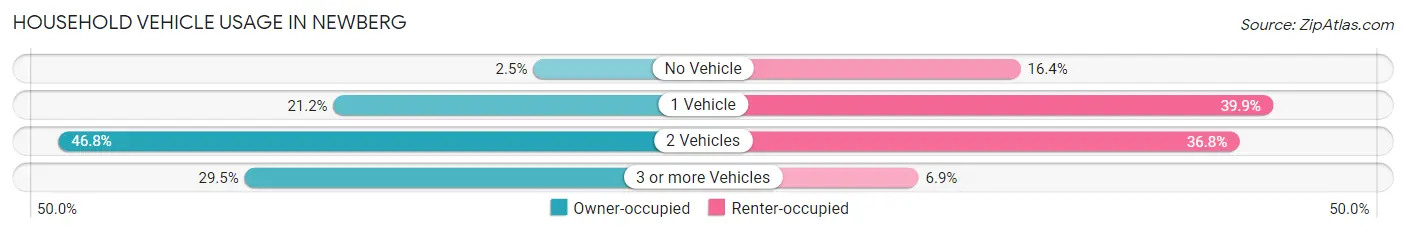
| Vehicles per Household | Owner-occupied | Renter-occupied |
| No Vehicle | 147 (2.5%) | 553 (16.4%) |
| 1 Vehicle | 1,236 (21.2%) | 1,346 (39.9%) |
| 2 Vehicles | 2,735 (46.8%) | 1,240 (36.8%) |
| 3 or more Vehicles | 1,721 (29.5%) | 232 (6.9%) |
| Total | 5,839 (100.0%) | 3,371 (100.0%) |
Real Estate & Mortgages in Newberg
Real Estate and Mortgage Overview in Newberg
| Characteristic | Without Mortgage | With Mortgage |
| Housing Units | 1,293 | 4,546 |
| Median Property Value | $337,500 | $449,800 |
| Median Household Income | $63,537 | $1,386 |
| Monthly Housing Costs | $663 | $470 |
| Real Estate Taxes | $2,655 | $0 |
Property Value by Mortgage Status in Newberg
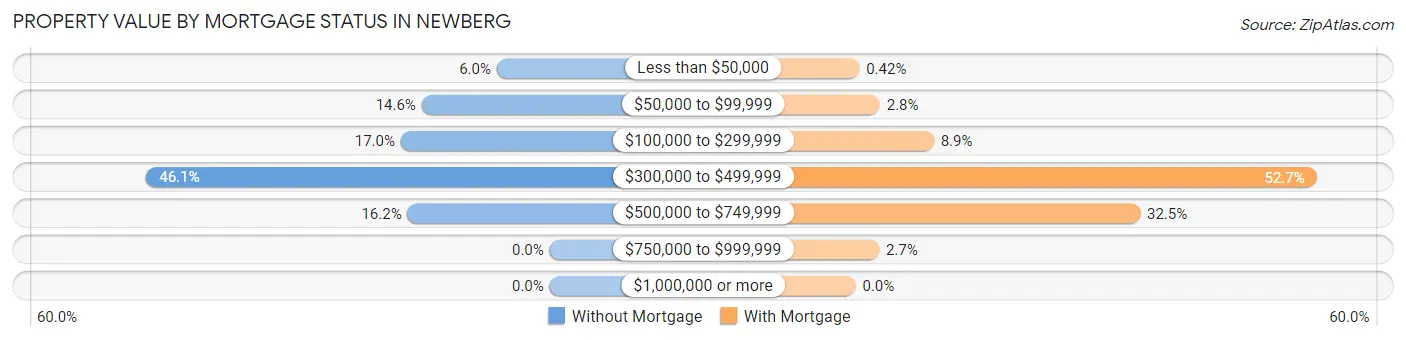
| Property Value | Without Mortgage | With Mortgage |
| Less than $50,000 | 78 (6.0%) | 19 (0.4%) |
| $50,000 to $99,999 | 189 (14.6%) | 126 (2.8%) |
| $100,000 to $299,999 | 220 (17.0%) | 406 (8.9%) |
| $300,000 to $499,999 | 596 (46.1%) | 2,395 (52.7%) |
| $500,000 to $749,999 | 210 (16.2%) | 1,478 (32.5%) |
| $750,000 to $999,999 | 0 (0.0%) | 122 (2.7%) |
| $1,000,000 or more | 0 (0.0%) | 0 (0.0%) |
| Total | 1,293 (100.0%) | 4,546 (100.0%) |
Household Income by Mortgage Status in Newberg
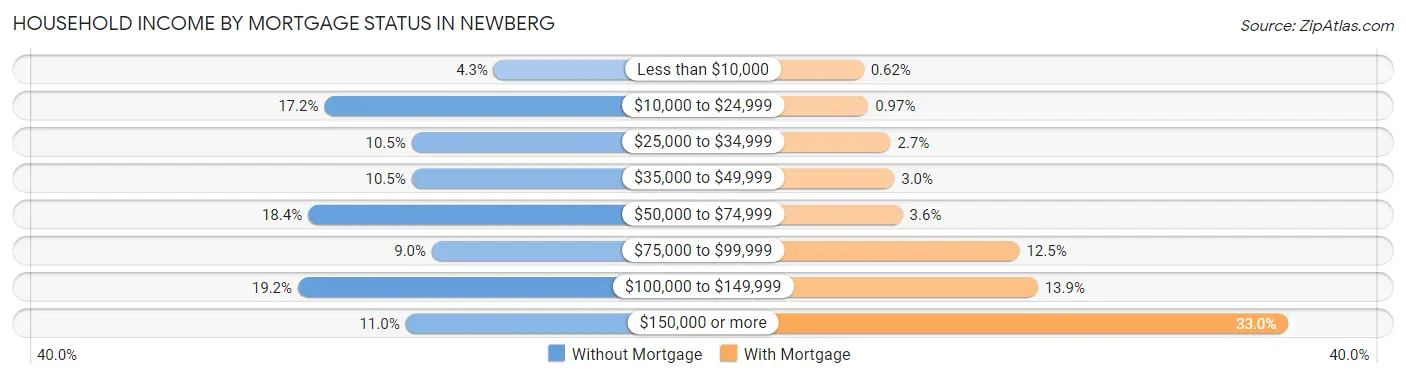
| Household Income | Without Mortgage | With Mortgage |
| Less than $10,000 | 55 (4.3%) | 28 (0.6%) |
| $10,000 to $24,999 | 222 (17.2%) | 44 (1.0%) |
| $25,000 to $34,999 | 136 (10.5%) | 121 (2.7%) |
| $35,000 to $49,999 | 136 (10.5%) | 134 (2.9%) |
| $50,000 to $74,999 | 238 (18.4%) | 163 (3.6%) |
| $75,000 to $99,999 | 116 (9.0%) | 568 (12.5%) |
| $100,000 to $149,999 | 248 (19.2%) | 631 (13.9%) |
| $150,000 or more | 142 (11.0%) | 1,499 (33.0%) |
| Total | 1,293 (100.0%) | 4,546 (100.0%) |
Property Value to Household Income Ratio in Newberg
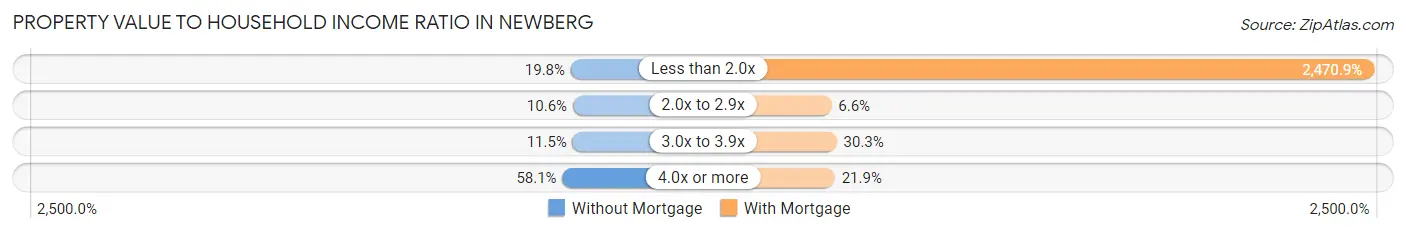
| Value-to-Income Ratio | Without Mortgage | With Mortgage |
| Less than 2.0x | 256 (19.8%) | 112,325 (2,470.9%) |
| 2.0x to 2.9x | 137 (10.6%) | 299 (6.6%) |
| 3.0x to 3.9x | 149 (11.5%) | 1,376 (30.3%) |
| 4.0x or more | 751 (58.1%) | 996 (21.9%) |
| Total | 1,293 (100.0%) | 4,546 (100.0%) |
Real Estate Taxes by Mortgage Status in Newberg
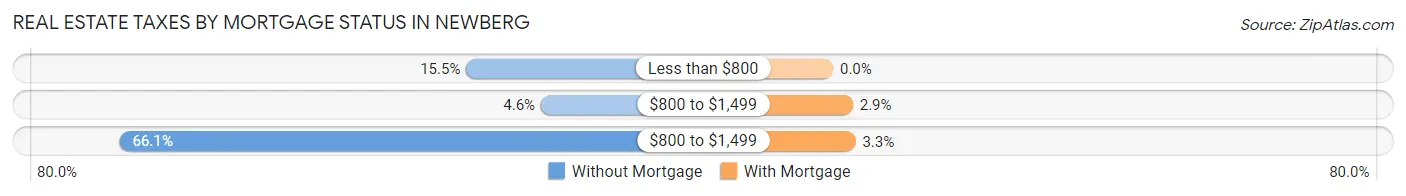
| Property Taxes | Without Mortgage | With Mortgage |
| Less than $800 | 200 (15.5%) | 0 (0.0%) |
| $800 to $1,499 | 59 (4.6%) | 131 (2.9%) |
| $800 to $1,499 | 855 (66.1%) | 149 (3.3%) |
| Total | 1,293 (100.0%) | 4,546 (100.0%) |
Health & Disability in Newberg
Health Insurance Coverage by Age in Newberg
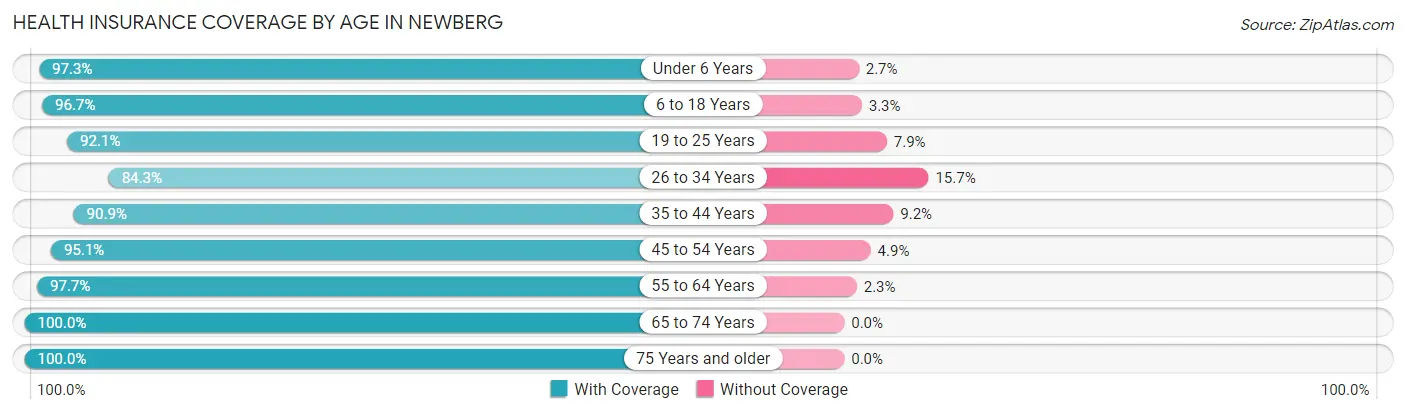
| Age Bracket | With Coverage | Without Coverage |
| Under 6 Years | 2,056 (97.3%) | 57 (2.7%) |
| 6 to 18 Years | 4,122 (96.7%) | 139 (3.3%) |
| 19 to 25 Years | 2,785 (92.1%) | 240 (7.9%) |
| 26 to 34 Years | 3,194 (84.3%) | 595 (15.7%) |
| 35 to 44 Years | 3,268 (90.8%) | 329 (9.1%) |
| 45 to 54 Years | 2,280 (95.1%) | 118 (4.9%) |
| 55 to 64 Years | 2,430 (97.7%) | 58 (2.3%) |
| 65 to 74 Years | 2,113 (100.0%) | 0 (0.0%) |
| 75 Years and older | 1,446 (100.0%) | 0 (0.0%) |
| Total | 23,694 (93.9%) | 1,536 (6.1%) |
Health Insurance Coverage by Citizenship Status in Newberg
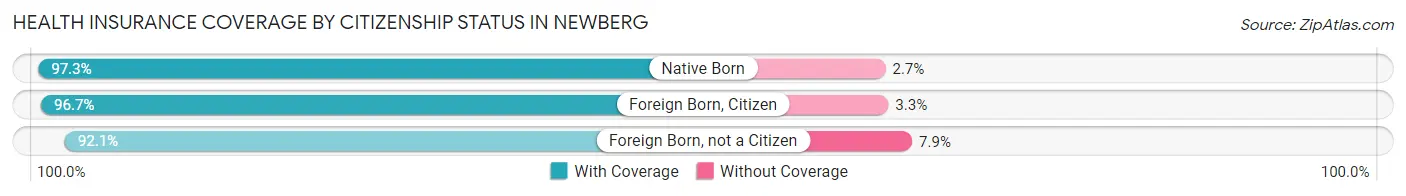
| Citizenship Status | With Coverage | Without Coverage |
| Native Born | 2,056 (97.3%) | 57 (2.7%) |
| Foreign Born, Citizen | 4,122 (96.7%) | 139 (3.3%) |
| Foreign Born, not a Citizen | 2,785 (92.1%) | 240 (7.9%) |
Health Insurance Coverage by Household Income in Newberg
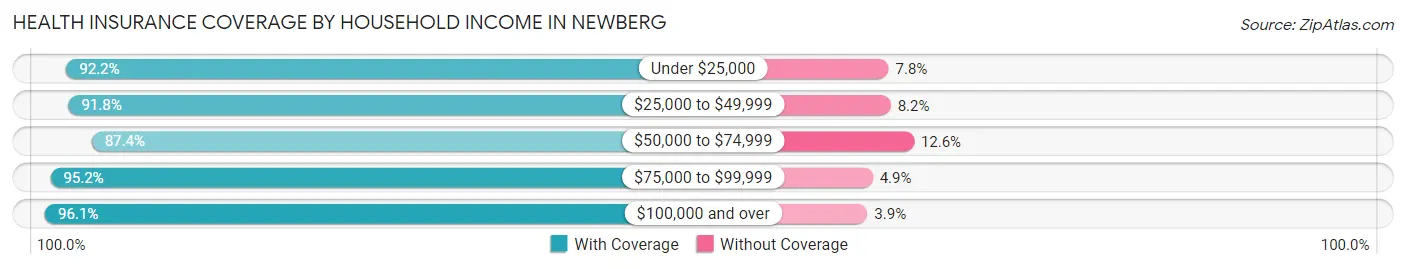
| Household Income | With Coverage | Without Coverage |
| Under $25,000 | 1,543 (92.2%) | 131 (7.8%) |
| $25,000 to $49,999 | 2,220 (91.8%) | 199 (8.2%) |
| $50,000 to $74,999 | 3,758 (87.4%) | 541 (12.6%) |
| $75,000 to $99,999 | 2,999 (95.2%) | 153 (4.9%) |
| $100,000 and over | 11,542 (96.1%) | 464 (3.9%) |
Public vs Private Health Insurance Coverage by Age in Newberg
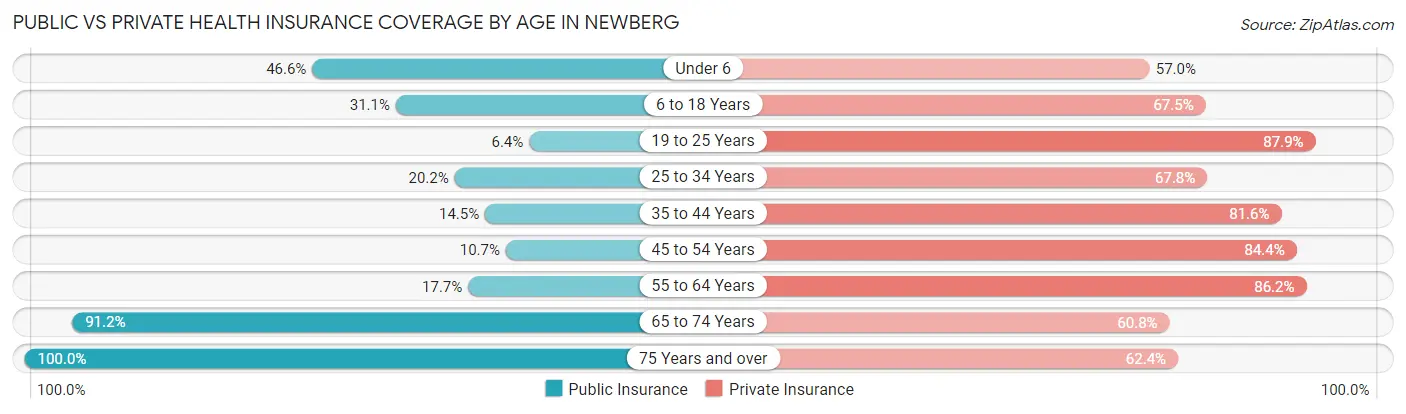
| Age Bracket | Public Insurance | Private Insurance |
| Under 6 | 985 (46.6%) | 1,204 (57.0%) |
| 6 to 18 Years | 1,325 (31.1%) | 2,876 (67.5%) |
| 19 to 25 Years | 192 (6.4%) | 2,659 (87.9%) |
| 25 to 34 Years | 765 (20.2%) | 2,569 (67.8%) |
| 35 to 44 Years | 523 (14.5%) | 2,934 (81.6%) |
| 45 to 54 Years | 256 (10.7%) | 2,024 (84.4%) |
| 55 to 64 Years | 440 (17.7%) | 2,145 (86.2%) |
| 65 to 74 Years | 1,926 (91.1%) | 1,285 (60.8%) |
| 75 Years and over | 1,446 (100.0%) | 902 (62.4%) |
| Total | 7,858 (31.1%) | 18,598 (73.7%) |
Disability Status by Sex by Age in Newberg
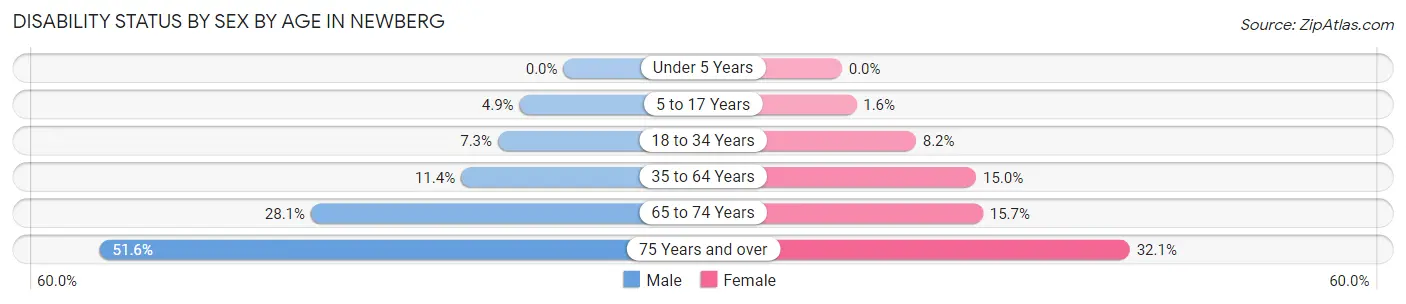
| Age Bracket | Male | Female |
| Under 5 Years | 0 (0.0%) | 0 (0.0%) |
| 5 to 17 Years | 94 (4.9%) | 32 (1.6%) |
| 18 to 34 Years | 267 (7.3%) | 314 (8.2%) |
| 35 to 64 Years | 466 (11.4%) | 657 (14.9%) |
| 65 to 74 Years | 261 (28.1%) | 186 (15.7%) |
| 75 Years and over | 378 (51.6%) | 229 (32.1%) |
Disability Class by Sex by Age in Newberg
Disability Class: Hearing Difficulty
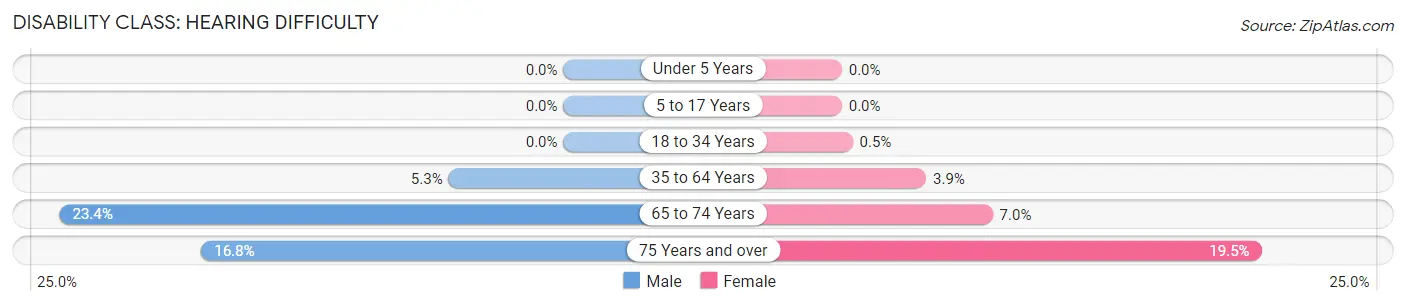
| Age Bracket | Male | Female |
| Under 5 Years | 0 (0.0%) | 0 (0.0%) |
| 5 to 17 Years | 0 (0.0%) | 0 (0.0%) |
| 18 to 34 Years | 0 (0.0%) | 19 (0.5%) |
| 35 to 64 Years | 218 (5.3%) | 172 (3.9%) |
| 65 to 74 Years | 217 (23.4%) | 83 (7.0%) |
| 75 Years and over | 123 (16.8%) | 139 (19.5%) |
Disability Class: Vision Difficulty
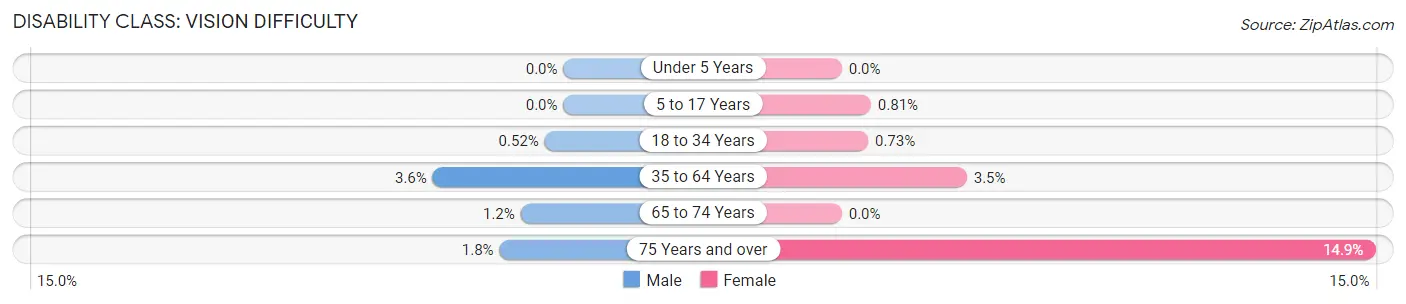
| Age Bracket | Male | Female |
| Under 5 Years | 0 (0.0%) | 0 (0.0%) |
| 5 to 17 Years | 0 (0.0%) | 16 (0.8%) |
| 18 to 34 Years | 19 (0.5%) | 28 (0.7%) |
| 35 to 64 Years | 149 (3.6%) | 153 (3.5%) |
| 65 to 74 Years | 11 (1.2%) | 0 (0.0%) |
| 75 Years and over | 13 (1.8%) | 106 (14.8%) |
Disability Class: Cognitive Difficulty
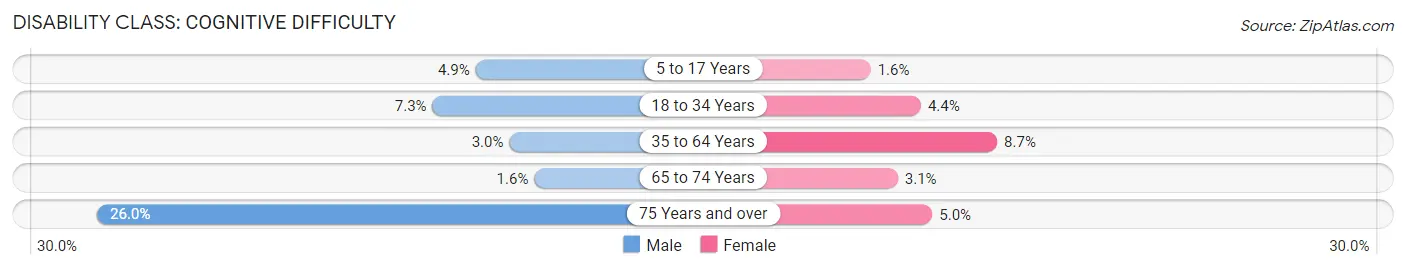
| Age Bracket | Male | Female |
| 5 to 17 Years | 94 (4.9%) | 32 (1.6%) |
| 18 to 34 Years | 267 (7.3%) | 168 (4.4%) |
| 35 to 64 Years | 123 (3.0%) | 380 (8.6%) |
| 65 to 74 Years | 15 (1.6%) | 37 (3.1%) |
| 75 Years and over | 190 (26.0%) | 36 (5.0%) |
Disability Class: Ambulatory Difficulty
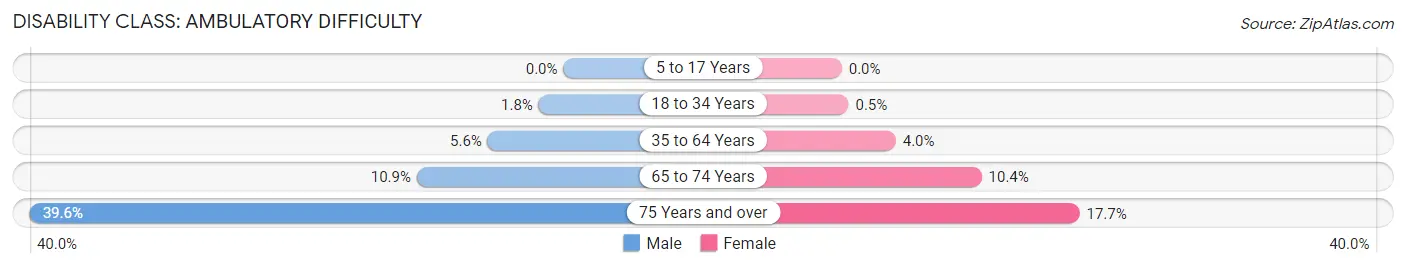
| Age Bracket | Male | Female |
| 5 to 17 Years | 0 (0.0%) | 0 (0.0%) |
| 18 to 34 Years | 67 (1.8%) | 19 (0.5%) |
| 35 to 64 Years | 230 (5.6%) | 176 (4.0%) |
| 65 to 74 Years | 101 (10.9%) | 123 (10.4%) |
| 75 Years and over | 290 (39.6%) | 126 (17.6%) |
Disability Class: Self-Care Difficulty
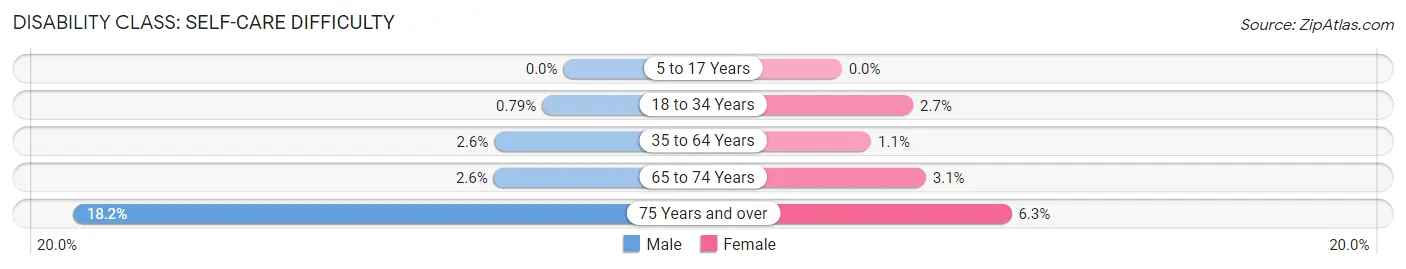
| Age Bracket | Male | Female |
| 5 to 17 Years | 0 (0.0%) | 0 (0.0%) |
| 18 to 34 Years | 29 (0.8%) | 101 (2.6%) |
| 35 to 64 Years | 105 (2.6%) | 48 (1.1%) |
| 65 to 74 Years | 24 (2.6%) | 37 (3.1%) |
| 75 Years and over | 133 (18.2%) | 45 (6.3%) |
Technology Access in Newberg
Computing Device Access in Newberg
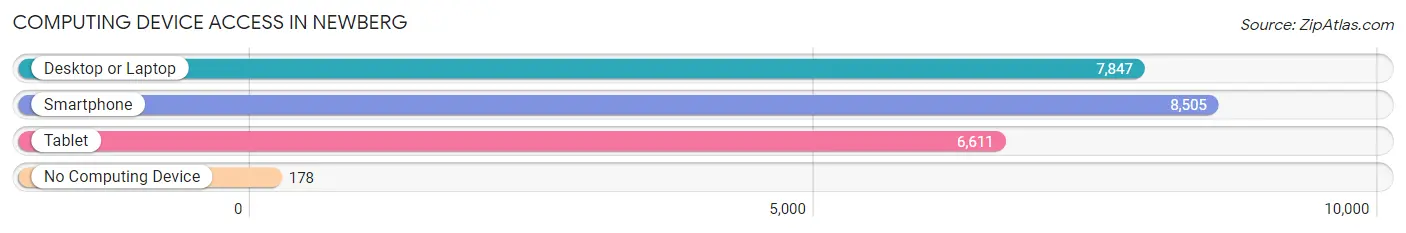
| Device Type | # Households | % Households |
| Desktop or Laptop | 7,847 | 85.2% |
| Smartphone | 8,505 | 92.3% |
| Tablet | 6,611 | 71.8% |
| No Computing Device | 178 | 1.9% |
| Total | 9,210 | 100.0% |
Internet Access in Newberg
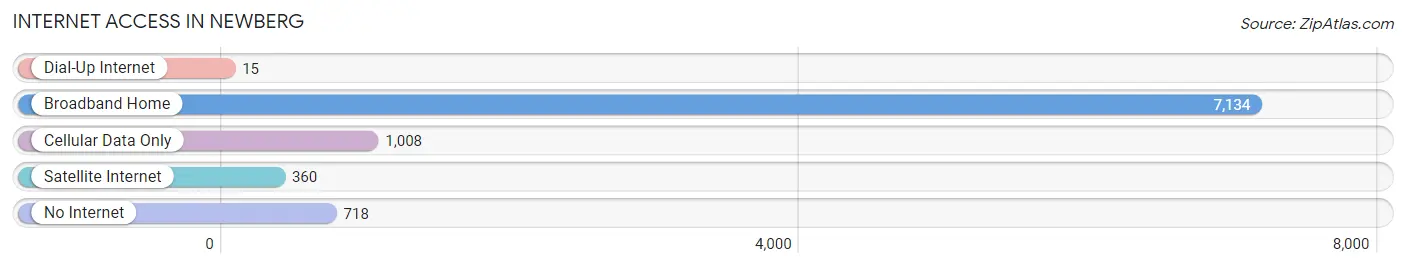
| Internet Type | # Households | % Households |
| Dial-Up Internet | 15 | 0.2% |
| Broadband Home | 7,134 | 77.5% |
| Cellular Data Only | 1,008 | 10.9% |
| Satellite Internet | 360 | 3.9% |
| No Internet | 718 | 7.8% |
| Total | 9,210 | 100.0% |
Newberg Summary
Newberg, Oregon is a city located in Yamhill County, Oregon, United States. It is located in the northern part of the Willamette Valley, approximately 30 miles southwest of Portland. As of the 2010 census, the city had a population of 22,580.
History
The area that is now Newberg was first settled in 1842 by William and Mary Newberg, who were among the first settlers in the Willamette Valley. The city was incorporated in 1889 and was named after the Newberg family.
In the late 19th century, Newberg was a major center for the Oregon wine industry. The city was home to several wineries, including the Newberg Winery, which was founded in 1882 and was the first winery in the state.
Geography
Newberg is located in the northern part of the Willamette Valley, approximately 30 miles southwest of Portland. The city is situated on the Tualatin River, which flows through the city and is a tributary of the Willamette River. The city has a total area of 5.6 square miles, all of which is land.
Economy
Newberg’s economy is largely based on agriculture and manufacturing. The city is home to several wineries and vineyards, as well as a number of food processing plants. The city is also home to several technology companies, including Intel, which has a large manufacturing facility in the city.
Demographics
As of the 2010 census, the city had a population of 22,580. The racial makeup of the city was 87.2% White, 1.3% African American, 0.7% Native American, 2.2% Asian, 0.2% Pacific Islander, 5.2% from other races, and 3.2% from two or more races. Hispanic or Latino of any race were 11.2% of the population.
The median income for a household in the city was $50,837, and the median income for a family was $60,945. The per capita income for the city was $24,845. About 8.7% of families and 11.3% of the population were below the poverty line, including 15.2% of those under age 18 and 6.2% of those age 65 or over.
Newberg is served by the Newberg School District, which includes five elementary schools, two middle schools, and one high school. The city is also home to George Fox University, a private Christian university.
Common Questions
What is Per Capita Income in Newberg?
Per Capita income in Newberg is $38,099.
What is the Median Family Income in Newberg?
Median Family Income in Newberg is $104,399.
What is the Median Household income in Newberg?
Median Household Income in Newberg is $87,873.
What is Income or Wage Gap in Newberg?
Income or Wage Gap in Newberg is 50.6%.
Women in Newberg earn 49.4 cents for every dollar earned by a man.
What is Family Income Deficit in Newberg?
Family Income Deficit in Newberg is $8,571.
Families that are below poverty line in Newberg earn $8,571 less on average than the poverty threshold level.
What is Inequality or Gini Index in Newberg?
Inequality or Gini Index in Newberg is 0.39.
What is the Total Population of Newberg?
Total Population of Newberg is 25,379.
What is the Total Male Population of Newberg?
Total Male Population of Newberg is 12,319.
What is the Total Female Population of Newberg?
Total Female Population of Newberg is 13,060.
What is the Ratio of Males per 100 Females in Newberg?
There are 94.33 Males per 100 Females in Newberg.
What is the Ratio of Females per 100 Males in Newberg?
There are 106.02 Females per 100 Males in Newberg.
What is the Median Population Age in Newberg?
Median Population Age in Newberg is 34.2 Years.
What is the Average Family Size in Newberg
Average Family Size in Newberg is 3.0 People.
What is the Average Household Size in Newberg
Average Household Size in Newberg is 2.6 People.
How Large is the Labor Force in Newberg?
There are 13,920 People in the Labor Forcein in Newberg.
What is the Percentage of People in the Labor Force in Newberg?
68.3% of People are in the Labor Force in Newberg.
What is the Unemployment Rate in Newberg?
Unemployment Rate in Newberg is 3.3%.