Redmond, OR Map & Demographics
Redmond Map
Redmond Overview
$32,613
PER CAPITA INCOME
$82,526
AVG FAMILY INCOME
$72,798
AVG HOUSEHOLD INCOME
17.9%
WAGE / INCOME GAP [ % ]
82.1¢/ $1
WAGE / INCOME GAP [ $ ]
0.37
INEQUALITY / GINI INDEX
34,191
TOTAL POPULATION
16,035
MALE POPULATION
18,156
FEMALE POPULATION
88.32
MALES / 100 FEMALES
113.23
FEMALES / 100 MALES
36.4
MEDIAN AGE
3.1
AVG FAMILY SIZE
2.6
AVG HOUSEHOLD SIZE
17,884
LABOR FORCE [ PEOPLE ]
66.7%
PERCENT IN LABOR FORCE
7.2%
UNEMPLOYMENT RATE
Redmond Zip Codes
Redmond Area Codes
Income in Redmond
Income Overview in Redmond
Per Capita Income in Redmond is $32,613, while median incomes of families and households are $82,526 and $72,798 respectively.
| Characteristic | Number | Measure |
| Per Capita Income | 34,191 | $32,613 |
| Median Family Income | 8,379 | $82,526 |
| Mean Family Income | 8,379 | $91,689 |
| Median Household Income | 13,025 | $72,798 |
| Mean Household Income | 13,025 | $84,502 |
| Income Deficit | 8,379 | $0 |
| Wage / Income Gap (%) | 34,191 | 17.87% |
| Wage / Income Gap ($) | 34,191 | 82.13¢ per $1 |
| Gini / Inequality Index | 34,191 | 0.37 |
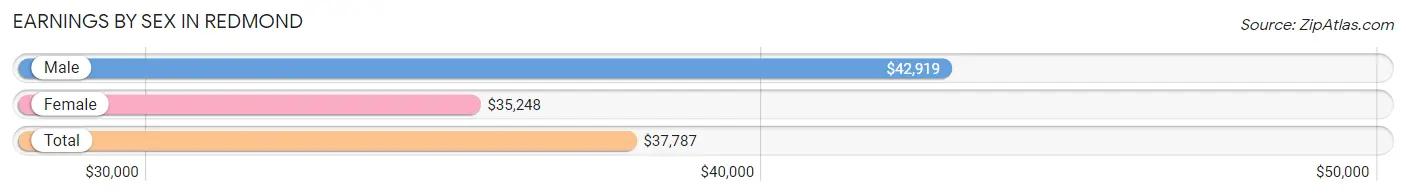
Earnings by Sex in Redmond
Average Earnings in Redmond are $37,787, $42,919 for men and $35,248 for women, a difference of 17.9%.
| Sex | Number | Average Earnings |
| Male | 8,960 (49.3%) | $42,919 |
| Female | 9,195 (50.6%) | $35,248 |
| Total | 18,155 (100.0%) | $37,787 |
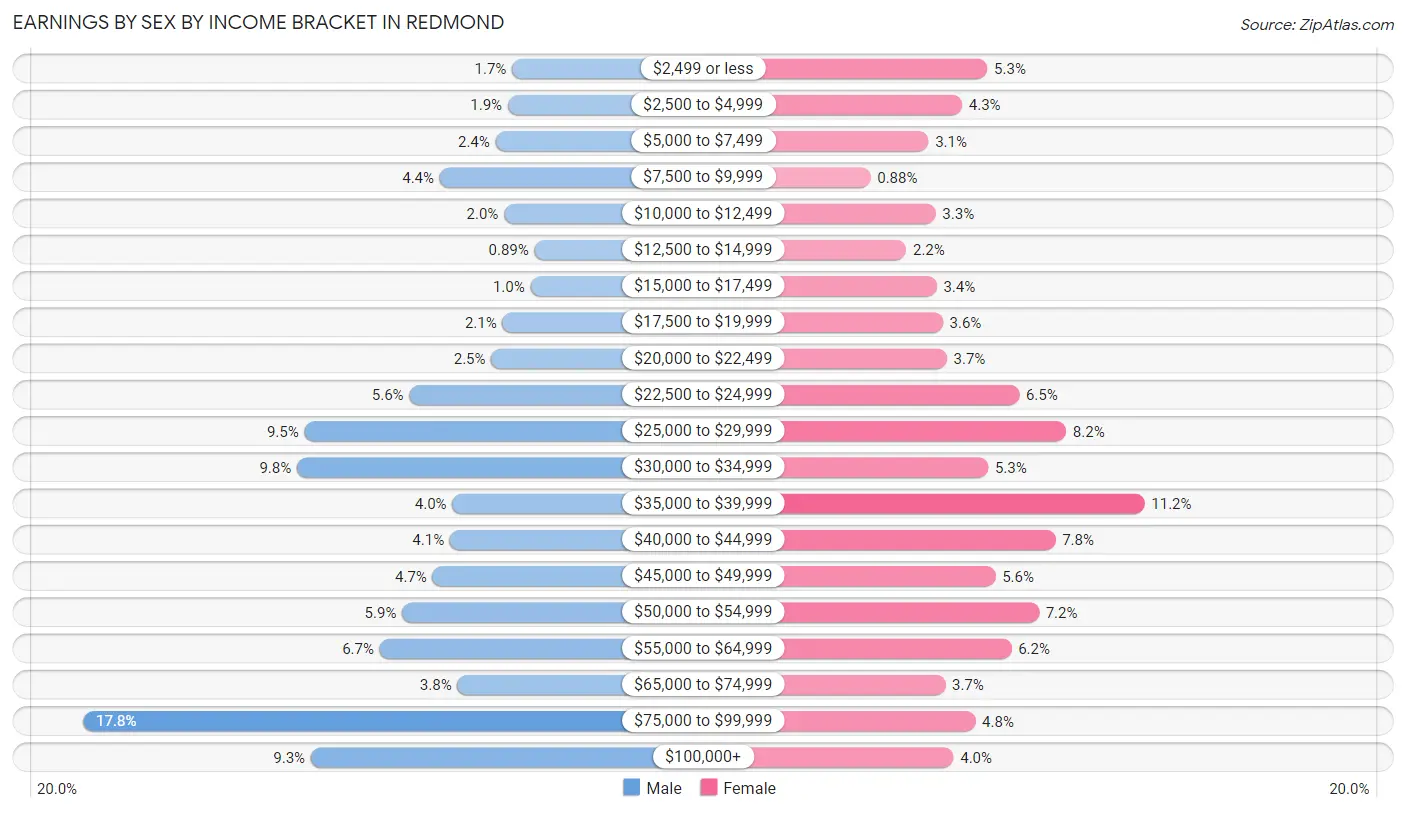
Earnings by Sex by Income Bracket in Redmond
The most common earnings brackets in Redmond are $75,000 to $99,999 for men (1,596 | 17.8%) and $35,000 to $39,999 for women (1,025 | 11.2%).
| Income | Male | Female |
| $2,499 or less | 155 (1.7%) | 484 (5.3%) |
| $2,500 to $4,999 | 169 (1.9%) | 396 (4.3%) |
| $5,000 to $7,499 | 211 (2.4%) | 280 (3.0%) |
| $7,500 to $9,999 | 398 (4.4%) | 81 (0.9%) |
| $10,000 to $12,499 | 182 (2.0%) | 305 (3.3%) |
| $12,500 to $14,999 | 80 (0.9%) | 204 (2.2%) |
| $15,000 to $17,499 | 93 (1.0%) | 309 (3.4%) |
| $17,500 to $19,999 | 187 (2.1%) | 330 (3.6%) |
| $20,000 to $22,499 | 225 (2.5%) | 344 (3.7%) |
| $22,500 to $24,999 | 500 (5.6%) | 593 (6.5%) |
| $25,000 to $29,999 | 852 (9.5%) | 755 (8.2%) |
| $30,000 to $34,999 | 877 (9.8%) | 486 (5.3%) |
| $35,000 to $39,999 | 356 (4.0%) | 1,025 (11.2%) |
| $40,000 to $44,999 | 364 (4.1%) | 718 (7.8%) |
| $45,000 to $49,999 | 422 (4.7%) | 511 (5.6%) |
| $50,000 to $54,999 | 524 (5.9%) | 661 (7.2%) |
| $55,000 to $64,999 | 599 (6.7%) | 566 (6.2%) |
| $65,000 to $74,999 | 339 (3.8%) | 338 (3.7%) |
| $75,000 to $99,999 | 1,596 (17.8%) | 442 (4.8%) |
| $100,000+ | 831 (9.3%) | 367 (4.0%) |
| Total | 8,960 (100.0%) | 9,195 (100.0%) |
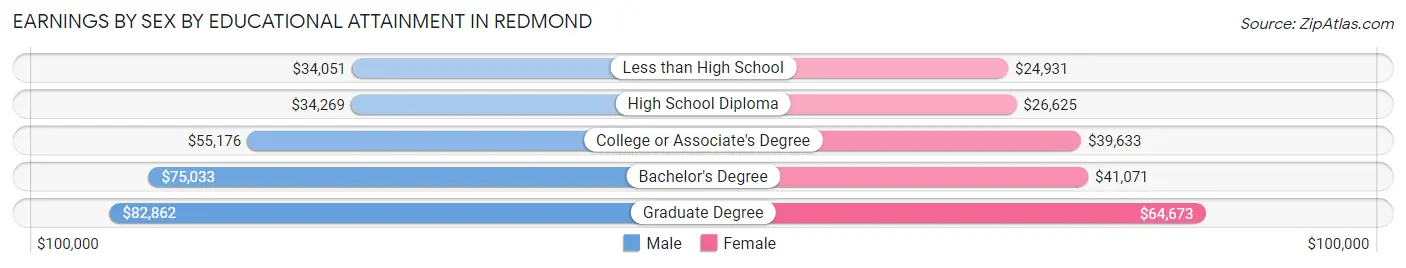
Earnings by Sex by Educational Attainment in Redmond
Average earnings in Redmond are $47,130 for men and $38,352 for women, a difference of 18.6%. Men with an educational attainment of graduate degree enjoy the highest average annual earnings of $82,862, while those with less than high school education earn the least with $34,051. Women with an educational attainment of graduate degree earn the most with the average annual earnings of $64,673, while those with less than high school education have the smallest earnings of $24,931.
| Educational Attainment | Male Income | Female Income |
| Less than High School | $34,051 | $24,931 |
| High School Diploma | $34,269 | $26,625 |
| College or Associate's Degree | $55,176 | $39,633 |
| Bachelor's Degree | $75,033 | $41,071 |
| Graduate Degree | $82,862 | $64,673 |
| Total | $47,130 | $38,352 |
Family Income in Redmond
Family Income Brackets in Redmond
According to the Redmond family income data, there are 1,994 families falling into the $100,000 to $149,999 income range, which is the most common income bracket and makes up 23.8% of all families. Conversely, the $10,000 to $14,999 income bracket is the least frequent group with only 84 families (1.0%) belonging to this category.
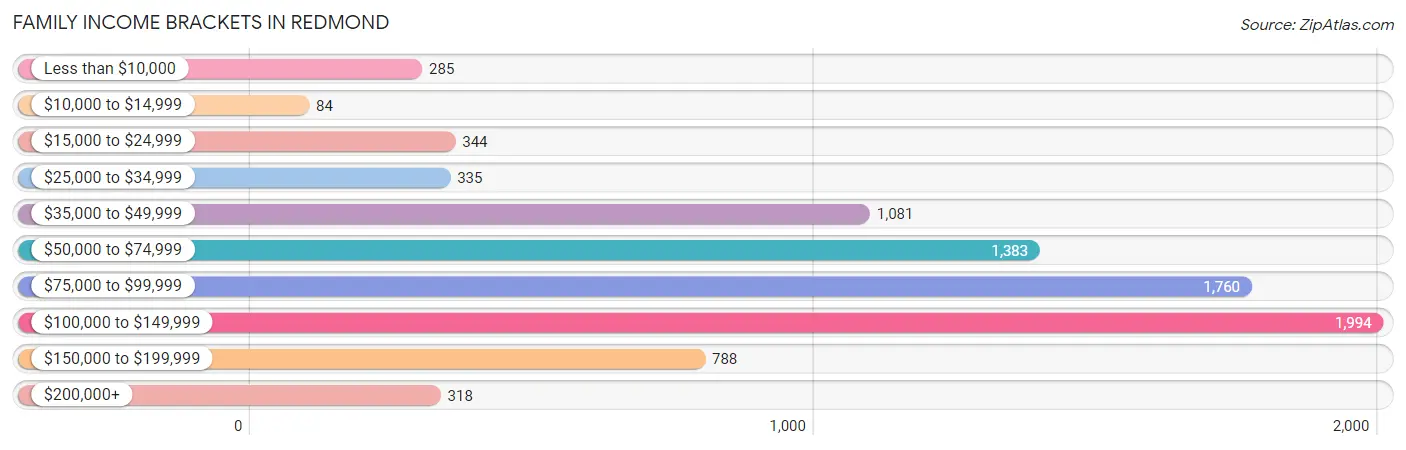
| Income Bracket | # Families | % Families |
| Less than $10,000 | 285 | 3.4% |
| $10,000 to $14,999 | 84 | 1.0% |
| $15,000 to $24,999 | 344 | 4.1% |
| $25,000 to $34,999 | 335 | 4.0% |
| $35,000 to $49,999 | 1,081 | 12.9% |
| $50,000 to $74,999 | 1,383 | 16.5% |
| $75,000 to $99,999 | 1,760 | 21.0% |
| $100,000 to $149,999 | 1,994 | 23.8% |
| $150,000 to $199,999 | 788 | 9.4% |
| $200,000+ | 318 | 3.8% |
Family Income by Famaliy Size in Redmond
3-person families (1,715 | 20.5%) account for the highest median family income in Redmond with $100,734 per family, while 2-person families (3,964 | 47.3%) have the highest median income of $34,794 per family member.
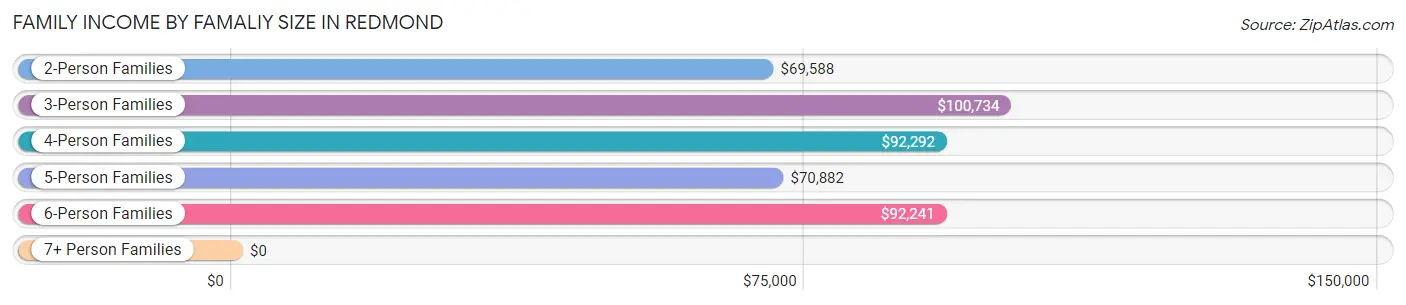
| Income Bracket | # Families | Median Income |
| 2-Person Families | 3,964 (47.3%) | $69,588 |
| 3-Person Families | 1,715 (20.5%) | $100,734 |
| 4-Person Families | 1,642 (19.6%) | $92,292 |
| 5-Person Families | 604 (7.2%) | $70,882 |
| 6-Person Families | 396 (4.7%) | $92,241 |
| 7+ Person Families | 58 (0.7%) | $0 |
| Total | 8,379 (100.0%) | $82,526 |
Family Income by Number of Earners in Redmond
The median family income in Redmond is $82,526, with families comprising 3+ earners (975) having the highest median family income of $108,341, while families with no earners (1,411) have the lowest median family income of $54,583, accounting for 11.6% and 16.8% of families, respectively.
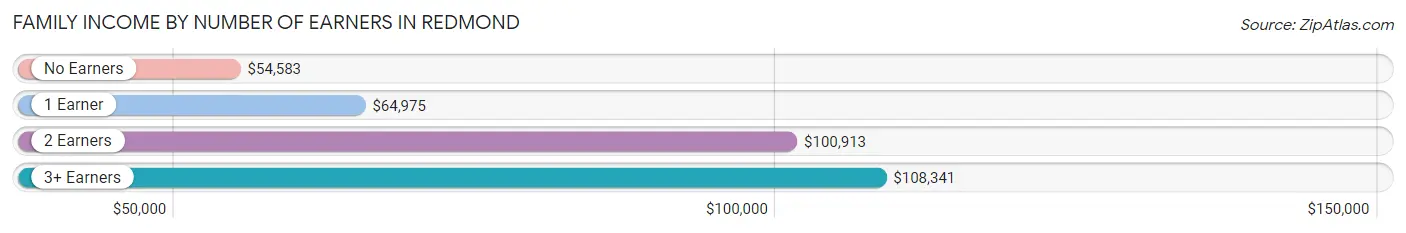
| Number of Earners | # Families | Median Income |
| No Earners | 1,411 (16.8%) | $54,583 |
| 1 Earner | 2,709 (32.3%) | $64,975 |
| 2 Earners | 3,284 (39.2%) | $100,913 |
| 3+ Earners | 975 (11.6%) | $108,341 |
| Total | 8,379 (100.0%) | $82,526 |
Household Income in Redmond
Household Income Brackets in Redmond
With 2,579 households falling in the category, the $50,000 to $74,999 income range is the most frequent in Redmond, accounting for 19.8% of all households. In contrast, only 221 households (1.7%) fall into the $10,000 to $14,999 income bracket, making it the least populous group.
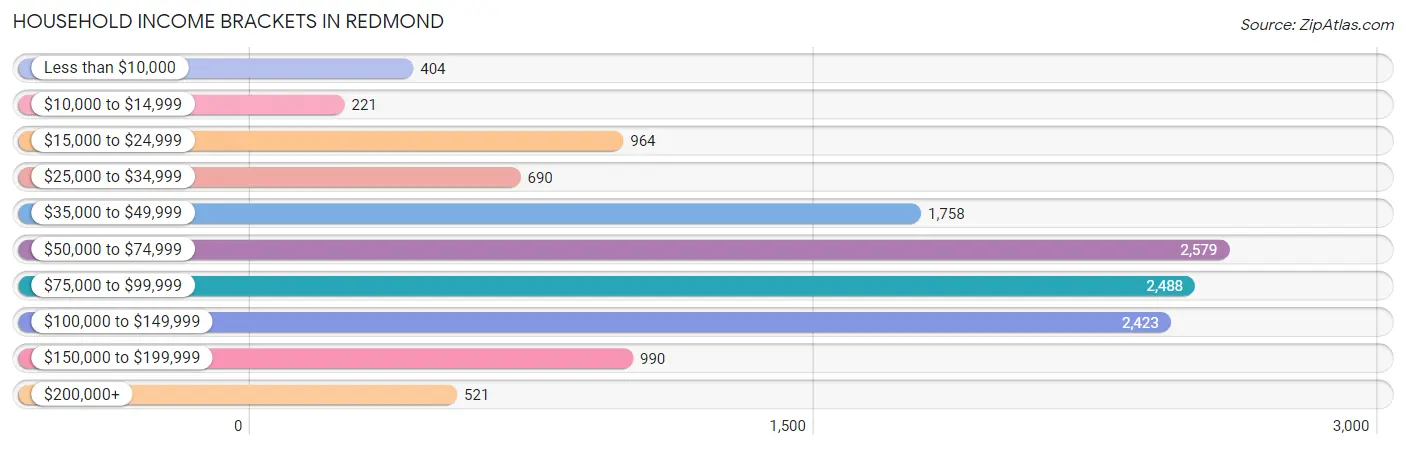
| Income Bracket | # Households | % Households |
| Less than $10,000 | 404 | 3.1% |
| $10,000 to $14,999 | 221 | 1.7% |
| $15,000 to $24,999 | 964 | 7.4% |
| $25,000 to $34,999 | 690 | 5.3% |
| $35,000 to $49,999 | 1,758 | 13.5% |
| $50,000 to $74,999 | 2,579 | 19.8% |
| $75,000 to $99,999 | 2,488 | 19.1% |
| $100,000 to $149,999 | 2,423 | 18.6% |
| $150,000 to $199,999 | 990 | 7.6% |
| $200,000+ | 521 | 4.0% |
Household Income by Householder Age in Redmond
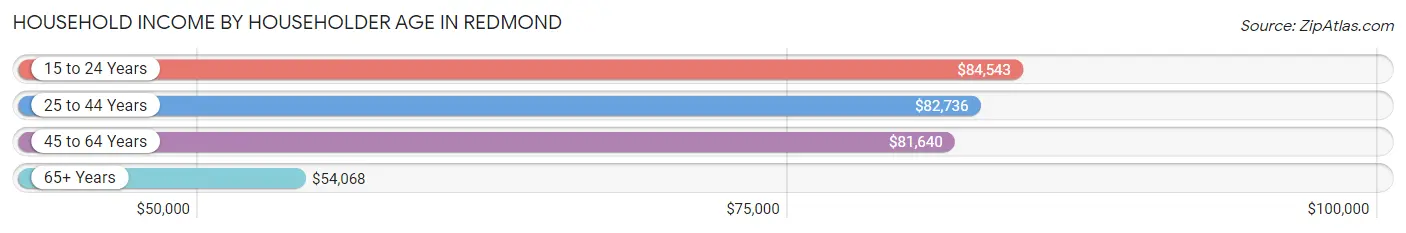
The median household income in Redmond is $72,798, with the highest median household income of $84,543 found in the 15 to 24 years age bracket for the primary householder. A total of 624 households (4.8%) fall into this category. Meanwhile, the 65+ years age bracket for the primary householder has the lowest median household income of $54,068, with 3,625 households (27.8%) in this group.
| Income Bracket | # Households | Median Income |
| 15 to 24 Years | 624 (4.8%) | $84,543 |
| 25 to 44 Years | 4,557 (35.0%) | $82,736 |
| 45 to 64 Years | 4,219 (32.4%) | $81,640 |
| 65+ Years | 3,625 (27.8%) | $54,068 |
| Total | 13,025 (100.0%) | $72,798 |
Poverty in Redmond
Income Below Poverty by Sex and Age in Redmond
With 7.7% poverty level for males and 8.8% for females among the residents of Redmond, under 5 year old males and 12 to 14 year old females are the most vulnerable to poverty, with 245 males (19.8%) and 222 females (32.9%) in their respective age groups living below the poverty level.
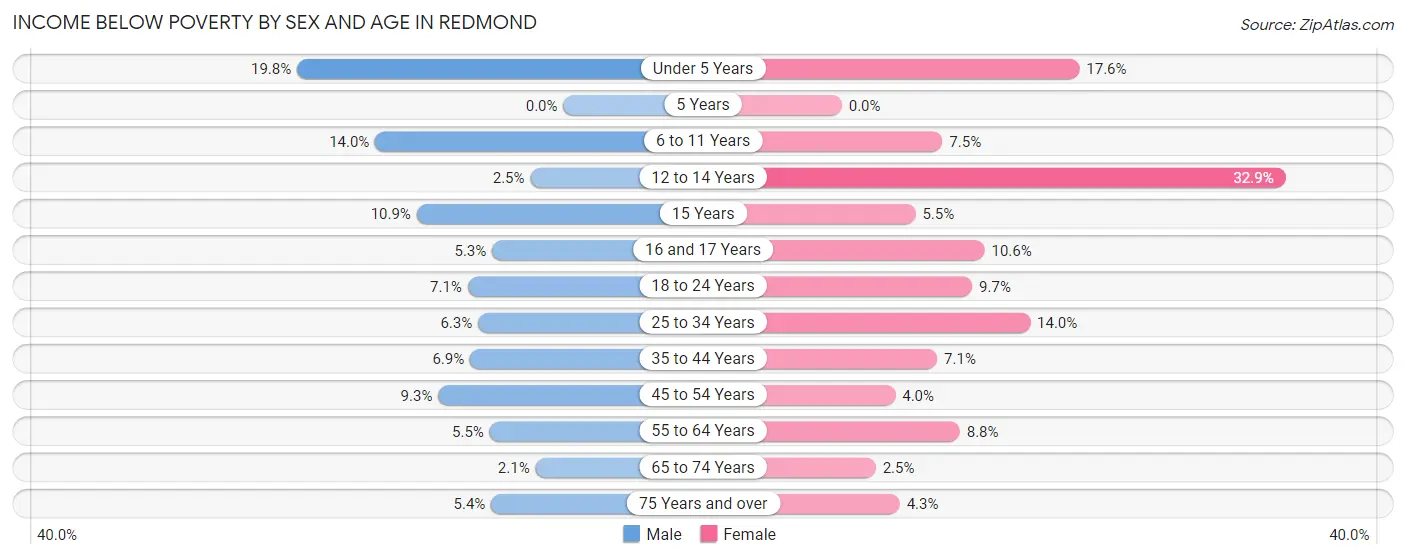
| Age Bracket | Male | Female |
| Under 5 Years | 245 (19.8%) | 124 (17.6%) |
| 5 Years | 0 (0.0%) | 0 (0.0%) |
| 6 to 11 Years | 173 (14.0%) | 120 (7.5%) |
| 12 to 14 Years | 19 (2.5%) | 222 (32.9%) |
| 15 Years | 11 (10.9%) | 17 (5.5%) |
| 16 and 17 Years | 11 (5.3%) | 23 (10.6%) |
| 18 to 24 Years | 100 (7.1%) | 149 (9.7%) |
| 25 to 34 Years | 143 (6.3%) | 372 (14.0%) |
| 35 to 44 Years | 170 (6.9%) | 202 (7.1%) |
| 45 to 54 Years | 184 (9.3%) | 75 (4.0%) |
| 55 to 64 Years | 90 (5.5%) | 182 (8.8%) |
| 65 to 74 Years | 31 (2.1%) | 41 (2.5%) |
| 75 Years and over | 46 (5.4%) | 68 (4.3%) |
| Total | 1,223 (7.7%) | 1,595 (8.8%) |
Income Above Poverty by Sex and Age in Redmond
According to the poverty statistics in Redmond, males aged 5 years and females aged 5 years are the age groups that are most secure financially, with 100.0% of males and 100.0% of females in these age groups living above the poverty line.
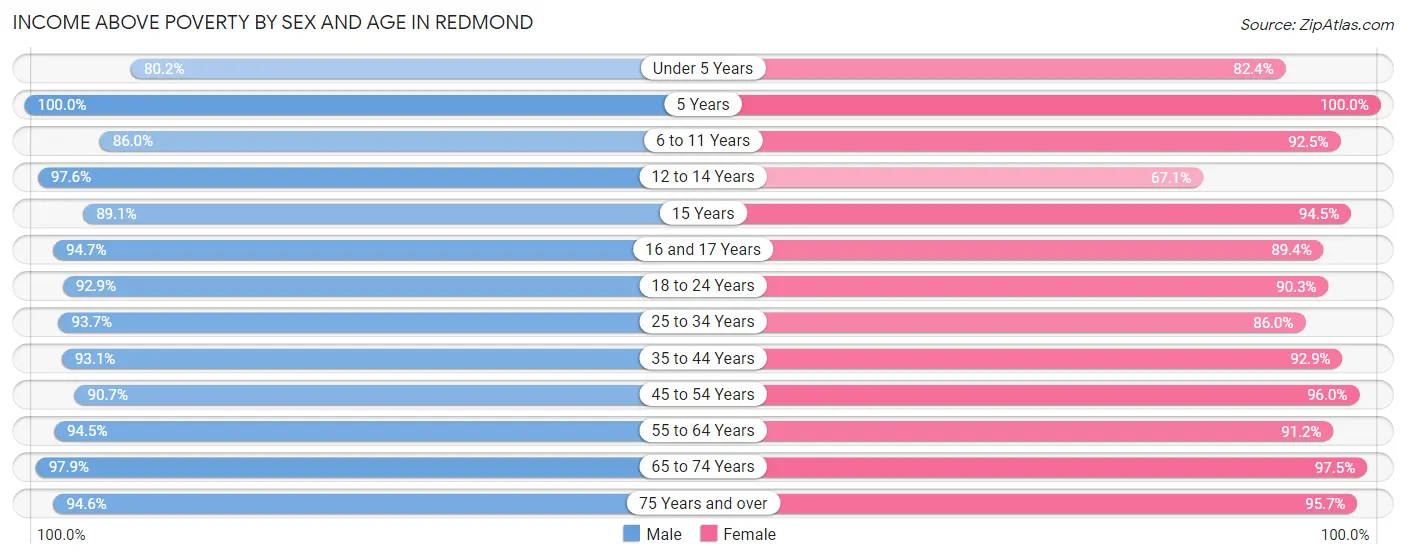
| Age Bracket | Male | Female |
| Under 5 Years | 994 (80.2%) | 579 (82.4%) |
| 5 Years | 185 (100.0%) | 275 (100.0%) |
| 6 to 11 Years | 1,065 (86.0%) | 1,486 (92.5%) |
| 12 to 14 Years | 756 (97.6%) | 452 (67.1%) |
| 15 Years | 90 (89.1%) | 294 (94.5%) |
| 16 and 17 Years | 197 (94.7%) | 194 (89.4%) |
| 18 to 24 Years | 1,309 (92.9%) | 1,391 (90.3%) |
| 25 to 34 Years | 2,116 (93.7%) | 2,289 (86.0%) |
| 35 to 44 Years | 2,283 (93.1%) | 2,651 (92.9%) |
| 45 to 54 Years | 1,797 (90.7%) | 1,814 (96.0%) |
| 55 to 64 Years | 1,554 (94.5%) | 1,896 (91.2%) |
| 65 to 74 Years | 1,463 (97.9%) | 1,587 (97.5%) |
| 75 Years and over | 812 (94.6%) | 1,514 (95.7%) |
| Total | 14,621 (92.3%) | 16,422 (91.1%) |
Income Below Poverty Among Married-Couple Families in Redmond
The poverty statistics for married-couple families in Redmond show that 3.3% or 210 of the total 6,400 families live below the poverty line. Families with 1 or 2 children have the highest poverty rate of 4.0%, comprising of 90 families. On the other hand, families with 3 or 4 children have the lowest poverty rate of 0.0%, which includes 0 families.

| Children | Above Poverty | Below Poverty |
| No Children | 3,403 (96.6%) | 120 (3.4%) |
| 1 or 2 Children | 2,165 (96.0%) | 90 (4.0%) |
| 3 or 4 Children | 622 (100.0%) | 0 (0.0%) |
| 5 or more Children | 0 (0.0%) | 0 (0.0%) |
| Total | 6,190 (96.7%) | 210 (3.3%) |
Income Below Poverty Among Single-Parent Households in Redmond
According to the poverty data in Redmond, 22.2% or 105 single-father households and 17.7% or 267 single-mother households are living below the poverty line. Among single-father households, those with 1 or 2 children have the highest poverty rate, with 105 households (41.5%) experiencing poverty. Likewise, among single-mother households, those with 3 or 4 children have the highest poverty rate, with 162 households (71.4%) falling below the poverty line.
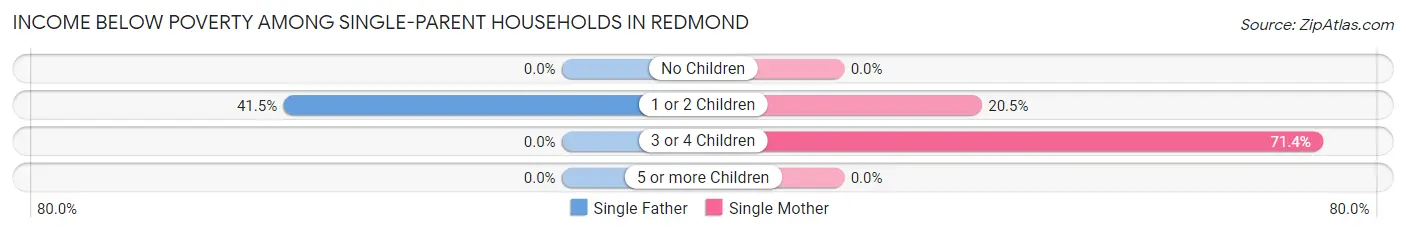
| Children | Single Father | Single Mother |
| No Children | 0 (0.0%) | 0 (0.0%) |
| 1 or 2 Children | 105 (41.5%) | 105 (20.5%) |
| 3 or 4 Children | 0 (0.0%) | 162 (71.4%) |
| 5 or more Children | 0 (0.0%) | 0 (0.0%) |
| Total | 105 (22.2%) | 267 (17.7%) |
Income Below Poverty Among Married-Couple vs Single-Parent Households in Redmond
The poverty data for Redmond shows that 210 of the married-couple family households (3.3%) and 372 of the single-parent households (18.8%) are living below the poverty level. Within the married-couple family households, those with 1 or 2 children have the highest poverty rate, with 90 households (4.0%) falling below the poverty line. Among the single-parent households, those with 3 or 4 children have the highest poverty rate, with 162 household (59.6%) living below poverty.
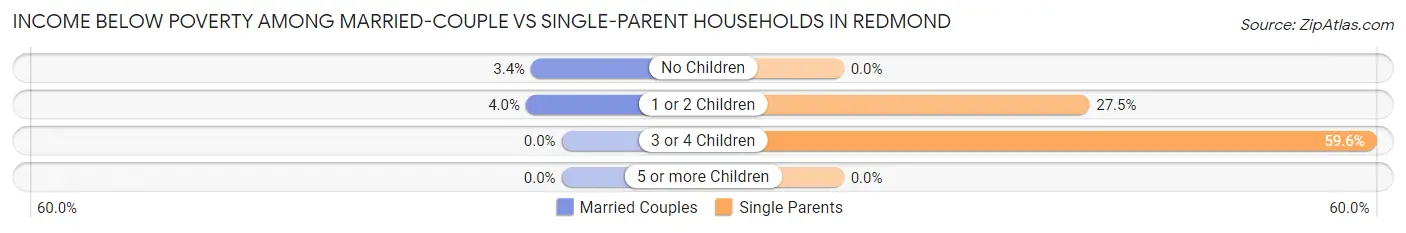
| Children | Married-Couple Families | Single-Parent Households |
| No Children | 120 (3.4%) | 0 (0.0%) |
| 1 or 2 Children | 90 (4.0%) | 210 (27.5%) |
| 3 or 4 Children | 0 (0.0%) | 162 (59.6%) |
| 5 or more Children | 0 (0.0%) | 0 (0.0%) |
| Total | 210 (3.3%) | 372 (18.8%) |
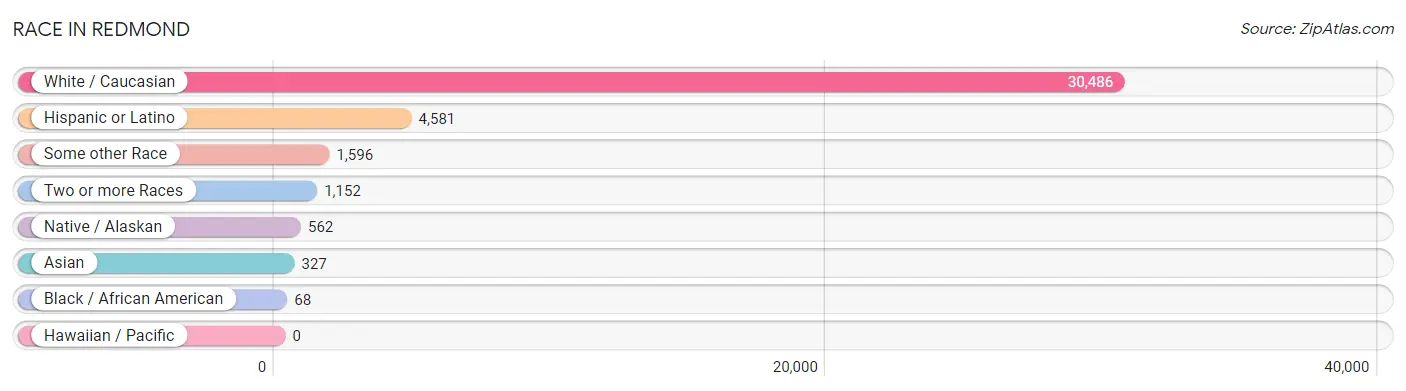
Race in Redmond
The most populous races in Redmond are White / Caucasian (30,486 | 89.2%), Hispanic or Latino (4,581 | 13.4%), and Some other Race (1,596 | 4.7%).
| Race | # Population | % Population |
| Asian | 327 | 1.0% |
| Black / African American | 68 | 0.2% |
| Hawaiian / Pacific | 0 | 0.0% |
| Hispanic or Latino | 4,581 | 13.4% |
| Native / Alaskan | 562 | 1.6% |
| White / Caucasian | 30,486 | 89.2% |
| Two or more Races | 1,152 | 3.4% |
| Some other Race | 1,596 | 4.7% |
| Total | 34,191 | 100.0% |
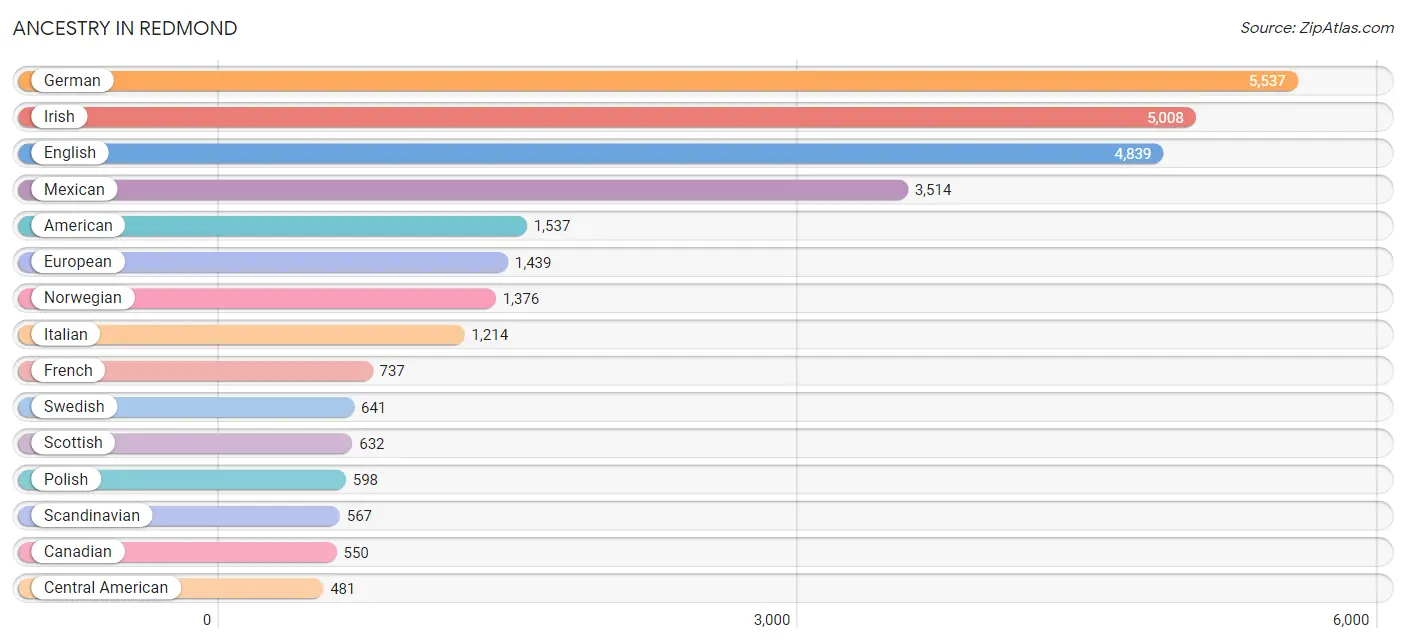
Ancestry in Redmond
The most populous ancestries reported in Redmond are German (5,537 | 16.2%), Irish (5,008 | 14.6%), English (4,839 | 14.1%), Mexican (3,514 | 10.3%), and American (1,537 | 4.5%), together accounting for 59.8% of all Redmond residents.
| Ancestry | # Population | % Population |
| African | 32 | 0.1% |
| Alsatian | 10 | 0.0% |
| American | 1,537 | 4.5% |
| Apache | 7 | 0.0% |
| Arab | 47 | 0.1% |
| Arapaho | 24 | 0.1% |
| Austrian | 211 | 0.6% |
| Belgian | 35 | 0.1% |
| Bhutanese | 119 | 0.4% |
| British | 257 | 0.7% |
| Bulgarian | 70 | 0.2% |
| Burmese | 40 | 0.1% |
| Canadian | 550 | 1.6% |
| Central American | 481 | 1.4% |
| Cherokee | 104 | 0.3% |
| Chickasaw | 48 | 0.1% |
| Chippewa | 86 | 0.3% |
| Czech | 192 | 0.6% |
| Czechoslovakian | 11 | 0.0% |
| Danish | 155 | 0.4% |
| Dutch | 447 | 1.3% |
| Dutch West Indian | 30 | 0.1% |
| Eastern European | 31 | 0.1% |
| English | 4,839 | 14.1% |
| European | 1,439 | 4.2% |
| Finnish | 87 | 0.3% |
| French | 737 | 2.2% |
| French American Indian | 30 | 0.1% |
| French Canadian | 207 | 0.6% |
| German | 5,537 | 16.2% |
| Greek | 103 | 0.3% |
| Guatemalan | 130 | 0.4% |
| Honduran | 182 | 0.5% |
| Hungarian | 24 | 0.1% |
| Icelander | 18 | 0.1% |
| Indian (Asian) | 237 | 0.7% |
| Iranian | 12 | 0.0% |
| Irish | 5,008 | 14.6% |
| Italian | 1,214 | 3.5% |
| Japanese | 29 | 0.1% |
| Korean | 116 | 0.3% |
| Latvian | 62 | 0.2% |
| Lithuanian | 10 | 0.0% |
| Macedonian | 19 | 0.1% |
| Mexican | 3,514 | 10.3% |
| Mongolian | 24 | 0.1% |
| Native Hawaiian | 90 | 0.3% |
| Nicaraguan | 37 | 0.1% |
| Northern European | 172 | 0.5% |
| Norwegian | 1,376 | 4.0% |
| Pakistani | 22 | 0.1% |
| Peruvian | 72 | 0.2% |
| Polish | 598 | 1.8% |
| Portuguese | 48 | 0.1% |
| Puerto Rican | 75 | 0.2% |
| Romanian | 122 | 0.4% |
| Russian | 240 | 0.7% |
| Salvadoran | 132 | 0.4% |
| Scandinavian | 567 | 1.7% |
| Scotch-Irish | 372 | 1.1% |
| Scottish | 632 | 1.8% |
| Serbian | 19 | 0.1% |
| Slovak | 28 | 0.1% |
| Slovene | 67 | 0.2% |
| South American | 72 | 0.2% |
| Spaniard | 105 | 0.3% |
| Spanish | 2 | 0.0% |
| Subsaharan African | 32 | 0.1% |
| Swedish | 641 | 1.9% |
| Swiss | 261 | 0.8% |
| Ukrainian | 46 | 0.1% |
| Welsh | 193 | 0.6% |
| Yugoslavian | 10 | 0.0% | View All 73 Rows |
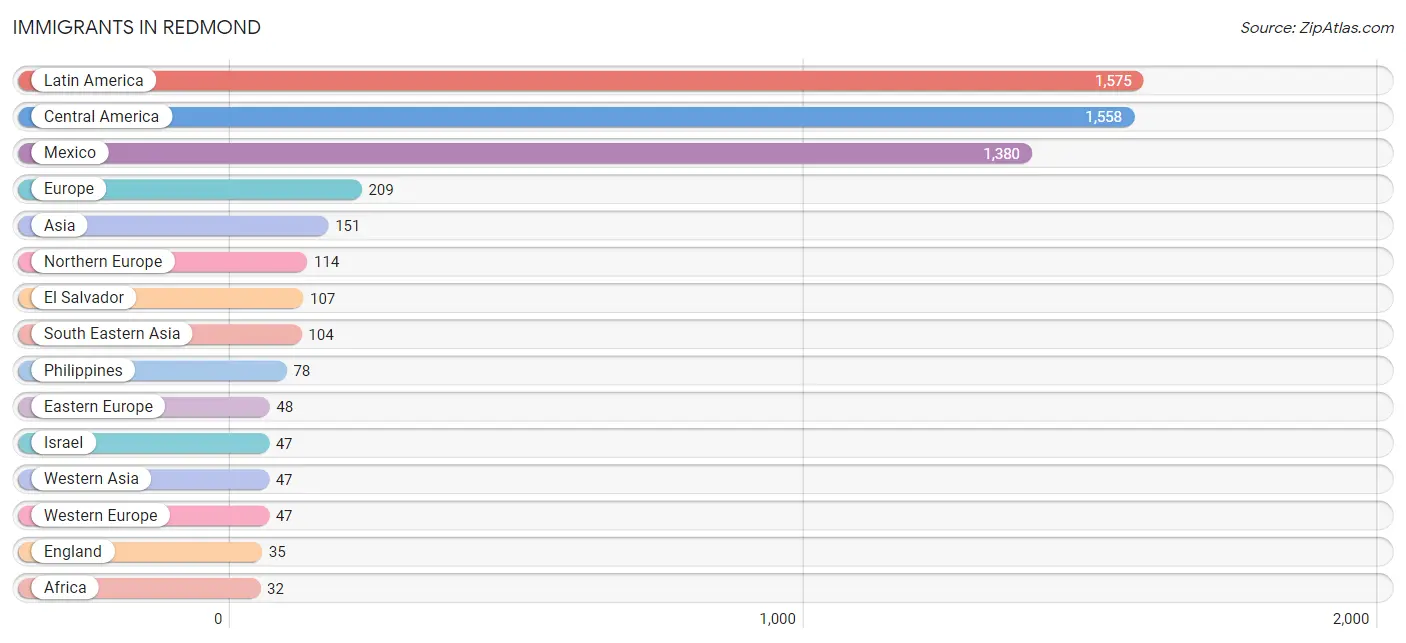
Immigrants in Redmond
The most numerous immigrant groups reported in Redmond came from Latin America (1,575 | 4.6%), Central America (1,558 | 4.6%), Mexico (1,380 | 4.0%), Europe (209 | 0.6%), and Asia (151 | 0.4%), together accounting for 14.3% of all Redmond residents.
| Immigration Origin | # Population | % Population |
| Africa | 32 | 0.1% |
| Asia | 151 | 0.4% |
| Bulgaria | 12 | 0.0% |
| Canada | 15 | 0.0% |
| Central America | 1,558 | 4.6% |
| Eastern Europe | 48 | 0.1% |
| El Salvador | 107 | 0.3% |
| England | 35 | 0.1% |
| Europe | 209 | 0.6% |
| France | 20 | 0.1% |
| Germany | 27 | 0.1% |
| Guatemala | 25 | 0.1% |
| Israel | 47 | 0.1% |
| Latin America | 1,575 | 4.6% |
| Mexico | 1,380 | 4.0% |
| Northern Europe | 114 | 0.3% |
| Peru | 17 | 0.1% |
| Philippines | 78 | 0.2% |
| Poland | 19 | 0.1% |
| Scotland | 20 | 0.1% |
| South America | 17 | 0.1% |
| South Eastern Asia | 104 | 0.3% |
| Thailand | 26 | 0.1% |
| Western Africa | 32 | 0.1% |
| Western Asia | 47 | 0.1% |
| Western Europe | 47 | 0.1% | View All 26 Rows |
Sex and Age in Redmond
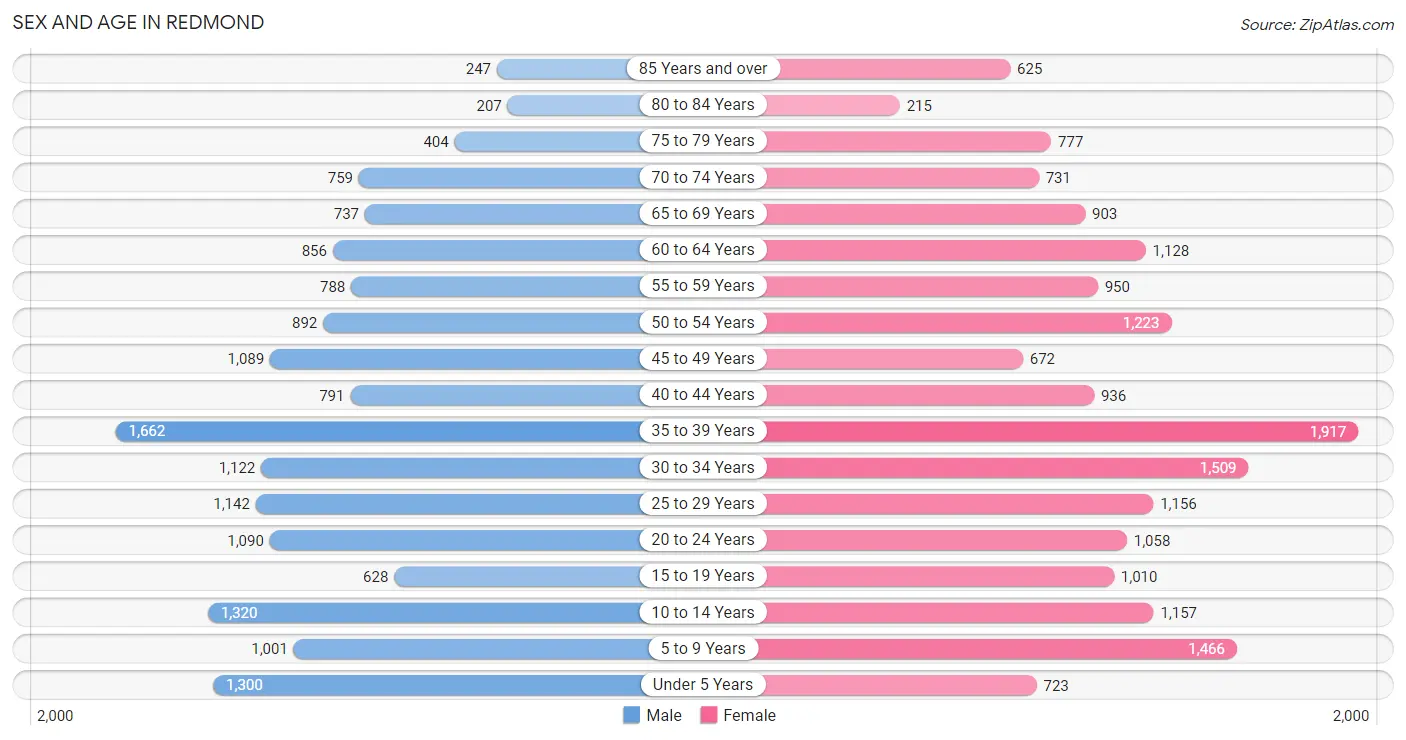
Sex and Age in Redmond
The most populous age groups in Redmond are 35 to 39 Years (1,662 | 10.4%) for men and 35 to 39 Years (1,917 | 10.6%) for women.
| Age Bracket | Male | Female |
| Under 5 Years | 1,300 (8.1%) | 723 (4.0%) |
| 5 to 9 Years | 1,001 (6.2%) | 1,466 (8.1%) |
| 10 to 14 Years | 1,320 (8.2%) | 1,157 (6.4%) |
| 15 to 19 Years | 628 (3.9%) | 1,010 (5.6%) |
| 20 to 24 Years | 1,090 (6.8%) | 1,058 (5.8%) |
| 25 to 29 Years | 1,142 (7.1%) | 1,156 (6.4%) |
| 30 to 34 Years | 1,122 (7.0%) | 1,509 (8.3%) |
| 35 to 39 Years | 1,662 (10.4%) | 1,917 (10.6%) |
| 40 to 44 Years | 791 (4.9%) | 936 (5.2%) |
| 45 to 49 Years | 1,089 (6.8%) | 672 (3.7%) |
| 50 to 54 Years | 892 (5.6%) | 1,223 (6.7%) |
| 55 to 59 Years | 788 (4.9%) | 950 (5.2%) |
| 60 to 64 Years | 856 (5.3%) | 1,128 (6.2%) |
| 65 to 69 Years | 737 (4.6%) | 903 (5.0%) |
| 70 to 74 Years | 759 (4.7%) | 731 (4.0%) |
| 75 to 79 Years | 404 (2.5%) | 777 (4.3%) |
| 80 to 84 Years | 207 (1.3%) | 215 (1.2%) |
| 85 Years and over | 247 (1.5%) | 625 (3.4%) |
| Total | 16,035 (100.0%) | 18,156 (100.0%) |
Families and Households in Redmond
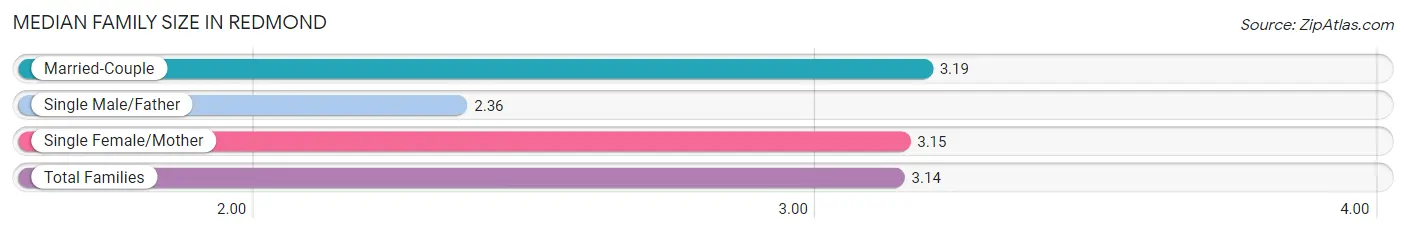
Median Family Size in Redmond
The median family size in Redmond is 3.14 persons per family, with married-couple families (6,400 | 76.4%) accounting for the largest median family size of 3.19 persons per family. On the other hand, single male/father families (474 | 5.7%) represent the smallest median family size with 2.36 persons per family.
| Family Type | # Families | Family Size |
| Married-Couple | 6,400 (76.4%) | 3.19 |
| Single Male/Father | 474 (5.7%) | 2.36 |
| Single Female/Mother | 1,505 (18.0%) | 3.15 |
| Total Families | 8,379 (100.0%) | 3.14 |
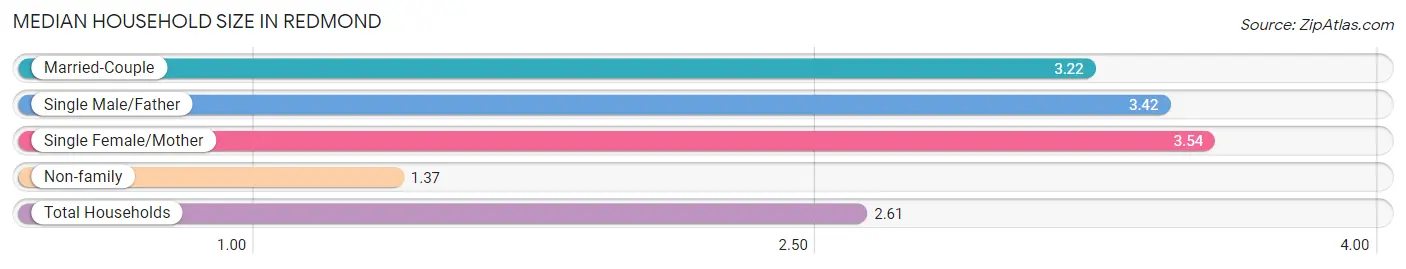
Median Household Size in Redmond
The median household size in Redmond is 2.61 persons per household, with single female/mother households (1,505 | 11.6%) accounting for the largest median household size of 3.54 persons per household. non-family households (4,646 | 35.7%) represent the smallest median household size with 1.37 persons per household.
| Household Type | # Households | Household Size |
| Married-Couple | 6,400 (49.1%) | 3.22 |
| Single Male/Father | 474 (3.6%) | 3.42 |
| Single Female/Mother | 1,505 (11.6%) | 3.54 |
| Non-family | 4,646 (35.7%) | 1.37 |
| Total Households | 13,025 (100.0%) | 2.61 |
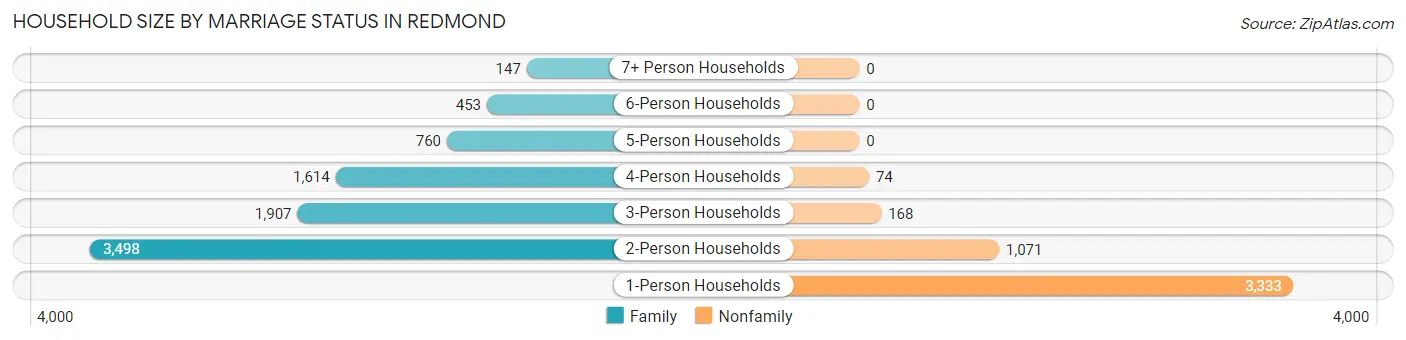
Household Size by Marriage Status in Redmond
Out of a total of 13,025 households in Redmond, 8,379 (64.3%) are family households, while 4,646 (35.7%) are nonfamily households. The most numerous type of family households are 2-person households, comprising 3,498, and the most common type of nonfamily households are 1-person households, comprising 3,333.
| Household Size | Family Households | Nonfamily Households |
| 1-Person Households | - | 3,333 (25.6%) |
| 2-Person Households | 3,498 (26.9%) | 1,071 (8.2%) |
| 3-Person Households | 1,907 (14.6%) | 168 (1.3%) |
| 4-Person Households | 1,614 (12.4%) | 74 (0.6%) |
| 5-Person Households | 760 (5.8%) | 0 (0.0%) |
| 6-Person Households | 453 (3.5%) | 0 (0.0%) |
| 7+ Person Households | 147 (1.1%) | 0 (0.0%) |
| Total | 8,379 (64.3%) | 4,646 (35.7%) |
Female Fertility in Redmond
Fertility by Age in Redmond
Average fertility rate in Redmond is 65.0 births per 1,000 women. Women in the age bracket of 20 to 34 years have the highest fertility rate with 136.0 births per 1,000 women. Women in the age bracket of 20 to 34 years acount for 91.7% of all women with births.
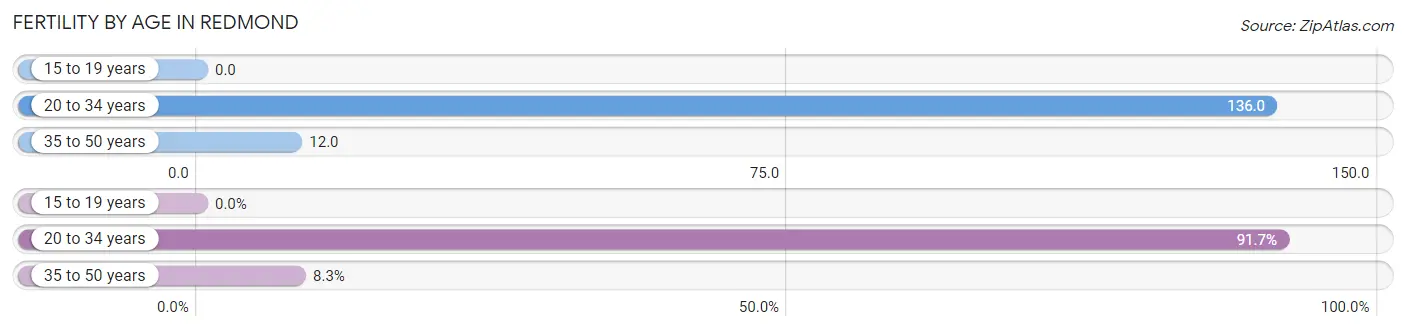
| Age Bracket | Women with Births | Births / 1,000 Women |
| 15 to 19 years | 0 (0.0%) | 0.0 |
| 20 to 34 years | 507 (91.7%) | 136.0 |
| 35 to 50 years | 46 (8.3%) | 12.0 |
| Total | 553 (100.0%) | 65.0 |
Fertility by Age by Marriage Status in Redmond
75.4% of women with births (553) in Redmond are married. The highest percentage of unmarried women with births falls into 20 to 34 years age bracket with 26.8% of them unmarried at the time of birth, while the lowest percentage of unmarried women with births belong to 35 to 50 years age bracket with 0.0% of them unmarried.
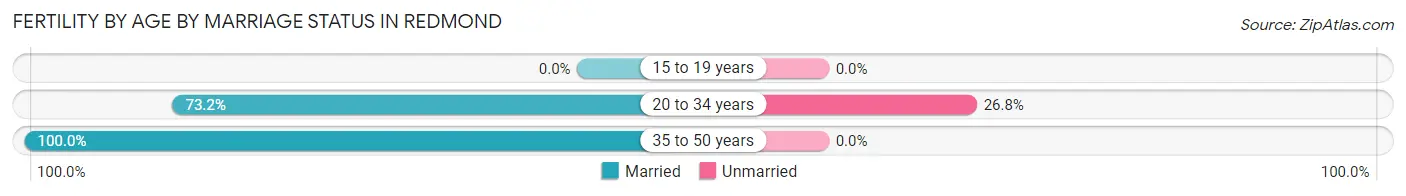
| Age Bracket | Married | Unmarried |
| 15 to 19 years | 0 (0.0%) | 0 (0.0%) |
| 20 to 34 years | 371 (73.2%) | 136 (26.8%) |
| 35 to 50 years | 46 (100.0%) | 0 (0.0%) |
| Total | 417 (75.4%) | 136 (24.6%) |
Fertility by Education in Redmond
Average fertility rate in Redmond is 65.0 births per 1,000 women. Women with the education attainment of high school diploma have the highest fertility rate of 104.0 births per 1,000 women, while women with the education attainment of college or associate's degree have the lowest fertility at 11.0 births per 1,000 women. Women with the education attainment of high school diploma represent 40.3% of all women with births.
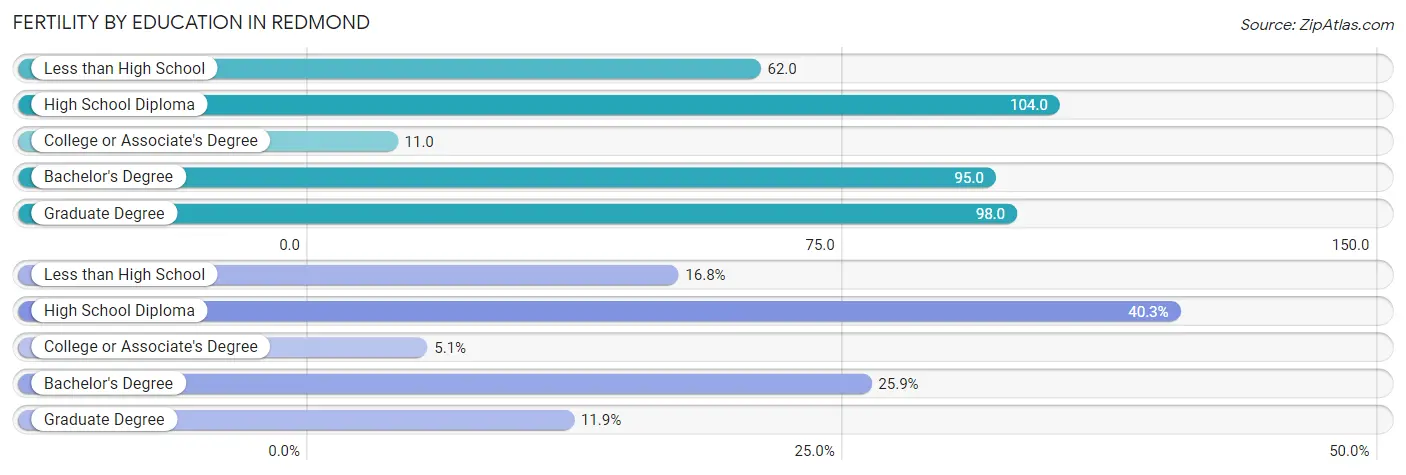
| Educational Attainment | Women with Births | Births / 1,000 Women |
| Less than High School | 93 (16.8%) | 62.0 |
| High School Diploma | 223 (40.3%) | 104.0 |
| College or Associate's Degree | 28 (5.1%) | 11.0 |
| Bachelor's Degree | 143 (25.9%) | 95.0 |
| Graduate Degree | 66 (11.9%) | 98.0 |
| Total | 553 (100.0%) | 65.0 |
Fertility by Education by Marriage Status in Redmond
24.6% of women with births in Redmond are unmarried. Women with the educational attainment of less than high school are most likely to be married with 100.0% of them married at childbirth, while women with the educational attainment of college or associate's degree are least likely to be married with 100.0% of them unmarried at childbirth.
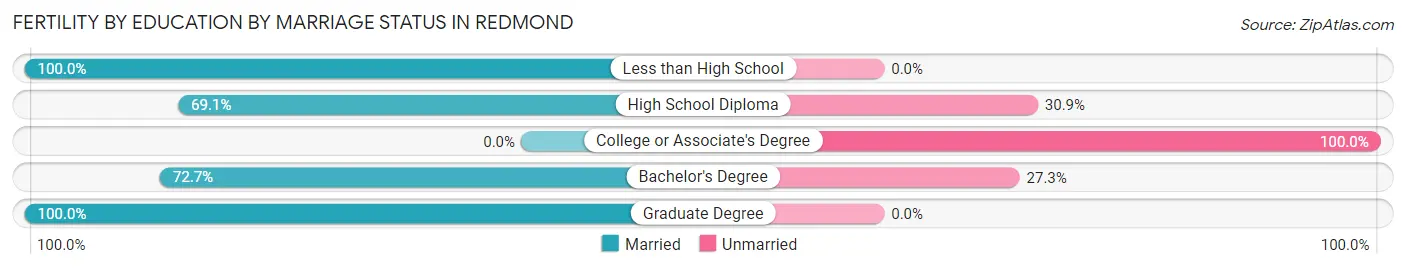
| Educational Attainment | Married | Unmarried |
| Less than High School | 93 (100.0%) | 0 (0.0%) |
| High School Diploma | 154 (69.1%) | 69 (30.9%) |
| College or Associate's Degree | 0 (0.0%) | 28 (100.0%) |
| Bachelor's Degree | 104 (72.7%) | 39 (27.3%) |
| Graduate Degree | 66 (100.0%) | 0 (0.0%) |
| Total | 417 (75.4%) | 136 (24.6%) |
Employment Characteristics in Redmond
Employment by Class of Employer in Redmond
Among the 16,239 employed individuals in Redmond, private company employees (10,891 | 67.1%), local government employees (1,183 | 7.3%), and not-for-profit organizations (1,182 | 7.3%) make up the most common classes of employment.
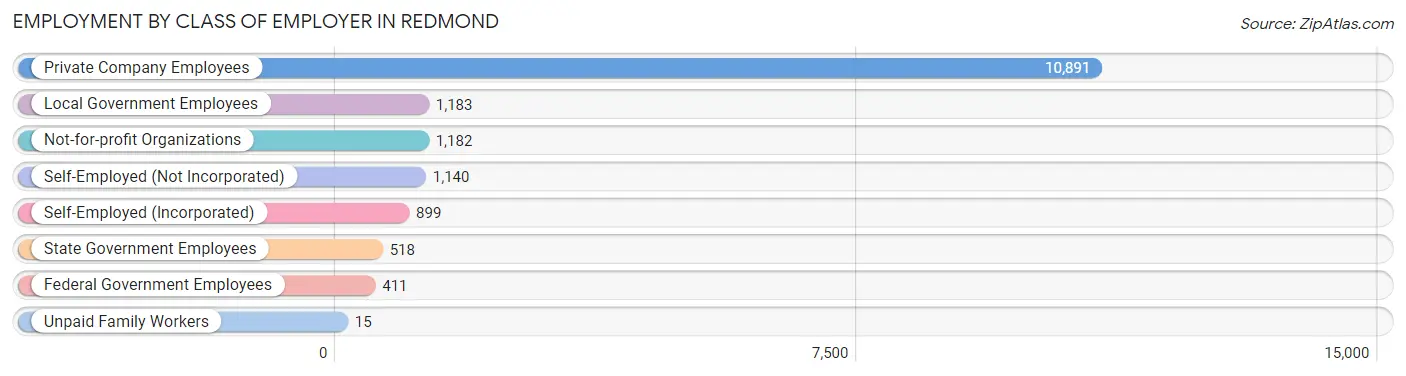
| Employer Class | # Employees | % Employees |
| Private Company Employees | 10,891 | 67.1% |
| Self-Employed (Incorporated) | 899 | 5.5% |
| Self-Employed (Not Incorporated) | 1,140 | 7.0% |
| Not-for-profit Organizations | 1,182 | 7.3% |
| Local Government Employees | 1,183 | 7.3% |
| State Government Employees | 518 | 3.2% |
| Federal Government Employees | 411 | 2.5% |
| Unpaid Family Workers | 15 | 0.1% |
| Total | 16,239 | 100.0% |
Employment Status by Age in Redmond
According to the labor force statistics for Redmond, out of the total population over 16 years of age (26,812), 66.7% or 17,884 individuals are in the labor force, with 7.2% or 1,288 of them unemployed. The age group with the highest labor force participation rate is 25 to 29 years, with 90.3% or 2,075 individuals in the labor force. Within the labor force, the 16 to 19 years age range has the highest percentage of unemployed individuals, with 27.0% or 197 of them being unemployed.
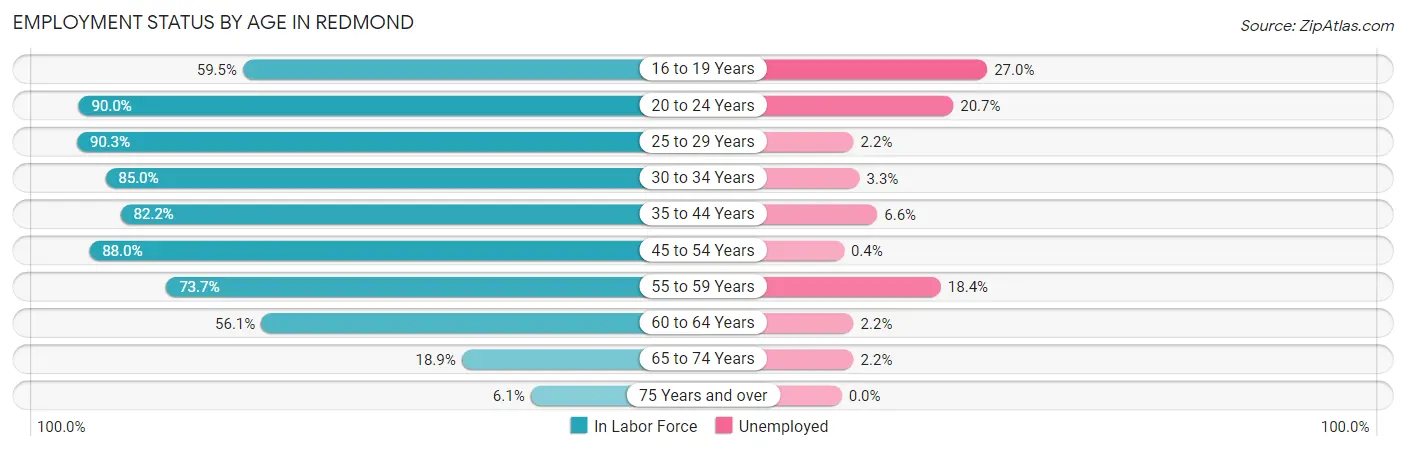
| Age Bracket | In Labor Force | Unemployed |
| 16 to 19 Years | 729 (59.5%) | 197 (27.0%) |
| 20 to 24 Years | 1,933 (90.0%) | 400 (20.7%) |
| 25 to 29 Years | 2,075 (90.3%) | 46 (2.2%) |
| 30 to 34 Years | 2,236 (85.0%) | 74 (3.3%) |
| 35 to 44 Years | 4,362 (82.2%) | 288 (6.6%) |
| 45 to 54 Years | 3,411 (88.0%) | 14 (0.4%) |
| 55 to 59 Years | 1,281 (73.7%) | 236 (18.4%) |
| 60 to 64 Years | 1,113 (56.1%) | 24 (2.2%) |
| 65 to 74 Years | 592 (18.9%) | 13 (2.2%) |
| 75 Years and over | 151 (6.1%) | 0 (0.0%) |
| Total | 17,884 (66.7%) | 1,288 (7.2%) |
Employment Status by Educational Attainment in Redmond
According to labor force statistics for Redmond, 81.2% of individuals (14,480) out of the total population between 25 and 64 years of age (17,833) are in the labor force, with 4.7% or 681 of them being unemployed. The group with the highest labor force participation rate are those with the educational attainment of bachelor's degree or higher, with 89.1% or 3,860 individuals in the labor force. Within the labor force, individuals with less than high school education have the highest percentage of unemployment, with 12.2% or 218 of them being unemployed.
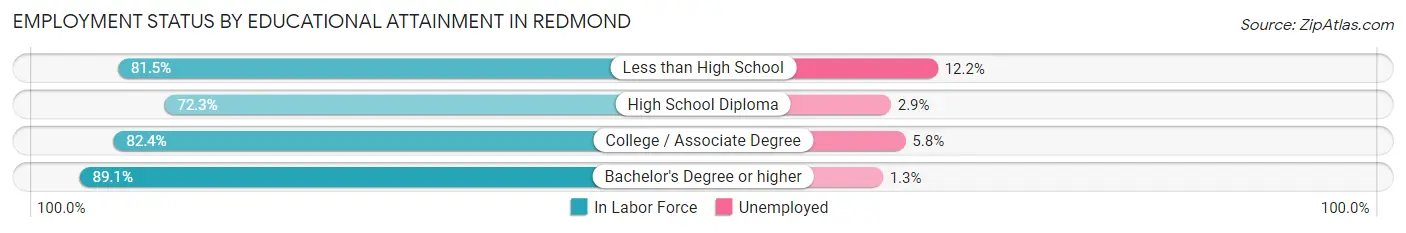
| Educational Attainment | In Labor Force | Unemployed |
| Less than High School | 1,788 (81.5%) | 268 (12.2%) |
| High School Diploma | 3,460 (72.3%) | 139 (2.9%) |
| College / Associate Degree | 5,374 (82.4%) | 378 (5.8%) |
| Bachelor's Degree or higher | 3,860 (89.1%) | 56 (1.3%) |
| Total | 14,480 (81.2%) | 838 (4.7%) |
Employment Occupations by Sex in Redmond
Management, Business, Science and Arts Occupations
The most common Management, Business, Science and Arts occupations in Redmond are Community & Social Service (1,783 | 10.7%), Management (1,518 | 9.1%), Computers, Engineering & Science (903 | 5.4%), Health Diagnosing & Treating (819 | 4.9%), and Education Instruction & Library (698 | 4.2%).
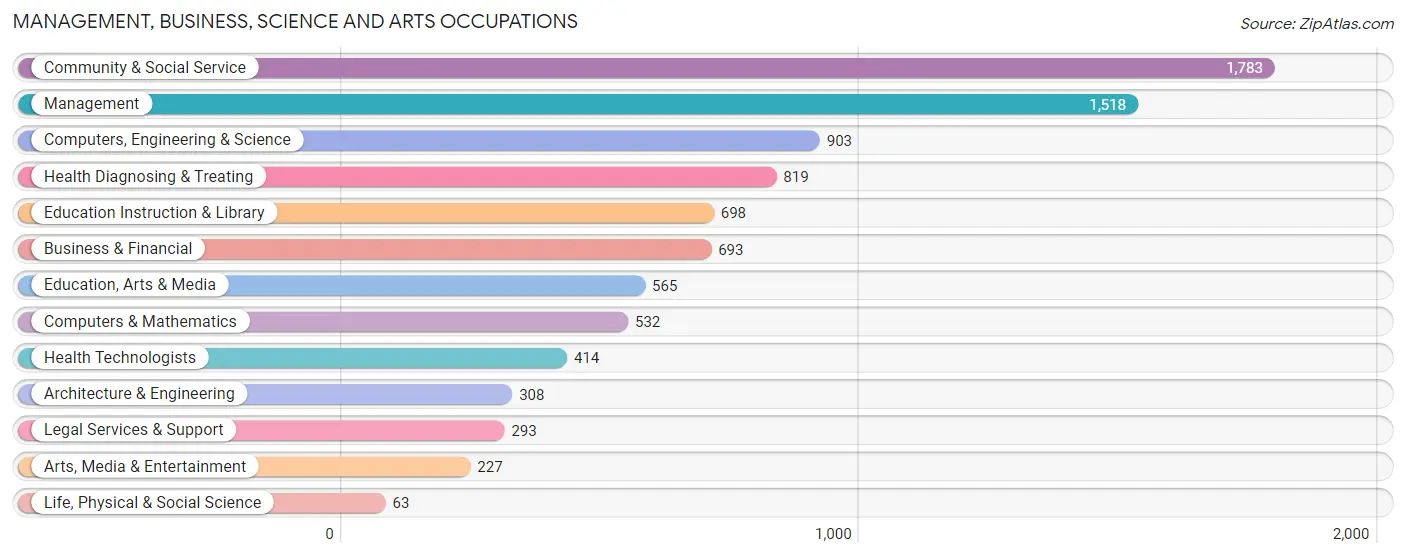
Management, Business, Science and Arts Occupations by Sex
Within the Management, Business, Science and Arts occupations in Redmond, the most male-oriented occupations are Computers & Mathematics (78.8%), Legal Services & Support (78.2%), and Computers, Engineering & Science (77.3%), while the most female-oriented occupations are Education Instruction & Library (91.4%), Health Diagnosing & Treating (80.7%), and Health Technologists (72.7%).
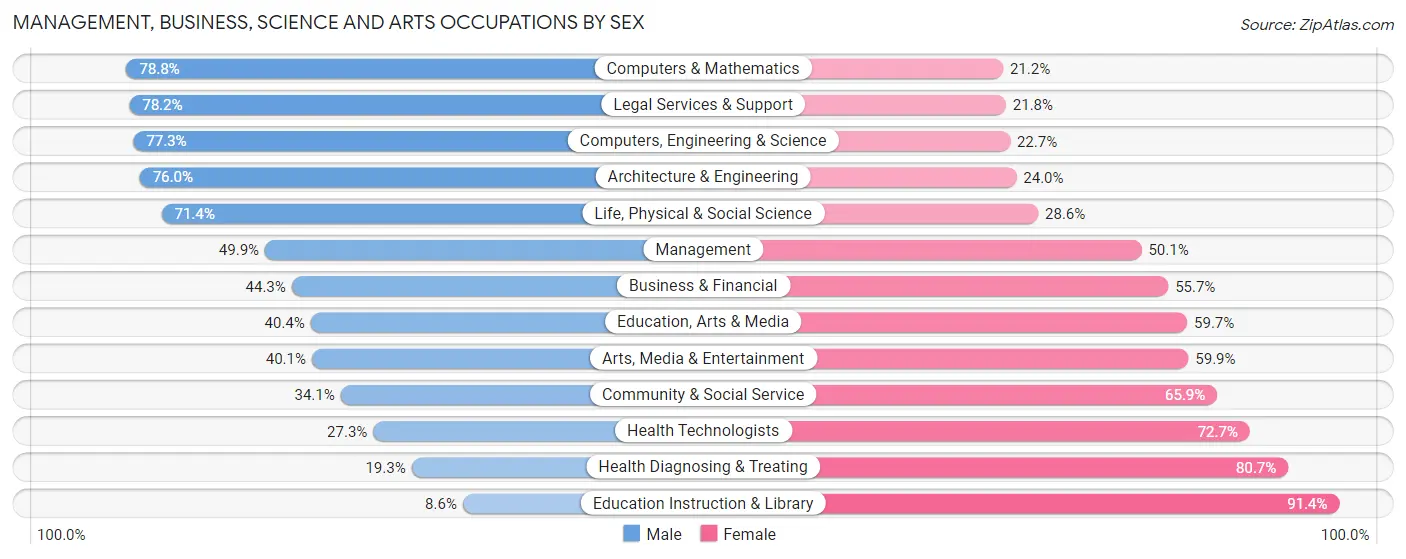
| Occupation | Male | Female |
| Management | 757 (49.9%) | 761 (50.1%) |
| Business & Financial | 307 (44.3%) | 386 (55.7%) |
| Computers, Engineering & Science | 698 (77.3%) | 205 (22.7%) |
| Computers & Mathematics | 419 (78.8%) | 113 (21.2%) |
| Architecture & Engineering | 234 (76.0%) | 74 (24.0%) |
| Life, Physical & Social Science | 45 (71.4%) | 18 (28.6%) |
| Community & Social Service | 608 (34.1%) | 1,175 (65.9%) |
| Education, Arts & Media | 228 (40.4%) | 337 (59.7%) |
| Legal Services & Support | 229 (78.2%) | 64 (21.8%) |
| Education Instruction & Library | 60 (8.6%) | 638 (91.4%) |
| Arts, Media & Entertainment | 91 (40.1%) | 136 (59.9%) |
| Health Diagnosing & Treating | 158 (19.3%) | 661 (80.7%) |
| Health Technologists | 113 (27.3%) | 301 (72.7%) |
| Total (Category) | 2,528 (44.2%) | 3,188 (55.8%) |
| Total (Overall) | 8,364 (50.4%) | 8,232 (49.6%) |
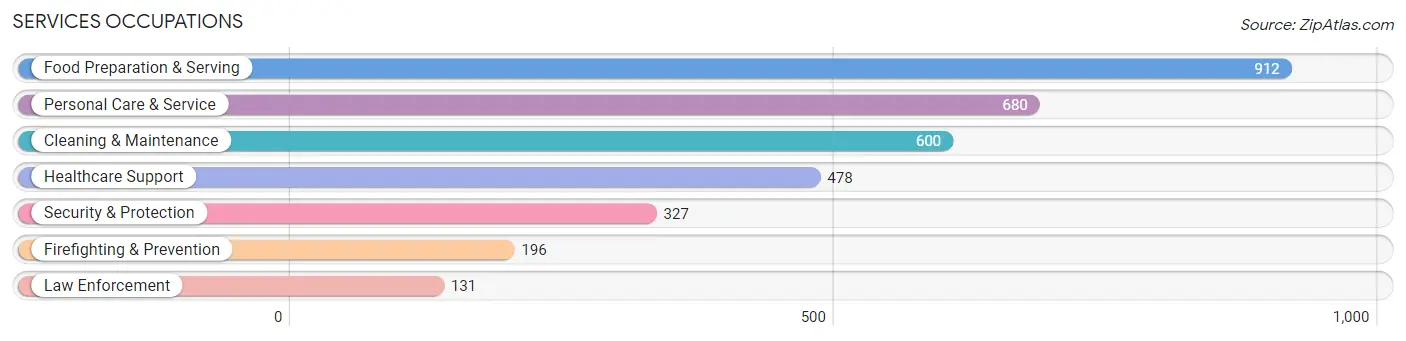
Services Occupations
The most common Services occupations in Redmond are Food Preparation & Serving (912 | 5.5%), Personal Care & Service (680 | 4.1%), Cleaning & Maintenance (600 | 3.6%), Healthcare Support (478 | 2.9%), and Security & Protection (327 | 2.0%).
Services Occupations by Sex
Within the Services occupations in Redmond, the most male-oriented occupations are Law Enforcement (82.4%), Security & Protection (64.2%), and Cleaning & Maintenance (52.3%), while the most female-oriented occupations are Personal Care & Service (83.5%), Food Preparation & Serving (74.3%), and Healthcare Support (74.3%).
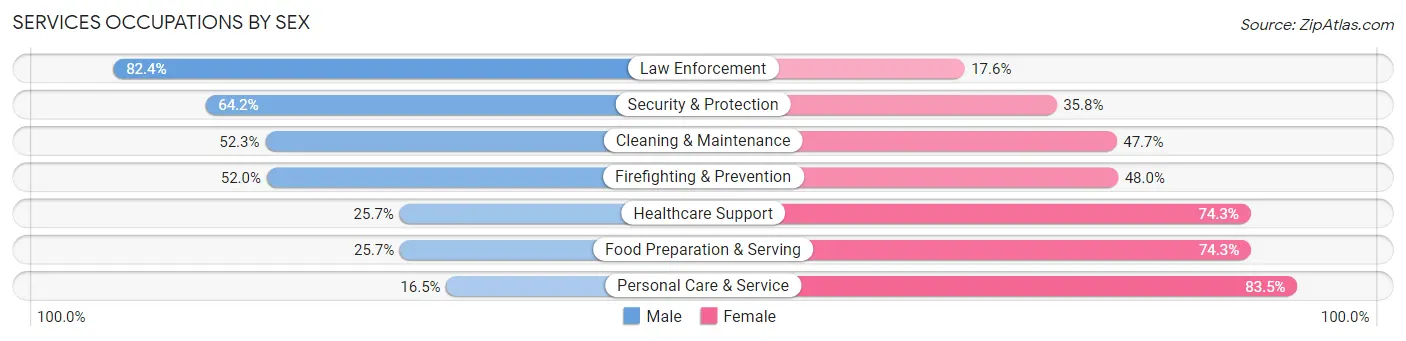
| Occupation | Male | Female |
| Healthcare Support | 123 (25.7%) | 355 (74.3%) |
| Security & Protection | 210 (64.2%) | 117 (35.8%) |
| Firefighting & Prevention | 102 (52.0%) | 94 (48.0%) |
| Law Enforcement | 108 (82.4%) | 23 (17.6%) |
| Food Preparation & Serving | 234 (25.7%) | 678 (74.3%) |
| Cleaning & Maintenance | 314 (52.3%) | 286 (47.7%) |
| Personal Care & Service | 112 (16.5%) | 568 (83.5%) |
| Total (Category) | 993 (33.1%) | 2,004 (66.9%) |
| Total (Overall) | 8,364 (50.4%) | 8,232 (49.6%) |
Sales and Office Occupations
The most common Sales and Office occupations in Redmond are Office & Administration (2,462 | 14.8%), and Sales & Related (1,320 | 8.0%).
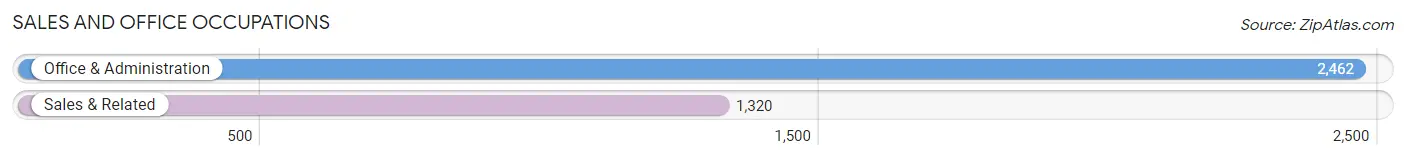
Sales and Office Occupations by Sex
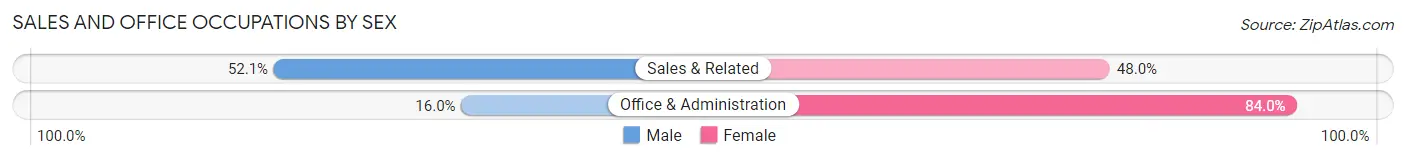
| Occupation | Male | Female |
| Sales & Related | 687 (52.0%) | 633 (47.9%) |
| Office & Administration | 394 (16.0%) | 2,068 (84.0%) |
| Total (Category) | 1,081 (28.6%) | 2,701 (71.4%) |
| Total (Overall) | 8,364 (50.4%) | 8,232 (49.6%) |
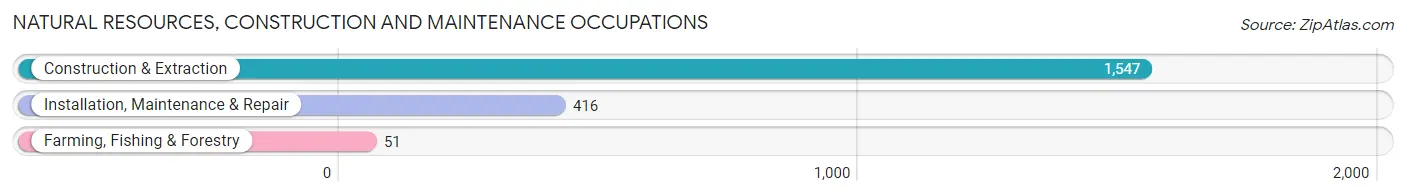
Natural Resources, Construction and Maintenance Occupations
The most common Natural Resources, Construction and Maintenance occupations in Redmond are Construction & Extraction (1,547 | 9.3%), Installation, Maintenance & Repair (416 | 2.5%), and Farming, Fishing & Forestry (51 | 0.3%).
Natural Resources, Construction and Maintenance Occupations by Sex
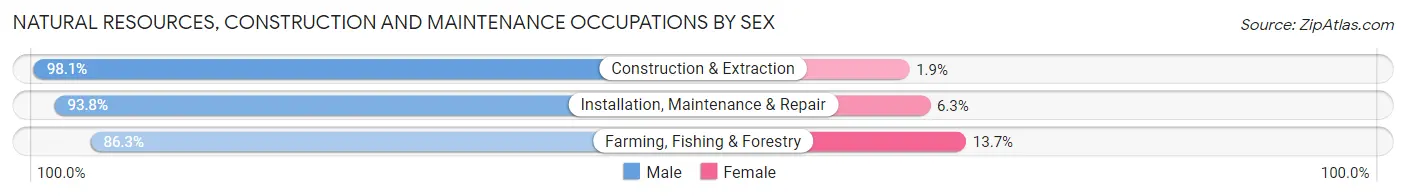
| Occupation | Male | Female |
| Farming, Fishing & Forestry | 44 (86.3%) | 7 (13.7%) |
| Construction & Extraction | 1,517 (98.1%) | 30 (1.9%) |
| Installation, Maintenance & Repair | 390 (93.8%) | 26 (6.2%) |
| Total (Category) | 1,951 (96.9%) | 63 (3.1%) |
| Total (Overall) | 8,364 (50.4%) | 8,232 (49.6%) |
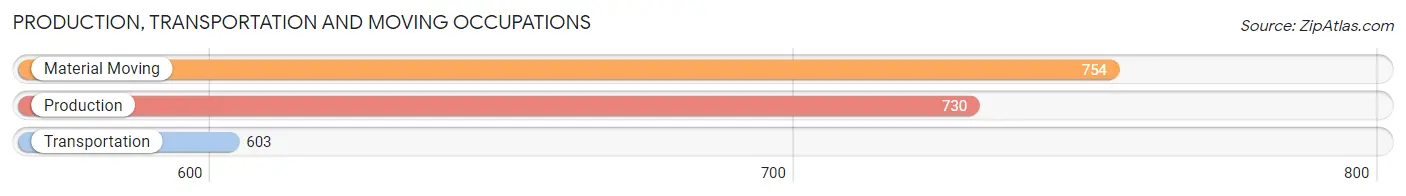
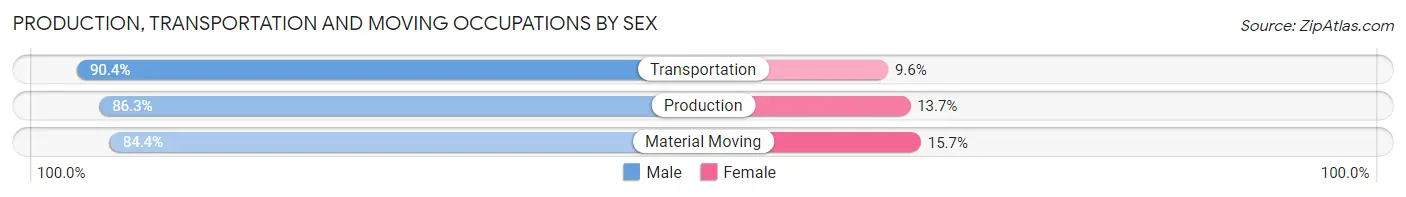
Production, Transportation and Moving Occupations
The most common Production, Transportation and Moving occupations in Redmond are Material Moving (754 | 4.5%), Production (730 | 4.4%), and Transportation (603 | 3.6%).
Production, Transportation and Moving Occupations by Sex
| Occupation | Male | Female |
| Production | 630 (86.3%) | 100 (13.7%) |
| Transportation | 545 (90.4%) | 58 (9.6%) |
| Material Moving | 636 (84.4%) | 118 (15.7%) |
| Total (Category) | 1,811 (86.8%) | 276 (13.2%) |
| Total (Overall) | 8,364 (50.4%) | 8,232 (49.6%) |
Employment Industries by Sex in Redmond
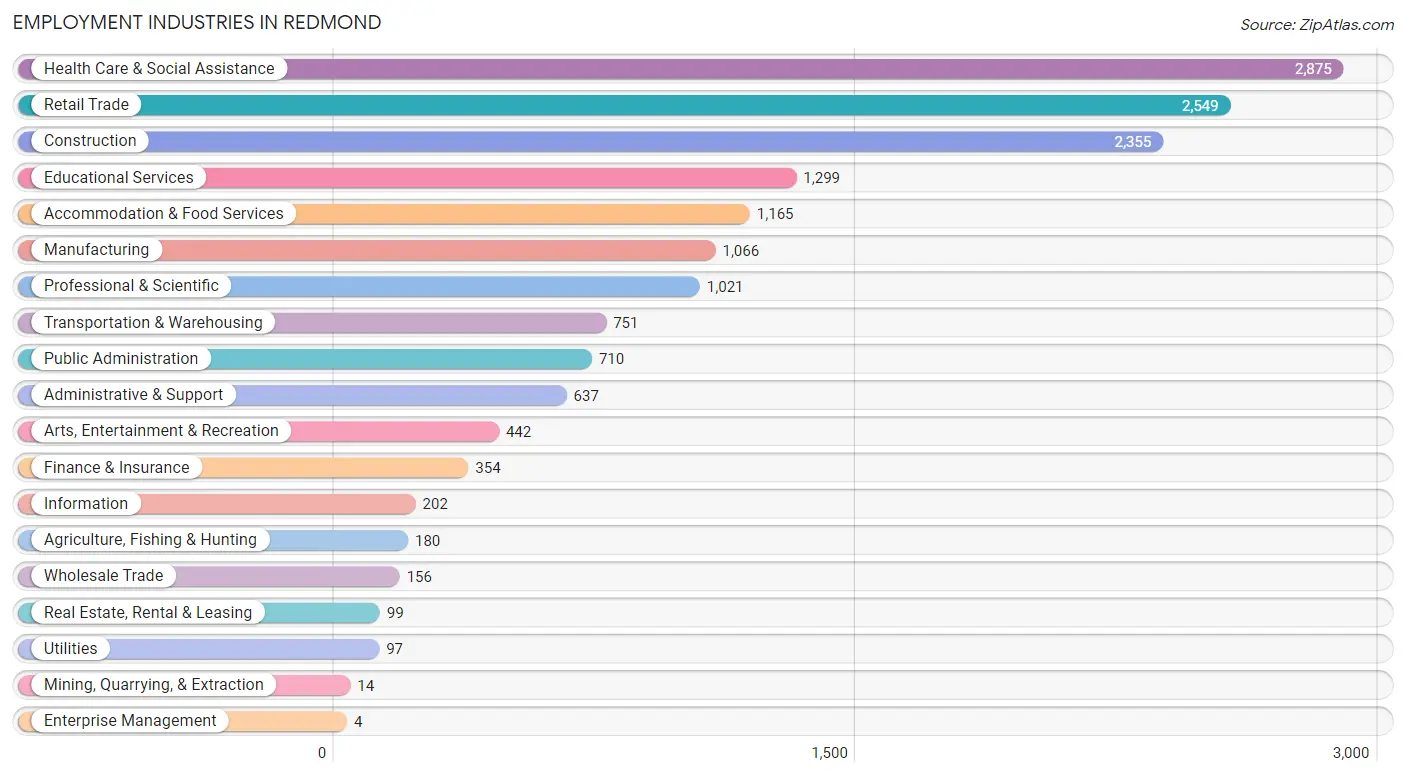
Employment Industries in Redmond
The major employment industries in Redmond include Health Care & Social Assistance (2,875 | 17.3%), Retail Trade (2,549 | 15.4%), Construction (2,355 | 14.2%), Educational Services (1,299 | 7.8%), and Accommodation & Food Services (1,165 | 7.0%).
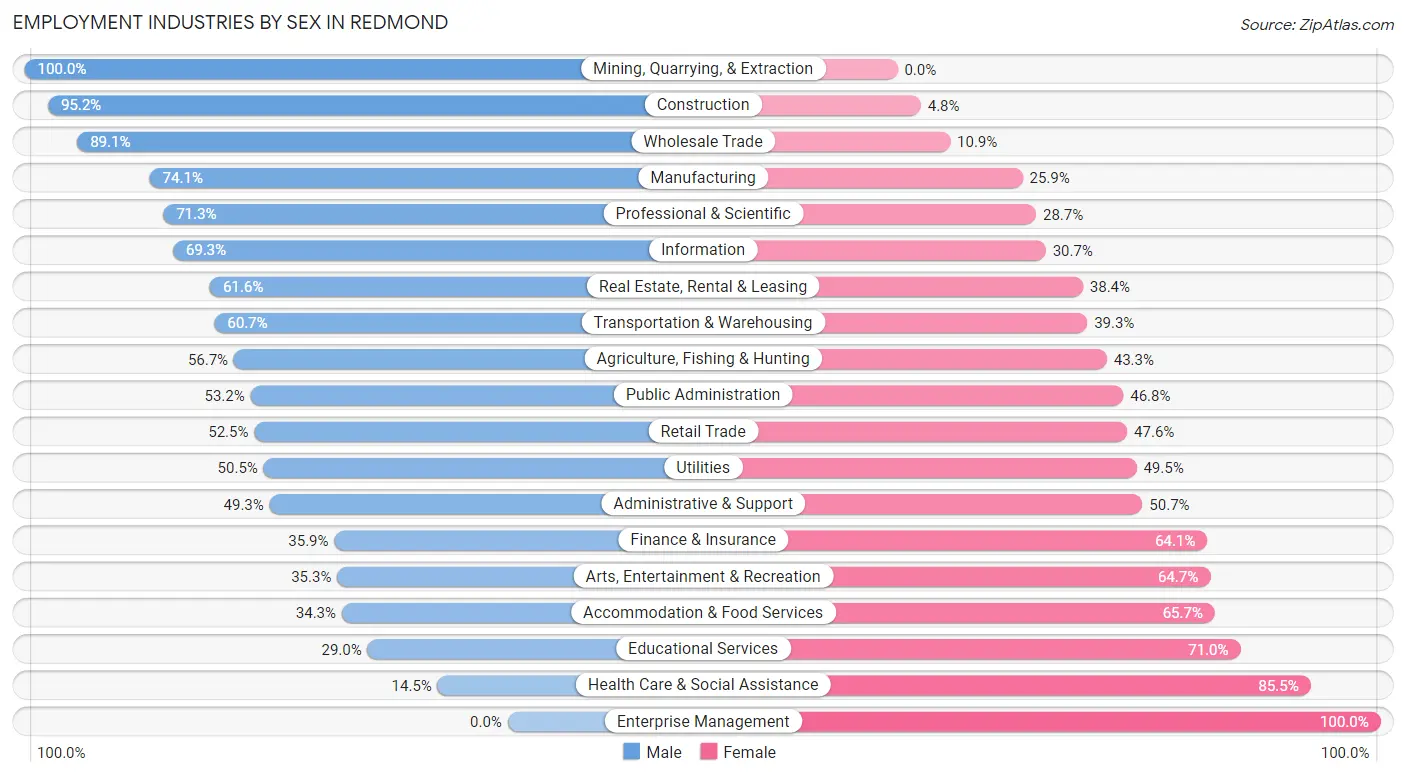
Employment Industries by Sex in Redmond
The Redmond industries that see more men than women are Mining, Quarrying, & Extraction (100.0%), Construction (95.2%), and Wholesale Trade (89.1%), whereas the industries that tend to have a higher number of women are Enterprise Management (100.0%), Health Care & Social Assistance (85.5%), and Educational Services (71.0%).
| Industry | Male | Female |
| Agriculture, Fishing & Hunting | 102 (56.7%) | 78 (43.3%) |
| Mining, Quarrying, & Extraction | 14 (100.0%) | 0 (0.0%) |
| Construction | 2,241 (95.2%) | 114 (4.8%) |
| Manufacturing | 790 (74.1%) | 276 (25.9%) |
| Wholesale Trade | 139 (89.1%) | 17 (10.9%) |
| Retail Trade | 1,337 (52.4%) | 1,212 (47.5%) |
| Transportation & Warehousing | 456 (60.7%) | 295 (39.3%) |
| Utilities | 49 (50.5%) | 48 (49.5%) |
| Information | 140 (69.3%) | 62 (30.7%) |
| Finance & Insurance | 127 (35.9%) | 227 (64.1%) |
| Real Estate, Rental & Leasing | 61 (61.6%) | 38 (38.4%) |
| Professional & Scientific | 728 (71.3%) | 293 (28.7%) |
| Enterprise Management | 0 (0.0%) | 4 (100.0%) |
| Administrative & Support | 314 (49.3%) | 323 (50.7%) |
| Educational Services | 377 (29.0%) | 922 (71.0%) |
| Health Care & Social Assistance | 417 (14.5%) | 2,458 (85.5%) |
| Arts, Entertainment & Recreation | 156 (35.3%) | 286 (64.7%) |
| Accommodation & Food Services | 400 (34.3%) | 765 (65.7%) |
| Public Administration | 378 (53.2%) | 332 (46.8%) |
| Total | 8,364 (50.4%) | 8,232 (49.6%) |
Education in Redmond
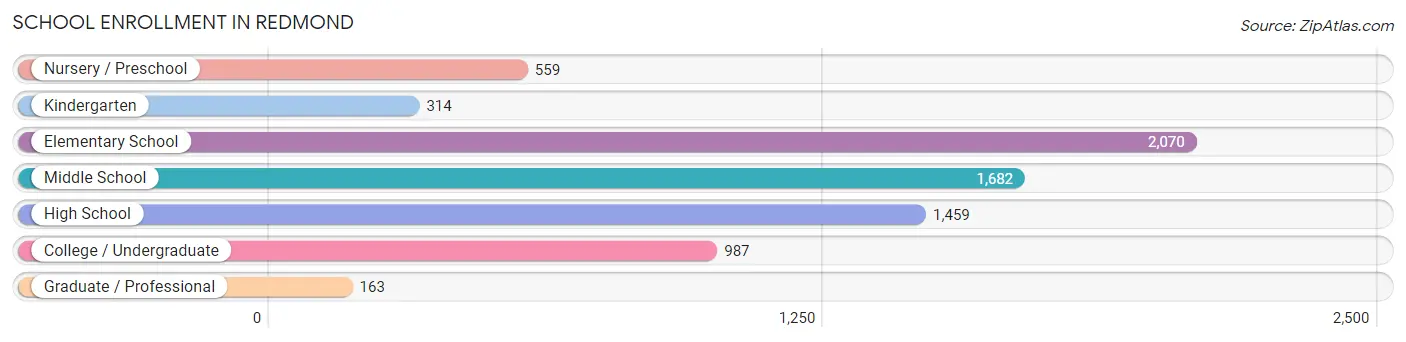
School Enrollment in Redmond
The most common levels of schooling among the 7,234 students in Redmond are elementary school (2,070 | 28.6%), middle school (1,682 | 23.3%), and high school (1,459 | 20.2%).
| School Level | # Students | % Students |
| Nursery / Preschool | 559 | 7.7% |
| Kindergarten | 314 | 4.3% |
| Elementary School | 2,070 | 28.6% |
| Middle School | 1,682 | 23.3% |
| High School | 1,459 | 20.2% |
| College / Undergraduate | 987 | 13.6% |
| Graduate / Professional | 163 | 2.2% |
| Total | 7,234 | 100.0% |
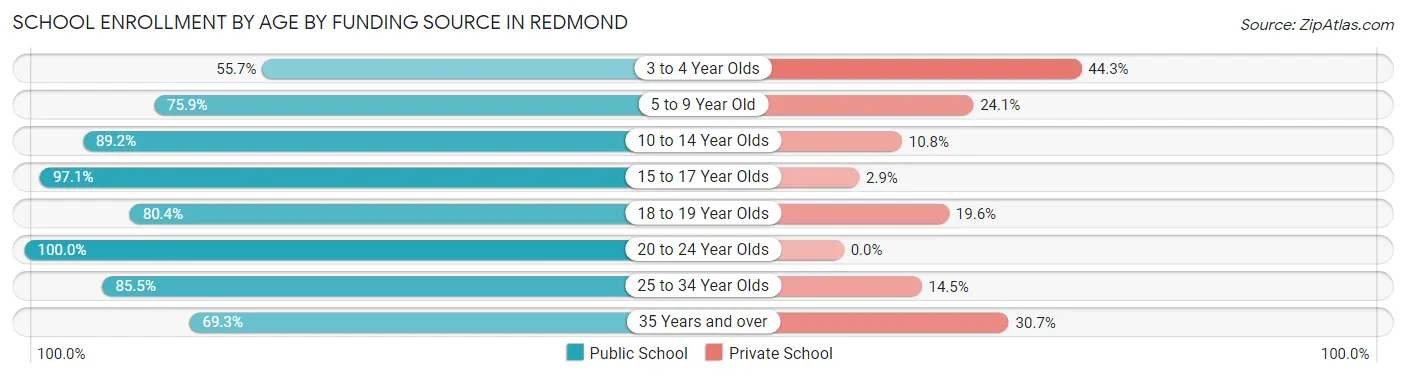
School Enrollment by Age by Funding Source in Redmond
Out of a total of 7,234 students who are enrolled in schools in Redmond, 1,194 (16.5%) attend a private institution, while the remaining 6,040 (83.5%) are enrolled in public schools. The age group of 3 to 4 year olds has the highest likelihood of being enrolled in private schools, with 120 (44.3% in the age bracket) enrolled. Conversely, the age group of 20 to 24 year olds has the lowest likelihood of being enrolled in a private school, with 352 (100.0% in the age bracket) attending a public institution.
| Age Bracket | Public School | Private School |
| 3 to 4 Year Olds | 151 (55.7%) | 120 (44.3%) |
| 5 to 9 Year Old | 1,698 (75.9%) | 540 (24.1%) |
| 10 to 14 Year Olds | 2,073 (89.2%) | 252 (10.8%) |
| 15 to 17 Year Olds | 813 (97.1%) | 24 (2.9%) |
| 18 to 19 Year Olds | 320 (80.4%) | 78 (19.6%) |
| 20 to 24 Year Olds | 352 (100.0%) | 0 (0.0%) |
| 25 to 34 Year Olds | 389 (85.5%) | 66 (14.5%) |
| 35 Years and over | 248 (69.3%) | 110 (30.7%) |
| Total | 6,040 (83.5%) | 1,194 (16.5%) |
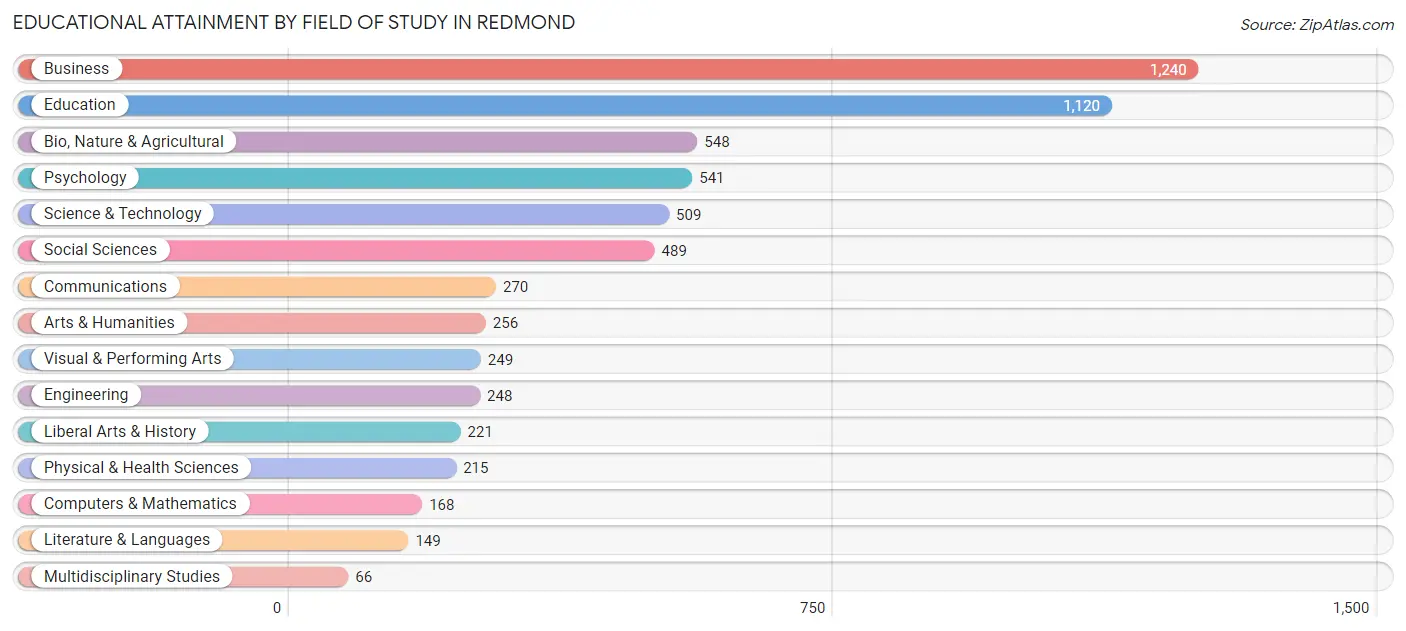
Educational Attainment by Field of Study in Redmond
Business (1,240 | 19.7%), education (1,120 | 17.8%), bio, nature & agricultural (548 | 8.7%), psychology (541 | 8.6%), and science & technology (509 | 8.1%) are the most common fields of study among 6,289 individuals in Redmond who have obtained a bachelor's degree or higher.
| Field of Study | # Graduates | % Graduates |
| Computers & Mathematics | 168 | 2.7% |
| Bio, Nature & Agricultural | 548 | 8.7% |
| Physical & Health Sciences | 215 | 3.4% |
| Psychology | 541 | 8.6% |
| Social Sciences | 489 | 7.8% |
| Engineering | 248 | 3.9% |
| Multidisciplinary Studies | 66 | 1.1% |
| Science & Technology | 509 | 8.1% |
| Business | 1,240 | 19.7% |
| Education | 1,120 | 17.8% |
| Literature & Languages | 149 | 2.4% |
| Liberal Arts & History | 221 | 3.5% |
| Visual & Performing Arts | 249 | 4.0% |
| Communications | 270 | 4.3% |
| Arts & Humanities | 256 | 4.1% |
| Total | 6,289 | 100.0% |
Transportation & Commute in Redmond
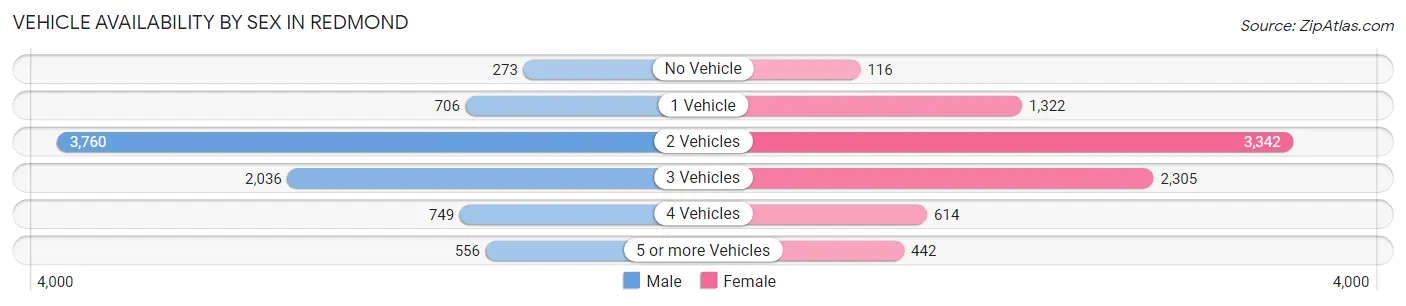
Vehicle Availability by Sex in Redmond
The most prevalent vehicle ownership categories in Redmond are males with 2 vehicles (3,760, accounting for 46.5%) and females with 2 vehicles (3,342, making up 46.2%).
| Vehicles Available | Male | Female |
| No Vehicle | 273 (3.4%) | 116 (1.4%) |
| 1 Vehicle | 706 (8.7%) | 1,322 (16.2%) |
| 2 Vehicles | 3,760 (46.5%) | 3,342 (41.0%) |
| 3 Vehicles | 2,036 (25.2%) | 2,305 (28.3%) |
| 4 Vehicles | 749 (9.3%) | 614 (7.5%) |
| 5 or more Vehicles | 556 (6.9%) | 442 (5.4%) |
| Total | 8,080 (100.0%) | 8,141 (100.0%) |
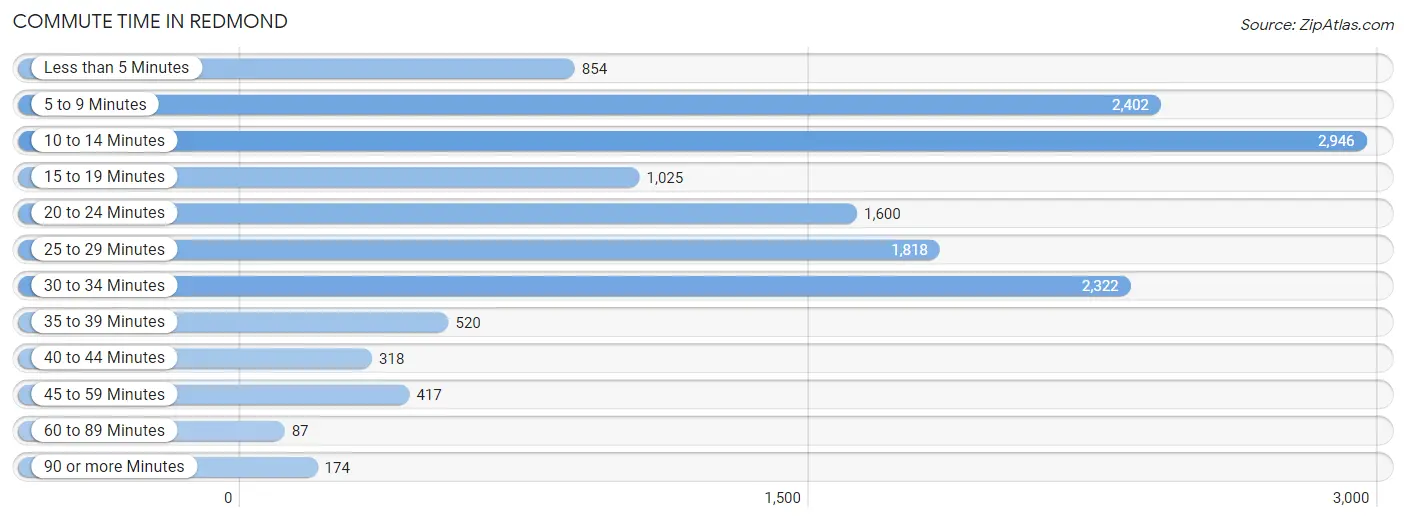
Commute Time in Redmond
The most frequently occuring commute durations in Redmond are 10 to 14 minutes (2,946 commuters, 20.3%), 5 to 9 minutes (2,402 commuters, 16.6%), and 30 to 34 minutes (2,322 commuters, 16.0%).
| Commute Time | # Commuters | % Commuters |
| Less than 5 Minutes | 854 | 5.9% |
| 5 to 9 Minutes | 2,402 | 16.6% |
| 10 to 14 Minutes | 2,946 | 20.3% |
| 15 to 19 Minutes | 1,025 | 7.1% |
| 20 to 24 Minutes | 1,600 | 11.1% |
| 25 to 29 Minutes | 1,818 | 12.6% |
| 30 to 34 Minutes | 2,322 | 16.0% |
| 35 to 39 Minutes | 520 | 3.6% |
| 40 to 44 Minutes | 318 | 2.2% |
| 45 to 59 Minutes | 417 | 2.9% |
| 60 to 89 Minutes | 87 | 0.6% |
| 90 or more Minutes | 174 | 1.2% |
Commute Time by Sex in Redmond
The most common commute times in Redmond are 10 to 14 minutes (1,279 commuters, 17.4%) for males and 10 to 14 minutes (1,667 commuters, 23.3%) for females.
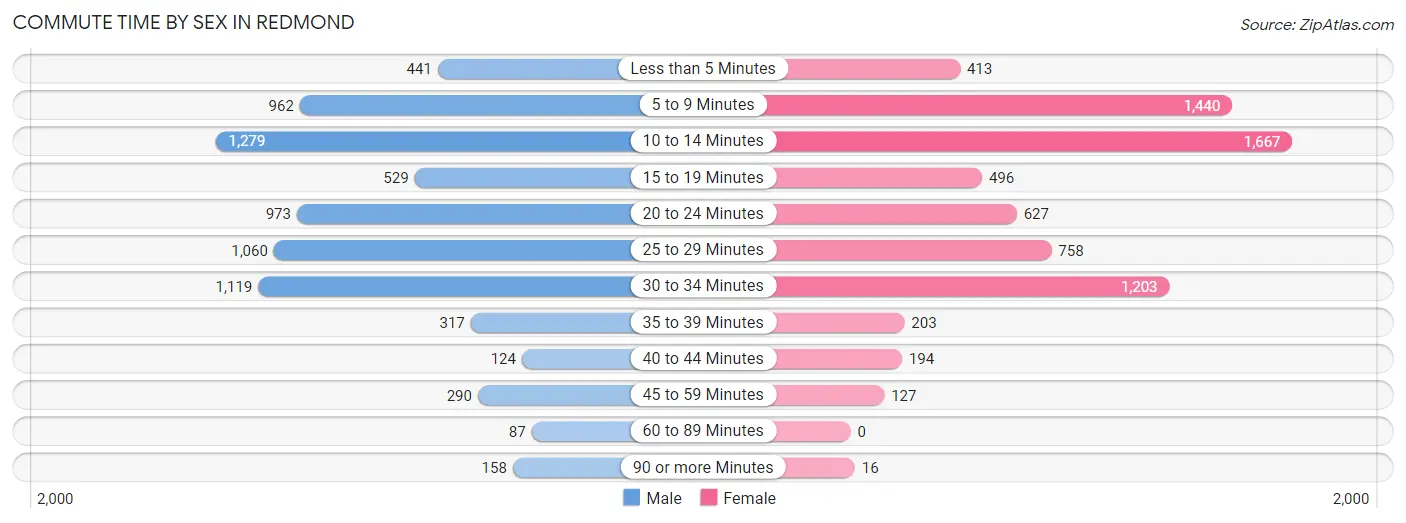
| Commute Time | Male | Female |
| Less than 5 Minutes | 441 (6.0%) | 413 (5.8%) |
| 5 to 9 Minutes | 962 (13.1%) | 1,440 (20.2%) |
| 10 to 14 Minutes | 1,279 (17.4%) | 1,667 (23.3%) |
| 15 to 19 Minutes | 529 (7.2%) | 496 (6.9%) |
| 20 to 24 Minutes | 973 (13.3%) | 627 (8.8%) |
| 25 to 29 Minutes | 1,060 (14.4%) | 758 (10.6%) |
| 30 to 34 Minutes | 1,119 (15.2%) | 1,203 (16.8%) |
| 35 to 39 Minutes | 317 (4.3%) | 203 (2.8%) |
| 40 to 44 Minutes | 124 (1.7%) | 194 (2.7%) |
| 45 to 59 Minutes | 290 (4.0%) | 127 (1.8%) |
| 60 to 89 Minutes | 87 (1.2%) | 0 (0.0%) |
| 90 or more Minutes | 158 (2.1%) | 16 (0.2%) |
Time of Departure to Work by Sex in Redmond
The most frequent times of departure to work in Redmond are 7:00 AM to 7:29 AM (1,287, 17.5%) for males and 7:30 AM to 7:59 AM (1,546, 21.6%) for females.
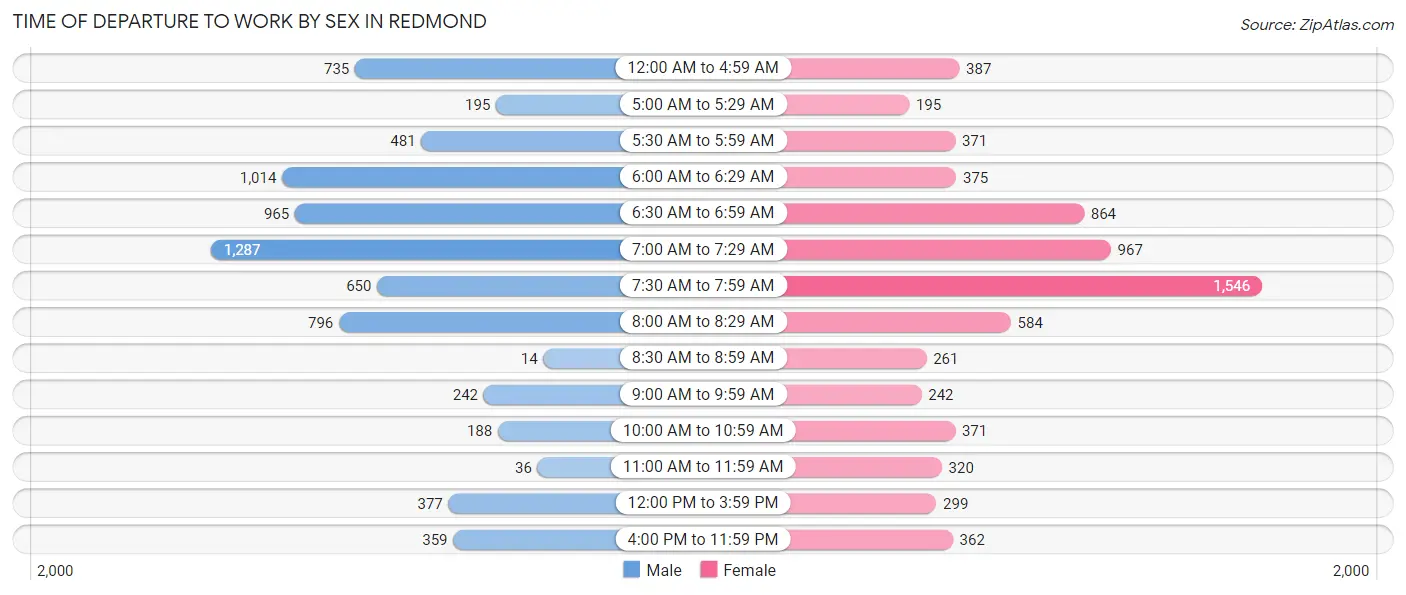
| Time of Departure | Male | Female |
| 12:00 AM to 4:59 AM | 735 (10.0%) | 387 (5.4%) |
| 5:00 AM to 5:29 AM | 195 (2.7%) | 195 (2.7%) |
| 5:30 AM to 5:59 AM | 481 (6.6%) | 371 (5.2%) |
| 6:00 AM to 6:29 AM | 1,014 (13.8%) | 375 (5.2%) |
| 6:30 AM to 6:59 AM | 965 (13.2%) | 864 (12.1%) |
| 7:00 AM to 7:29 AM | 1,287 (17.5%) | 967 (13.5%) |
| 7:30 AM to 7:59 AM | 650 (8.9%) | 1,546 (21.6%) |
| 8:00 AM to 8:29 AM | 796 (10.8%) | 584 (8.2%) |
| 8:30 AM to 8:59 AM | 14 (0.2%) | 261 (3.6%) |
| 9:00 AM to 9:59 AM | 242 (3.3%) | 242 (3.4%) |
| 10:00 AM to 10:59 AM | 188 (2.6%) | 371 (5.2%) |
| 11:00 AM to 11:59 AM | 36 (0.5%) | 320 (4.5%) |
| 12:00 PM to 3:59 PM | 377 (5.1%) | 299 (4.2%) |
| 4:00 PM to 11:59 PM | 359 (4.9%) | 362 (5.1%) |
| Total | 7,339 (100.0%) | 7,144 (100.0%) |
Housing Occupancy in Redmond
Occupancy by Ownership in Redmond
Of the total 13,025 dwellings in Redmond, owner-occupied units account for 8,367 (64.2%), while renter-occupied units make up 4,658 (35.8%).
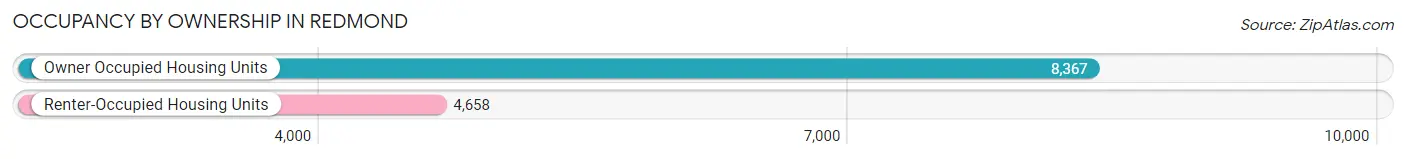
| Occupancy | # Housing Units | % Housing Units |
| Owner Occupied Housing Units | 8,367 | 64.2% |
| Renter-Occupied Housing Units | 4,658 | 35.8% |
| Total Occupied Housing Units | 13,025 | 100.0% |
Occupancy by Household Size in Redmond
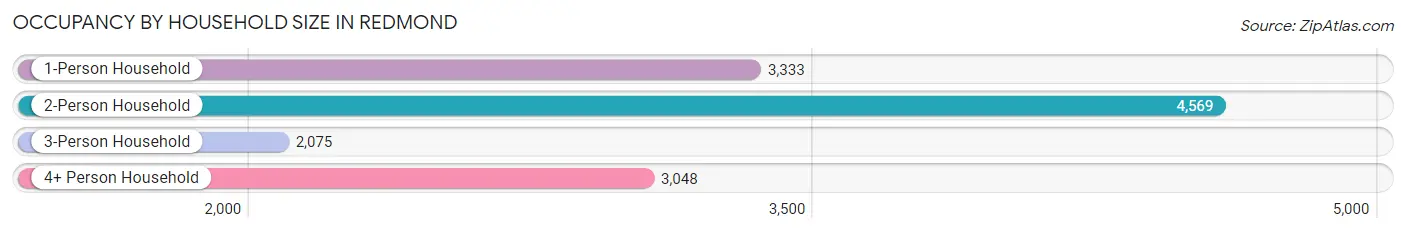
| Household Size | # Housing Units | % Housing Units |
| 1-Person Household | 3,333 | 25.6% |
| 2-Person Household | 4,569 | 35.1% |
| 3-Person Household | 2,075 | 15.9% |
| 4+ Person Household | 3,048 | 23.4% |
| Total Housing Units | 13,025 | 100.0% |
Occupancy by Ownership by Household Size in Redmond
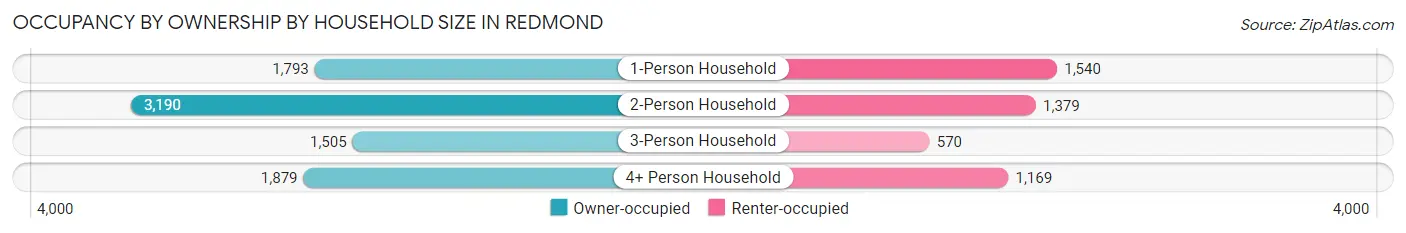
| Household Size | Owner-occupied | Renter-occupied |
| 1-Person Household | 1,793 (53.8%) | 1,540 (46.2%) |
| 2-Person Household | 3,190 (69.8%) | 1,379 (30.2%) |
| 3-Person Household | 1,505 (72.5%) | 570 (27.5%) |
| 4+ Person Household | 1,879 (61.7%) | 1,169 (38.4%) |
| Total Housing Units | 8,367 (64.2%) | 4,658 (35.8%) |
Occupancy by Educational Attainment in Redmond
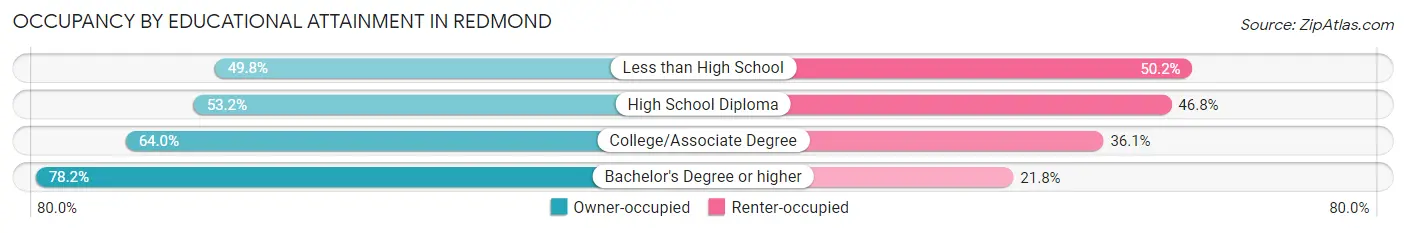
| Household Size | Owner-occupied | Renter-occupied |
| Less than High School | 471 (49.8%) | 474 (50.2%) |
| High School Diploma | 1,533 (53.2%) | 1,350 (46.8%) |
| College/Associate Degree | 3,725 (63.9%) | 2,100 (36.0%) |
| Bachelor's Degree or higher | 2,638 (78.2%) | 734 (21.8%) |
Occupancy by Age of Householder in Redmond
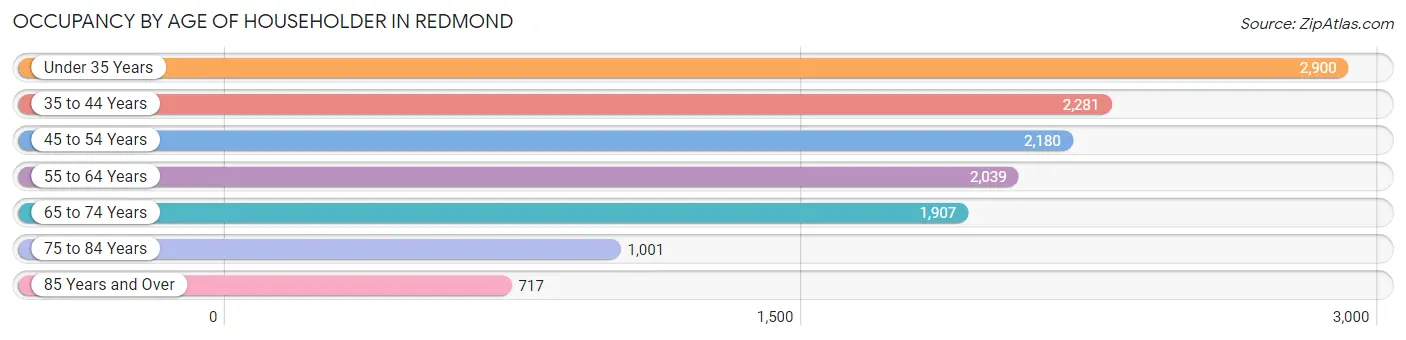
| Age Bracket | # Households | % Households |
| Under 35 Years | 2,900 | 22.3% |
| 35 to 44 Years | 2,281 | 17.5% |
| 45 to 54 Years | 2,180 | 16.7% |
| 55 to 64 Years | 2,039 | 15.7% |
| 65 to 74 Years | 1,907 | 14.6% |
| 75 to 84 Years | 1,001 | 7.7% |
| 85 Years and Over | 717 | 5.5% |
| Total | 13,025 | 100.0% |
Housing Finances in Redmond
Median Income by Occupancy in Redmond
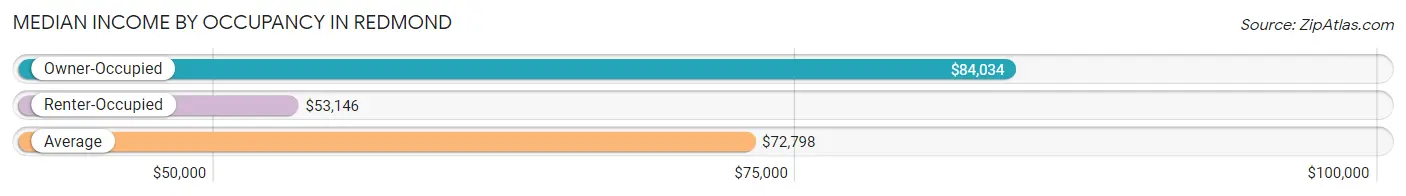
| Occupancy Type | # Households | Median Income |
| Owner-Occupied | 8,367 (64.2%) | $84,034 |
| Renter-Occupied | 4,658 (35.8%) | $53,146 |
| Average | 13,025 (100.0%) | $72,798 |
Occupancy by Householder Income Bracket in Redmond
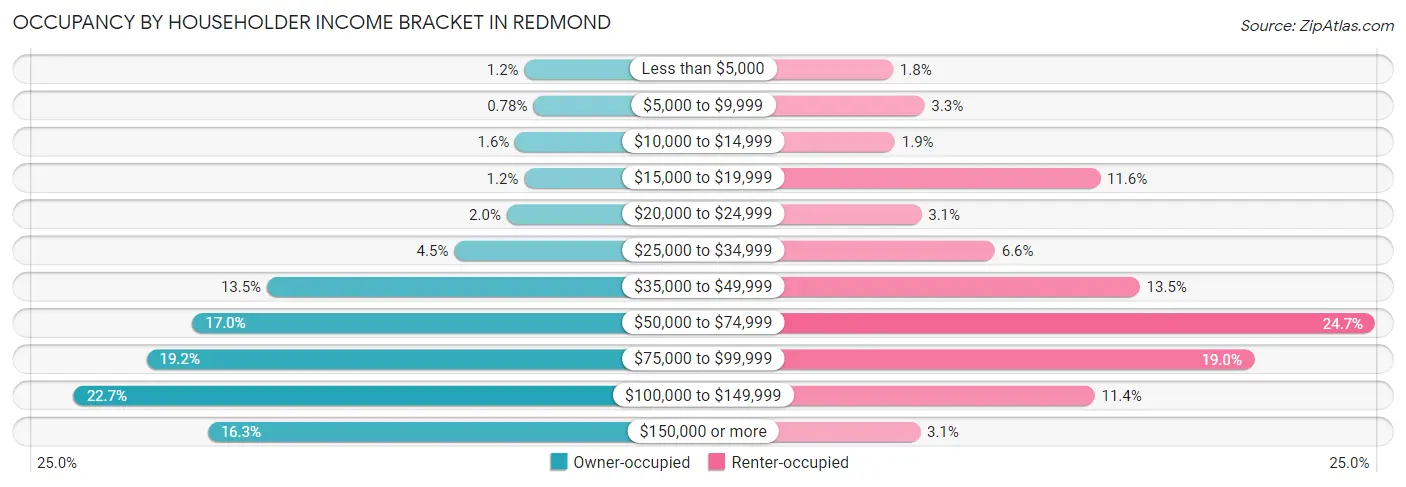
| Income Bracket | Owner-occupied | Renter-occupied |
| Less than $5,000 | 100 (1.2%) | 83 (1.8%) |
| $5,000 to $9,999 | 65 (0.8%) | 153 (3.3%) |
| $10,000 to $14,999 | 137 (1.6%) | 87 (1.9%) |
| $15,000 to $19,999 | 101 (1.2%) | 542 (11.6%) |
| $20,000 to $24,999 | 171 (2.0%) | 146 (3.1%) |
| $25,000 to $34,999 | 380 (4.5%) | 309 (6.6%) |
| $35,000 to $49,999 | 1,126 (13.5%) | 630 (13.5%) |
| $50,000 to $74,999 | 1,423 (17.0%) | 1,152 (24.7%) |
| $75,000 to $99,999 | 1,606 (19.2%) | 883 (19.0%) |
| $100,000 to $149,999 | 1,896 (22.7%) | 530 (11.4%) |
| $150,000 or more | 1,362 (16.3%) | 143 (3.1%) |
| Total | 8,367 (100.0%) | 4,658 (100.0%) |
Monthly Housing Cost Tiers in Redmond
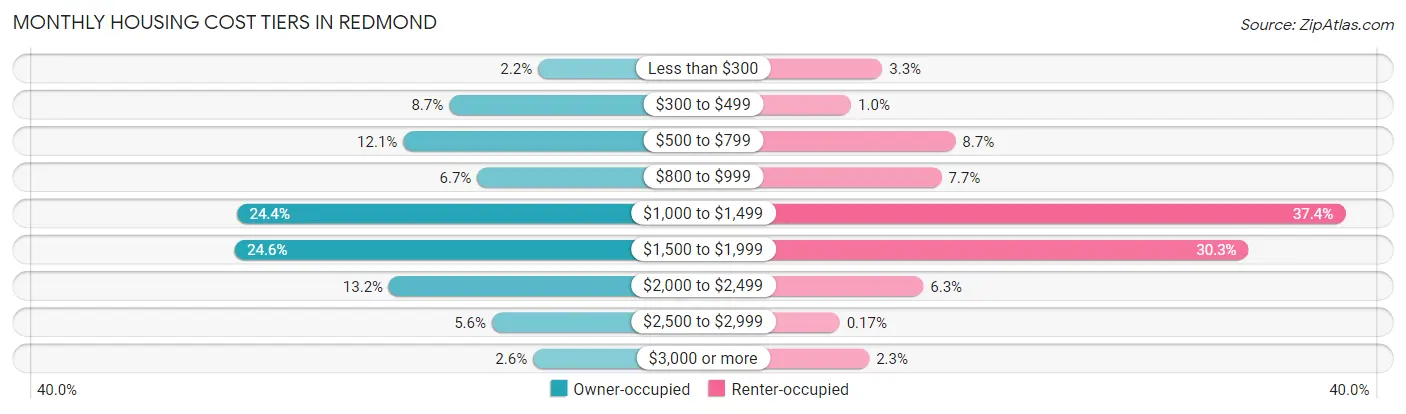
| Monthly Cost | Owner-occupied | Renter-occupied |
| Less than $300 | 183 (2.2%) | 154 (3.3%) |
| $300 to $499 | 731 (8.7%) | 47 (1.0%) |
| $500 to $799 | 1,014 (12.1%) | 405 (8.7%) |
| $800 to $999 | 558 (6.7%) | 357 (7.7%) |
| $1,000 to $1,499 | 2,041 (24.4%) | 1,741 (37.4%) |
| $1,500 to $1,999 | 2,056 (24.6%) | 1,410 (30.3%) |
| $2,000 to $2,499 | 1,102 (13.2%) | 295 (6.3%) |
| $2,500 to $2,999 | 468 (5.6%) | 8 (0.2%) |
| $3,000 or more | 214 (2.6%) | 109 (2.3%) |
| Total | 8,367 (100.0%) | 4,658 (100.0%) |
Physical Housing Characteristics in Redmond
Housing Structures in Redmond
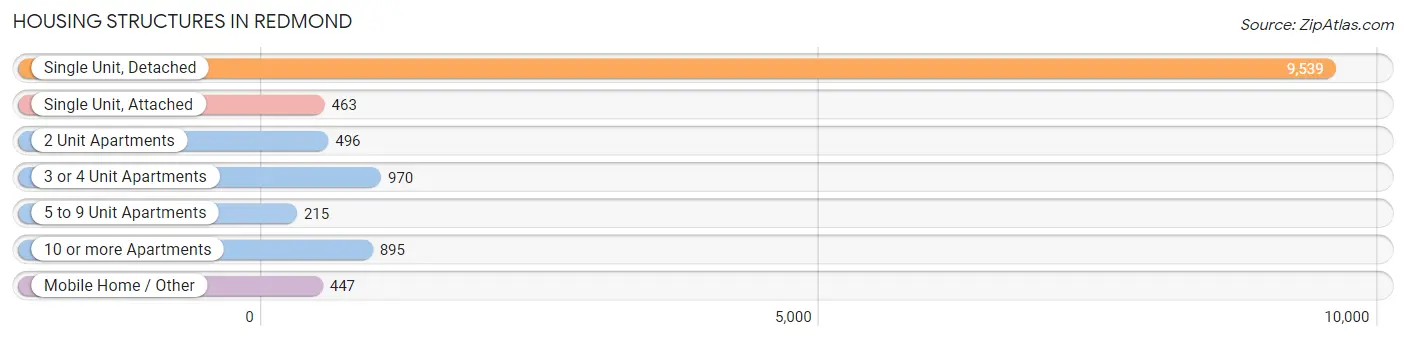
| Structure Type | # Housing Units | % Housing Units |
| Single Unit, Detached | 9,539 | 73.2% |
| Single Unit, Attached | 463 | 3.5% |
| 2 Unit Apartments | 496 | 3.8% |
| 3 or 4 Unit Apartments | 970 | 7.4% |
| 5 to 9 Unit Apartments | 215 | 1.7% |
| 10 or more Apartments | 895 | 6.9% |
| Mobile Home / Other | 447 | 3.4% |
| Total | 13,025 | 100.0% |
Housing Structures by Occupancy in Redmond
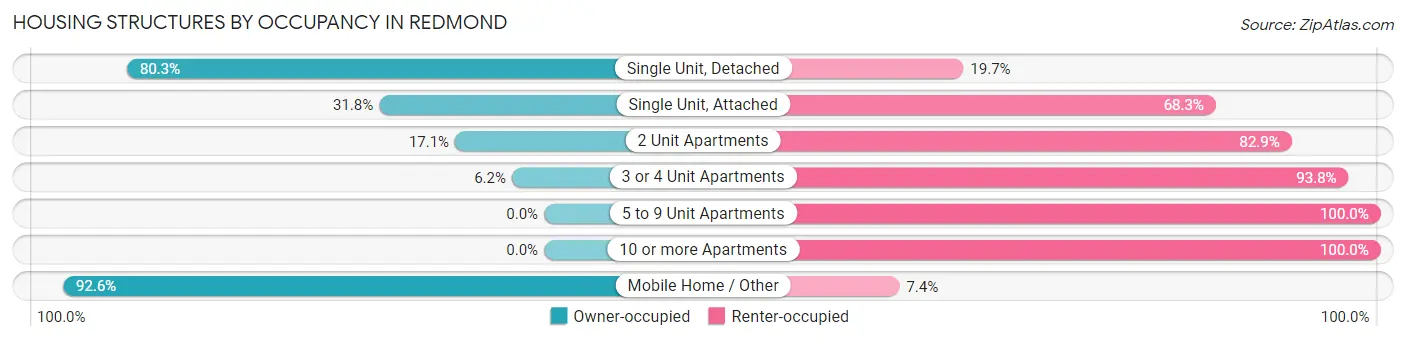
| Structure Type | Owner-occupied | Renter-occupied |
| Single Unit, Detached | 7,661 (80.3%) | 1,878 (19.7%) |
| Single Unit, Attached | 147 (31.8%) | 316 (68.2%) |
| 2 Unit Apartments | 85 (17.1%) | 411 (82.9%) |
| 3 or 4 Unit Apartments | 60 (6.2%) | 910 (93.8%) |
| 5 to 9 Unit Apartments | 0 (0.0%) | 215 (100.0%) |
| 10 or more Apartments | 0 (0.0%) | 895 (100.0%) |
| Mobile Home / Other | 414 (92.6%) | 33 (7.4%) |
| Total | 8,367 (64.2%) | 4,658 (35.8%) |
Housing Structures by Number of Rooms in Redmond
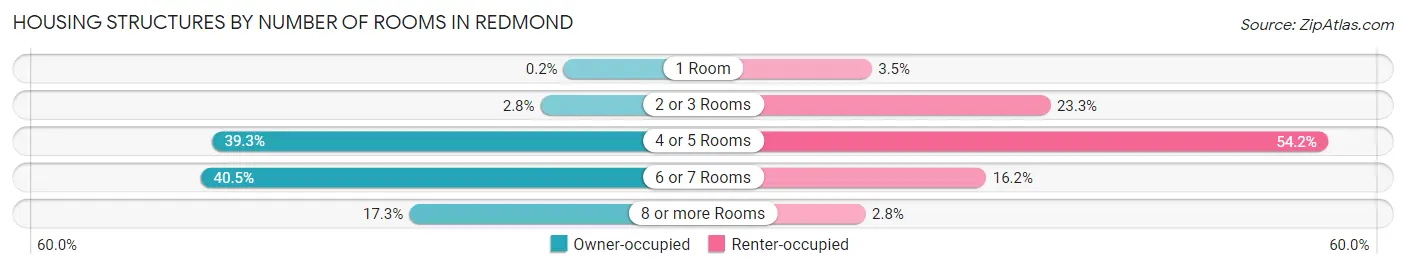
| Number of Rooms | Owner-occupied | Renter-occupied |
| 1 Room | 17 (0.2%) | 162 (3.5%) |
| 2 or 3 Rooms | 231 (2.8%) | 1,086 (23.3%) |
| 4 or 5 Rooms | 3,284 (39.3%) | 2,526 (54.2%) |
| 6 or 7 Rooms | 3,385 (40.5%) | 754 (16.2%) |
| 8 or more Rooms | 1,450 (17.3%) | 130 (2.8%) |
| Total | 8,367 (100.0%) | 4,658 (100.0%) |
Housing Structure by Heating Type in Redmond
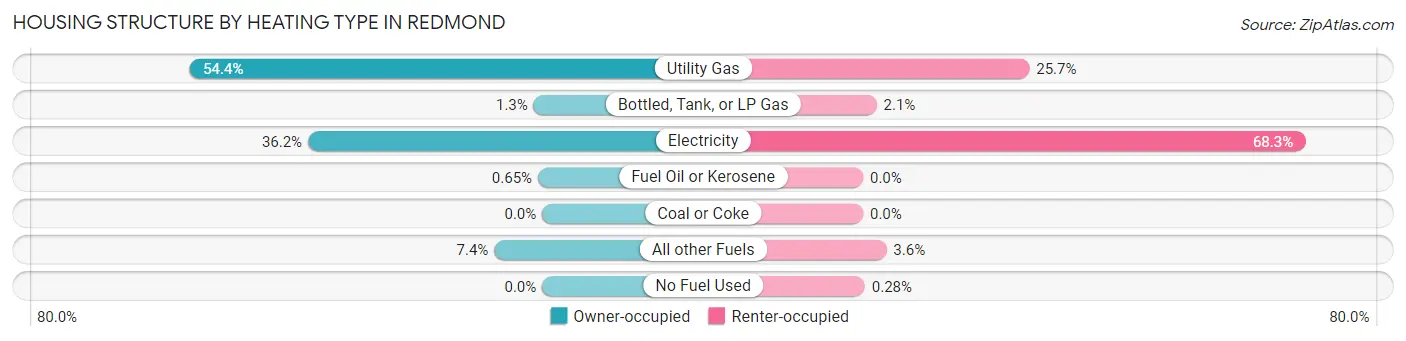
| Heating Type | Owner-occupied | Renter-occupied |
| Utility Gas | 4,554 (54.4%) | 1,197 (25.7%) |
| Bottled, Tank, or LP Gas | 110 (1.3%) | 98 (2.1%) |
| Electricity | 3,029 (36.2%) | 3,182 (68.3%) |
| Fuel Oil or Kerosene | 54 (0.6%) | 0 (0.0%) |
| Coal or Coke | 0 (0.0%) | 0 (0.0%) |
| All other Fuels | 620 (7.4%) | 168 (3.6%) |
| No Fuel Used | 0 (0.0%) | 13 (0.3%) |
| Total | 8,367 (100.0%) | 4,658 (100.0%) |
Household Vehicle Usage in Redmond
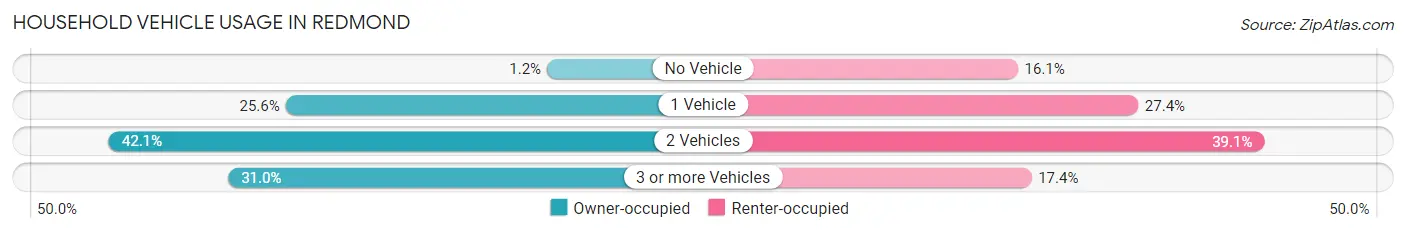
| Vehicles per Household | Owner-occupied | Renter-occupied |
| No Vehicle | 104 (1.2%) | 751 (16.1%) |
| 1 Vehicle | 2,145 (25.6%) | 1,274 (27.4%) |
| 2 Vehicles | 3,525 (42.1%) | 1,823 (39.1%) |
| 3 or more Vehicles | 2,593 (31.0%) | 810 (17.4%) |
| Total | 8,367 (100.0%) | 4,658 (100.0%) |
Real Estate & Mortgages in Redmond
Real Estate and Mortgage Overview in Redmond
| Characteristic | Without Mortgage | With Mortgage |
| Housing Units | 2,063 | 6,304 |
| Median Property Value | $384,300 | $378,500 |
| Median Household Income | $64,774 | $1,147 |
| Monthly Housing Costs | $538 | $214 |
| Real Estate Taxes | $3,049 | $23 |
Property Value by Mortgage Status in Redmond
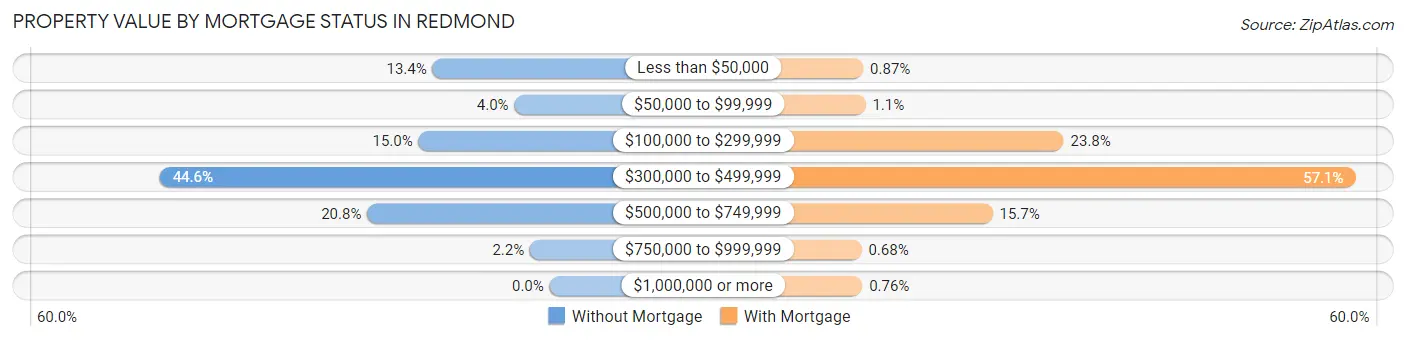
| Property Value | Without Mortgage | With Mortgage |
| Less than $50,000 | 276 (13.4%) | 55 (0.9%) |
| $50,000 to $99,999 | 83 (4.0%) | 71 (1.1%) |
| $100,000 to $299,999 | 309 (15.0%) | 1,499 (23.8%) |
| $300,000 to $499,999 | 919 (44.6%) | 3,601 (57.1%) |
| $500,000 to $749,999 | 430 (20.8%) | 987 (15.7%) |
| $750,000 to $999,999 | 46 (2.2%) | 43 (0.7%) |
| $1,000,000 or more | 0 (0.0%) | 48 (0.8%) |
| Total | 2,063 (100.0%) | 6,304 (100.0%) |
Household Income by Mortgage Status in Redmond
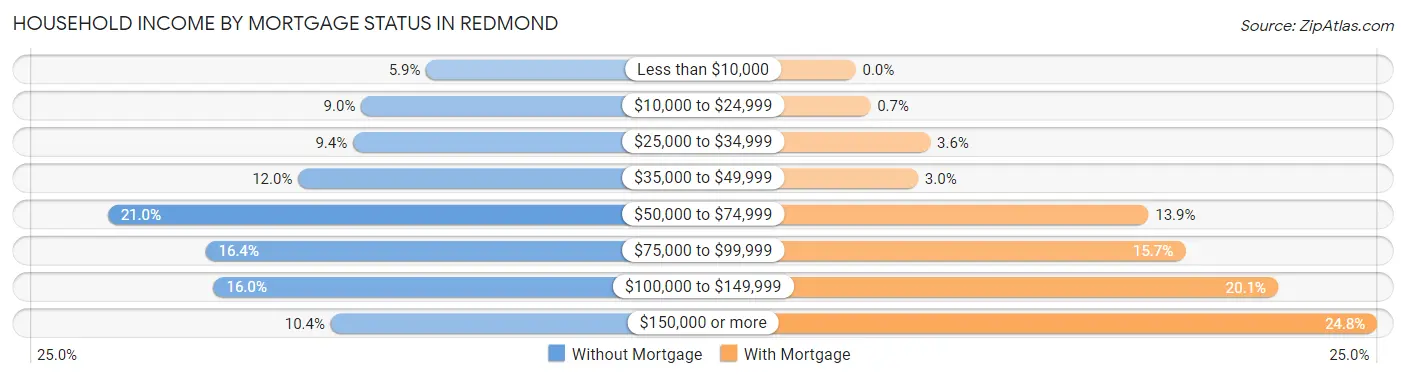
| Household Income | Without Mortgage | With Mortgage |
| Less than $10,000 | 121 (5.9%) | 0 (0.0%) |
| $10,000 to $24,999 | 185 (9.0%) | 44 (0.7%) |
| $25,000 to $34,999 | 193 (9.4%) | 224 (3.5%) |
| $35,000 to $49,999 | 247 (12.0%) | 187 (3.0%) |
| $50,000 to $74,999 | 434 (21.0%) | 879 (13.9%) |
| $75,000 to $99,999 | 338 (16.4%) | 989 (15.7%) |
| $100,000 to $149,999 | 330 (16.0%) | 1,268 (20.1%) |
| $150,000 or more | 215 (10.4%) | 1,566 (24.8%) |
| Total | 2,063 (100.0%) | 6,304 (100.0%) |
Property Value to Household Income Ratio in Redmond
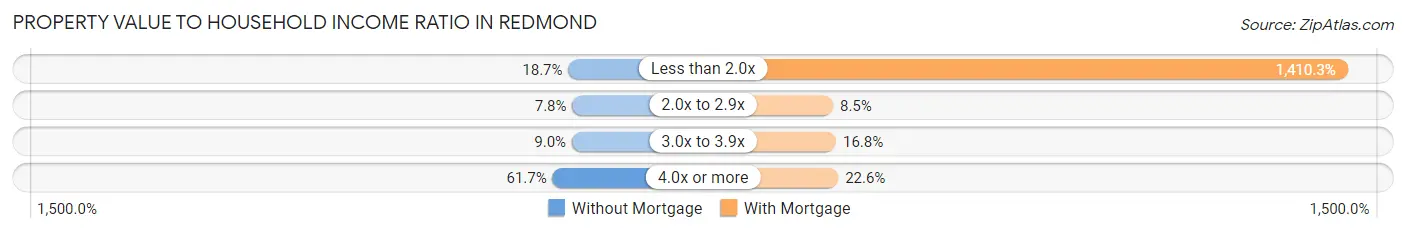
| Value-to-Income Ratio | Without Mortgage | With Mortgage |
| Less than 2.0x | 386 (18.7%) | 88,908 (1,410.3%) |
| 2.0x to 2.9x | 160 (7.8%) | 535 (8.5%) |
| 3.0x to 3.9x | 185 (9.0%) | 1,059 (16.8%) |
| 4.0x or more | 1,273 (61.7%) | 1,425 (22.6%) |
| Total | 2,063 (100.0%) | 6,304 (100.0%) |
Real Estate Taxes by Mortgage Status in Redmond
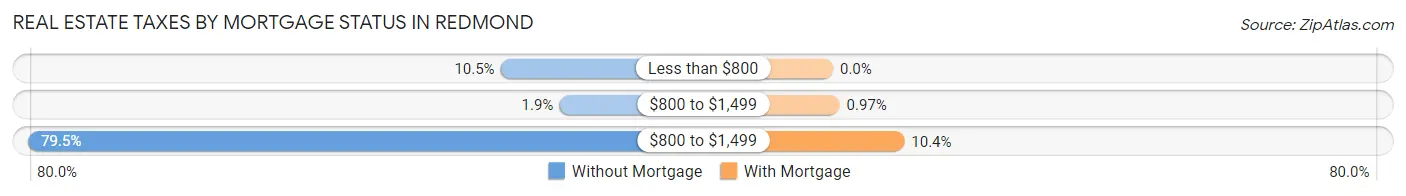
| Property Taxes | Without Mortgage | With Mortgage |
| Less than $800 | 216 (10.5%) | 0 (0.0%) |
| $800 to $1,499 | 39 (1.9%) | 61 (1.0%) |
| $800 to $1,499 | 1,640 (79.5%) | 657 (10.4%) |
| Total | 2,063 (100.0%) | 6,304 (100.0%) |
Health & Disability in Redmond
Health Insurance Coverage by Age in Redmond
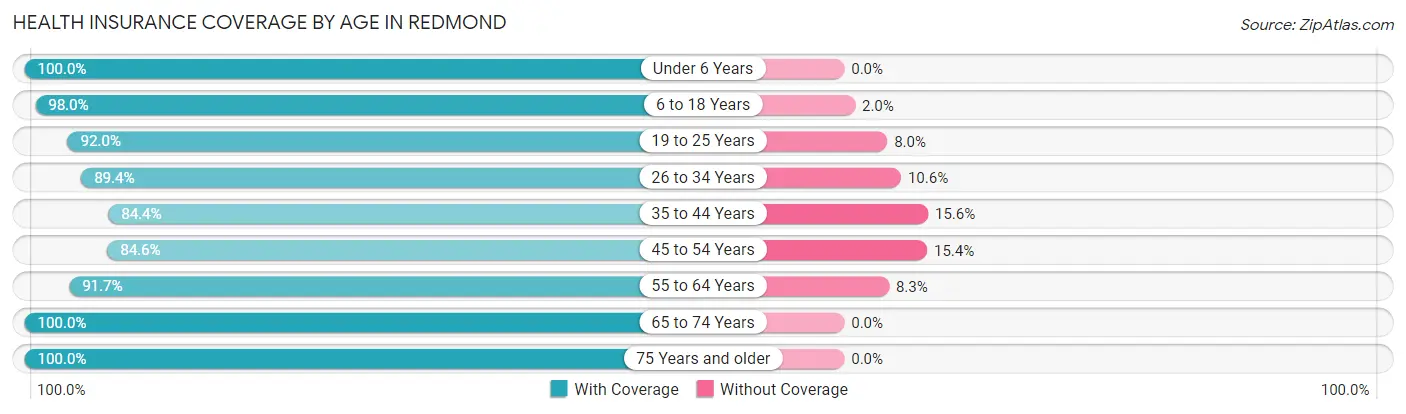
| Age Bracket | With Coverage | Without Coverage |
| Under 6 Years | 2,500 (100.0%) | 0 (0.0%) |
| 6 to 18 Years | 5,633 (98.0%) | 115 (2.0%) |
| 19 to 25 Years | 2,585 (92.0%) | 225 (8.0%) |
| 26 to 34 Years | 4,127 (89.4%) | 488 (10.6%) |
| 35 to 44 Years | 4,477 (84.4%) | 829 (15.6%) |
| 45 to 54 Years | 3,273 (84.6%) | 597 (15.4%) |
| 55 to 64 Years | 3,412 (91.7%) | 310 (8.3%) |
| 65 to 74 Years | 3,122 (100.0%) | 0 (0.0%) |
| 75 Years and older | 2,440 (100.0%) | 0 (0.0%) |
| Total | 31,569 (92.5%) | 2,564 (7.5%) |
Health Insurance Coverage by Citizenship Status in Redmond
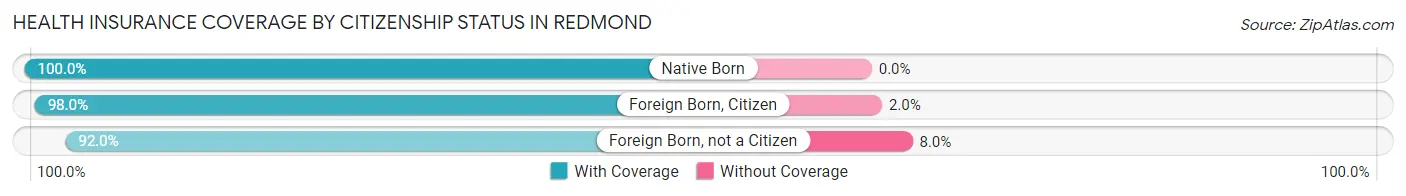
| Citizenship Status | With Coverage | Without Coverage |
| Native Born | 2,500 (100.0%) | 0 (0.0%) |
| Foreign Born, Citizen | 5,633 (98.0%) | 115 (2.0%) |
| Foreign Born, not a Citizen | 2,585 (92.0%) | 225 (8.0%) |
Health Insurance Coverage by Household Income in Redmond
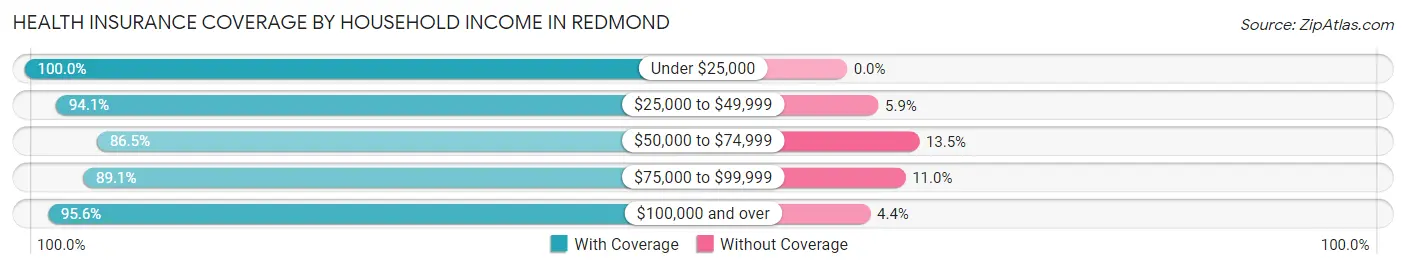
| Household Income | With Coverage | Without Coverage |
| Under $25,000 | 2,464 (100.0%) | 0 (0.0%) |
| $25,000 to $49,999 | 4,951 (94.1%) | 309 (5.9%) |
| $50,000 to $74,999 | 5,899 (86.5%) | 922 (13.5%) |
| $75,000 to $99,999 | 6,554 (89.0%) | 806 (11.0%) |
| $100,000 and over | 11,509 (95.6%) | 526 (4.4%) |
Public vs Private Health Insurance Coverage by Age in Redmond
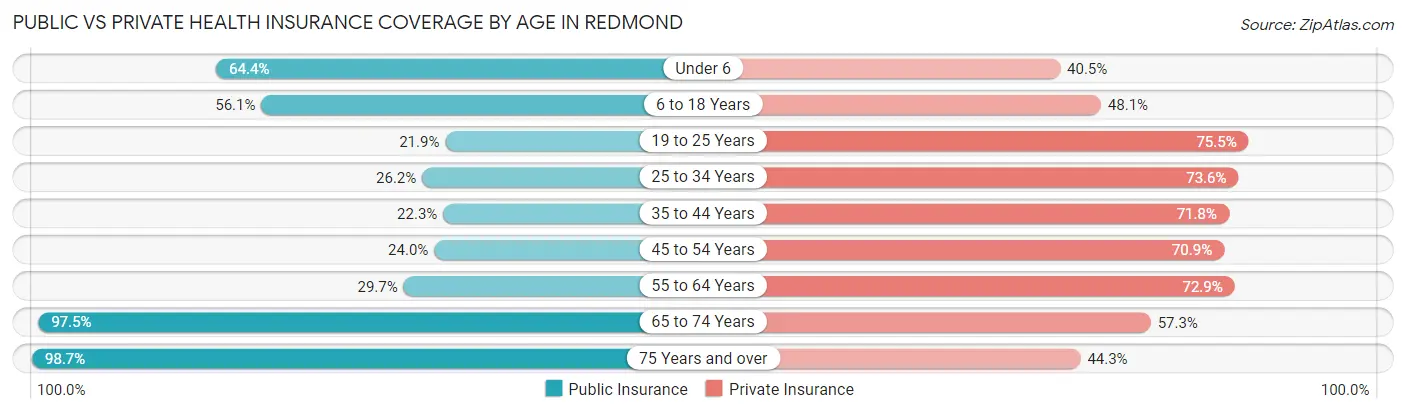
| Age Bracket | Public Insurance | Private Insurance |
| Under 6 | 1,611 (64.4%) | 1,013 (40.5%) |
| 6 to 18 Years | 3,223 (56.1%) | 2,765 (48.1%) |
| 19 to 25 Years | 616 (21.9%) | 2,121 (75.5%) |
| 25 to 34 Years | 1,210 (26.2%) | 3,396 (73.6%) |
| 35 to 44 Years | 1,184 (22.3%) | 3,810 (71.8%) |
| 45 to 54 Years | 928 (24.0%) | 2,745 (70.9%) |
| 55 to 64 Years | 1,104 (29.7%) | 2,713 (72.9%) |
| 65 to 74 Years | 3,043 (97.5%) | 1,790 (57.3%) |
| 75 Years and over | 2,407 (98.7%) | 1,081 (44.3%) |
| Total | 15,326 (44.9%) | 21,434 (62.8%) |
Disability Status by Sex by Age in Redmond
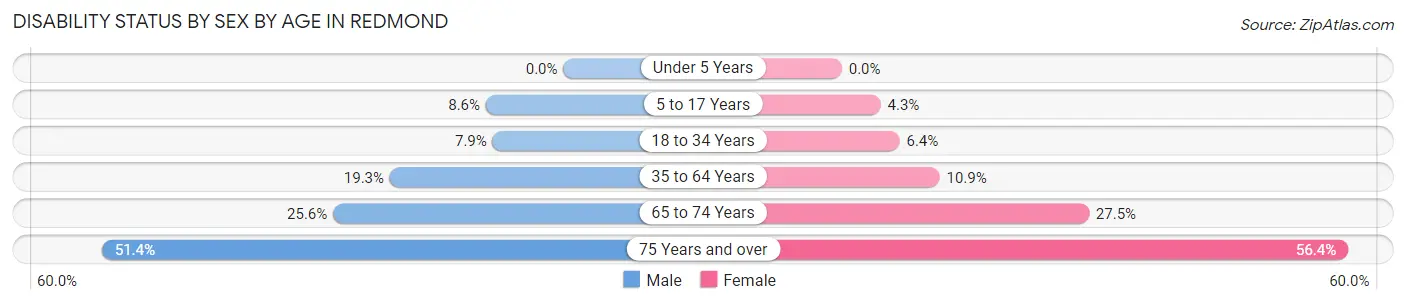
| Age Bracket | Male | Female |
| Under 5 Years | 0 (0.0%) | 0 (0.0%) |
| 5 to 17 Years | 227 (8.6%) | 136 (4.3%) |
| 18 to 34 Years | 289 (7.9%) | 270 (6.4%) |
| 35 to 64 Years | 1,174 (19.3%) | 743 (10.9%) |
| 65 to 74 Years | 383 (25.6%) | 448 (27.5%) |
| 75 Years and over | 441 (51.4%) | 892 (56.4%) |
Disability Class by Sex by Age in Redmond
Disability Class: Hearing Difficulty
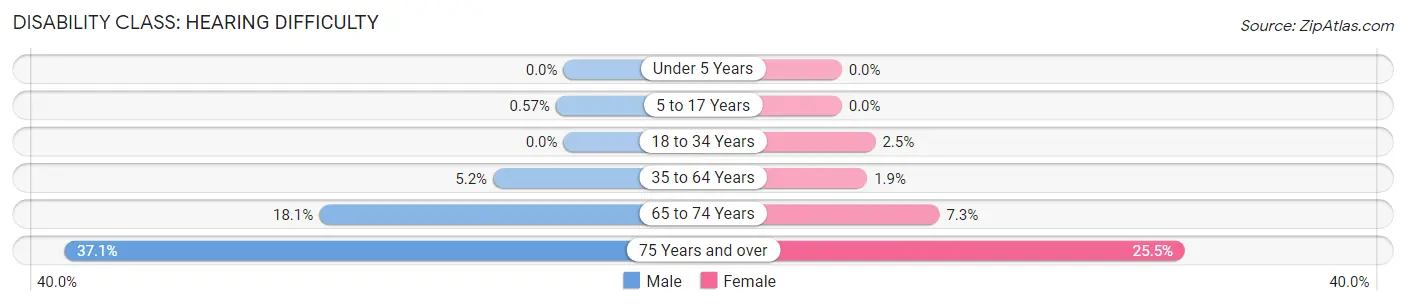
| Age Bracket | Male | Female |
| Under 5 Years | 0 (0.0%) | 0 (0.0%) |
| 5 to 17 Years | 15 (0.6%) | 0 (0.0%) |
| 18 to 34 Years | 0 (0.0%) | 105 (2.5%) |
| 35 to 64 Years | 318 (5.2%) | 129 (1.9%) |
| 65 to 74 Years | 271 (18.1%) | 118 (7.2%) |
| 75 Years and over | 318 (37.1%) | 403 (25.5%) |
Disability Class: Vision Difficulty
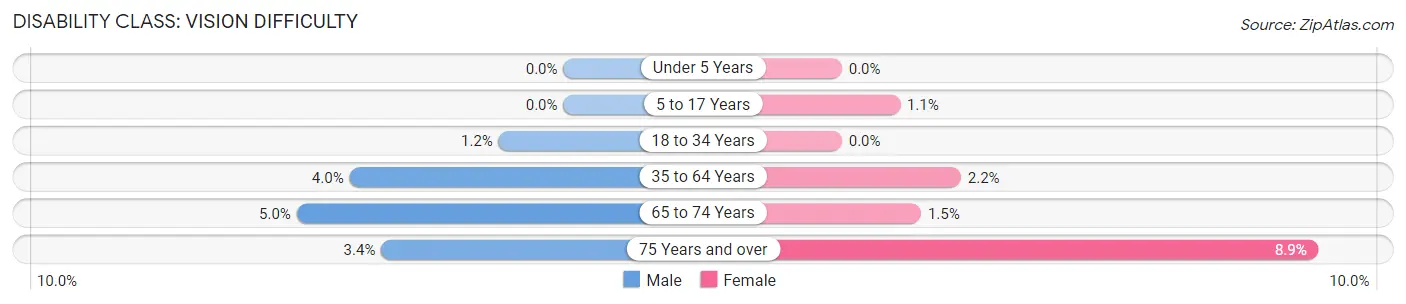
| Age Bracket | Male | Female |
| Under 5 Years | 0 (0.0%) | 0 (0.0%) |
| 5 to 17 Years | 0 (0.0%) | 34 (1.1%) |
| 18 to 34 Years | 44 (1.2%) | 0 (0.0%) |
| 35 to 64 Years | 241 (4.0%) | 151 (2.2%) |
| 65 to 74 Years | 74 (5.0%) | 24 (1.5%) |
| 75 Years and over | 29 (3.4%) | 140 (8.8%) |
Disability Class: Cognitive Difficulty
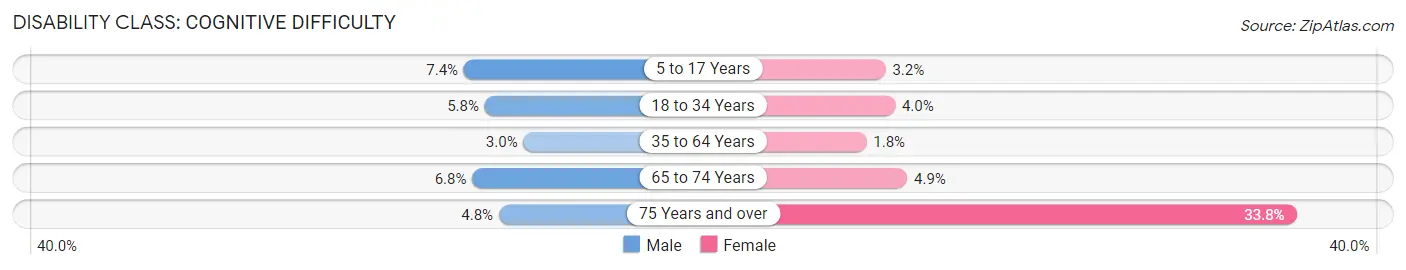
| Age Bracket | Male | Female |
| 5 to 17 Years | 194 (7.4%) | 102 (3.2%) |
| 18 to 34 Years | 214 (5.8%) | 166 (4.0%) |
| 35 to 64 Years | 180 (3.0%) | 124 (1.8%) |
| 65 to 74 Years | 101 (6.8%) | 79 (4.9%) |
| 75 Years and over | 41 (4.8%) | 534 (33.8%) |
Disability Class: Ambulatory Difficulty
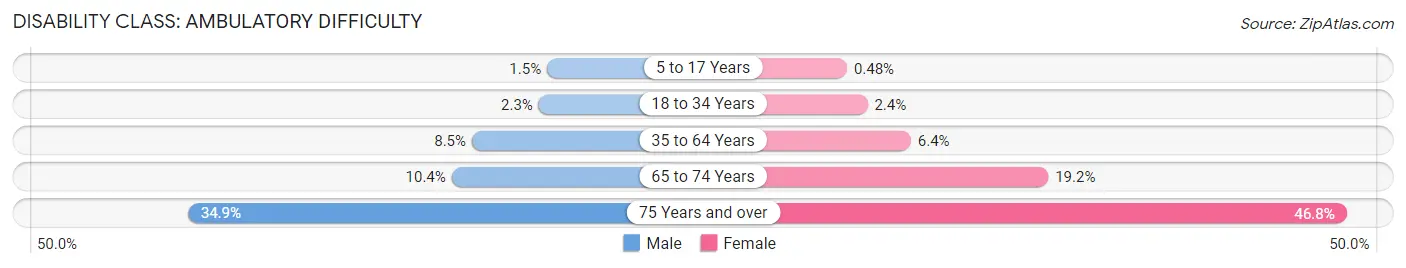
| Age Bracket | Male | Female |
| 5 to 17 Years | 40 (1.5%) | 15 (0.5%) |
| 18 to 34 Years | 84 (2.3%) | 100 (2.4%) |
| 35 to 64 Years | 516 (8.5%) | 437 (6.4%) |
| 65 to 74 Years | 155 (10.4%) | 312 (19.2%) |
| 75 Years and over | 299 (34.8%) | 741 (46.8%) |
Disability Class: Self-Care Difficulty
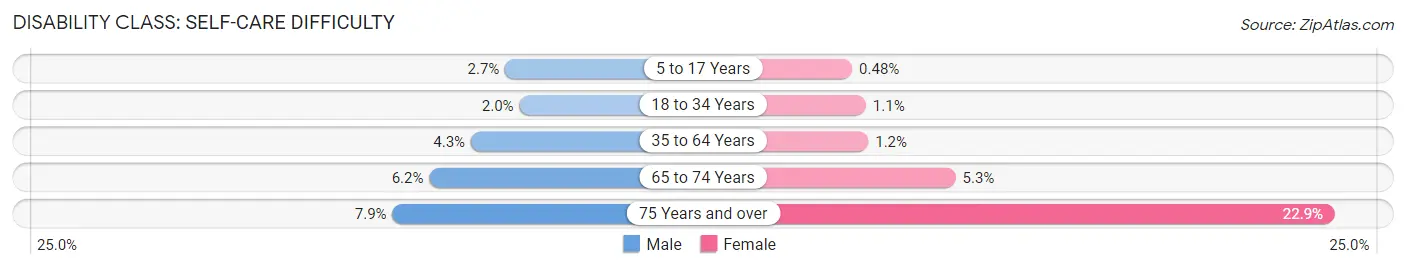
| Age Bracket | Male | Female |
| 5 to 17 Years | 71 (2.7%) | 15 (0.5%) |
| 18 to 34 Years | 75 (2.0%) | 47 (1.1%) |
| 35 to 64 Years | 261 (4.3%) | 84 (1.2%) |
| 65 to 74 Years | 93 (6.2%) | 86 (5.3%) |
| 75 Years and over | 68 (7.9%) | 362 (22.9%) |
Technology Access in Redmond
Computing Device Access in Redmond
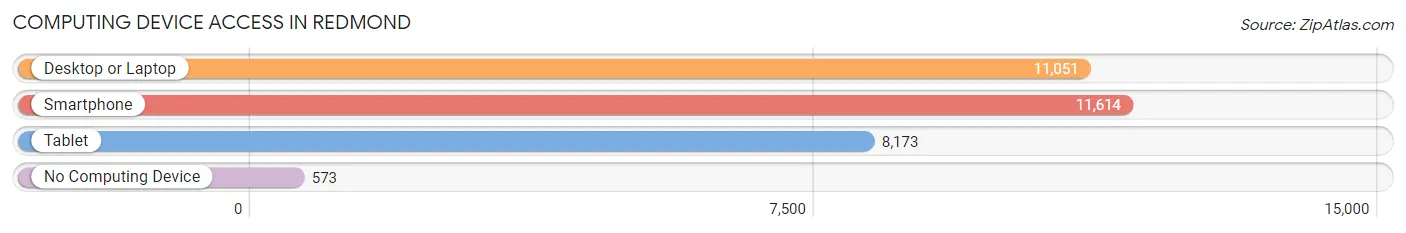
| Device Type | # Households | % Households |
| Desktop or Laptop | 11,051 | 84.8% |
| Smartphone | 11,614 | 89.2% |
| Tablet | 8,173 | 62.7% |
| No Computing Device | 573 | 4.4% |
| Total | 13,025 | 100.0% |
Internet Access in Redmond
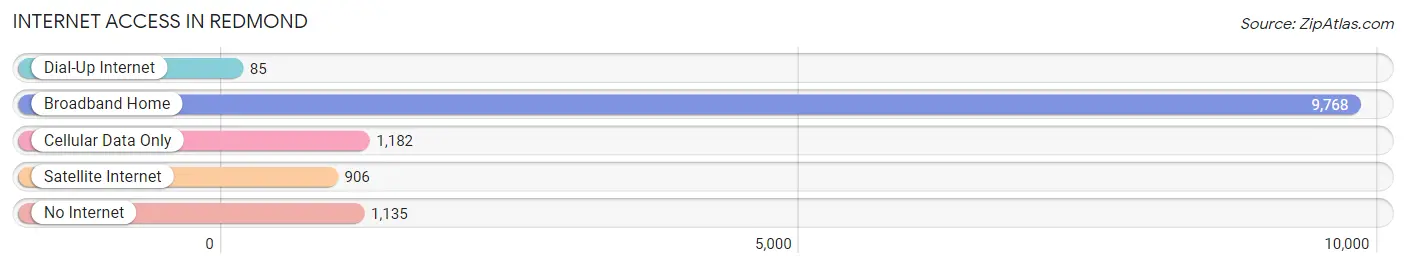
| Internet Type | # Households | % Households |
| Dial-Up Internet | 85 | 0.6% |
| Broadband Home | 9,768 | 75.0% |
| Cellular Data Only | 1,182 | 9.1% |
| Satellite Internet | 906 | 7.0% |
| No Internet | 1,135 | 8.7% |
| Total | 13,025 | 100.0% |
Redmond Summary
Redmond, Oregon is a city located in Deschutes County in the Central Oregon region of the state. It is the county seat and the largest city in the county. Redmond is located in the high desert of Central Oregon, at an elevation of 3,077 feet (938 m). The city is situated on the eastern side of the Cascade Range, and is bordered by the Deschutes River to the north and the Crooked River to the south. Redmond is located approximately 15 miles (24 km) north of Bend, Oregon, and is part of the Bend-Redmond metropolitan area.
History
The area that is now Redmond was originally inhabited by the Northern Paiute people. The first non-native settlers arrived in the area in the late 1800s, and the city was officially incorporated in 1910. The city was named after Frank T. Redmond, who was a prominent local businessman and the first postmaster of the city.
In the early 1900s, Redmond was a small agricultural community, with the main crops being wheat, potatoes, and hay. The city was also home to a number of small businesses, including a flour mill, a creamery, and a cannery.
In the 1950s, Redmond began to experience rapid growth due to the construction of the nearby Madras Airport. The airport was built to serve the nearby military base, and it brought a large number of new residents to the area. The city also experienced a boom in the construction of new homes and businesses.
Geography
Redmond is located in the high desert of Central Oregon, at an elevation of 3,077 feet (938 m). The city is situated on the eastern side of the Cascade Range, and is bordered by the Deschutes River to the north and the Crooked River to the south. Redmond is located approximately 15 miles (24 km) north of Bend, Oregon, and is part of the Bend-Redmond metropolitan area.
The city has a total area of 10.3 square miles (26.7 km2), of which 10.2 square miles (26.4 km2) is land and 0.1 square miles (0.3 km2) is water. Redmond has a semi-arid climate, with hot summers and cold winters. The average annual precipitation is 8.5 inches (216 mm).
Economy
Redmond’s economy is largely based on the service sector, with the largest employers being the Redmond School District, St. Charles Medical Center, and the Redmond Airport. The city is also home to a number of technology companies, including Microsoft, Google, and Amazon.
The city is also home to a number of manufacturing companies, including Cascade Designs, which produces outdoor gear, and Cascade Windows, which manufactures windows and doors. Redmond is also home to a number of agricultural businesses, including farms, ranches, and wineries.
Demographics
As of the 2010 census, Redmond had a population of 26,215. The racial makeup of the city was 87.3% White, 1.2% African American, 1.2% Native American, 2.2% Asian, 0.2% Pacific Islander, 5.2% from other races, and 3.0% from two or more races. Hispanic or Latino of any race were 11.2% of the population.
The median income for a household in the city was $45,837, and the median income for a family was $51,919. The per capita income for the city was $22,945. About 11.2% of families and 14.3% of the population were below the poverty line, including 19.2% of those under age 18 and 8.2% of those age 65 or over.
Common Questions
What is Per Capita Income in Redmond?
Per Capita income in Redmond is $32,613.
What is the Median Family Income in Redmond?
Median Family Income in Redmond is $82,526.
What is the Median Household income in Redmond?
Median Household Income in Redmond is $72,798.
What is Income or Wage Gap in Redmond?
Income or Wage Gap in Redmond is 17.9%.
Women in Redmond earn 82.1 cents for every dollar earned by a man.
What is Inequality or Gini Index in Redmond?
Inequality or Gini Index in Redmond is 0.37.
What is the Total Population of Redmond?
Total Population of Redmond is 34,191.
What is the Total Male Population of Redmond?
Total Male Population of Redmond is 16,035.
What is the Total Female Population of Redmond?
Total Female Population of Redmond is 18,156.
What is the Ratio of Males per 100 Females in Redmond?
There are 88.32 Males per 100 Females in Redmond.
What is the Ratio of Females per 100 Males in Redmond?
There are 113.23 Females per 100 Males in Redmond.
What is the Median Population Age in Redmond?
Median Population Age in Redmond is 36.4 Years.
What is the Average Family Size in Redmond
Average Family Size in Redmond is 3.1 People.
What is the Average Household Size in Redmond
Average Household Size in Redmond is 2.6 People.
How Large is the Labor Force in Redmond?
There are 17,884 People in the Labor Forcein in Redmond.
What is the Percentage of People in the Labor Force in Redmond?
66.7% of People are in the Labor Force in Redmond.
What is the Unemployment Rate in Redmond?
Unemployment Rate in Redmond is 7.2%.