Cities with the Highest Child Poverty Level Among Girls Under the Age of 16 in Oregon
RELATED REPORTS & OPTIONS
Highest Poverty | Girls 0-16
Oregon
Compare Cities
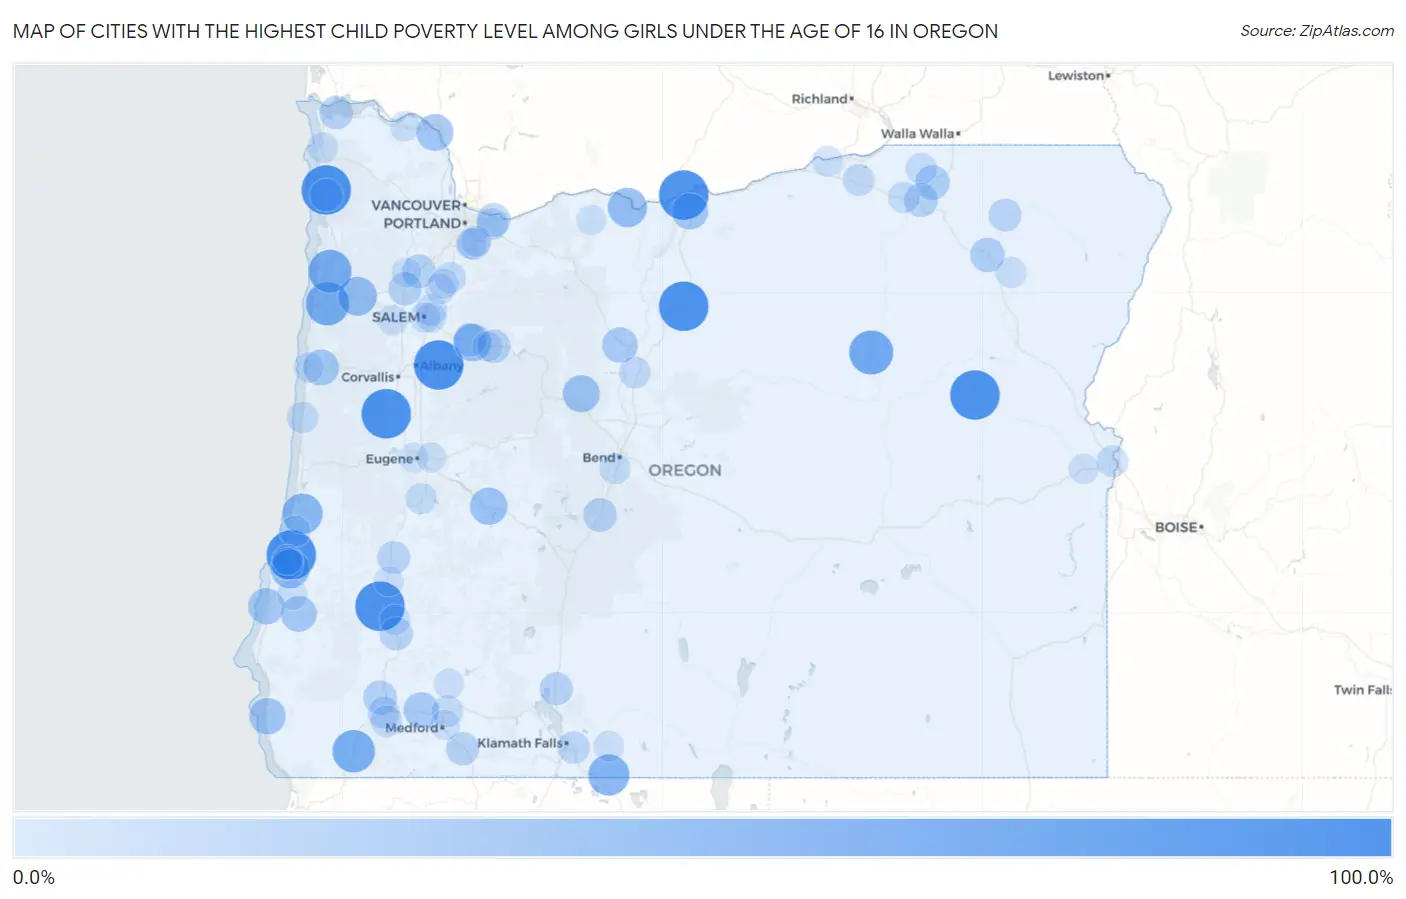
Map of Cities with the Highest Child Poverty Level Among Girls Under the Age of 16 in Oregon
0.0%
100.0%
Cities with the Highest Child Poverty Level Among Girls Under the Age of 16 in Oregon
| City | Child Poverty (Girls) | vs State | vs National | |
| 1. | Glasgow | 100.0% | 13.1%(+86.9)#1 | 17.0%(+83.0)#73 |
| 2. | San Marine | 100.0% | 13.1%(+86.9)#2 | 17.0%(+83.0)#164 |
| 3. | Crabtree | 100.0% | 13.1%(+86.9)#3 | 17.0%(+83.0)#174 |
| 4. | Dillard | 100.0% | 13.1%(+86.9)#4 | 17.0%(+83.0)#244 |
| 5. | Nehalem | 100.0% | 13.1%(+86.9)#5 | 17.0%(+83.0)#284 |
| 6. | Alpine | 100.0% | 13.1%(+86.9)#6 | 17.0%(+83.0)#303 |
| 7. | Rufus | 100.0% | 13.1%(+86.9)#7 | 17.0%(+83.0)#327 |
| 8. | Beaver Marsh | 100.0% | 13.1%(+86.9)#8 | 17.0%(+83.0)#491 |
| 9. | Unity | 100.0% | 13.1%(+86.9)#9 | 17.0%(+83.0)#654 |
| 10. | Shaniko | 100.0% | 13.1%(+86.9)#10 | 17.0%(+83.0)#678 |
| 11. | Long Creek | 76.2% | 13.1%(+63.1)#11 | 17.0%(+59.2)#1,163 |
| 12. | Rose Lodge | 73.1% | 13.1%(+60.0)#12 | 17.0%(+56.1)#1,298 |
| 13. | Hebo | 71.6% | 13.1%(+58.5)#13 | 17.0%(+54.6)#1,377 |
| 14. | Cave Junction | 69.6% | 13.1%(+56.5)#14 | 17.0%(+52.6)#1,482 |
| 15. | Malin | 63.9% | 13.1%(+50.8)#15 | 17.0%(+47.0)#1,821 |
| 16. | Reedsport | 60.7% | 13.1%(+47.6)#16 | 17.0%(+43.7)#2,028 |
| 17. | Svensen | 56.4% | 13.1%(+43.3)#17 | 17.0%(+39.4)#2,386 |
| 18. | Chenoweth | 55.6% | 13.1%(+42.4)#18 | 17.0%(+38.6)#2,460 |
| 19. | Bunker Hill | 54.9% | 13.1%(+41.8)#19 | 17.0%(+37.9)#2,529 |
| 20. | Grand Ronde | 54.3% | 13.1%(+41.1)#20 | 17.0%(+37.3)#2,588 |
| 21. | Mapleton | 51.0% | 13.1%(+37.8)#21 | 17.0%(+34.0)#2,923 |
| 22. | Lyons | 49.5% | 13.1%(+36.3)#22 | 17.0%(+32.5)#3,158 |
| 23. | Oakridge | 47.7% | 13.1%(+34.6)#23 | 17.0%(+30.7)#3,327 |
| 24. | Camp Sherman | 46.7% | 13.1%(+33.5)#24 | 17.0%(+29.7)#3,471 |
| 25. | Rainier | 45.7% | 13.1%(+32.6)#25 | 17.0%(+28.7)#3,602 |
| 26. | Gold Beach | 43.8% | 13.1%(+30.7)#26 | 17.0%(+26.9)#3,849 |
| 27. | Wasco | 43.6% | 13.1%(+30.5)#27 | 17.0%(+26.6)#3,888 |
| 28. | Bandon | 43.5% | 13.1%(+30.3)#28 | 17.0%(+26.5)#3,903 |
| 29. | Toledo | 42.3% | 13.1%(+29.1)#29 | 17.0%(+25.3)#4,093 |
| 30. | Myrtle Point | 41.8% | 13.1%(+28.7)#30 | 17.0%(+24.9)#4,151 |
| 31. | Warm Springs | 40.2% | 13.1%(+27.0)#31 | 17.0%(+23.2)#4,423 |
| 32. | Heceta Beach | 40.0% | 13.1%(+26.9)#32 | 17.0%(+23.0)#4,438 |
| 33. | Gold Hill | 39.6% | 13.1%(+26.4)#33 | 17.0%(+22.6)#4,549 |
| 34. | La Grande | 36.2% | 13.1%(+23.1)#34 | 17.0%(+19.2)#5,211 |
| 35. | Dexter | 36.0% | 13.1%(+22.9)#35 | 17.0%(+19.0)#5,250 |
| 36. | Adams | 35.7% | 13.1%(+22.6)#36 | 17.0%(+18.7)#5,304 |
| 37. | Mission | 33.3% | 13.1%(+20.2)#37 | 17.0%(+16.4)#5,805 |
| 38. | Dayton | 32.9% | 13.1%(+19.8)#38 | 17.0%(+16.0)#5,993 |
| 39. | Merlin | 32.6% | 13.1%(+19.5)#39 | 17.0%(+15.6)#6,062 |
| 40. | Wood Village | 32.6% | 13.1%(+19.4)#40 | 17.0%(+15.6)#6,066 |
| 41. | Astoria | 32.4% | 13.1%(+19.2)#41 | 17.0%(+15.4)#6,111 |
| 42. | La Pine | 32.2% | 13.1%(+19.0)#42 | 17.0%(+15.2)#6,167 |
| 43. | Mehama | 31.8% | 13.1%(+18.7)#43 | 17.0%(+14.8)#6,245 |
| 44. | Gates | 31.8% | 13.1%(+18.7)#44 | 17.0%(+14.8)#6,247 |
| 45. | Amity | 31.4% | 13.1%(+18.3)#45 | 17.0%(+14.4)#6,333 |
| 46. | Canyonville | 31.0% | 13.1%(+17.9)#46 | 17.0%(+14.0)#6,434 |
| 47. | Ashland | 30.5% | 13.1%(+17.3)#47 | 17.0%(+13.5)#6,569 |
| 48. | Chiloquin | 30.2% | 13.1%(+17.1)#48 | 17.0%(+13.3)#6,625 |
| 49. | River Point | 30.0% | 13.1%(+16.9)#49 | 17.0%(+13.0)#6,702 |
| 50. | Oakland | 29.8% | 13.1%(+16.7)#50 | 17.0%(+12.8)#6,739 |
| 51. | Wheeler | 29.4% | 13.1%(+16.3)#51 | 17.0%(+12.4)#6,841 |
| 52. | Elgin | 28.9% | 13.1%(+15.8)#52 | 17.0%(+12.0)#6,956 |
| 53. | Gladstone | 28.2% | 13.1%(+15.0)#53 | 17.0%(+11.2)#7,150 |
| 54. | Altamont | 27.7% | 13.1%(+14.6)#54 | 17.0%(+10.7)#7,289 |
| 55. | Redwood | 25.9% | 13.1%(+12.8)#55 | 17.0%(+8.95)#7,810 |
| 56. | Coos Bay | 25.4% | 13.1%(+12.2)#56 | 17.0%(+8.41)#7,990 |
| 57. | Stanfield | 25.0% | 13.1%(+11.9)#57 | 17.0%(+8.02)#8,069 |
| 58. | Metolius | 25.0% | 13.1%(+11.9)#58 | 17.0%(+8.02)#8,086 |
| 59. | Keno | 24.7% | 13.1%(+11.5)#59 | 17.0%(+7.70)#8,251 |
| 60. | Hayesville | 24.6% | 13.1%(+11.5)#60 | 17.0%(+7.66)#8,266 |
| 61. | New Hope | 24.6% | 13.1%(+11.4)#61 | 17.0%(+7.57)#8,285 |
| 62. | Ontario | 24.5% | 13.1%(+11.4)#62 | 17.0%(+7.56)#8,292 |
| 63. | Marlene | 24.0% | 13.1%(+10.9)#63 | 17.0%(+7.02)#8,430 |
| 64. | Gresham | 23.9% | 13.1%(+10.8)#64 | 17.0%(+6.92)#8,473 |
| 65. | Helix | 23.8% | 13.1%(+10.7)#65 | 17.0%(+6.83)#8,503 |
| 66. | Hubbard | 23.5% | 13.1%(+10.4)#66 | 17.0%(+6.55)#8,573 |
| 67. | Yachats | 23.5% | 13.1%(+10.4)#67 | 17.0%(+6.55)#8,582 |
| 68. | Pendleton | 23.5% | 13.1%(+10.3)#68 | 17.0%(+6.51)#8,612 |
| 69. | White City | 23.4% | 13.1%(+10.3)#69 | 17.0%(+6.47)#8,624 |
| 70. | Deschutes River Woods | 22.4% | 13.1%(+9.25)#70 | 17.0%(+5.42)#8,985 |
| 71. | Lakeside | 22.2% | 13.1%(+9.08)#71 | 17.0%(+5.25)#9,022 |
| 72. | Cottage Grove | 21.7% | 13.1%(+8.58)#72 | 17.0%(+4.74)#9,222 |
| 73. | Irrigon | 21.7% | 13.1%(+8.53)#73 | 17.0%(+4.70)#9,234 |
| 74. | Jennings Lodge | 21.7% | 13.1%(+8.51)#74 | 17.0%(+4.68)#9,244 |
| 75. | Union | 21.6% | 13.1%(+8.45)#75 | 17.0%(+4.61)#9,260 |
| 76. | Johnson City | 21.4% | 13.1%(+8.29)#76 | 17.0%(+4.45)#9,332 |
| 77. | Prineville Lake Acres | 21.3% | 13.1%(+8.16)#77 | 17.0%(+4.32)#9,387 |
| 78. | Seaside | 21.1% | 13.1%(+7.98)#78 | 17.0%(+4.15)#9,450 |
| 79. | Myrtle Creek | 20.8% | 13.1%(+7.68)#79 | 17.0%(+3.84)#9,563 |
| 80. | Dallas | 20.5% | 13.1%(+7.34)#80 | 17.0%(+3.51)#9,677 |
| 81. | Bonanza | 20.0% | 13.1%(+6.86)#81 | 17.0%(+3.02)#9,838 |
| 82. | River Road | 19.8% | 13.1%(+6.70)#82 | 17.0%(+2.86)#9,937 |
| 83. | Vale | 19.7% | 13.1%(+6.57)#83 | 17.0%(+2.73)#9,985 |
| 84. | Salem | 19.7% | 13.1%(+6.53)#84 | 17.0%(+2.69)#9,998 |
| 85. | Four Corners | 19.5% | 13.1%(+6.39)#85 | 17.0%(+2.55)#10,046 |
| 86. | Shady Cove | 19.5% | 13.1%(+6.34)#86 | 17.0%(+2.50)#10,068 |
| 87. | Mill City | 19.4% | 13.1%(+6.26)#87 | 17.0%(+2.42)#10,089 |
| 88. | Newport | 19.3% | 13.1%(+6.21)#88 | 17.0%(+2.37)#10,103 |
| 89. | Gervais | 19.3% | 13.1%(+6.19)#89 | 17.0%(+2.35)#10,107 |
| 90. | Clatskanie | 19.3% | 13.1%(+6.15)#90 | 17.0%(+2.31)#10,125 |
| 91. | Woodburn | 19.3% | 13.1%(+6.12)#91 | 17.0%(+2.29)#10,138 |
| 92. | Mount Hood | 19.2% | 13.1%(+6.07)#92 | 17.0%(+2.23)#10,169 |
| 93. | Coquille | 18.8% | 13.1%(+5.71)#93 | 17.0%(+1.87)#10,297 |
| 94. | Santa Clara | 18.7% | 13.1%(+5.53)#94 | 17.0%(+1.69)#10,352 |
| 95. | Roseburg North | 18.6% | 13.1%(+5.45)#95 | 17.0%(+1.62)#10,376 |
| 96. | Medford | 18.6% | 13.1%(+5.45)#96 | 17.0%(+1.61)#10,378 |
| 97. | North Bend | 18.5% | 13.1%(+5.37)#97 | 17.0%(+1.54)#10,427 |
| 98. | Mcminnville | 18.5% | 13.1%(+5.34)#98 | 17.0%(+1.50)#10,439 |
| 99. | Eugene | 18.4% | 13.1%(+5.23)#99 | 17.0%(+1.40)#10,480 |
| 100. | Springfield | 18.3% | 13.1%(+5.16)#100 | 17.0%(+1.32)#10,509 |
Common Questions
What are the Top 10 Cities with the Highest Child Poverty Level Among Girls Under the Age of 16 in Oregon?
Top 10 Cities with the Highest Child Poverty Level Among Girls Under the Age of 16 in Oregon are:
#1
100.0%
#2
100.0%
#3
100.0%
#4
100.0%
#5
100.0%
#6
100.0%
#7
100.0%
#8
100.0%
#9
76.2%
#10
73.1%
What city has the Highest Child Poverty Level Among Girls Under the Age of 16 in Oregon?
Glasgow has the Highest Child Poverty Level Among Girls Under the Age of 16 in Oregon with 100.0%.
What is the Poverty Level Among Girls Under the Age of 16 in the State of Oregon?
Poverty Level Among Girls Under the Age of 16 in Oregon is 13.1%.
What is the Poverty Level Among Girls Under the Age of 16 in the United States?
Poverty Level Among Girls Under the Age of 16 in the United States is 17.0%.