Baker City, OR Map & Demographics
Baker City Map
Baker City Overview
$31,677
PER CAPITA INCOME
$65,911
AVG FAMILY INCOME
$54,063
AVG HOUSEHOLD INCOME
45.6%
WAGE / INCOME GAP [ % ]
54.4¢/ $1
WAGE / INCOME GAP [ $ ]
$9,378
FAMILY INCOME DEFICIT
0.45
INEQUALITY / GINI INDEX
10,110
TOTAL POPULATION
5,275
MALE POPULATION
4,835
FEMALE POPULATION
109.10
MALES / 100 FEMALES
91.66
FEMALES / 100 MALES
44.0
MEDIAN AGE
3.0
AVG FAMILY SIZE
2.3
AVG HOUSEHOLD SIZE
4,277
LABOR FORCE [ PEOPLE ]
51.7%
PERCENT IN LABOR FORCE
5.8%
UNEMPLOYMENT RATE
Baker City Zip Codes
Baker City Area Codes
Income in Baker City
Income Overview in Baker City
Per Capita Income in Baker City is $31,677, while median incomes of families and households are $65,911 and $54,063 respectively.
| Characteristic | Number | Measure |
| Per Capita Income | 10,110 | $31,677 |
| Median Family Income | 2,267 | $65,911 |
| Mean Family Income | 2,267 | $89,108 |
| Median Household Income | 4,244 | $54,063 |
| Mean Household Income | 4,244 | $71,793 |
| Income Deficit | 2,267 | $9,378 |
| Wage / Income Gap (%) | 10,110 | 45.55% |
| Wage / Income Gap ($) | 10,110 | 54.45¢ per $1 |
| Gini / Inequality Index | 10,110 | 0.45 |
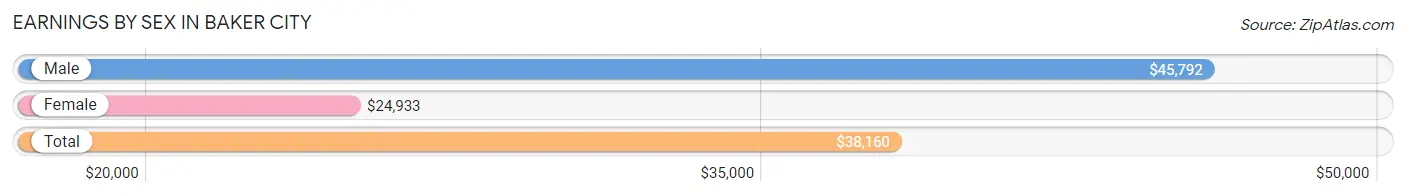
Earnings by Sex in Baker City
Average Earnings in Baker City are $38,160, $45,792 for men and $24,933 for women, a difference of 45.6%.
| Sex | Number | Average Earnings |
| Male | 2,627 (55.3%) | $45,792 |
| Female | 2,126 (44.7%) | $24,933 |
| Total | 4,753 (100.0%) | $38,160 |
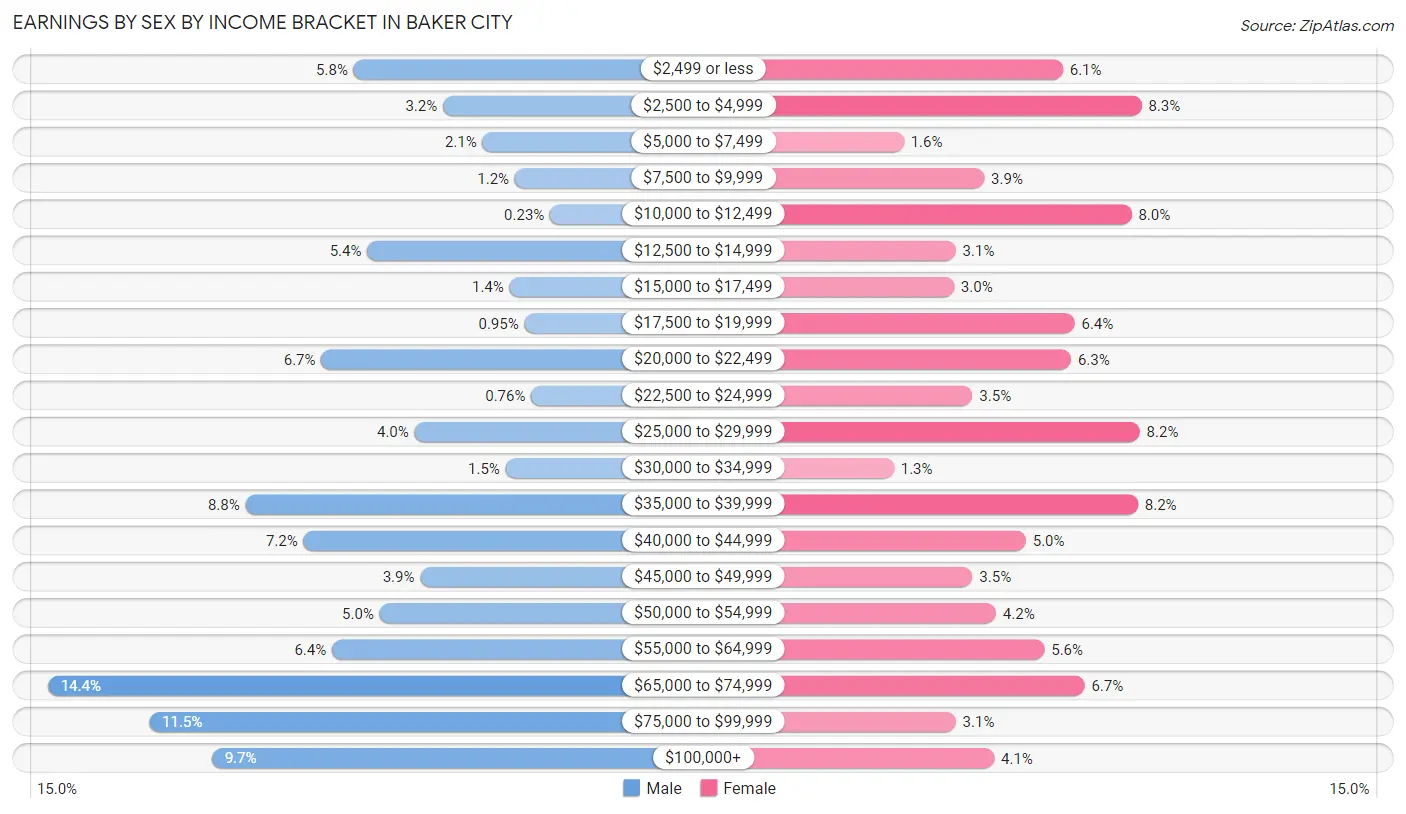
Earnings by Sex by Income Bracket in Baker City
The most common earnings brackets in Baker City are $65,000 to $74,999 for men (377 | 14.3%) and $2,500 to $4,999 for women (176 | 8.3%).
| Income | Male | Female |
| $2,499 or less | 151 (5.8%) | 129 (6.1%) |
| $2,500 to $4,999 | 85 (3.2%) | 176 (8.3%) |
| $5,000 to $7,499 | 56 (2.1%) | 34 (1.6%) |
| $7,500 to $9,999 | 32 (1.2%) | 82 (3.9%) |
| $10,000 to $12,499 | 6 (0.2%) | 170 (8.0%) |
| $12,500 to $14,999 | 141 (5.4%) | 65 (3.1%) |
| $15,000 to $17,499 | 36 (1.4%) | 64 (3.0%) |
| $17,500 to $19,999 | 25 (0.9%) | 136 (6.4%) |
| $20,000 to $22,499 | 175 (6.7%) | 134 (6.3%) |
| $22,500 to $24,999 | 20 (0.8%) | 75 (3.5%) |
| $25,000 to $29,999 | 106 (4.0%) | 175 (8.2%) |
| $30,000 to $34,999 | 39 (1.5%) | 28 (1.3%) |
| $35,000 to $39,999 | 231 (8.8%) | 174 (8.2%) |
| $40,000 to $44,999 | 188 (7.2%) | 107 (5.0%) |
| $45,000 to $49,999 | 102 (3.9%) | 75 (3.5%) |
| $50,000 to $54,999 | 132 (5.0%) | 89 (4.2%) |
| $55,000 to $64,999 | 167 (6.4%) | 118 (5.6%) |
| $65,000 to $74,999 | 377 (14.3%) | 142 (6.7%) |
| $75,000 to $99,999 | 302 (11.5%) | 65 (3.1%) |
| $100,000+ | 256 (9.7%) | 88 (4.1%) |
| Total | 2,627 (100.0%) | 2,126 (100.0%) |
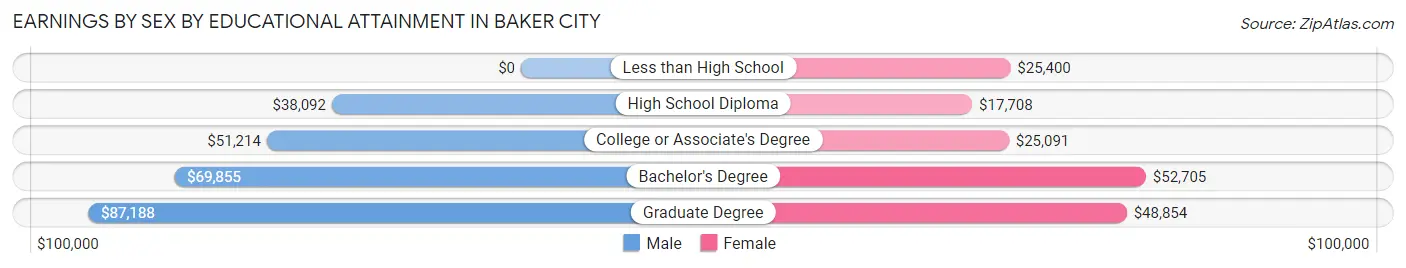
Earnings by Sex by Educational Attainment in Baker City
Average earnings in Baker City are $52,706 for men and $27,424 for women, a difference of 48.0%. Men with an educational attainment of graduate degree enjoy the highest average annual earnings of $87,188, while those with high school diploma education earn the least with $38,092. Women with an educational attainment of bachelor's degree earn the most with the average annual earnings of $52,705, while those with high school diploma education have the smallest earnings of $17,708.
| Educational Attainment | Male Income | Female Income |
| Less than High School | - | - |
| High School Diploma | $38,092 | $17,708 |
| College or Associate's Degree | $51,214 | $25,091 |
| Bachelor's Degree | $69,855 | $52,705 |
| Graduate Degree | $87,188 | $48,854 |
| Total | $52,706 | $27,424 |
Family Income in Baker City
Family Income Brackets in Baker City
According to the Baker City family income data, there are 524 families falling into the $50,000 to $74,999 income range, which is the most common income bracket and makes up 23.1% of all families. Conversely, the $15,000 to $24,999 income bracket is the least frequent group with only 50 families (2.2%) belonging to this category.
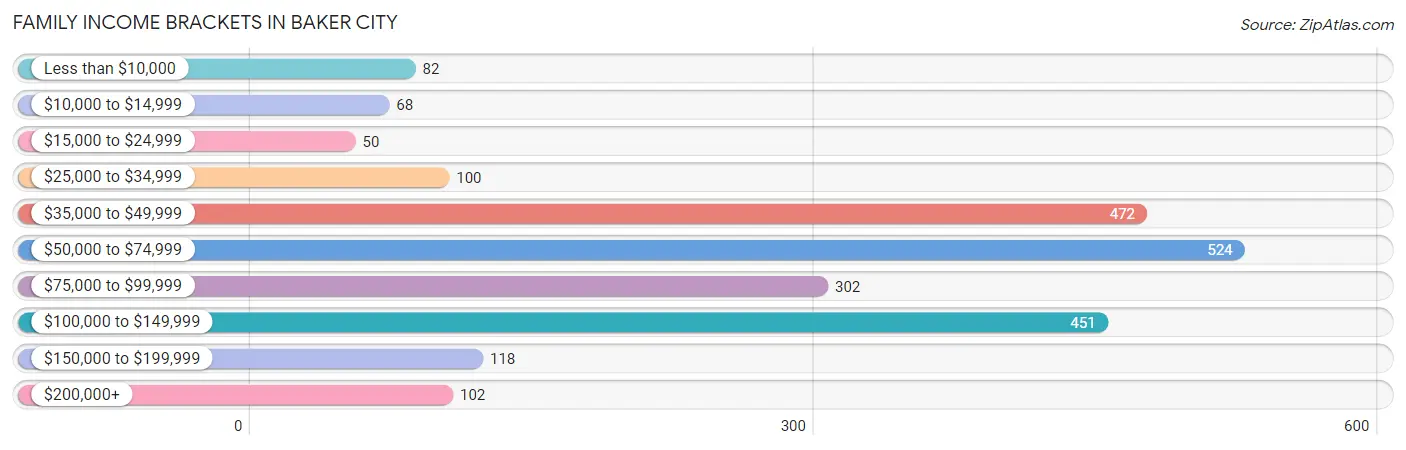
| Income Bracket | # Families | % Families |
| Less than $10,000 | 82 | 3.6% |
| $10,000 to $14,999 | 68 | 3.0% |
| $15,000 to $24,999 | 50 | 2.2% |
| $25,000 to $34,999 | 100 | 4.4% |
| $35,000 to $49,999 | 472 | 20.8% |
| $50,000 to $74,999 | 524 | 23.1% |
| $75,000 to $99,999 | 302 | 13.3% |
| $100,000 to $149,999 | 451 | 19.9% |
| $150,000 to $199,999 | 118 | 5.2% |
| $200,000+ | 102 | 4.5% |
Family Income by Famaliy Size in Baker City
6-person families (212 | 9.3%) account for the highest median family income in Baker City with $133,152 per family, while 2-person families (1,407 | 62.1%) have the highest median income of $29,162 per family member.
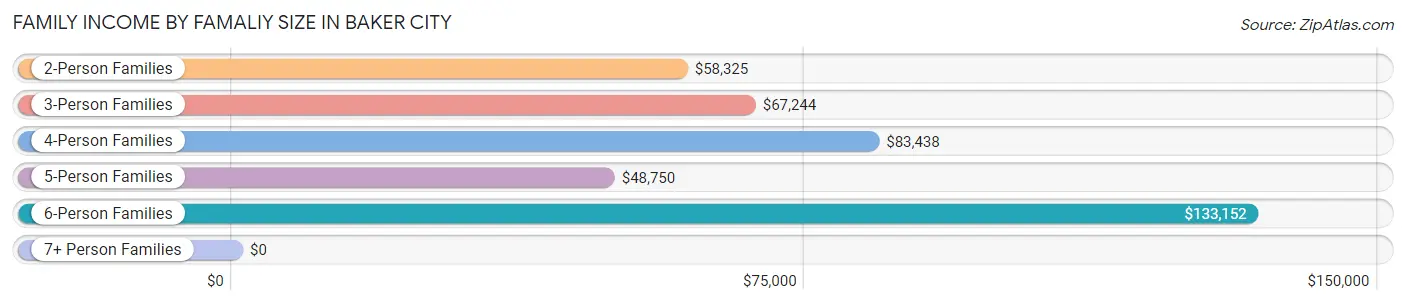
| Income Bracket | # Families | Median Income |
| 2-Person Families | 1,407 (62.1%) | $58,325 |
| 3-Person Families | 300 (13.2%) | $67,244 |
| 4-Person Families | 256 (11.3%) | $83,438 |
| 5-Person Families | 75 (3.3%) | $48,750 |
| 6-Person Families | 212 (9.3%) | $133,152 |
| 7+ Person Families | 17 (0.7%) | $0 |
| Total | 2,267 (100.0%) | $65,911 |
Family Income by Number of Earners in Baker City
The median family income in Baker City is $65,911, with families comprising 3+ earners (144) having the highest median family income of $133,676, while families with no earners (705) have the lowest median family income of $40,893, accounting for 6.4% and 31.1% of families, respectively.
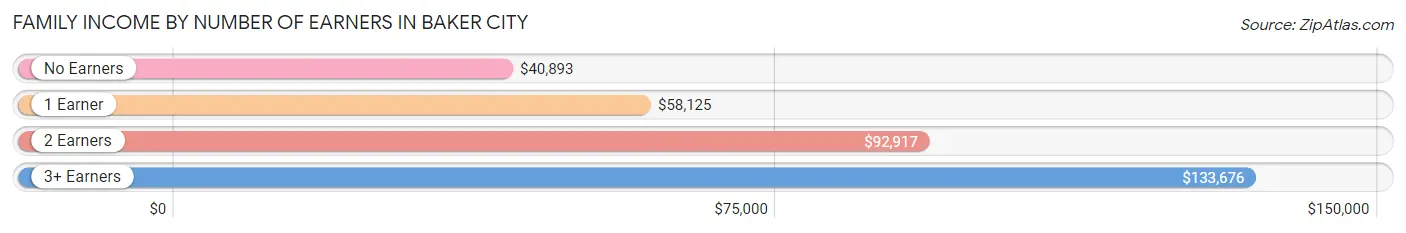
| Number of Earners | # Families | Median Income |
| No Earners | 705 (31.1%) | $40,893 |
| 1 Earner | 547 (24.1%) | $58,125 |
| 2 Earners | 871 (38.4%) | $92,917 |
| 3+ Earners | 144 (6.4%) | $133,676 |
| Total | 2,267 (100.0%) | $65,911 |
Household Income in Baker City
Household Income Brackets in Baker City
With 934 households falling in the category, the $50,000 to $74,999 income range is the most frequent in Baker City, accounting for 22.0% of all households. In contrast, only 136 households (3.2%) fall into the $200,000+ income bracket, making it the least populous group.
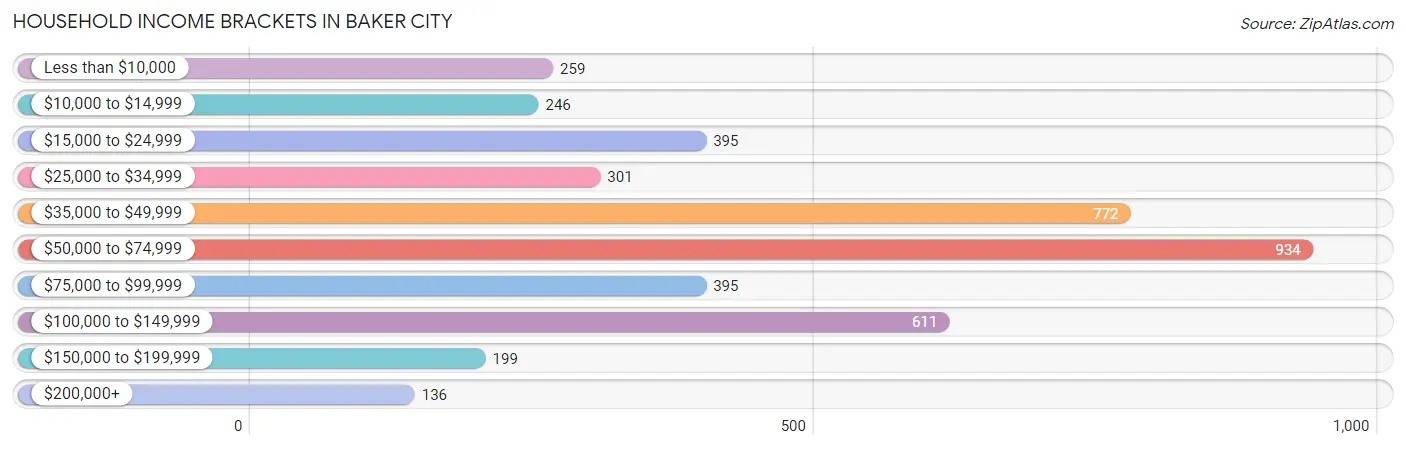
| Income Bracket | # Households | % Households |
| Less than $10,000 | 259 | 6.1% |
| $10,000 to $14,999 | 246 | 5.8% |
| $15,000 to $24,999 | 395 | 9.3% |
| $25,000 to $34,999 | 301 | 7.1% |
| $35,000 to $49,999 | 772 | 18.2% |
| $50,000 to $74,999 | 934 | 22.0% |
| $75,000 to $99,999 | 395 | 9.3% |
| $100,000 to $149,999 | 611 | 14.4% |
| $150,000 to $199,999 | 199 | 4.7% |
| $200,000+ | 136 | 3.2% |
Household Income by Householder Age in Baker City
The median household income in Baker City is $54,063, with the highest median household income of $71,261 found in the 25 to 44 years age bracket for the primary householder. A total of 1,124 households (26.5%) fall into this category. Meanwhile, the 15 to 24 years age bracket for the primary householder has the lowest median household income of $0, with 99 households (2.3%) in this group.
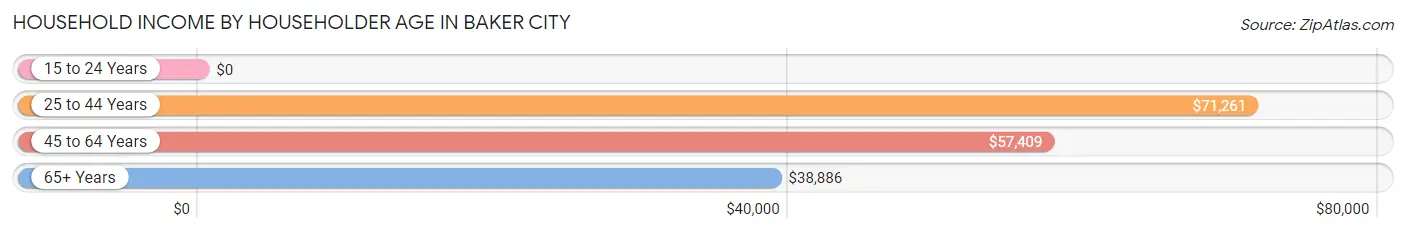
| Income Bracket | # Households | Median Income |
| 15 to 24 Years | 99 (2.3%) | $0 |
| 25 to 44 Years | 1,124 (26.5%) | $71,261 |
| 45 to 64 Years | 1,406 (33.1%) | $57,409 |
| 65+ Years | 1,615 (38.1%) | $38,886 |
| Total | 4,244 (100.0%) | $54,063 |
Poverty in Baker City
Income Below Poverty by Sex and Age in Baker City
With 10.3% poverty level for males and 17.3% for females among the residents of Baker City, 15 year old males and 18 to 24 year old females are the most vulnerable to poverty, with 18 males (40.0%) and 124 females (38.5%) in their respective age groups living below the poverty level.
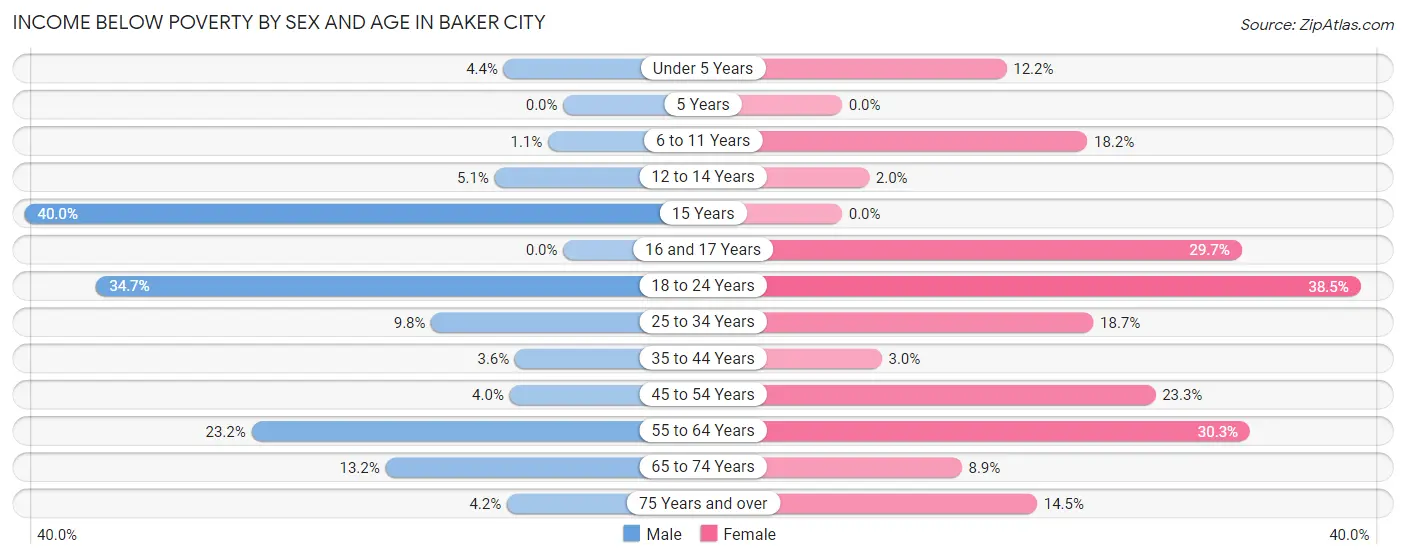
| Age Bracket | Male | Female |
| Under 5 Years | 15 (4.4%) | 26 (12.2%) |
| 5 Years | 0 (0.0%) | 0 (0.0%) |
| 6 to 11 Years | 4 (1.1%) | 51 (18.2%) |
| 12 to 14 Years | 10 (5.1%) | 5 (2.0%) |
| 15 Years | 18 (40.0%) | 0 (0.0%) |
| 16 and 17 Years | 0 (0.0%) | 46 (29.7%) |
| 18 to 24 Years | 112 (34.7%) | 124 (38.5%) |
| 25 to 34 Years | 60 (9.8%) | 89 (18.7%) |
| 35 to 44 Years | 20 (3.6%) | 16 (2.9%) |
| 45 to 54 Years | 20 (4.0%) | 138 (23.3%) |
| 55 to 64 Years | 141 (23.2%) | 183 (30.3%) |
| 65 to 74 Years | 80 (13.2%) | 55 (8.9%) |
| 75 Years and over | 23 (4.2%) | 97 (14.5%) |
| Total | 503 (10.3%) | 830 (17.3%) |
Income Above Poverty by Sex and Age in Baker City
According to the poverty statistics in Baker City, males aged 5 years and females aged 5 years are the age groups that are most secure financially, with 100.0% of males and 100.0% of females in these age groups living above the poverty line.
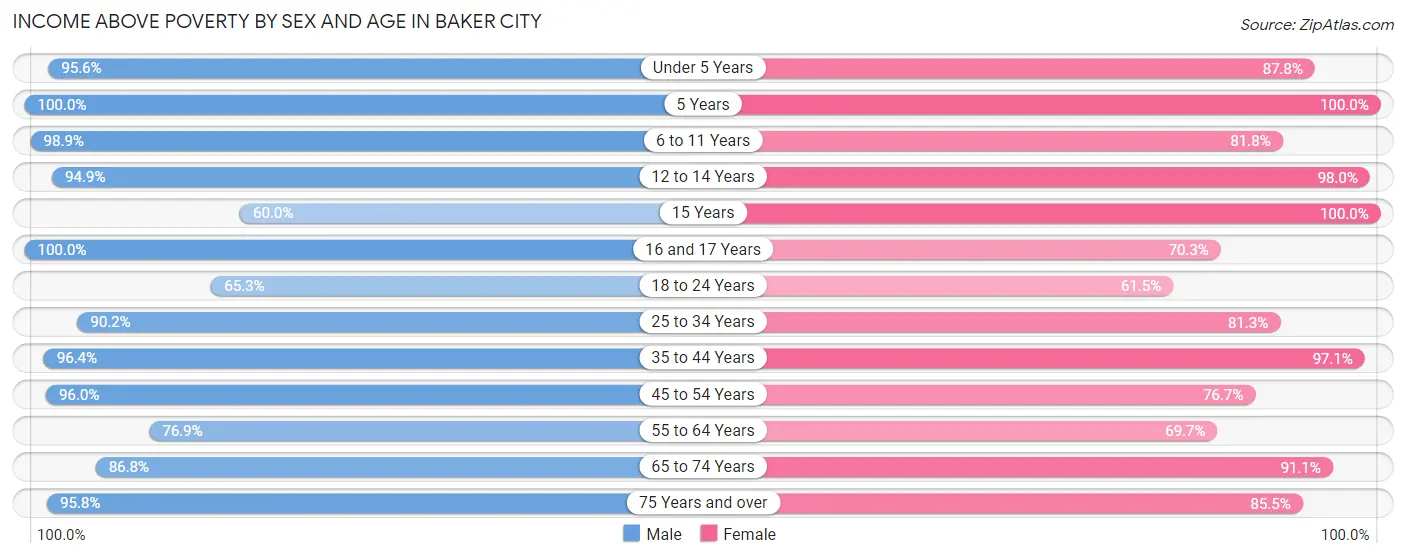
| Age Bracket | Male | Female |
| Under 5 Years | 324 (95.6%) | 187 (87.8%) |
| 5 Years | 70 (100.0%) | 22 (100.0%) |
| 6 to 11 Years | 349 (98.9%) | 229 (81.8%) |
| 12 to 14 Years | 186 (94.9%) | 244 (98.0%) |
| 15 Years | 27 (60.0%) | 54 (100.0%) |
| 16 and 17 Years | 108 (100.0%) | 109 (70.3%) |
| 18 to 24 Years | 211 (65.3%) | 198 (61.5%) |
| 25 to 34 Years | 552 (90.2%) | 388 (81.3%) |
| 35 to 44 Years | 539 (96.4%) | 526 (97.1%) |
| 45 to 54 Years | 482 (96.0%) | 455 (76.7%) |
| 55 to 64 Years | 468 (76.8%) | 421 (69.7%) |
| 65 to 74 Years | 526 (86.8%) | 564 (91.1%) |
| 75 Years and over | 527 (95.8%) | 573 (85.5%) |
| Total | 4,369 (89.7%) | 3,970 (82.7%) |
Income Below Poverty Among Married-Couple Families in Baker City
The poverty statistics for married-couple families in Baker City show that 3.8% or 69 of the total 1,830 families live below the poverty line. Families with no children have the highest poverty rate of 6.0%, comprising of 69 families. On the other hand, families with 1 or 2 children have the lowest poverty rate of 0.0%, which includes 0 families.
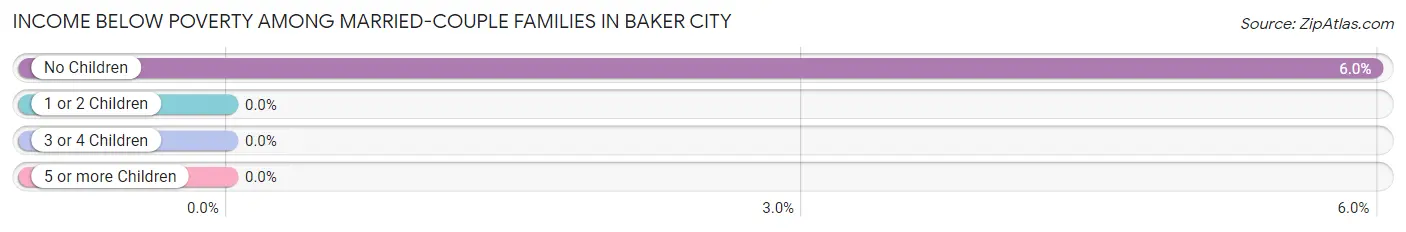
| Children | Above Poverty | Below Poverty |
| No Children | 1,084 (94.0%) | 69 (6.0%) |
| 1 or 2 Children | 420 (100.0%) | 0 (0.0%) |
| 3 or 4 Children | 257 (100.0%) | 0 (0.0%) |
| 5 or more Children | 0 (0.0%) | 0 (0.0%) |
| Total | 1,761 (96.2%) | 69 (3.8%) |
Income Below Poverty Among Single-Parent Households in Baker City
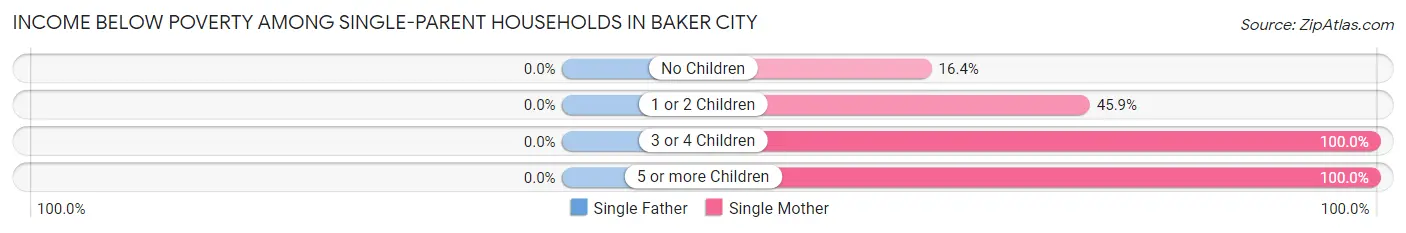
| Children | Single Father | Single Mother |
| No Children | 0 (0.0%) | 20 (16.4%) |
| 1 or 2 Children | 0 (0.0%) | 83 (45.9%) |
| 3 or 4 Children | 0 (0.0%) | 19 (100.0%) |
| 5 or more Children | 0 (0.0%) | 16 (100.0%) |
| Total | 0 (0.0%) | 138 (40.8%) |
Income Below Poverty Among Married-Couple vs Single-Parent Households in Baker City
The poverty data for Baker City shows that 69 of the married-couple family households (3.8%) and 138 of the single-parent households (31.6%) are living below the poverty level. Within the married-couple family households, those with no children have the highest poverty rate, with 69 households (6.0%) falling below the poverty line. Among the single-parent households, those with 3 or 4 children have the highest poverty rate, with 19 household (100.0%) living below poverty.
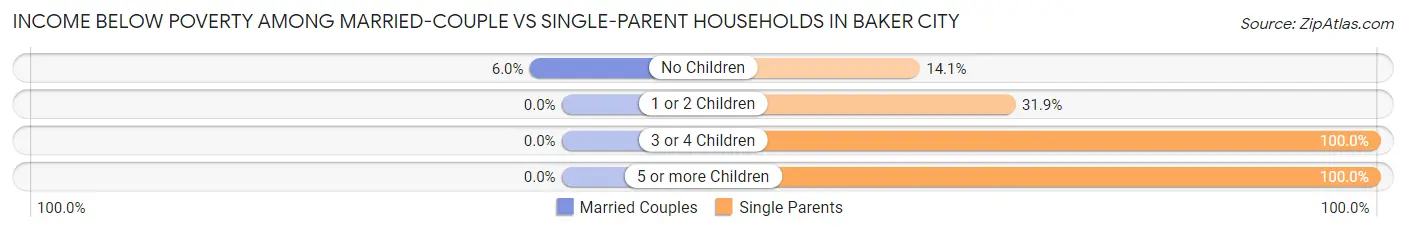
| Children | Married-Couple Families | Single-Parent Households |
| No Children | 69 (6.0%) | 20 (14.1%) |
| 1 or 2 Children | 0 (0.0%) | 83 (31.9%) |
| 3 or 4 Children | 0 (0.0%) | 19 (100.0%) |
| 5 or more Children | 0 (0.0%) | 16 (100.0%) |
| Total | 69 (3.8%) | 138 (31.6%) |
Race in Baker City
The most populous races in Baker City are White / Caucasian (9,250 | 91.5%), Hispanic or Latino (533 | 5.3%), and Two or more Races (320 | 3.2%).
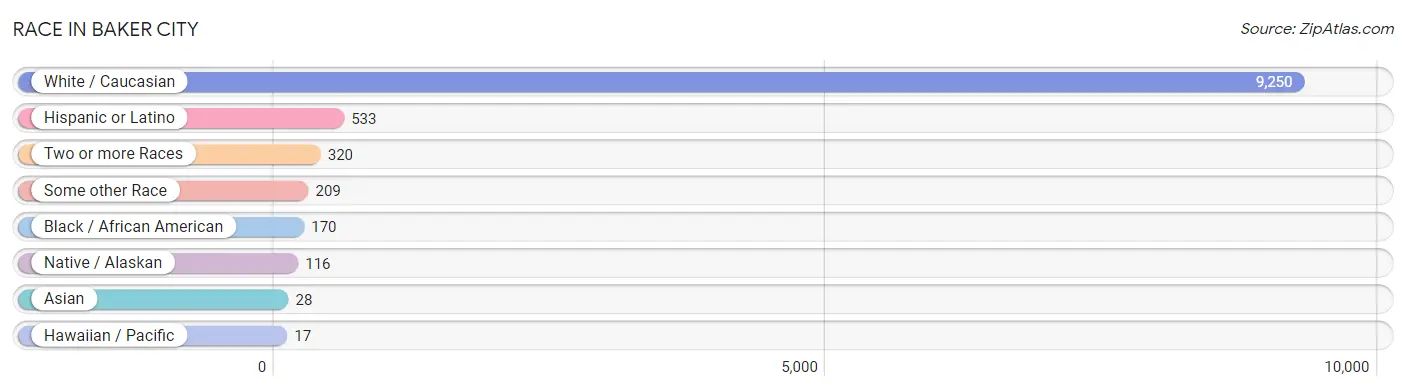
| Race | # Population | % Population |
| Asian | 28 | 0.3% |
| Black / African American | 170 | 1.7% |
| Hawaiian / Pacific | 17 | 0.2% |
| Hispanic or Latino | 533 | 5.3% |
| Native / Alaskan | 116 | 1.1% |
| White / Caucasian | 9,250 | 91.5% |
| Two or more Races | 320 | 3.2% |
| Some other Race | 209 | 2.1% |
| Total | 10,110 | 100.0% |
Ancestry in Baker City
The most populous ancestries reported in Baker City are German (1,591 | 15.7%), English (1,377 | 13.6%), Irish (1,013 | 10.0%), American (475 | 4.7%), and European (414 | 4.1%), together accounting for 48.2% of all Baker City residents.
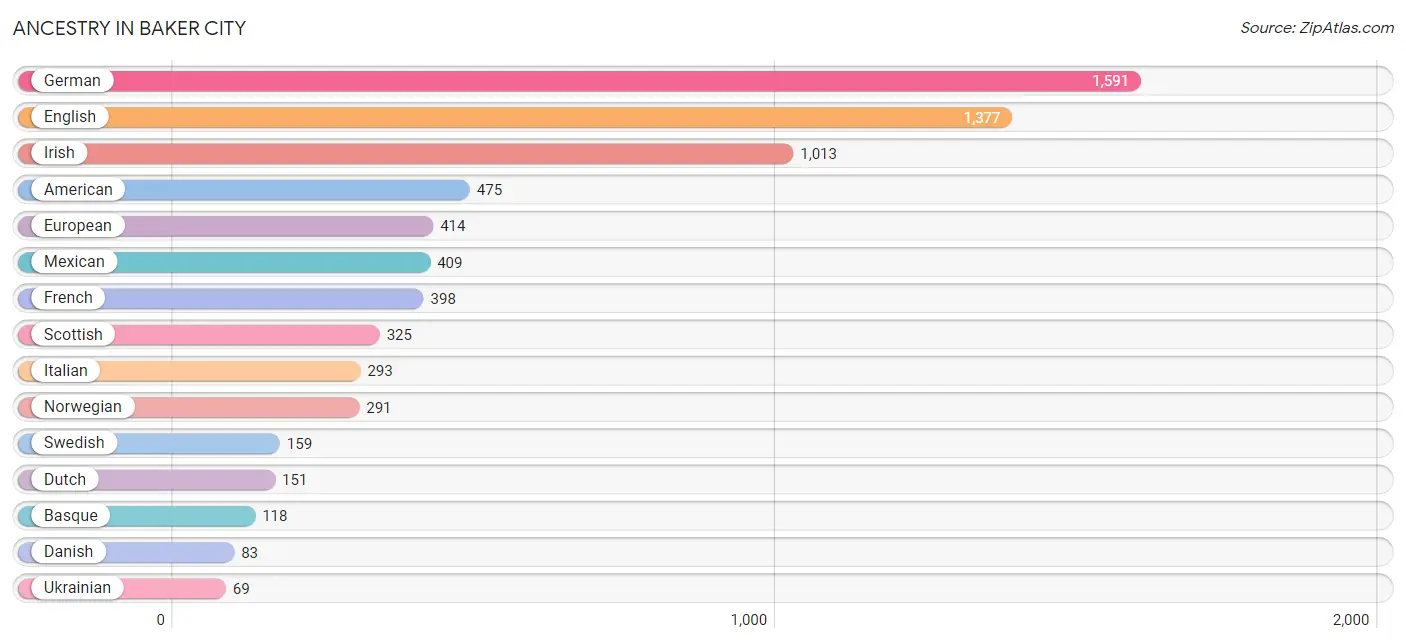
| Ancestry | # Population | % Population |
| American | 475 | 4.7% |
| Arapaho | 4 | 0.0% |
| Australian | 56 | 0.5% |
| Austrian | 9 | 0.1% |
| Basque | 118 | 1.2% |
| Belgian | 27 | 0.3% |
| Bhutanese | 20 | 0.2% |
| Blackfeet | 11 | 0.1% |
| British | 27 | 0.3% |
| Canadian | 8 | 0.1% |
| Central American | 5 | 0.1% |
| Central American Indian | 25 | 0.3% |
| Cherokee | 64 | 0.6% |
| Czechoslovakian | 19 | 0.2% |
| Danish | 83 | 0.8% |
| Delaware | 39 | 0.4% |
| Dutch | 151 | 1.5% |
| Eastern European | 9 | 0.1% |
| English | 1,377 | 13.6% |
| Ethiopian | 62 | 0.6% |
| European | 414 | 4.1% |
| Finnish | 23 | 0.2% |
| French | 398 | 3.9% |
| French Canadian | 10 | 0.1% |
| German | 1,591 | 15.7% |
| Greek | 52 | 0.5% |
| Guamanian / Chamorro | 4 | 0.0% |
| Guatemalan | 5 | 0.1% |
| Irish | 1,013 | 10.0% |
| Italian | 293 | 2.9% |
| Jamaican | 13 | 0.1% |
| Japanese | 38 | 0.4% |
| Lithuanian | 9 | 0.1% |
| Mexican | 409 | 4.1% |
| Native Hawaiian | 13 | 0.1% |
| Northern European | 19 | 0.2% |
| Norwegian | 291 | 2.9% |
| Pakistani | 6 | 0.1% |
| Polish | 44 | 0.4% |
| Portuguese | 7 | 0.1% |
| Romanian | 15 | 0.2% |
| Russian | 14 | 0.1% |
| Samoan | 11 | 0.1% |
| Scandinavian | 54 | 0.5% |
| Scotch-Irish | 67 | 0.7% |
| Scottish | 325 | 3.2% |
| Serbian | 40 | 0.4% |
| Slovene | 12 | 0.1% |
| Spanish | 38 | 0.4% |
| Subsaharan African | 62 | 0.6% |
| Swedish | 159 | 1.6% |
| Swiss | 15 | 0.2% |
| Ukrainian | 69 | 0.7% |
| Welsh | 17 | 0.2% | View All 54 Rows |
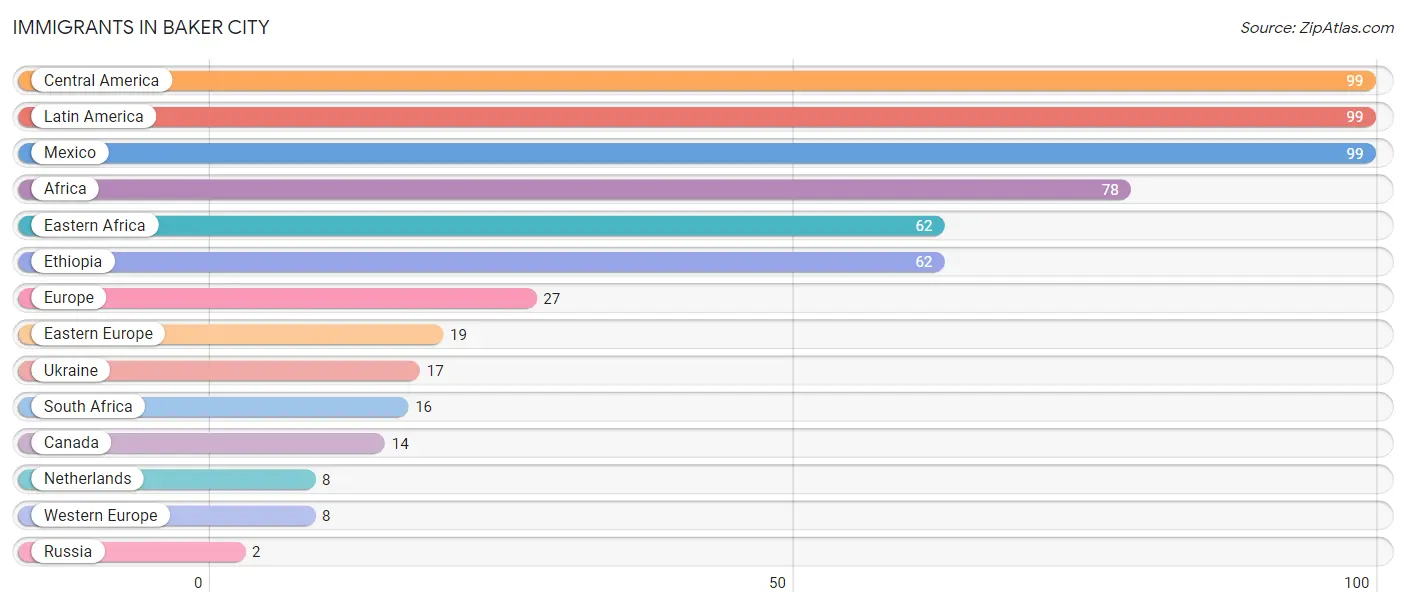
Immigrants in Baker City
The most numerous immigrant groups reported in Baker City came from Central America (99 | 1.0%), Latin America (99 | 1.0%), Mexico (99 | 1.0%), Africa (78 | 0.8%), and Eastern Africa (62 | 0.6%), together accounting for 4.3% of all Baker City residents.
| Immigration Origin | # Population | % Population |
| Africa | 78 | 0.8% |
| Canada | 14 | 0.1% |
| Central America | 99 | 1.0% |
| Eastern Africa | 62 | 0.6% |
| Eastern Europe | 19 | 0.2% |
| Ethiopia | 62 | 0.6% |
| Europe | 27 | 0.3% |
| Latin America | 99 | 1.0% |
| Mexico | 99 | 1.0% |
| Netherlands | 8 | 0.1% |
| Russia | 2 | 0.0% |
| South Africa | 16 | 0.2% |
| Ukraine | 17 | 0.2% |
| Western Europe | 8 | 0.1% | View All 14 Rows |
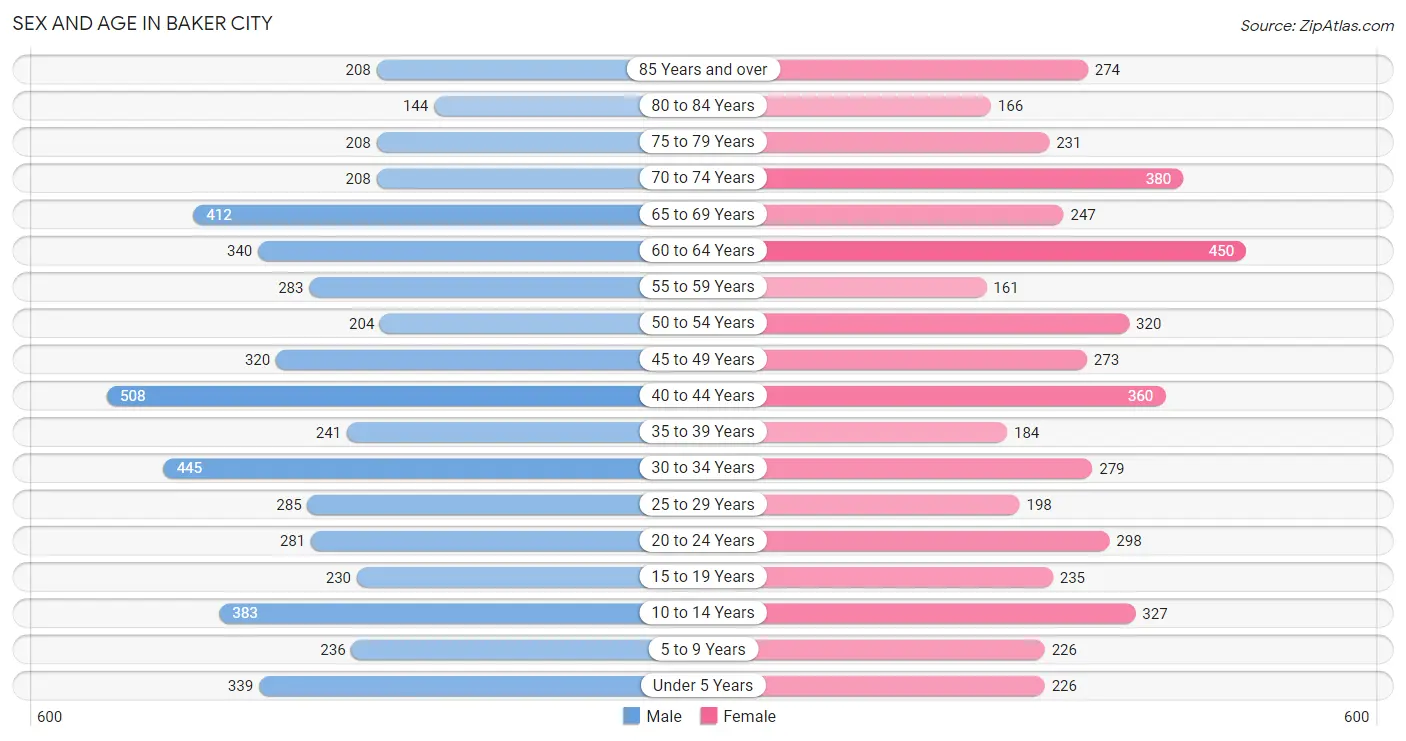
Sex and Age in Baker City
Sex and Age in Baker City
The most populous age groups in Baker City are 40 to 44 Years (508 | 9.6%) for men and 60 to 64 Years (450 | 9.3%) for women.
| Age Bracket | Male | Female |
| Under 5 Years | 339 (6.4%) | 226 (4.7%) |
| 5 to 9 Years | 236 (4.5%) | 226 (4.7%) |
| 10 to 14 Years | 383 (7.3%) | 327 (6.8%) |
| 15 to 19 Years | 230 (4.4%) | 235 (4.9%) |
| 20 to 24 Years | 281 (5.3%) | 298 (6.2%) |
| 25 to 29 Years | 285 (5.4%) | 198 (4.1%) |
| 30 to 34 Years | 445 (8.4%) | 279 (5.8%) |
| 35 to 39 Years | 241 (4.6%) | 184 (3.8%) |
| 40 to 44 Years | 508 (9.6%) | 360 (7.4%) |
| 45 to 49 Years | 320 (6.1%) | 273 (5.7%) |
| 50 to 54 Years | 204 (3.9%) | 320 (6.6%) |
| 55 to 59 Years | 283 (5.4%) | 161 (3.3%) |
| 60 to 64 Years | 340 (6.5%) | 450 (9.3%) |
| 65 to 69 Years | 412 (7.8%) | 247 (5.1%) |
| 70 to 74 Years | 208 (3.9%) | 380 (7.9%) |
| 75 to 79 Years | 208 (3.9%) | 231 (4.8%) |
| 80 to 84 Years | 144 (2.7%) | 166 (3.4%) |
| 85 Years and over | 208 (3.9%) | 274 (5.7%) |
| Total | 5,275 (100.0%) | 4,835 (100.0%) |
Families and Households in Baker City
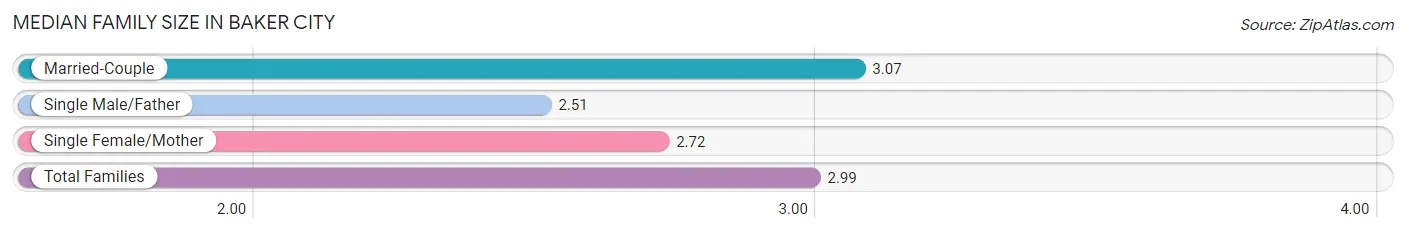
Median Family Size in Baker City
The median family size in Baker City is 2.99 persons per family, with married-couple families (1,830 | 80.7%) accounting for the largest median family size of 3.07 persons per family. On the other hand, single male/father families (99 | 4.4%) represent the smallest median family size with 2.51 persons per family.
| Family Type | # Families | Family Size |
| Married-Couple | 1,830 (80.7%) | 3.07 |
| Single Male/Father | 99 (4.4%) | 2.51 |
| Single Female/Mother | 338 (14.9%) | 2.72 |
| Total Families | 2,267 (100.0%) | 2.99 |
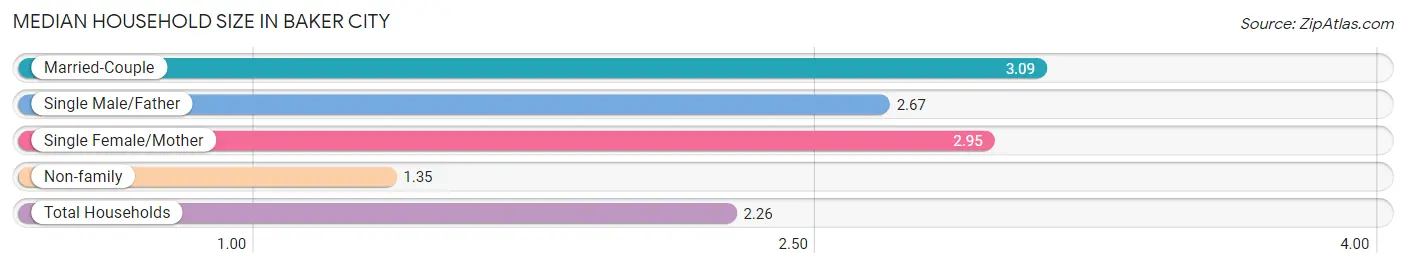
Median Household Size in Baker City
The median household size in Baker City is 2.26 persons per household, with married-couple households (1,830 | 43.1%) accounting for the largest median household size of 3.09 persons per household. non-family households (1,977 | 46.6%) represent the smallest median household size with 1.35 persons per household.
| Household Type | # Households | Household Size |
| Married-Couple | 1,830 (43.1%) | 3.09 |
| Single Male/Father | 99 (2.3%) | 2.67 |
| Single Female/Mother | 338 (8.0%) | 2.95 |
| Non-family | 1,977 (46.6%) | 1.35 |
| Total Households | 4,244 (100.0%) | 2.26 |
Household Size by Marriage Status in Baker City
Out of a total of 4,244 households in Baker City, 2,267 (53.4%) are family households, while 1,977 (46.6%) are nonfamily households. The most numerous type of family households are 2-person households, comprising 1,306, and the most common type of nonfamily households are 1-person households, comprising 1,551.
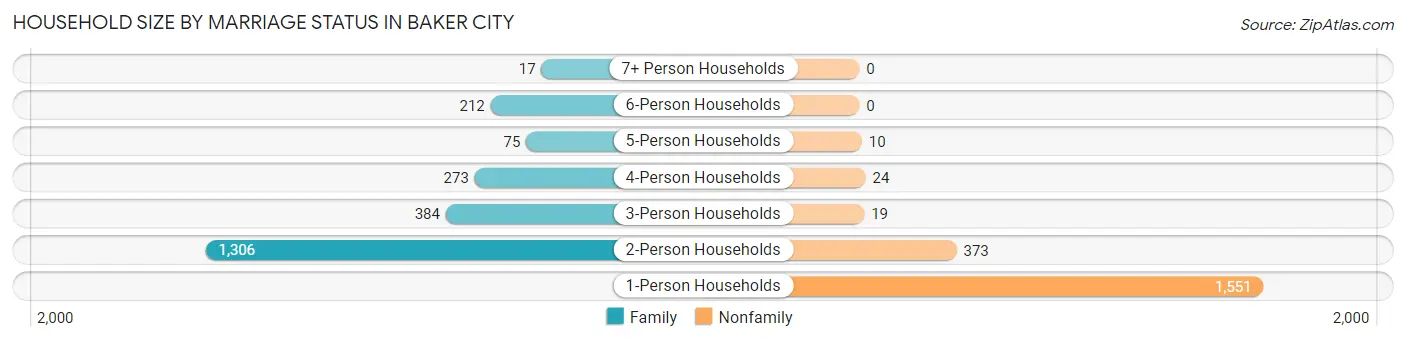
| Household Size | Family Households | Nonfamily Households |
| 1-Person Households | - | 1,551 (36.5%) |
| 2-Person Households | 1,306 (30.8%) | 373 (8.8%) |
| 3-Person Households | 384 (9.0%) | 19 (0.4%) |
| 4-Person Households | 273 (6.4%) | 24 (0.6%) |
| 5-Person Households | 75 (1.8%) | 10 (0.2%) |
| 6-Person Households | 212 (5.0%) | 0 (0.0%) |
| 7+ Person Households | 17 (0.4%) | 0 (0.0%) |
| Total | 2,267 (53.4%) | 1,977 (46.6%) |
Female Fertility in Baker City
Fertility by Age in Baker City
Average fertility rate in Baker City is 52.0 births per 1,000 women. Women in the age bracket of 20 to 34 years have the highest fertility rate with 124.0 births per 1,000 women. Women in the age bracket of 20 to 34 years acount for 100.0% of all women with births.
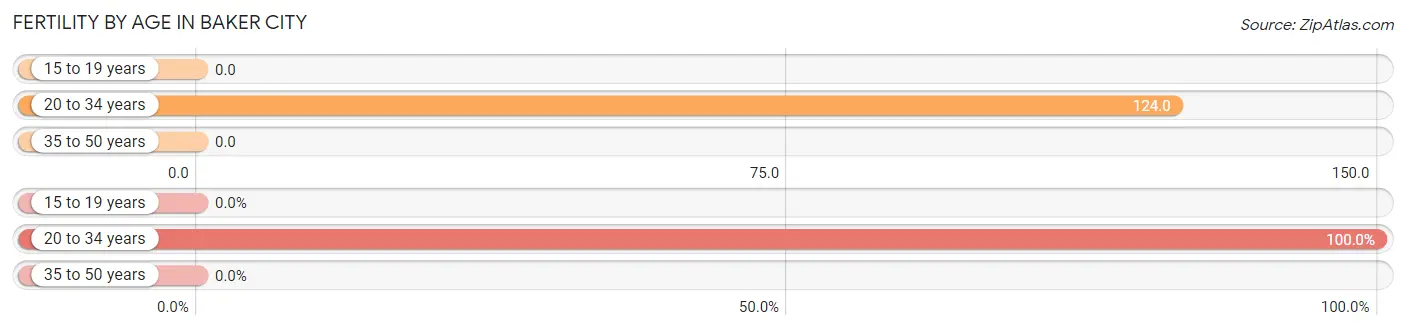
| Age Bracket | Women with Births | Births / 1,000 Women |
| 15 to 19 years | 0 (0.0%) | 0.0 |
| 20 to 34 years | 96 (100.0%) | 124.0 |
| 35 to 50 years | 0 (0.0%) | 0.0 |
| Total | 96 (100.0%) | 52.0 |
Fertility by Age by Marriage Status in Baker City
49.0% of women with births (96) in Baker City are married. The highest percentage of unmarried women with births falls into 20 to 34 years age bracket with 51.0% of them unmarried at the time of birth, while the lowest percentage of unmarried women with births belong to 20 to 34 years age bracket with 51.0% of them unmarried.
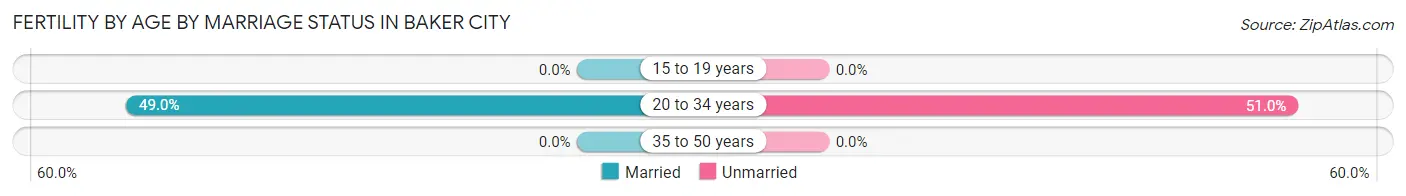
| Age Bracket | Married | Unmarried |
| 15 to 19 years | 0 (0.0%) | 0 (0.0%) |
| 20 to 34 years | 47 (49.0%) | 49 (51.0%) |
| 35 to 50 years | 0 (0.0%) | 0 (0.0%) |
| Total | 47 (49.0%) | 49 (51.0%) |
Fertility by Education in Baker City
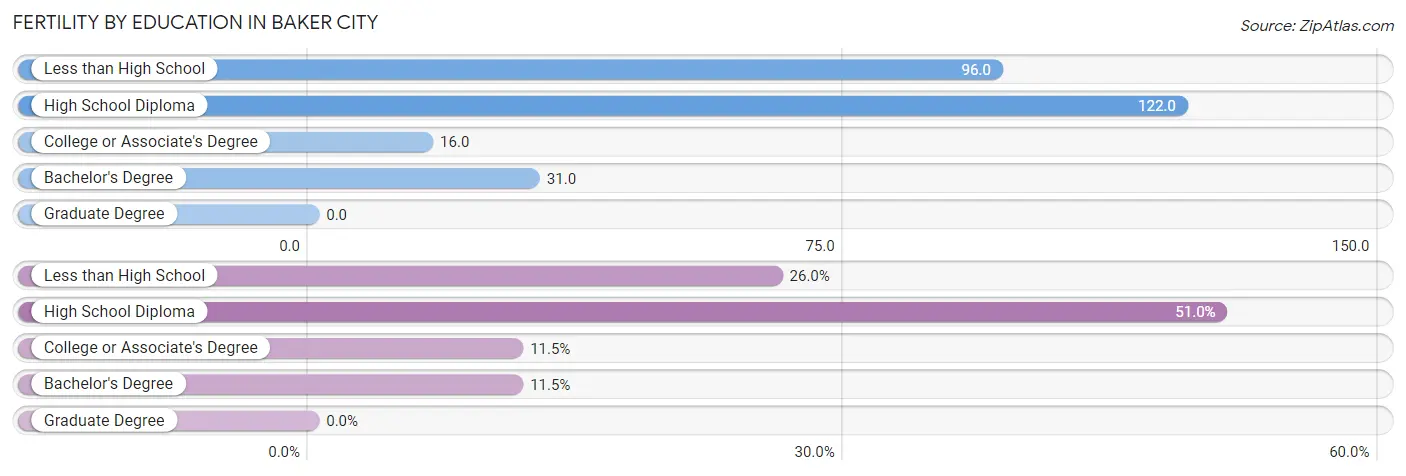
| Educational Attainment | Women with Births | Births / 1,000 Women |
| Less than High School | 25 (26.0%) | 96.0 |
| High School Diploma | 49 (51.0%) | 122.0 |
| College or Associate's Degree | 11 (11.5%) | 16.0 |
| Bachelor's Degree | 11 (11.5%) | 31.0 |
| Graduate Degree | 0 (0.0%) | 0.0 |
| Total | 96 (100.0%) | 52.0 |
Fertility by Education by Marriage Status in Baker City
51.0% of women with births in Baker City are unmarried. Women with the educational attainment of less than high school are most likely to be married with 100.0% of them married at childbirth, while women with the educational attainment of high school diploma are least likely to be married with 100.0% of them unmarried at childbirth.
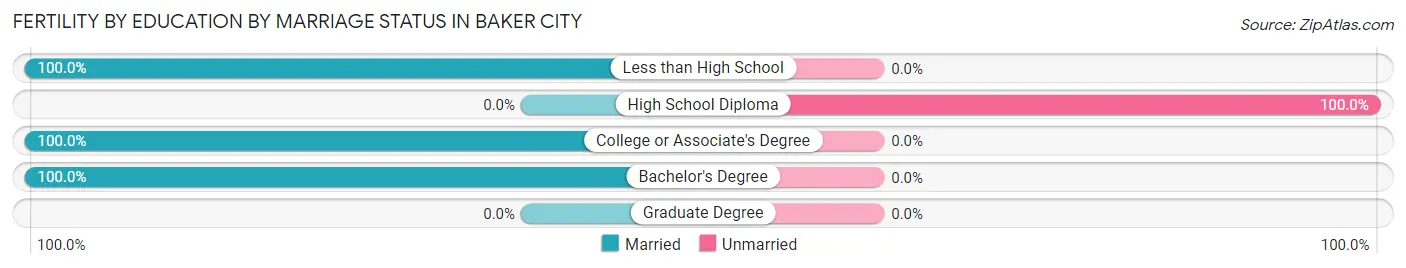
| Educational Attainment | Married | Unmarried |
| Less than High School | 25 (100.0%) | 0 (0.0%) |
| High School Diploma | 0 (0.0%) | 49 (100.0%) |
| College or Associate's Degree | 11 (100.0%) | 0 (0.0%) |
| Bachelor's Degree | 11 (100.0%) | 0 (0.0%) |
| Graduate Degree | 0 (0.0%) | 0 (0.0%) |
| Total | 47 (49.0%) | 49 (51.0%) |
Employment Characteristics in Baker City
Employment by Class of Employer in Baker City
Among the 3,913 employed individuals in Baker City, private company employees (2,318 | 59.2%), not-for-profit organizations (465 | 11.9%), and local government employees (369 | 9.4%) make up the most common classes of employment.
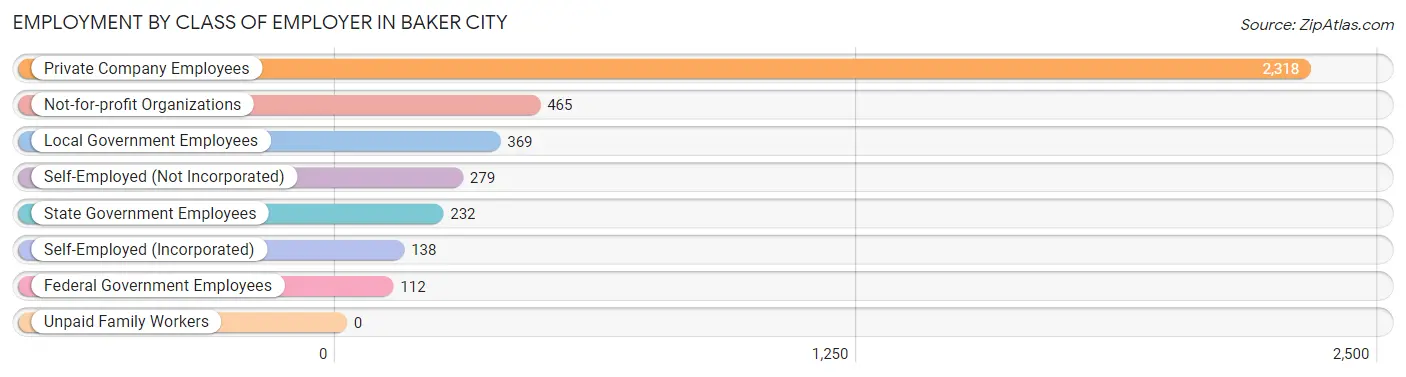
| Employer Class | # Employees | % Employees |
| Private Company Employees | 2,318 | 59.2% |
| Self-Employed (Incorporated) | 138 | 3.5% |
| Self-Employed (Not Incorporated) | 279 | 7.1% |
| Not-for-profit Organizations | 465 | 11.9% |
| Local Government Employees | 369 | 9.4% |
| State Government Employees | 232 | 5.9% |
| Federal Government Employees | 112 | 2.9% |
| Unpaid Family Workers | 0 | 0.0% |
| Total | 3,913 | 100.0% |
Employment Status by Age in Baker City
According to the labor force statistics for Baker City, out of the total population over 16 years of age (8,273), 51.7% or 4,277 individuals are in the labor force, with 5.8% or 248 of them unemployed. The age group with the highest labor force participation rate is 30 to 34 years, with 89.4% or 647 individuals in the labor force. Within the labor force, the 25 to 29 years age range has the highest percentage of unemployed individuals, with 25.7% or 94 of them being unemployed.
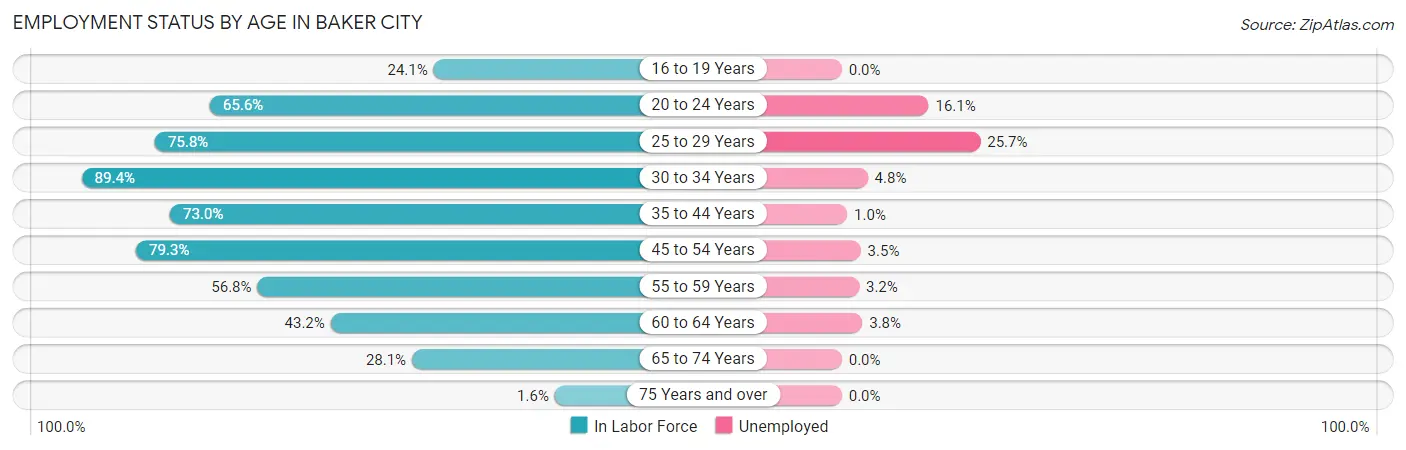
| Age Bracket | In Labor Force | Unemployed |
| 16 to 19 Years | 88 (24.1%) | 0 (0.0%) |
| 20 to 24 Years | 380 (65.6%) | 61 (16.1%) |
| 25 to 29 Years | 366 (75.8%) | 94 (25.7%) |
| 30 to 34 Years | 647 (89.4%) | 31 (4.8%) |
| 35 to 44 Years | 944 (73.0%) | 9 (1.0%) |
| 45 to 54 Years | 886 (79.3%) | 31 (3.5%) |
| 55 to 59 Years | 252 (56.8%) | 8 (3.2%) |
| 60 to 64 Years | 341 (43.2%) | 13 (3.8%) |
| 65 to 74 Years | 350 (28.1%) | 0 (0.0%) |
| 75 Years and over | 20 (1.6%) | 0 (0.0%) |
| Total | 4,277 (51.7%) | 248 (5.8%) |
Employment Status by Educational Attainment in Baker City
According to labor force statistics for Baker City, 70.8% of individuals (3,435) out of the total population between 25 and 64 years of age (4,851) are in the labor force, with 5.4% or 185 of them being unemployed. The group with the highest labor force participation rate are those with the educational attainment of bachelor's degree or higher, with 89.9% or 1,134 individuals in the labor force. Within the labor force, individuals with college / associate degree education have the highest percentage of unemployment, with 8.4% or 111 of them being unemployed.
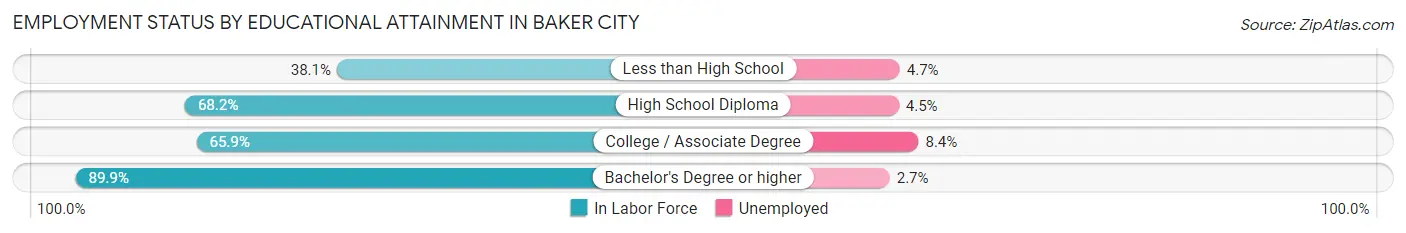
| Educational Attainment | In Labor Force | Unemployed |
| Less than High School | 127 (38.1%) | 16 (4.7%) |
| High School Diploma | 853 (68.2%) | 56 (4.5%) |
| College / Associate Degree | 1,322 (65.9%) | 169 (8.4%) |
| Bachelor's Degree or higher | 1,134 (89.9%) | 34 (2.7%) |
| Total | 3,435 (70.8%) | 262 (5.4%) |
Employment Occupations by Sex in Baker City
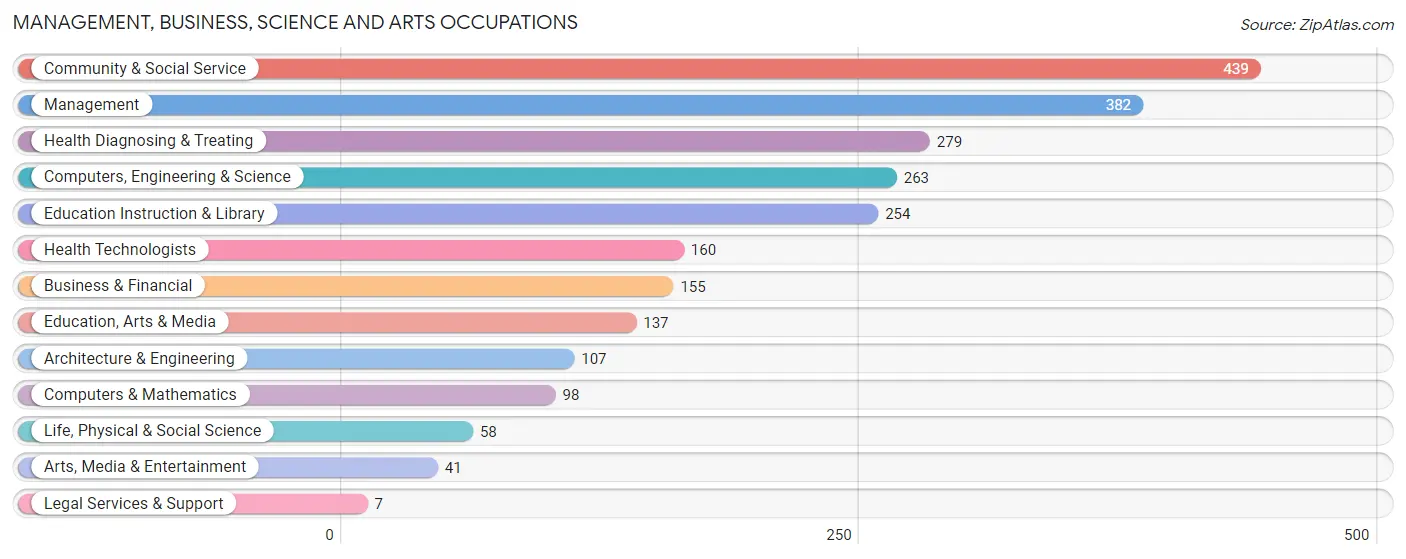
Management, Business, Science and Arts Occupations
The most common Management, Business, Science and Arts occupations in Baker City are Community & Social Service (439 | 10.9%), Management (382 | 9.5%), Health Diagnosing & Treating (279 | 6.9%), Computers, Engineering & Science (263 | 6.5%), and Education Instruction & Library (254 | 6.3%).
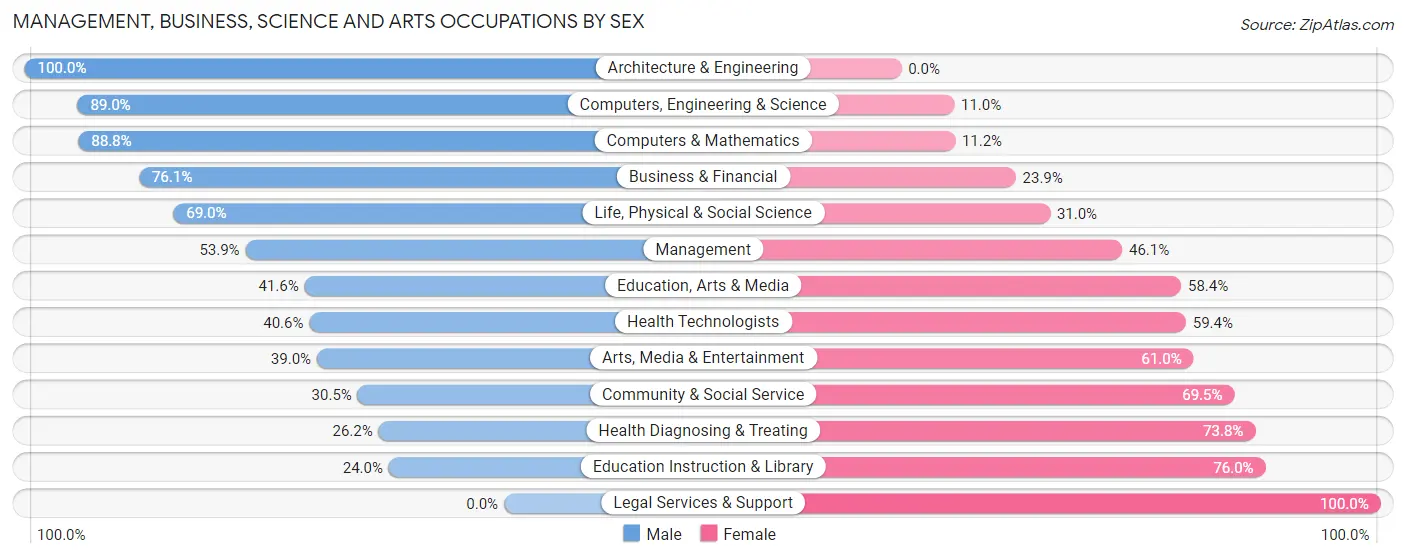
Management, Business, Science and Arts Occupations by Sex
Within the Management, Business, Science and Arts occupations in Baker City, the most male-oriented occupations are Architecture & Engineering (100.0%), Computers, Engineering & Science (89.0%), and Computers & Mathematics (88.8%), while the most female-oriented occupations are Legal Services & Support (100.0%), Education Instruction & Library (76.0%), and Health Diagnosing & Treating (73.8%).
| Occupation | Male | Female |
| Management | 206 (53.9%) | 176 (46.1%) |
| Business & Financial | 118 (76.1%) | 37 (23.9%) |
| Computers, Engineering & Science | 234 (89.0%) | 29 (11.0%) |
| Computers & Mathematics | 87 (88.8%) | 11 (11.2%) |
| Architecture & Engineering | 107 (100.0%) | 0 (0.0%) |
| Life, Physical & Social Science | 40 (69.0%) | 18 (31.0%) |
| Community & Social Service | 134 (30.5%) | 305 (69.5%) |
| Education, Arts & Media | 57 (41.6%) | 80 (58.4%) |
| Legal Services & Support | 0 (0.0%) | 7 (100.0%) |
| Education Instruction & Library | 61 (24.0%) | 193 (76.0%) |
| Arts, Media & Entertainment | 16 (39.0%) | 25 (61.0%) |
| Health Diagnosing & Treating | 73 (26.2%) | 206 (73.8%) |
| Health Technologists | 65 (40.6%) | 95 (59.4%) |
| Total (Category) | 765 (50.4%) | 753 (49.6%) |
| Total (Overall) | 2,193 (54.5%) | 1,834 (45.5%) |
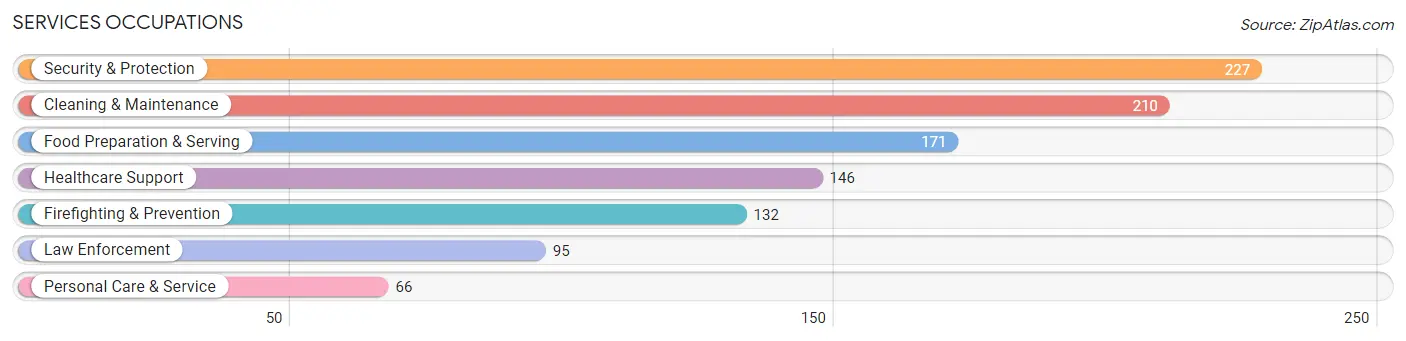
Services Occupations
The most common Services occupations in Baker City are Security & Protection (227 | 5.6%), Cleaning & Maintenance (210 | 5.2%), Food Preparation & Serving (171 | 4.3%), Healthcare Support (146 | 3.6%), and Firefighting & Prevention (132 | 3.3%).
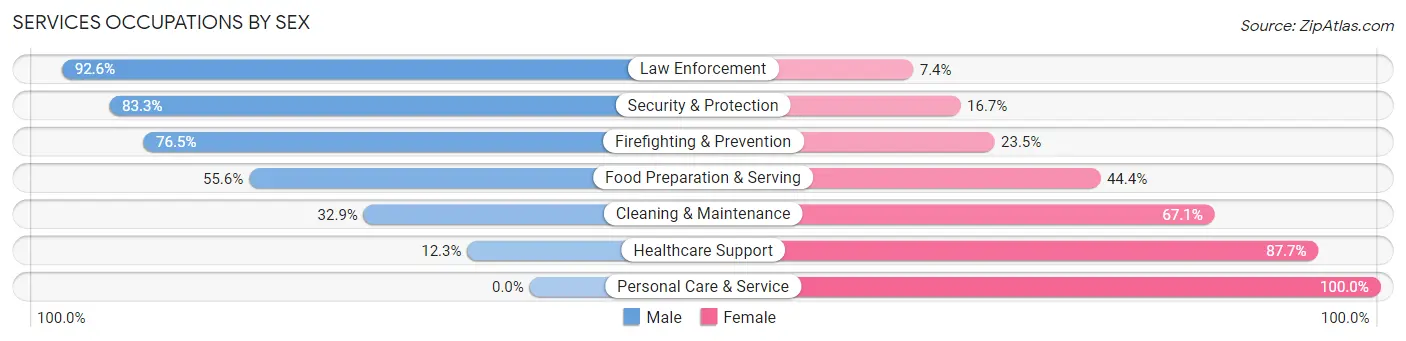
Services Occupations by Sex
Within the Services occupations in Baker City, the most male-oriented occupations are Law Enforcement (92.6%), Security & Protection (83.3%), and Firefighting & Prevention (76.5%), while the most female-oriented occupations are Personal Care & Service (100.0%), Healthcare Support (87.7%), and Cleaning & Maintenance (67.1%).
| Occupation | Male | Female |
| Healthcare Support | 18 (12.3%) | 128 (87.7%) |
| Security & Protection | 189 (83.3%) | 38 (16.7%) |
| Firefighting & Prevention | 101 (76.5%) | 31 (23.5%) |
| Law Enforcement | 88 (92.6%) | 7 (7.4%) |
| Food Preparation & Serving | 95 (55.6%) | 76 (44.4%) |
| Cleaning & Maintenance | 69 (32.9%) | 141 (67.1%) |
| Personal Care & Service | 0 (0.0%) | 66 (100.0%) |
| Total (Category) | 371 (45.2%) | 449 (54.8%) |
| Total (Overall) | 2,193 (54.5%) | 1,834 (45.5%) |
Sales and Office Occupations
The most common Sales and Office occupations in Baker City are Sales & Related (469 | 11.7%), and Office & Administration (294 | 7.3%).
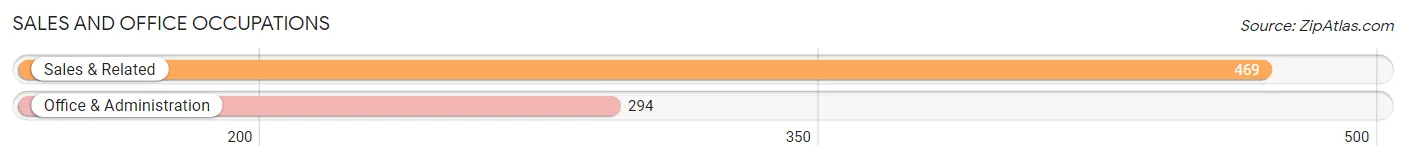
Sales and Office Occupations by Sex
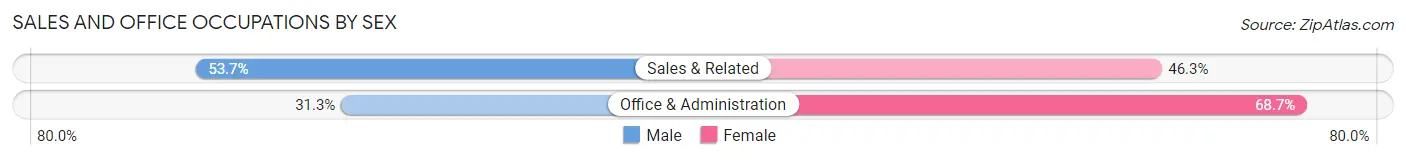
| Occupation | Male | Female |
| Sales & Related | 252 (53.7%) | 217 (46.3%) |
| Office & Administration | 92 (31.3%) | 202 (68.7%) |
| Total (Category) | 344 (45.1%) | 419 (54.9%) |
| Total (Overall) | 2,193 (54.5%) | 1,834 (45.5%) |
Natural Resources, Construction and Maintenance Occupations
The most common Natural Resources, Construction and Maintenance occupations in Baker City are Installation, Maintenance & Repair (203 | 5.0%), Construction & Extraction (159 | 4.0%), and Farming, Fishing & Forestry (21 | 0.5%).
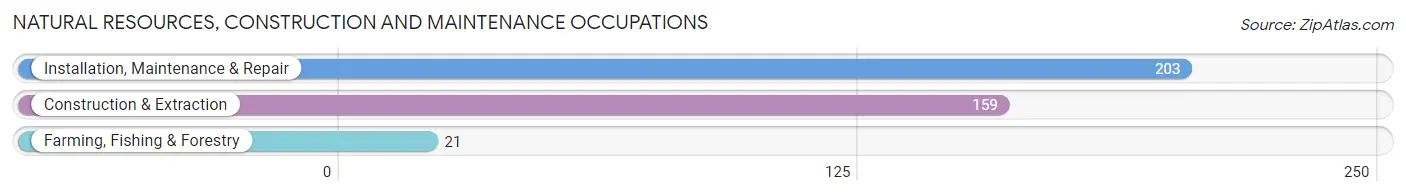
Natural Resources, Construction and Maintenance Occupations by Sex
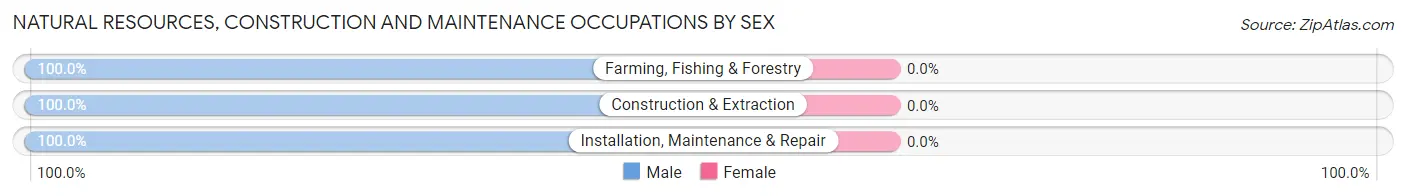
| Occupation | Male | Female |
| Farming, Fishing & Forestry | 21 (100.0%) | 0 (0.0%) |
| Construction & Extraction | 159 (100.0%) | 0 (0.0%) |
| Installation, Maintenance & Repair | 203 (100.0%) | 0 (0.0%) |
| Total (Category) | 383 (100.0%) | 0 (0.0%) |
| Total (Overall) | 2,193 (54.5%) | 1,834 (45.5%) |
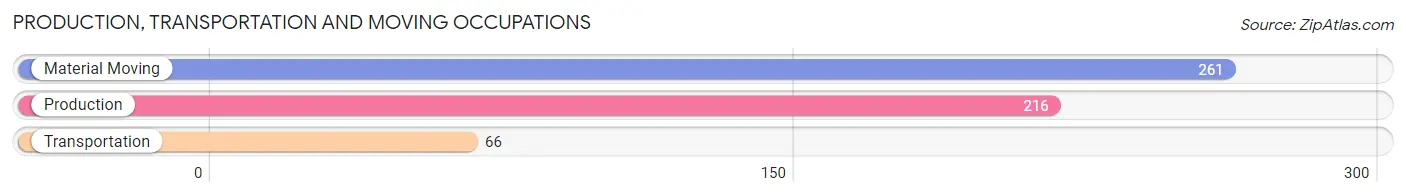
Production, Transportation and Moving Occupations
The most common Production, Transportation and Moving occupations in Baker City are Material Moving (261 | 6.5%), Production (216 | 5.4%), and Transportation (66 | 1.6%).
Production, Transportation and Moving Occupations by Sex
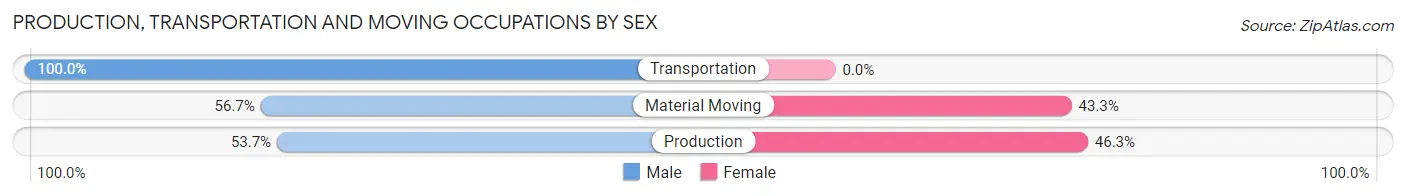
| Occupation | Male | Female |
| Production | 116 (53.7%) | 100 (46.3%) |
| Transportation | 66 (100.0%) | 0 (0.0%) |
| Material Moving | 148 (56.7%) | 113 (43.3%) |
| Total (Category) | 330 (60.8%) | 213 (39.2%) |
| Total (Overall) | 2,193 (54.5%) | 1,834 (45.5%) |
Employment Industries by Sex in Baker City
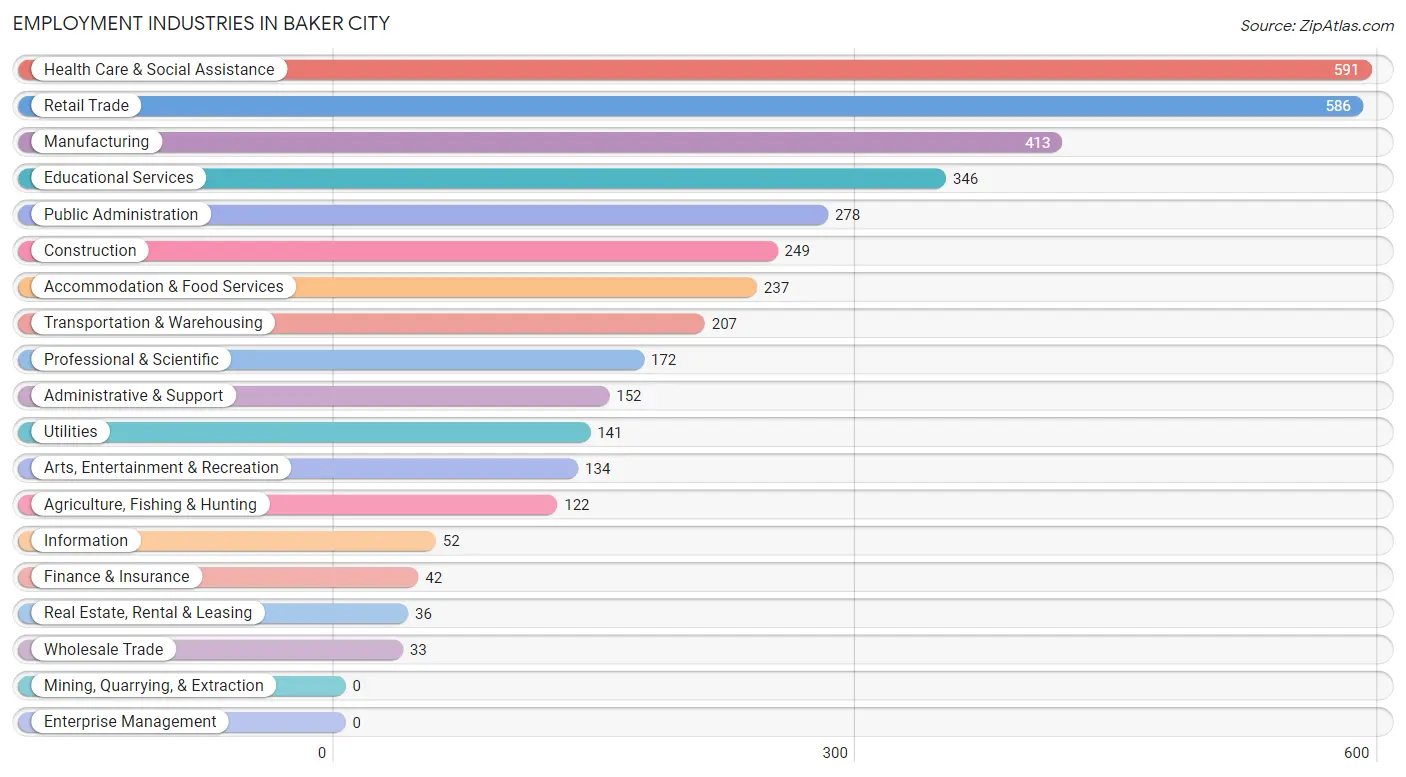
Employment Industries in Baker City
The major employment industries in Baker City include Health Care & Social Assistance (591 | 14.7%), Retail Trade (586 | 14.5%), Manufacturing (413 | 10.3%), Educational Services (346 | 8.6%), and Public Administration (278 | 6.9%).
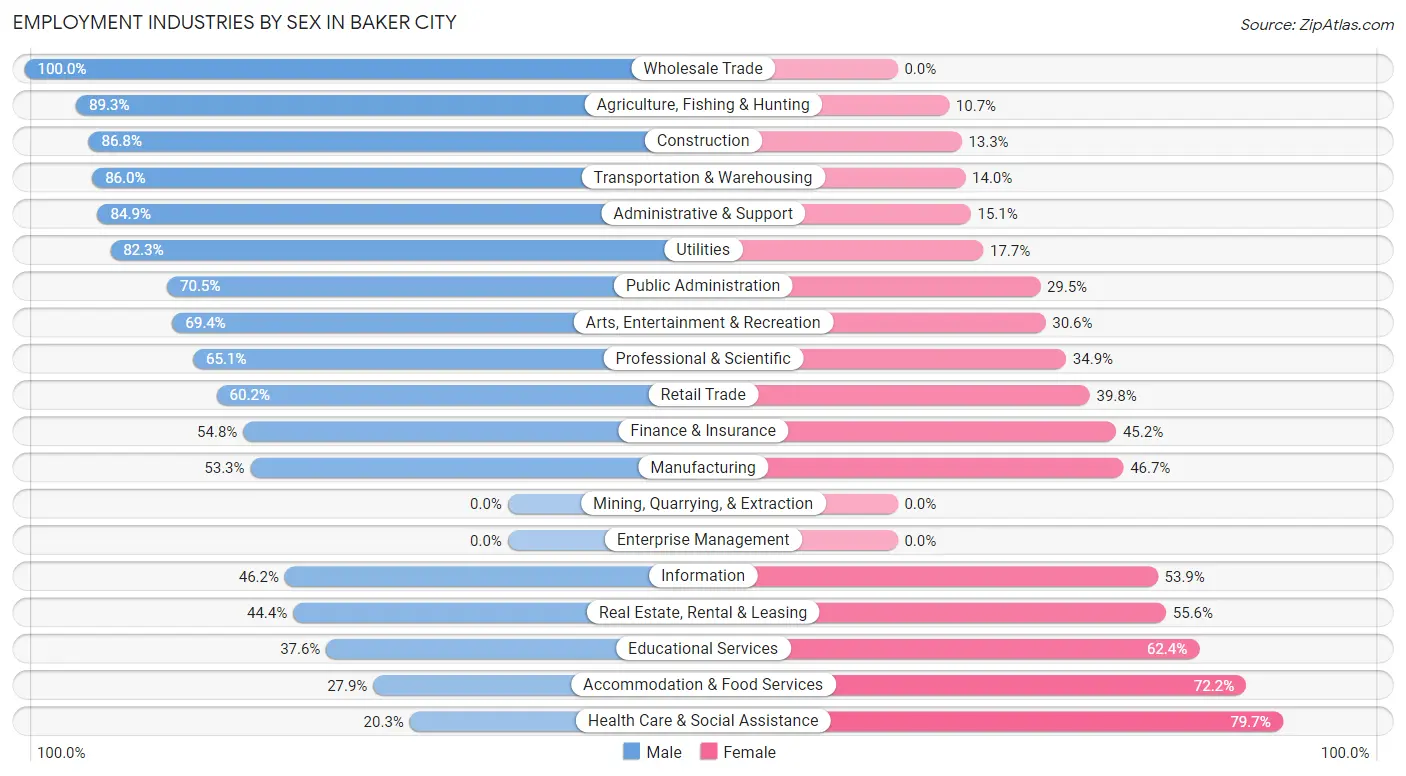
Employment Industries by Sex in Baker City
The Baker City industries that see more men than women are Wholesale Trade (100.0%), Agriculture, Fishing & Hunting (89.3%), and Construction (86.8%), whereas the industries that tend to have a higher number of women are Health Care & Social Assistance (79.7%), Accommodation & Food Services (72.2%), and Educational Services (62.4%).
| Industry | Male | Female |
| Agriculture, Fishing & Hunting | 109 (89.3%) | 13 (10.7%) |
| Mining, Quarrying, & Extraction | 0 (0.0%) | 0 (0.0%) |
| Construction | 216 (86.8%) | 33 (13.3%) |
| Manufacturing | 220 (53.3%) | 193 (46.7%) |
| Wholesale Trade | 33 (100.0%) | 0 (0.0%) |
| Retail Trade | 353 (60.2%) | 233 (39.8%) |
| Transportation & Warehousing | 178 (86.0%) | 29 (14.0%) |
| Utilities | 116 (82.3%) | 25 (17.7%) |
| Information | 24 (46.2%) | 28 (53.8%) |
| Finance & Insurance | 23 (54.8%) | 19 (45.2%) |
| Real Estate, Rental & Leasing | 16 (44.4%) | 20 (55.6%) |
| Professional & Scientific | 112 (65.1%) | 60 (34.9%) |
| Enterprise Management | 0 (0.0%) | 0 (0.0%) |
| Administrative & Support | 129 (84.9%) | 23 (15.1%) |
| Educational Services | 130 (37.6%) | 216 (62.4%) |
| Health Care & Social Assistance | 120 (20.3%) | 471 (79.7%) |
| Arts, Entertainment & Recreation | 93 (69.4%) | 41 (30.6%) |
| Accommodation & Food Services | 66 (27.9%) | 171 (72.2%) |
| Public Administration | 196 (70.5%) | 82 (29.5%) |
| Total | 2,193 (54.5%) | 1,834 (45.5%) |
Education in Baker City
School Enrollment in Baker City
The most common levels of schooling among the 2,161 students in Baker City are middle school (558 | 25.8%), high school (545 | 25.2%), and college / undergraduate (369 | 17.1%).
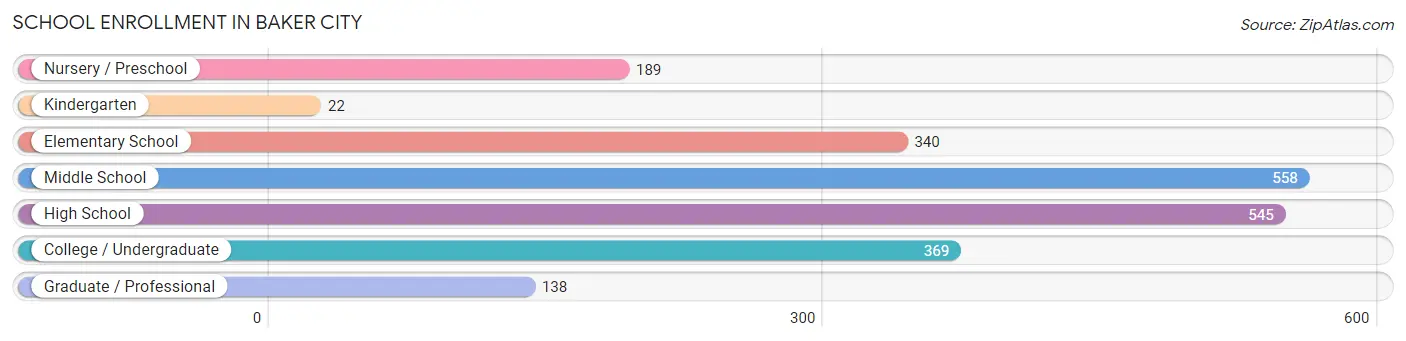
| School Level | # Students | % Students |
| Nursery / Preschool | 189 | 8.7% |
| Kindergarten | 22 | 1.0% |
| Elementary School | 340 | 15.7% |
| Middle School | 558 | 25.8% |
| High School | 545 | 25.2% |
| College / Undergraduate | 369 | 17.1% |
| Graduate / Professional | 138 | 6.4% |
| Total | 2,161 | 100.0% |
School Enrollment by Age by Funding Source in Baker City
Out of a total of 2,161 students who are enrolled in schools in Baker City, 542 (25.1%) attend a private institution, while the remaining 1,619 (74.9%) are enrolled in public schools. The age group of 3 to 4 year olds has the highest likelihood of being enrolled in private schools, with 116 (79.4% in the age bracket) enrolled. Conversely, the age group of 25 to 34 year olds has the lowest likelihood of being enrolled in a private school, with 120 (100.0% in the age bracket) attending a public institution.
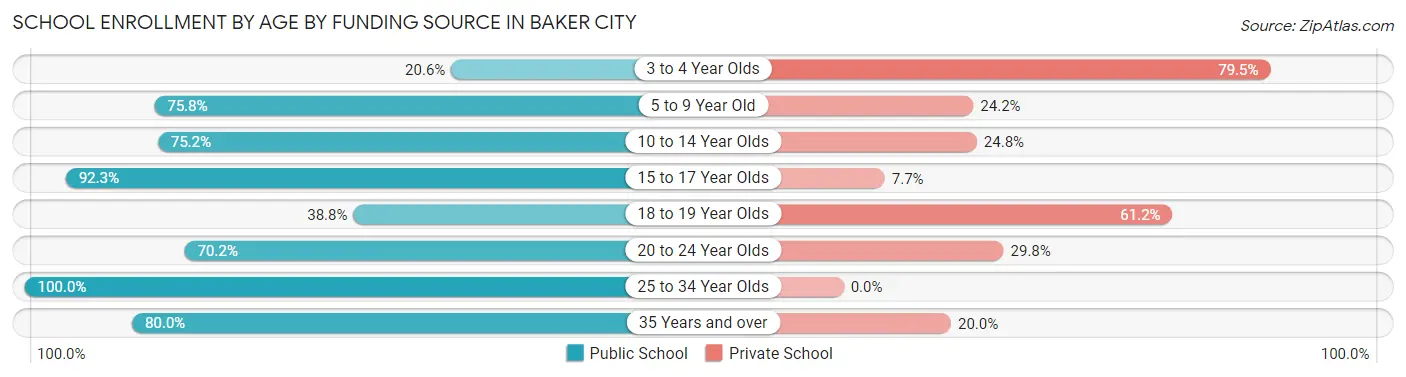
| Age Bracket | Public School | Private School |
| 3 to 4 Year Olds | 30 (20.5%) | 116 (79.4%) |
| 5 to 9 Year Old | 295 (75.8%) | 94 (24.2%) |
| 10 to 14 Year Olds | 509 (75.2%) | 168 (24.8%) |
| 15 to 17 Year Olds | 337 (92.3%) | 28 (7.7%) |
| 18 to 19 Year Olds | 19 (38.8%) | 30 (61.2%) |
| 20 to 24 Year Olds | 165 (70.2%) | 70 (29.8%) |
| 25 to 34 Year Olds | 120 (100.0%) | 0 (0.0%) |
| 35 Years and over | 144 (80.0%) | 36 (20.0%) |
| Total | 1,619 (74.9%) | 542 (25.1%) |
Educational Attainment by Field of Study in Baker City
Education (306 | 15.2%), bio, nature & agricultural (263 | 13.1%), science & technology (236 | 11.7%), business (175 | 8.7%), and arts & humanities (175 | 8.7%) are the most common fields of study among 2,015 individuals in Baker City who have obtained a bachelor's degree or higher.
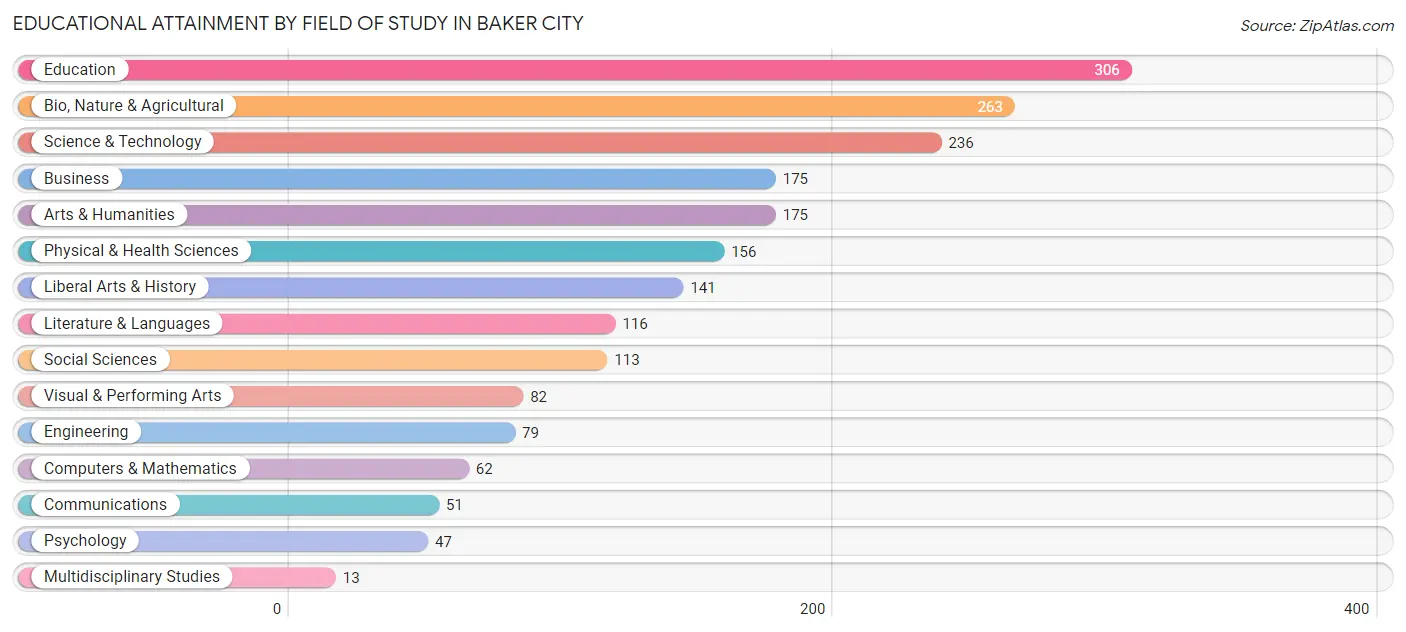
| Field of Study | # Graduates | % Graduates |
| Computers & Mathematics | 62 | 3.1% |
| Bio, Nature & Agricultural | 263 | 13.1% |
| Physical & Health Sciences | 156 | 7.7% |
| Psychology | 47 | 2.3% |
| Social Sciences | 113 | 5.6% |
| Engineering | 79 | 3.9% |
| Multidisciplinary Studies | 13 | 0.6% |
| Science & Technology | 236 | 11.7% |
| Business | 175 | 8.7% |
| Education | 306 | 15.2% |
| Literature & Languages | 116 | 5.8% |
| Liberal Arts & History | 141 | 7.0% |
| Visual & Performing Arts | 82 | 4.1% |
| Communications | 51 | 2.5% |
| Arts & Humanities | 175 | 8.7% |
| Total | 2,015 | 100.0% |
Transportation & Commute in Baker City
Vehicle Availability by Sex in Baker City
The most prevalent vehicle ownership categories in Baker City are males with 2 vehicles (941, accounting for 44.9%) and females with 2 vehicles (633, making up 53.3%).
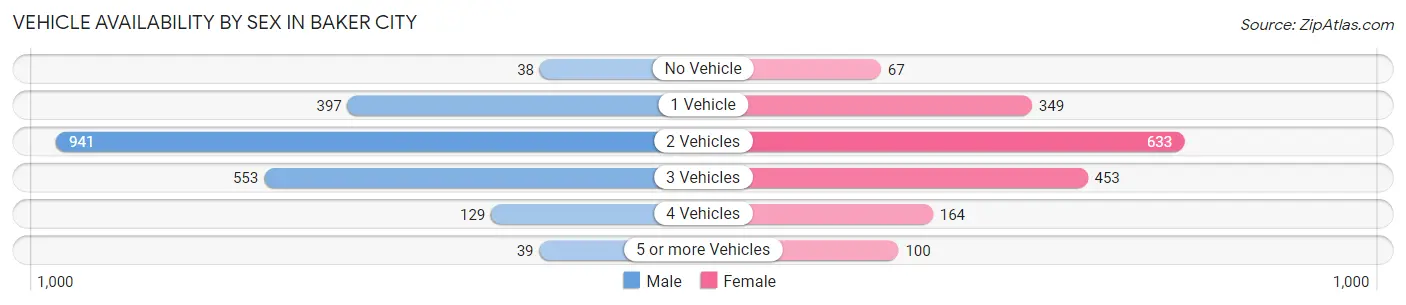
| Vehicles Available | Male | Female |
| No Vehicle | 38 (1.8%) | 67 (3.8%) |
| 1 Vehicle | 397 (18.9%) | 349 (19.8%) |
| 2 Vehicles | 941 (44.9%) | 633 (35.8%) |
| 3 Vehicles | 553 (26.4%) | 453 (25.7%) |
| 4 Vehicles | 129 (6.1%) | 164 (9.3%) |
| 5 or more Vehicles | 39 (1.9%) | 100 (5.7%) |
| Total | 2,097 (100.0%) | 1,766 (100.0%) |
Commute Time in Baker City
The most frequently occuring commute durations in Baker City are 5 to 9 minutes (1,690 commuters, 46.7%), 10 to 14 minutes (563 commuters, 15.6%), and less than 5 minutes (470 commuters, 13.0%).
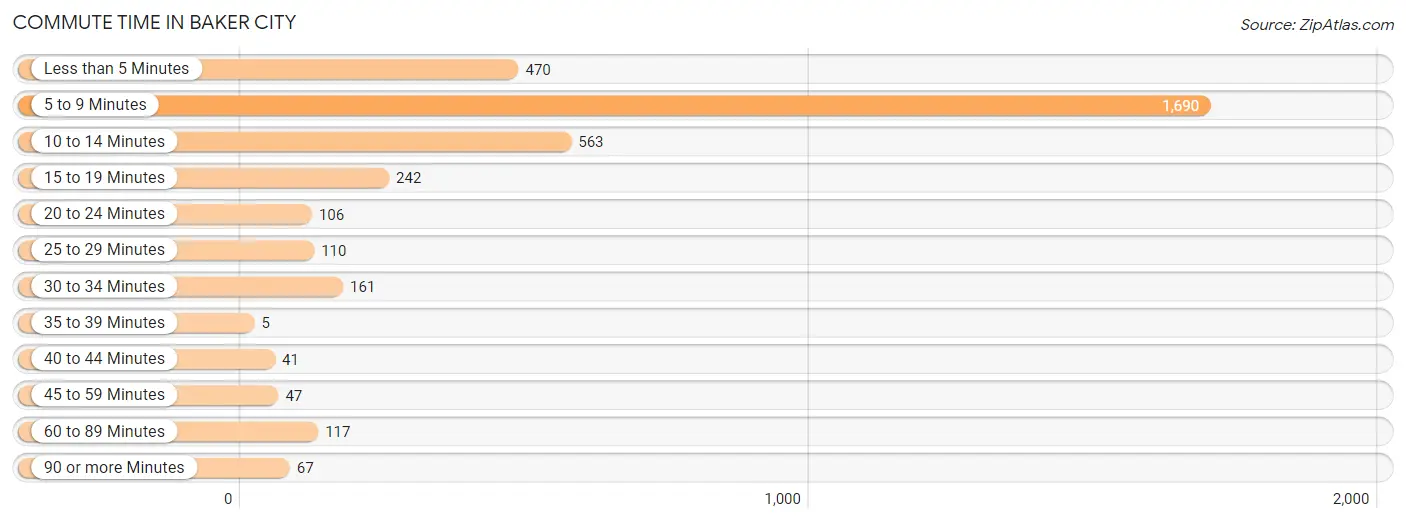
| Commute Time | # Commuters | % Commuters |
| Less than 5 Minutes | 470 | 13.0% |
| 5 to 9 Minutes | 1,690 | 46.7% |
| 10 to 14 Minutes | 563 | 15.6% |
| 15 to 19 Minutes | 242 | 6.7% |
| 20 to 24 Minutes | 106 | 2.9% |
| 25 to 29 Minutes | 110 | 3.0% |
| 30 to 34 Minutes | 161 | 4.4% |
| 35 to 39 Minutes | 5 | 0.1% |
| 40 to 44 Minutes | 41 | 1.1% |
| 45 to 59 Minutes | 47 | 1.3% |
| 60 to 89 Minutes | 117 | 3.2% |
| 90 or more Minutes | 67 | 1.8% |
Commute Time by Sex in Baker City
The most common commute times in Baker City are 5 to 9 minutes (959 commuters, 49.8%) for males and 5 to 9 minutes (731 commuters, 43.1%) for females.
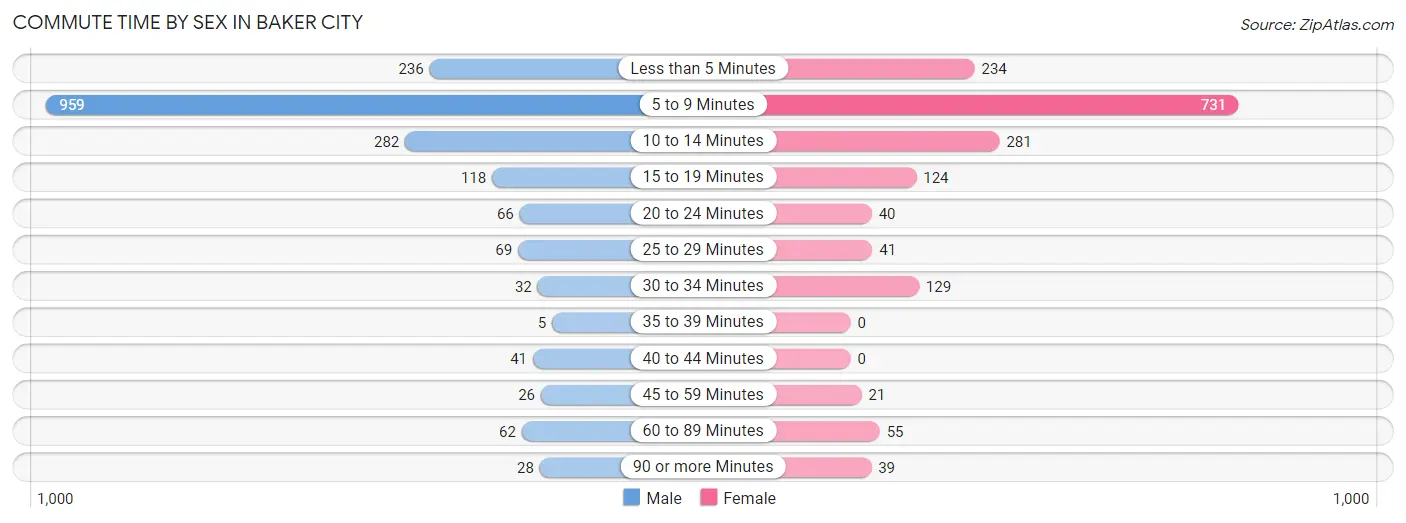
| Commute Time | Male | Female |
| Less than 5 Minutes | 236 (12.3%) | 234 (13.8%) |
| 5 to 9 Minutes | 959 (49.8%) | 731 (43.1%) |
| 10 to 14 Minutes | 282 (14.7%) | 281 (16.6%) |
| 15 to 19 Minutes | 118 (6.1%) | 124 (7.3%) |
| 20 to 24 Minutes | 66 (3.4%) | 40 (2.4%) |
| 25 to 29 Minutes | 69 (3.6%) | 41 (2.4%) |
| 30 to 34 Minutes | 32 (1.7%) | 129 (7.6%) |
| 35 to 39 Minutes | 5 (0.3%) | 0 (0.0%) |
| 40 to 44 Minutes | 41 (2.1%) | 0 (0.0%) |
| 45 to 59 Minutes | 26 (1.3%) | 21 (1.2%) |
| 60 to 89 Minutes | 62 (3.2%) | 55 (3.2%) |
| 90 or more Minutes | 28 (1.5%) | 39 (2.3%) |
Time of Departure to Work by Sex in Baker City
The most frequent times of departure to work in Baker City are 7:00 AM to 7:29 AM (306, 15.9%) for males and 7:30 AM to 7:59 AM (300, 17.7%) for females.
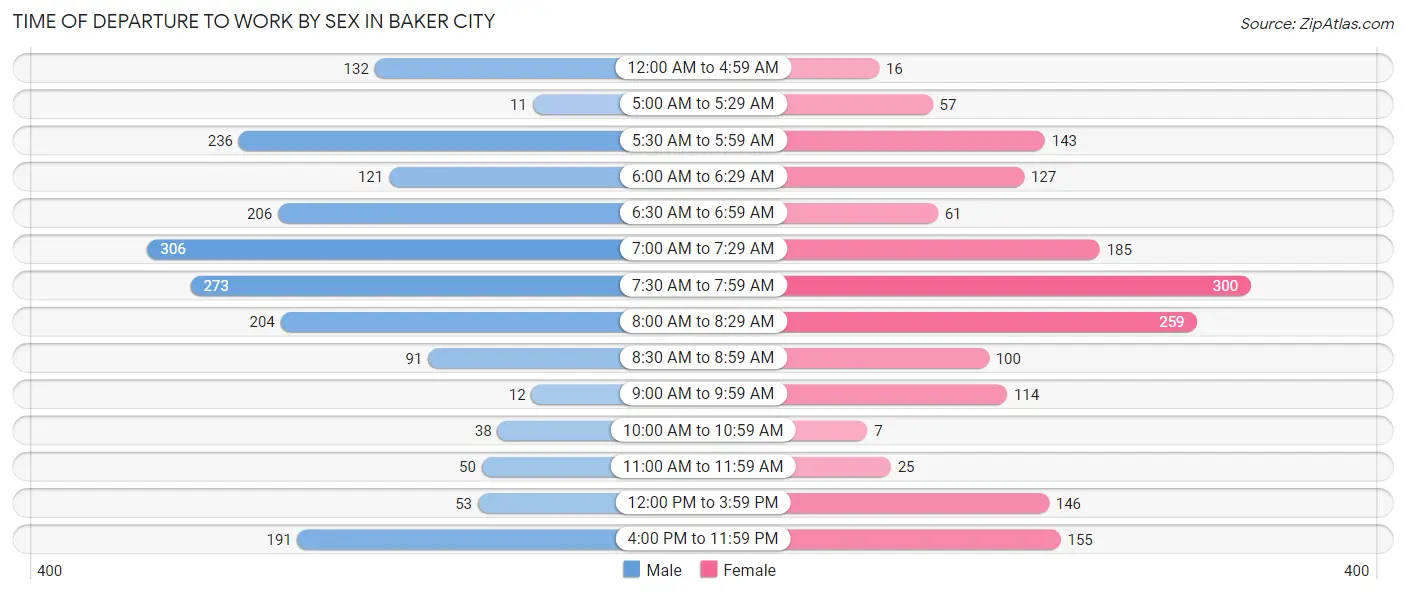
| Time of Departure | Male | Female |
| 12:00 AM to 4:59 AM | 132 (6.9%) | 16 (0.9%) |
| 5:00 AM to 5:29 AM | 11 (0.6%) | 57 (3.4%) |
| 5:30 AM to 5:59 AM | 236 (12.3%) | 143 (8.4%) |
| 6:00 AM to 6:29 AM | 121 (6.3%) | 127 (7.5%) |
| 6:30 AM to 6:59 AM | 206 (10.7%) | 61 (3.6%) |
| 7:00 AM to 7:29 AM | 306 (15.9%) | 185 (10.9%) |
| 7:30 AM to 7:59 AM | 273 (14.2%) | 300 (17.7%) |
| 8:00 AM to 8:29 AM | 204 (10.6%) | 259 (15.3%) |
| 8:30 AM to 8:59 AM | 91 (4.7%) | 100 (5.9%) |
| 9:00 AM to 9:59 AM | 12 (0.6%) | 114 (6.7%) |
| 10:00 AM to 10:59 AM | 38 (2.0%) | 7 (0.4%) |
| 11:00 AM to 11:59 AM | 50 (2.6%) | 25 (1.5%) |
| 12:00 PM to 3:59 PM | 53 (2.8%) | 146 (8.6%) |
| 4:00 PM to 11:59 PM | 191 (9.9%) | 155 (9.1%) |
| Total | 1,924 (100.0%) | 1,695 (100.0%) |
Housing Occupancy in Baker City
Occupancy by Ownership in Baker City
Of the total 4,244 dwellings in Baker City, owner-occupied units account for 3,051 (71.9%), while renter-occupied units make up 1,193 (28.1%).
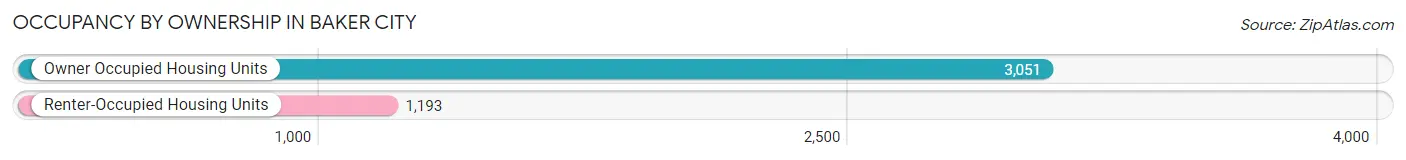
| Occupancy | # Housing Units | % Housing Units |
| Owner Occupied Housing Units | 3,051 | 71.9% |
| Renter-Occupied Housing Units | 1,193 | 28.1% |
| Total Occupied Housing Units | 4,244 | 100.0% |
Occupancy by Household Size in Baker City
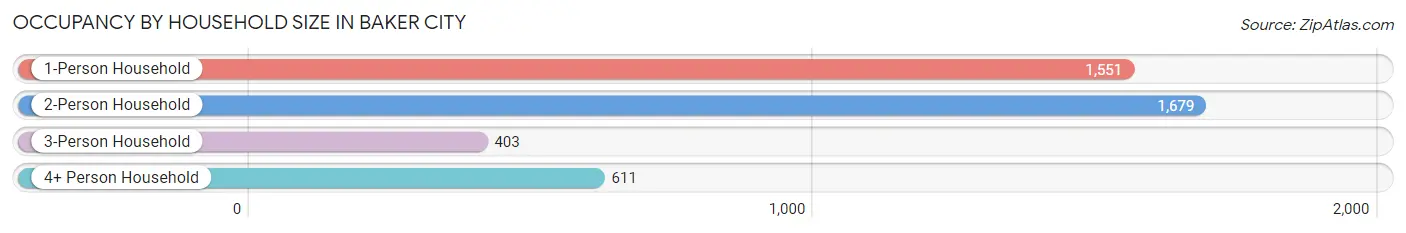
| Household Size | # Housing Units | % Housing Units |
| 1-Person Household | 1,551 | 36.5% |
| 2-Person Household | 1,679 | 39.6% |
| 3-Person Household | 403 | 9.5% |
| 4+ Person Household | 611 | 14.4% |
| Total Housing Units | 4,244 | 100.0% |
Occupancy by Ownership by Household Size in Baker City
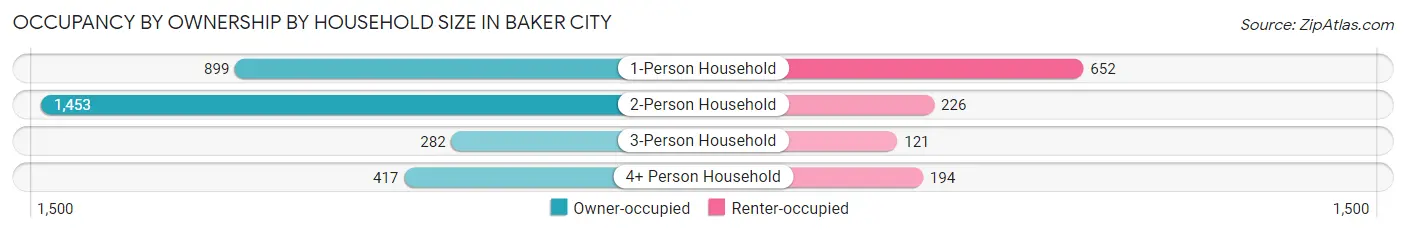
| Household Size | Owner-occupied | Renter-occupied |
| 1-Person Household | 899 (58.0%) | 652 (42.0%) |
| 2-Person Household | 1,453 (86.5%) | 226 (13.5%) |
| 3-Person Household | 282 (70.0%) | 121 (30.0%) |
| 4+ Person Household | 417 (68.2%) | 194 (31.8%) |
| Total Housing Units | 3,051 (71.9%) | 1,193 (28.1%) |
Occupancy by Educational Attainment in Baker City
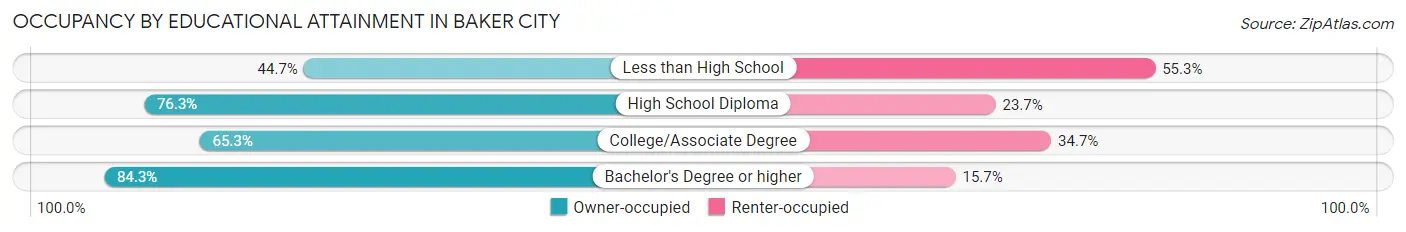
| Household Size | Owner-occupied | Renter-occupied |
| Less than High School | 151 (44.7%) | 187 (55.3%) |
| High School Diploma | 758 (76.3%) | 235 (23.7%) |
| College/Associate Degree | 1,077 (65.3%) | 572 (34.7%) |
| Bachelor's Degree or higher | 1,065 (84.3%) | 199 (15.7%) |
Occupancy by Age of Householder in Baker City
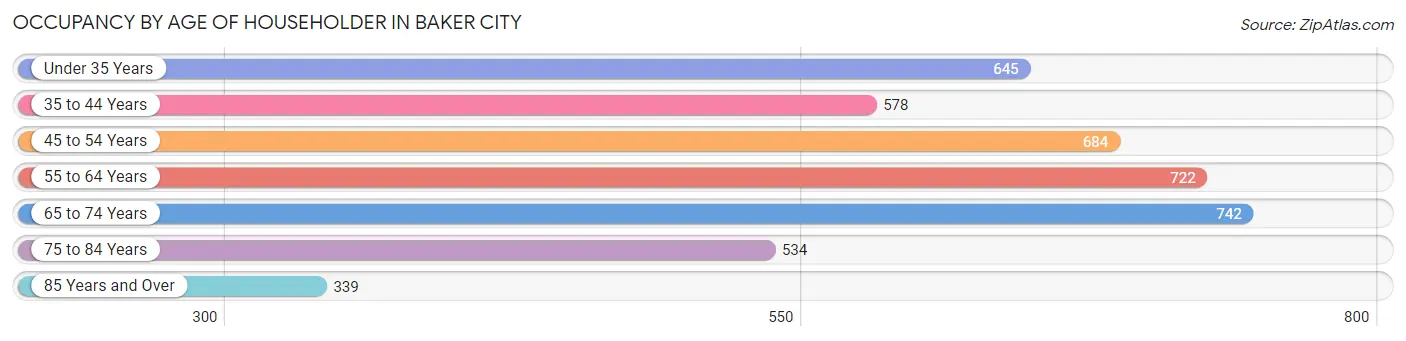
| Age Bracket | # Households | % Households |
| Under 35 Years | 645 | 15.2% |
| 35 to 44 Years | 578 | 13.6% |
| 45 to 54 Years | 684 | 16.1% |
| 55 to 64 Years | 722 | 17.0% |
| 65 to 74 Years | 742 | 17.5% |
| 75 to 84 Years | 534 | 12.6% |
| 85 Years and Over | 339 | 8.0% |
| Total | 4,244 | 100.0% |
Housing Finances in Baker City
Median Income by Occupancy in Baker City

| Occupancy Type | # Households | Median Income |
| Owner-Occupied | 3,051 (71.9%) | $59,443 |
| Renter-Occupied | 1,193 (28.1%) | $36,331 |
| Average | 4,244 (100.0%) | $54,063 |
Occupancy by Householder Income Bracket in Baker City
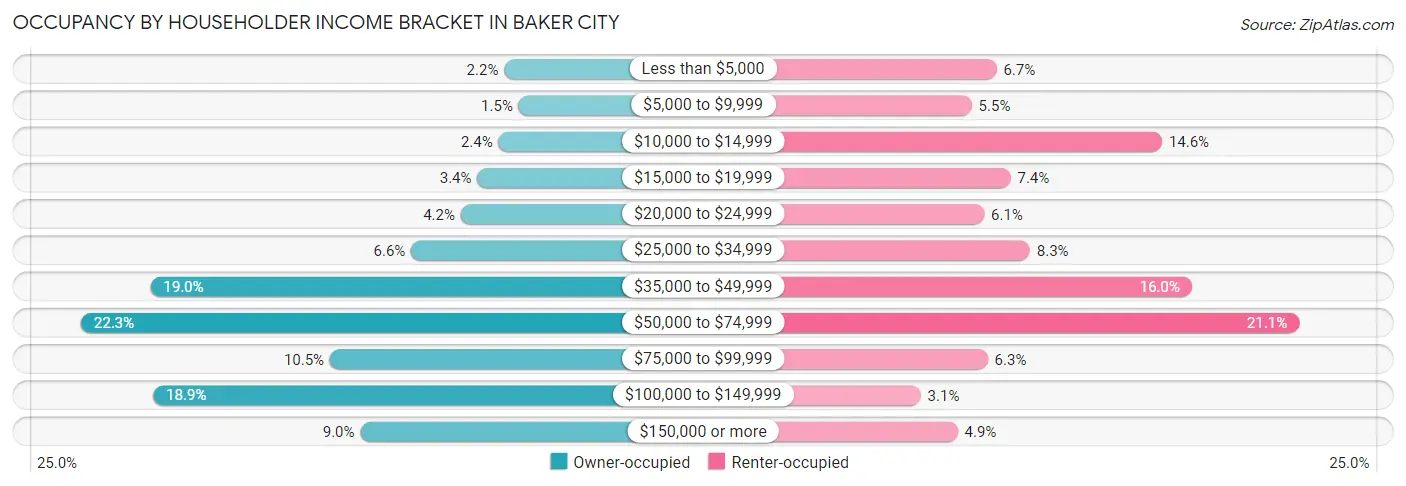
| Income Bracket | Owner-occupied | Renter-occupied |
| Less than $5,000 | 66 (2.2%) | 80 (6.7%) |
| $5,000 to $9,999 | 45 (1.5%) | 66 (5.5%) |
| $10,000 to $14,999 | 74 (2.4%) | 174 (14.6%) |
| $15,000 to $19,999 | 105 (3.4%) | 88 (7.4%) |
| $20,000 to $24,999 | 129 (4.2%) | 73 (6.1%) |
| $25,000 to $34,999 | 201 (6.6%) | 99 (8.3%) |
| $35,000 to $49,999 | 580 (19.0%) | 191 (16.0%) |
| $50,000 to $74,999 | 681 (22.3%) | 252 (21.1%) |
| $75,000 to $99,999 | 319 (10.5%) | 75 (6.3%) |
| $100,000 to $149,999 | 576 (18.9%) | 37 (3.1%) |
| $150,000 or more | 275 (9.0%) | 58 (4.9%) |
| Total | 3,051 (100.0%) | 1,193 (100.0%) |
Monthly Housing Cost Tiers in Baker City
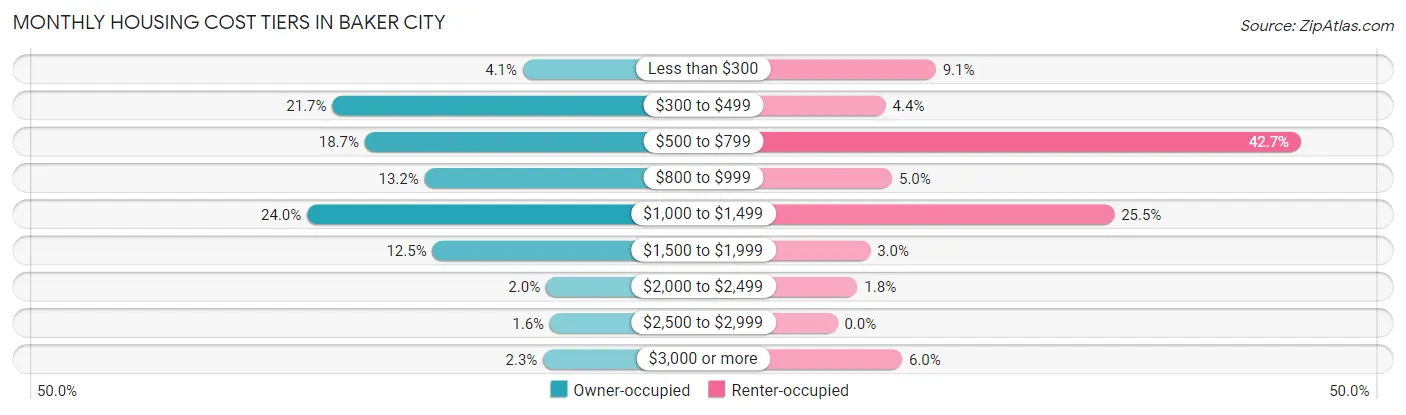
| Monthly Cost | Owner-occupied | Renter-occupied |
| Less than $300 | 126 (4.1%) | 108 (9.0%) |
| $300 to $499 | 661 (21.7%) | 53 (4.4%) |
| $500 to $799 | 570 (18.7%) | 509 (42.7%) |
| $800 to $999 | 402 (13.2%) | 60 (5.0%) |
| $1,000 to $1,499 | 732 (24.0%) | 304 (25.5%) |
| $1,500 to $1,999 | 380 (12.4%) | 36 (3.0%) |
| $2,000 to $2,499 | 61 (2.0%) | 22 (1.8%) |
| $2,500 to $2,999 | 50 (1.6%) | 0 (0.0%) |
| $3,000 or more | 69 (2.3%) | 71 (5.9%) |
| Total | 3,051 (100.0%) | 1,193 (100.0%) |
Physical Housing Characteristics in Baker City
Housing Structures in Baker City
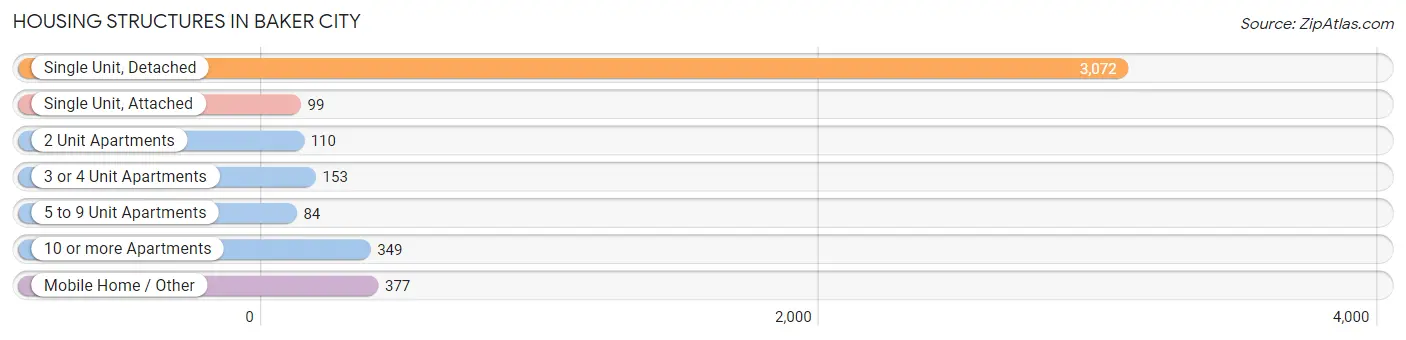
| Structure Type | # Housing Units | % Housing Units |
| Single Unit, Detached | 3,072 | 72.4% |
| Single Unit, Attached | 99 | 2.3% |
| 2 Unit Apartments | 110 | 2.6% |
| 3 or 4 Unit Apartments | 153 | 3.6% |
| 5 to 9 Unit Apartments | 84 | 2.0% |
| 10 or more Apartments | 349 | 8.2% |
| Mobile Home / Other | 377 | 8.9% |
| Total | 4,244 | 100.0% |
Housing Structures by Occupancy in Baker City
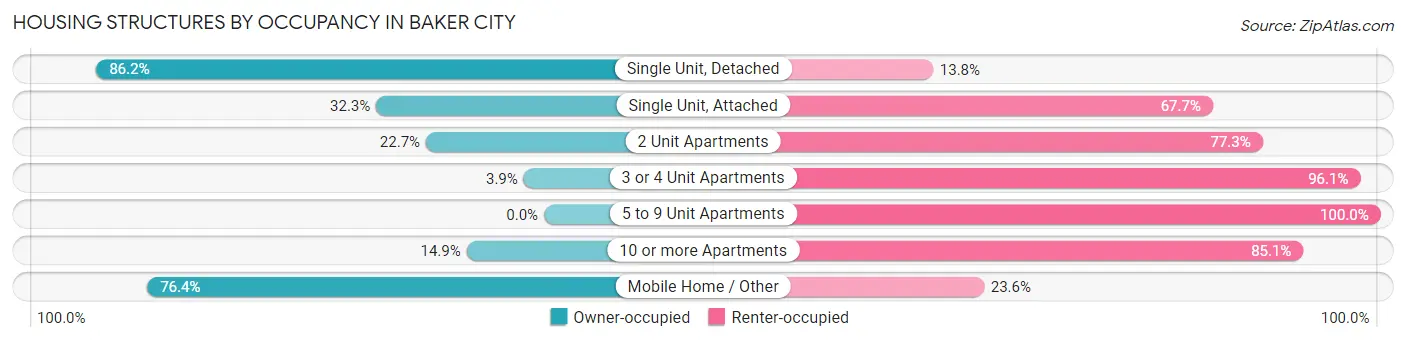
| Structure Type | Owner-occupied | Renter-occupied |
| Single Unit, Detached | 2,648 (86.2%) | 424 (13.8%) |
| Single Unit, Attached | 32 (32.3%) | 67 (67.7%) |
| 2 Unit Apartments | 25 (22.7%) | 85 (77.3%) |
| 3 or 4 Unit Apartments | 6 (3.9%) | 147 (96.1%) |
| 5 to 9 Unit Apartments | 0 (0.0%) | 84 (100.0%) |
| 10 or more Apartments | 52 (14.9%) | 297 (85.1%) |
| Mobile Home / Other | 288 (76.4%) | 89 (23.6%) |
| Total | 3,051 (71.9%) | 1,193 (28.1%) |
Housing Structures by Number of Rooms in Baker City
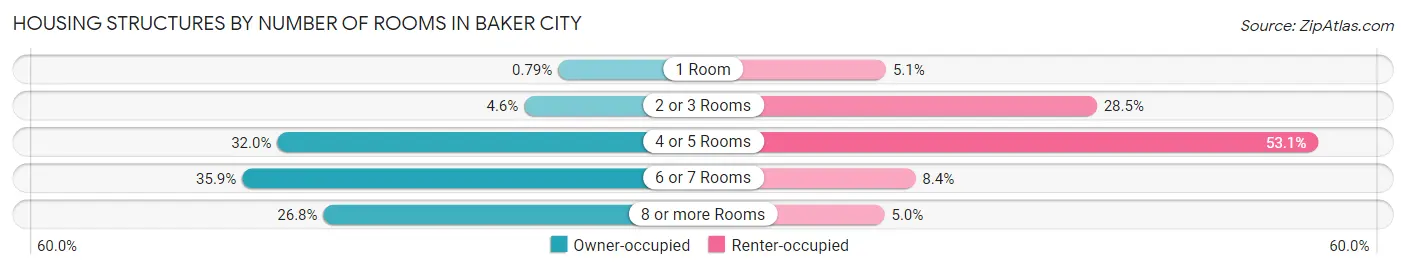
| Number of Rooms | Owner-occupied | Renter-occupied |
| 1 Room | 24 (0.8%) | 61 (5.1%) |
| 2 or 3 Rooms | 139 (4.6%) | 340 (28.5%) |
| 4 or 5 Rooms | 975 (32.0%) | 633 (53.1%) |
| 6 or 7 Rooms | 1,094 (35.9%) | 100 (8.4%) |
| 8 or more Rooms | 819 (26.8%) | 59 (5.0%) |
| Total | 3,051 (100.0%) | 1,193 (100.0%) |
Housing Structure by Heating Type in Baker City
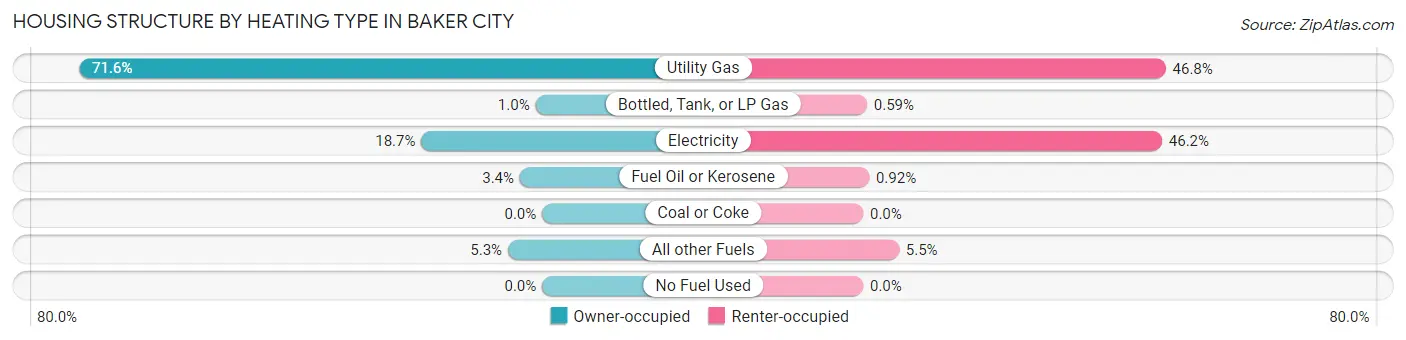
| Heating Type | Owner-occupied | Renter-occupied |
| Utility Gas | 2,184 (71.6%) | 558 (46.8%) |
| Bottled, Tank, or LP Gas | 31 (1.0%) | 7 (0.6%) |
| Electricity | 570 (18.7%) | 551 (46.2%) |
| Fuel Oil or Kerosene | 105 (3.4%) | 11 (0.9%) |
| Coal or Coke | 0 (0.0%) | 0 (0.0%) |
| All other Fuels | 161 (5.3%) | 66 (5.5%) |
| No Fuel Used | 0 (0.0%) | 0 (0.0%) |
| Total | 3,051 (100.0%) | 1,193 (100.0%) |
Household Vehicle Usage in Baker City
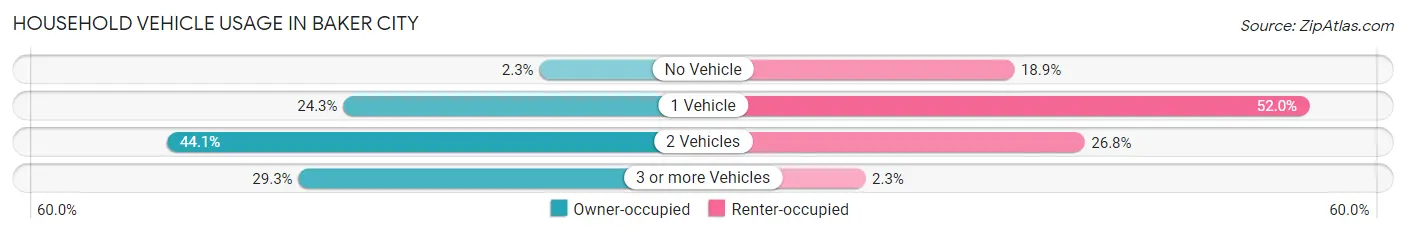
| Vehicles per Household | Owner-occupied | Renter-occupied |
| No Vehicle | 71 (2.3%) | 226 (18.9%) |
| 1 Vehicle | 741 (24.3%) | 620 (52.0%) |
| 2 Vehicles | 1,344 (44.1%) | 320 (26.8%) |
| 3 or more Vehicles | 895 (29.3%) | 27 (2.3%) |
| Total | 3,051 (100.0%) | 1,193 (100.0%) |
Real Estate & Mortgages in Baker City
Real Estate and Mortgage Overview in Baker City
| Characteristic | Without Mortgage | With Mortgage |
| Housing Units | 1,351 | 1,700 |
| Median Property Value | $185,700 | $220,200 |
| Median Household Income | $48,685 | $252 |
| Monthly Housing Costs | $472 | $61 |
| Real Estate Taxes | $2,044 | $8 |
Property Value by Mortgage Status in Baker City
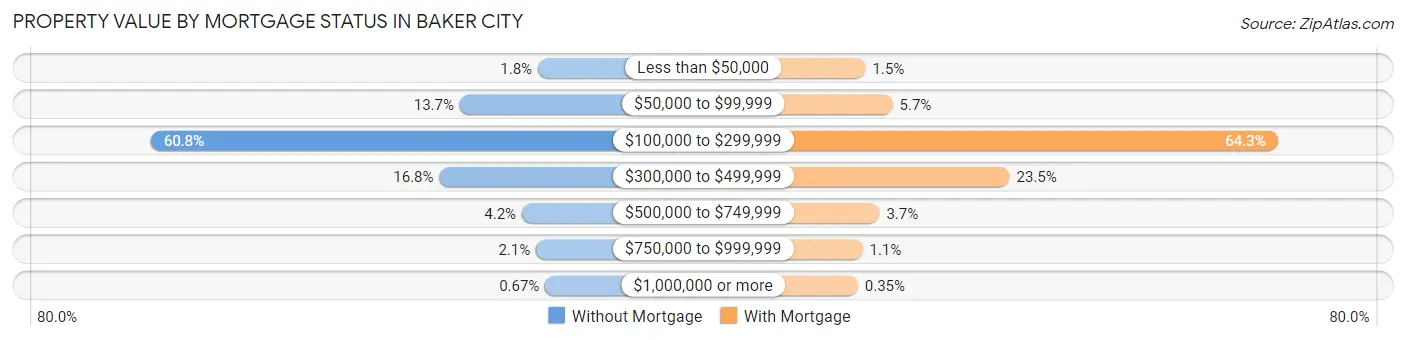
| Property Value | Without Mortgage | With Mortgage |
| Less than $50,000 | 24 (1.8%) | 26 (1.5%) |
| $50,000 to $99,999 | 185 (13.7%) | 96 (5.7%) |
| $100,000 to $299,999 | 821 (60.8%) | 1,093 (64.3%) |
| $300,000 to $499,999 | 227 (16.8%) | 399 (23.5%) |
| $500,000 to $749,999 | 57 (4.2%) | 62 (3.6%) |
| $750,000 to $999,999 | 28 (2.1%) | 18 (1.1%) |
| $1,000,000 or more | 9 (0.7%) | 6 (0.4%) |
| Total | 1,351 (100.0%) | 1,700 (100.0%) |
Household Income by Mortgage Status in Baker City
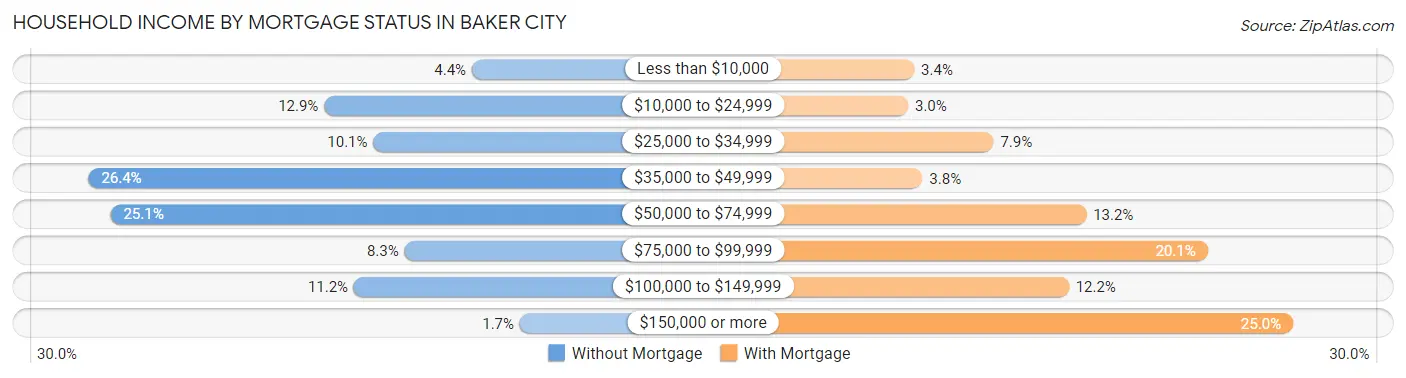
| Household Income | Without Mortgage | With Mortgage |
| Less than $10,000 | 60 (4.4%) | 57 (3.4%) |
| $10,000 to $24,999 | 174 (12.9%) | 51 (3.0%) |
| $25,000 to $34,999 | 136 (10.1%) | 134 (7.9%) |
| $35,000 to $49,999 | 356 (26.4%) | 65 (3.8%) |
| $50,000 to $74,999 | 339 (25.1%) | 224 (13.2%) |
| $75,000 to $99,999 | 112 (8.3%) | 342 (20.1%) |
| $100,000 to $149,999 | 151 (11.2%) | 207 (12.2%) |
| $150,000 or more | 23 (1.7%) | 425 (25.0%) |
| Total | 1,351 (100.0%) | 1,700 (100.0%) |
Property Value to Household Income Ratio in Baker City
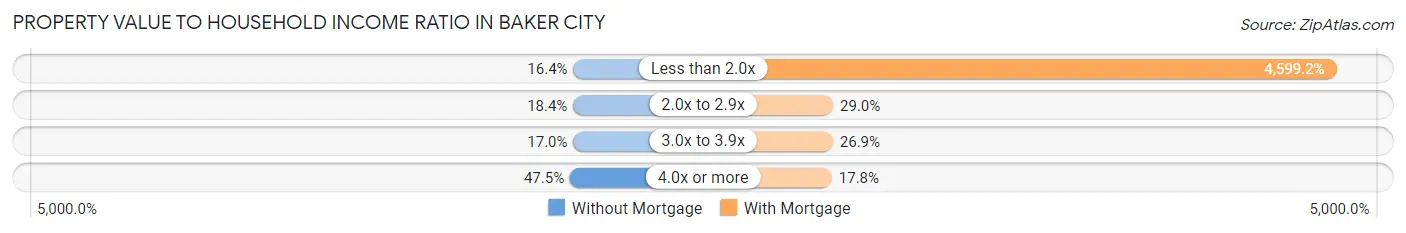
| Value-to-Income Ratio | Without Mortgage | With Mortgage |
| Less than 2.0x | 221 (16.4%) | 78,186 (4,599.2%) |
| 2.0x to 2.9x | 249 (18.4%) | 493 (29.0%) |
| 3.0x to 3.9x | 230 (17.0%) | 457 (26.9%) |
| 4.0x or more | 642 (47.5%) | 302 (17.8%) |
| Total | 1,351 (100.0%) | 1,700 (100.0%) |
Real Estate Taxes by Mortgage Status in Baker City
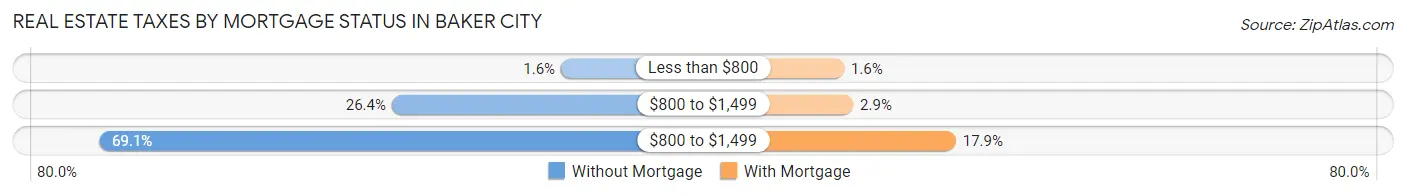
| Property Taxes | Without Mortgage | With Mortgage |
| Less than $800 | 22 (1.6%) | 27 (1.6%) |
| $800 to $1,499 | 356 (26.4%) | 50 (2.9%) |
| $800 to $1,499 | 934 (69.1%) | 305 (17.9%) |
| Total | 1,351 (100.0%) | 1,700 (100.0%) |
Health & Disability in Baker City
Health Insurance Coverage by Age in Baker City
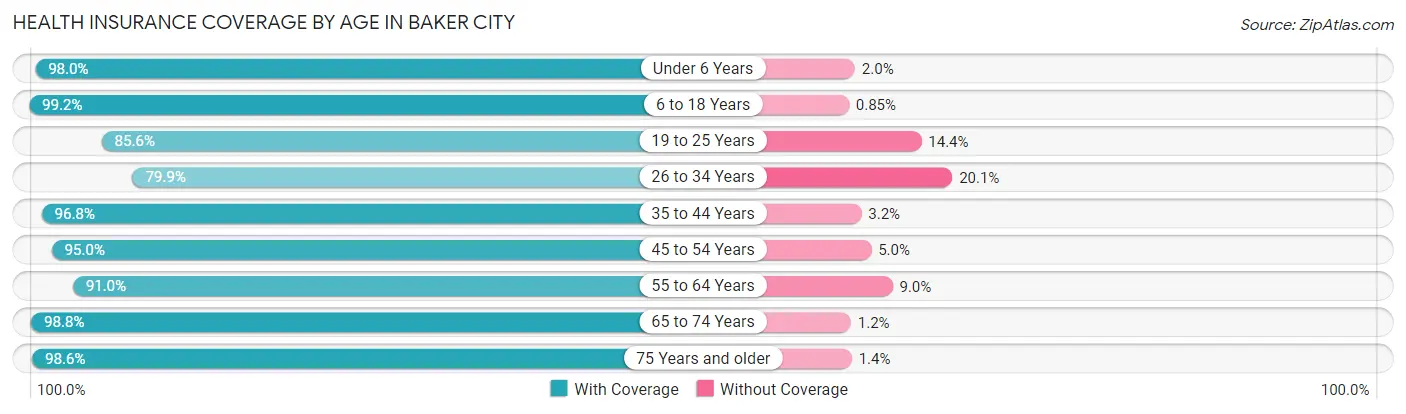
| Age Bracket | With Coverage | Without Coverage |
| Under 6 Years | 644 (98.0%) | 13 (2.0%) |
| 6 to 18 Years | 1,511 (99.2%) | 13 (0.9%) |
| 19 to 25 Years | 566 (85.6%) | 95 (14.4%) |
| 26 to 34 Years | 790 (79.9%) | 199 (20.1%) |
| 35 to 44 Years | 1,066 (96.8%) | 35 (3.2%) |
| 45 to 54 Years | 1,040 (95.0%) | 55 (5.0%) |
| 55 to 64 Years | 1,104 (91.0%) | 109 (9.0%) |
| 65 to 74 Years | 1,210 (98.8%) | 15 (1.2%) |
| 75 Years and older | 1,203 (98.6%) | 17 (1.4%) |
| Total | 9,134 (94.3%) | 551 (5.7%) |
Health Insurance Coverage by Citizenship Status in Baker City
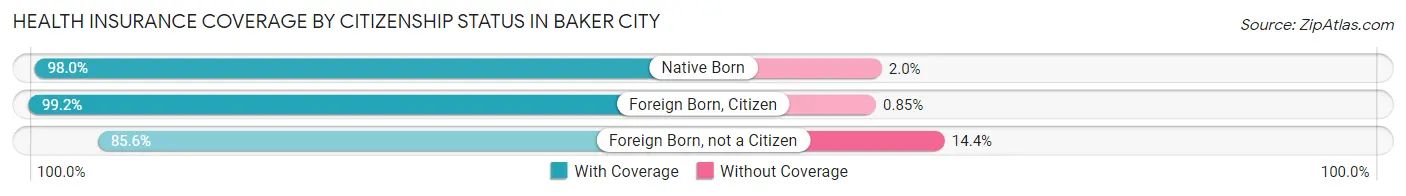
| Citizenship Status | With Coverage | Without Coverage |
| Native Born | 644 (98.0%) | 13 (2.0%) |
| Foreign Born, Citizen | 1,511 (99.2%) | 13 (0.9%) |
| Foreign Born, not a Citizen | 566 (85.6%) | 95 (14.4%) |
Health Insurance Coverage by Household Income in Baker City
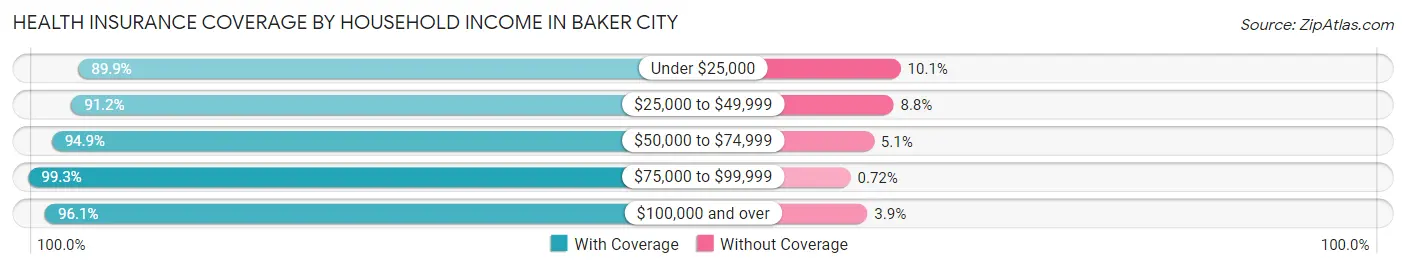
| Household Income | With Coverage | Without Coverage |
| Under $25,000 | 1,141 (89.9%) | 128 (10.1%) |
| $25,000 to $49,999 | 1,958 (91.2%) | 188 (8.8%) |
| $50,000 to $74,999 | 2,132 (94.9%) | 114 (5.1%) |
| $75,000 to $99,999 | 962 (99.3%) | 7 (0.7%) |
| $100,000 and over | 2,837 (96.1%) | 114 (3.9%) |
Public vs Private Health Insurance Coverage by Age in Baker City
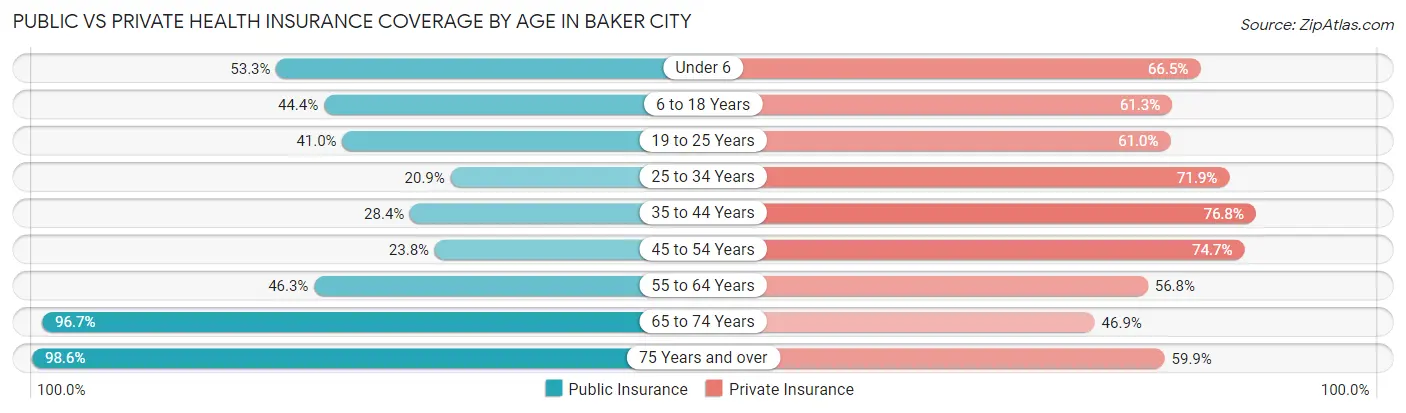
| Age Bracket | Public Insurance | Private Insurance |
| Under 6 | 350 (53.3%) | 437 (66.5%) |
| 6 to 18 Years | 677 (44.4%) | 934 (61.3%) |
| 19 to 25 Years | 271 (41.0%) | 403 (61.0%) |
| 25 to 34 Years | 207 (20.9%) | 711 (71.9%) |
| 35 to 44 Years | 313 (28.4%) | 846 (76.8%) |
| 45 to 54 Years | 261 (23.8%) | 818 (74.7%) |
| 55 to 64 Years | 561 (46.3%) | 689 (56.8%) |
| 65 to 74 Years | 1,185 (96.7%) | 575 (46.9%) |
| 75 Years and over | 1,203 (98.6%) | 731 (59.9%) |
| Total | 5,028 (51.9%) | 6,144 (63.4%) |
Disability Status by Sex by Age in Baker City
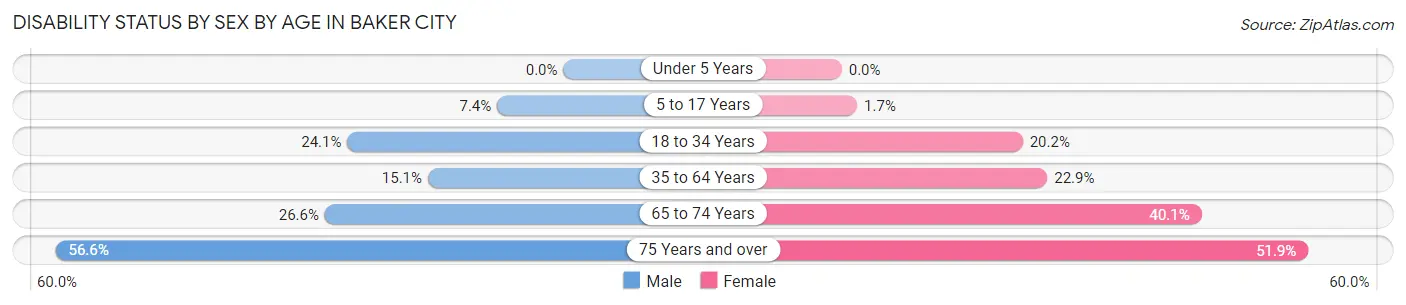
| Age Bracket | Male | Female |
| Under 5 Years | 0 (0.0%) | 0 (0.0%) |
| 5 to 17 Years | 57 (7.4%) | 13 (1.7%) |
| 18 to 34 Years | 225 (24.1%) | 161 (20.2%) |
| 35 to 64 Years | 252 (15.1%) | 398 (22.9%) |
| 65 to 74 Years | 161 (26.6%) | 248 (40.1%) |
| 75 Years and over | 311 (56.6%) | 348 (51.9%) |
Disability Class by Sex by Age in Baker City
Disability Class: Hearing Difficulty
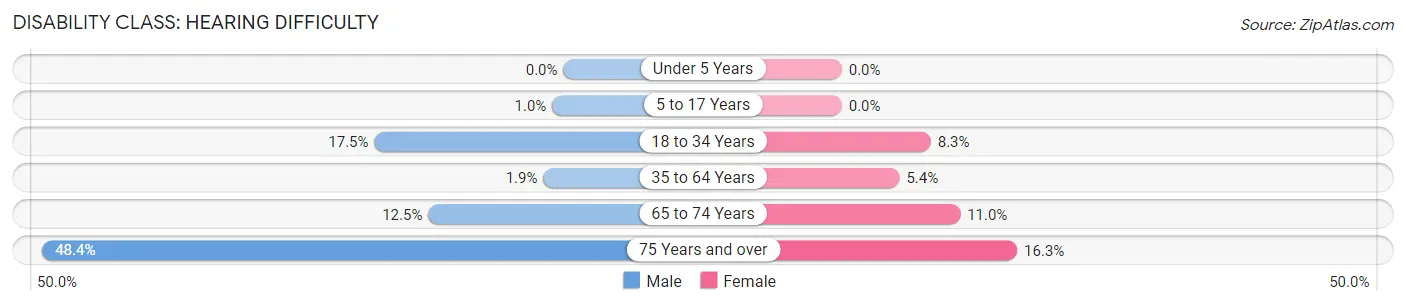
| Age Bracket | Male | Female |
| Under 5 Years | 0 (0.0%) | 0 (0.0%) |
| 5 to 17 Years | 8 (1.0%) | 0 (0.0%) |
| 18 to 34 Years | 164 (17.5%) | 66 (8.3%) |
| 35 to 64 Years | 31 (1.9%) | 93 (5.3%) |
| 65 to 74 Years | 76 (12.5%) | 68 (11.0%) |
| 75 Years and over | 266 (48.4%) | 109 (16.3%) |
Disability Class: Vision Difficulty
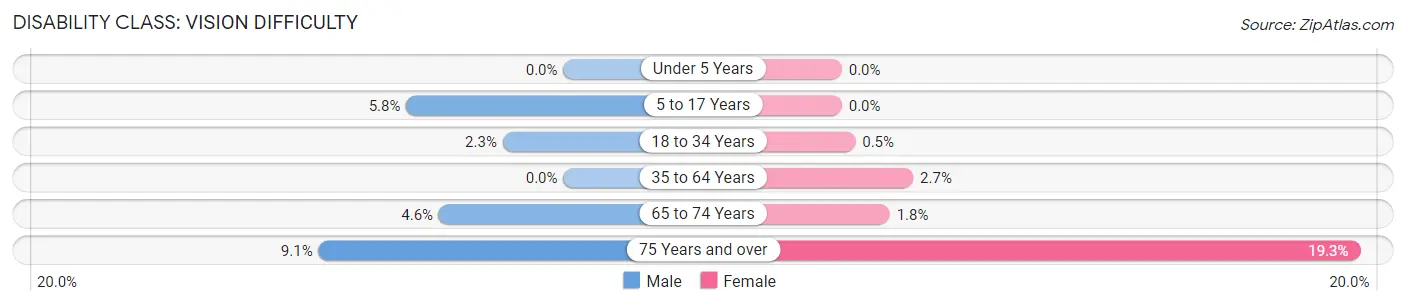
| Age Bracket | Male | Female |
| Under 5 Years | 0 (0.0%) | 0 (0.0%) |
| 5 to 17 Years | 45 (5.8%) | 0 (0.0%) |
| 18 to 34 Years | 21 (2.2%) | 4 (0.5%) |
| 35 to 64 Years | 0 (0.0%) | 46 (2.6%) |
| 65 to 74 Years | 28 (4.6%) | 11 (1.8%) |
| 75 Years and over | 50 (9.1%) | 129 (19.3%) |
Disability Class: Cognitive Difficulty
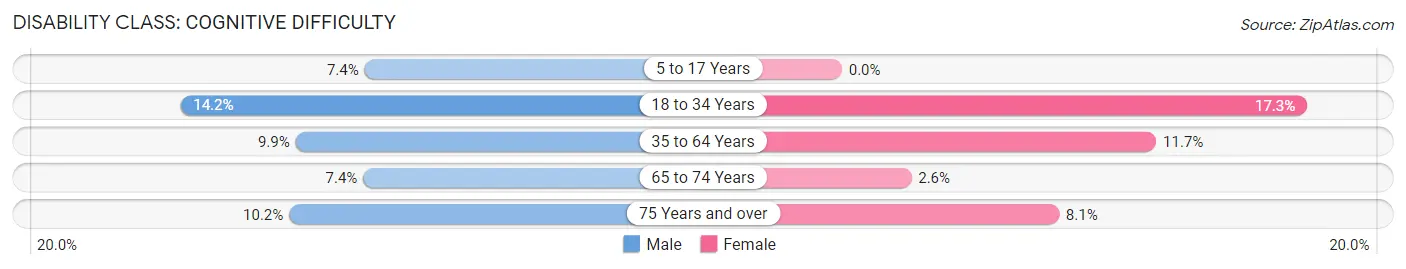
| Age Bracket | Male | Female |
| 5 to 17 Years | 57 (7.4%) | 0 (0.0%) |
| 18 to 34 Years | 133 (14.2%) | 138 (17.3%) |
| 35 to 64 Years | 166 (9.9%) | 203 (11.7%) |
| 65 to 74 Years | 45 (7.4%) | 16 (2.6%) |
| 75 Years and over | 56 (10.2%) | 54 (8.1%) |
Disability Class: Ambulatory Difficulty
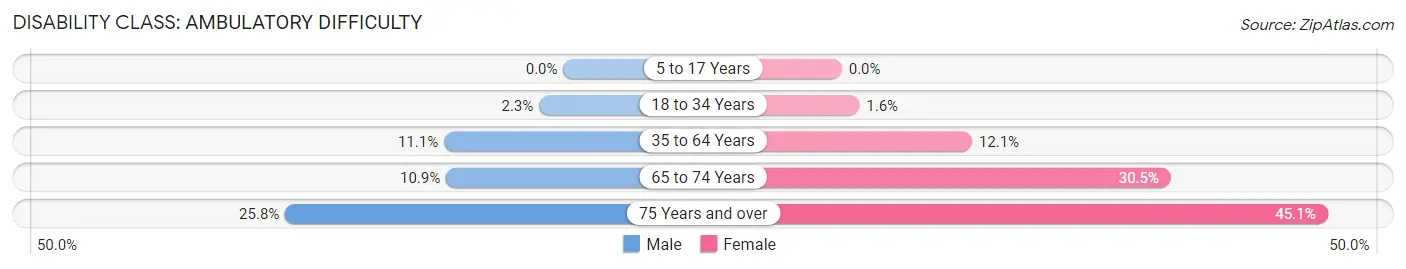
| Age Bracket | Male | Female |
| 5 to 17 Years | 0 (0.0%) | 0 (0.0%) |
| 18 to 34 Years | 21 (2.2%) | 13 (1.6%) |
| 35 to 64 Years | 185 (11.1%) | 210 (12.1%) |
| 65 to 74 Years | 66 (10.9%) | 189 (30.5%) |
| 75 Years and over | 142 (25.8%) | 302 (45.1%) |
Disability Class: Self-Care Difficulty
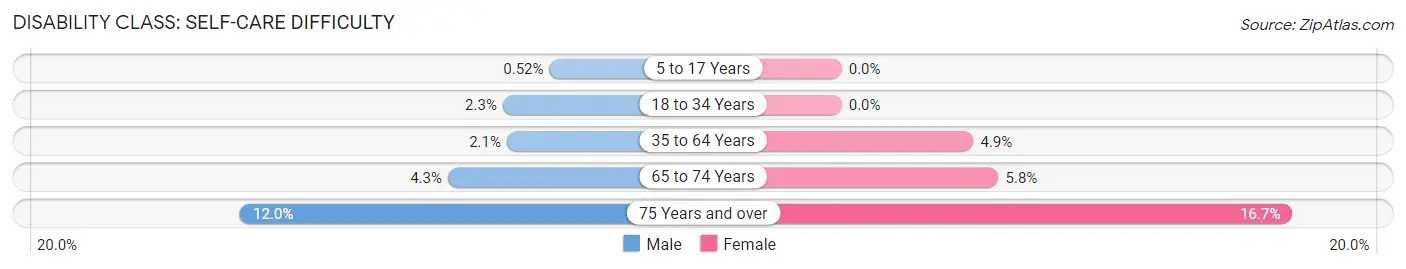
| Age Bracket | Male | Female |
| 5 to 17 Years | 4 (0.5%) | 0 (0.0%) |
| 18 to 34 Years | 21 (2.2%) | 0 (0.0%) |
| 35 to 64 Years | 35 (2.1%) | 85 (4.9%) |
| 65 to 74 Years | 26 (4.3%) | 36 (5.8%) |
| 75 Years and over | 66 (12.0%) | 112 (16.7%) |
Technology Access in Baker City
Computing Device Access in Baker City
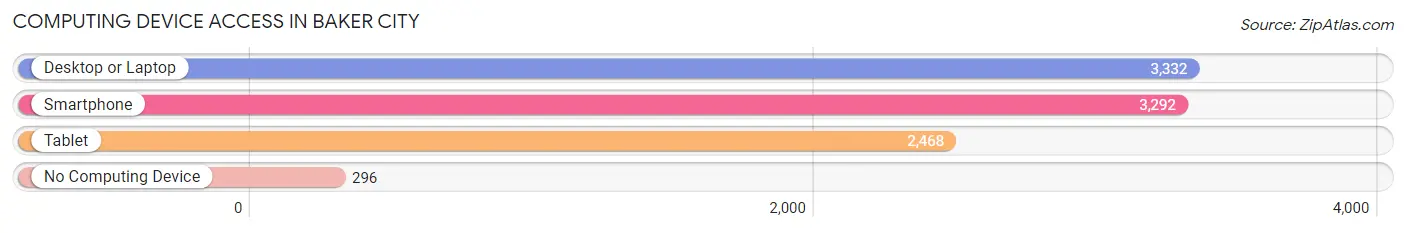
| Device Type | # Households | % Households |
| Desktop or Laptop | 3,332 | 78.5% |
| Smartphone | 3,292 | 77.6% |
| Tablet | 2,468 | 58.2% |
| No Computing Device | 296 | 7.0% |
| Total | 4,244 | 100.0% |
Internet Access in Baker City
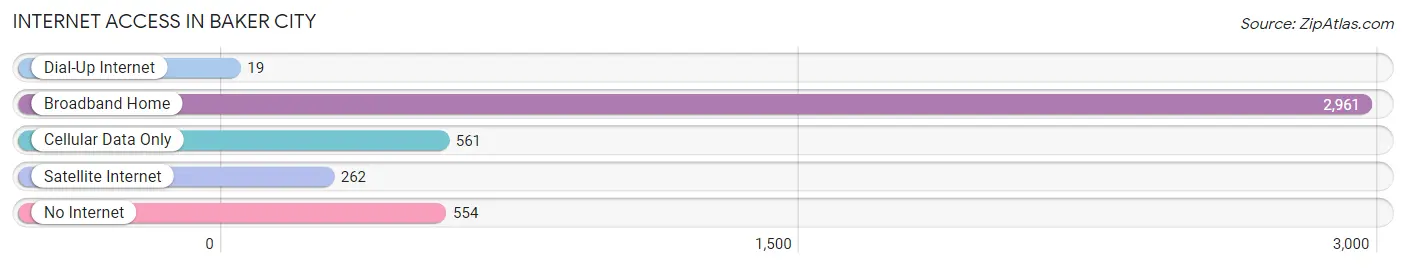
| Internet Type | # Households | % Households |
| Dial-Up Internet | 19 | 0.4% |
| Broadband Home | 2,961 | 69.8% |
| Cellular Data Only | 561 | 13.2% |
| Satellite Internet | 262 | 6.2% |
| No Internet | 554 | 13.1% |
| Total | 4,244 | 100.0% |
Baker City Summary
Baker City is a city located in the state of Oregon, United States. It is the county seat of Baker County and is located in the northeastern corner of the state. The city is situated at the base of the Blue Mountains, and is surrounded by the Wallowa-Whitman National Forest. The city has a population of 10,000 people, and is the largest city in Baker County.
History
The area that is now Baker City was first inhabited by the Native American tribes of the Nez Perce, Umatilla, and Walla Walla. The first European settlers arrived in the area in the early 1860s, and the city was officially founded in 1874. The city was named after Edward D. Baker, a U.S. Senator from Oregon who was killed in the Civil War.
The city quickly grew in the late 19th century, and by the early 20th century, it had become a major center for the mining and timber industries. The city was also home to several large flour mills, and was a major hub for the Oregon Short Line Railroad.
In the late 20th century, the city began to diversify its economy, and today it is home to a variety of industries, including manufacturing, healthcare, and tourism.
Geography
Baker City is located in the northeastern corner of Oregon, at the base of the Blue Mountains. The city is situated at an elevation of 3,000 feet, and is surrounded by the Wallowa-Whitman National Forest. The city is located at the confluence of the Powder and Burnt Rivers, and is approximately 100 miles east of the state capital, Salem.
The city has a total area of 8.3 square miles, and is located in a semi-arid climate zone. The average annual temperature is 50 degrees Fahrenheit, and the average annual precipitation is 12 inches.
Economy
Baker City’s economy is largely based on the service sector, with healthcare, retail, and tourism being the largest industries. The city is also home to several manufacturing companies, including a large aluminum smelter.
The city is also home to several large employers, including St. Alphonsus Medical Center, the Baker County School District, and the U.S. Forest Service.
Demographics
As of the 2010 census, the population of Baker City was 10,000 people. The racial makeup of the city was 90.2% White, 0.7% African American, 0.7% Native American, 0.7% Asian, 0.2% Pacific Islander, and 6.2% from other races. The median household income was $37,000, and the median family income was $45,000.
The city is home to a variety of religious denominations, including Catholic, Protestant, and Mormon. The city is also home to a large number of immigrants, with the largest groups being from Mexico, El Salvador, and Guatemala.
Conclusion
Baker City is a city located in the northeastern corner of Oregon, United States. It is the county seat of Baker County and is home to a population of 10,000 people. The city is situated at the base of the Blue Mountains, and is surrounded by the Wallowa-Whitman National Forest. The city’s economy is largely based on the service sector, with healthcare, retail, and tourism being the largest industries. The city is also home to a variety of religious denominations, and a large number of immigrants.
Common Questions
What is Per Capita Income in Baker City?
Per Capita income in Baker City is $31,677.
What is the Median Family Income in Baker City?
Median Family Income in Baker City is $65,911.
What is the Median Household income in Baker City?
Median Household Income in Baker City is $54,063.
What is Income or Wage Gap in Baker City?
Income or Wage Gap in Baker City is 45.6%.
Women in Baker City earn 54.4 cents for every dollar earned by a man.
What is Family Income Deficit in Baker City?
Family Income Deficit in Baker City is $9,378.
Families that are below poverty line in Baker City earn $9,378 less on average than the poverty threshold level.
What is Inequality or Gini Index in Baker City?
Inequality or Gini Index in Baker City is 0.45.
What is the Total Population of Baker City?
Total Population of Baker City is 10,110.
What is the Total Male Population of Baker City?
Total Male Population of Baker City is 5,275.
What is the Total Female Population of Baker City?
Total Female Population of Baker City is 4,835.
What is the Ratio of Males per 100 Females in Baker City?
There are 109.10 Males per 100 Females in Baker City.
What is the Ratio of Females per 100 Males in Baker City?
There are 91.66 Females per 100 Males in Baker City.
What is the Median Population Age in Baker City?
Median Population Age in Baker City is 44.0 Years.
What is the Average Family Size in Baker City
Average Family Size in Baker City is 3.0 People.
What is the Average Household Size in Baker City
Average Household Size in Baker City is 2.3 People.
How Large is the Labor Force in Baker City?
There are 4,277 People in the Labor Forcein in Baker City.
What is the Percentage of People in the Labor Force in Baker City?
51.7% of People are in the Labor Force in Baker City.
What is the Unemployment Rate in Baker City?
Unemployment Rate in Baker City is 5.8%.