Cities with the Highest Percentage of Cherokee Population in Oregon
RELATED REPORTS & OPTIONS
Cherokee
Oregon
Compare Cities
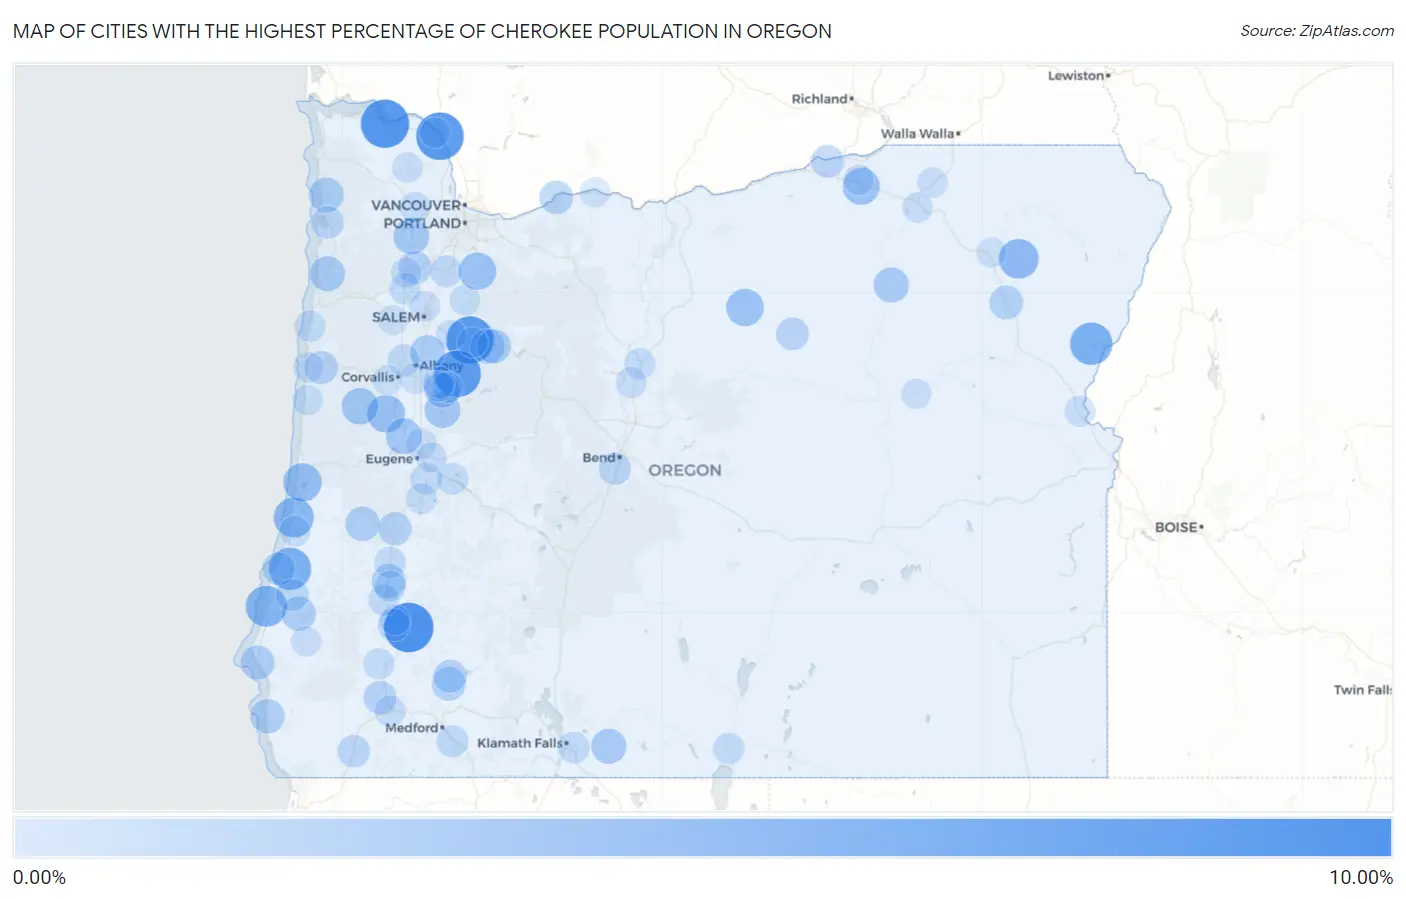
Map of Cities with the Highest Percentage of Cherokee Population in Oregon
0.00%
10.00%
Cities with the Highest Percentage of Cherokee Population in Oregon
| City | Cherokee | vs State | vs National | |
| 1. | Days Creek | 9.20% | 0.55%(+8.65)#1 | 0.35%(+8.85)#408 |
| 2. | Westport | 8.72% | 0.55%(+8.17)#2 | 0.35%(+8.37)#427 |
| 3. | Prescott | 8.33% | 0.55%(+7.78)#3 | 0.35%(+7.99)#447 |
| 4. | Mehama | 8.24% | 0.55%(+7.69)#4 | 0.35%(+7.89)#452 |
| 5. | Lacomb | 8.03% | 0.55%(+7.48)#5 | 0.35%(+7.68)#461 |
| 6. | Bunker Hill | 6.04% | 0.55%(+5.49)#6 | 0.35%(+5.69)#610 |
| 7. | Richland | 6.03% | 0.55%(+5.48)#7 | 0.35%(+5.68)#612 |
| 8. | Bandon | 5.52% | 0.55%(+4.97)#8 | 0.35%(+5.17)#659 |
| 9. | Winchester Bay | 5.06% | 0.55%(+4.51)#9 | 0.35%(+4.72)#725 |
| 10. | Cove | 4.88% | 0.55%(+4.33)#10 | 0.35%(+4.53)#755 |
| 11. | Dunes City | 4.33% | 0.55%(+3.78)#11 | 0.35%(+3.99)#841 |
| 12. | Cheshire | 4.14% | 0.55%(+3.59)#12 | 0.35%(+3.79)#877 |
| 13. | Alpine | 4.10% | 0.55%(+3.55)#13 | 0.35%(+3.75)#892 |
| 14. | Mulino | 3.95% | 0.55%(+3.40)#14 | 0.35%(+3.60)#922 |
| 15. | Fossil | 3.92% | 0.55%(+3.37)#15 | 0.35%(+3.57)#936 |
| 16. | Echo | 3.77% | 0.55%(+3.22)#16 | 0.35%(+3.42)#975 |
| 17. | Alsea | 3.60% | 0.55%(+3.05)#17 | 0.35%(+3.25)#1,016 |
| 18. | Junction City | 3.34% | 0.55%(+2.79)#18 | 0.35%(+2.99)#1,083 |
| 19. | Gaston | 3.24% | 0.55%(+2.69)#19 | 0.35%(+2.89)#1,126 |
| 20. | Crawfordsville | 3.24% | 0.55%(+2.69)#20 | 0.35%(+2.89)#1,128 |
| 21. | Mapleton | 3.12% | 0.55%(+2.57)#21 | 0.35%(+2.77)#1,179 |
| 22. | Sodaville | 3.02% | 0.55%(+2.47)#22 | 0.35%(+2.67)#1,224 |
| 23. | Ukiah | 3.02% | 0.55%(+2.47)#23 | 0.35%(+2.67)#1,227 |
| 24. | Cloverdale | 2.98% | 0.55%(+2.43)#24 | 0.35%(+2.63)#1,243 |
| 25. | Bonanza | 2.94% | 0.55%(+2.39)#25 | 0.35%(+2.59)#1,255 |
| 26. | Jefferson | 2.86% | 0.55%(+2.31)#26 | 0.35%(+2.51)#1,289 |
| 27. | Wheeler | 2.80% | 0.55%(+2.25)#27 | 0.35%(+2.45)#1,326 |
| 28. | Elkton | 2.74% | 0.55%(+2.19)#28 | 0.35%(+2.39)#1,361 |
| 29. | Mill City | 2.73% | 0.55%(+2.18)#29 | 0.35%(+2.38)#1,367 |
| 30. | Myrtle Point | 2.68% | 0.55%(+2.13)#30 | 0.35%(+2.33)#1,391 |
| 31. | Gates | 2.66% | 0.55%(+2.11)#31 | 0.35%(+2.31)#1,399 |
| 32. | Gold Beach | 2.61% | 0.55%(+2.06)#32 | 0.35%(+2.26)#1,414 |
| 33. | Roseburg North | 2.57% | 0.55%(+2.02)#33 | 0.35%(+2.22)#1,435 |
| 34. | Port Orford | 2.56% | 0.55%(+2.01)#34 | 0.35%(+2.22)#1,438 |
| 35. | Shady Cove | 2.50% | 0.55%(+1.95)#35 | 0.35%(+2.15)#1,472 |
| 36. | North Powder | 2.43% | 0.55%(+1.88)#36 | 0.35%(+2.08)#1,510 |
| 37. | Cascade Locks | 2.33% | 0.55%(+1.78)#37 | 0.35%(+1.98)#1,587 |
| 38. | Lafayette | 2.28% | 0.55%(+1.73)#38 | 0.35%(+1.93)#1,616 |
| 39. | Yoncalla | 2.26% | 0.55%(+1.71)#39 | 0.35%(+1.92)#1,627 |
| 40. | Toledo | 2.20% | 0.55%(+1.65)#40 | 0.35%(+1.85)#1,661 |
| 41. | Trail | 2.17% | 0.55%(+1.62)#41 | 0.35%(+1.83)#1,677 |
| 42. | Merlin | 2.15% | 0.55%(+1.60)#42 | 0.35%(+1.80)#1,697 |
| 43. | Spray | 2.01% | 0.55%(+1.46)#43 | 0.35%(+1.66)#1,810 |
| 44. | Irrigon | 1.98% | 0.55%(+1.43)#44 | 0.35%(+1.63)#1,842 |
| 45. | Barview | 1.97% | 0.55%(+1.42)#45 | 0.35%(+1.62)#1,849 |
| 46. | Bay City | 1.93% | 0.55%(+1.38)#46 | 0.35%(+1.59)#1,887 |
| 47. | Coquille | 1.90% | 0.55%(+1.35)#47 | 0.35%(+1.55)#1,926 |
| 48. | Cave Junction | 1.88% | 0.55%(+1.34)#48 | 0.35%(+1.54)#1,938 |
| 49. | Deschutes River Woods | 1.84% | 0.55%(+1.29)#49 | 0.35%(+1.49)#1,978 |
| 50. | Tri City | 1.81% | 0.55%(+1.26)#50 | 0.35%(+1.46)#2,014 |
| 51. | Svensen | 1.72% | 0.55%(+1.17)#51 | 0.35%(+1.38)#2,092 |
| 52. | Falcon Heights | 1.71% | 0.55%(+1.16)#52 | 0.35%(+1.36)#2,119 |
| 53. | Lebanon | 1.66% | 0.55%(+1.11)#53 | 0.35%(+1.31)#2,179 |
| 54. | Donald | 1.65% | 0.55%(+1.10)#54 | 0.35%(+1.30)#2,194 |
| 55. | Talent | 1.65% | 0.55%(+1.10)#55 | 0.35%(+1.30)#2,201 |
| 56. | Adair Village | 1.60% | 0.55%(+1.05)#56 | 0.35%(+1.26)#2,254 |
| 57. | Prineville Lake Acres | 1.58% | 0.55%(+1.03)#57 | 0.35%(+1.23)#2,284 |
| 58. | Altamont | 1.52% | 0.55%(+0.974)#58 | 0.35%(+1.18)#2,363 |
| 59. | Sutherlin | 1.50% | 0.55%(+0.954)#59 | 0.35%(+1.16)#2,392 |
| 60. | Creswell | 1.50% | 0.55%(+0.948)#60 | 0.35%(+1.15)#2,401 |
| 61. | Lowell | 1.49% | 0.55%(+0.937)#61 | 0.35%(+1.14)#2,421 |
| 62. | Green | 1.48% | 0.55%(+0.935)#62 | 0.35%(+1.14)#2,426 |
| 63. | Roseburg | 1.48% | 0.55%(+0.930)#63 | 0.35%(+1.13)#2,436 |
| 64. | Lakeview | 1.46% | 0.55%(+0.909)#64 | 0.35%(+1.11)#2,466 |
| 65. | Amity | 1.42% | 0.55%(+0.868)#65 | 0.35%(+1.07)#2,517 |
| 66. | Madras | 1.33% | 0.55%(+0.785)#66 | 0.35%(+0.987)#2,660 |
| 67. | Lincoln Beach | 1.33% | 0.55%(+0.782)#67 | 0.35%(+0.984)#2,673 |
| 68. | Glendale | 1.33% | 0.55%(+0.780)#68 | 0.35%(+0.983)#2,674 |
| 69. | Banks | 1.32% | 0.55%(+0.769)#69 | 0.35%(+0.971)#2,691 |
| 70. | Cottage Grove | 1.28% | 0.55%(+0.726)#70 | 0.35%(+0.928)#2,756 |
| 71. | Grants Pass | 1.27% | 0.55%(+0.720)#71 | 0.35%(+0.923)#2,770 |
| 72. | Waterloo | 1.26% | 0.55%(+0.711)#72 | 0.35%(+0.913)#2,786 |
| 73. | Saunders Lake | 1.25% | 0.55%(+0.696)#73 | 0.35%(+0.898)#2,817 |
| 74. | Culver | 1.24% | 0.55%(+0.693)#74 | 0.35%(+0.895)#2,827 |
| 75. | Lakeside | 1.20% | 0.55%(+0.647)#75 | 0.35%(+0.849)#2,917 |
| 76. | Scotts Mills | 1.18% | 0.55%(+0.635)#76 | 0.35%(+0.837)#2,946 |
| 77. | Huntington | 1.17% | 0.55%(+0.623)#77 | 0.35%(+0.826)#2,970 |
| 78. | Sublimity | 1.15% | 0.55%(+0.605)#78 | 0.35%(+0.807)#3,001 |
| 79. | Waldport | 1.13% | 0.55%(+0.579)#79 | 0.35%(+0.781)#3,053 |
| 80. | Keizer | 1.12% | 0.55%(+0.567)#80 | 0.35%(+0.770)#3,081 |
| 81. | Newport | 1.10% | 0.55%(+0.555)#81 | 0.35%(+0.757)#3,110 |
| 82. | Rainier | 1.09% | 0.55%(+0.545)#82 | 0.35%(+0.747)#3,132 |
| 83. | Myrtle Creek | 1.06% | 0.55%(+0.511)#83 | 0.35%(+0.713)#3,210 |
| 84. | Powers | 1.06% | 0.55%(+0.509)#84 | 0.35%(+0.711)#3,217 |
| 85. | Boring | 1.06% | 0.55%(+0.507)#85 | 0.35%(+0.709)#3,219 |
| 86. | Mcminnville | 1.05% | 0.55%(+0.505)#86 | 0.35%(+0.707)#3,228 |
| 87. | Coburg | 1.04% | 0.55%(+0.490)#87 | 0.35%(+0.692)#3,271 |
| 88. | Stanfield | 1.03% | 0.55%(+0.484)#88 | 0.35%(+0.686)#3,286 |
| 89. | Lyons | 1.02% | 0.55%(+0.472)#89 | 0.35%(+0.674)#3,325 |
| 90. | Adams | 1.02% | 0.55%(+0.471)#90 | 0.35%(+0.673)#3,326 |
| 91. | South Lebanon | 1.01% | 0.55%(+0.465)#91 | 0.35%(+0.667)#3,332 |
| 92. | Tutuilla | 1.01% | 0.55%(+0.463)#92 | 0.35%(+0.665)#3,347 |
| 93. | Springfield | 1.01% | 0.55%(+0.459)#93 | 0.35%(+0.662)#3,355 |
| 94. | Vernonia | 1.01% | 0.55%(+0.457)#94 | 0.35%(+0.659)#3,362 |
| 95. | Tangent | 1.00% | 0.55%(+0.451)#95 | 0.35%(+0.653)#3,379 |
| 96. | Hood River | 0.99% | 0.55%(+0.439)#96 | 0.35%(+0.641)#3,406 |
| 97. | Prairie City | 0.98% | 0.55%(+0.427)#97 | 0.35%(+0.629)#3,437 |
| 98. | Philomath | 0.98% | 0.55%(+0.427)#98 | 0.35%(+0.629)#3,439 |
| 99. | Island City | 0.95% | 0.55%(+0.399)#99 | 0.35%(+0.601)#3,516 |
| 100. | Dallas | 0.93% | 0.55%(+0.383)#100 | 0.35%(+0.585)#3,565 |
Common Questions
What are the Top 10 Cities with the Highest Percentage of Cherokee Population in Oregon?
Top 10 Cities with the Highest Percentage of Cherokee Population in Oregon are:
#1
9.20%
#2
8.72%
#3
8.33%
#4
8.24%
#5
8.03%
#6
6.04%
#7
6.03%
#8
5.52%
#9
5.06%
#10
4.88%
What city has the Highest Percentage of Cherokee Population in Oregon?
Days Creek has the Highest Percentage of Cherokee Population in Oregon with 9.20%.
What is the Percentage of Cherokee Population in the State of Oregon?
Percentage of Cherokee Population in Oregon is 0.55%.
What is the Percentage of Cherokee Population in the United States?
Percentage of Cherokee Population in the United States is 0.35%.