Cottage Grove, OR Map & Demographics
Cottage Grove Map
Cottage Grove Overview
$27,942
PER CAPITA INCOME
$67,326
AVG FAMILY INCOME
$60,219
AVG HOUSEHOLD INCOME
23.8%
WAGE / INCOME GAP [ % ]
76.2¢/ $1
WAGE / INCOME GAP [ $ ]
0.39
INEQUALITY / GINI INDEX
10,583
TOTAL POPULATION
5,593
MALE POPULATION
4,990
FEMALE POPULATION
112.08
MALES / 100 FEMALES
89.22
FEMALES / 100 MALES
38.2
MEDIAN AGE
3.0
AVG FAMILY SIZE
2.5
AVG HOUSEHOLD SIZE
5,303
LABOR FORCE [ PEOPLE ]
62.1%
PERCENT IN LABOR FORCE
6.1%
UNEMPLOYMENT RATE
Cottage Grove Zip Codes
Cottage Grove Area Codes
Income in Cottage Grove
Income Overview in Cottage Grove
Per Capita Income in Cottage Grove is $27,942, while median incomes of families and households are $67,326 and $60,219 respectively.
| Characteristic | Number | Measure |
| Per Capita Income | 10,583 | $27,942 |
| Median Family Income | 2,497 | $67,326 |
| Mean Family Income | 2,497 | $81,296 |
| Median Household Income | 4,210 | $60,219 |
| Mean Household Income | 4,210 | $71,537 |
| Income Deficit | 2,497 | $0 |
| Wage / Income Gap (%) | 10,583 | 23.80% |
| Wage / Income Gap ($) | 10,583 | 76.20¢ per $1 |
| Gini / Inequality Index | 10,583 | 0.39 |
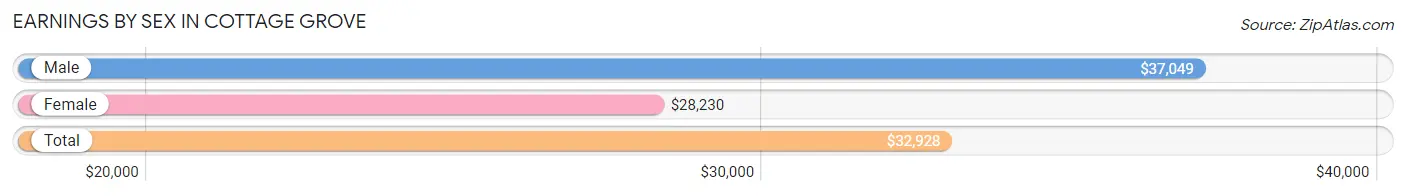
Earnings by Sex in Cottage Grove
Average Earnings in Cottage Grove are $32,928, $37,049 for men and $28,230 for women, a difference of 23.8%.
| Sex | Number | Average Earnings |
| Male | 3,094 (56.4%) | $37,049 |
| Female | 2,390 (43.6%) | $28,230 |
| Total | 5,484 (100.0%) | $32,928 |
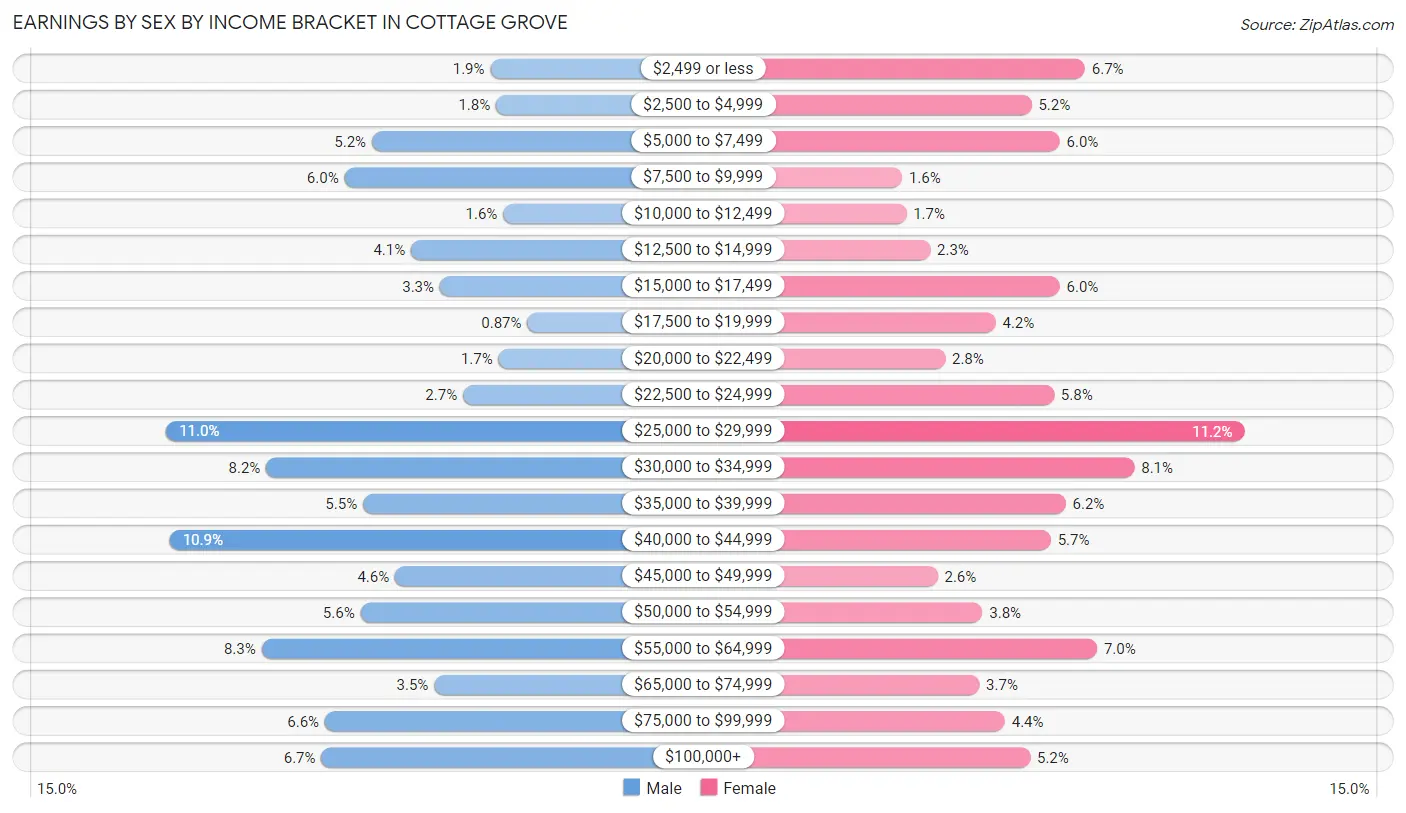
Earnings by Sex by Income Bracket in Cottage Grove
The most common earnings brackets in Cottage Grove are $25,000 to $29,999 for men (341 | 11.0%) and $25,000 to $29,999 for women (267 | 11.2%).
| Income | Male | Female |
| $2,499 or less | 59 (1.9%) | 160 (6.7%) |
| $2,500 to $4,999 | 54 (1.8%) | 124 (5.2%) |
| $5,000 to $7,499 | 162 (5.2%) | 143 (6.0%) |
| $7,500 to $9,999 | 186 (6.0%) | 37 (1.5%) |
| $10,000 to $12,499 | 48 (1.5%) | 40 (1.7%) |
| $12,500 to $14,999 | 128 (4.1%) | 56 (2.3%) |
| $15,000 to $17,499 | 103 (3.3%) | 143 (6.0%) |
| $17,500 to $19,999 | 27 (0.9%) | 100 (4.2%) |
| $20,000 to $22,499 | 52 (1.7%) | 66 (2.8%) |
| $22,500 to $24,999 | 83 (2.7%) | 139 (5.8%) |
| $25,000 to $29,999 | 341 (11.0%) | 267 (11.2%) |
| $30,000 to $34,999 | 254 (8.2%) | 193 (8.1%) |
| $35,000 to $39,999 | 170 (5.5%) | 147 (6.1%) |
| $40,000 to $44,999 | 338 (10.9%) | 137 (5.7%) |
| $45,000 to $49,999 | 142 (4.6%) | 61 (2.5%) |
| $50,000 to $54,999 | 172 (5.6%) | 91 (3.8%) |
| $55,000 to $64,999 | 258 (8.3%) | 168 (7.0%) |
| $65,000 to $74,999 | 108 (3.5%) | 89 (3.7%) |
| $75,000 to $99,999 | 203 (6.6%) | 106 (4.4%) |
| $100,000+ | 206 (6.7%) | 123 (5.1%) |
| Total | 3,094 (100.0%) | 2,390 (100.0%) |
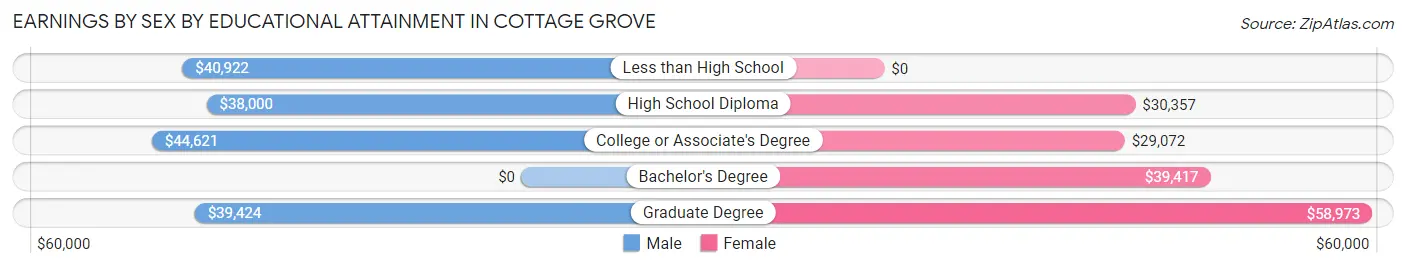
Earnings by Sex by Educational Attainment in Cottage Grove
Average earnings in Cottage Grove are $40,854 for men and $33,812 for women, a difference of 17.2%. Men with an educational attainment of college or associate's degree enjoy the highest average annual earnings of $44,621, while those with high school diploma education earn the least with $38,000. Women with an educational attainment of graduate degree earn the most with the average annual earnings of $58,973, while those with college or associate's degree education have the smallest earnings of $29,072.
| Educational Attainment | Male Income | Female Income |
| Less than High School | $40,922 | $0 |
| High School Diploma | $38,000 | $30,357 |
| College or Associate's Degree | $44,621 | $29,072 |
| Bachelor's Degree | - | - |
| Graduate Degree | $39,424 | $58,973 |
| Total | $40,854 | $33,812 |
Family Income in Cottage Grove
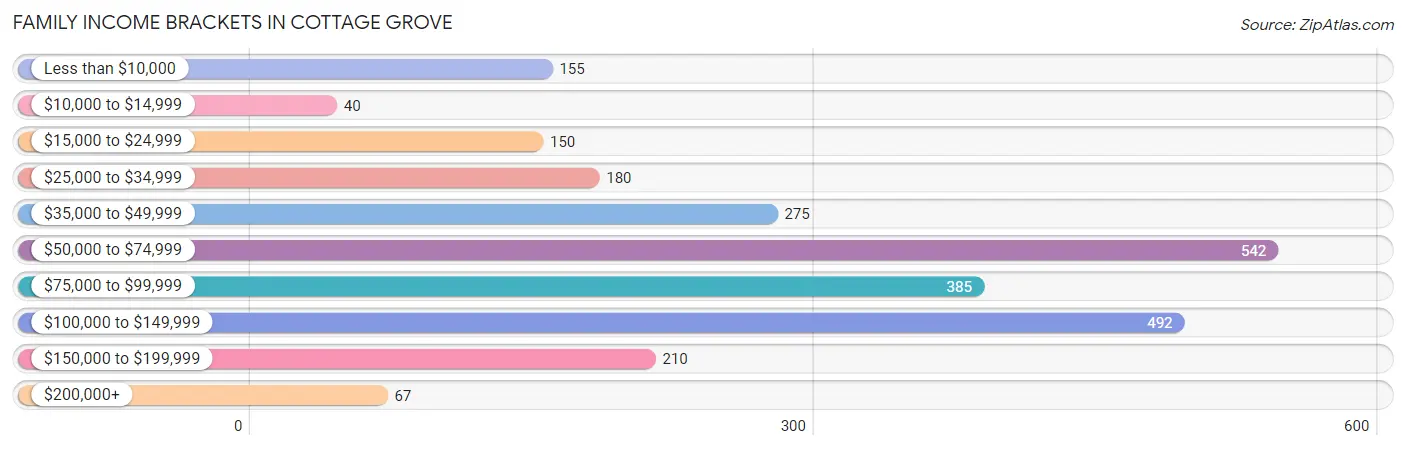
Family Income Brackets in Cottage Grove
According to the Cottage Grove family income data, there are 542 families falling into the $50,000 to $74,999 income range, which is the most common income bracket and makes up 21.7% of all families. Conversely, the $10,000 to $14,999 income bracket is the least frequent group with only 40 families (1.6%) belonging to this category.
| Income Bracket | # Families | % Families |
| Less than $10,000 | 155 | 6.2% |
| $10,000 to $14,999 | 40 | 1.6% |
| $15,000 to $24,999 | 150 | 6.0% |
| $25,000 to $34,999 | 180 | 7.2% |
| $35,000 to $49,999 | 275 | 11.0% |
| $50,000 to $74,999 | 542 | 21.7% |
| $75,000 to $99,999 | 385 | 15.4% |
| $100,000 to $149,999 | 492 | 19.7% |
| $150,000 to $199,999 | 210 | 8.4% |
| $200,000+ | 67 | 2.7% |
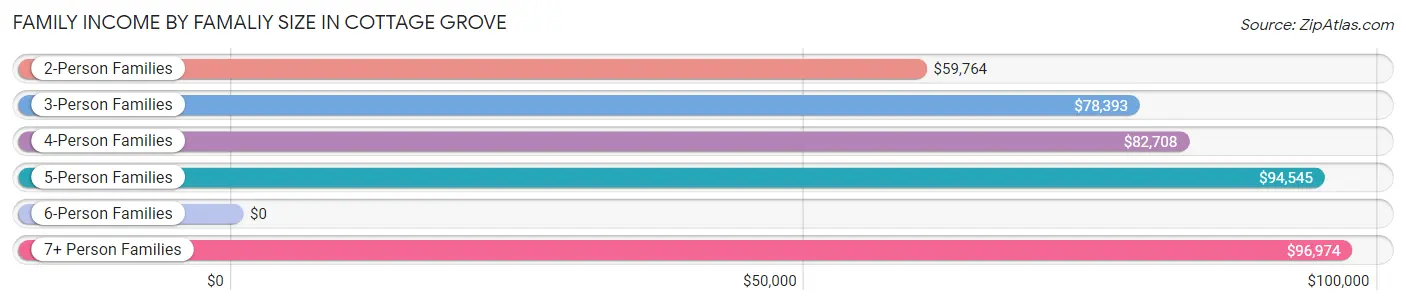
Family Income by Famaliy Size in Cottage Grove
7+ person families (84 | 3.4%) account for the highest median family income in Cottage Grove with $96,974 per family, while 2-person families (1,176 | 47.1%) have the highest median income of $29,882 per family member.
| Income Bracket | # Families | Median Income |
| 2-Person Families | 1,176 (47.1%) | $59,764 |
| 3-Person Families | 627 (25.1%) | $78,393 |
| 4-Person Families | 446 (17.9%) | $82,708 |
| 5-Person Families | 154 (6.2%) | $94,545 |
| 6-Person Families | 10 (0.4%) | $0 |
| 7+ Person Families | 84 (3.4%) | $96,974 |
| Total | 2,497 (100.0%) | $67,326 |
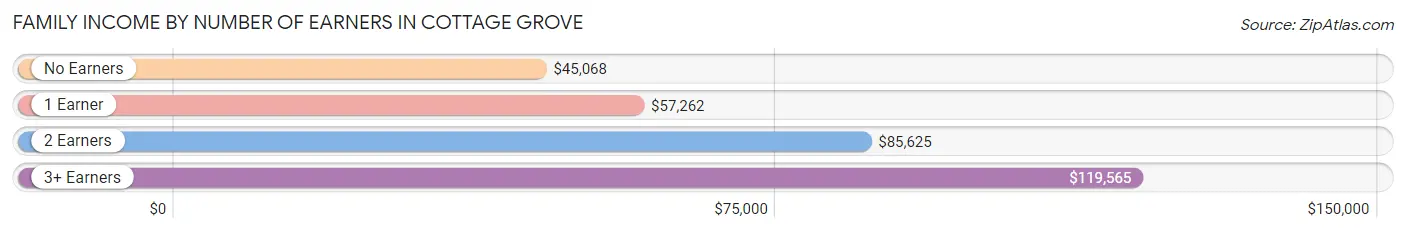
Family Income by Number of Earners in Cottage Grove
The median family income in Cottage Grove is $67,326, with families comprising 3+ earners (176) having the highest median family income of $119,565, while families with no earners (373) have the lowest median family income of $45,068, accounting for 7.0% and 14.9% of families, respectively.
| Number of Earners | # Families | Median Income |
| No Earners | 373 (14.9%) | $45,068 |
| 1 Earner | 936 (37.5%) | $57,262 |
| 2 Earners | 1,012 (40.5%) | $85,625 |
| 3+ Earners | 176 (7.0%) | $119,565 |
| Total | 2,497 (100.0%) | $67,326 |
Household Income in Cottage Grove
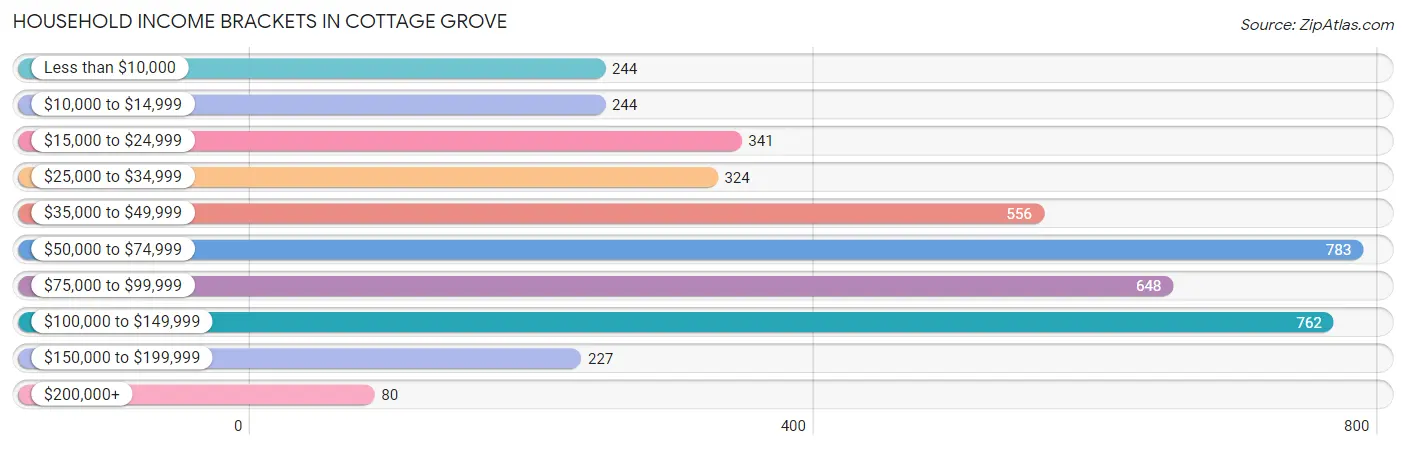
Household Income Brackets in Cottage Grove
With 783 households falling in the category, the $50,000 to $74,999 income range is the most frequent in Cottage Grove, accounting for 18.6% of all households. In contrast, only 80 households (1.9%) fall into the $200,000+ income bracket, making it the least populous group.
| Income Bracket | # Households | % Households |
| Less than $10,000 | 244 | 5.8% |
| $10,000 to $14,999 | 244 | 5.8% |
| $15,000 to $24,999 | 341 | 8.1% |
| $25,000 to $34,999 | 324 | 7.7% |
| $35,000 to $49,999 | 556 | 13.2% |
| $50,000 to $74,999 | 783 | 18.6% |
| $75,000 to $99,999 | 648 | 15.4% |
| $100,000 to $149,999 | 762 | 18.1% |
| $150,000 to $199,999 | 227 | 5.4% |
| $200,000+ | 80 | 1.9% |
Household Income by Householder Age in Cottage Grove
The median household income in Cottage Grove is $60,219, with the highest median household income of $76,229 found in the 15 to 24 years age bracket for the primary householder. A total of 264 households (6.3%) fall into this category. Meanwhile, the 65+ years age bracket for the primary householder has the lowest median household income of $45,410, with 1,145 households (27.2%) in this group.
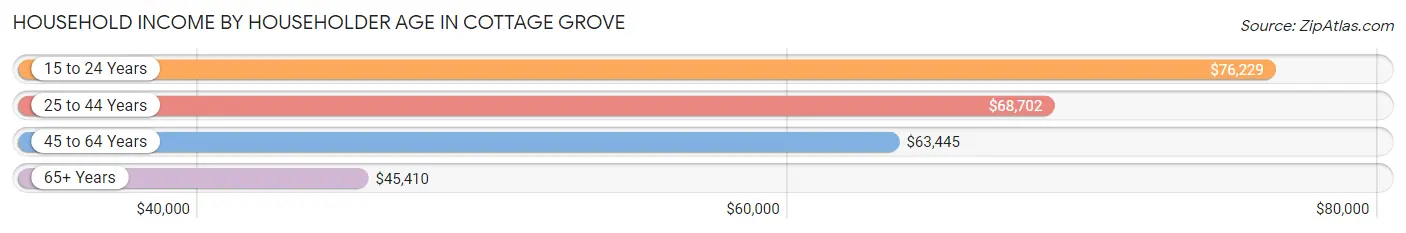
| Income Bracket | # Households | Median Income |
| 15 to 24 Years | 264 (6.3%) | $76,229 |
| 25 to 44 Years | 1,377 (32.7%) | $68,702 |
| 45 to 64 Years | 1,424 (33.8%) | $63,445 |
| 65+ Years | 1,145 (27.2%) | $45,410 |
| Total | 4,210 (100.0%) | $60,219 |
Poverty in Cottage Grove
Income Below Poverty by Sex and Age in Cottage Grove
With 17.6% poverty level for males and 17.2% for females among the residents of Cottage Grove, 25 to 34 year old males and 5 year old females are the most vulnerable to poverty, with 225 males (33.7%) and 32 females (84.2%) in their respective age groups living below the poverty level.
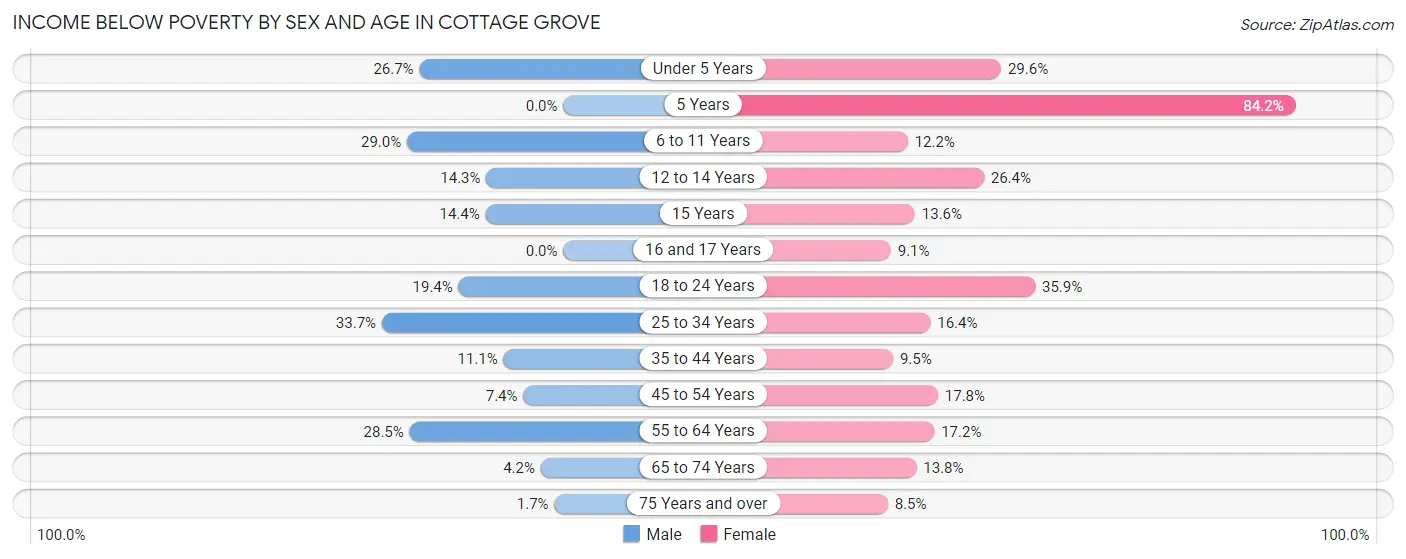
| Age Bracket | Male | Female |
| Under 5 Years | 86 (26.7%) | 52 (29.5%) |
| 5 Years | 0 (0.0%) | 32 (84.2%) |
| 6 to 11 Years | 119 (29.0%) | 46 (12.2%) |
| 12 to 14 Years | 27 (14.3%) | 44 (26.4%) |
| 15 Years | 13 (14.4%) | 16 (13.6%) |
| 16 and 17 Years | 0 (0.0%) | 9 (9.1%) |
| 18 to 24 Years | 179 (19.4%) | 184 (35.9%) |
| 25 to 34 Years | 225 (33.7%) | 68 (16.4%) |
| 35 to 44 Years | 92 (11.1%) | 84 (9.5%) |
| 45 to 54 Years | 49 (7.4%) | 102 (17.8%) |
| 55 to 64 Years | 143 (28.5%) | 93 (17.2%) |
| 65 to 74 Years | 19 (4.2%) | 75 (13.8%) |
| 75 Years and over | 4 (1.7%) | 40 (8.5%) |
| Total | 956 (17.6%) | 845 (17.2%) |
Income Above Poverty by Sex and Age in Cottage Grove
According to the poverty statistics in Cottage Grove, males aged 5 years and females aged 75 years and over are the age groups that are most secure financially, with 100.0% of males and 91.5% of females in these age groups living above the poverty line.
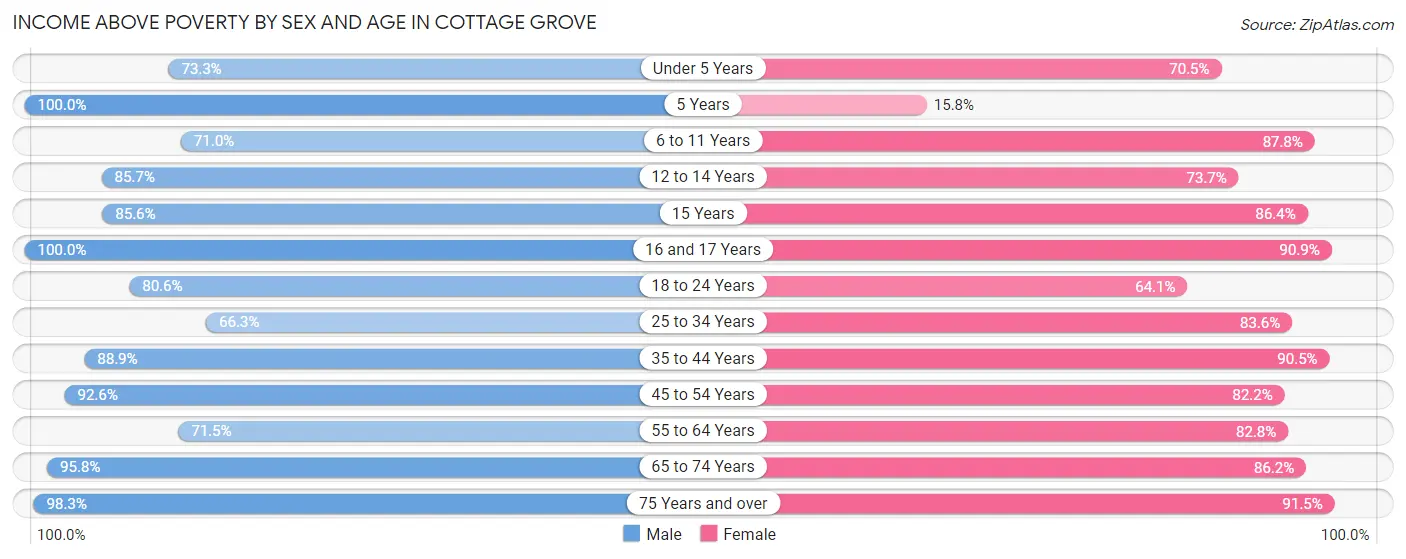
| Age Bracket | Male | Female |
| Under 5 Years | 236 (73.3%) | 124 (70.5%) |
| 5 Years | 33 (100.0%) | 6 (15.8%) |
| 6 to 11 Years | 291 (71.0%) | 330 (87.8%) |
| 12 to 14 Years | 162 (85.7%) | 123 (73.7%) |
| 15 Years | 77 (85.6%) | 102 (86.4%) |
| 16 and 17 Years | 116 (100.0%) | 90 (90.9%) |
| 18 to 24 Years | 742 (80.6%) | 329 (64.1%) |
| 25 to 34 Years | 443 (66.3%) | 346 (83.6%) |
| 35 to 44 Years | 737 (88.9%) | 800 (90.5%) |
| 45 to 54 Years | 611 (92.6%) | 470 (82.2%) |
| 55 to 64 Years | 358 (71.5%) | 449 (82.8%) |
| 65 to 74 Years | 435 (95.8%) | 467 (86.2%) |
| 75 Years and over | 237 (98.3%) | 429 (91.5%) |
| Total | 4,478 (82.4%) | 4,065 (82.8%) |
Income Below Poverty Among Married-Couple Families in Cottage Grove
The poverty statistics for married-couple families in Cottage Grove show that 4.8% or 85 of the total 1,764 families live below the poverty line. Families with 5 or more children have the highest poverty rate of 26.8%, comprising of 15 families. On the other hand, families with no children have the lowest poverty rate of 2.8%, which includes 28 families.
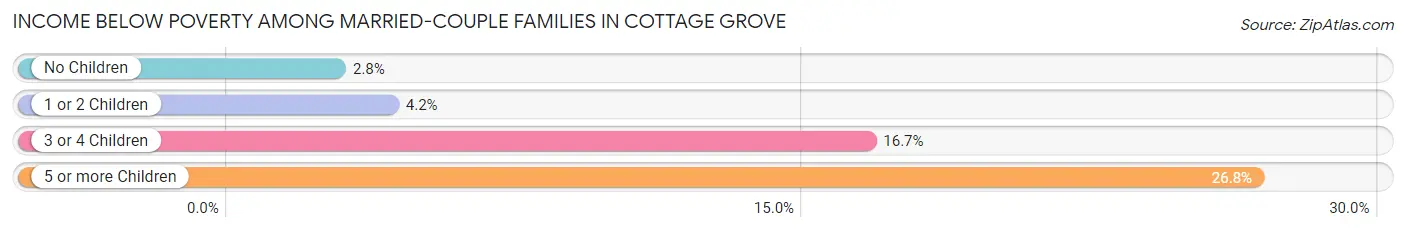
| Children | Above Poverty | Below Poverty |
| No Children | 965 (97.2%) | 28 (2.8%) |
| 1 or 2 Children | 593 (95.8%) | 26 (4.2%) |
| 3 or 4 Children | 80 (83.3%) | 16 (16.7%) |
| 5 or more Children | 41 (73.2%) | 15 (26.8%) |
| Total | 1,679 (95.2%) | 85 (4.8%) |
Income Below Poverty Among Single-Parent Households in Cottage Grove
According to the poverty data in Cottage Grove, 34.9% or 44 single-father households and 33.0% or 200 single-mother households are living below the poverty line. Among single-father households, those with 3 or 4 children have the highest poverty rate, with 15 households (55.6%) experiencing poverty. Likewise, among single-mother households, those with 1 or 2 children have the highest poverty rate, with 176 households (40.6%) falling below the poverty line.
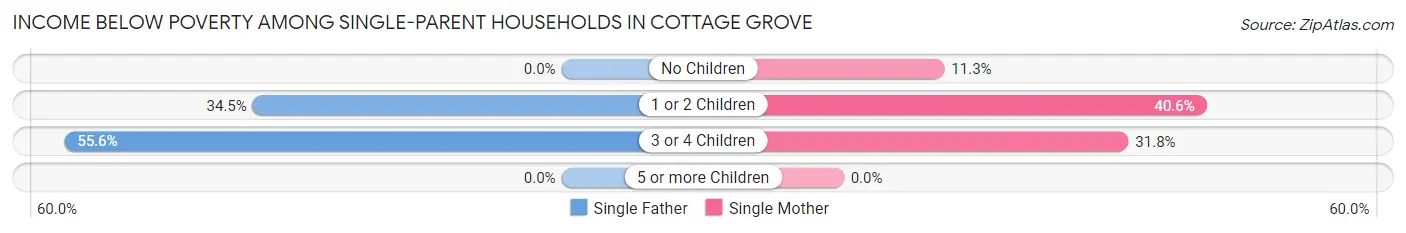
| Children | Single Father | Single Mother |
| No Children | 0 (0.0%) | 17 (11.3%) |
| 1 or 2 Children | 29 (34.5%) | 176 (40.6%) |
| 3 or 4 Children | 15 (55.6%) | 7 (31.8%) |
| 5 or more Children | 0 (0.0%) | 0 (0.0%) |
| Total | 44 (34.9%) | 200 (33.0%) |
Income Below Poverty Among Married-Couple vs Single-Parent Households in Cottage Grove
The poverty data for Cottage Grove shows that 85 of the married-couple family households (4.8%) and 244 of the single-parent households (33.3%) are living below the poverty level. Within the married-couple family households, those with 5 or more children have the highest poverty rate, with 15 households (26.8%) falling below the poverty line. Among the single-parent households, those with 3 or 4 children have the highest poverty rate, with 22 household (44.9%) living below poverty.
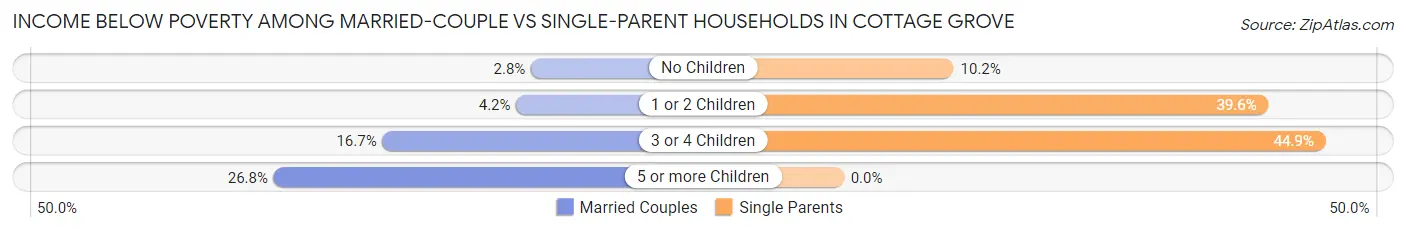
| Children | Married-Couple Families | Single-Parent Households |
| No Children | 28 (2.8%) | 17 (10.2%) |
| 1 or 2 Children | 26 (4.2%) | 205 (39.6%) |
| 3 or 4 Children | 16 (16.7%) | 22 (44.9%) |
| 5 or more Children | 15 (26.8%) | 0 (0.0%) |
| Total | 85 (4.8%) | 244 (33.3%) |
Race in Cottage Grove
The most populous races in Cottage Grove are White / Caucasian (8,808 | 83.2%), Hispanic or Latino (1,081 | 10.2%), and Two or more Races (935 | 8.8%).
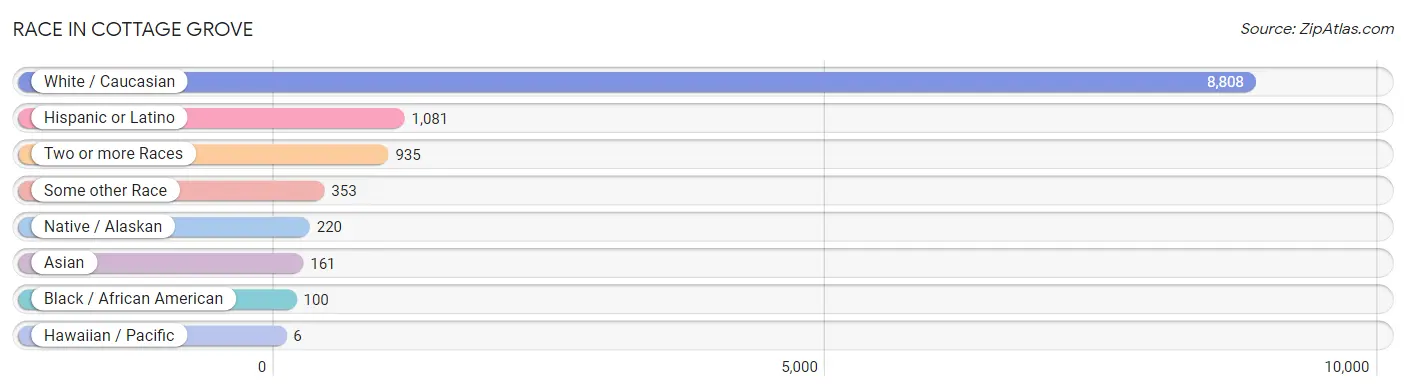
| Race | # Population | % Population |
| Asian | 161 | 1.5% |
| Black / African American | 100 | 0.9% |
| Hawaiian / Pacific | 6 | 0.1% |
| Hispanic or Latino | 1,081 | 10.2% |
| Native / Alaskan | 220 | 2.1% |
| White / Caucasian | 8,808 | 83.2% |
| Two or more Races | 935 | 8.8% |
| Some other Race | 353 | 3.3% |
| Total | 10,583 | 100.0% |
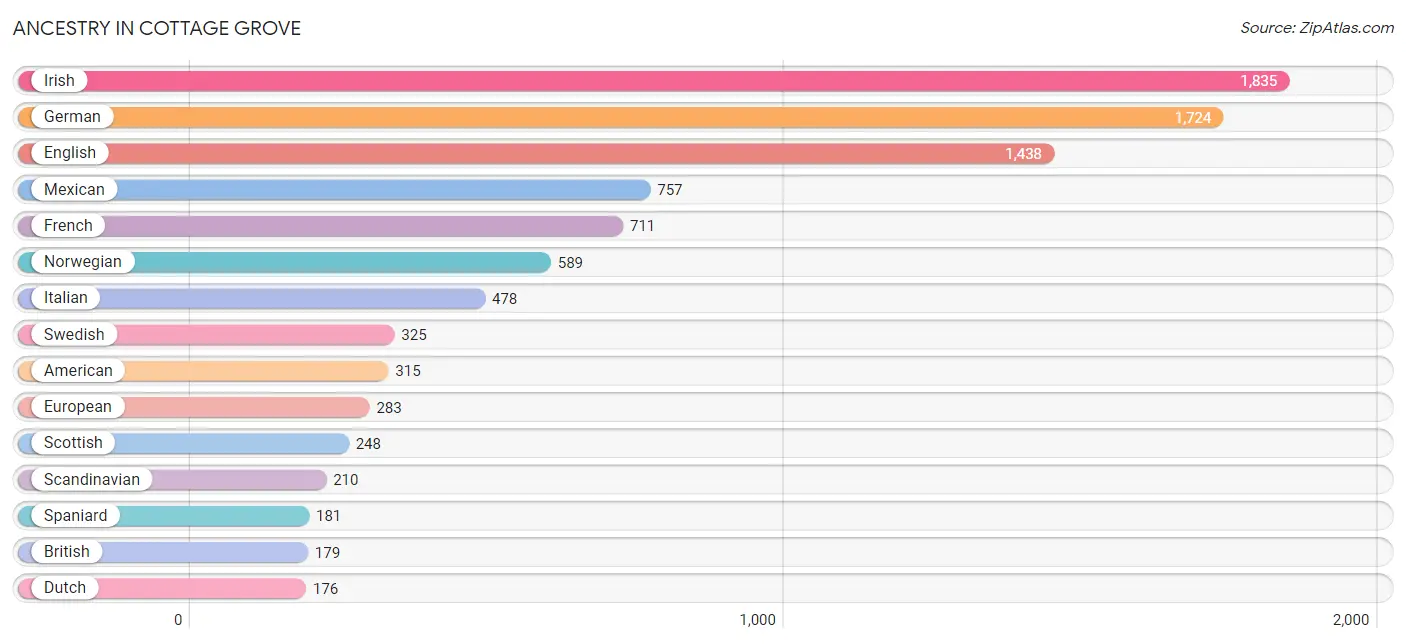
Ancestry in Cottage Grove
The most populous ancestries reported in Cottage Grove are Irish (1,835 | 17.3%), German (1,724 | 16.3%), English (1,438 | 13.6%), Mexican (757 | 7.1%), and French (711 | 6.7%), together accounting for 61.1% of all Cottage Grove residents.
| Ancestry | # Population | % Population |
| African | 6 | 0.1% |
| American | 315 | 3.0% |
| Apache | 25 | 0.2% |
| Arab | 8 | 0.1% |
| Austrian | 26 | 0.3% |
| Belgian | 11 | 0.1% |
| Bhutanese | 87 | 0.8% |
| Blackfeet | 61 | 0.6% |
| British | 179 | 1.7% |
| Burmese | 21 | 0.2% |
| Central American | 39 | 0.4% |
| Central American Indian | 51 | 0.5% |
| Cherokee | 135 | 1.3% |
| Chickasaw | 10 | 0.1% |
| Czech | 10 | 0.1% |
| Czechoslovakian | 12 | 0.1% |
| Danish | 166 | 1.6% |
| Dutch | 176 | 1.7% |
| English | 1,438 | 13.6% |
| Estonian | 3 | 0.0% |
| Ethiopian | 5 | 0.1% |
| European | 283 | 2.7% |
| Finnish | 42 | 0.4% |
| French | 711 | 6.7% |
| French American Indian | 9 | 0.1% |
| French Canadian | 49 | 0.5% |
| German | 1,724 | 16.3% |
| Greek | 131 | 1.2% |
| Guamanian / Chamorro | 6 | 0.1% |
| Guatemalan | 39 | 0.4% |
| Indian (Asian) | 34 | 0.3% |
| Iranian | 12 | 0.1% |
| Irish | 1,835 | 17.3% |
| Italian | 478 | 4.5% |
| Korean | 81 | 0.8% |
| Lebanese | 8 | 0.1% |
| Lithuanian | 46 | 0.4% |
| Mexican | 757 | 7.1% |
| Mexican American Indian | 123 | 1.2% |
| Native Hawaiian | 27 | 0.3% |
| Northern European | 50 | 0.5% |
| Norwegian | 589 | 5.6% |
| Pennsylvania German | 23 | 0.2% |
| Peruvian | 6 | 0.1% |
| Polish | 69 | 0.6% |
| Portuguese | 78 | 0.7% |
| Pueblo | 15 | 0.1% |
| Puerto Rican | 72 | 0.7% |
| Puget Sound Salish | 31 | 0.3% |
| Russian | 100 | 0.9% |
| Samoan | 8 | 0.1% |
| Scandinavian | 210 | 2.0% |
| Scotch-Irish | 57 | 0.5% |
| Scottish | 248 | 2.3% |
| Sioux | 23 | 0.2% |
| Slovak | 19 | 0.2% |
| South American | 6 | 0.1% |
| Spaniard | 181 | 1.7% |
| Spanish | 9 | 0.1% |
| Sri Lankan | 98 | 0.9% |
| Subsaharan African | 11 | 0.1% |
| Swedish | 325 | 3.1% |
| Swiss | 40 | 0.4% |
| Turkish | 27 | 0.3% |
| Ukrainian | 10 | 0.1% |
| Welsh | 47 | 0.4% | View All 66 Rows |
Immigrants in Cottage Grove
The most numerous immigrant groups reported in Cottage Grove came from Central America (253 | 2.4%), Latin America (253 | 2.4%), Mexico (214 | 2.0%), Asia (122 | 1.1%), and South Eastern Asia (64 | 0.6%), together accounting for 8.6% of all Cottage Grove residents.
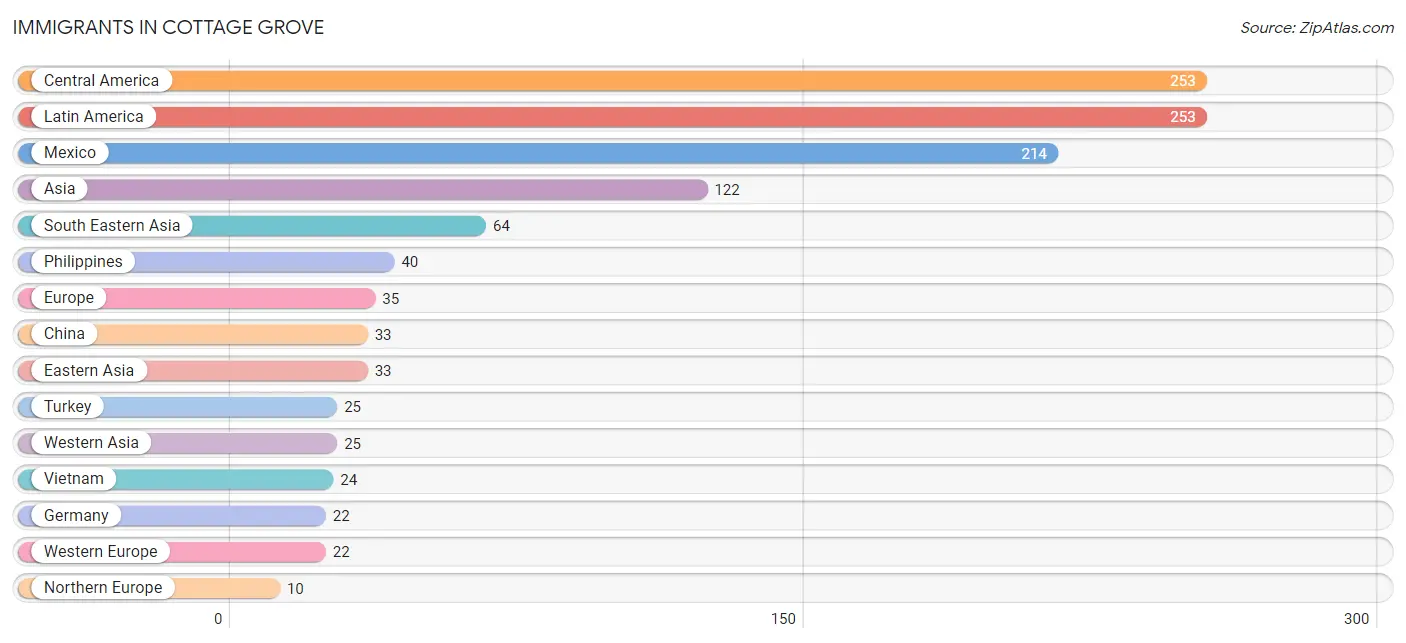
| Immigration Origin | # Population | % Population |
| Africa | 5 | 0.1% |
| Asia | 122 | 1.1% |
| Canada | 9 | 0.1% |
| Central America | 253 | 2.4% |
| China | 33 | 0.3% |
| Eastern Africa | 5 | 0.1% |
| Eastern Asia | 33 | 0.3% |
| Eastern Europe | 3 | 0.0% |
| Ethiopia | 5 | 0.1% |
| Europe | 35 | 0.3% |
| Germany | 22 | 0.2% |
| Latin America | 253 | 2.4% |
| Mexico | 214 | 2.0% |
| Northern Europe | 10 | 0.1% |
| Philippines | 40 | 0.4% |
| South Eastern Asia | 64 | 0.6% |
| Turkey | 25 | 0.2% |
| Vietnam | 24 | 0.2% |
| Western Asia | 25 | 0.2% |
| Western Europe | 22 | 0.2% | View All 20 Rows |
Sex and Age in Cottage Grove
Sex and Age in Cottage Grove
The most populous age groups in Cottage Grove are 20 to 24 Years (707 | 12.6%) for men and 35 to 39 Years (453 | 9.1%) for women.
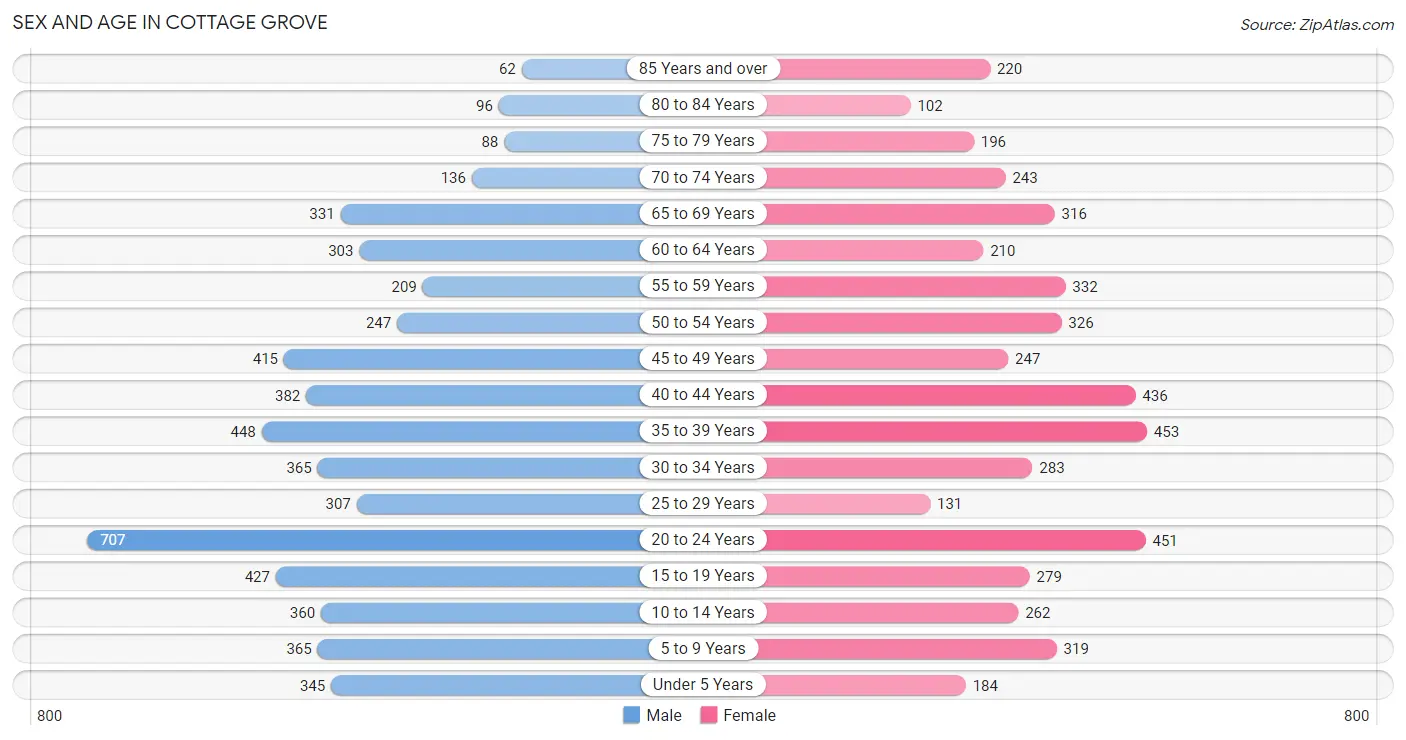
| Age Bracket | Male | Female |
| Under 5 Years | 345 (6.2%) | 184 (3.7%) |
| 5 to 9 Years | 365 (6.5%) | 319 (6.4%) |
| 10 to 14 Years | 360 (6.4%) | 262 (5.2%) |
| 15 to 19 Years | 427 (7.6%) | 279 (5.6%) |
| 20 to 24 Years | 707 (12.6%) | 451 (9.0%) |
| 25 to 29 Years | 307 (5.5%) | 131 (2.6%) |
| 30 to 34 Years | 365 (6.5%) | 283 (5.7%) |
| 35 to 39 Years | 448 (8.0%) | 453 (9.1%) |
| 40 to 44 Years | 382 (6.8%) | 436 (8.7%) |
| 45 to 49 Years | 415 (7.4%) | 247 (5.0%) |
| 50 to 54 Years | 247 (4.4%) | 326 (6.5%) |
| 55 to 59 Years | 209 (3.7%) | 332 (6.7%) |
| 60 to 64 Years | 303 (5.4%) | 210 (4.2%) |
| 65 to 69 Years | 331 (5.9%) | 316 (6.3%) |
| 70 to 74 Years | 136 (2.4%) | 243 (4.9%) |
| 75 to 79 Years | 88 (1.6%) | 196 (3.9%) |
| 80 to 84 Years | 96 (1.7%) | 102 (2.0%) |
| 85 Years and over | 62 (1.1%) | 220 (4.4%) |
| Total | 5,593 (100.0%) | 4,990 (100.0%) |
Families and Households in Cottage Grove
Median Family Size in Cottage Grove
The median family size in Cottage Grove is 2.96 persons per family, with married-couple families (1,764 | 70.6%) accounting for the largest median family size of 3.1 persons per family. On the other hand, single female/mother families (607 | 24.3%) represent the smallest median family size with 2.60 persons per family.
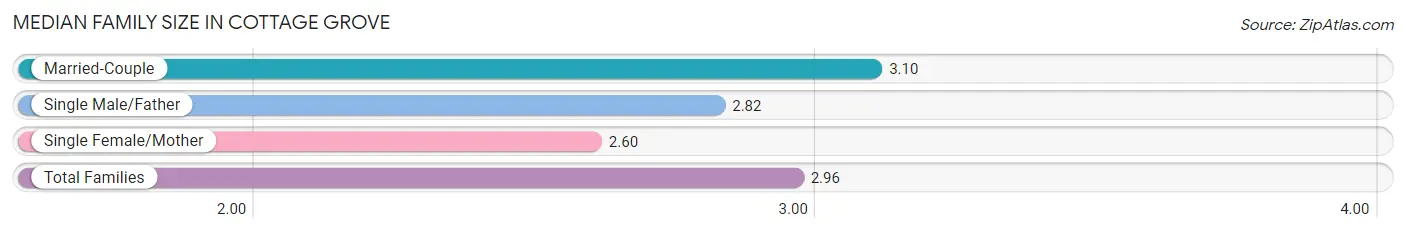
| Family Type | # Families | Family Size |
| Married-Couple | 1,764 (70.6%) | 3.10 |
| Single Male/Father | 126 (5.1%) | 2.82 |
| Single Female/Mother | 607 (24.3%) | 2.60 |
| Total Families | 2,497 (100.0%) | 2.96 |
Median Household Size in Cottage Grove
The median household size in Cottage Grove is 2.48 persons per household, with married-couple households (1,764 | 41.9%) accounting for the largest median household size of 3.23 persons per household. non-family households (1,713 | 40.7%) represent the smallest median household size with 1.41 persons per household.
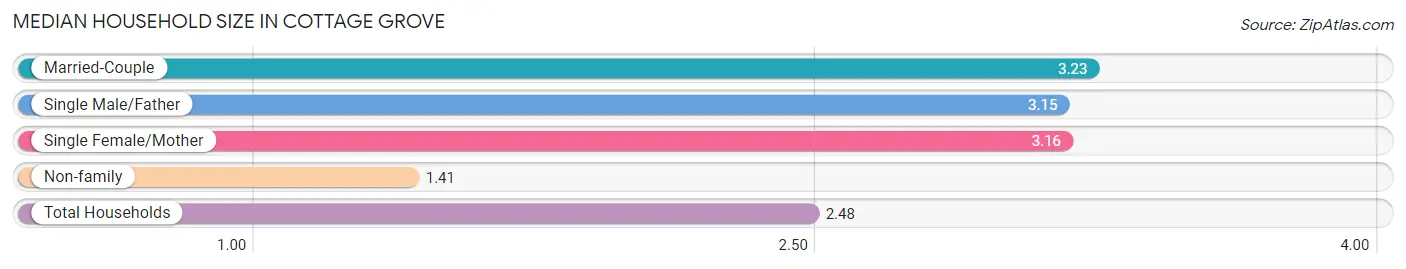
| Household Type | # Households | Household Size |
| Married-Couple | 1,764 (41.9%) | 3.23 |
| Single Male/Father | 126 (3.0%) | 3.15 |
| Single Female/Mother | 607 (14.4%) | 3.16 |
| Non-family | 1,713 (40.7%) | 1.41 |
| Total Households | 4,210 (100.0%) | 2.48 |
Household Size by Marriage Status in Cottage Grove
Out of a total of 4,210 households in Cottage Grove, 2,497 (59.3%) are family households, while 1,713 (40.7%) are nonfamily households. The most numerous type of family households are 2-person households, comprising 1,023, and the most common type of nonfamily households are 1-person households, comprising 1,170.
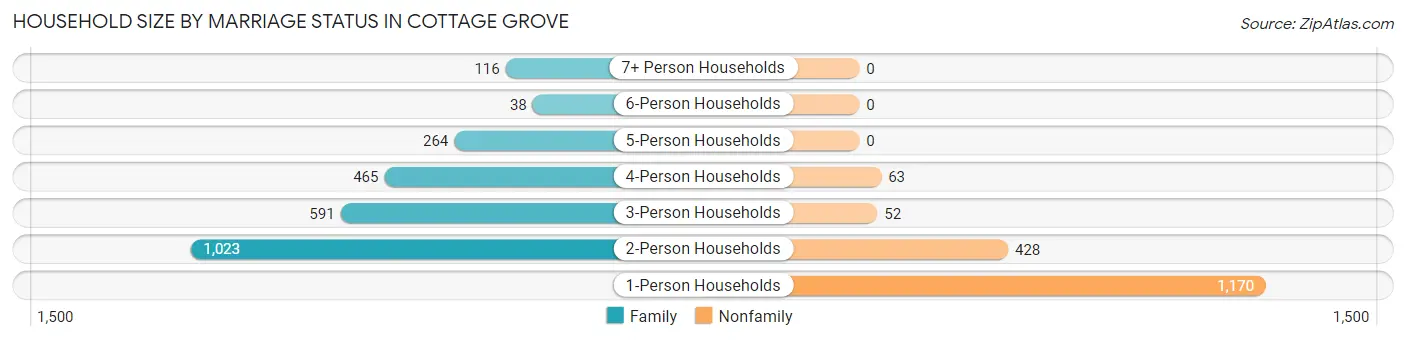
| Household Size | Family Households | Nonfamily Households |
| 1-Person Households | - | 1,170 (27.8%) |
| 2-Person Households | 1,023 (24.3%) | 428 (10.2%) |
| 3-Person Households | 591 (14.0%) | 52 (1.2%) |
| 4-Person Households | 465 (11.1%) | 63 (1.5%) |
| 5-Person Households | 264 (6.3%) | 0 (0.0%) |
| 6-Person Households | 38 (0.9%) | 0 (0.0%) |
| 7+ Person Households | 116 (2.8%) | 0 (0.0%) |
| Total | 2,497 (59.3%) | 1,713 (40.7%) |
Female Fertility in Cottage Grove
Fertility by Age in Cottage Grove
Average fertility rate in Cottage Grove is 101.0 births per 1,000 women. Women in the age bracket of 20 to 34 years have the highest fertility rate with 173.0 births per 1,000 women. Women in the age bracket of 20 to 34 years acount for 63.3% of all women with births.
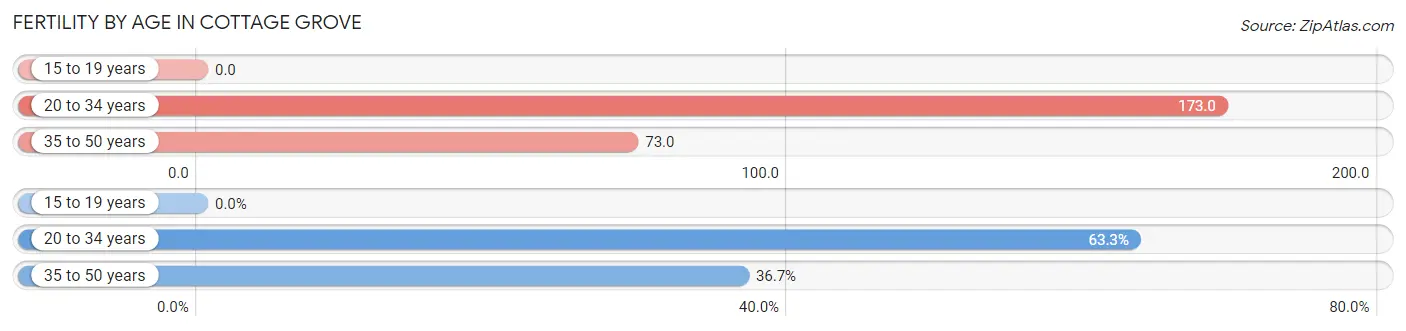
| Age Bracket | Women with Births | Births / 1,000 Women |
| 15 to 19 years | 0 (0.0%) | 0.0 |
| 20 to 34 years | 150 (63.3%) | 173.0 |
| 35 to 50 years | 87 (36.7%) | 73.0 |
| Total | 237 (100.0%) | 101.0 |
Fertility by Age by Marriage Status in Cottage Grove
89.9% of women with births (237) in Cottage Grove are married. The highest percentage of unmarried women with births falls into 20 to 34 years age bracket with 16.0% of them unmarried at the time of birth, while the lowest percentage of unmarried women with births belong to 35 to 50 years age bracket with 0.0% of them unmarried.
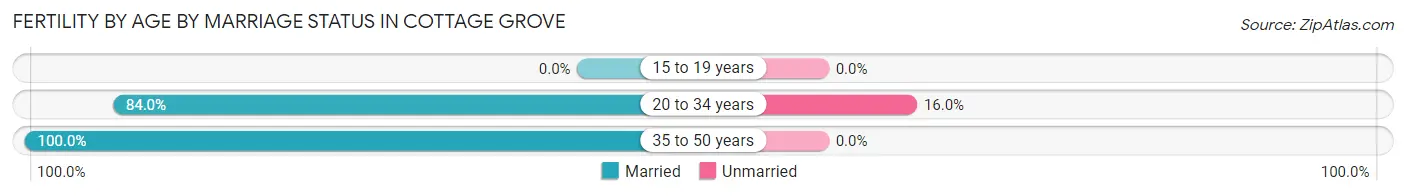
| Age Bracket | Married | Unmarried |
| 15 to 19 years | 0 (0.0%) | 0 (0.0%) |
| 20 to 34 years | 126 (84.0%) | 24 (16.0%) |
| 35 to 50 years | 87 (100.0%) | 0 (0.0%) |
| Total | 213 (89.9%) | 24 (10.1%) |
Fertility by Education in Cottage Grove
Average fertility rate in Cottage Grove is 101.0 births per 1,000 women. Women with the education attainment of graduate degree have the highest fertility rate of 694.0 births per 1,000 women, while women with the education attainment of high school diploma have the lowest fertility at 55.0 births per 1,000 women. Women with the education attainment of graduate degree represent 42.2% of all women with births.
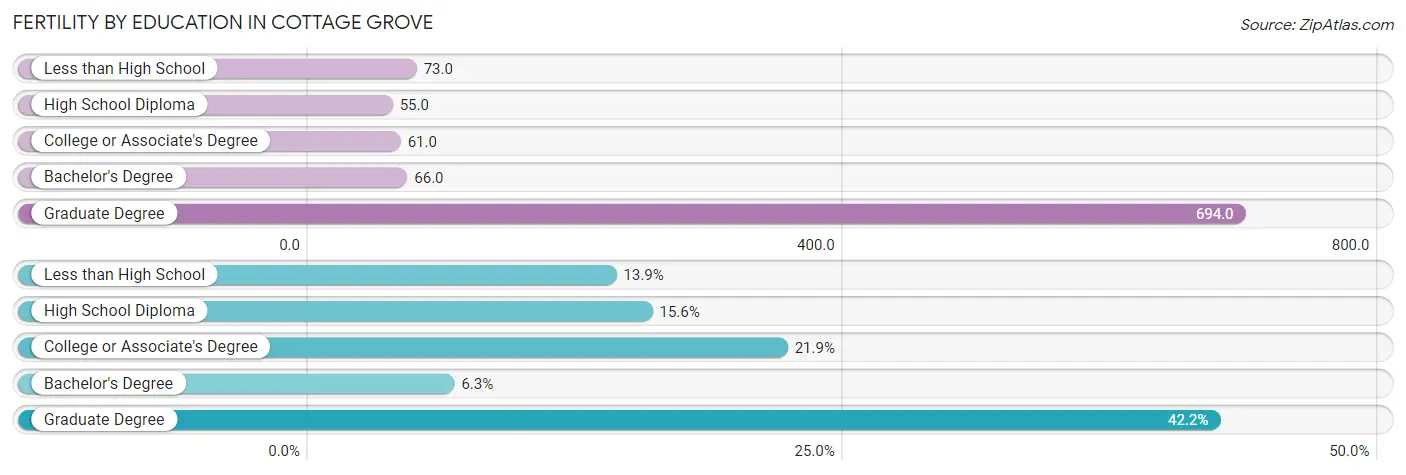
| Educational Attainment | Women with Births | Births / 1,000 Women |
| Less than High School | 33 (13.9%) | 73.0 |
| High School Diploma | 37 (15.6%) | 55.0 |
| College or Associate's Degree | 52 (21.9%) | 61.0 |
| Bachelor's Degree | 15 (6.3%) | 66.0 |
| Graduate Degree | 100 (42.2%) | 694.0 |
| Total | 237 (100.0%) | 101.0 |
Fertility by Education by Marriage Status in Cottage Grove
10.1% of women with births in Cottage Grove are unmarried. Women with the educational attainment of less than high school are most likely to be married with 100.0% of them married at childbirth, while women with the educational attainment of high school diploma are least likely to be married with 64.9% of them unmarried at childbirth.
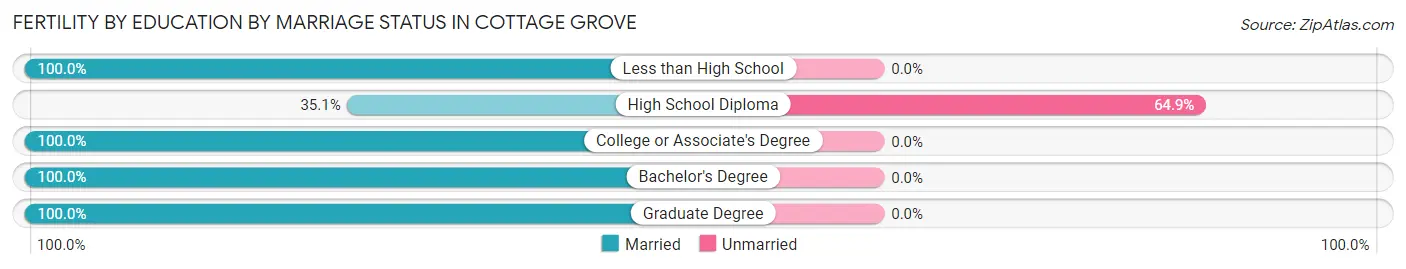
| Educational Attainment | Married | Unmarried |
| Less than High School | 33 (100.0%) | 0 (0.0%) |
| High School Diploma | 13 (35.1%) | 24 (64.9%) |
| College or Associate's Degree | 52 (100.0%) | 0 (0.0%) |
| Bachelor's Degree | 15 (100.0%) | 0 (0.0%) |
| Graduate Degree | 100 (100.0%) | 0 (0.0%) |
| Total | 213 (89.9%) | 24 (10.1%) |
Employment Characteristics in Cottage Grove
Employment by Class of Employer in Cottage Grove
Among the 4,896 employed individuals in Cottage Grove, private company employees (3,287 | 67.1%), local government employees (471 | 9.6%), and not-for-profit organizations (309 | 6.3%) make up the most common classes of employment.
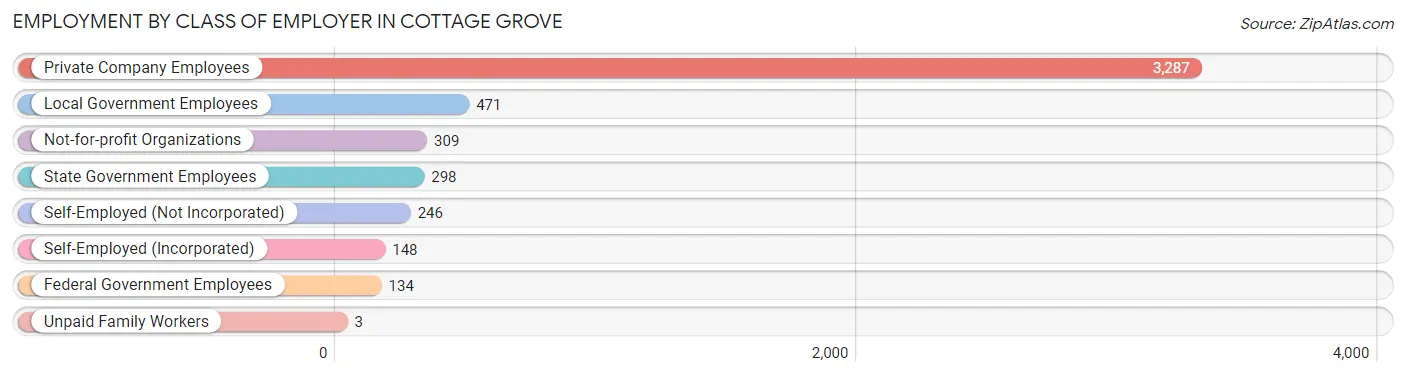
| Employer Class | # Employees | % Employees |
| Private Company Employees | 3,287 | 67.1% |
| Self-Employed (Incorporated) | 148 | 3.0% |
| Self-Employed (Not Incorporated) | 246 | 5.0% |
| Not-for-profit Organizations | 309 | 6.3% |
| Local Government Employees | 471 | 9.6% |
| State Government Employees | 298 | 6.1% |
| Federal Government Employees | 134 | 2.7% |
| Unpaid Family Workers | 3 | 0.1% |
| Total | 4,896 | 100.0% |
Employment Status by Age in Cottage Grove
According to the labor force statistics for Cottage Grove, out of the total population over 16 years of age (8,540), 62.1% or 5,303 individuals are in the labor force, with 6.1% or 323 of them unemployed. The age group with the highest labor force participation rate is 35 to 44 years, with 87.6% or 1,506 individuals in the labor force. Within the labor force, the 16 to 19 years age range has the highest percentage of unemployed individuals, with 23.4% or 32 of them being unemployed.
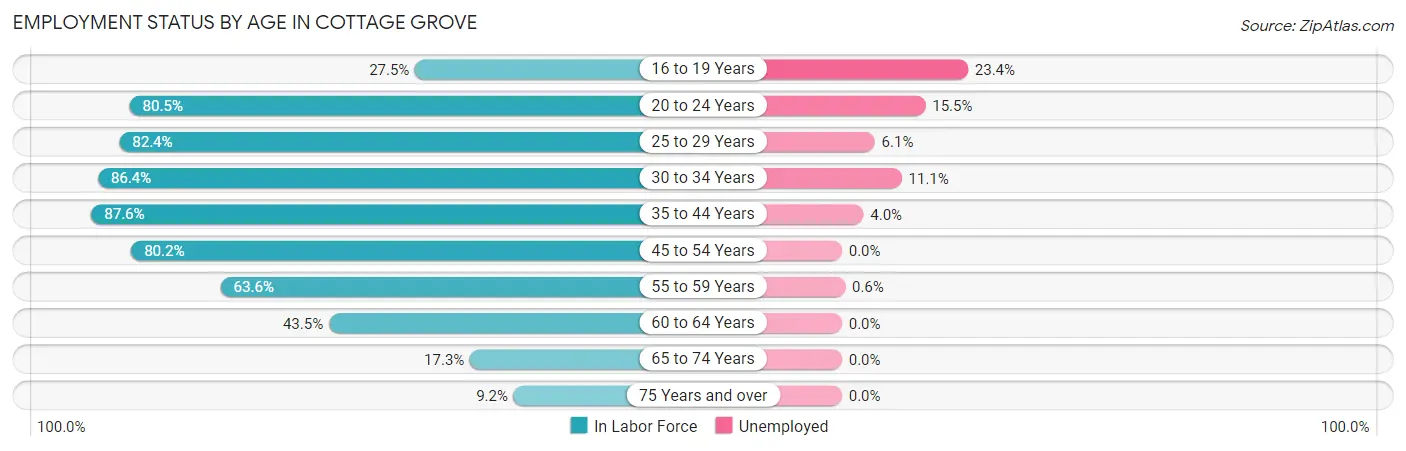
| Age Bracket | In Labor Force | Unemployed |
| 16 to 19 Years | 137 (27.5%) | 32 (23.4%) |
| 20 to 24 Years | 932 (80.5%) | 144 (15.5%) |
| 25 to 29 Years | 361 (82.4%) | 22 (6.1%) |
| 30 to 34 Years | 560 (86.4%) | 62 (11.1%) |
| 35 to 44 Years | 1,506 (87.6%) | 60 (4.0%) |
| 45 to 54 Years | 990 (80.2%) | 0 (0.0%) |
| 55 to 59 Years | 344 (63.6%) | 2 (0.6%) |
| 60 to 64 Years | 223 (43.5%) | 0 (0.0%) |
| 65 to 74 Years | 177 (17.3%) | 0 (0.0%) |
| 75 Years and over | 70 (9.2%) | 0 (0.0%) |
| Total | 5,303 (62.1%) | 323 (6.1%) |
Employment Status by Educational Attainment in Cottage Grove
According to labor force statistics for Cottage Grove, 78.2% of individuals (3,984) out of the total population between 25 and 64 years of age (5,094) are in the labor force, with 3.7% or 147 of them being unemployed. The group with the highest labor force participation rate are those with the educational attainment of college / associate degree, with 83.0% or 1,697 individuals in the labor force. Within the labor force, individuals with less than high school education have the highest percentage of unemployment, with 15.1% or 43 of them being unemployed.
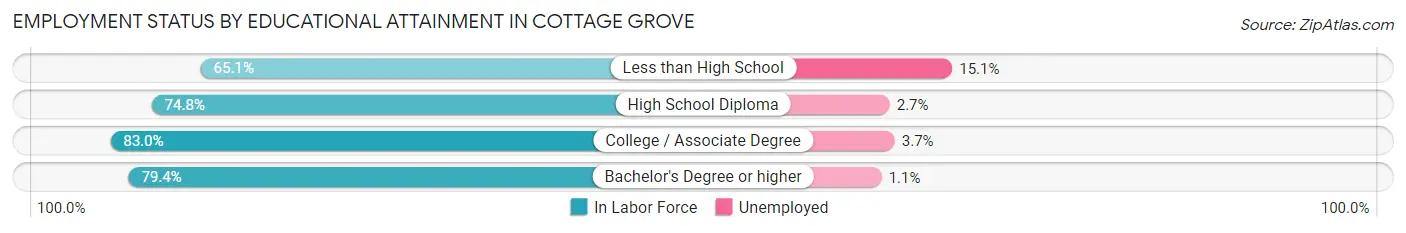
| Educational Attainment | In Labor Force | Unemployed |
| Less than High School | 284 (65.1%) | 66 (15.1%) |
| High School Diploma | 1,192 (74.8%) | 43 (2.7%) |
| College / Associate Degree | 1,697 (83.0%) | 76 (3.7%) |
| Bachelor's Degree or higher | 811 (79.4%) | 11 (1.1%) |
| Total | 3,984 (78.2%) | 188 (3.7%) |
Employment Occupations by Sex in Cottage Grove
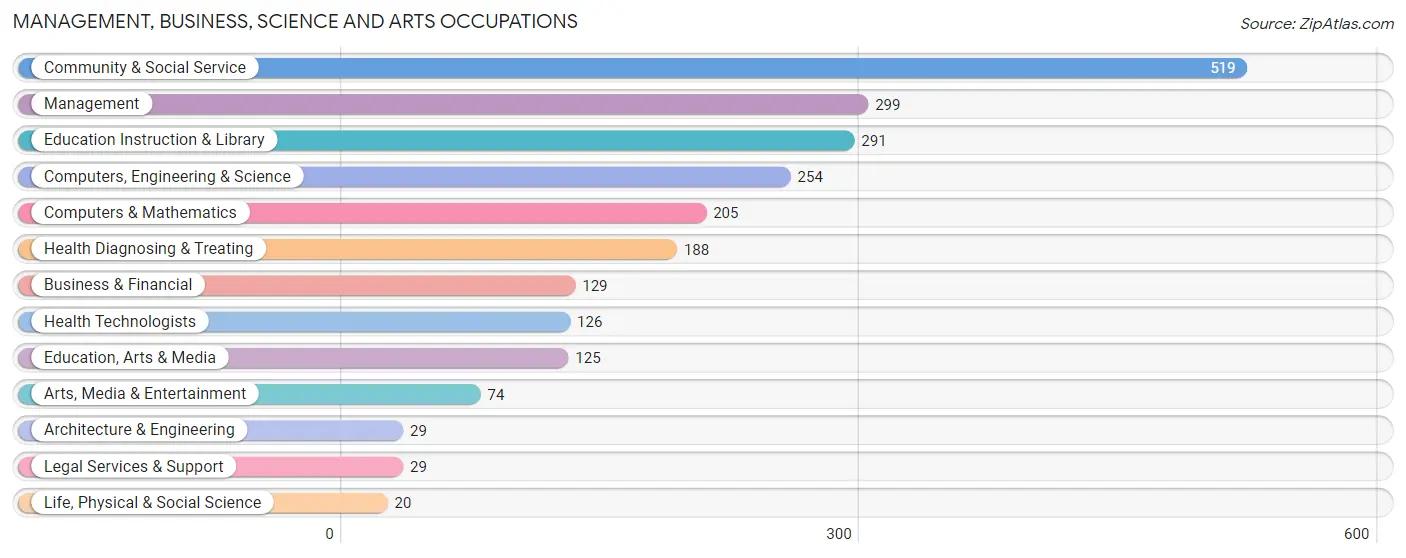
Management, Business, Science and Arts Occupations
The most common Management, Business, Science and Arts occupations in Cottage Grove are Community & Social Service (519 | 10.4%), Management (299 | 6.0%), Education Instruction & Library (291 | 5.9%), Computers, Engineering & Science (254 | 5.1%), and Computers & Mathematics (205 | 4.1%).
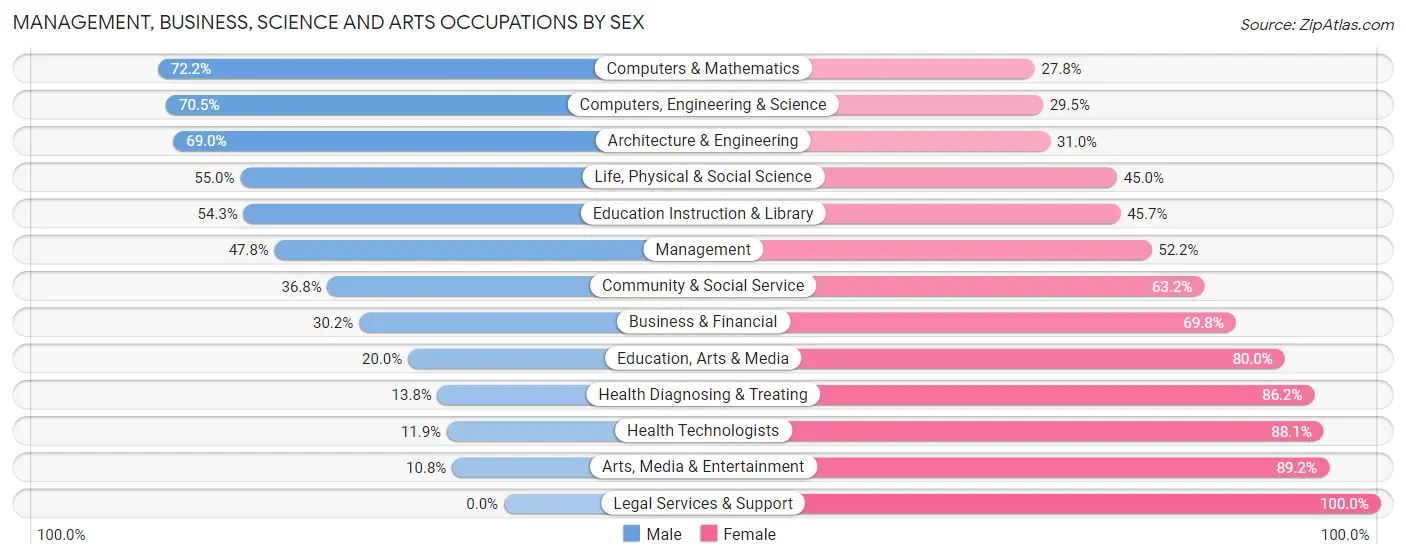
Management, Business, Science and Arts Occupations by Sex
Within the Management, Business, Science and Arts occupations in Cottage Grove, the most male-oriented occupations are Computers & Mathematics (72.2%), Computers, Engineering & Science (70.5%), and Architecture & Engineering (69.0%), while the most female-oriented occupations are Legal Services & Support (100.0%), Arts, Media & Entertainment (89.2%), and Health Technologists (88.1%).
| Occupation | Male | Female |
| Management | 143 (47.8%) | 156 (52.2%) |
| Business & Financial | 39 (30.2%) | 90 (69.8%) |
| Computers, Engineering & Science | 179 (70.5%) | 75 (29.5%) |
| Computers & Mathematics | 148 (72.2%) | 57 (27.8%) |
| Architecture & Engineering | 20 (69.0%) | 9 (31.0%) |
| Life, Physical & Social Science | 11 (55.0%) | 9 (45.0%) |
| Community & Social Service | 191 (36.8%) | 328 (63.2%) |
| Education, Arts & Media | 25 (20.0%) | 100 (80.0%) |
| Legal Services & Support | 0 (0.0%) | 29 (100.0%) |
| Education Instruction & Library | 158 (54.3%) | 133 (45.7%) |
| Arts, Media & Entertainment | 8 (10.8%) | 66 (89.2%) |
| Health Diagnosing & Treating | 26 (13.8%) | 162 (86.2%) |
| Health Technologists | 15 (11.9%) | 111 (88.1%) |
| Total (Category) | 578 (41.6%) | 811 (58.4%) |
| Total (Overall) | 2,745 (55.1%) | 2,233 (44.9%) |
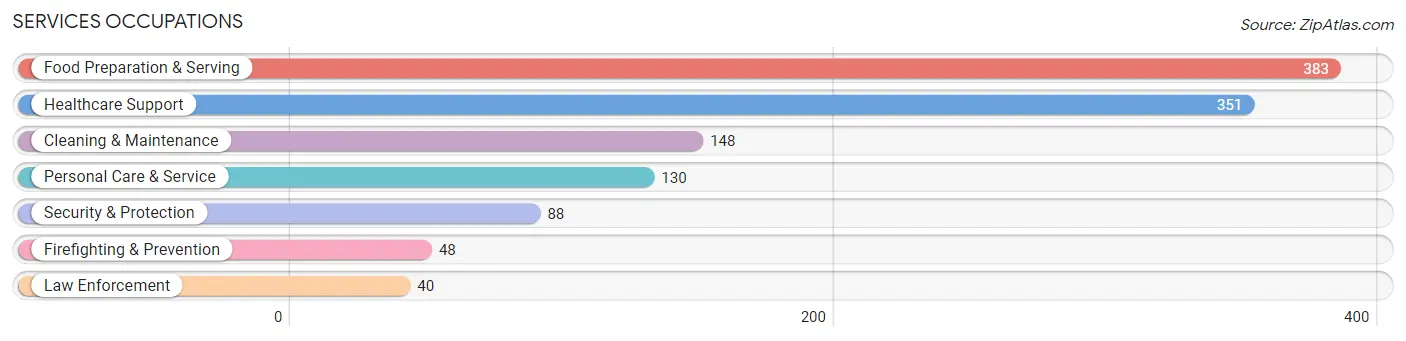
Services Occupations
The most common Services occupations in Cottage Grove are Food Preparation & Serving (383 | 7.7%), Healthcare Support (351 | 7.0%), Cleaning & Maintenance (148 | 3.0%), Personal Care & Service (130 | 2.6%), and Security & Protection (88 | 1.8%).
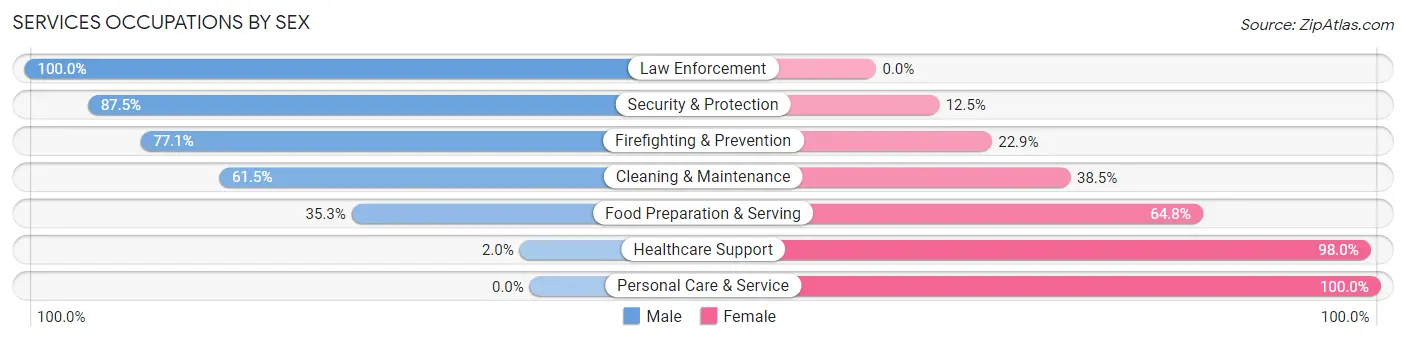
Services Occupations by Sex
Within the Services occupations in Cottage Grove, the most male-oriented occupations are Law Enforcement (100.0%), Security & Protection (87.5%), and Firefighting & Prevention (77.1%), while the most female-oriented occupations are Personal Care & Service (100.0%), Healthcare Support (98.0%), and Food Preparation & Serving (64.7%).
| Occupation | Male | Female |
| Healthcare Support | 7 (2.0%) | 344 (98.0%) |
| Security & Protection | 77 (87.5%) | 11 (12.5%) |
| Firefighting & Prevention | 37 (77.1%) | 11 (22.9%) |
| Law Enforcement | 40 (100.0%) | 0 (0.0%) |
| Food Preparation & Serving | 135 (35.2%) | 248 (64.7%) |
| Cleaning & Maintenance | 91 (61.5%) | 57 (38.5%) |
| Personal Care & Service | 0 (0.0%) | 130 (100.0%) |
| Total (Category) | 310 (28.2%) | 790 (71.8%) |
| Total (Overall) | 2,745 (55.1%) | 2,233 (44.9%) |
Sales and Office Occupations
The most common Sales and Office occupations in Cottage Grove are Office & Administration (512 | 10.3%), and Sales & Related (502 | 10.1%).

Sales and Office Occupations by Sex

| Occupation | Male | Female |
| Sales & Related | 289 (57.6%) | 213 (42.4%) |
| Office & Administration | 180 (35.2%) | 332 (64.8%) |
| Total (Category) | 469 (46.3%) | 545 (53.7%) |
| Total (Overall) | 2,745 (55.1%) | 2,233 (44.9%) |
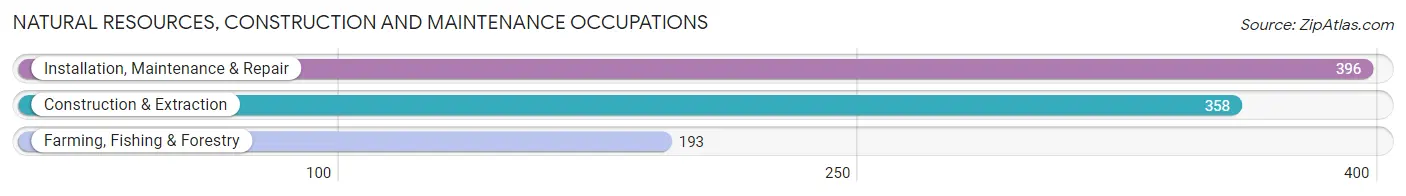
Natural Resources, Construction and Maintenance Occupations
The most common Natural Resources, Construction and Maintenance occupations in Cottage Grove are Installation, Maintenance & Repair (396 | 8.0%), Construction & Extraction (358 | 7.2%), and Farming, Fishing & Forestry (193 | 3.9%).
Natural Resources, Construction and Maintenance Occupations by Sex
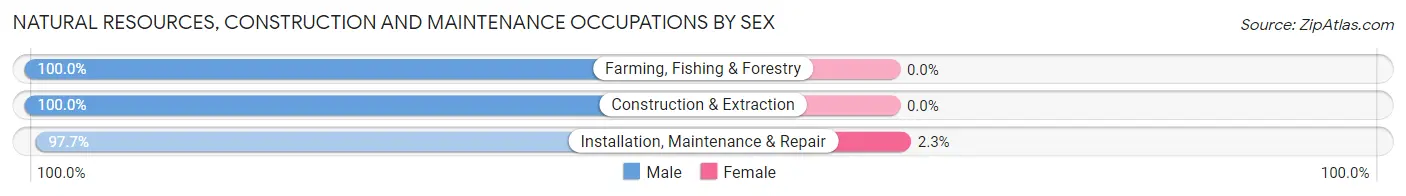
| Occupation | Male | Female |
| Farming, Fishing & Forestry | 193 (100.0%) | 0 (0.0%) |
| Construction & Extraction | 358 (100.0%) | 0 (0.0%) |
| Installation, Maintenance & Repair | 387 (97.7%) | 9 (2.3%) |
| Total (Category) | 938 (99.1%) | 9 (0.9%) |
| Total (Overall) | 2,745 (55.1%) | 2,233 (44.9%) |
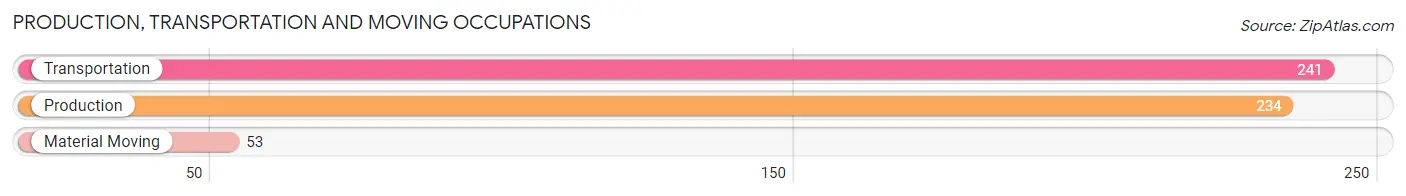
Production, Transportation and Moving Occupations
The most common Production, Transportation and Moving occupations in Cottage Grove are Transportation (241 | 4.8%), Production (234 | 4.7%), and Material Moving (53 | 1.1%).
Production, Transportation and Moving Occupations by Sex
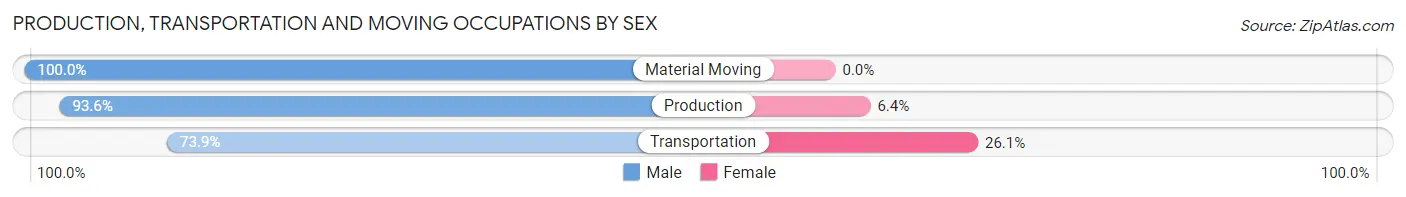
| Occupation | Male | Female |
| Production | 219 (93.6%) | 15 (6.4%) |
| Transportation | 178 (73.9%) | 63 (26.1%) |
| Material Moving | 53 (100.0%) | 0 (0.0%) |
| Total (Category) | 450 (85.2%) | 78 (14.8%) |
| Total (Overall) | 2,745 (55.1%) | 2,233 (44.9%) |
Employment Industries by Sex in Cottage Grove
Employment Industries in Cottage Grove
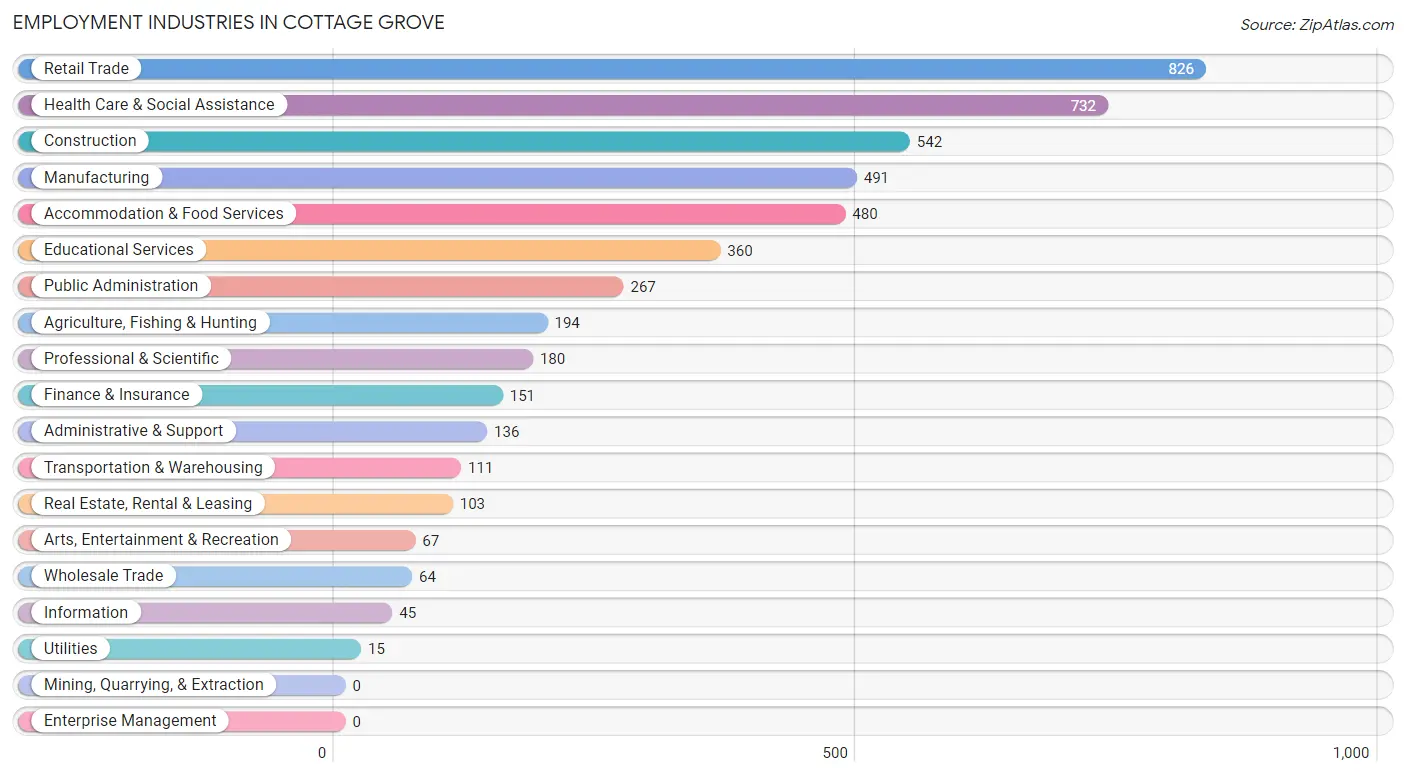
The major employment industries in Cottage Grove include Retail Trade (826 | 16.6%), Health Care & Social Assistance (732 | 14.7%), Construction (542 | 10.9%), Manufacturing (491 | 9.9%), and Accommodation & Food Services (480 | 9.6%).
Employment Industries by Sex in Cottage Grove
The Cottage Grove industries that see more men than women are Information (100.0%), Agriculture, Fishing & Hunting (96.9%), and Manufacturing (92.5%), whereas the industries that tend to have a higher number of women are Health Care & Social Assistance (91.3%), Arts, Entertainment & Recreation (83.6%), and Finance & Insurance (74.2%).
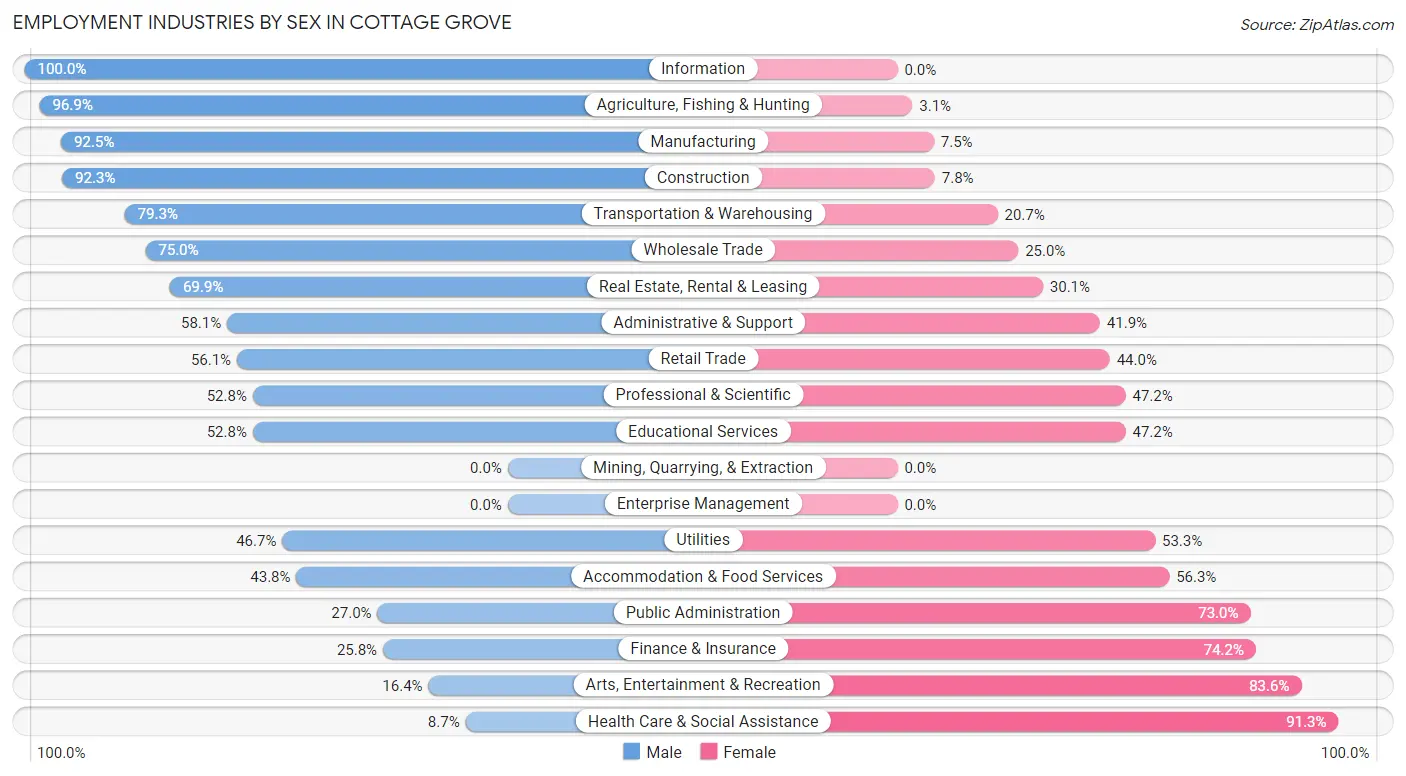
| Industry | Male | Female |
| Agriculture, Fishing & Hunting | 188 (96.9%) | 6 (3.1%) |
| Mining, Quarrying, & Extraction | 0 (0.0%) | 0 (0.0%) |
| Construction | 500 (92.2%) | 42 (7.7%) |
| Manufacturing | 454 (92.5%) | 37 (7.5%) |
| Wholesale Trade | 48 (75.0%) | 16 (25.0%) |
| Retail Trade | 463 (56.0%) | 363 (44.0%) |
| Transportation & Warehousing | 88 (79.3%) | 23 (20.7%) |
| Utilities | 7 (46.7%) | 8 (53.3%) |
| Information | 45 (100.0%) | 0 (0.0%) |
| Finance & Insurance | 39 (25.8%) | 112 (74.2%) |
| Real Estate, Rental & Leasing | 72 (69.9%) | 31 (30.1%) |
| Professional & Scientific | 95 (52.8%) | 85 (47.2%) |
| Enterprise Management | 0 (0.0%) | 0 (0.0%) |
| Administrative & Support | 79 (58.1%) | 57 (41.9%) |
| Educational Services | 190 (52.8%) | 170 (47.2%) |
| Health Care & Social Assistance | 64 (8.7%) | 668 (91.3%) |
| Arts, Entertainment & Recreation | 11 (16.4%) | 56 (83.6%) |
| Accommodation & Food Services | 210 (43.8%) | 270 (56.2%) |
| Public Administration | 72 (27.0%) | 195 (73.0%) |
| Total | 2,745 (55.1%) | 2,233 (44.9%) |
Education in Cottage Grove
School Enrollment in Cottage Grove
The most common levels of schooling among the 2,253 students in Cottage Grove are elementary school (627 | 27.8%), high school (614 | 27.3%), and middle school (398 | 17.7%).
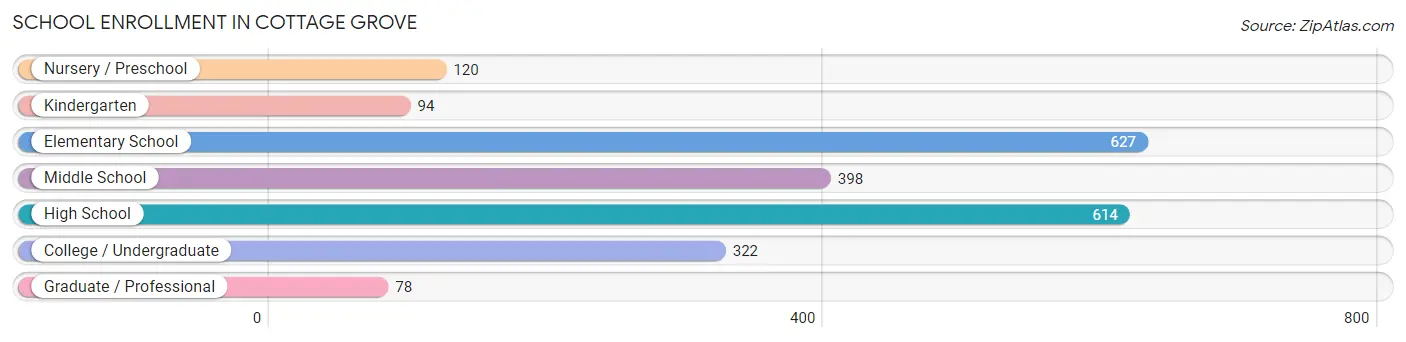
| School Level | # Students | % Students |
| Nursery / Preschool | 120 | 5.3% |
| Kindergarten | 94 | 4.2% |
| Elementary School | 627 | 27.8% |
| Middle School | 398 | 17.7% |
| High School | 614 | 27.3% |
| College / Undergraduate | 322 | 14.3% |
| Graduate / Professional | 78 | 3.5% |
| Total | 2,253 | 100.0% |
School Enrollment by Age by Funding Source in Cottage Grove
Out of a total of 2,253 students who are enrolled in schools in Cottage Grove, 372 (16.5%) attend a private institution, while the remaining 1,881 (83.5%) are enrolled in public schools. The age group of 35 years and over has the highest likelihood of being enrolled in private schools, with 104 (48.4% in the age bracket) enrolled. Conversely, the age group of 18 to 19 year olds has the lowest likelihood of being enrolled in a private school, with 145 (100.0% in the age bracket) attending a public institution.
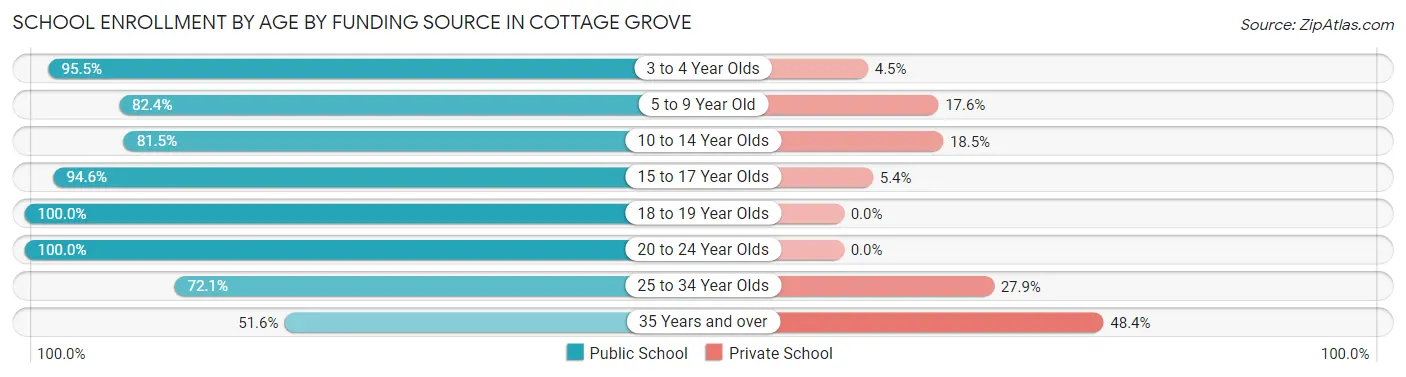
| Age Bracket | Public School | Private School |
| 3 to 4 Year Olds | 85 (95.5%) | 4 (4.5%) |
| 5 to 9 Year Old | 524 (82.4%) | 112 (17.6%) |
| 10 to 14 Year Olds | 485 (81.5%) | 110 (18.5%) |
| 15 to 17 Year Olds | 384 (94.6%) | 22 (5.4%) |
| 18 to 19 Year Olds | 145 (100.0%) | 0 (0.0%) |
| 20 to 24 Year Olds | 99 (100.0%) | 0 (0.0%) |
| 25 to 34 Year Olds | 49 (72.1%) | 19 (27.9%) |
| 35 Years and over | 111 (51.6%) | 104 (48.4%) |
| Total | 1,881 (83.5%) | 372 (16.5%) |
Educational Attainment by Field of Study in Cottage Grove
Arts & humanities (239 | 16.0%), business (214 | 14.4%), liberal arts & history (188 | 12.6%), psychology (150 | 10.1%), and bio, nature & agricultural (142 | 9.5%) are the most common fields of study among 1,490 individuals in Cottage Grove who have obtained a bachelor's degree or higher.
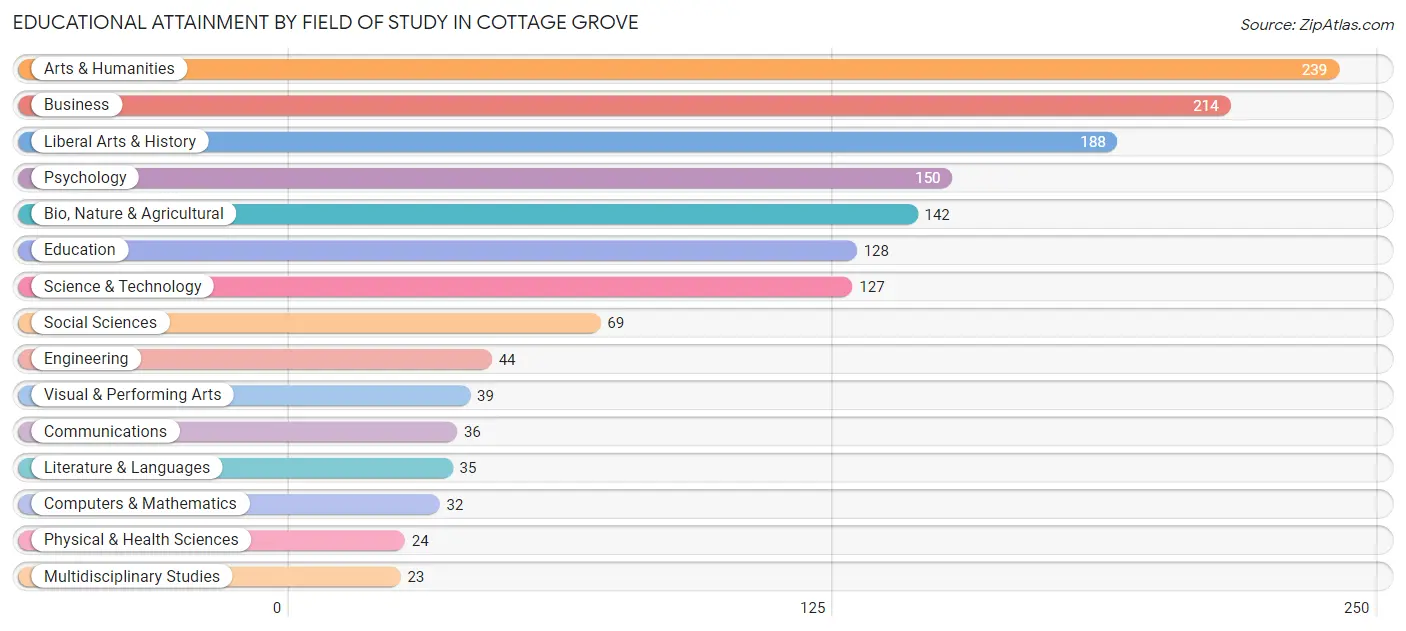
| Field of Study | # Graduates | % Graduates |
| Computers & Mathematics | 32 | 2.1% |
| Bio, Nature & Agricultural | 142 | 9.5% |
| Physical & Health Sciences | 24 | 1.6% |
| Psychology | 150 | 10.1% |
| Social Sciences | 69 | 4.6% |
| Engineering | 44 | 2.9% |
| Multidisciplinary Studies | 23 | 1.5% |
| Science & Technology | 127 | 8.5% |
| Business | 214 | 14.4% |
| Education | 128 | 8.6% |
| Literature & Languages | 35 | 2.4% |
| Liberal Arts & History | 188 | 12.6% |
| Visual & Performing Arts | 39 | 2.6% |
| Communications | 36 | 2.4% |
| Arts & Humanities | 239 | 16.0% |
| Total | 1,490 | 100.0% |
Transportation & Commute in Cottage Grove
Vehicle Availability by Sex in Cottage Grove
The most prevalent vehicle ownership categories in Cottage Grove are males with 2 vehicles (1,351, accounting for 49.8%) and females with 2 vehicles (853, making up 62.0%).
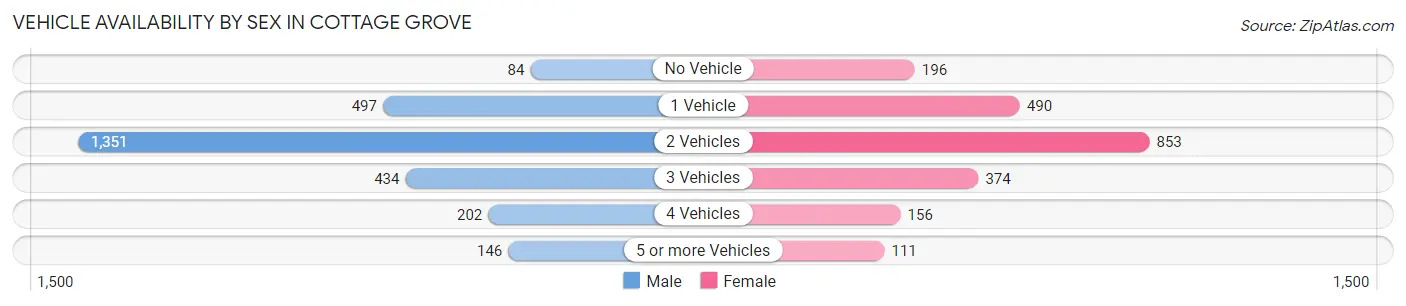
| Vehicles Available | Male | Female |
| No Vehicle | 84 (3.1%) | 196 (9.0%) |
| 1 Vehicle | 497 (18.3%) | 490 (22.5%) |
| 2 Vehicles | 1,351 (49.8%) | 853 (39.1%) |
| 3 Vehicles | 434 (16.0%) | 374 (17.2%) |
| 4 Vehicles | 202 (7.4%) | 156 (7.2%) |
| 5 or more Vehicles | 146 (5.4%) | 111 (5.1%) |
| Total | 2,714 (100.0%) | 2,180 (100.0%) |
Commute Time in Cottage Grove
The most frequently occuring commute durations in Cottage Grove are 5 to 9 minutes (904 commuters, 20.0%), 30 to 34 minutes (899 commuters, 19.9%), and less than 5 minutes (708 commuters, 15.7%).
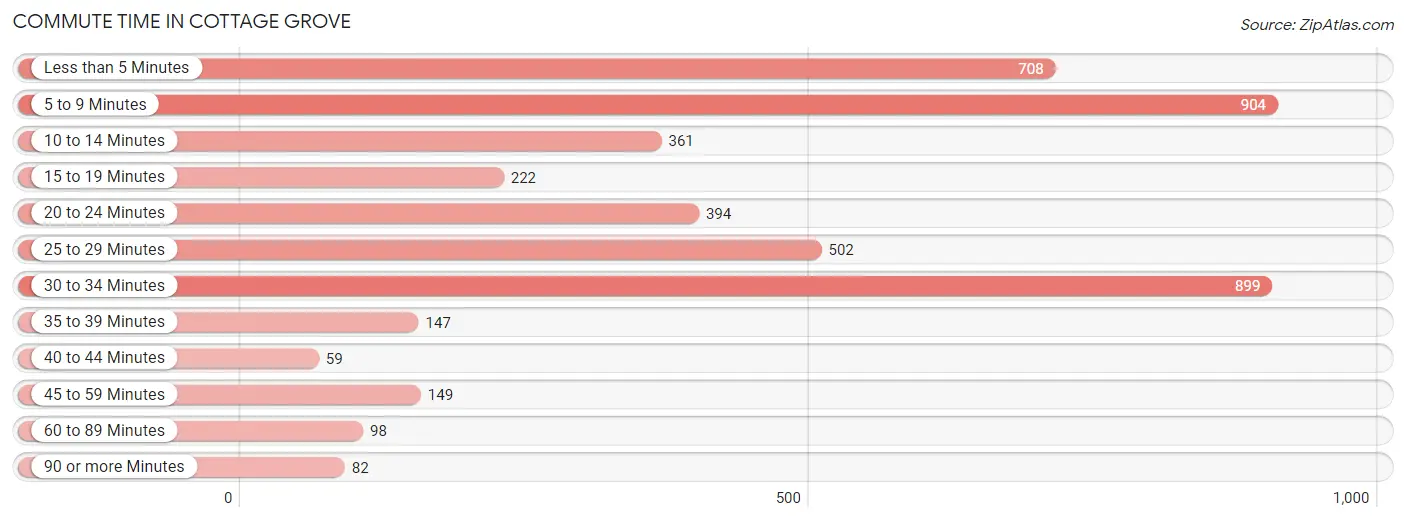
| Commute Time | # Commuters | % Commuters |
| Less than 5 Minutes | 708 | 15.7% |
| 5 to 9 Minutes | 904 | 20.0% |
| 10 to 14 Minutes | 361 | 8.0% |
| 15 to 19 Minutes | 222 | 4.9% |
| 20 to 24 Minutes | 394 | 8.7% |
| 25 to 29 Minutes | 502 | 11.1% |
| 30 to 34 Minutes | 899 | 19.9% |
| 35 to 39 Minutes | 147 | 3.3% |
| 40 to 44 Minutes | 59 | 1.3% |
| 45 to 59 Minutes | 149 | 3.3% |
| 60 to 89 Minutes | 98 | 2.2% |
| 90 or more Minutes | 82 | 1.8% |
Commute Time by Sex in Cottage Grove
The most common commute times in Cottage Grove are 30 to 34 minutes (545 commuters, 21.0%) for males and 5 to 9 minutes (520 commuters, 27.0%) for females.
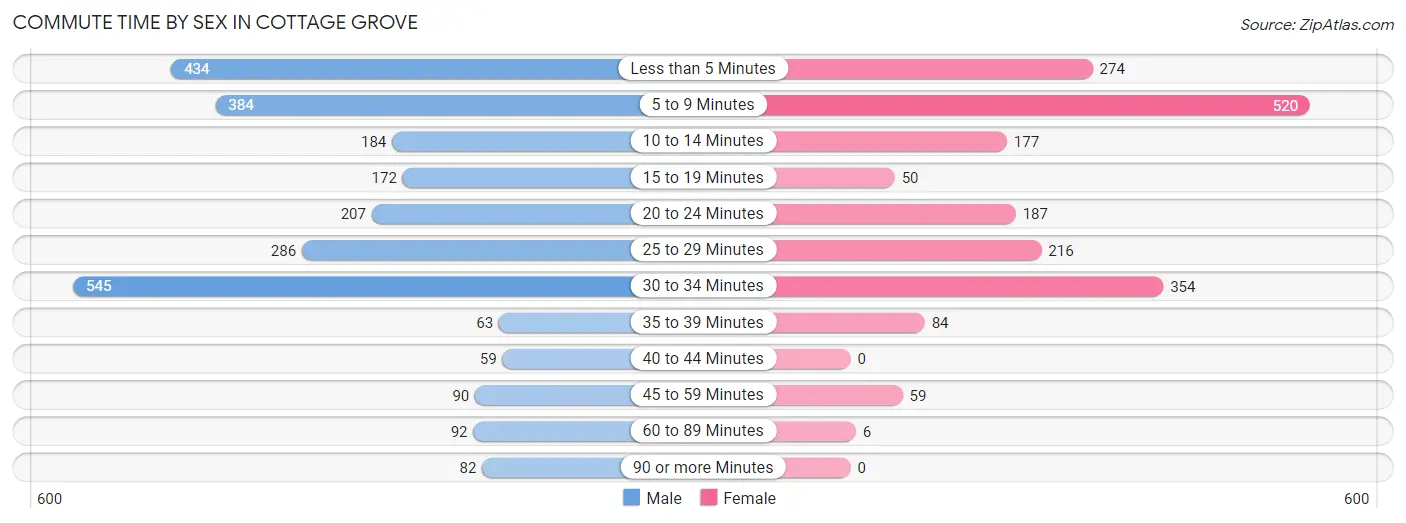
| Commute Time | Male | Female |
| Less than 5 Minutes | 434 (16.7%) | 274 (14.2%) |
| 5 to 9 Minutes | 384 (14.8%) | 520 (27.0%) |
| 10 to 14 Minutes | 184 (7.1%) | 177 (9.2%) |
| 15 to 19 Minutes | 172 (6.6%) | 50 (2.6%) |
| 20 to 24 Minutes | 207 (8.0%) | 187 (9.7%) |
| 25 to 29 Minutes | 286 (11.0%) | 216 (11.2%) |
| 30 to 34 Minutes | 545 (21.0%) | 354 (18.4%) |
| 35 to 39 Minutes | 63 (2.4%) | 84 (4.4%) |
| 40 to 44 Minutes | 59 (2.3%) | 0 (0.0%) |
| 45 to 59 Minutes | 90 (3.5%) | 59 (3.1%) |
| 60 to 89 Minutes | 92 (3.5%) | 6 (0.3%) |
| 90 or more Minutes | 82 (3.2%) | 0 (0.0%) |
Time of Departure to Work by Sex in Cottage Grove
The most frequent times of departure to work in Cottage Grove are 7:00 AM to 7:29 AM (351, 13.5%) for males and 7:00 AM to 7:29 AM (332, 17.2%) for females.
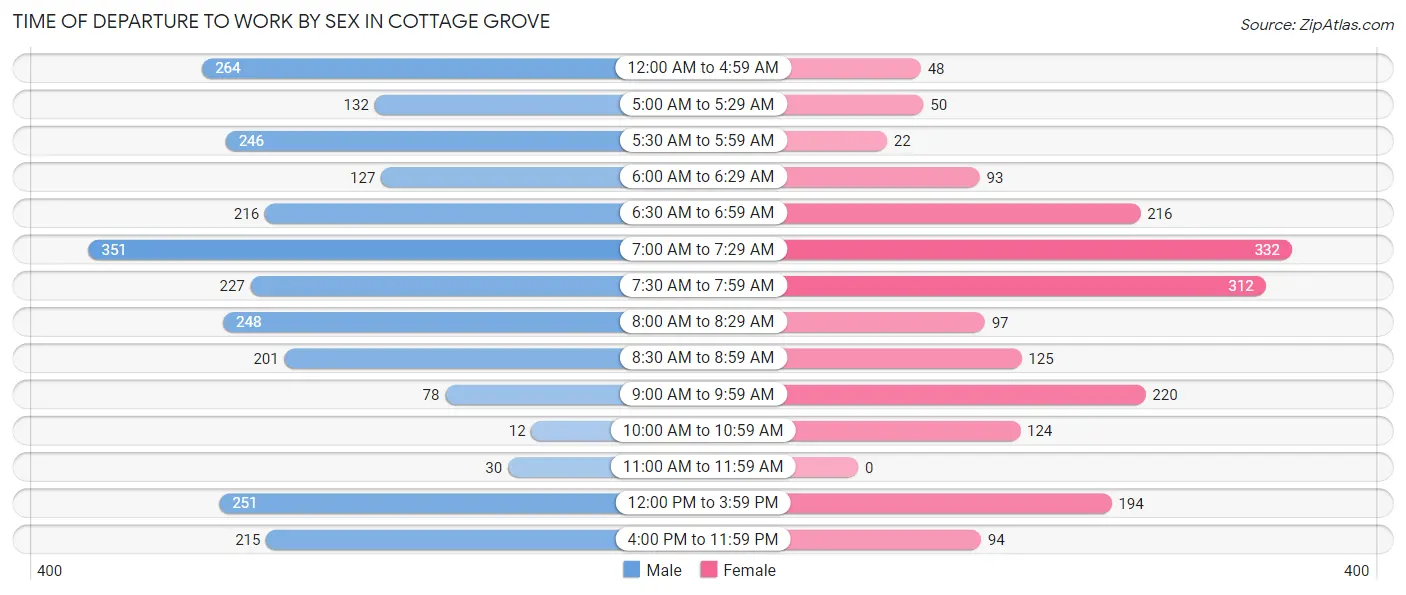
| Time of Departure | Male | Female |
| 12:00 AM to 4:59 AM | 264 (10.2%) | 48 (2.5%) |
| 5:00 AM to 5:29 AM | 132 (5.1%) | 50 (2.6%) |
| 5:30 AM to 5:59 AM | 246 (9.5%) | 22 (1.1%) |
| 6:00 AM to 6:29 AM | 127 (4.9%) | 93 (4.8%) |
| 6:30 AM to 6:59 AM | 216 (8.3%) | 216 (11.2%) |
| 7:00 AM to 7:29 AM | 351 (13.5%) | 332 (17.2%) |
| 7:30 AM to 7:59 AM | 227 (8.7%) | 312 (16.2%) |
| 8:00 AM to 8:29 AM | 248 (9.6%) | 97 (5.0%) |
| 8:30 AM to 8:59 AM | 201 (7.7%) | 125 (6.5%) |
| 9:00 AM to 9:59 AM | 78 (3.0%) | 220 (11.4%) |
| 10:00 AM to 10:59 AM | 12 (0.5%) | 124 (6.4%) |
| 11:00 AM to 11:59 AM | 30 (1.1%) | 0 (0.0%) |
| 12:00 PM to 3:59 PM | 251 (9.7%) | 194 (10.1%) |
| 4:00 PM to 11:59 PM | 215 (8.3%) | 94 (4.9%) |
| Total | 2,598 (100.0%) | 1,927 (100.0%) |
Housing Occupancy in Cottage Grove
Occupancy by Ownership in Cottage Grove
Of the total 4,210 dwellings in Cottage Grove, owner-occupied units account for 2,502 (59.4%), while renter-occupied units make up 1,708 (40.6%).

| Occupancy | # Housing Units | % Housing Units |
| Owner Occupied Housing Units | 2,502 | 59.4% |
| Renter-Occupied Housing Units | 1,708 | 40.6% |
| Total Occupied Housing Units | 4,210 | 100.0% |
Occupancy by Household Size in Cottage Grove
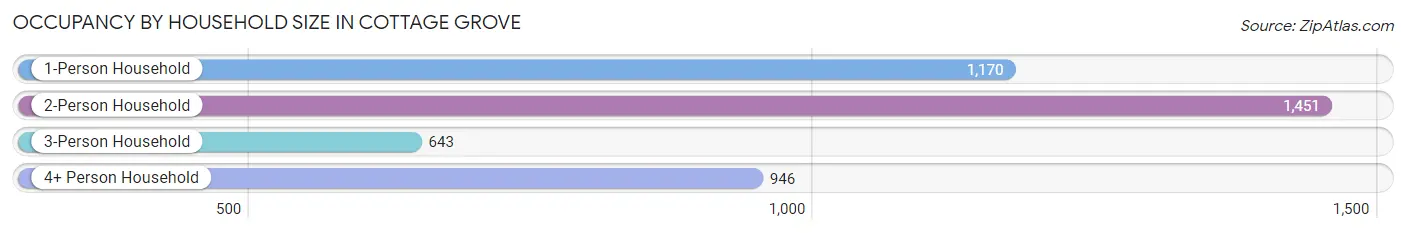
| Household Size | # Housing Units | % Housing Units |
| 1-Person Household | 1,170 | 27.8% |
| 2-Person Household | 1,451 | 34.5% |
| 3-Person Household | 643 | 15.3% |
| 4+ Person Household | 946 | 22.5% |
| Total Housing Units | 4,210 | 100.0% |
Occupancy by Ownership by Household Size in Cottage Grove
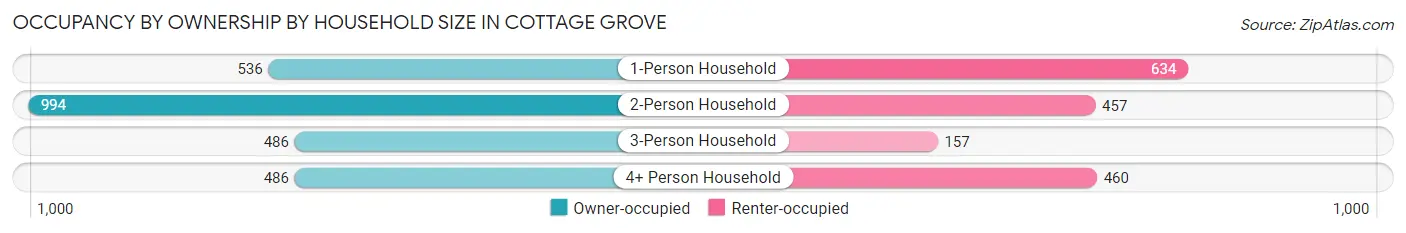
| Household Size | Owner-occupied | Renter-occupied |
| 1-Person Household | 536 (45.8%) | 634 (54.2%) |
| 2-Person Household | 994 (68.5%) | 457 (31.5%) |
| 3-Person Household | 486 (75.6%) | 157 (24.4%) |
| 4+ Person Household | 486 (51.4%) | 460 (48.6%) |
| Total Housing Units | 2,502 (59.4%) | 1,708 (40.6%) |
Occupancy by Educational Attainment in Cottage Grove
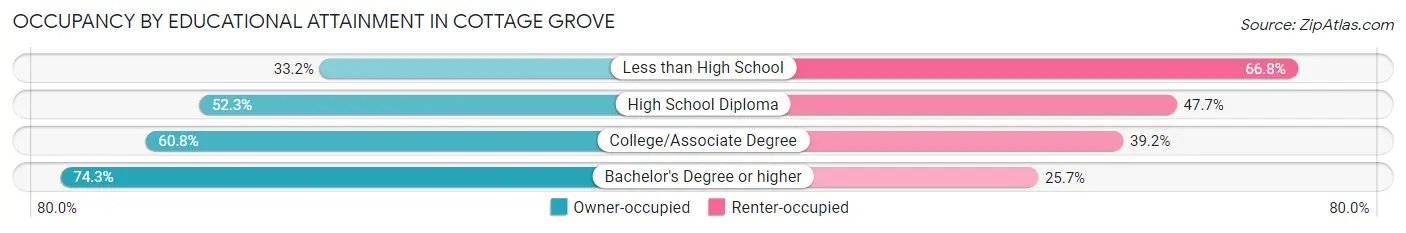
| Household Size | Owner-occupied | Renter-occupied |
| Less than High School | 73 (33.2%) | 147 (66.8%) |
| High School Diploma | 681 (52.3%) | 620 (47.7%) |
| College/Associate Degree | 1,131 (60.8%) | 728 (39.2%) |
| Bachelor's Degree or higher | 617 (74.3%) | 213 (25.7%) |
Occupancy by Age of Householder in Cottage Grove
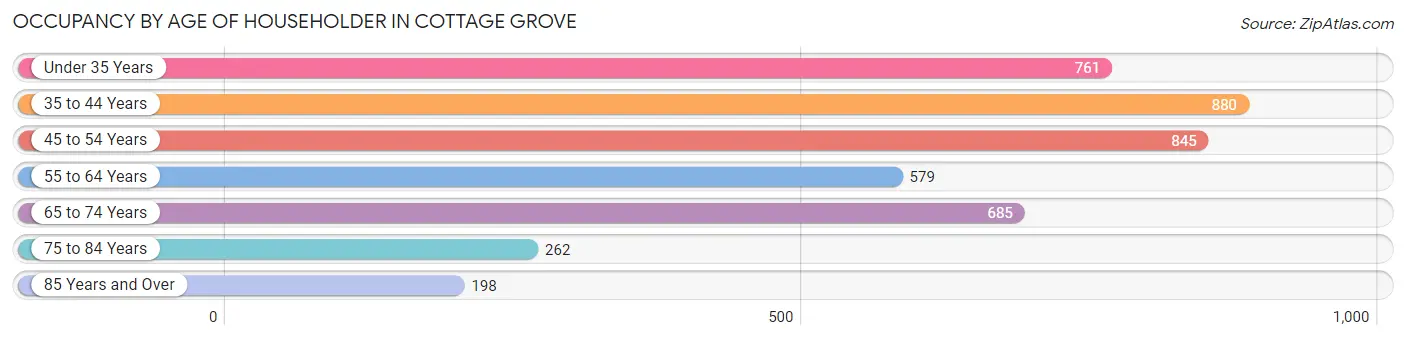
| Age Bracket | # Households | % Households |
| Under 35 Years | 761 | 18.1% |
| 35 to 44 Years | 880 | 20.9% |
| 45 to 54 Years | 845 | 20.1% |
| 55 to 64 Years | 579 | 13.8% |
| 65 to 74 Years | 685 | 16.3% |
| 75 to 84 Years | 262 | 6.2% |
| 85 Years and Over | 198 | 4.7% |
| Total | 4,210 | 100.0% |
Housing Finances in Cottage Grove
Median Income by Occupancy in Cottage Grove
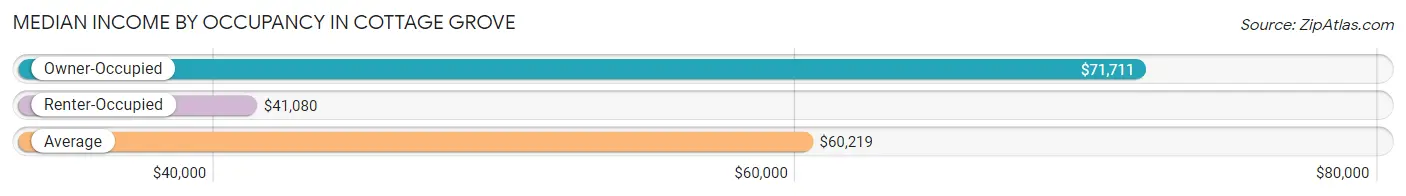
| Occupancy Type | # Households | Median Income |
| Owner-Occupied | 2,502 (59.4%) | $71,711 |
| Renter-Occupied | 1,708 (40.6%) | $41,080 |
| Average | 4,210 (100.0%) | $60,219 |
Occupancy by Householder Income Bracket in Cottage Grove
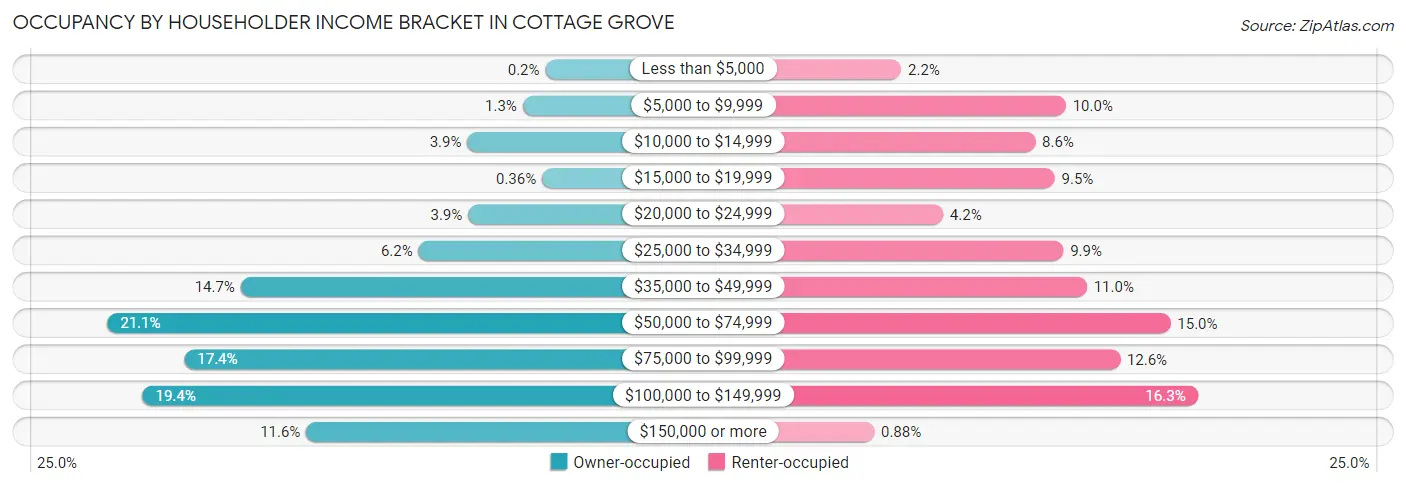
| Income Bracket | Owner-occupied | Renter-occupied |
| Less than $5,000 | 5 (0.2%) | 37 (2.2%) |
| $5,000 to $9,999 | 32 (1.3%) | 171 (10.0%) |
| $10,000 to $14,999 | 98 (3.9%) | 146 (8.6%) |
| $15,000 to $19,999 | 9 (0.4%) | 162 (9.5%) |
| $20,000 to $24,999 | 97 (3.9%) | 71 (4.2%) |
| $25,000 to $34,999 | 156 (6.2%) | 169 (9.9%) |
| $35,000 to $49,999 | 368 (14.7%) | 188 (11.0%) |
| $50,000 to $74,999 | 527 (21.1%) | 256 (15.0%) |
| $75,000 to $99,999 | 435 (17.4%) | 215 (12.6%) |
| $100,000 to $149,999 | 485 (19.4%) | 278 (16.3%) |
| $150,000 or more | 290 (11.6%) | 15 (0.9%) |
| Total | 2,502 (100.0%) | 1,708 (100.0%) |
Monthly Housing Cost Tiers in Cottage Grove
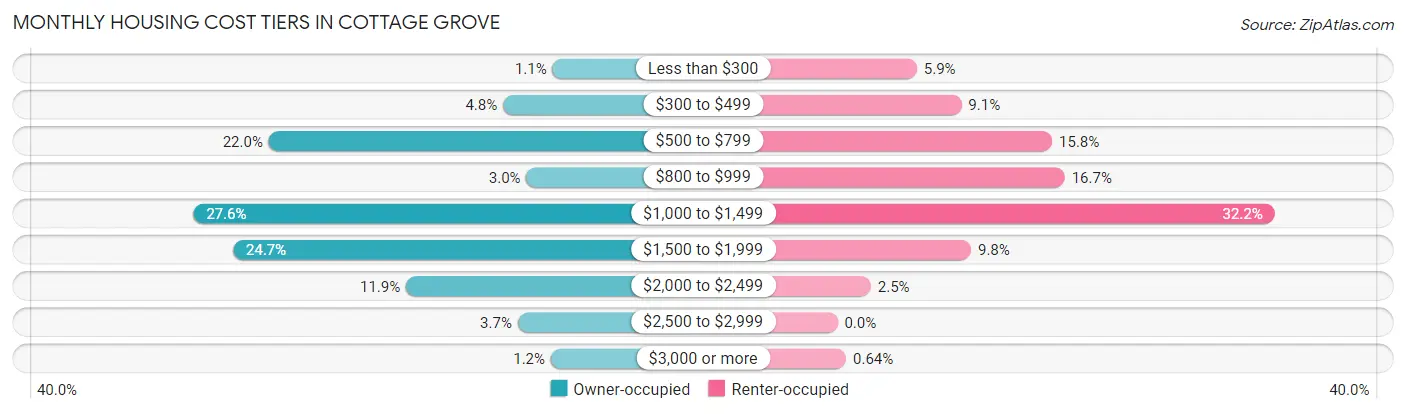
| Monthly Cost | Owner-occupied | Renter-occupied |
| Less than $300 | 28 (1.1%) | 100 (5.9%) |
| $300 to $499 | 119 (4.8%) | 156 (9.1%) |
| $500 to $799 | 551 (22.0%) | 270 (15.8%) |
| $800 to $999 | 76 (3.0%) | 286 (16.7%) |
| $1,000 to $1,499 | 690 (27.6%) | 550 (32.2%) |
| $1,500 to $1,999 | 617 (24.7%) | 168 (9.8%) |
| $2,000 to $2,499 | 298 (11.9%) | 42 (2.5%) |
| $2,500 to $2,999 | 92 (3.7%) | 0 (0.0%) |
| $3,000 or more | 31 (1.2%) | 11 (0.6%) |
| Total | 2,502 (100.0%) | 1,708 (100.0%) |
Physical Housing Characteristics in Cottage Grove
Housing Structures in Cottage Grove
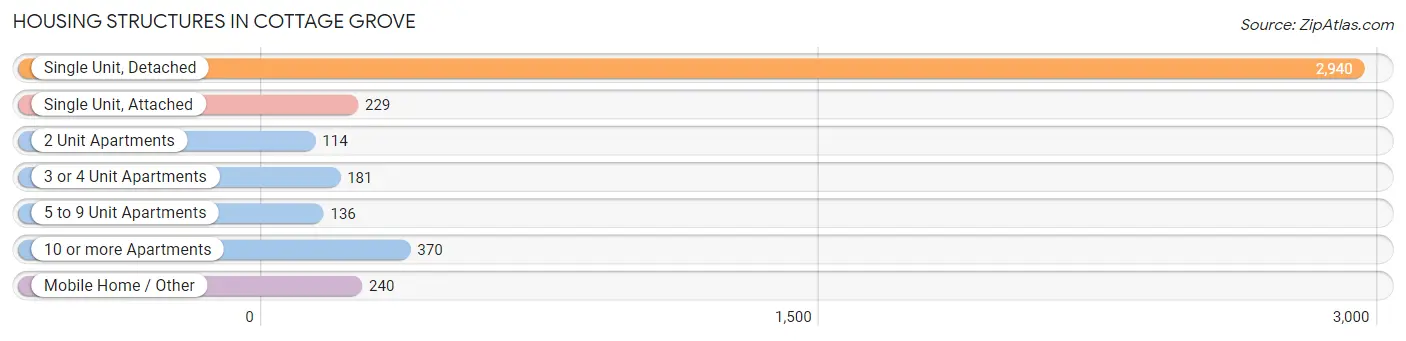
| Structure Type | # Housing Units | % Housing Units |
| Single Unit, Detached | 2,940 | 69.8% |
| Single Unit, Attached | 229 | 5.4% |
| 2 Unit Apartments | 114 | 2.7% |
| 3 or 4 Unit Apartments | 181 | 4.3% |
| 5 to 9 Unit Apartments | 136 | 3.2% |
| 10 or more Apartments | 370 | 8.8% |
| Mobile Home / Other | 240 | 5.7% |
| Total | 4,210 | 100.0% |
Housing Structures by Occupancy in Cottage Grove
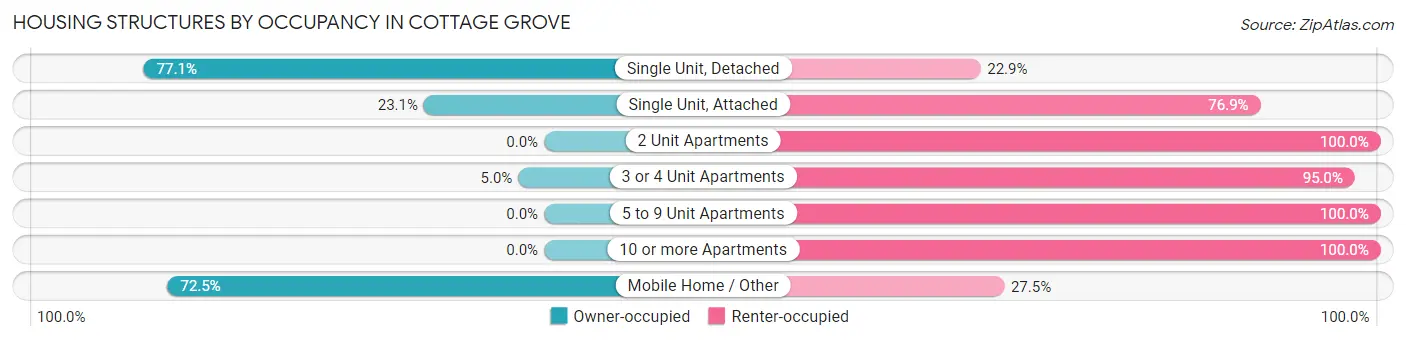
| Structure Type | Owner-occupied | Renter-occupied |
| Single Unit, Detached | 2,266 (77.1%) | 674 (22.9%) |
| Single Unit, Attached | 53 (23.1%) | 176 (76.9%) |
| 2 Unit Apartments | 0 (0.0%) | 114 (100.0%) |
| 3 or 4 Unit Apartments | 9 (5.0%) | 172 (95.0%) |
| 5 to 9 Unit Apartments | 0 (0.0%) | 136 (100.0%) |
| 10 or more Apartments | 0 (0.0%) | 370 (100.0%) |
| Mobile Home / Other | 174 (72.5%) | 66 (27.5%) |
| Total | 2,502 (59.4%) | 1,708 (40.6%) |
Housing Structures by Number of Rooms in Cottage Grove
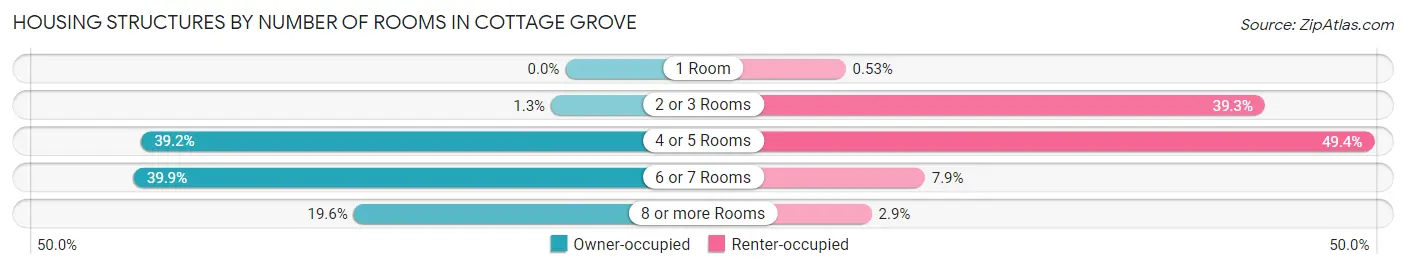
| Number of Rooms | Owner-occupied | Renter-occupied |
| 1 Room | 0 (0.0%) | 9 (0.5%) |
| 2 or 3 Rooms | 33 (1.3%) | 671 (39.3%) |
| 4 or 5 Rooms | 981 (39.2%) | 844 (49.4%) |
| 6 or 7 Rooms | 998 (39.9%) | 134 (7.9%) |
| 8 or more Rooms | 490 (19.6%) | 50 (2.9%) |
| Total | 2,502 (100.0%) | 1,708 (100.0%) |
Housing Structure by Heating Type in Cottage Grove
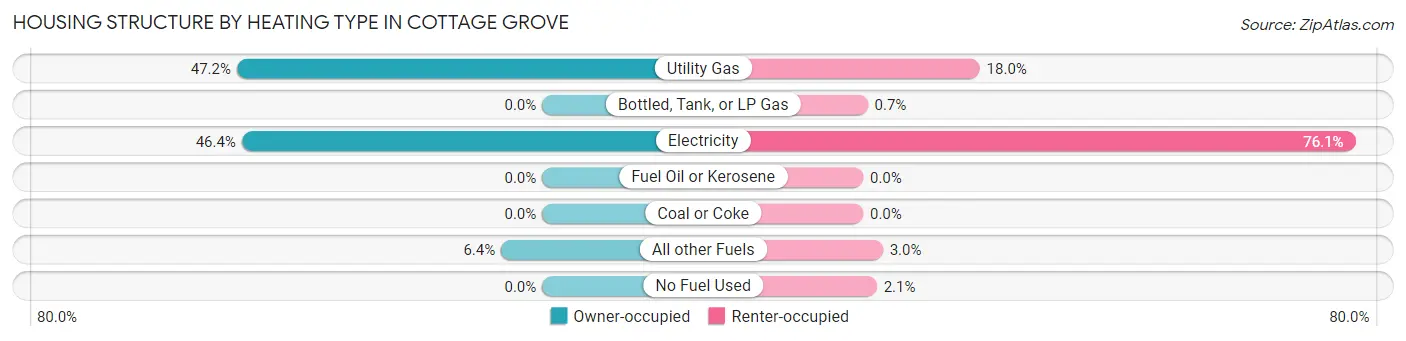
| Heating Type | Owner-occupied | Renter-occupied |
| Utility Gas | 1,181 (47.2%) | 308 (18.0%) |
| Bottled, Tank, or LP Gas | 0 (0.0%) | 12 (0.7%) |
| Electricity | 1,162 (46.4%) | 1,300 (76.1%) |
| Fuel Oil or Kerosene | 0 (0.0%) | 0 (0.0%) |
| Coal or Coke | 0 (0.0%) | 0 (0.0%) |
| All other Fuels | 159 (6.4%) | 52 (3.0%) |
| No Fuel Used | 0 (0.0%) | 36 (2.1%) |
| Total | 2,502 (100.0%) | 1,708 (100.0%) |
Household Vehicle Usage in Cottage Grove
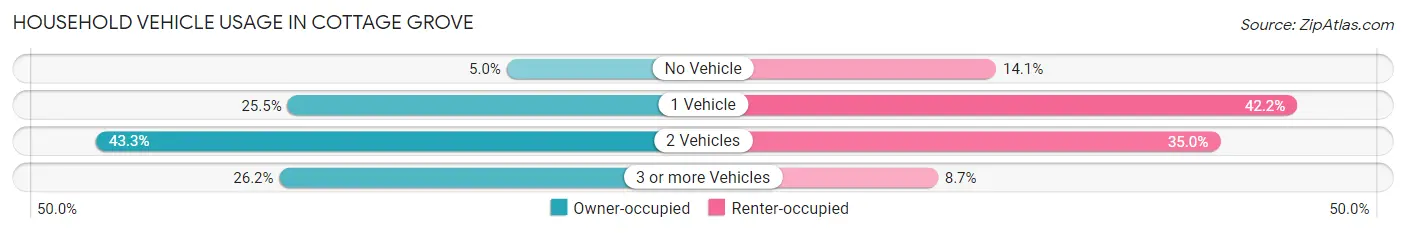
| Vehicles per Household | Owner-occupied | Renter-occupied |
| No Vehicle | 125 (5.0%) | 241 (14.1%) |
| 1 Vehicle | 637 (25.5%) | 721 (42.2%) |
| 2 Vehicles | 1,084 (43.3%) | 598 (35.0%) |
| 3 or more Vehicles | 656 (26.2%) | 148 (8.7%) |
| Total | 2,502 (100.0%) | 1,708 (100.0%) |
Real Estate & Mortgages in Cottage Grove
Real Estate and Mortgage Overview in Cottage Grove
| Characteristic | Without Mortgage | With Mortgage |
| Housing Units | 713 | 1,789 |
| Median Property Value | $280,800 | $287,300 |
| Median Household Income | $45,461 | $246 |
| Monthly Housing Costs | $601 | $31 |
| Real Estate Taxes | $2,990 | $17 |
Property Value by Mortgage Status in Cottage Grove
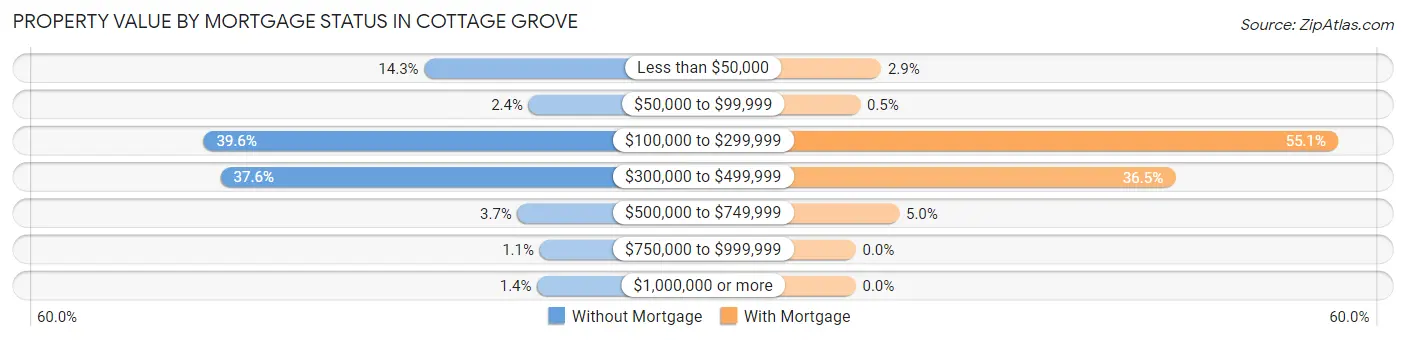
| Property Value | Without Mortgage | With Mortgage |
| Less than $50,000 | 102 (14.3%) | 52 (2.9%) |
| $50,000 to $99,999 | 17 (2.4%) | 9 (0.5%) |
| $100,000 to $299,999 | 282 (39.6%) | 986 (55.1%) |
| $300,000 to $499,999 | 268 (37.6%) | 653 (36.5%) |
| $500,000 to $749,999 | 26 (3.6%) | 89 (5.0%) |
| $750,000 to $999,999 | 8 (1.1%) | 0 (0.0%) |
| $1,000,000 or more | 10 (1.4%) | 0 (0.0%) |
| Total | 713 (100.0%) | 1,789 (100.0%) |
Household Income by Mortgage Status in Cottage Grove
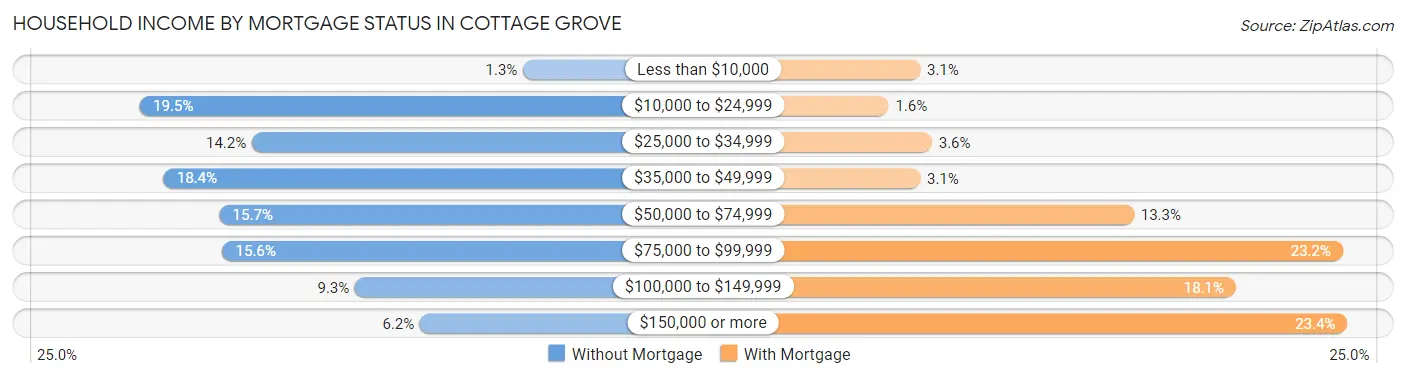
| Household Income | Without Mortgage | With Mortgage |
| Less than $10,000 | 9 (1.3%) | 55 (3.1%) |
| $10,000 to $24,999 | 139 (19.5%) | 28 (1.6%) |
| $25,000 to $34,999 | 101 (14.2%) | 65 (3.6%) |
| $35,000 to $49,999 | 131 (18.4%) | 55 (3.1%) |
| $50,000 to $74,999 | 112 (15.7%) | 237 (13.3%) |
| $75,000 to $99,999 | 111 (15.6%) | 415 (23.2%) |
| $100,000 to $149,999 | 66 (9.3%) | 324 (18.1%) |
| $150,000 or more | 44 (6.2%) | 419 (23.4%) |
| Total | 713 (100.0%) | 1,789 (100.0%) |
Property Value to Household Income Ratio in Cottage Grove
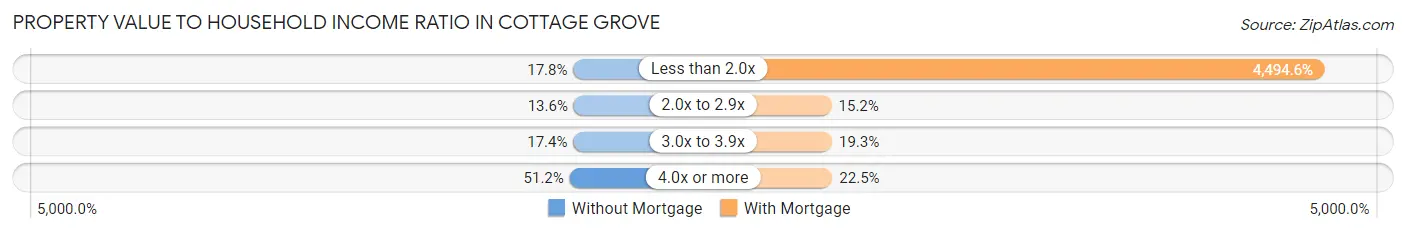
| Value-to-Income Ratio | Without Mortgage | With Mortgage |
| Less than 2.0x | 127 (17.8%) | 80,408 (4,494.6%) |
| 2.0x to 2.9x | 97 (13.6%) | 271 (15.1%) |
| 3.0x to 3.9x | 124 (17.4%) | 345 (19.3%) |
| 4.0x or more | 365 (51.2%) | 402 (22.5%) |
| Total | 713 (100.0%) | 1,789 (100.0%) |
Real Estate Taxes by Mortgage Status in Cottage Grove
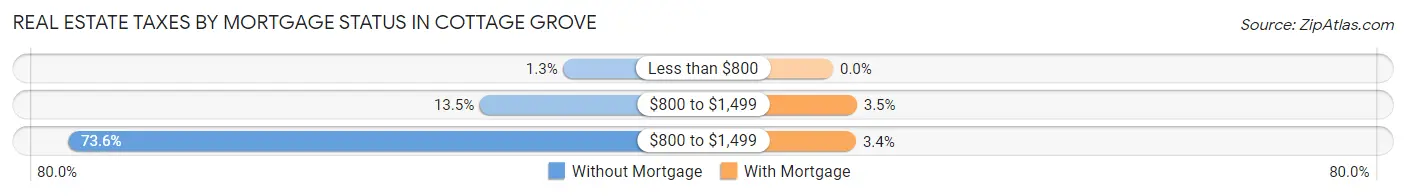
| Property Taxes | Without Mortgage | With Mortgage |
| Less than $800 | 9 (1.3%) | 0 (0.0%) |
| $800 to $1,499 | 96 (13.5%) | 62 (3.5%) |
| $800 to $1,499 | 525 (73.6%) | 60 (3.4%) |
| Total | 713 (100.0%) | 1,789 (100.0%) |
Health & Disability in Cottage Grove
Health Insurance Coverage by Age in Cottage Grove
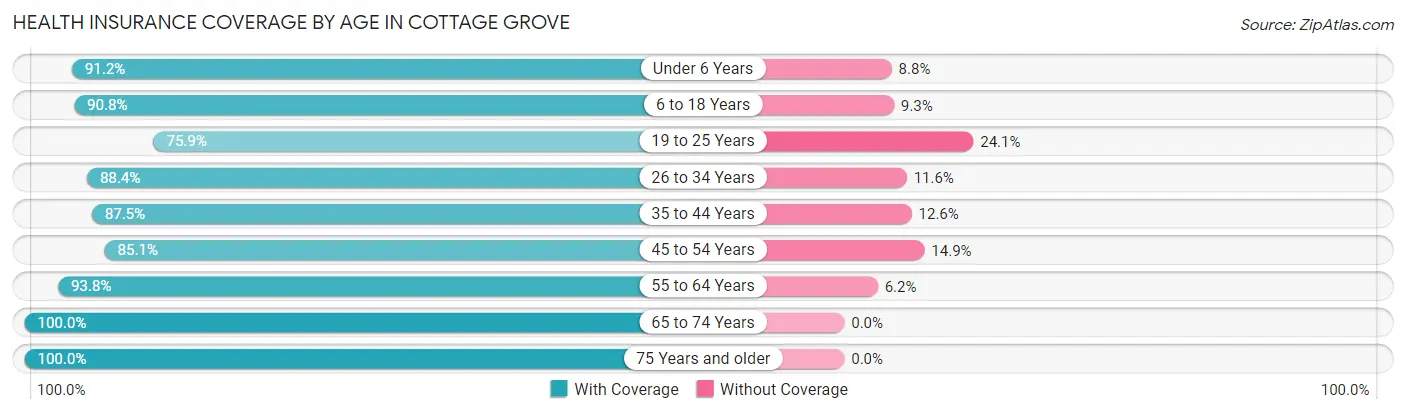
| Age Bracket | With Coverage | Without Coverage |
| Under 6 Years | 547 (91.2%) | 53 (8.8%) |
| 6 to 18 Years | 1,619 (90.7%) | 165 (9.2%) |
| 19 to 25 Years | 1,045 (75.9%) | 331 (24.1%) |
| 26 to 34 Years | 896 (88.4%) | 118 (11.6%) |
| 35 to 44 Years | 1,498 (87.5%) | 215 (12.6%) |
| 45 to 54 Years | 1,048 (85.1%) | 184 (14.9%) |
| 55 to 64 Years | 978 (93.8%) | 65 (6.2%) |
| 65 to 74 Years | 996 (100.0%) | 0 (0.0%) |
| 75 Years and older | 710 (100.0%) | 0 (0.0%) |
| Total | 9,337 (89.2%) | 1,131 (10.8%) |
Health Insurance Coverage by Citizenship Status in Cottage Grove

| Citizenship Status | With Coverage | Without Coverage |
| Native Born | 547 (91.2%) | 53 (8.8%) |
| Foreign Born, Citizen | 1,619 (90.7%) | 165 (9.2%) |
| Foreign Born, not a Citizen | 1,045 (75.9%) | 331 (24.1%) |
Health Insurance Coverage by Household Income in Cottage Grove
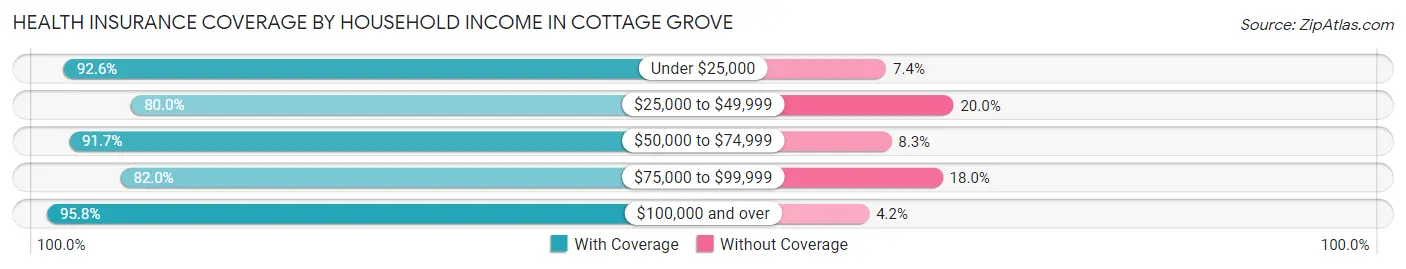
| Household Income | With Coverage | Without Coverage |
| Under $25,000 | 1,182 (92.6%) | 94 (7.4%) |
| $25,000 to $49,999 | 1,449 (80.0%) | 362 (20.0%) |
| $50,000 to $74,999 | 1,692 (91.7%) | 154 (8.3%) |
| $75,000 to $99,999 | 1,731 (82.0%) | 379 (18.0%) |
| $100,000 and over | 3,239 (95.8%) | 142 (4.2%) |
Public vs Private Health Insurance Coverage by Age in Cottage Grove
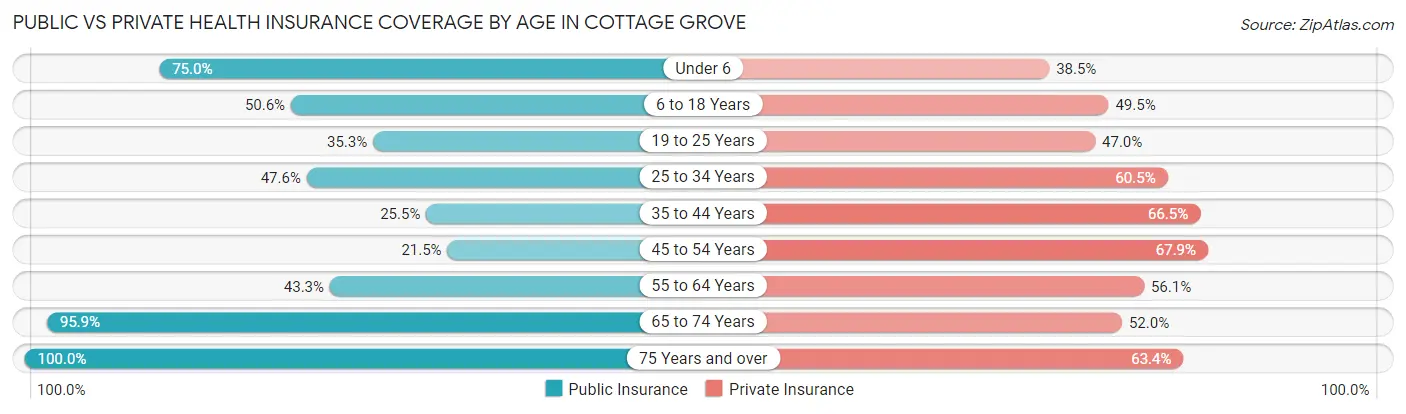
| Age Bracket | Public Insurance | Private Insurance |
| Under 6 | 450 (75.0%) | 231 (38.5%) |
| 6 to 18 Years | 902 (50.6%) | 883 (49.5%) |
| 19 to 25 Years | 486 (35.3%) | 647 (47.0%) |
| 25 to 34 Years | 483 (47.6%) | 613 (60.5%) |
| 35 to 44 Years | 436 (25.5%) | 1,139 (66.5%) |
| 45 to 54 Years | 265 (21.5%) | 837 (67.9%) |
| 55 to 64 Years | 452 (43.3%) | 585 (56.1%) |
| 65 to 74 Years | 955 (95.9%) | 518 (52.0%) |
| 75 Years and over | 710 (100.0%) | 450 (63.4%) |
| Total | 5,139 (49.1%) | 5,903 (56.4%) |
Disability Status by Sex by Age in Cottage Grove
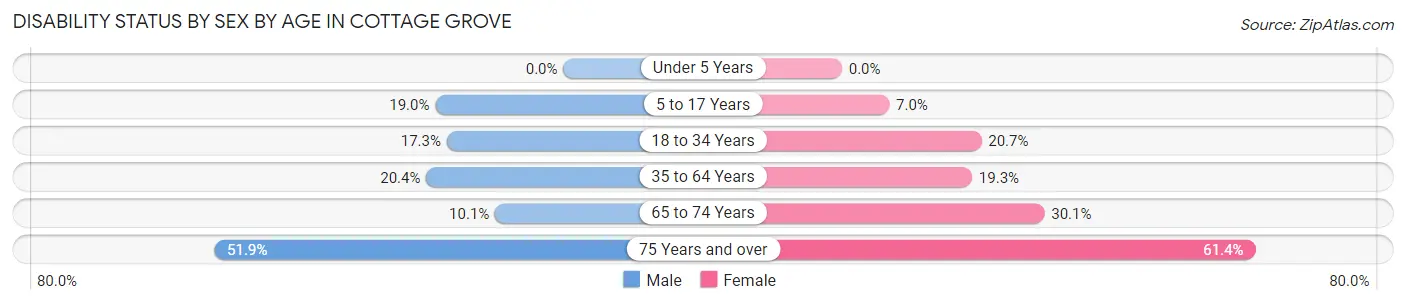
| Age Bracket | Male | Female |
| Under 5 Years | 0 (0.0%) | 0 (0.0%) |
| 5 to 17 Years | 177 (19.0%) | 56 (7.0%) |
| 18 to 34 Years | 275 (17.3%) | 192 (20.7%) |
| 35 to 64 Years | 405 (20.3%) | 386 (19.3%) |
| 65 to 74 Years | 46 (10.1%) | 163 (30.1%) |
| 75 Years and over | 125 (51.9%) | 288 (61.4%) |
Disability Class by Sex by Age in Cottage Grove
Disability Class: Hearing Difficulty
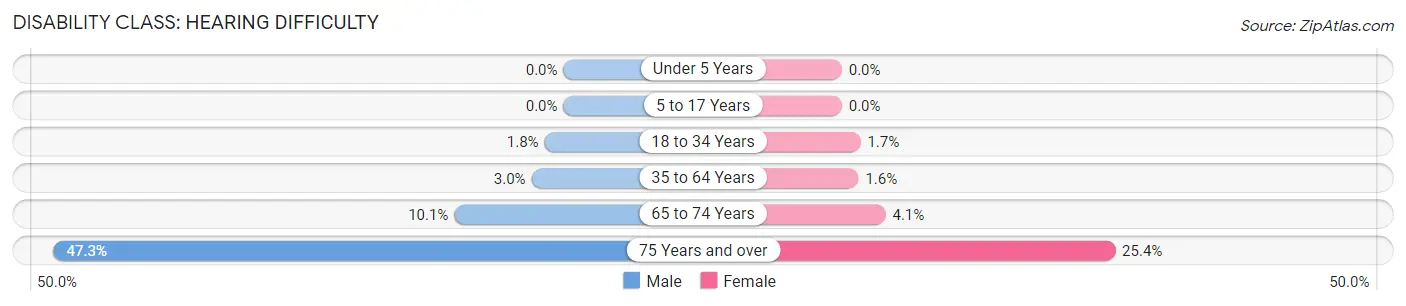
| Age Bracket | Male | Female |
| Under 5 Years | 0 (0.0%) | 0 (0.0%) |
| 5 to 17 Years | 0 (0.0%) | 0 (0.0%) |
| 18 to 34 Years | 28 (1.8%) | 16 (1.7%) |
| 35 to 64 Years | 59 (3.0%) | 31 (1.5%) |
| 65 to 74 Years | 46 (10.1%) | 22 (4.1%) |
| 75 Years and over | 114 (47.3%) | 119 (25.4%) |
Disability Class: Vision Difficulty
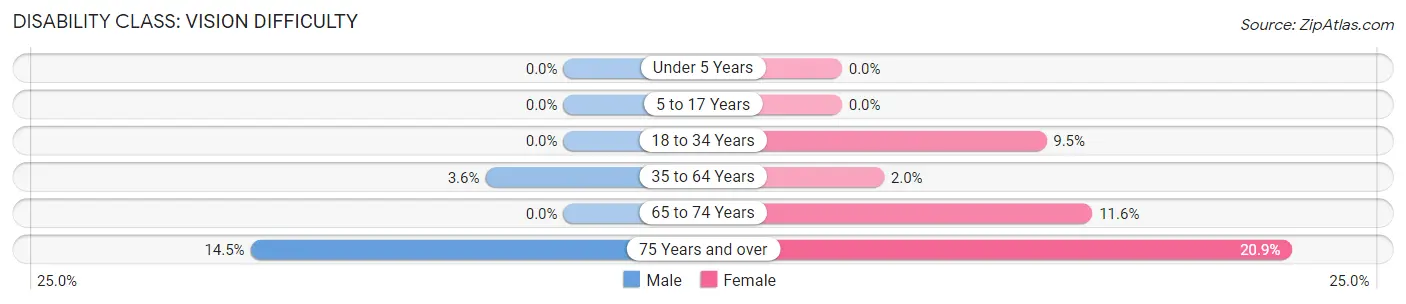
| Age Bracket | Male | Female |
| Under 5 Years | 0 (0.0%) | 0 (0.0%) |
| 5 to 17 Years | 0 (0.0%) | 0 (0.0%) |
| 18 to 34 Years | 0 (0.0%) | 88 (9.5%) |
| 35 to 64 Years | 72 (3.6%) | 39 (1.9%) |
| 65 to 74 Years | 0 (0.0%) | 63 (11.6%) |
| 75 Years and over | 35 (14.5%) | 98 (20.9%) |
Disability Class: Cognitive Difficulty
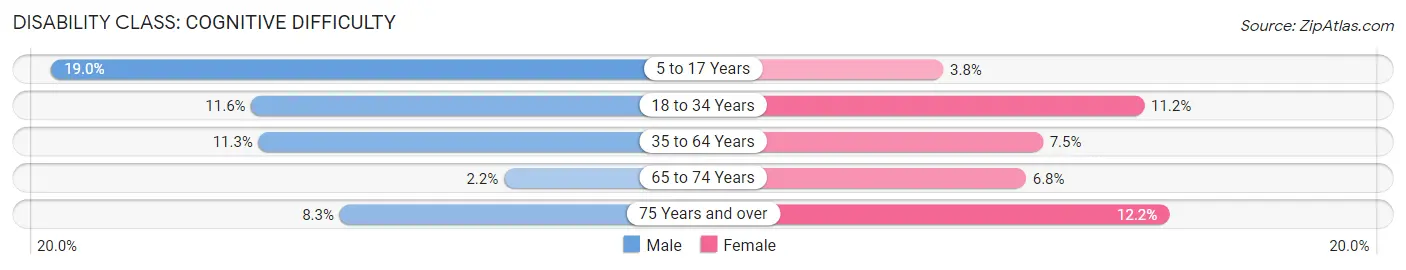
| Age Bracket | Male | Female |
| 5 to 17 Years | 177 (19.0%) | 30 (3.8%) |
| 18 to 34 Years | 184 (11.6%) | 104 (11.2%) |
| 35 to 64 Years | 225 (11.3%) | 149 (7.5%) |
| 65 to 74 Years | 10 (2.2%) | 37 (6.8%) |
| 75 Years and over | 20 (8.3%) | 57 (12.1%) |
Disability Class: Ambulatory Difficulty
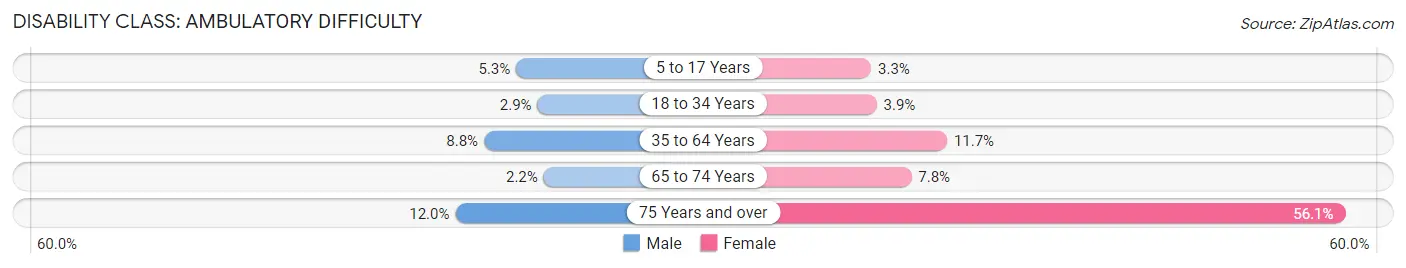
| Age Bracket | Male | Female |
| 5 to 17 Years | 49 (5.3%) | 26 (3.3%) |
| 18 to 34 Years | 46 (2.9%) | 36 (3.9%) |
| 35 to 64 Years | 176 (8.8%) | 234 (11.7%) |
| 65 to 74 Years | 10 (2.2%) | 42 (7.7%) |
| 75 Years and over | 29 (12.0%) | 263 (56.1%) |
Disability Class: Self-Care Difficulty
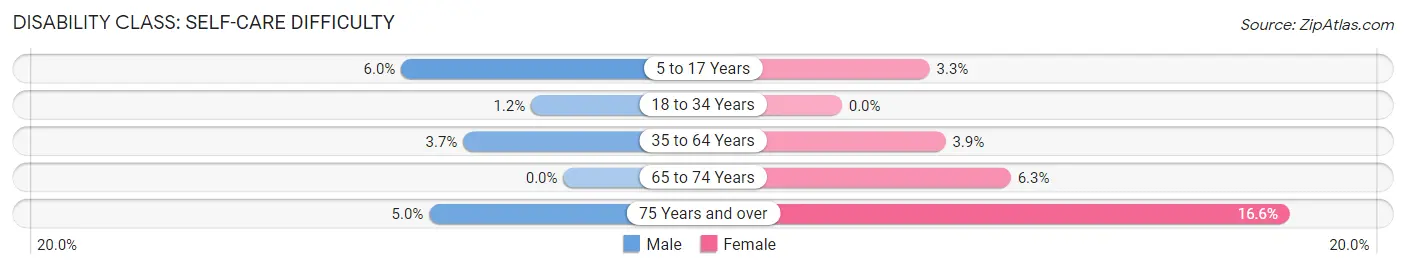
| Age Bracket | Male | Female |
| 5 to 17 Years | 56 (6.0%) | 26 (3.3%) |
| 18 to 34 Years | 19 (1.2%) | 0 (0.0%) |
| 35 to 64 Years | 74 (3.7%) | 77 (3.8%) |
| 65 to 74 Years | 0 (0.0%) | 34 (6.3%) |
| 75 Years and over | 12 (5.0%) | 78 (16.6%) |
Technology Access in Cottage Grove
Computing Device Access in Cottage Grove
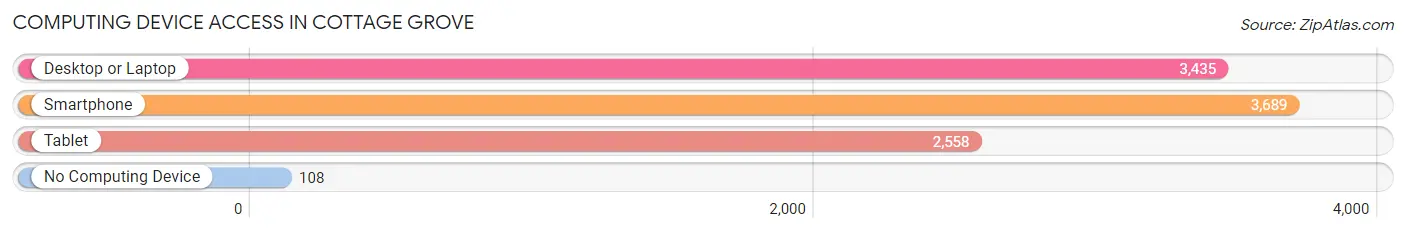
| Device Type | # Households | % Households |
| Desktop or Laptop | 3,435 | 81.6% |
| Smartphone | 3,689 | 87.6% |
| Tablet | 2,558 | 60.8% |
| No Computing Device | 108 | 2.6% |
| Total | 4,210 | 100.0% |
Internet Access in Cottage Grove
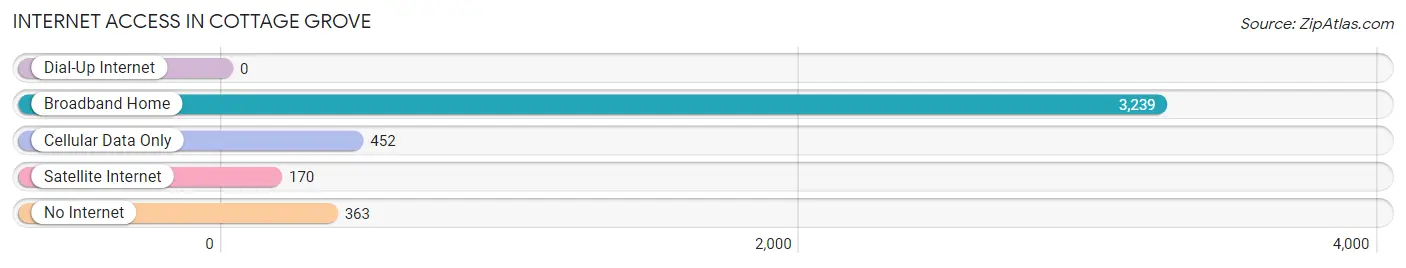
| Internet Type | # Households | % Households |
| Dial-Up Internet | 0 | 0.0% |
| Broadband Home | 3,239 | 76.9% |
| Cellular Data Only | 452 | 10.7% |
| Satellite Internet | 170 | 4.0% |
| No Internet | 363 | 8.6% |
| Total | 4,210 | 100.0% |
Cottage Grove Summary
Cottage Grove is a city located in Lane County, Oregon, United States. It is situated in the southern part of the Willamette Valley, approximately 15 miles south of Eugene and 90 miles south of Portland. The city is located along the Coast Fork of the Willamette River, and is surrounded by the Cascade Mountains to the east and the Coast Range to the west. As of the 2010 census, the city had a population of 9,686.
History
The area that is now Cottage Grove was first inhabited by the Kalapuya Native American tribe. The first white settlers arrived in the area in the 1850s, and the city was officially incorporated in 1872. The city was named after a grove of trees near the original town site.
In the late 19th century, Cottage Grove was a major logging center, and the city was home to several sawmills and lumber companies. The city also had a thriving agricultural industry, and was known for its production of hops, fruit, and vegetables.
In the early 20th century, Cottage Grove became a popular tourist destination, and the city was home to several resorts and hotels. The city also had a thriving entertainment industry, and was home to several theaters, dance halls, and other attractions.
Geography
Cottage Grove is located at an elevation of 441 feet (134 m) above sea level. The city is situated in the southern part of the Willamette Valley, approximately 15 miles south of Eugene and 90 miles south of Portland. The city is located along the Coast Fork of the Willamette River, and is surrounded by the Cascade Mountains to the east and the Coast Range to the west.
The city has a total area of 4.3 square miles (11.2 km2), of which 4.2 square miles (10.9 km2) is land and 0.1 square miles (0.3 km2) is water.
Economy
Cottage Grove’s economy is largely based on the timber industry, and the city is home to several lumber mills and wood-products companies. The city also has a thriving agricultural industry, and is known for its production of hops, fruit, and vegetables.
The city is also home to several manufacturing companies, including a paper mill, a plastics factory, and a metal-fabrication plant. In addition, the city is home to several retail stores, restaurants, and other businesses.
Demographics
As of the 2010 census, there were 9,686 people, 3,845 households, and 2,541 families residing in the city. The population density was 2,288.2 people per square mile (883.3/km2). There were 4,093 housing units at an average density of 972.2 per square mile (375.3/km2).
The racial makeup of the city was 90.2% White, 0.7% African American, 1.2% Native American, 0.9% Asian, 0.1% Pacific Islander, 4.2% from other races, and 2.7% from two or more races. Hispanic or Latino of any race were 8.2% of the population.
There were 3,845 households, out of which 32.2% had children under the age of 18 living with them, 48.2% were married couples living together, 12.7% had a female householder with no husband present, and 33.3% were non-families. 27.2% of all households were made up of individuals, and 11.3% had someone living alone who was 65 years of age or older. The average household size was 2.50 and the average family size was 3.02.
In the city, the population was spread out, with 26.2% under the age of 18, 8.3% from 18 to 24, 27.2% from 25 to 44, 24.2% from 45 to 64, and 14.1% who were 65 years of age or older. The median age was 37 years. For every 100 females, there were 94.2 males. For every 100 females age 18 and over, there were 91.2 males.
The median income for a household in the city was $35,945, and the median income for a family was $41,944. Males had a median income of $35,945 versus $25,945 for females. The per capita income for the city was $17,845. About 11.2% of families and 14.2% of the population were below the poverty line, including 19.2% of those under age 18 and 8.2% of those age 65 or over.
Common Questions
What is Per Capita Income in Cottage Grove?
Per Capita income in Cottage Grove is $27,942.
What is the Median Family Income in Cottage Grove?
Median Family Income in Cottage Grove is $67,326.
What is the Median Household income in Cottage Grove?
Median Household Income in Cottage Grove is $60,219.
What is Income or Wage Gap in Cottage Grove?
Income or Wage Gap in Cottage Grove is 23.8%.
Women in Cottage Grove earn 76.2 cents for every dollar earned by a man.
What is Inequality or Gini Index in Cottage Grove?
Inequality or Gini Index in Cottage Grove is 0.39.
What is the Total Population of Cottage Grove?
Total Population of Cottage Grove is 10,583.
What is the Total Male Population of Cottage Grove?
Total Male Population of Cottage Grove is 5,593.
What is the Total Female Population of Cottage Grove?
Total Female Population of Cottage Grove is 4,990.
What is the Ratio of Males per 100 Females in Cottage Grove?
There are 112.08 Males per 100 Females in Cottage Grove.
What is the Ratio of Females per 100 Males in Cottage Grove?
There are 89.22 Females per 100 Males in Cottage Grove.
What is the Median Population Age in Cottage Grove?
Median Population Age in Cottage Grove is 38.2 Years.
What is the Average Family Size in Cottage Grove
Average Family Size in Cottage Grove is 3.0 People.
What is the Average Household Size in Cottage Grove
Average Household Size in Cottage Grove is 2.5 People.
How Large is the Labor Force in Cottage Grove?
There are 5,303 People in the Labor Forcein in Cottage Grove.
What is the Percentage of People in the Labor Force in Cottage Grove?
62.1% of People are in the Labor Force in Cottage Grove.
What is the Unemployment Rate in Cottage Grove?
Unemployment Rate in Cottage Grove is 6.1%.