Rainier, OR Map & Demographics
Rainier Map
Rainier Overview
$29,692
PER CAPITA INCOME
$59,931
AVG FAMILY INCOME
$58,333
AVG HOUSEHOLD INCOME
54.5%
WAGE / INCOME GAP [ % ]
45.5¢/ $1
WAGE / INCOME GAP [ $ ]
0.45
INEQUALITY / GINI INDEX
2,010
TOTAL POPULATION
987
MALE POPULATION
1,023
FEMALE POPULATION
96.48
MALES / 100 FEMALES
103.65
FEMALES / 100 MALES
34.1
MEDIAN AGE
3.3
AVG FAMILY SIZE
2.5
AVG HOUSEHOLD SIZE
735
LABOR FORCE [ PEOPLE ]
51.3%
PERCENT IN LABOR FORCE
Rainier Zip Codes
Income in Rainier
Income Overview in Rainier
Per Capita Income in Rainier is $29,692, while median incomes of families and households are $59,931 and $58,333 respectively.
| Characteristic | Number | Measure |
| Per Capita Income | 2,010 | $29,692 |
| Median Family Income | 449 | $59,931 |
| Mean Family Income | 449 | $83,195 |
| Median Household Income | 804 | $58,333 |
| Mean Household Income | 804 | $73,555 |
| Income Deficit | 449 | $0 |
| Wage / Income Gap (%) | 2,010 | 54.54% |
| Wage / Income Gap ($) | 2,010 | 45.46¢ per $1 |
| Gini / Inequality Index | 2,010 | 0.45 |
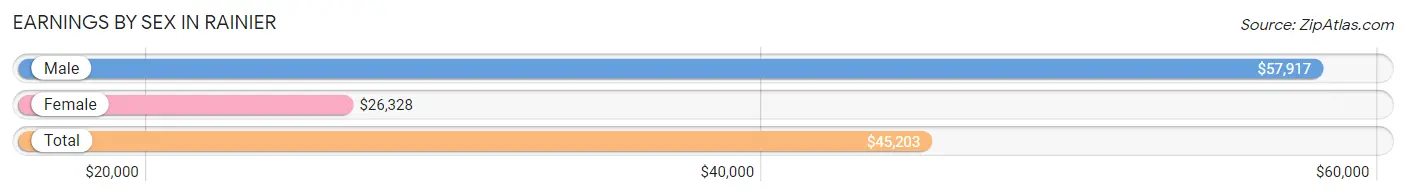
Earnings by Sex in Rainier
Average Earnings in Rainier are $45,203, $57,917 for men and $26,328 for women, a difference of 54.5%.
| Sex | Number | Average Earnings |
| Male | 543 (67.7%) | $57,917 |
| Female | 259 (32.3%) | $26,328 |
| Total | 802 (100.0%) | $45,203 |
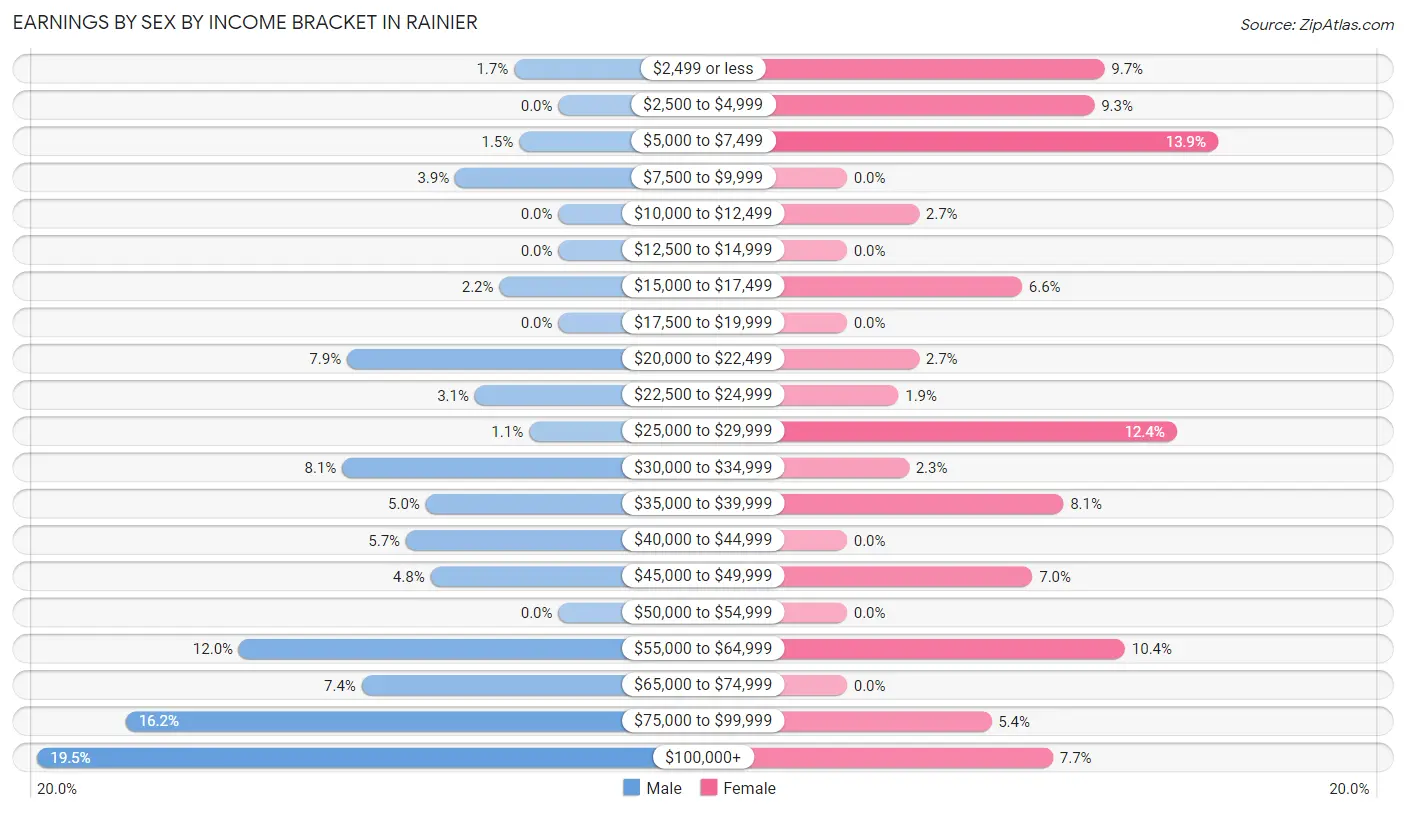
Earnings by Sex by Income Bracket in Rainier
The most common earnings brackets in Rainier are $100,000+ for men (106 | 19.5%) and $5,000 to $7,499 for women (36 | 13.9%).
| Income | Male | Female |
| $2,499 or less | 9 (1.7%) | 25 (9.7%) |
| $2,500 to $4,999 | 0 (0.0%) | 24 (9.3%) |
| $5,000 to $7,499 | 8 (1.5%) | 36 (13.9%) |
| $7,500 to $9,999 | 21 (3.9%) | 0 (0.0%) |
| $10,000 to $12,499 | 0 (0.0%) | 7 (2.7%) |
| $12,500 to $14,999 | 0 (0.0%) | 0 (0.0%) |
| $15,000 to $17,499 | 12 (2.2%) | 17 (6.6%) |
| $17,500 to $19,999 | 0 (0.0%) | 0 (0.0%) |
| $20,000 to $22,499 | 43 (7.9%) | 7 (2.7%) |
| $22,500 to $24,999 | 17 (3.1%) | 5 (1.9%) |
| $25,000 to $29,999 | 6 (1.1%) | 32 (12.4%) |
| $30,000 to $34,999 | 44 (8.1%) | 6 (2.3%) |
| $35,000 to $39,999 | 27 (5.0%) | 21 (8.1%) |
| $40,000 to $44,999 | 31 (5.7%) | 0 (0.0%) |
| $45,000 to $49,999 | 26 (4.8%) | 18 (7.0%) |
| $50,000 to $54,999 | 0 (0.0%) | 0 (0.0%) |
| $55,000 to $64,999 | 65 (12.0%) | 27 (10.4%) |
| $65,000 to $74,999 | 40 (7.4%) | 0 (0.0%) |
| $75,000 to $99,999 | 88 (16.2%) | 14 (5.4%) |
| $100,000+ | 106 (19.5%) | 20 (7.7%) |
| Total | 543 (100.0%) | 259 (100.0%) |
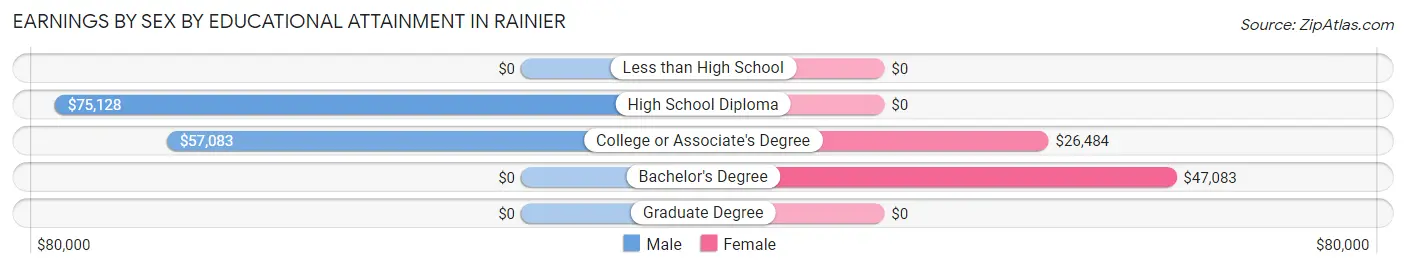
Earnings by Sex by Educational Attainment in Rainier
Average earnings in Rainier are $59,111 for men and $27,578 for women, a difference of 53.3%. Men with an educational attainment of high school diploma enjoy the highest average annual earnings of $75,128, while those with college or associate's degree education earn the least with $57,083. Women with an educational attainment of bachelor's degree earn the most with the average annual earnings of $47,083, while those with college or associate's degree education have the smallest earnings of $26,484.
| Educational Attainment | Male Income | Female Income |
| Less than High School | - | - |
| High School Diploma | $75,128 | $0 |
| College or Associate's Degree | $57,083 | $26,484 |
| Bachelor's Degree | - | - |
| Graduate Degree | - | - |
| Total | $59,111 | $27,578 |
Family Income in Rainier
Family Income Brackets in Rainier
According to the Rainier family income data, there are 130 families falling into the $100,000 to $149,999 income range, which is the most common income bracket and makes up 28.9% of all families. Conversely, the $15,000 to $24,999 income bracket is the least frequent group with only 5 families (1.1%) belonging to this category.
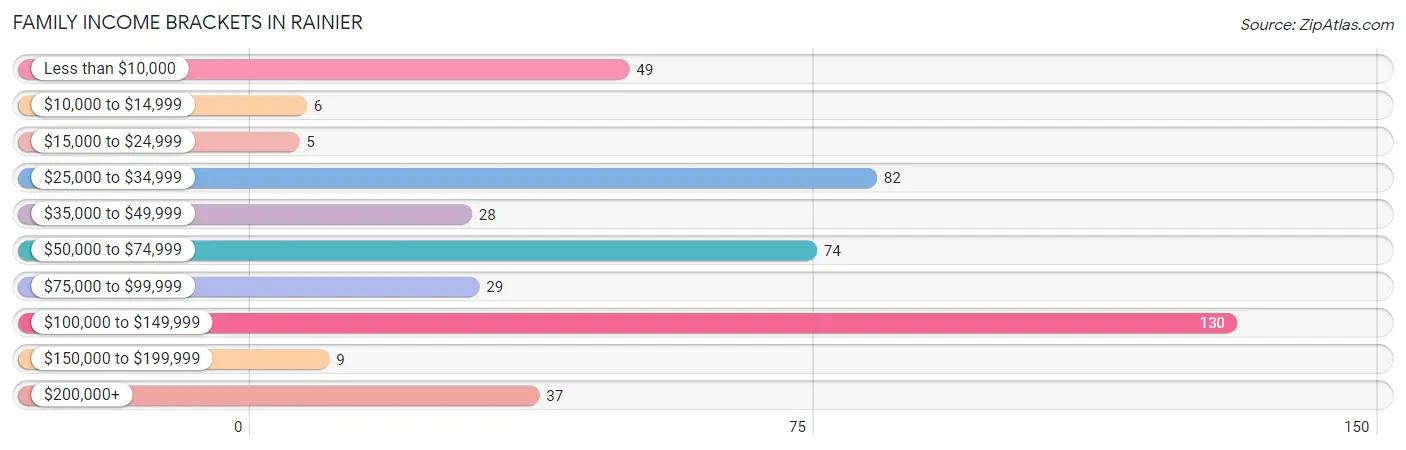
| Income Bracket | # Families | % Families |
| Less than $10,000 | 49 | 10.9% |
| $10,000 to $14,999 | 6 | 1.3% |
| $15,000 to $24,999 | 5 | 1.1% |
| $25,000 to $34,999 | 82 | 18.3% |
| $35,000 to $49,999 | 28 | 6.2% |
| $50,000 to $74,999 | 74 | 16.5% |
| $75,000 to $99,999 | 29 | 6.5% |
| $100,000 to $149,999 | 130 | 29.0% |
| $150,000 to $199,999 | 9 | 2.0% |
| $200,000+ | 37 | 8.2% |
Family Income by Famaliy Size in Rainier
5-person families (25 | 5.6%) account for the highest median family income in Rainier with $112,768 per family, while 2-person families (215 | 47.9%) have the highest median income of $28,646 per family member.
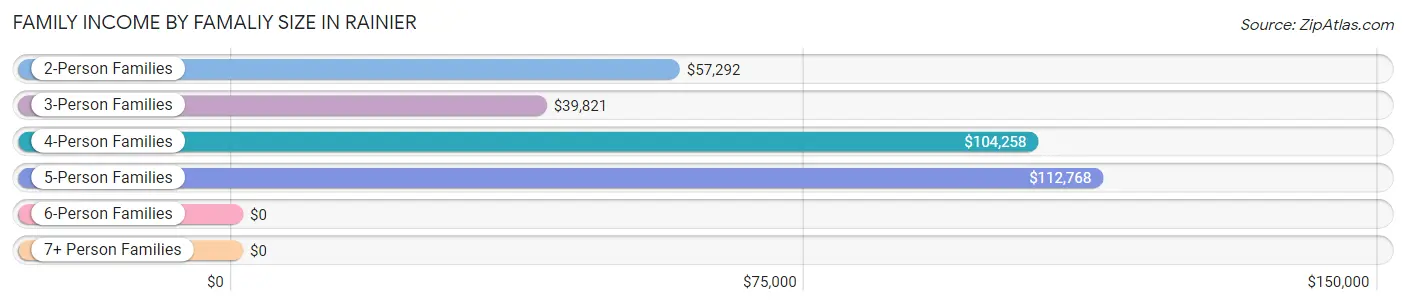
| Income Bracket | # Families | Median Income |
| 2-Person Families | 215 (47.9%) | $57,292 |
| 3-Person Families | 77 (17.2%) | $39,821 |
| 4-Person Families | 83 (18.5%) | $104,258 |
| 5-Person Families | 25 (5.6%) | $112,768 |
| 6-Person Families | 14 (3.1%) | $0 |
| 7+ Person Families | 35 (7.8%) | $0 |
| Total | 449 (100.0%) | $59,931 |
Family Income by Number of Earners in Rainier
The median family income in Rainier is $59,931, with families comprising 3+ earners (16) having the highest median family income of $226,111, while families with 1 earner (286) have the lowest median family income of $55,139, accounting for 3.6% and 63.7% of families, respectively.
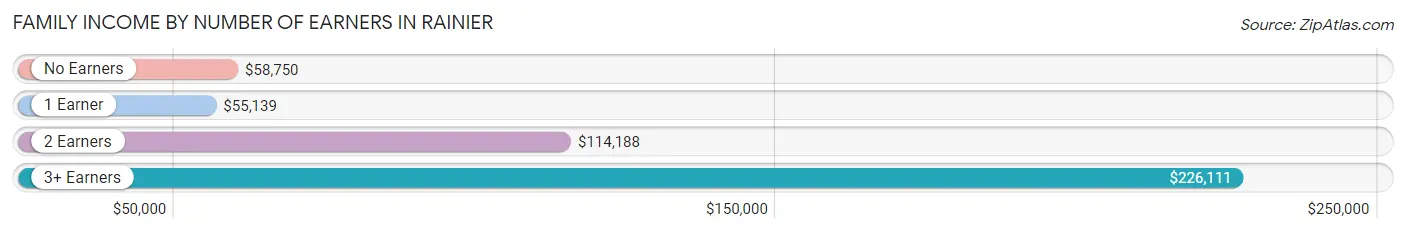
| Number of Earners | # Families | Median Income |
| No Earners | 48 (10.7%) | $58,750 |
| 1 Earner | 286 (63.7%) | $55,139 |
| 2 Earners | 99 (22.1%) | $114,188 |
| 3+ Earners | 16 (3.6%) | $226,111 |
| Total | 449 (100.0%) | $59,931 |
Household Income in Rainier
Household Income Brackets in Rainier
With 158 households falling in the category, the $100,000 to $149,999 income range is the most frequent in Rainier, accounting for 19.7% of all households. In contrast, only 9 households (1.1%) fall into the $150,000 to $199,999 income bracket, making it the least populous group.
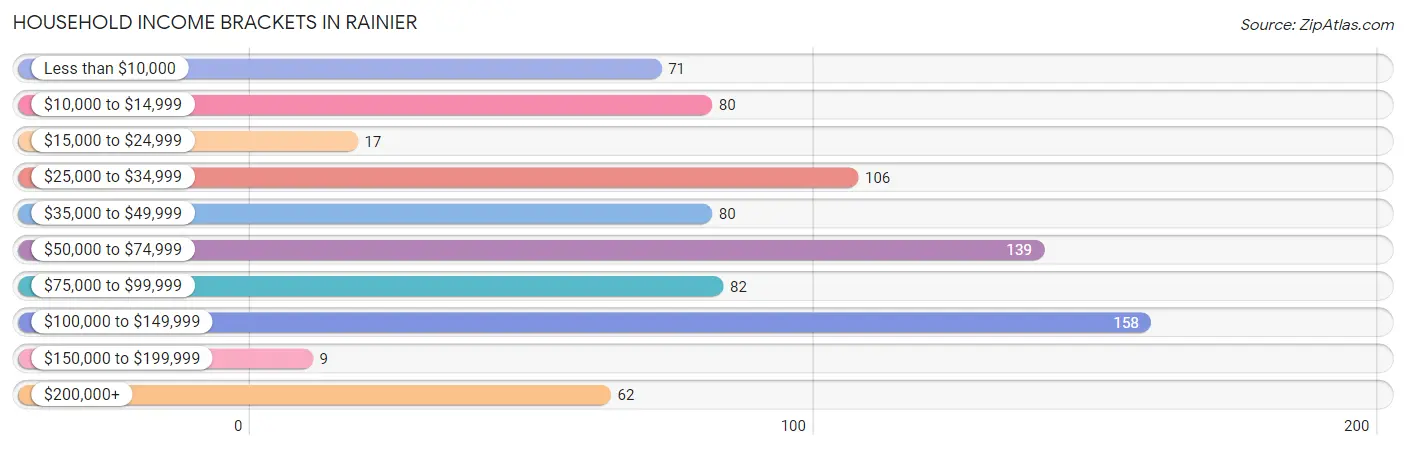
| Income Bracket | # Households | % Households |
| Less than $10,000 | 71 | 8.8% |
| $10,000 to $14,999 | 80 | 10.0% |
| $15,000 to $24,999 | 17 | 2.1% |
| $25,000 to $34,999 | 106 | 13.2% |
| $35,000 to $49,999 | 80 | 10.0% |
| $50,000 to $74,999 | 139 | 17.3% |
| $75,000 to $99,999 | 82 | 10.2% |
| $100,000 to $149,999 | 158 | 19.7% |
| $150,000 to $199,999 | 9 | 1.1% |
| $200,000+ | 62 | 7.7% |
Household Income by Householder Age in Rainier
The median household income in Rainier is $58,333, with the highest median household income of $65,750 found in the 45 to 64 years age bracket for the primary householder. A total of 230 households (28.6%) fall into this category. Meanwhile, the 15 to 24 years age bracket for the primary householder has the lowest median household income of $0, with 19 households (2.4%) in this group.
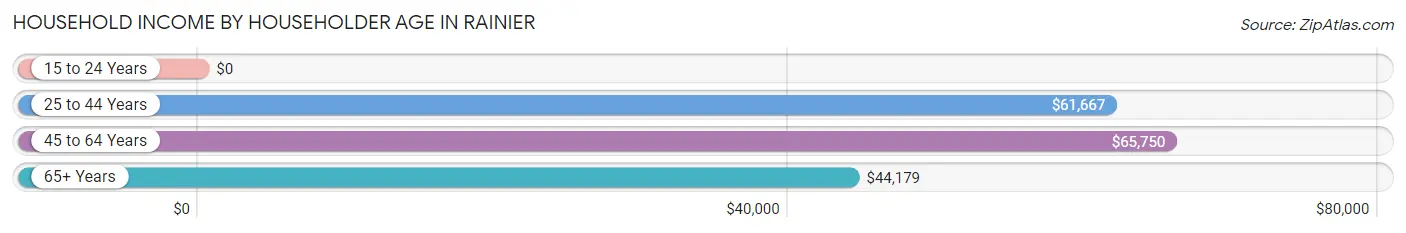
| Income Bracket | # Households | Median Income |
| 15 to 24 Years | 19 (2.4%) | $0 |
| 25 to 44 Years | 324 (40.3%) | $61,667 |
| 45 to 64 Years | 230 (28.6%) | $65,750 |
| 65+ Years | 231 (28.7%) | $44,179 |
| Total | 804 (100.0%) | $58,333 |
Poverty in Rainier
Income Below Poverty by Sex and Age in Rainier
With 20.8% poverty level for males and 37.2% for females among the residents of Rainier, 6 to 11 year old males and 5 year old females are the most vulnerable to poverty, with 89 males (50.0%) and 26 females (100.0%) in their respective age groups living below the poverty level.
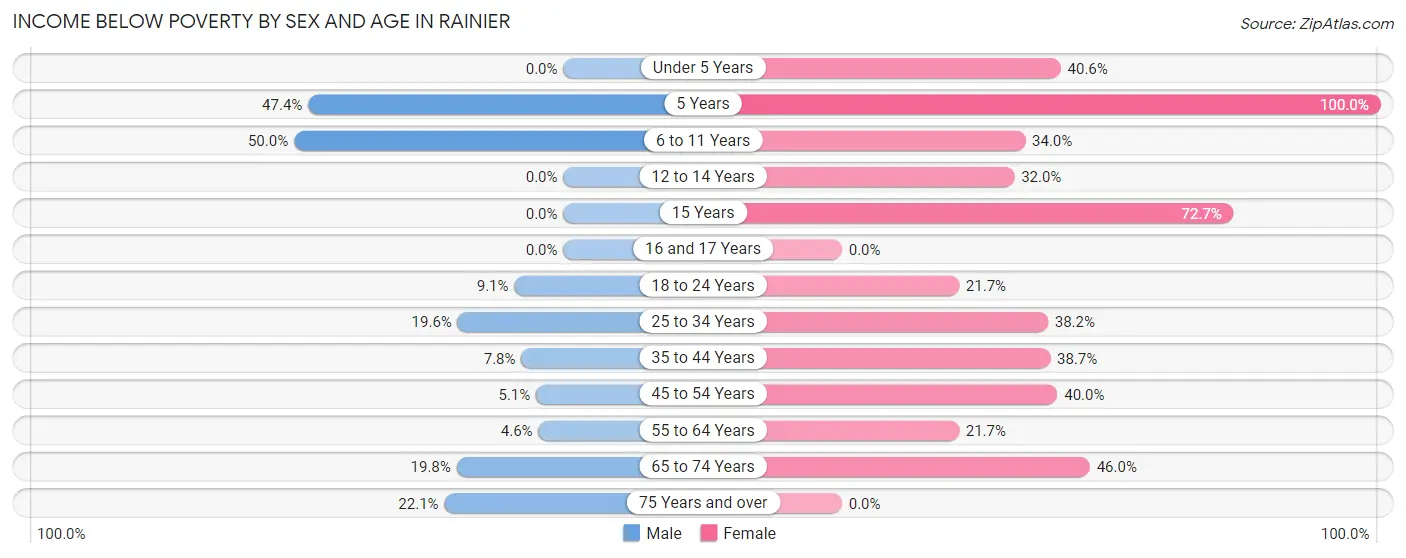
| Age Bracket | Male | Female |
| Under 5 Years | 0 (0.0%) | 39 (40.6%) |
| 5 Years | 18 (47.4%) | 26 (100.0%) |
| 6 to 11 Years | 89 (50.0%) | 33 (34.0%) |
| 12 to 14 Years | 0 (0.0%) | 16 (32.0%) |
| 15 Years | 0 (0.0%) | 24 (72.7%) |
| 16 and 17 Years | 0 (0.0%) | 0 (0.0%) |
| 18 to 24 Years | 4 (9.1%) | 5 (21.7%) |
| 25 to 34 Years | 41 (19.6%) | 78 (38.2%) |
| 35 to 44 Years | 6 (7.8%) | 46 (38.7%) |
| 45 to 54 Years | 4 (5.1%) | 24 (40.0%) |
| 55 to 64 Years | 5 (4.6%) | 38 (21.7%) |
| 65 to 74 Years | 21 (19.8%) | 52 (46.0%) |
| 75 Years and over | 17 (22.1%) | 0 (0.0%) |
| Total | 205 (20.8%) | 381 (37.2%) |
Income Above Poverty by Sex and Age in Rainier
According to the poverty statistics in Rainier, males aged under 5 years and females aged 75 years and over are the age groups that are most secure financially, with 100.0% of males and 100.0% of females in these age groups living above the poverty line.
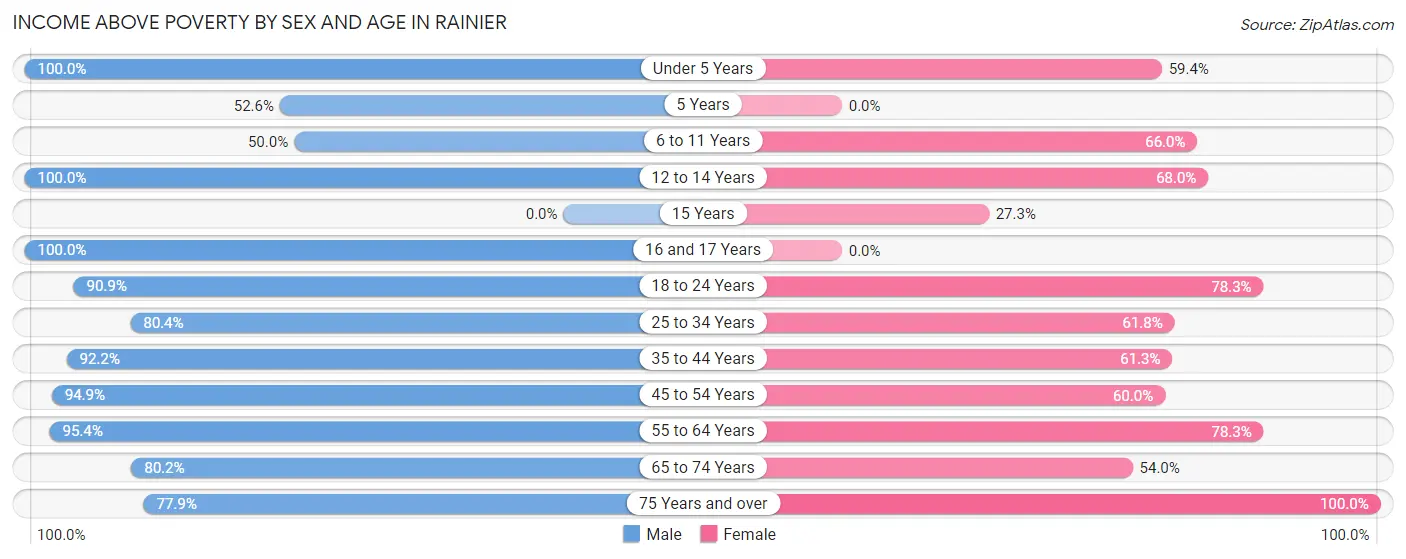
| Age Bracket | Male | Female |
| Under 5 Years | 53 (100.0%) | 57 (59.4%) |
| 5 Years | 20 (52.6%) | 0 (0.0%) |
| 6 to 11 Years | 89 (50.0%) | 64 (66.0%) |
| 12 to 14 Years | 7 (100.0%) | 34 (68.0%) |
| 15 Years | 0 (0.0%) | 9 (27.3%) |
| 16 and 17 Years | 11 (100.0%) | 0 (0.0%) |
| 18 to 24 Years | 40 (90.9%) | 18 (78.3%) |
| 25 to 34 Years | 168 (80.4%) | 126 (61.8%) |
| 35 to 44 Years | 71 (92.2%) | 73 (61.3%) |
| 45 to 54 Years | 75 (94.9%) | 36 (60.0%) |
| 55 to 64 Years | 103 (95.4%) | 137 (78.3%) |
| 65 to 74 Years | 85 (80.2%) | 61 (54.0%) |
| 75 Years and over | 60 (77.9%) | 27 (100.0%) |
| Total | 782 (79.2%) | 642 (62.8%) |
Income Below Poverty Among Married-Couple Families in Rainier
The poverty statistics for married-couple families in Rainier show that 9.4% or 31 of the total 329 families live below the poverty line. Families with 5 or more children have the highest poverty rate of 100.0%, comprising of 26 families. On the other hand, families with 1 or 2 children have the lowest poverty rate of 0.0%, which includes 0 families.
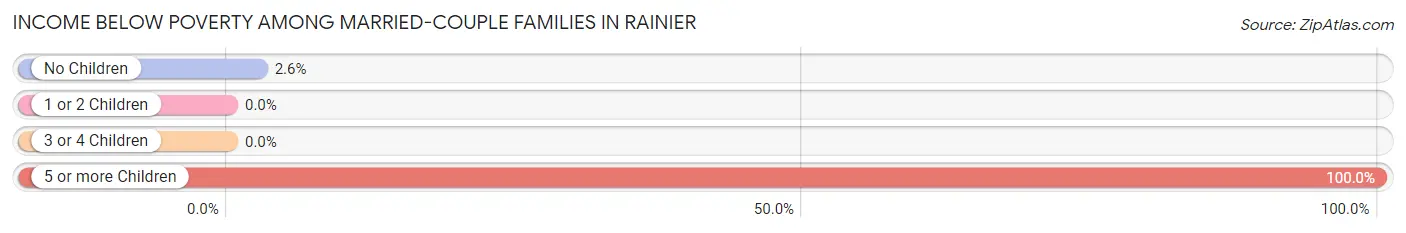
| Children | Above Poverty | Below Poverty |
| No Children | 189 (97.4%) | 5 (2.6%) |
| 1 or 2 Children | 84 (100.0%) | 0 (0.0%) |
| 3 or 4 Children | 25 (100.0%) | 0 (0.0%) |
| 5 or more Children | 0 (0.0%) | 26 (100.0%) |
| Total | 298 (90.6%) | 31 (9.4%) |
Income Below Poverty Among Single-Parent Households in Rainier
According to the poverty data in Rainier, 25.0% or 6 single-father households and 63.5% or 61 single-mother households are living below the poverty line. Among single-father households, those with no children have the highest poverty rate, with 6 households (100.0%) experiencing poverty. Likewise, among single-mother households, those with 1 or 2 children have the highest poverty rate, with 55 households (67.1%) falling below the poverty line.
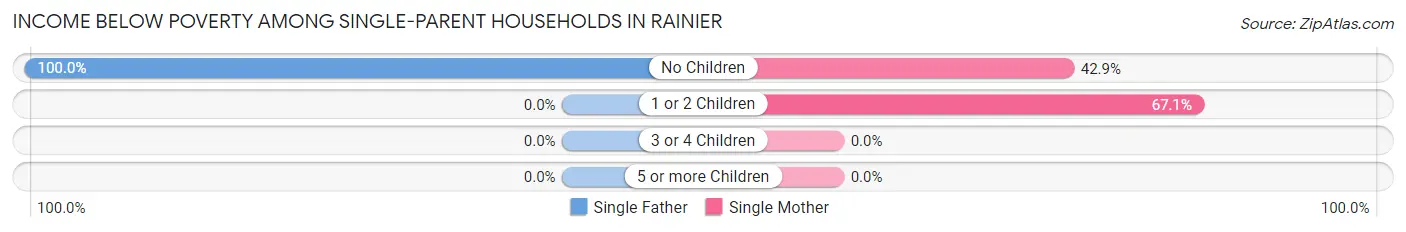
| Children | Single Father | Single Mother |
| No Children | 6 (100.0%) | 6 (42.9%) |
| 1 or 2 Children | 0 (0.0%) | 55 (67.1%) |
| 3 or 4 Children | 0 (0.0%) | 0 (0.0%) |
| 5 or more Children | 0 (0.0%) | 0 (0.0%) |
| Total | 6 (25.0%) | 61 (63.5%) |
Income Below Poverty Among Married-Couple vs Single-Parent Households in Rainier
The poverty data for Rainier shows that 31 of the married-couple family households (9.4%) and 67 of the single-parent households (55.8%) are living below the poverty level. Within the married-couple family households, those with 5 or more children have the highest poverty rate, with 26 households (100.0%) falling below the poverty line. Among the single-parent households, those with 1 or 2 children have the highest poverty rate, with 55 household (63.9%) living below poverty.
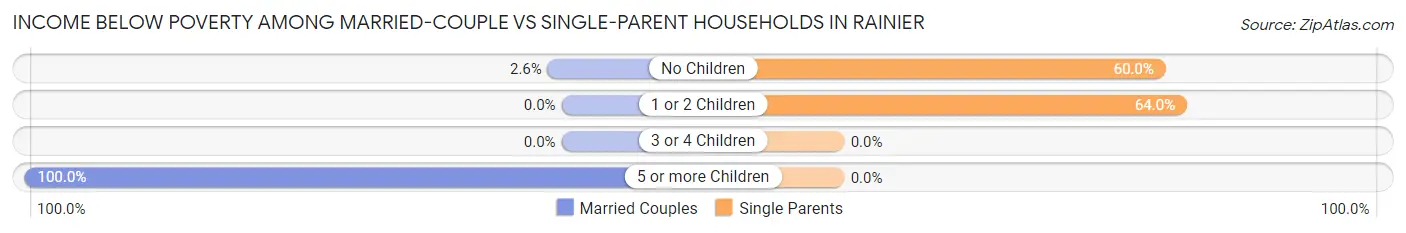
| Children | Married-Couple Families | Single-Parent Households |
| No Children | 5 (2.6%) | 12 (60.0%) |
| 1 or 2 Children | 0 (0.0%) | 55 (63.9%) |
| 3 or 4 Children | 0 (0.0%) | 0 (0.0%) |
| 5 or more Children | 26 (100.0%) | 0 (0.0%) |
| Total | 31 (9.4%) | 67 (55.8%) |
Race in Rainier
The most populous races in Rainier are White / Caucasian (1,757 | 87.4%), Two or more Races (171 | 8.5%), and Hispanic or Latino (118 | 5.9%).
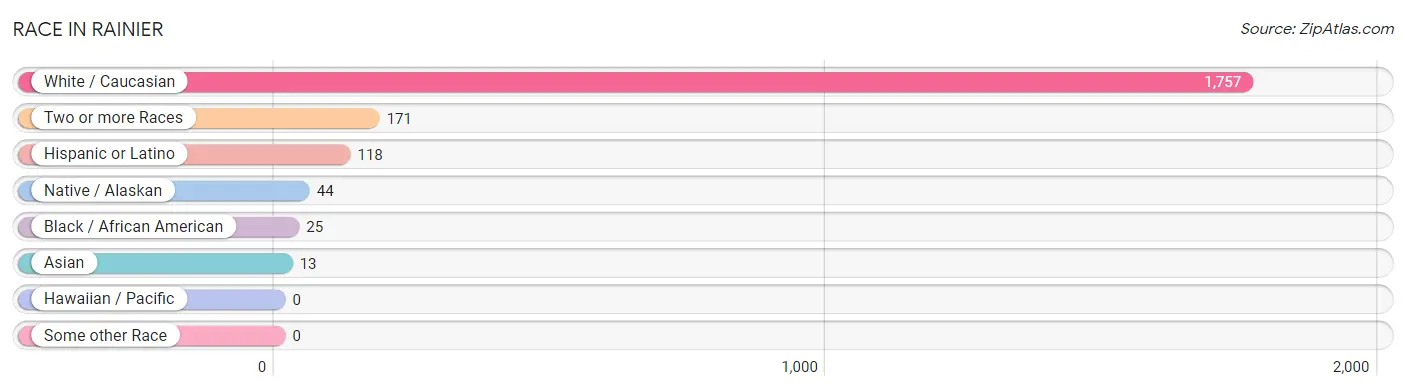
| Race | # Population | % Population |
| Asian | 13 | 0.6% |
| Black / African American | 25 | 1.2% |
| Hawaiian / Pacific | 0 | 0.0% |
| Hispanic or Latino | 118 | 5.9% |
| Native / Alaskan | 44 | 2.2% |
| White / Caucasian | 1,757 | 87.4% |
| Two or more Races | 171 | 8.5% |
| Some other Race | 0 | 0.0% |
| Total | 2,010 | 100.0% |
Ancestry in Rainier
The most populous ancestries reported in Rainier are German (372 | 18.5%), Irish (351 | 17.5%), English (164 | 8.2%), Italian (101 | 5.0%), and Mexican (79 | 3.9%), together accounting for 53.1% of all Rainier residents.
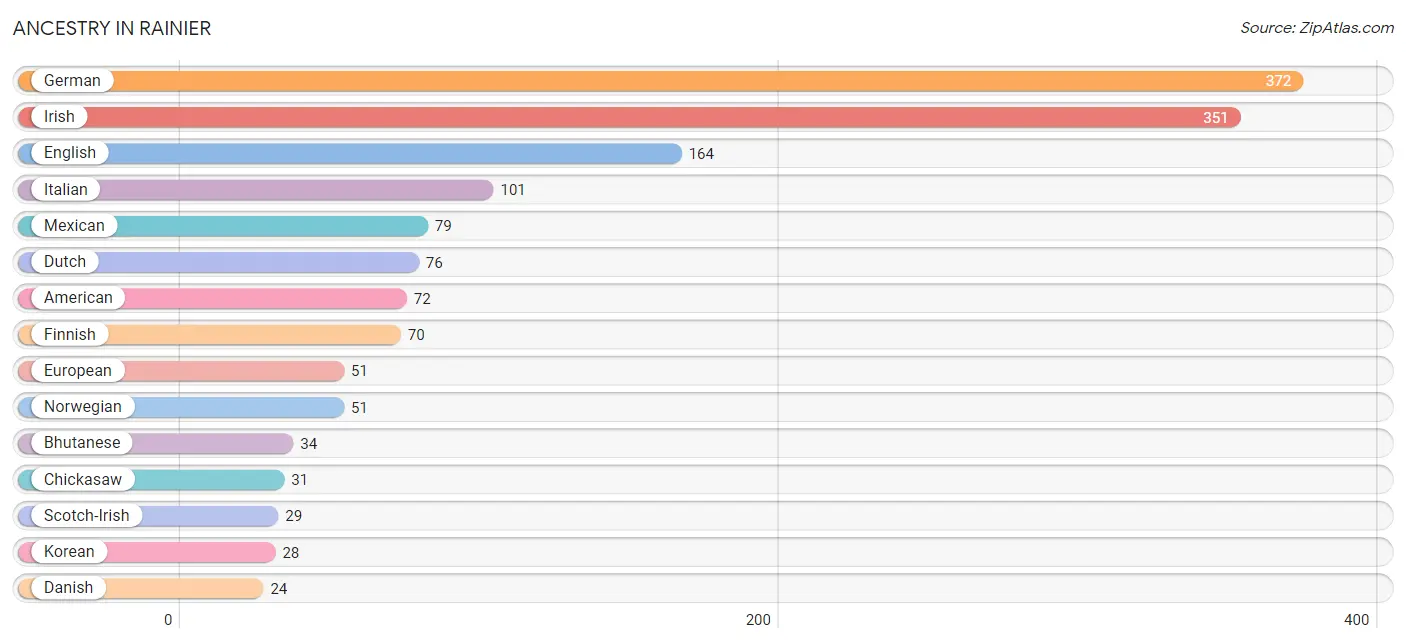
| Ancestry | # Population | % Population |
| American | 72 | 3.6% |
| Bhutanese | 34 | 1.7% |
| Canadian | 18 | 0.9% |
| Cherokee | 22 | 1.1% |
| Chickasaw | 31 | 1.5% |
| Chippewa | 20 | 1.0% |
| Choctaw | 21 | 1.0% |
| Colombian | 8 | 0.4% |
| Danish | 24 | 1.2% |
| Dutch | 76 | 3.8% |
| English | 164 | 8.2% |
| European | 51 | 2.5% |
| Finnish | 70 | 3.5% |
| French | 5 | 0.3% |
| French Canadian | 20 | 1.0% |
| German | 372 | 18.5% |
| Irish | 351 | 17.5% |
| Italian | 101 | 5.0% |
| Korean | 28 | 1.4% |
| Mexican | 79 | 3.9% |
| Mexican American Indian | 22 | 1.1% |
| Nigerian | 21 | 1.0% |
| Northern European | 5 | 0.3% |
| Norwegian | 51 | 2.5% |
| Portuguese | 4 | 0.2% |
| Puget Sound Salish | 3 | 0.2% |
| Scotch-Irish | 29 | 1.4% |
| Scottish | 7 | 0.4% |
| Sioux | 14 | 0.7% |
| South American | 8 | 0.4% |
| Subsaharan African | 21 | 1.0% |
| Swedish | 15 | 0.7% | View All 32 Rows |
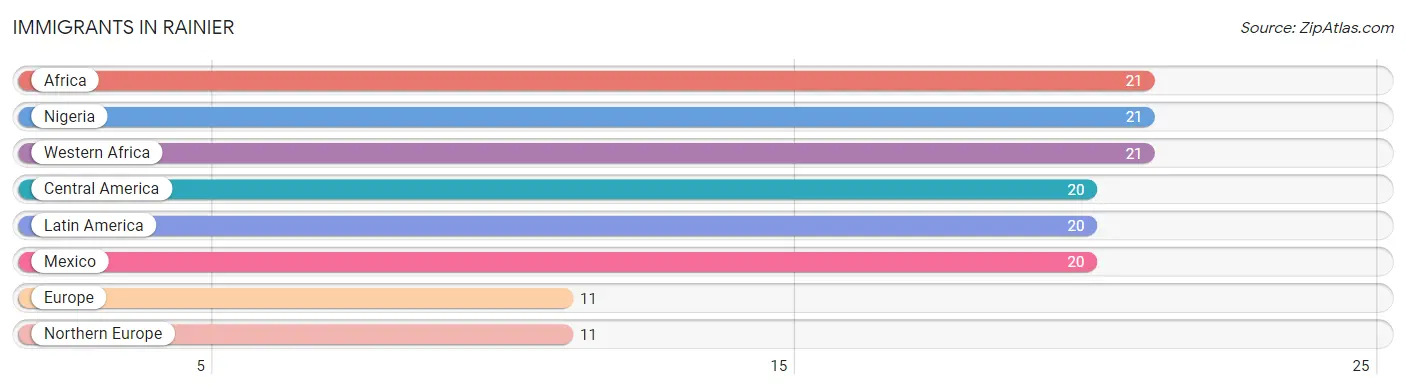
Immigrants in Rainier
The most numerous immigrant groups reported in Rainier came from Africa (21 | 1.0%), Nigeria (21 | 1.0%), Western Africa (21 | 1.0%), Central America (20 | 1.0%), and Latin America (20 | 1.0%), together accounting for 5.1% of all Rainier residents.
| Immigration Origin | # Population | % Population |
| Africa | 21 | 1.0% |
| Central America | 20 | 1.0% |
| Europe | 11 | 0.5% |
| Latin America | 20 | 1.0% |
| Mexico | 20 | 1.0% |
| Nigeria | 21 | 1.0% |
| Northern Europe | 11 | 0.5% |
| Western Africa | 21 | 1.0% | View All 8 Rows |
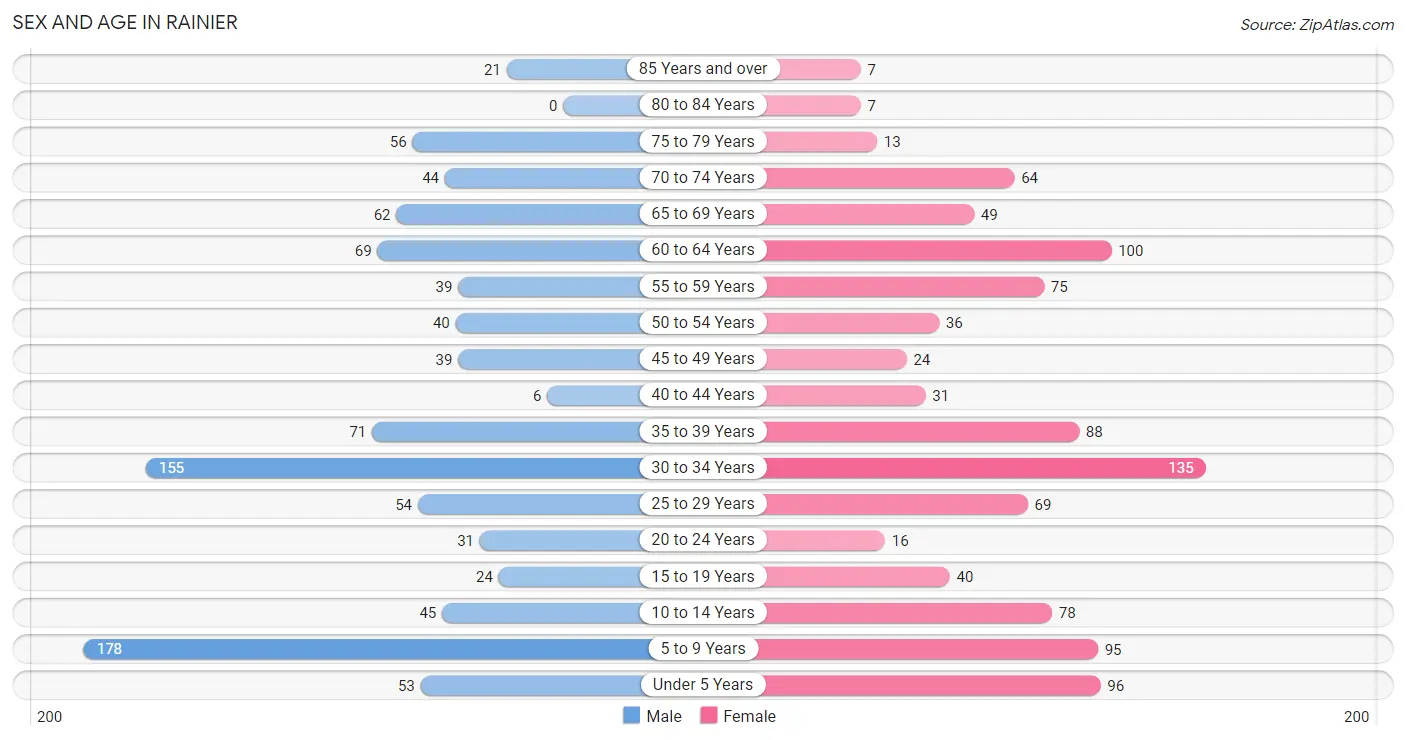
Sex and Age in Rainier
Sex and Age in Rainier
The most populous age groups in Rainier are 5 to 9 Years (178 | 18.0%) for men and 30 to 34 Years (135 | 13.2%) for women.
| Age Bracket | Male | Female |
| Under 5 Years | 53 (5.4%) | 96 (9.4%) |
| 5 to 9 Years | 178 (18.0%) | 95 (9.3%) |
| 10 to 14 Years | 45 (4.6%) | 78 (7.6%) |
| 15 to 19 Years | 24 (2.4%) | 40 (3.9%) |
| 20 to 24 Years | 31 (3.1%) | 16 (1.6%) |
| 25 to 29 Years | 54 (5.5%) | 69 (6.7%) |
| 30 to 34 Years | 155 (15.7%) | 135 (13.2%) |
| 35 to 39 Years | 71 (7.2%) | 88 (8.6%) |
| 40 to 44 Years | 6 (0.6%) | 31 (3.0%) |
| 45 to 49 Years | 39 (4.0%) | 24 (2.4%) |
| 50 to 54 Years | 40 (4.1%) | 36 (3.5%) |
| 55 to 59 Years | 39 (4.0%) | 75 (7.3%) |
| 60 to 64 Years | 69 (7.0%) | 100 (9.8%) |
| 65 to 69 Years | 62 (6.3%) | 49 (4.8%) |
| 70 to 74 Years | 44 (4.5%) | 64 (6.3%) |
| 75 to 79 Years | 56 (5.7%) | 13 (1.3%) |
| 80 to 84 Years | 0 (0.0%) | 7 (0.7%) |
| 85 Years and over | 21 (2.1%) | 7 (0.7%) |
| Total | 987 (100.0%) | 1,023 (100.0%) |
Families and Households in Rainier
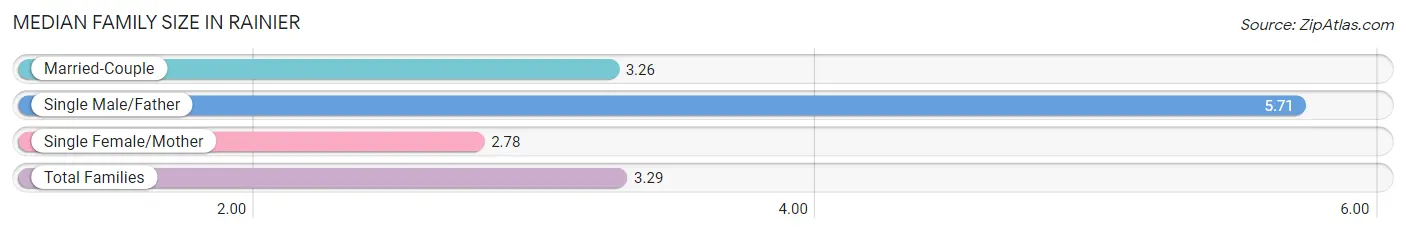
Median Family Size in Rainier
The median family size in Rainier is 3.29 persons per family, with single male/father families (24 | 5.3%) accounting for the largest median family size of 5.71 persons per family. On the other hand, single female/mother families (96 | 21.4%) represent the smallest median family size with 2.78 persons per family.
| Family Type | # Families | Family Size |
| Married-Couple | 329 (73.3%) | 3.26 |
| Single Male/Father | 24 (5.3%) | 5.71 |
| Single Female/Mother | 96 (21.4%) | 2.78 |
| Total Families | 449 (100.0%) | 3.29 |
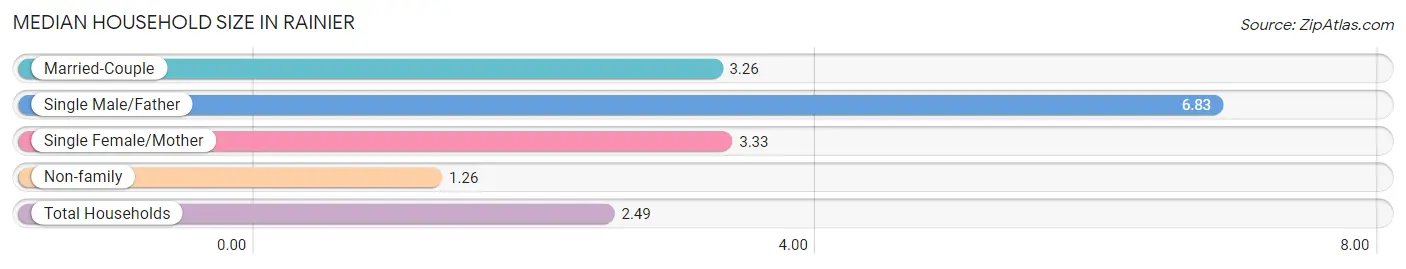
Median Household Size in Rainier
The median household size in Rainier is 2.49 persons per household, with single male/father households (24 | 3.0%) accounting for the largest median household size of 6.83 persons per household. non-family households (355 | 44.2%) represent the smallest median household size with 1.26 persons per household.
| Household Type | # Households | Household Size |
| Married-Couple | 329 (40.9%) | 3.26 |
| Single Male/Father | 24 (3.0%) | 6.83 |
| Single Female/Mother | 96 (11.9%) | 3.33 |
| Non-family | 355 (44.2%) | 1.26 |
| Total Households | 804 (100.0%) | 2.49 |
Household Size by Marriage Status in Rainier
Out of a total of 804 households in Rainier, 449 (55.8%) are family households, while 355 (44.2%) are nonfamily households. The most numerous type of family households are 2-person households, comprising 209, and the most common type of nonfamily households are 1-person households, comprising 258.
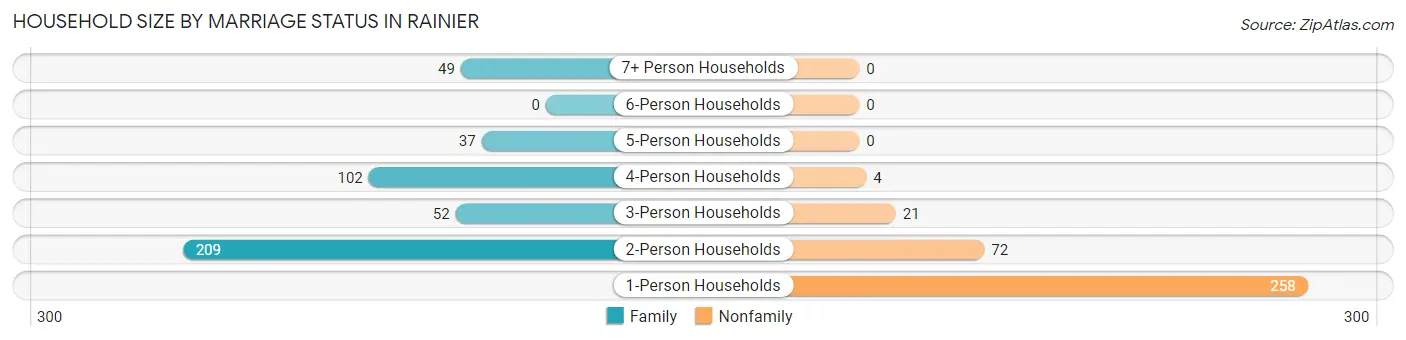
| Household Size | Family Households | Nonfamily Households |
| 1-Person Households | - | 258 (32.1%) |
| 2-Person Households | 209 (26.0%) | 72 (9.0%) |
| 3-Person Households | 52 (6.5%) | 21 (2.6%) |
| 4-Person Households | 102 (12.7%) | 4 (0.5%) |
| 5-Person Households | 37 (4.6%) | 0 (0.0%) |
| 6-Person Households | 0 (0.0%) | 0 (0.0%) |
| 7+ Person Households | 49 (6.1%) | 0 (0.0%) |
| Total | 449 (55.8%) | 355 (44.2%) |
Female Fertility in Rainier
Fertility by Age in Rainier
Average fertility rate in Rainier is 65.0 births per 1,000 women. Women in the age bracket of 20 to 34 years have the highest fertility rate with 91.0 births per 1,000 women. Women in the age bracket of 20 to 34 years acount for 74.1% of all women with births.
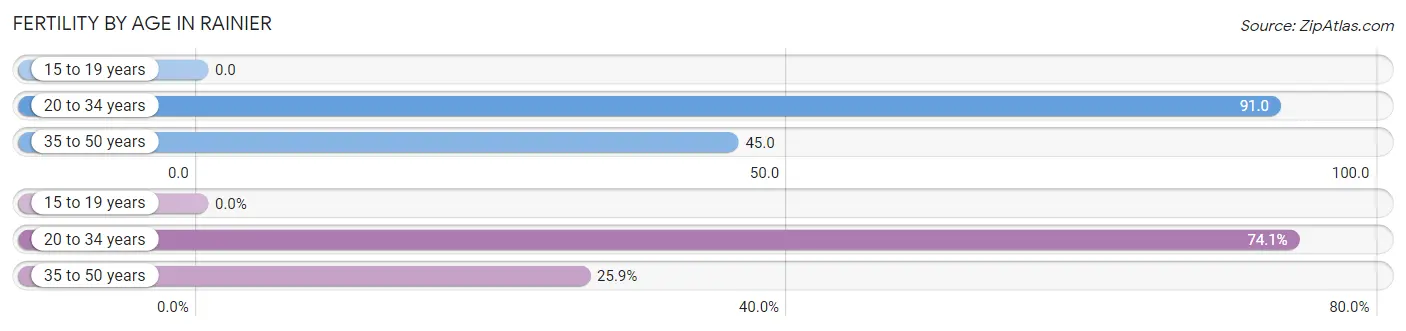
| Age Bracket | Women with Births | Births / 1,000 Women |
| 15 to 19 years | 0 (0.0%) | 0.0 |
| 20 to 34 years | 20 (74.1%) | 91.0 |
| 35 to 50 years | 7 (25.9%) | 45.0 |
| Total | 27 (100.0%) | 65.0 |
Fertility by Age by Marriage Status in Rainier
25.9% of women with births (27) in Rainier are married. The highest percentage of unmarried women with births falls into 20 to 34 years age bracket with 100.0% of them unmarried at the time of birth, while the lowest percentage of unmarried women with births belong to 35 to 50 years age bracket with 0.0% of them unmarried.
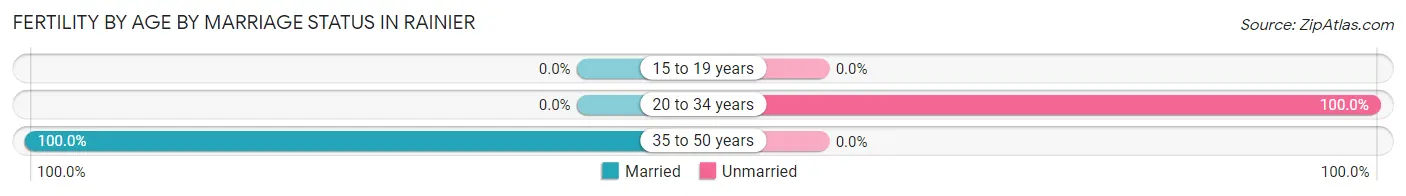
| Age Bracket | Married | Unmarried |
| 15 to 19 years | 0 (0.0%) | 0 (0.0%) |
| 20 to 34 years | 0 (0.0%) | 20 (100.0%) |
| 35 to 50 years | 7 (100.0%) | 0 (0.0%) |
| Total | 7 (25.9%) | 20 (74.1%) |
Fertility by Education in Rainier
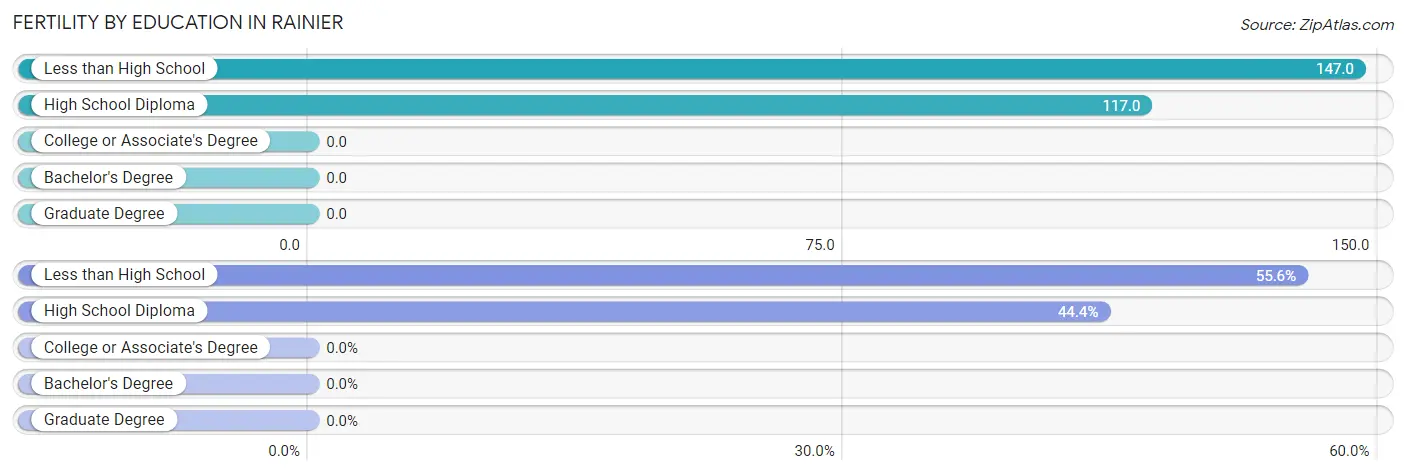
| Educational Attainment | Women with Births | Births / 1,000 Women |
| Less than High School | 15 (55.6%) | 147.0 |
| High School Diploma | 12 (44.4%) | 117.0 |
| College or Associate's Degree | 0 (0.0%) | 0.0 |
| Bachelor's Degree | 0 (0.0%) | 0.0 |
| Graduate Degree | 0 (0.0%) | 0.0 |
| Total | 27 (100.0%) | 65.0 |
Fertility by Education by Marriage Status in Rainier
74.1% of women with births in Rainier are unmarried. Women with the educational attainment of high school diploma are most likely to be married with 58.3% of them married at childbirth, while women with the educational attainment of less than high school are least likely to be married with 100.0% of them unmarried at childbirth.
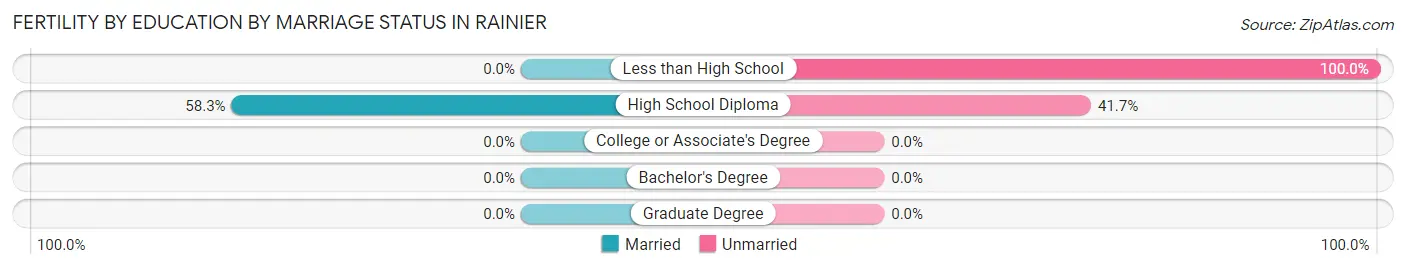
| Educational Attainment | Married | Unmarried |
| Less than High School | 0 (0.0%) | 15 (100.0%) |
| High School Diploma | 7 (58.3%) | 5 (41.7%) |
| College or Associate's Degree | 0 (0.0%) | 0 (0.0%) |
| Bachelor's Degree | 0 (0.0%) | 0 (0.0%) |
| Graduate Degree | 0 (0.0%) | 0 (0.0%) |
| Total | 7 (25.9%) | 20 (74.1%) |
Employment Characteristics in Rainier
Employment by Class of Employer in Rainier
Among the 730 employed individuals in Rainier, private company employees (551 | 75.5%), state government employees (47 | 6.4%), and self-employed (not incorporated) (40 | 5.5%) make up the most common classes of employment.
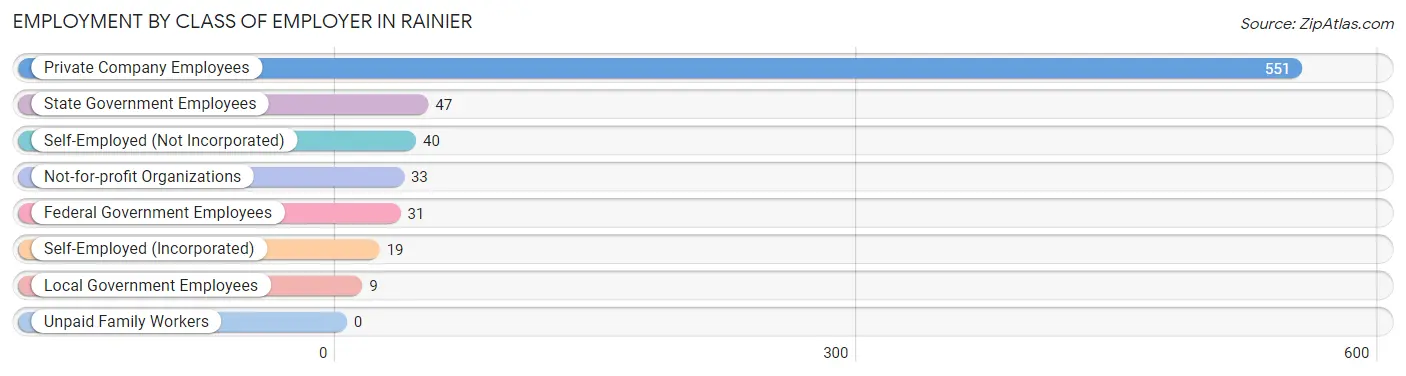
| Employer Class | # Employees | % Employees |
| Private Company Employees | 551 | 75.5% |
| Self-Employed (Incorporated) | 19 | 2.6% |
| Self-Employed (Not Incorporated) | 40 | 5.5% |
| Not-for-profit Organizations | 33 | 4.5% |
| Local Government Employees | 9 | 1.2% |
| State Government Employees | 47 | 6.4% |
| Federal Government Employees | 31 | 4.3% |
| Unpaid Family Workers | 0 | 0.0% |
| Total | 730 | 100.0% |
Employment Status by Age in Rainier
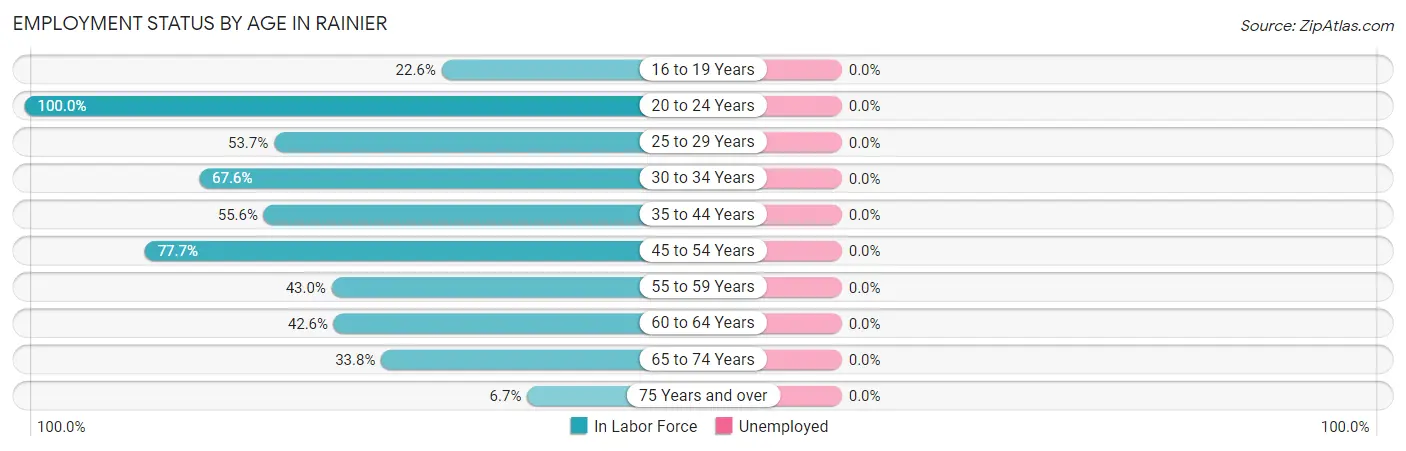
| Age Bracket | In Labor Force | Unemployed |
| 16 to 19 Years | 7 (22.6%) | 0 (0.0%) |
| 20 to 24 Years | 47 (100.0%) | 0 (0.0%) |
| 25 to 29 Years | 66 (53.7%) | 0 (0.0%) |
| 30 to 34 Years | 196 (67.6%) | 0 (0.0%) |
| 35 to 44 Years | 109 (55.6%) | 0 (0.0%) |
| 45 to 54 Years | 108 (77.7%) | 0 (0.0%) |
| 55 to 59 Years | 49 (43.0%) | 0 (0.0%) |
| 60 to 64 Years | 72 (42.6%) | 0 (0.0%) |
| 65 to 74 Years | 74 (33.8%) | 0 (0.0%) |
| 75 Years and over | 7 (6.7%) | 0 (0.0%) |
| Total | 735 (51.3%) | 0 (0.0%) |
Employment Status by Educational Attainment in Rainier
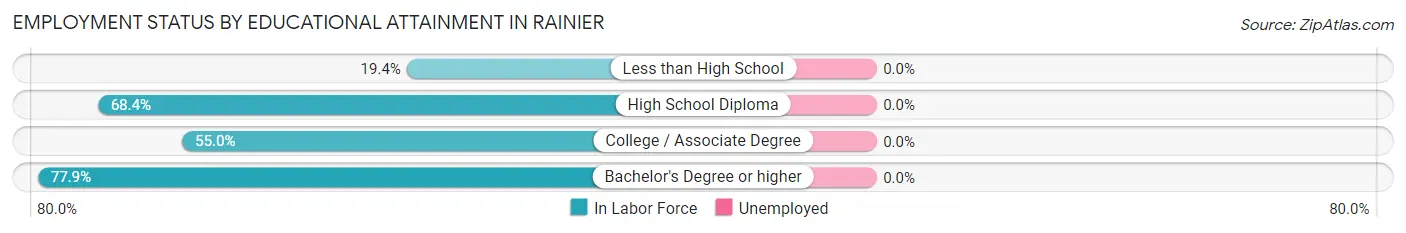
| Educational Attainment | In Labor Force | Unemployed |
| Less than High School | 28 (19.4%) | 0 (0.0%) |
| High School Diploma | 249 (68.4%) | 0 (0.0%) |
| College / Associate Degree | 203 (55.0%) | 0 (0.0%) |
| Bachelor's Degree or higher | 120 (77.9%) | 0 (0.0%) |
| Total | 600 (58.2%) | 0 (0.0%) |
Employment Occupations by Sex in Rainier
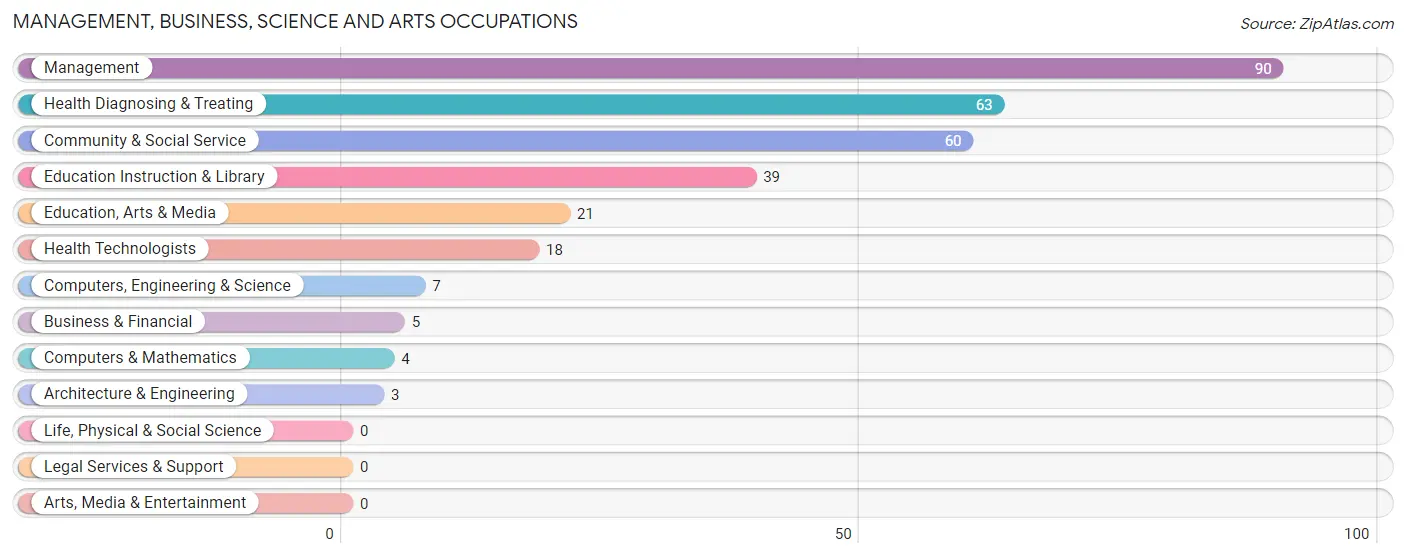
Management, Business, Science and Arts Occupations
The most common Management, Business, Science and Arts occupations in Rainier are Management (90 | 12.2%), Health Diagnosing & Treating (63 | 8.6%), Community & Social Service (60 | 8.2%), Education Instruction & Library (39 | 5.3%), and Education, Arts & Media (21 | 2.9%).
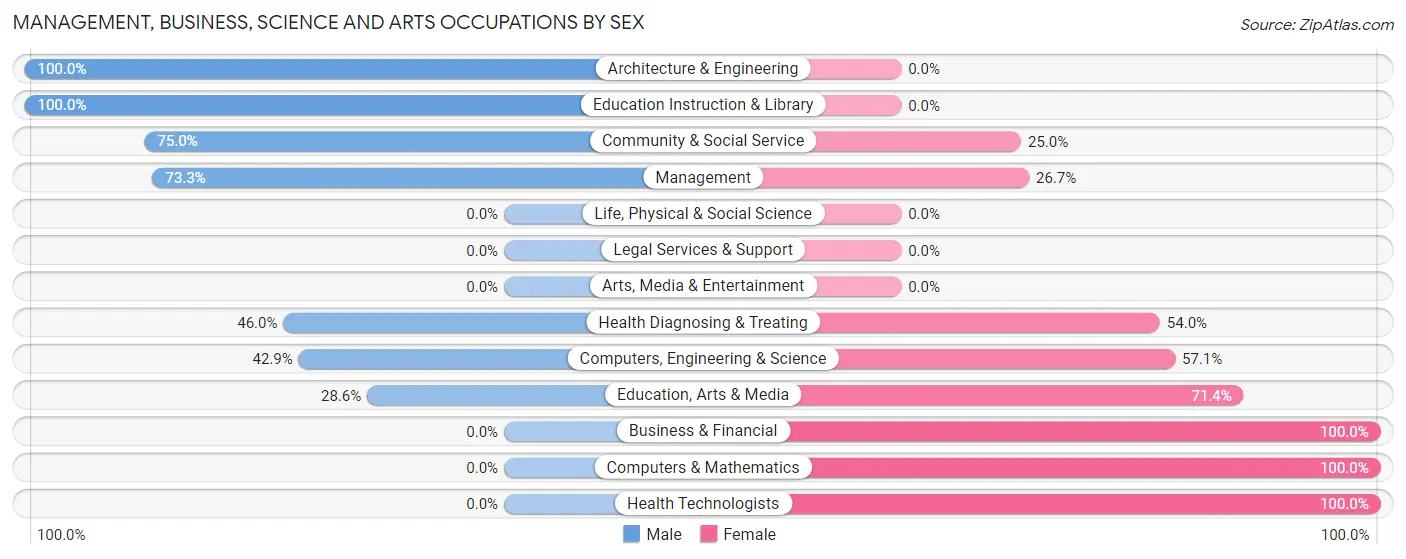
Management, Business, Science and Arts Occupations by Sex
Within the Management, Business, Science and Arts occupations in Rainier, the most male-oriented occupations are Architecture & Engineering (100.0%), Education Instruction & Library (100.0%), and Community & Social Service (75.0%), while the most female-oriented occupations are Business & Financial (100.0%), Computers & Mathematics (100.0%), and Health Technologists (100.0%).
| Occupation | Male | Female |
| Management | 66 (73.3%) | 24 (26.7%) |
| Business & Financial | 0 (0.0%) | 5 (100.0%) |
| Computers, Engineering & Science | 3 (42.9%) | 4 (57.1%) |
| Computers & Mathematics | 0 (0.0%) | 4 (100.0%) |
| Architecture & Engineering | 3 (100.0%) | 0 (0.0%) |
| Life, Physical & Social Science | 0 (0.0%) | 0 (0.0%) |
| Community & Social Service | 45 (75.0%) | 15 (25.0%) |
| Education, Arts & Media | 6 (28.6%) | 15 (71.4%) |
| Legal Services & Support | 0 (0.0%) | 0 (0.0%) |
| Education Instruction & Library | 39 (100.0%) | 0 (0.0%) |
| Arts, Media & Entertainment | 0 (0.0%) | 0 (0.0%) |
| Health Diagnosing & Treating | 29 (46.0%) | 34 (54.0%) |
| Health Technologists | 0 (0.0%) | 18 (100.0%) |
| Total (Category) | 143 (63.6%) | 82 (36.4%) |
| Total (Overall) | 492 (66.9%) | 243 (33.1%) |
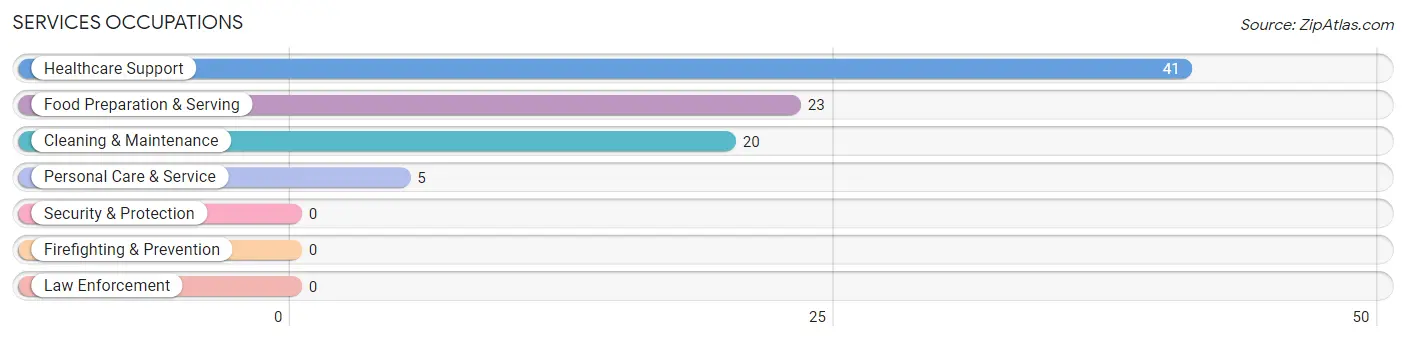
Services Occupations
The most common Services occupations in Rainier are Healthcare Support (41 | 5.6%), Food Preparation & Serving (23 | 3.1%), Cleaning & Maintenance (20 | 2.7%), and Personal Care & Service (5 | 0.7%).
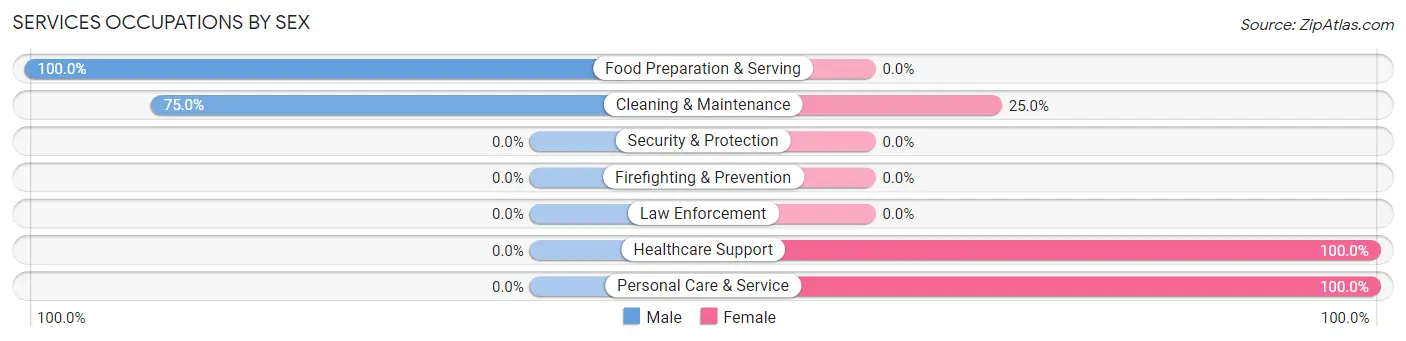
Services Occupations by Sex
Within the Services occupations in Rainier, the most male-oriented occupations are Food Preparation & Serving (100.0%), and Cleaning & Maintenance (75.0%), while the most female-oriented occupations are Healthcare Support (100.0%), Personal Care & Service (100.0%), and Cleaning & Maintenance (25.0%).
| Occupation | Male | Female |
| Healthcare Support | 0 (0.0%) | 41 (100.0%) |
| Security & Protection | 0 (0.0%) | 0 (0.0%) |
| Firefighting & Prevention | 0 (0.0%) | 0 (0.0%) |
| Law Enforcement | 0 (0.0%) | 0 (0.0%) |
| Food Preparation & Serving | 23 (100.0%) | 0 (0.0%) |
| Cleaning & Maintenance | 15 (75.0%) | 5 (25.0%) |
| Personal Care & Service | 0 (0.0%) | 5 (100.0%) |
| Total (Category) | 38 (42.7%) | 51 (57.3%) |
| Total (Overall) | 492 (66.9%) | 243 (33.1%) |
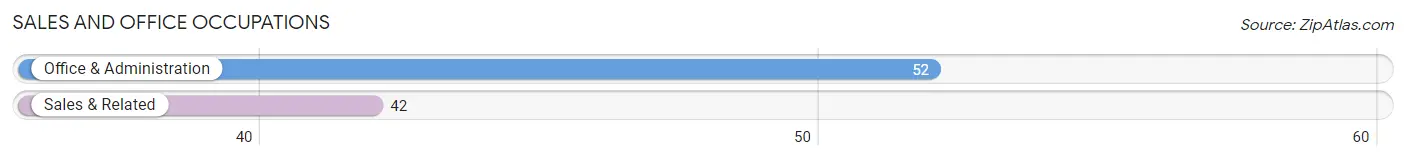
Sales and Office Occupations
The most common Sales and Office occupations in Rainier are Office & Administration (52 | 7.1%), and Sales & Related (42 | 5.7%).
Sales and Office Occupations by Sex
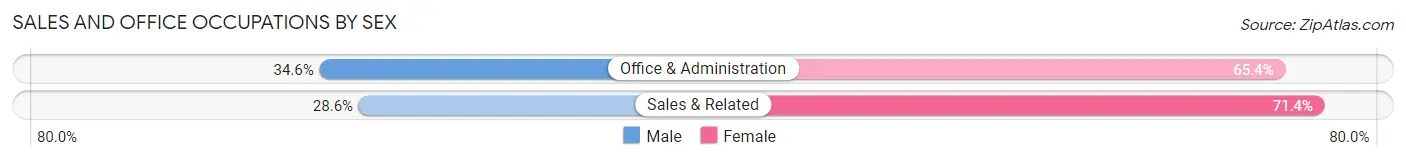
| Occupation | Male | Female |
| Sales & Related | 12 (28.6%) | 30 (71.4%) |
| Office & Administration | 18 (34.6%) | 34 (65.4%) |
| Total (Category) | 30 (31.9%) | 64 (68.1%) |
| Total (Overall) | 492 (66.9%) | 243 (33.1%) |
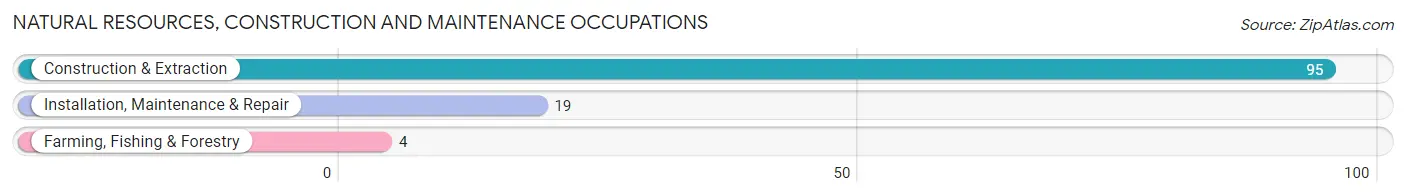
Natural Resources, Construction and Maintenance Occupations
The most common Natural Resources, Construction and Maintenance occupations in Rainier are Construction & Extraction (95 | 12.9%), Installation, Maintenance & Repair (19 | 2.6%), and Farming, Fishing & Forestry (4 | 0.5%).
Natural Resources, Construction and Maintenance Occupations by Sex
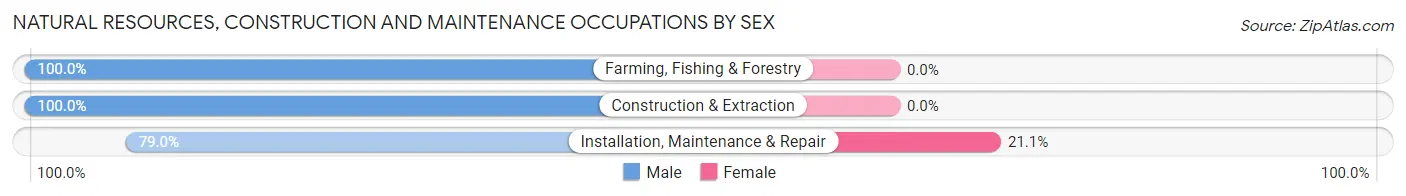
| Occupation | Male | Female |
| Farming, Fishing & Forestry | 4 (100.0%) | 0 (0.0%) |
| Construction & Extraction | 95 (100.0%) | 0 (0.0%) |
| Installation, Maintenance & Repair | 15 (78.9%) | 4 (21.0%) |
| Total (Category) | 114 (96.6%) | 4 (3.4%) |
| Total (Overall) | 492 (66.9%) | 243 (33.1%) |
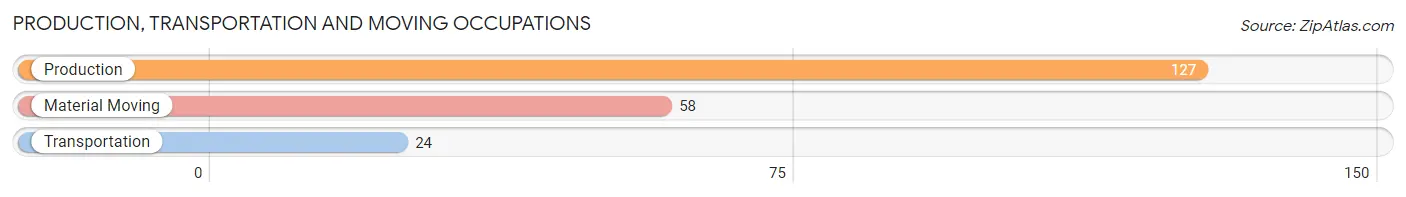
Production, Transportation and Moving Occupations
The most common Production, Transportation and Moving occupations in Rainier are Production (127 | 17.3%), Material Moving (58 | 7.9%), and Transportation (24 | 3.3%).
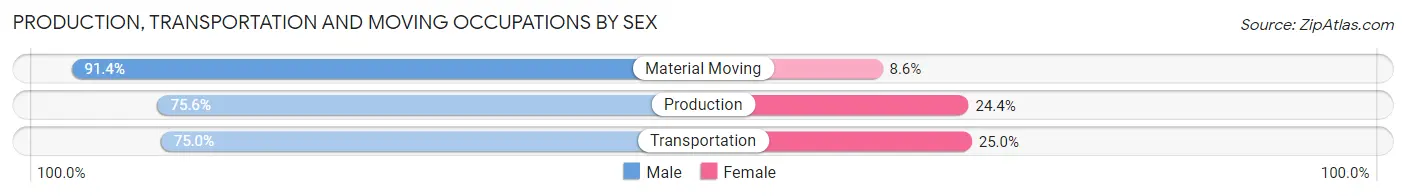
Production, Transportation and Moving Occupations by Sex
| Occupation | Male | Female |
| Production | 96 (75.6%) | 31 (24.4%) |
| Transportation | 18 (75.0%) | 6 (25.0%) |
| Material Moving | 53 (91.4%) | 5 (8.6%) |
| Total (Category) | 167 (79.9%) | 42 (20.1%) |
| Total (Overall) | 492 (66.9%) | 243 (33.1%) |
Employment Industries by Sex in Rainier
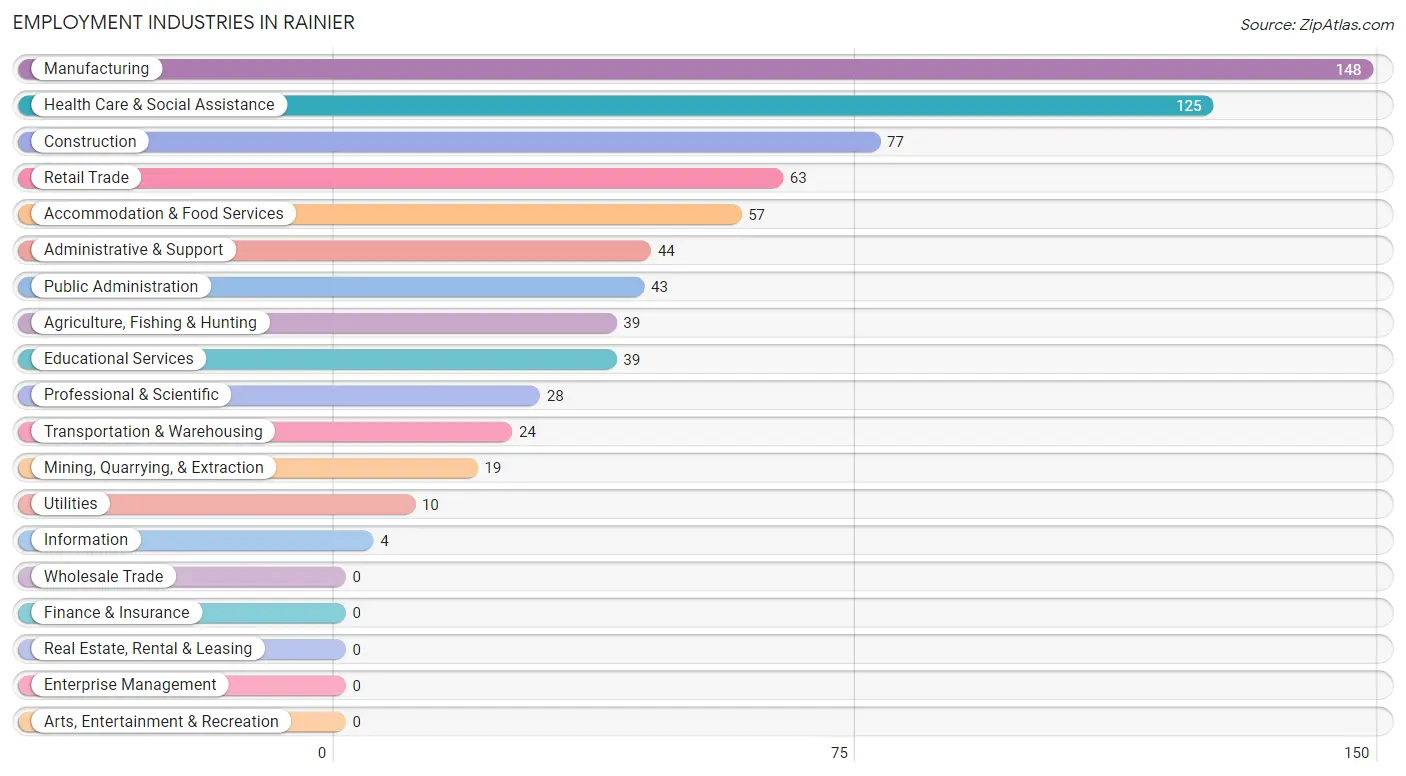
Employment Industries in Rainier
The major employment industries in Rainier include Manufacturing (148 | 20.1%), Health Care & Social Assistance (125 | 17.0%), Construction (77 | 10.5%), Retail Trade (63 | 8.6%), and Accommodation & Food Services (57 | 7.8%).
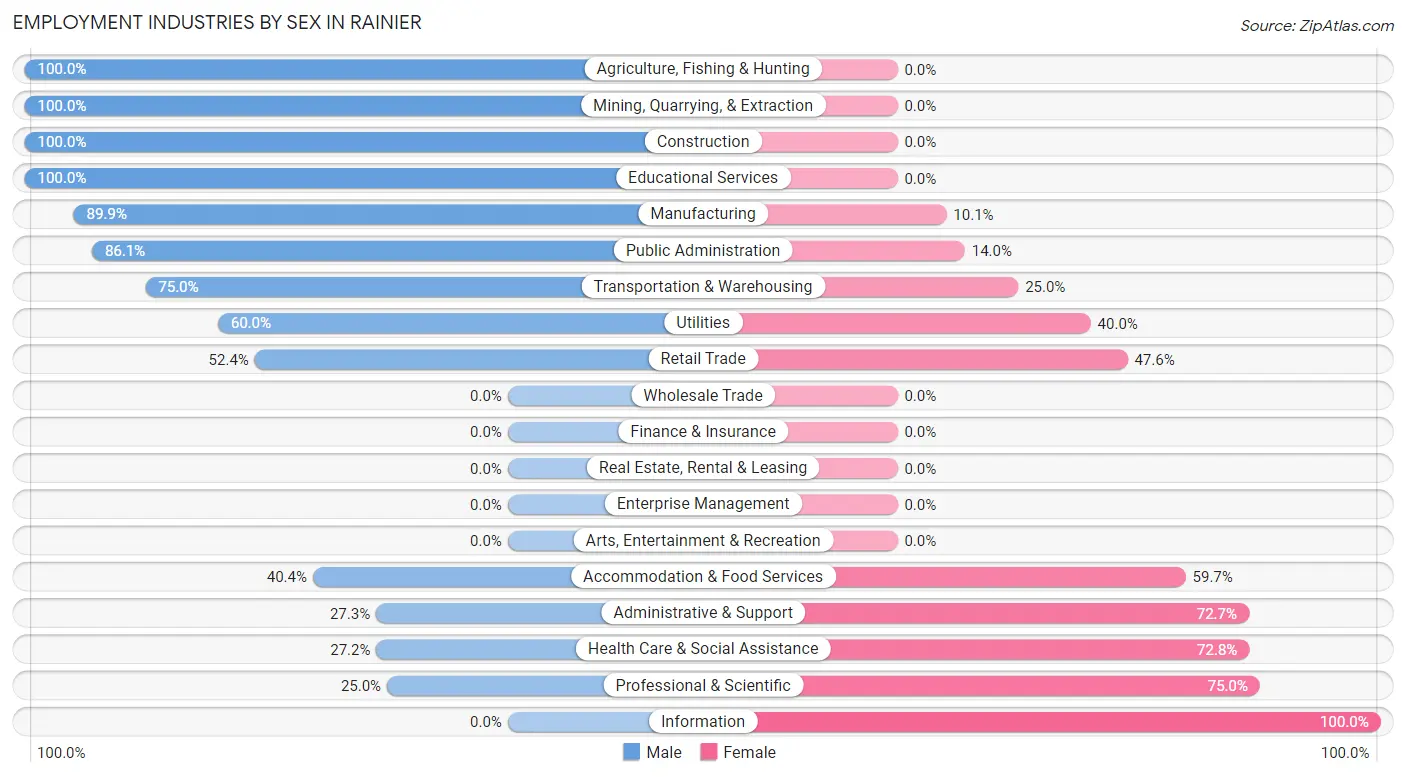
Employment Industries by Sex in Rainier
The Rainier industries that see more men than women are Agriculture, Fishing & Hunting (100.0%), Mining, Quarrying, & Extraction (100.0%), and Construction (100.0%), whereas the industries that tend to have a higher number of women are Information (100.0%), Professional & Scientific (75.0%), and Health Care & Social Assistance (72.8%).
| Industry | Male | Female |
| Agriculture, Fishing & Hunting | 39 (100.0%) | 0 (0.0%) |
| Mining, Quarrying, & Extraction | 19 (100.0%) | 0 (0.0%) |
| Construction | 77 (100.0%) | 0 (0.0%) |
| Manufacturing | 133 (89.9%) | 15 (10.1%) |
| Wholesale Trade | 0 (0.0%) | 0 (0.0%) |
| Retail Trade | 33 (52.4%) | 30 (47.6%) |
| Transportation & Warehousing | 18 (75.0%) | 6 (25.0%) |
| Utilities | 6 (60.0%) | 4 (40.0%) |
| Information | 0 (0.0%) | 4 (100.0%) |
| Finance & Insurance | 0 (0.0%) | 0 (0.0%) |
| Real Estate, Rental & Leasing | 0 (0.0%) | 0 (0.0%) |
| Professional & Scientific | 7 (25.0%) | 21 (75.0%) |
| Enterprise Management | 0 (0.0%) | 0 (0.0%) |
| Administrative & Support | 12 (27.3%) | 32 (72.7%) |
| Educational Services | 39 (100.0%) | 0 (0.0%) |
| Health Care & Social Assistance | 34 (27.2%) | 91 (72.8%) |
| Arts, Entertainment & Recreation | 0 (0.0%) | 0 (0.0%) |
| Accommodation & Food Services | 23 (40.4%) | 34 (59.7%) |
| Public Administration | 37 (86.1%) | 6 (14.0%) |
| Total | 492 (66.9%) | 243 (33.1%) |
Education in Rainier
School Enrollment in Rainier
The most common levels of schooling among the 432 students in Rainier are elementary school (213 | 49.3%), middle school (71 | 16.4%), and high school (60 | 13.9%).
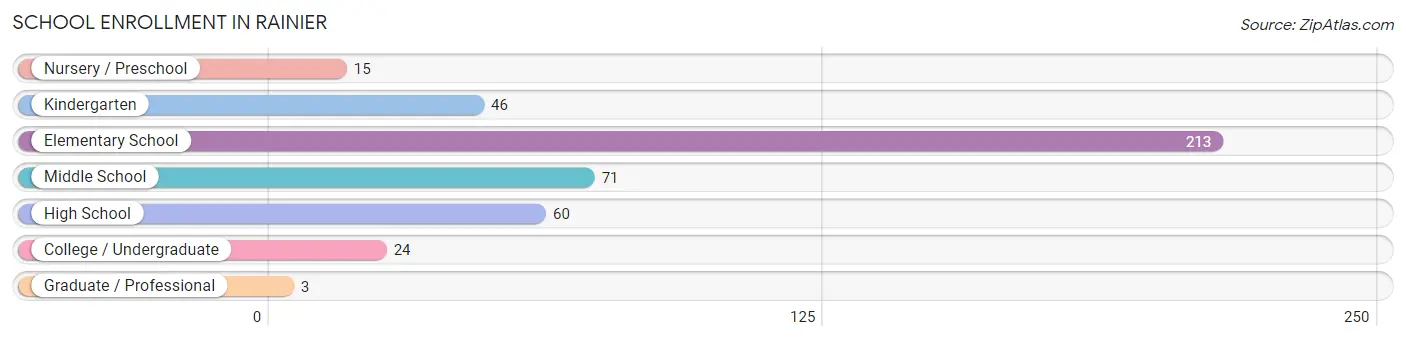
| School Level | # Students | % Students |
| Nursery / Preschool | 15 | 3.5% |
| Kindergarten | 46 | 10.6% |
| Elementary School | 213 | 49.3% |
| Middle School | 71 | 16.4% |
| High School | 60 | 13.9% |
| College / Undergraduate | 24 | 5.6% |
| Graduate / Professional | 3 | 0.7% |
| Total | 432 | 100.0% |
School Enrollment by Age by Funding Source in Rainier
Out of a total of 432 students who are enrolled in schools in Rainier, 40 (9.3%) attend a private institution, while the remaining 392 (90.7%) are enrolled in public schools. The age group of 3 to 4 year olds has the highest likelihood of being enrolled in private schools, with 15 (100.0% in the age bracket) enrolled. Conversely, the age group of 5 to 9 year old has the lowest likelihood of being enrolled in a private school, with 237 (100.0% in the age bracket) attending a public institution.
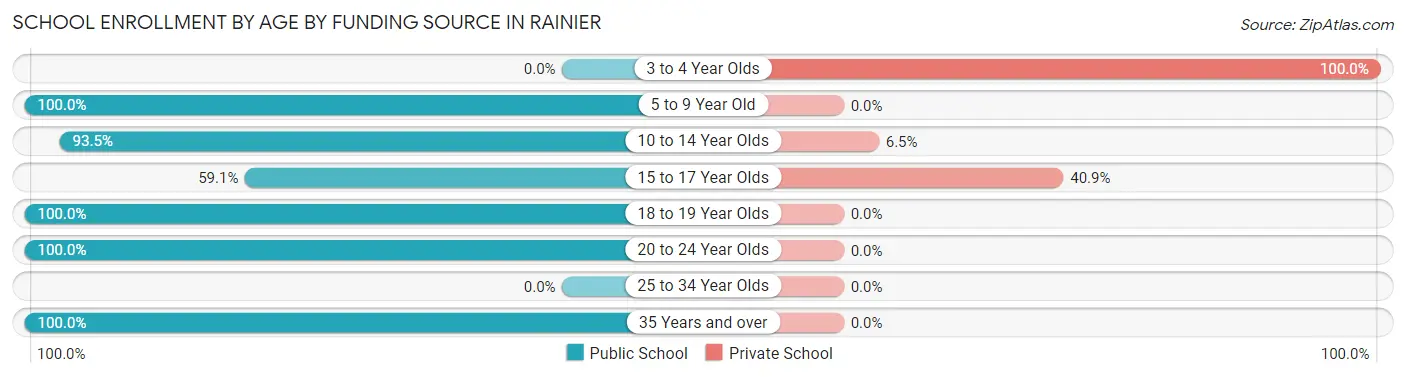
| Age Bracket | Public School | Private School |
| 3 to 4 Year Olds | 0 (0.0%) | 15 (100.0%) |
| 5 to 9 Year Old | 237 (100.0%) | 0 (0.0%) |
| 10 to 14 Year Olds | 100 (93.5%) | 7 (6.5%) |
| 15 to 17 Year Olds | 26 (59.1%) | 18 (40.9%) |
| 18 to 19 Year Olds | 2 (100.0%) | 0 (0.0%) |
| 20 to 24 Year Olds | 12 (100.0%) | 0 (0.0%) |
| 25 to 34 Year Olds | 0 (0.0%) | 0 (0.0%) |
| 35 Years and over | 15 (100.0%) | 0 (0.0%) |
| Total | 392 (90.7%) | 40 (9.3%) |
Educational Attainment by Field of Study in Rainier
Engineering (70 | 27.2%), physical & health sciences (42 | 16.3%), arts & humanities (25 | 9.7%), bio, nature & agricultural (23 | 8.9%), and science & technology (22 | 8.6%) are the most common fields of study among 257 individuals in Rainier who have obtained a bachelor's degree or higher.
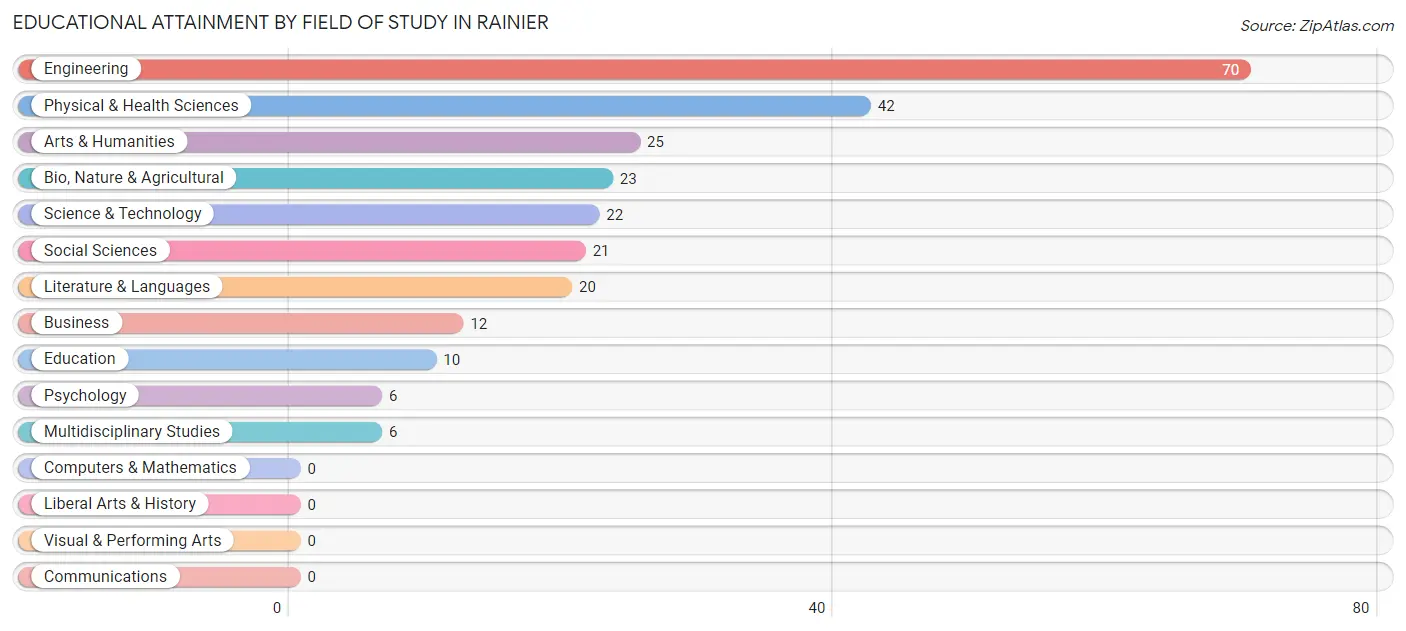
| Field of Study | # Graduates | % Graduates |
| Computers & Mathematics | 0 | 0.0% |
| Bio, Nature & Agricultural | 23 | 8.9% |
| Physical & Health Sciences | 42 | 16.3% |
| Psychology | 6 | 2.3% |
| Social Sciences | 21 | 8.2% |
| Engineering | 70 | 27.2% |
| Multidisciplinary Studies | 6 | 2.3% |
| Science & Technology | 22 | 8.6% |
| Business | 12 | 4.7% |
| Education | 10 | 3.9% |
| Literature & Languages | 20 | 7.8% |
| Liberal Arts & History | 0 | 0.0% |
| Visual & Performing Arts | 0 | 0.0% |
| Communications | 0 | 0.0% |
| Arts & Humanities | 25 | 9.7% |
| Total | 257 | 100.0% |
Transportation & Commute in Rainier
Vehicle Availability by Sex in Rainier
The most prevalent vehicle ownership categories in Rainier are males with 2 vehicles (207, accounting for 42.1%) and females with 2 vehicles (99, making up 88.1%).
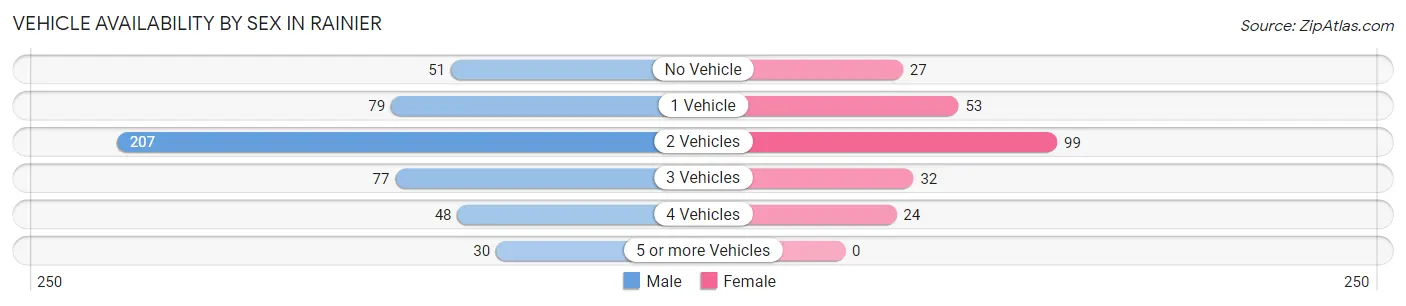
| Vehicles Available | Male | Female |
| No Vehicle | 51 (10.4%) | 27 (11.5%) |
| 1 Vehicle | 79 (16.1%) | 53 (22.6%) |
| 2 Vehicles | 207 (42.1%) | 99 (42.1%) |
| 3 Vehicles | 77 (15.7%) | 32 (13.6%) |
| 4 Vehicles | 48 (9.8%) | 24 (10.2%) |
| 5 or more Vehicles | 30 (6.1%) | 0 (0.0%) |
| Total | 492 (100.0%) | 235 (100.0%) |
Commute Time in Rainier
The most frequently occuring commute durations in Rainier are 5 to 9 minutes (129 commuters, 19.2%), 60 to 89 minutes (121 commuters, 18.0%), and 15 to 19 minutes (93 commuters, 13.8%).
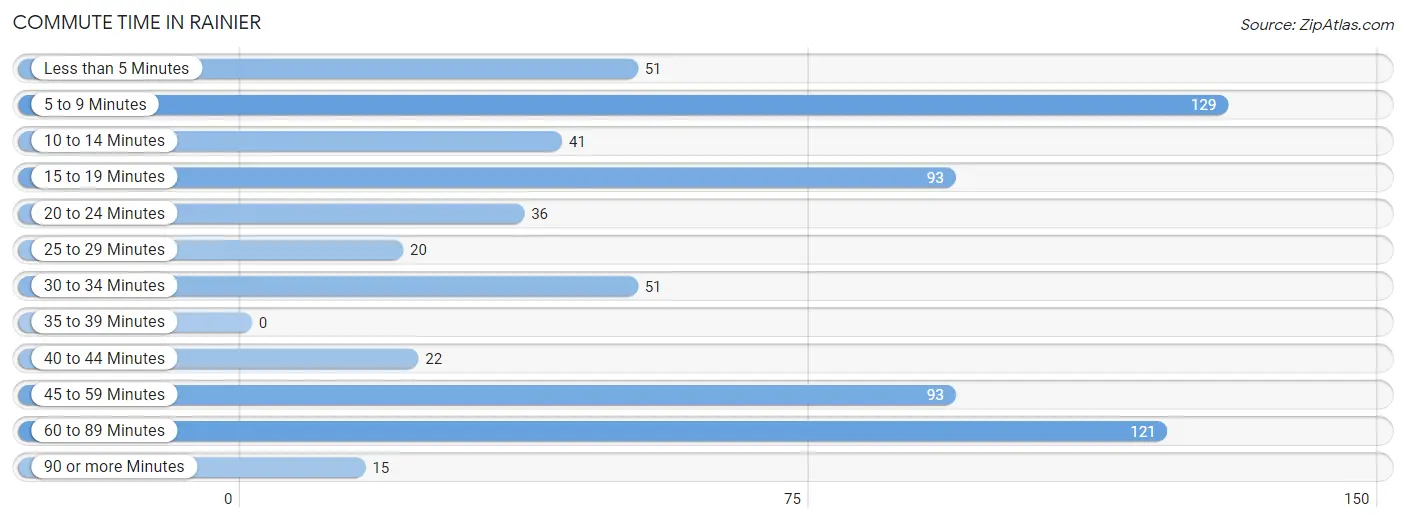
| Commute Time | # Commuters | % Commuters |
| Less than 5 Minutes | 51 | 7.6% |
| 5 to 9 Minutes | 129 | 19.2% |
| 10 to 14 Minutes | 41 | 6.1% |
| 15 to 19 Minutes | 93 | 13.8% |
| 20 to 24 Minutes | 36 | 5.4% |
| 25 to 29 Minutes | 20 | 3.0% |
| 30 to 34 Minutes | 51 | 7.6% |
| 35 to 39 Minutes | 0 | 0.0% |
| 40 to 44 Minutes | 22 | 3.3% |
| 45 to 59 Minutes | 93 | 13.8% |
| 60 to 89 Minutes | 121 | 18.0% |
| 90 or more Minutes | 15 | 2.2% |
Commute Time by Sex in Rainier
The most common commute times in Rainier are 5 to 9 minutes (117 commuters, 23.8%) for males and 60 to 89 minutes (51 commuters, 28.3%) for females.
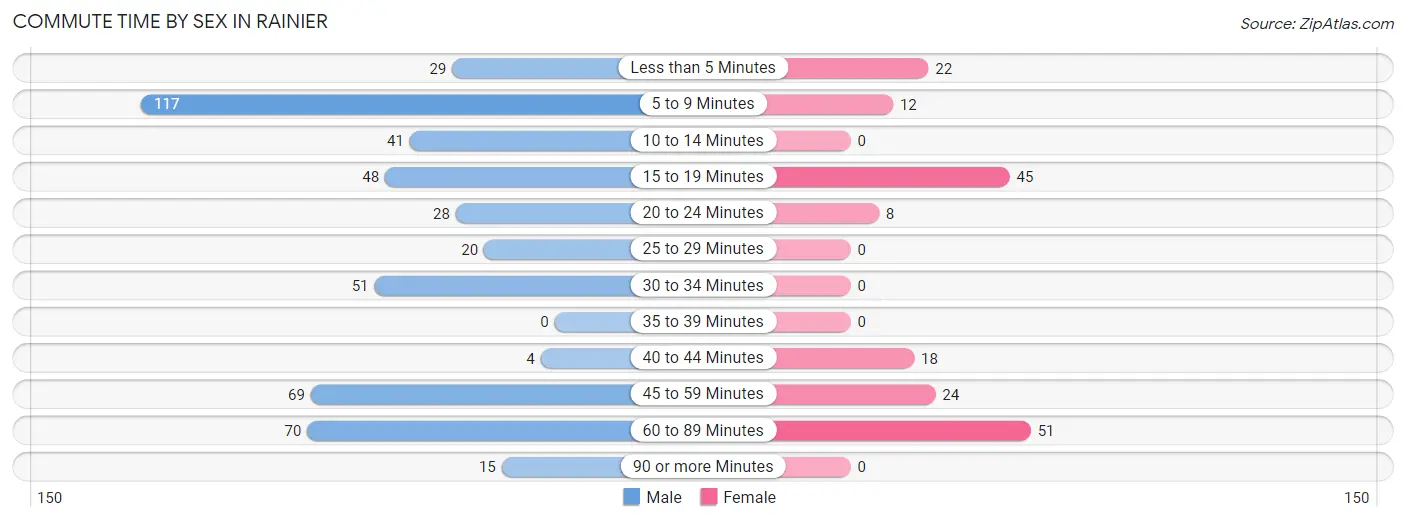
| Commute Time | Male | Female |
| Less than 5 Minutes | 29 (5.9%) | 22 (12.2%) |
| 5 to 9 Minutes | 117 (23.8%) | 12 (6.7%) |
| 10 to 14 Minutes | 41 (8.3%) | 0 (0.0%) |
| 15 to 19 Minutes | 48 (9.8%) | 45 (25.0%) |
| 20 to 24 Minutes | 28 (5.7%) | 8 (4.4%) |
| 25 to 29 Minutes | 20 (4.1%) | 0 (0.0%) |
| 30 to 34 Minutes | 51 (10.4%) | 0 (0.0%) |
| 35 to 39 Minutes | 0 (0.0%) | 0 (0.0%) |
| 40 to 44 Minutes | 4 (0.8%) | 18 (10.0%) |
| 45 to 59 Minutes | 69 (14.0%) | 24 (13.3%) |
| 60 to 89 Minutes | 70 (14.2%) | 51 (28.3%) |
| 90 or more Minutes | 15 (3.0%) | 0 (0.0%) |
Time of Departure to Work by Sex in Rainier
The most frequent times of departure to work in Rainier are 6:30 AM to 6:59 AM (124, 25.2%) for males and 7:00 AM to 7:29 AM (38, 21.1%) for females.
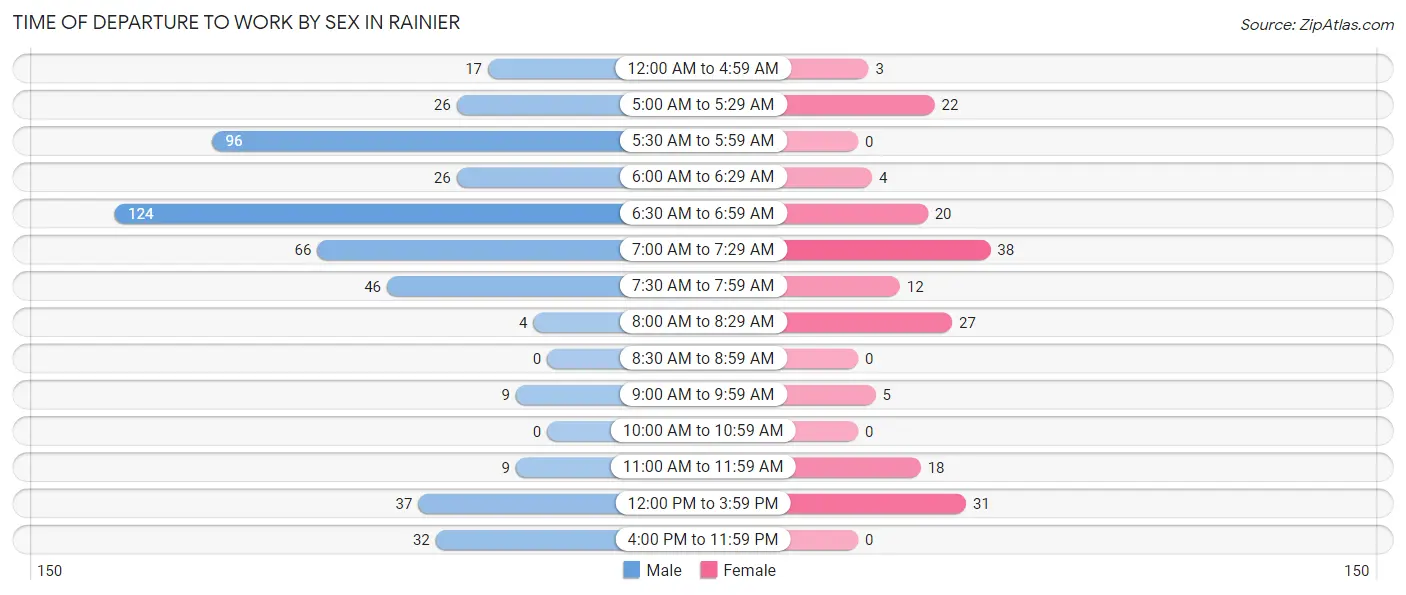
| Time of Departure | Male | Female |
| 12:00 AM to 4:59 AM | 17 (3.5%) | 3 (1.7%) |
| 5:00 AM to 5:29 AM | 26 (5.3%) | 22 (12.2%) |
| 5:30 AM to 5:59 AM | 96 (19.5%) | 0 (0.0%) |
| 6:00 AM to 6:29 AM | 26 (5.3%) | 4 (2.2%) |
| 6:30 AM to 6:59 AM | 124 (25.2%) | 20 (11.1%) |
| 7:00 AM to 7:29 AM | 66 (13.4%) | 38 (21.1%) |
| 7:30 AM to 7:59 AM | 46 (9.3%) | 12 (6.7%) |
| 8:00 AM to 8:29 AM | 4 (0.8%) | 27 (15.0%) |
| 8:30 AM to 8:59 AM | 0 (0.0%) | 0 (0.0%) |
| 9:00 AM to 9:59 AM | 9 (1.8%) | 5 (2.8%) |
| 10:00 AM to 10:59 AM | 0 (0.0%) | 0 (0.0%) |
| 11:00 AM to 11:59 AM | 9 (1.8%) | 18 (10.0%) |
| 12:00 PM to 3:59 PM | 37 (7.5%) | 31 (17.2%) |
| 4:00 PM to 11:59 PM | 32 (6.5%) | 0 (0.0%) |
| Total | 492 (100.0%) | 180 (100.0%) |
Housing Occupancy in Rainier
Occupancy by Ownership in Rainier
Of the total 804 dwellings in Rainier, owner-occupied units account for 412 (51.2%), while renter-occupied units make up 392 (48.8%).
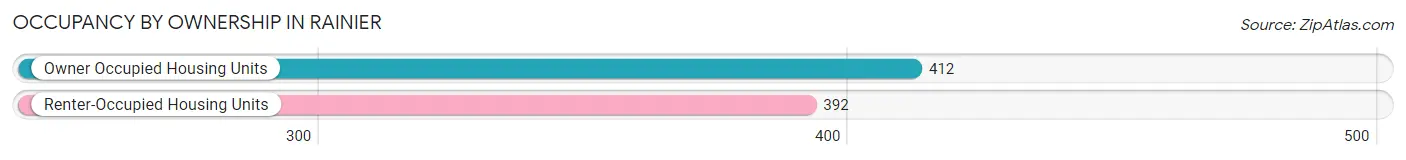
| Occupancy | # Housing Units | % Housing Units |
| Owner Occupied Housing Units | 412 | 51.2% |
| Renter-Occupied Housing Units | 392 | 48.8% |
| Total Occupied Housing Units | 804 | 100.0% |
Occupancy by Household Size in Rainier
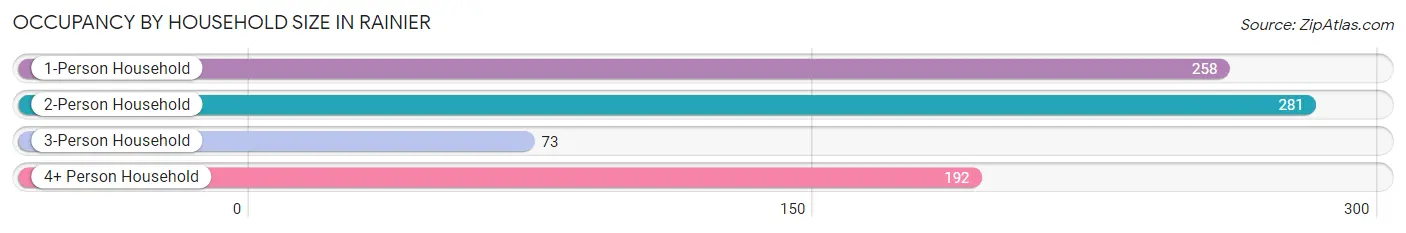
| Household Size | # Housing Units | % Housing Units |
| 1-Person Household | 258 | 32.1% |
| 2-Person Household | 281 | 34.9% |
| 3-Person Household | 73 | 9.1% |
| 4+ Person Household | 192 | 23.9% |
| Total Housing Units | 804 | 100.0% |
Occupancy by Ownership by Household Size in Rainier
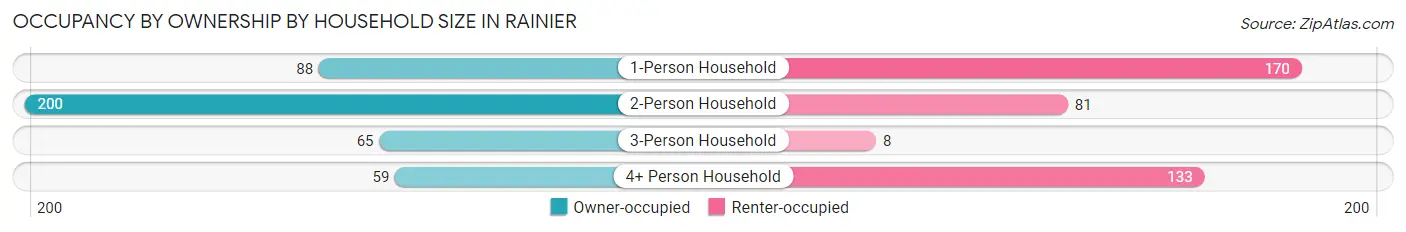
| Household Size | Owner-occupied | Renter-occupied |
| 1-Person Household | 88 (34.1%) | 170 (65.9%) |
| 2-Person Household | 200 (71.2%) | 81 (28.8%) |
| 3-Person Household | 65 (89.0%) | 8 (11.0%) |
| 4+ Person Household | 59 (30.7%) | 133 (69.3%) |
| Total Housing Units | 412 (51.2%) | 392 (48.8%) |
Occupancy by Educational Attainment in Rainier
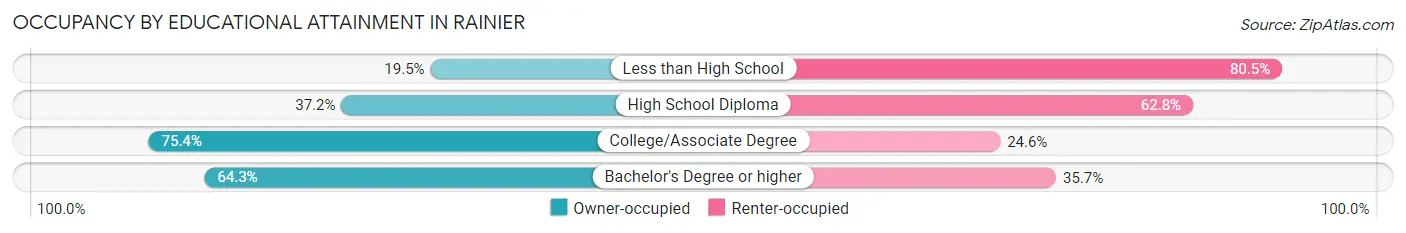
| Household Size | Owner-occupied | Renter-occupied |
| Less than High School | 17 (19.5%) | 70 (80.5%) |
| High School Diploma | 128 (37.2%) | 216 (62.8%) |
| College/Associate Degree | 184 (75.4%) | 60 (24.6%) |
| Bachelor's Degree or higher | 83 (64.3%) | 46 (35.7%) |
Occupancy by Age of Householder in Rainier
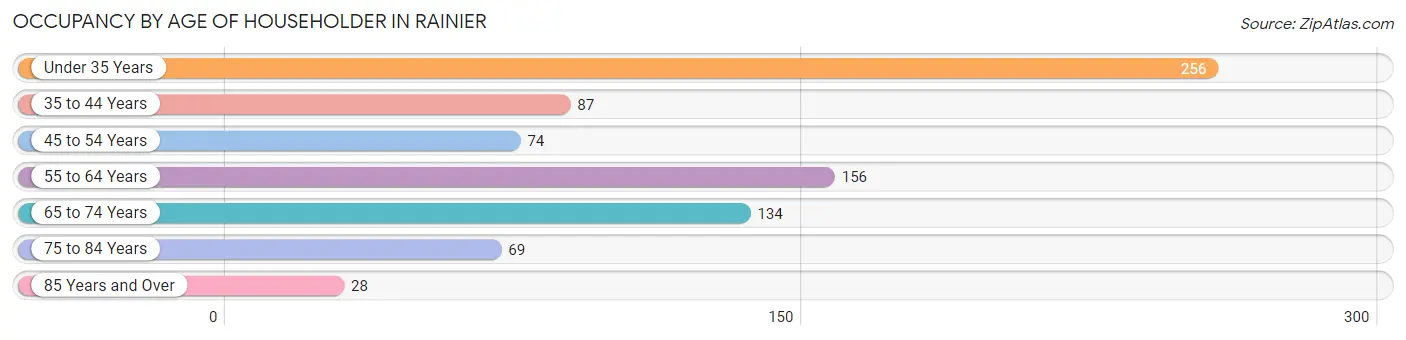
| Age Bracket | # Households | % Households |
| Under 35 Years | 256 | 31.8% |
| 35 to 44 Years | 87 | 10.8% |
| 45 to 54 Years | 74 | 9.2% |
| 55 to 64 Years | 156 | 19.4% |
| 65 to 74 Years | 134 | 16.7% |
| 75 to 84 Years | 69 | 8.6% |
| 85 Years and Over | 28 | 3.5% |
| Total | 804 | 100.0% |
Housing Finances in Rainier
Median Income by Occupancy in Rainier
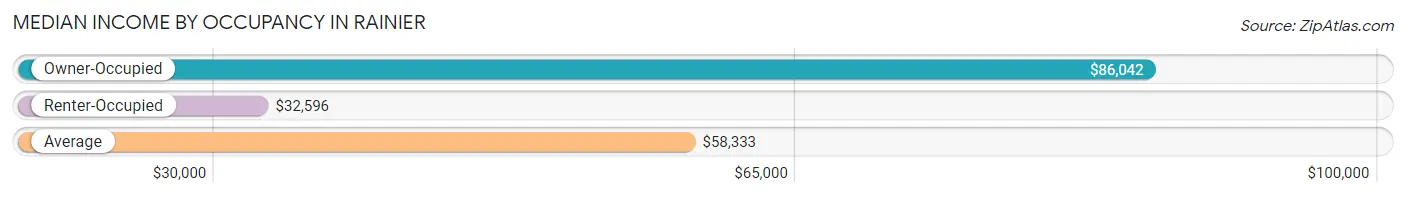
| Occupancy Type | # Households | Median Income |
| Owner-Occupied | 412 (51.2%) | $86,042 |
| Renter-Occupied | 392 (48.8%) | $32,596 |
| Average | 804 (100.0%) | $58,333 |
Occupancy by Householder Income Bracket in Rainier
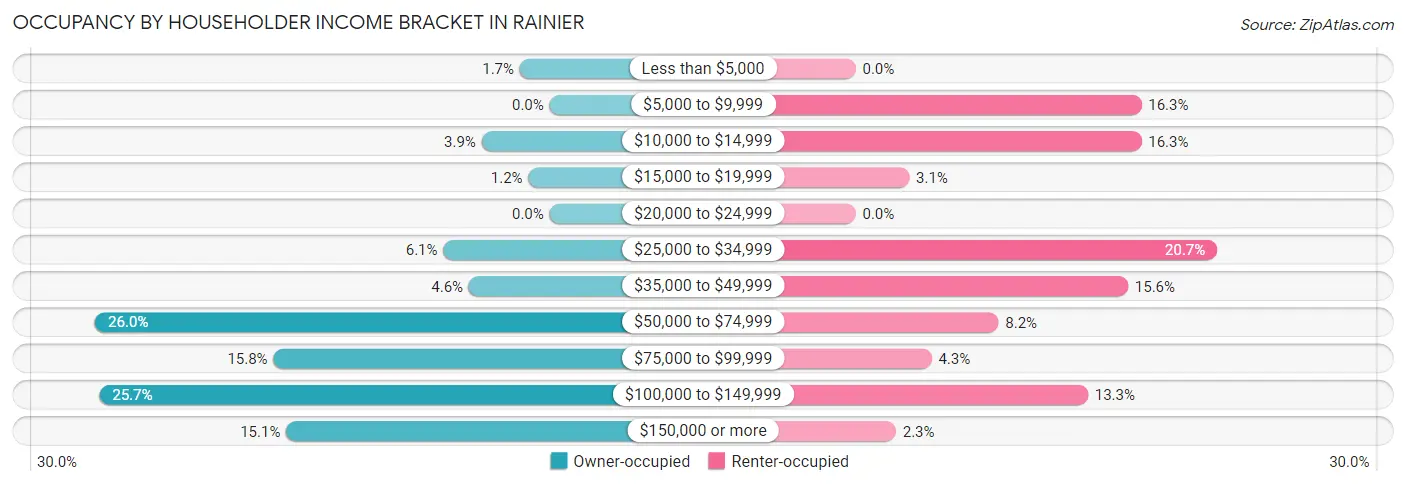
| Income Bracket | Owner-occupied | Renter-occupied |
| Less than $5,000 | 7 (1.7%) | 0 (0.0%) |
| $5,000 to $9,999 | 0 (0.0%) | 64 (16.3%) |
| $10,000 to $14,999 | 16 (3.9%) | 64 (16.3%) |
| $15,000 to $19,999 | 5 (1.2%) | 12 (3.1%) |
| $20,000 to $24,999 | 0 (0.0%) | 0 (0.0%) |
| $25,000 to $34,999 | 25 (6.1%) | 81 (20.7%) |
| $35,000 to $49,999 | 19 (4.6%) | 61 (15.6%) |
| $50,000 to $74,999 | 107 (26.0%) | 32 (8.2%) |
| $75,000 to $99,999 | 65 (15.8%) | 17 (4.3%) |
| $100,000 to $149,999 | 106 (25.7%) | 52 (13.3%) |
| $150,000 or more | 62 (15.0%) | 9 (2.3%) |
| Total | 412 (100.0%) | 392 (100.0%) |
Monthly Housing Cost Tiers in Rainier
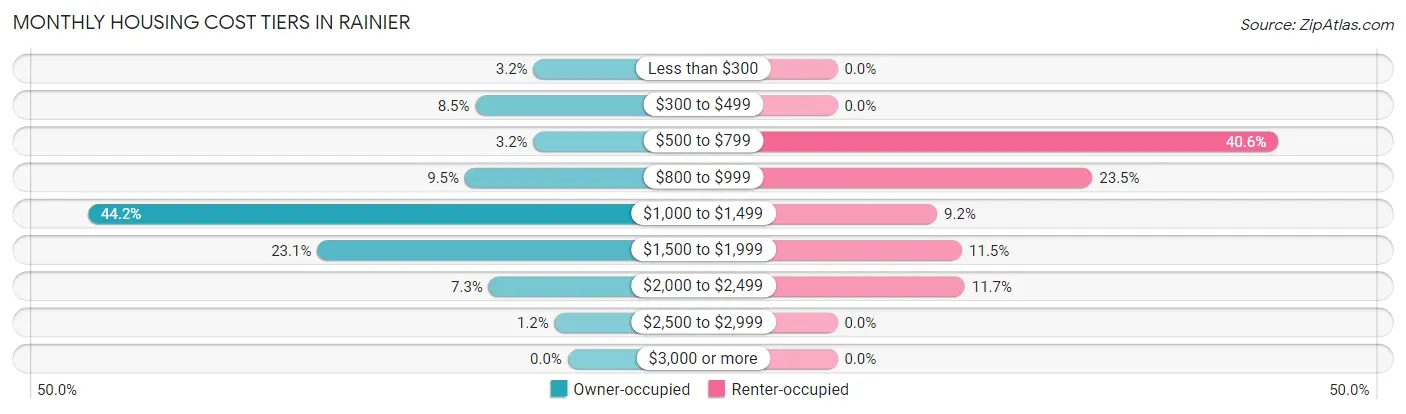
| Monthly Cost | Owner-occupied | Renter-occupied |
| Less than $300 | 13 (3.2%) | 0 (0.0%) |
| $300 to $499 | 35 (8.5%) | 0 (0.0%) |
| $500 to $799 | 13 (3.2%) | 159 (40.6%) |
| $800 to $999 | 39 (9.5%) | 92 (23.5%) |
| $1,000 to $1,499 | 182 (44.2%) | 36 (9.2%) |
| $1,500 to $1,999 | 95 (23.1%) | 45 (11.5%) |
| $2,000 to $2,499 | 30 (7.3%) | 46 (11.7%) |
| $2,500 to $2,999 | 5 (1.2%) | 0 (0.0%) |
| $3,000 or more | 0 (0.0%) | 0 (0.0%) |
| Total | 412 (100.0%) | 392 (100.0%) |
Physical Housing Characteristics in Rainier
Housing Structures in Rainier
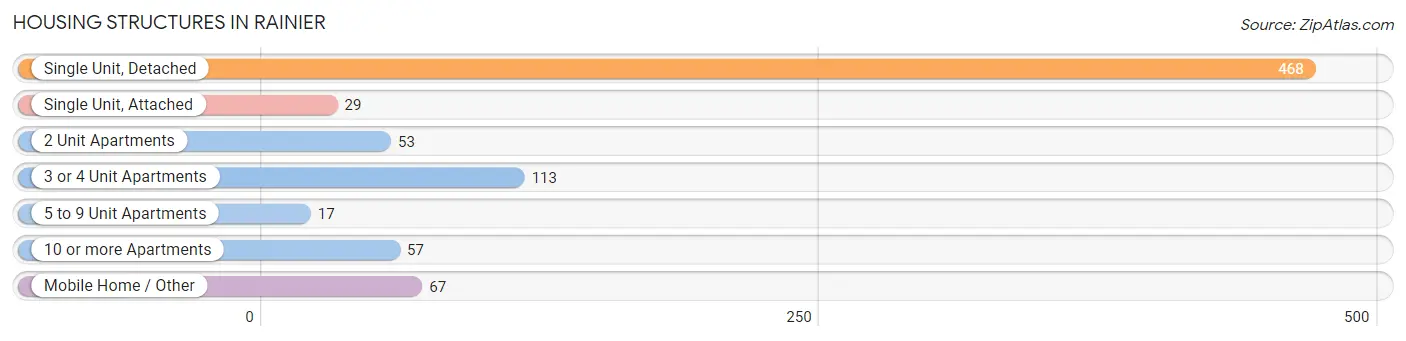
| Structure Type | # Housing Units | % Housing Units |
| Single Unit, Detached | 468 | 58.2% |
| Single Unit, Attached | 29 | 3.6% |
| 2 Unit Apartments | 53 | 6.6% |
| 3 or 4 Unit Apartments | 113 | 14.1% |
| 5 to 9 Unit Apartments | 17 | 2.1% |
| 10 or more Apartments | 57 | 7.1% |
| Mobile Home / Other | 67 | 8.3% |
| Total | 804 | 100.0% |
Housing Structures by Occupancy in Rainier
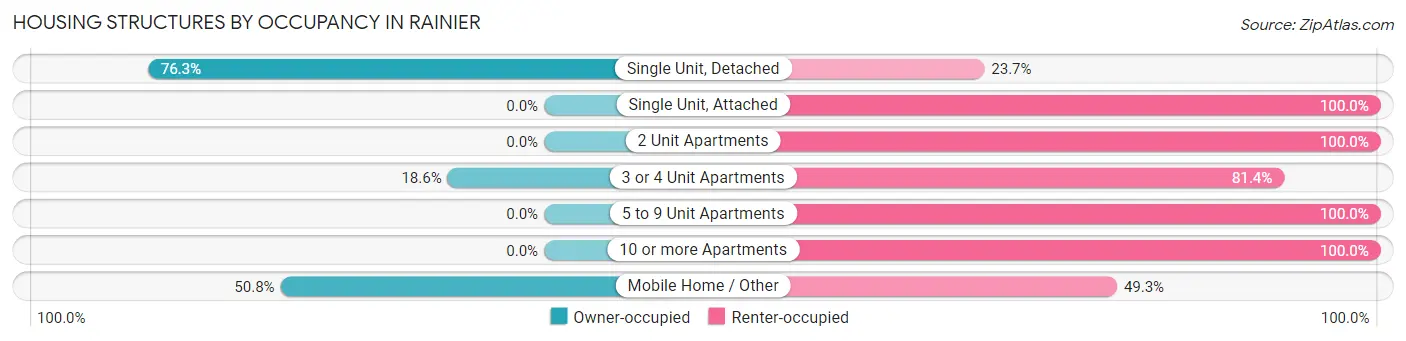
| Structure Type | Owner-occupied | Renter-occupied |
| Single Unit, Detached | 357 (76.3%) | 111 (23.7%) |
| Single Unit, Attached | 0 (0.0%) | 29 (100.0%) |
| 2 Unit Apartments | 0 (0.0%) | 53 (100.0%) |
| 3 or 4 Unit Apartments | 21 (18.6%) | 92 (81.4%) |
| 5 to 9 Unit Apartments | 0 (0.0%) | 17 (100.0%) |
| 10 or more Apartments | 0 (0.0%) | 57 (100.0%) |
| Mobile Home / Other | 34 (50.7%) | 33 (49.2%) |
| Total | 412 (51.2%) | 392 (48.8%) |
Housing Structures by Number of Rooms in Rainier
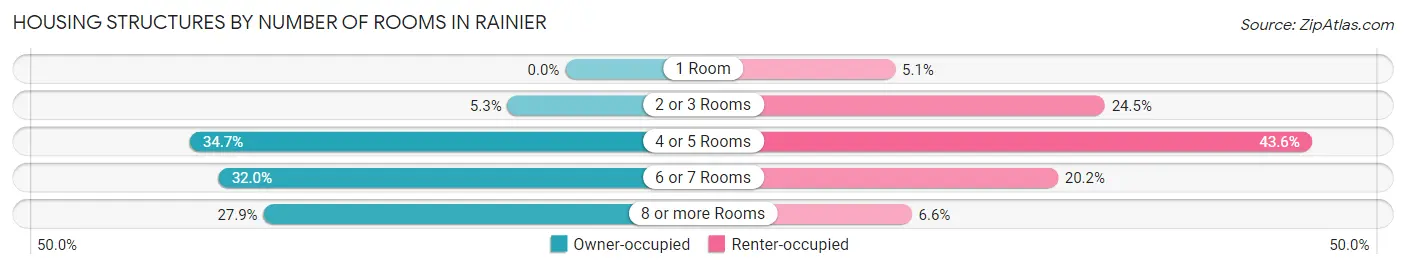
| Number of Rooms | Owner-occupied | Renter-occupied |
| 1 Room | 0 (0.0%) | 20 (5.1%) |
| 2 or 3 Rooms | 22 (5.3%) | 96 (24.5%) |
| 4 or 5 Rooms | 143 (34.7%) | 171 (43.6%) |
| 6 or 7 Rooms | 132 (32.0%) | 79 (20.2%) |
| 8 or more Rooms | 115 (27.9%) | 26 (6.6%) |
| Total | 412 (100.0%) | 392 (100.0%) |
Housing Structure by Heating Type in Rainier
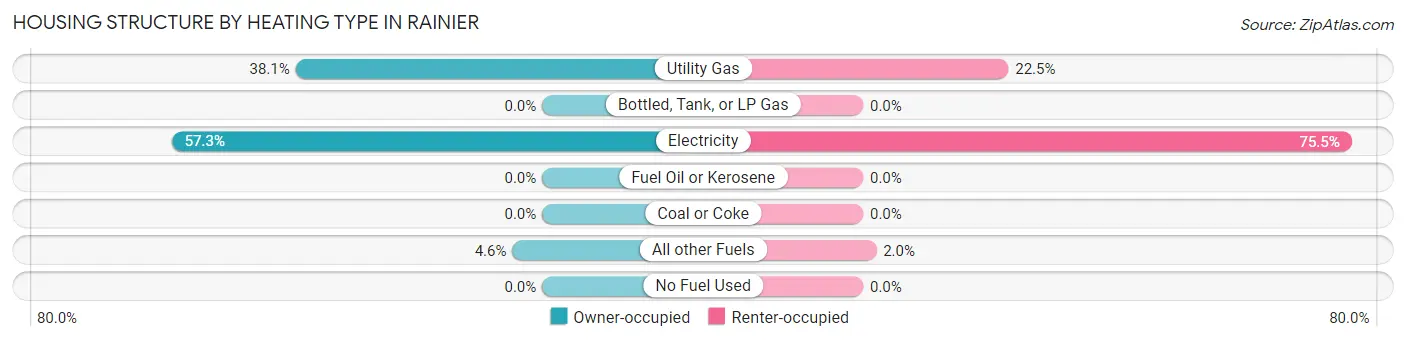
| Heating Type | Owner-occupied | Renter-occupied |
| Utility Gas | 157 (38.1%) | 88 (22.5%) |
| Bottled, Tank, or LP Gas | 0 (0.0%) | 0 (0.0%) |
| Electricity | 236 (57.3%) | 296 (75.5%) |
| Fuel Oil or Kerosene | 0 (0.0%) | 0 (0.0%) |
| Coal or Coke | 0 (0.0%) | 0 (0.0%) |
| All other Fuels | 19 (4.6%) | 8 (2.0%) |
| No Fuel Used | 0 (0.0%) | 0 (0.0%) |
| Total | 412 (100.0%) | 392 (100.0%) |
Household Vehicle Usage in Rainier
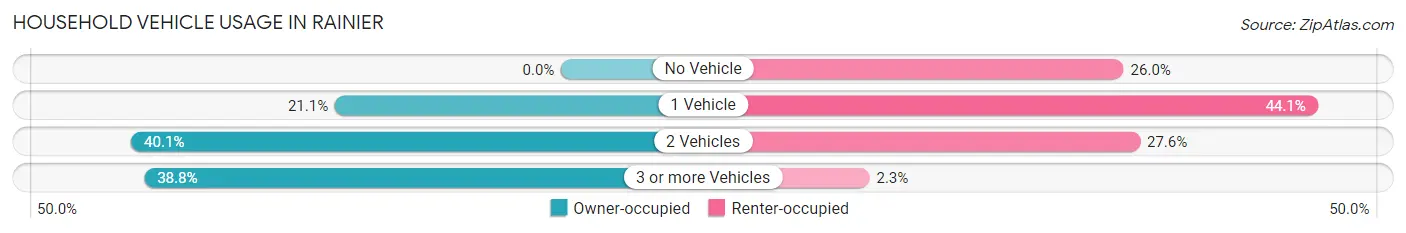
| Vehicles per Household | Owner-occupied | Renter-occupied |
| No Vehicle | 0 (0.0%) | 102 (26.0%) |
| 1 Vehicle | 87 (21.1%) | 173 (44.1%) |
| 2 Vehicles | 165 (40.1%) | 108 (27.6%) |
| 3 or more Vehicles | 160 (38.8%) | 9 (2.3%) |
| Total | 412 (100.0%) | 392 (100.0%) |
Real Estate & Mortgages in Rainier
Real Estate and Mortgage Overview in Rainier
| Characteristic | Without Mortgage | With Mortgage |
| Housing Units | 101 | 311 |
| Median Property Value | $385,400 | $255,800 |
| Median Household Income | $110,673 | $24 |
| Monthly Housing Costs | $542 | $0 |
| Real Estate Taxes | $3,500 | $0 |
Property Value by Mortgage Status in Rainier
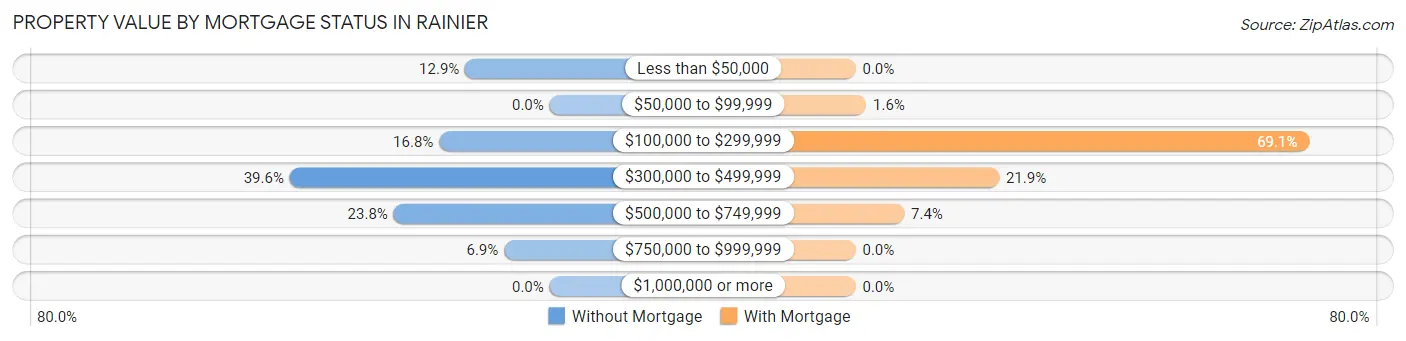
| Property Value | Without Mortgage | With Mortgage |
| Less than $50,000 | 13 (12.9%) | 0 (0.0%) |
| $50,000 to $99,999 | 0 (0.0%) | 5 (1.6%) |
| $100,000 to $299,999 | 17 (16.8%) | 215 (69.1%) |
| $300,000 to $499,999 | 40 (39.6%) | 68 (21.9%) |
| $500,000 to $749,999 | 24 (23.8%) | 23 (7.4%) |
| $750,000 to $999,999 | 7 (6.9%) | 0 (0.0%) |
| $1,000,000 or more | 0 (0.0%) | 0 (0.0%) |
| Total | 101 (100.0%) | 311 (100.0%) |
Household Income by Mortgage Status in Rainier
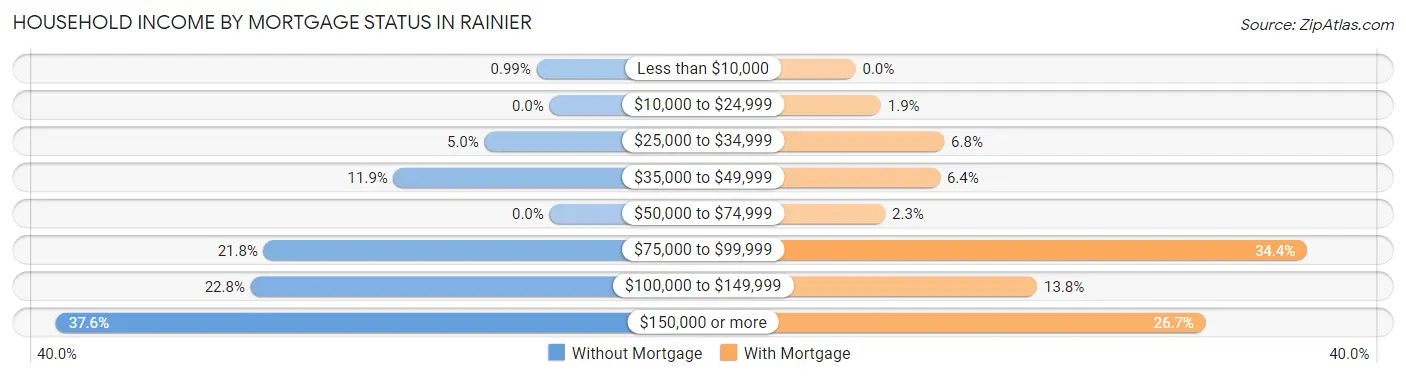
| Household Income | Without Mortgage | With Mortgage |
| Less than $10,000 | 1 (1.0%) | 0 (0.0%) |
| $10,000 to $24,999 | 0 (0.0%) | 6 (1.9%) |
| $25,000 to $34,999 | 5 (5.0%) | 21 (6.8%) |
| $35,000 to $49,999 | 12 (11.9%) | 20 (6.4%) |
| $50,000 to $74,999 | 0 (0.0%) | 7 (2.2%) |
| $75,000 to $99,999 | 22 (21.8%) | 107 (34.4%) |
| $100,000 to $149,999 | 23 (22.8%) | 43 (13.8%) |
| $150,000 or more | 38 (37.6%) | 83 (26.7%) |
| Total | 101 (100.0%) | 311 (100.0%) |
Property Value to Household Income Ratio in Rainier
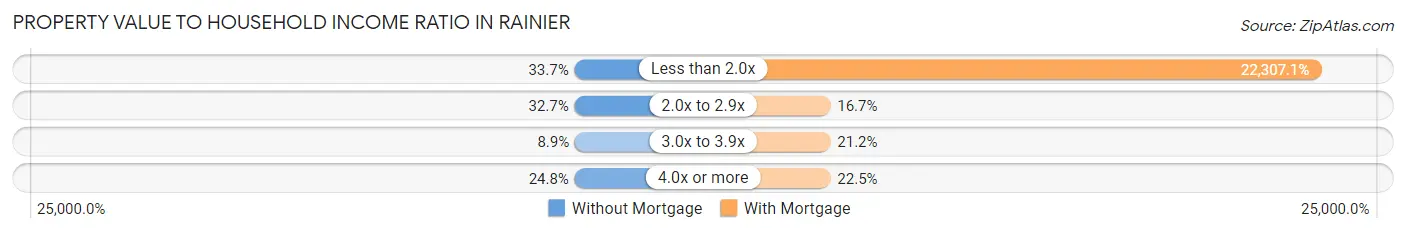
| Value-to-Income Ratio | Without Mortgage | With Mortgage |
| Less than 2.0x | 34 (33.7%) | 69,375 (22,307.1%) |
| 2.0x to 2.9x | 33 (32.7%) | 52 (16.7%) |
| 3.0x to 3.9x | 9 (8.9%) | 66 (21.2%) |
| 4.0x or more | 25 (24.7%) | 70 (22.5%) |
| Total | 101 (100.0%) | 311 (100.0%) |
Real Estate Taxes by Mortgage Status in Rainier
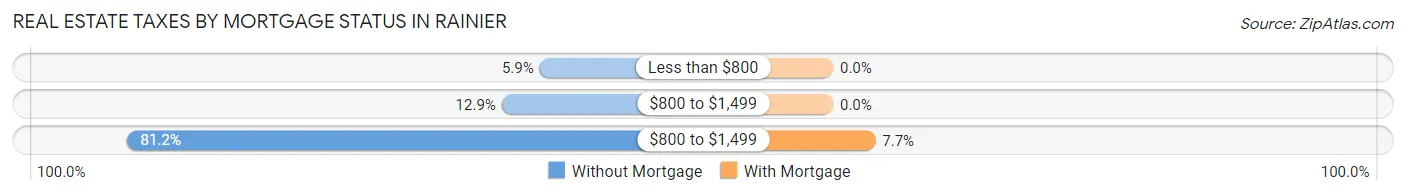
| Property Taxes | Without Mortgage | With Mortgage |
| Less than $800 | 6 (5.9%) | 0 (0.0%) |
| $800 to $1,499 | 13 (12.9%) | 0 (0.0%) |
| $800 to $1,499 | 82 (81.2%) | 24 (7.7%) |
| Total | 101 (100.0%) | 311 (100.0%) |
Health & Disability in Rainier
Health Insurance Coverage by Age in Rainier
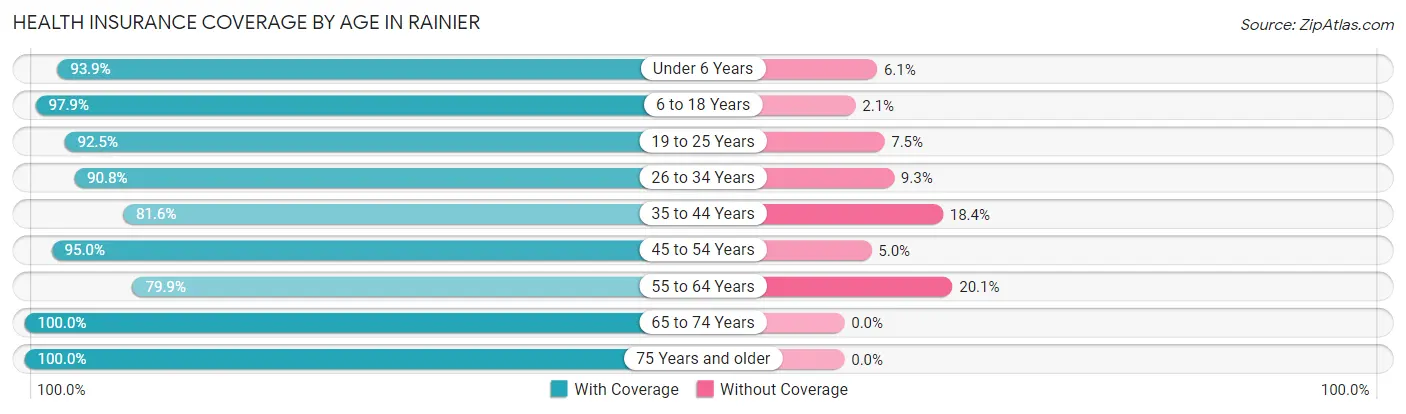
| Age Bracket | With Coverage | Without Coverage |
| Under 6 Years | 200 (93.9%) | 13 (6.1%) |
| 6 to 18 Years | 381 (97.9%) | 8 (2.1%) |
| 19 to 25 Years | 62 (92.5%) | 5 (7.5%) |
| 26 to 34 Years | 363 (90.7%) | 37 (9.2%) |
| 35 to 44 Years | 160 (81.6%) | 36 (18.4%) |
| 45 to 54 Years | 132 (95.0%) | 7 (5.0%) |
| 55 to 64 Years | 226 (79.9%) | 57 (20.1%) |
| 65 to 74 Years | 219 (100.0%) | 0 (0.0%) |
| 75 Years and older | 104 (100.0%) | 0 (0.0%) |
| Total | 1,847 (91.9%) | 163 (8.1%) |
Health Insurance Coverage by Citizenship Status in Rainier
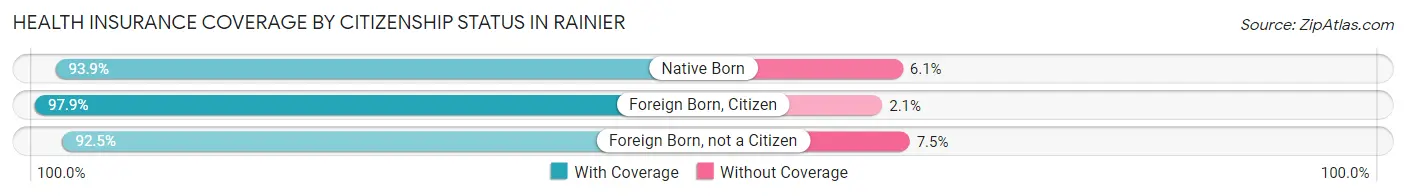
| Citizenship Status | With Coverage | Without Coverage |
| Native Born | 200 (93.9%) | 13 (6.1%) |
| Foreign Born, Citizen | 381 (97.9%) | 8 (2.1%) |
| Foreign Born, not a Citizen | 62 (92.5%) | 5 (7.5%) |
Health Insurance Coverage by Household Income in Rainier
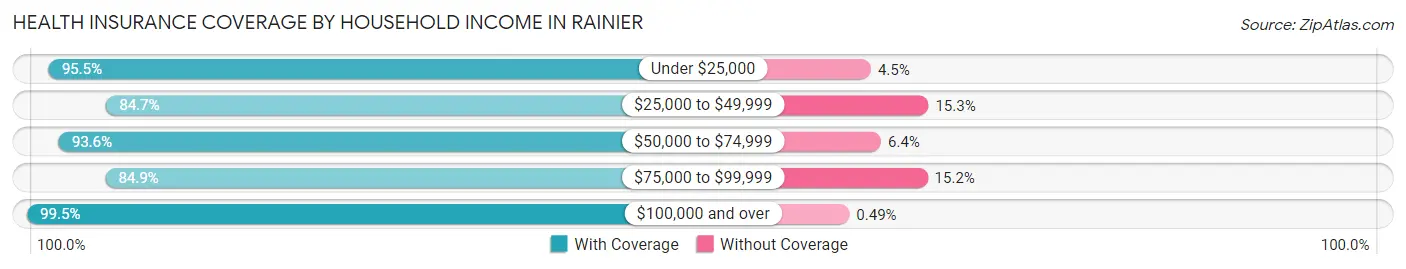
| Household Income | With Coverage | Without Coverage |
| Under $25,000 | 232 (95.5%) | 11 (4.5%) |
| $25,000 to $49,999 | 498 (84.7%) | 90 (15.3%) |
| $50,000 to $74,999 | 277 (93.6%) | 19 (6.4%) |
| $75,000 to $99,999 | 224 (84.9%) | 40 (15.1%) |
| $100,000 and over | 609 (99.5%) | 3 (0.5%) |
Public vs Private Health Insurance Coverage by Age in Rainier
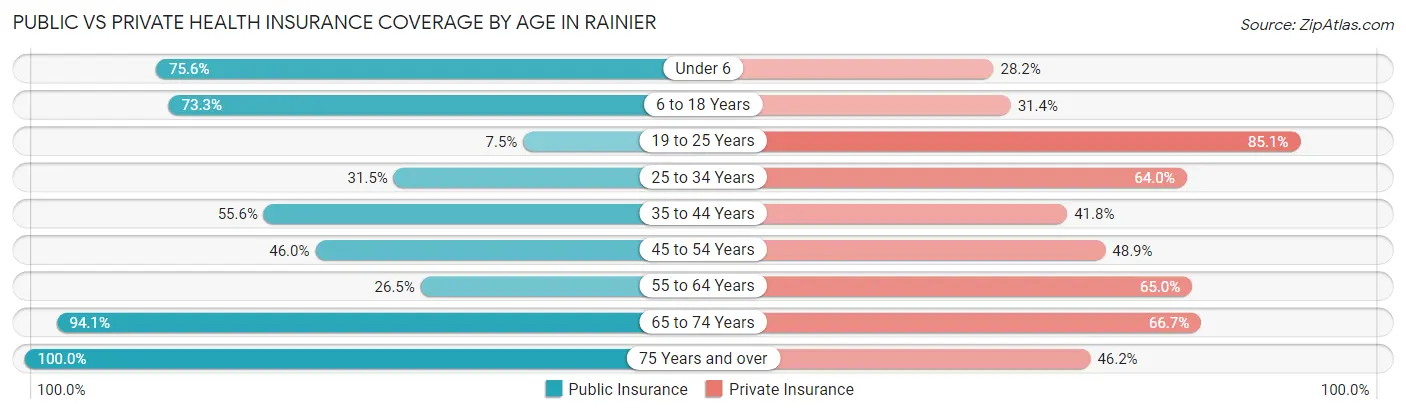
| Age Bracket | Public Insurance | Private Insurance |
| Under 6 | 161 (75.6%) | 60 (28.2%) |
| 6 to 18 Years | 285 (73.3%) | 122 (31.4%) |
| 19 to 25 Years | 5 (7.5%) | 57 (85.1%) |
| 25 to 34 Years | 126 (31.5%) | 256 (64.0%) |
| 35 to 44 Years | 109 (55.6%) | 82 (41.8%) |
| 45 to 54 Years | 64 (46.0%) | 68 (48.9%) |
| 55 to 64 Years | 75 (26.5%) | 184 (65.0%) |
| 65 to 74 Years | 206 (94.1%) | 146 (66.7%) |
| 75 Years and over | 104 (100.0%) | 48 (46.2%) |
| Total | 1,135 (56.5%) | 1,023 (50.9%) |
Disability Status by Sex by Age in Rainier
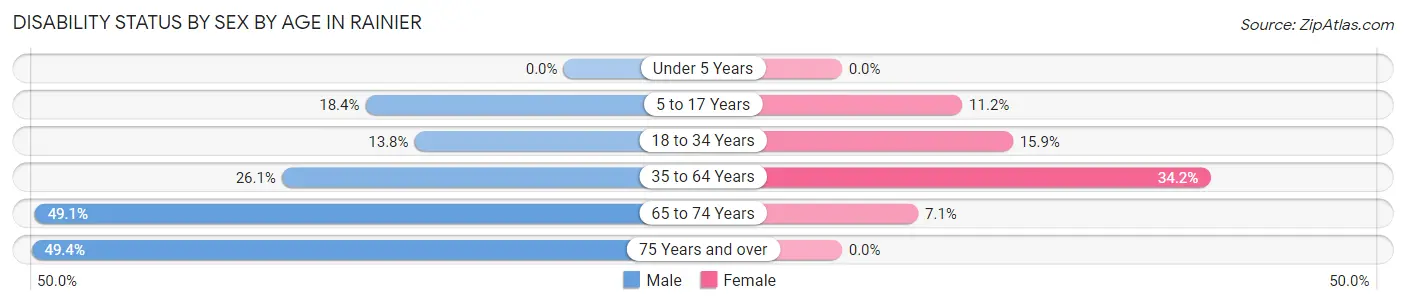
| Age Bracket | Male | Female |
| Under 5 Years | 0 (0.0%) | 0 (0.0%) |
| 5 to 17 Years | 43 (18.4%) | 23 (11.2%) |
| 18 to 34 Years | 35 (13.8%) | 36 (15.9%) |
| 35 to 64 Years | 69 (26.1%) | 121 (34.2%) |
| 65 to 74 Years | 52 (49.1%) | 8 (7.1%) |
| 75 Years and over | 38 (49.3%) | 0 (0.0%) |
Disability Class by Sex by Age in Rainier
Disability Class: Hearing Difficulty
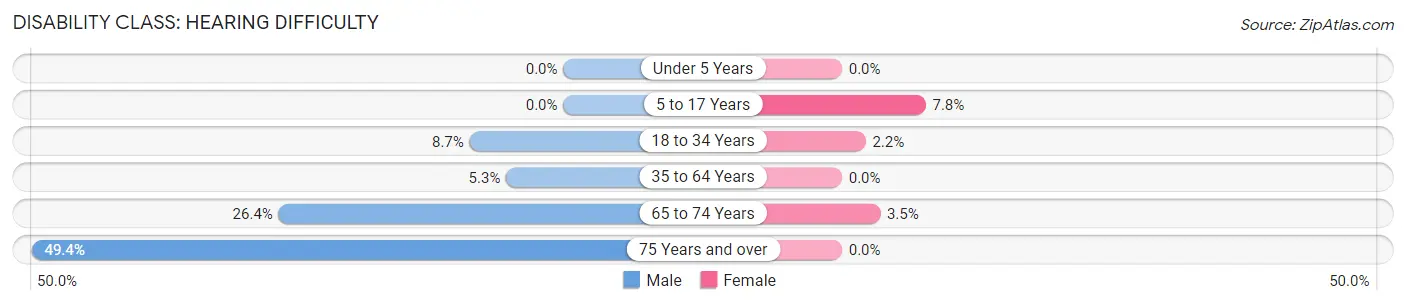
| Age Bracket | Male | Female |
| Under 5 Years | 0 (0.0%) | 0 (0.0%) |
| 5 to 17 Years | 0 (0.0%) | 16 (7.8%) |
| 18 to 34 Years | 22 (8.7%) | 5 (2.2%) |
| 35 to 64 Years | 14 (5.3%) | 0 (0.0%) |
| 65 to 74 Years | 28 (26.4%) | 4 (3.5%) |
| 75 Years and over | 38 (49.3%) | 0 (0.0%) |
Disability Class: Vision Difficulty
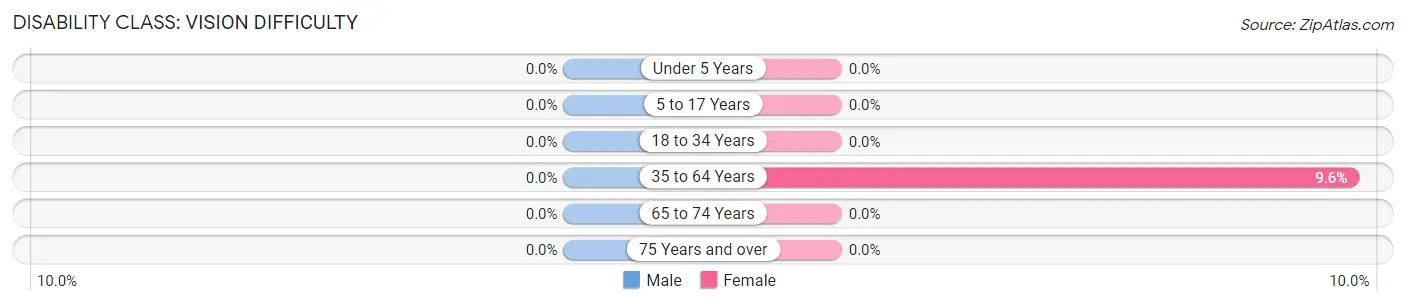
| Age Bracket | Male | Female |
| Under 5 Years | 0 (0.0%) | 0 (0.0%) |
| 5 to 17 Years | 0 (0.0%) | 0 (0.0%) |
| 18 to 34 Years | 0 (0.0%) | 0 (0.0%) |
| 35 to 64 Years | 0 (0.0%) | 34 (9.6%) |
| 65 to 74 Years | 0 (0.0%) | 0 (0.0%) |
| 75 Years and over | 0 (0.0%) | 0 (0.0%) |
Disability Class: Cognitive Difficulty
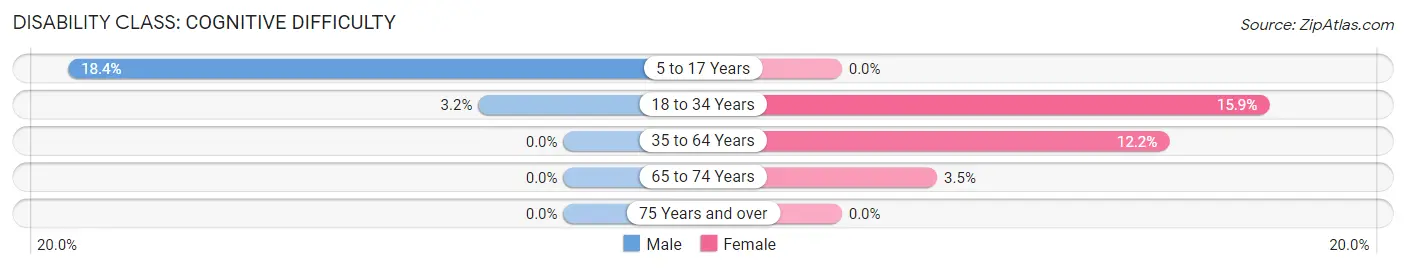
| Age Bracket | Male | Female |
| 5 to 17 Years | 43 (18.4%) | 0 (0.0%) |
| 18 to 34 Years | 8 (3.2%) | 36 (15.9%) |
| 35 to 64 Years | 0 (0.0%) | 43 (12.1%) |
| 65 to 74 Years | 0 (0.0%) | 4 (3.5%) |
| 75 Years and over | 0 (0.0%) | 0 (0.0%) |
Disability Class: Ambulatory Difficulty
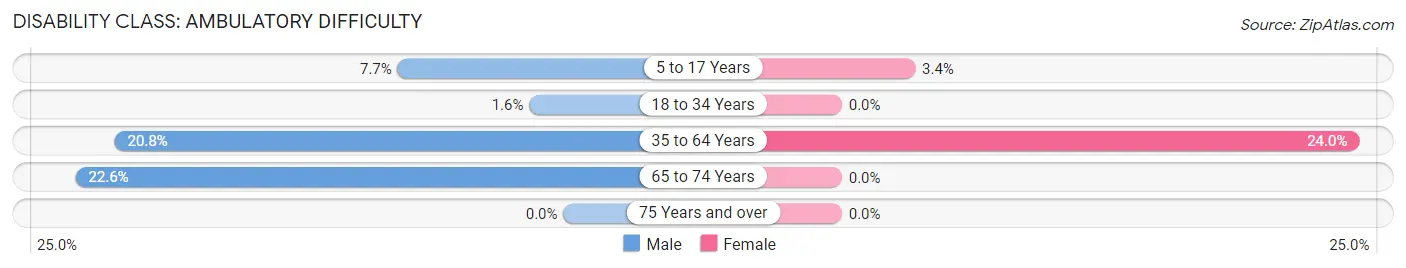
| Age Bracket | Male | Female |
| 5 to 17 Years | 18 (7.7%) | 7 (3.4%) |
| 18 to 34 Years | 4 (1.6%) | 0 (0.0%) |
| 35 to 64 Years | 55 (20.8%) | 85 (24.0%) |
| 65 to 74 Years | 24 (22.6%) | 0 (0.0%) |
| 75 Years and over | 0 (0.0%) | 0 (0.0%) |
Disability Class: Self-Care Difficulty
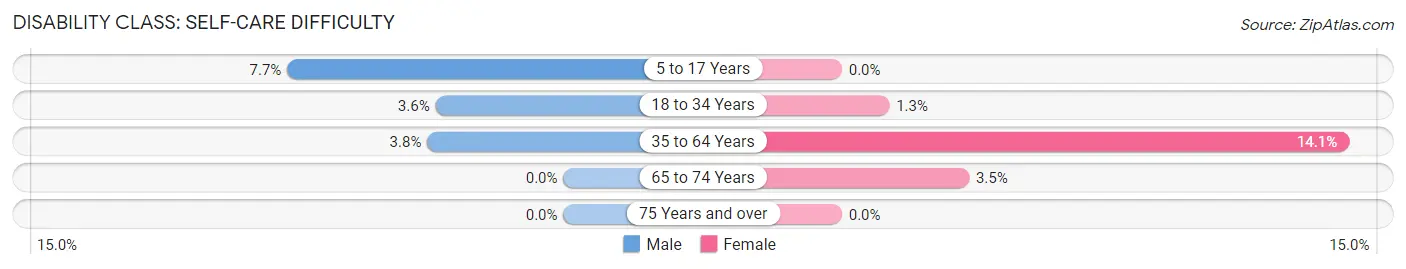
| Age Bracket | Male | Female |
| 5 to 17 Years | 18 (7.7%) | 0 (0.0%) |
| 18 to 34 Years | 9 (3.6%) | 3 (1.3%) |
| 35 to 64 Years | 10 (3.8%) | 50 (14.1%) |
| 65 to 74 Years | 0 (0.0%) | 4 (3.5%) |
| 75 Years and over | 0 (0.0%) | 0 (0.0%) |
Technology Access in Rainier
Computing Device Access in Rainier
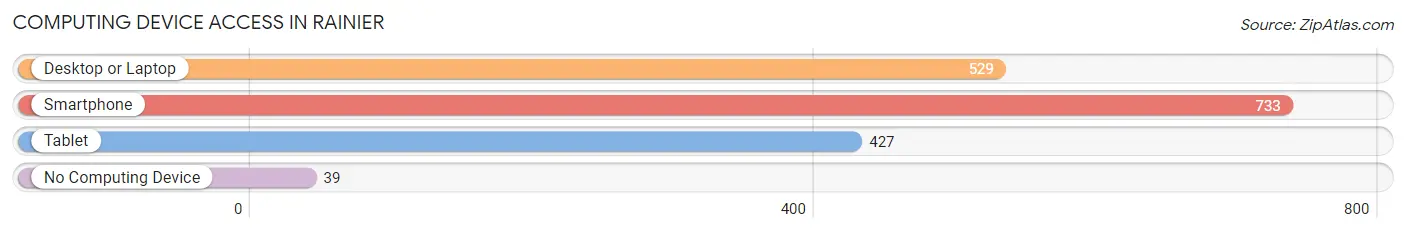
| Device Type | # Households | % Households |
| Desktop or Laptop | 529 | 65.8% |
| Smartphone | 733 | 91.2% |
| Tablet | 427 | 53.1% |
| No Computing Device | 39 | 4.9% |
| Total | 804 | 100.0% |
Internet Access in Rainier
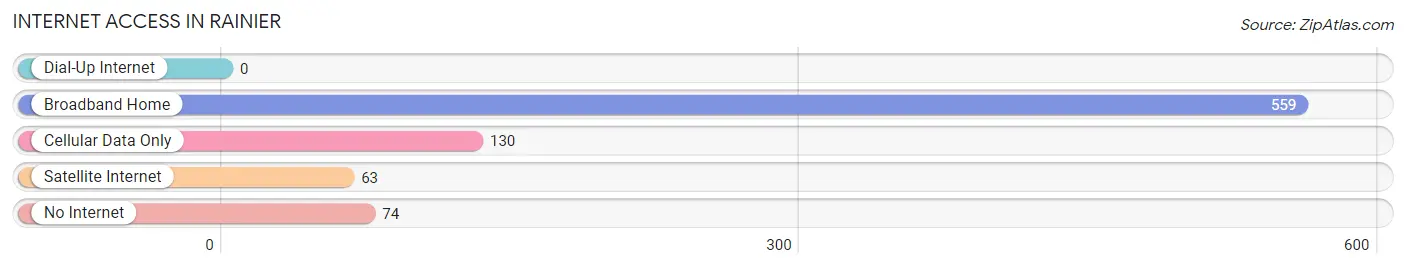
| Internet Type | # Households | % Households |
| Dial-Up Internet | 0 | 0.0% |
| Broadband Home | 559 | 69.5% |
| Cellular Data Only | 130 | 16.2% |
| Satellite Internet | 63 | 7.8% |
| No Internet | 74 | 9.2% |
| Total | 804 | 100.0% |
Rainier Summary
Rainier, Oregon is a small city located in Columbia County, Oregon, United States. It is situated on the banks of the Columbia River, approximately 25 miles north of Portland. The city has a population of approximately 3,000 people and is part of the Portland-Vancouver-Hillsboro Metropolitan Statistical Area.
History
Rainier was founded in 1851 by settlers from the Oregon Trail. The city was named after the nearby Mount Rainier, which was named after the British explorer George Vancouver. The city was originally a trading post and was known as "Rainier City" until 1891 when it was officially incorporated as the City of Rainier.
The city was an important port for the Columbia River, and was the site of the first bridge across the river. The bridge was built in 1883 and was the first bridge to span the entire width of the river.
The city was also the site of the first hydroelectric power plant in the Pacific Northwest. The plant was built in 1895 and provided power to the city until it was decommissioned in the 1950s.
Geography
Rainier is located in the Columbia River Gorge, a region of the Pacific Northwest known for its dramatic scenery and abundant wildlife. The city is situated on the banks of the Columbia River, approximately 25 miles north of Portland. The city is surrounded by rolling hills and lush forests, and is home to several parks and recreational areas.
The climate in Rainier is mild and temperate, with warm summers and cool winters. The average annual temperature is around 50 degrees Fahrenheit, and the average annual precipitation is around 40 inches.
Economy
Rainier's economy is largely based on agriculture and tourism. The city is home to several farms and ranches, and is a popular destination for outdoor recreation. The city is also home to several small businesses, including restaurants, retail stores, and service providers.
Demographics
As of the 2010 census, the population of Rainier was 3,037. The racial makeup of the city was 91.3% White, 0.7% African American, 0.7% Native American, 0.7% Asian, 0.2% Pacific Islander, and 5.9% from other races. The median household income was $41,944, and the median family income was $50,944.
Conclusion
Rainier, Oregon is a small city located in Columbia County, Oregon, United States. It is situated on the banks of the Columbia River, approximately 25 miles north of Portland. The city has a population of approximately 3,000 people and is part of the Portland-Vancouver-Hillsboro Metropolitan Statistical Area. The city has a long history, and is known for its scenic beauty and abundant wildlife. The economy of Rainier is largely based on agriculture and tourism, and the city is home to several small businesses. The population of Rainier is diverse, with a majority of the population being White.
Common Questions
What is Per Capita Income in Rainier?
Per Capita income in Rainier is $29,692.
What is the Median Family Income in Rainier?
Median Family Income in Rainier is $59,931.
What is the Median Household income in Rainier?
Median Household Income in Rainier is $58,333.
What is Income or Wage Gap in Rainier?
Income or Wage Gap in Rainier is 54.5%.
Women in Rainier earn 45.5 cents for every dollar earned by a man.
What is Inequality or Gini Index in Rainier?
Inequality or Gini Index in Rainier is 0.45.
What is the Total Population of Rainier?
Total Population of Rainier is 2,010.
What is the Total Male Population of Rainier?
Total Male Population of Rainier is 987.
What is the Total Female Population of Rainier?
Total Female Population of Rainier is 1,023.
What is the Ratio of Males per 100 Females in Rainier?
There are 96.48 Males per 100 Females in Rainier.
What is the Ratio of Females per 100 Males in Rainier?
There are 103.65 Females per 100 Males in Rainier.
What is the Median Population Age in Rainier?
Median Population Age in Rainier is 34.1 Years.
What is the Average Family Size in Rainier
Average Family Size in Rainier is 3.3 People.
What is the Average Household Size in Rainier
Average Household Size in Rainier is 2.5 People.
How Large is the Labor Force in Rainier?
There are 735 People in the Labor Forcein in Rainier.
What is the Percentage of People in the Labor Force in Rainier?
51.3% of People are in the Labor Force in Rainier.