West Linn, OR Map & Demographics
West Linn Map
West Linn Overview
$64,714
PER CAPITA INCOME
$159,344
AVG FAMILY INCOME
$134,116
AVG HOUSEHOLD INCOME
47.7%
WAGE / INCOME GAP [ % ]
52.3¢/ $1
WAGE / INCOME GAP [ $ ]
$14,731
FAMILY INCOME DEFICIT
0.46
INEQUALITY / GINI INDEX
27,167
TOTAL POPULATION
13,526
MALE POPULATION
13,641
FEMALE POPULATION
99.16
MALES / 100 FEMALES
100.85
FEMALES / 100 MALES
44.2
MEDIAN AGE
3.1
AVG FAMILY SIZE
2.7
AVG HOUSEHOLD SIZE
12,767
LABOR FORCE [ PEOPLE ]
60.0%
PERCENT IN LABOR FORCE
4.7%
UNEMPLOYMENT RATE
West Linn Zip Codes
Income in West Linn
Income Overview in West Linn
Per Capita Income in West Linn is $64,714, while median incomes of families and households are $159,344 and $134,116 respectively.
| Characteristic | Number | Measure |
| Per Capita Income | 27,167 | $64,714 |
| Median Family Income | 7,547 | $159,344 |
| Mean Family Income | 7,547 | $203,530 |
| Median Household Income | 10,008 | $134,116 |
| Mean Household Income | 10,008 | $174,816 |
| Income Deficit | 7,547 | $14,731 |
| Wage / Income Gap (%) | 27,167 | 47.73% |
| Wage / Income Gap ($) | 27,167 | 52.27¢ per $1 |
| Gini / Inequality Index | 27,167 | 0.46 |
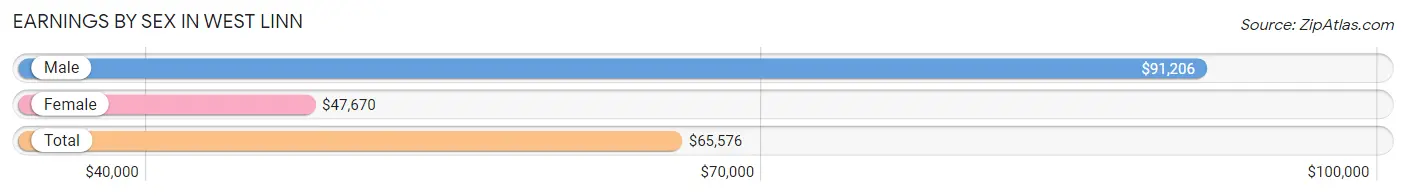
Earnings by Sex in West Linn
Average Earnings in West Linn are $65,576, $91,206 for men and $47,670 for women, a difference of 47.7%.
| Sex | Number | Average Earnings |
| Male | 7,421 (54.0%) | $91,206 |
| Female | 6,308 (46.0%) | $47,670 |
| Total | 13,729 (100.0%) | $65,576 |
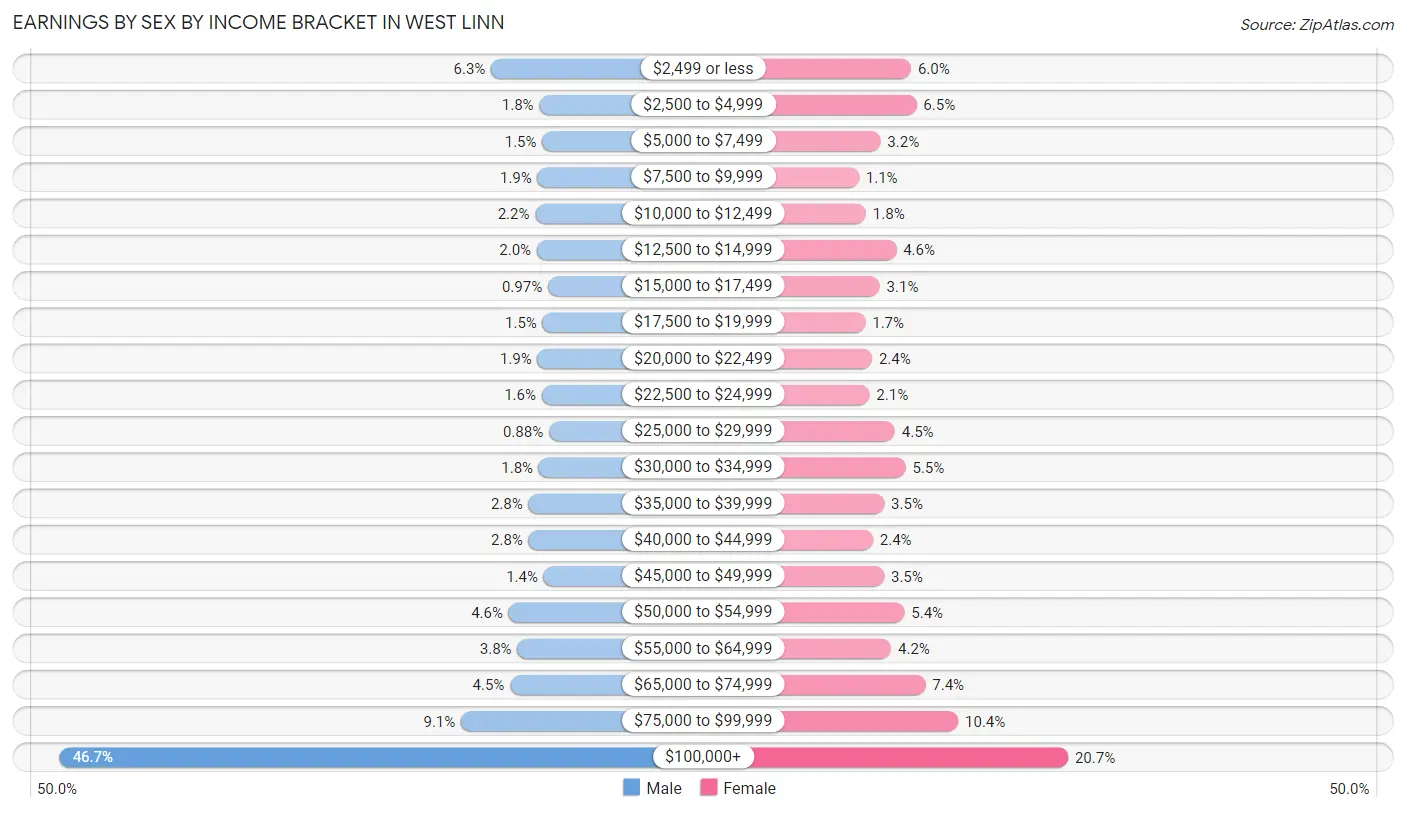
Earnings by Sex by Income Bracket in West Linn
The most common earnings brackets in West Linn are $100,000+ for men (3,466 | 46.7%) and $100,000+ for women (1,307 | 20.7%).
| Income | Male | Female |
| $2,499 or less | 467 (6.3%) | 379 (6.0%) |
| $2,500 to $4,999 | 131 (1.8%) | 411 (6.5%) |
| $5,000 to $7,499 | 111 (1.5%) | 199 (3.2%) |
| $7,500 to $9,999 | 144 (1.9%) | 71 (1.1%) |
| $10,000 to $12,499 | 160 (2.2%) | 113 (1.8%) |
| $12,500 to $14,999 | 149 (2.0%) | 292 (4.6%) |
| $15,000 to $17,499 | 72 (1.0%) | 194 (3.1%) |
| $17,500 to $19,999 | 109 (1.5%) | 109 (1.7%) |
| $20,000 to $22,499 | 144 (1.9%) | 149 (2.4%) |
| $22,500 to $24,999 | 115 (1.5%) | 134 (2.1%) |
| $25,000 to $29,999 | 65 (0.9%) | 284 (4.5%) |
| $30,000 to $34,999 | 135 (1.8%) | 347 (5.5%) |
| $35,000 to $39,999 | 207 (2.8%) | 221 (3.5%) |
| $40,000 to $44,999 | 206 (2.8%) | 154 (2.4%) |
| $45,000 to $49,999 | 101 (1.4%) | 220 (3.5%) |
| $50,000 to $54,999 | 344 (4.6%) | 340 (5.4%) |
| $55,000 to $64,999 | 284 (3.8%) | 262 (4.2%) |
| $65,000 to $74,999 | 335 (4.5%) | 464 (7.4%) |
| $75,000 to $99,999 | 676 (9.1%) | 658 (10.4%) |
| $100,000+ | 3,466 (46.7%) | 1,307 (20.7%) |
| Total | 7,421 (100.0%) | 6,308 (100.0%) |
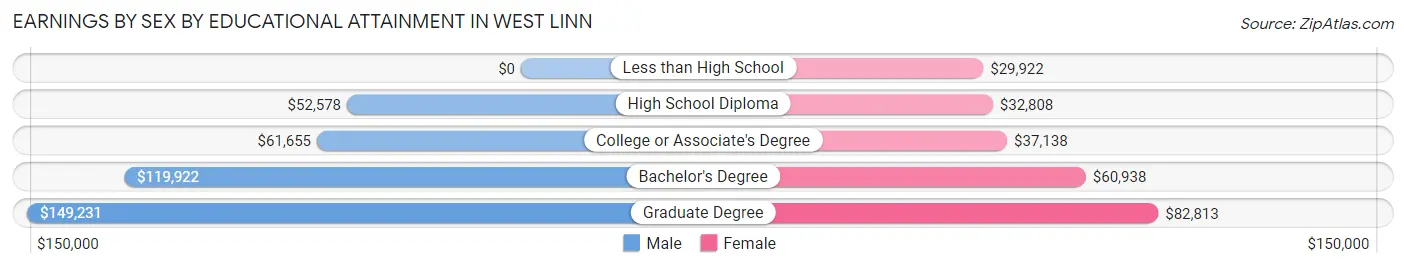
Earnings by Sex by Educational Attainment in West Linn
Average earnings in West Linn are $108,906 for men and $52,674 for women, a difference of 51.6%. Men with an educational attainment of graduate degree enjoy the highest average annual earnings of $149,231, while those with high school diploma education earn the least with $52,578. Women with an educational attainment of graduate degree earn the most with the average annual earnings of $82,813, while those with less than high school education have the smallest earnings of $29,922.
| Educational Attainment | Male Income | Female Income |
| Less than High School | - | - |
| High School Diploma | $52,578 | $32,808 |
| College or Associate's Degree | $61,655 | $37,138 |
| Bachelor's Degree | $119,922 | $60,938 |
| Graduate Degree | $149,231 | $82,813 |
| Total | $108,906 | $52,674 |
Family Income in West Linn
Family Income Brackets in West Linn
According to the West Linn family income data, there are 2,657 families falling into the $200,000+ income range, which is the most common income bracket and makes up 35.2% of all families. Conversely, the $10,000 to $14,999 income bracket is the least frequent group with only 8 families (0.1%) belonging to this category.
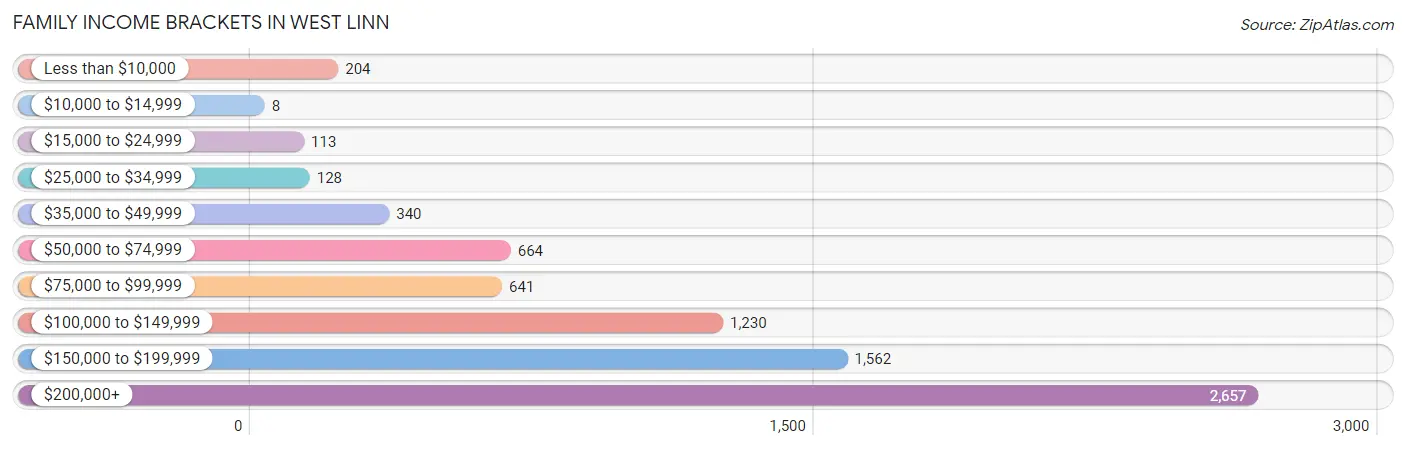
| Income Bracket | # Families | % Families |
| Less than $10,000 | 204 | 2.7% |
| $10,000 to $14,999 | 8 | 0.1% |
| $15,000 to $24,999 | 113 | 1.5% |
| $25,000 to $34,999 | 128 | 1.7% |
| $35,000 to $49,999 | 340 | 4.5% |
| $50,000 to $74,999 | 664 | 8.8% |
| $75,000 to $99,999 | 641 | 8.5% |
| $100,000 to $149,999 | 1,230 | 16.3% |
| $150,000 to $199,999 | 1,562 | 20.7% |
| $200,000+ | 2,657 | 35.2% |
Family Income by Famaliy Size in West Linn
5-person families (638 | 8.5%) account for the highest median family income in West Linn with $250,001 per family, while 2-person families (3,410 | 45.2%) have the highest median income of $64,458 per family member.
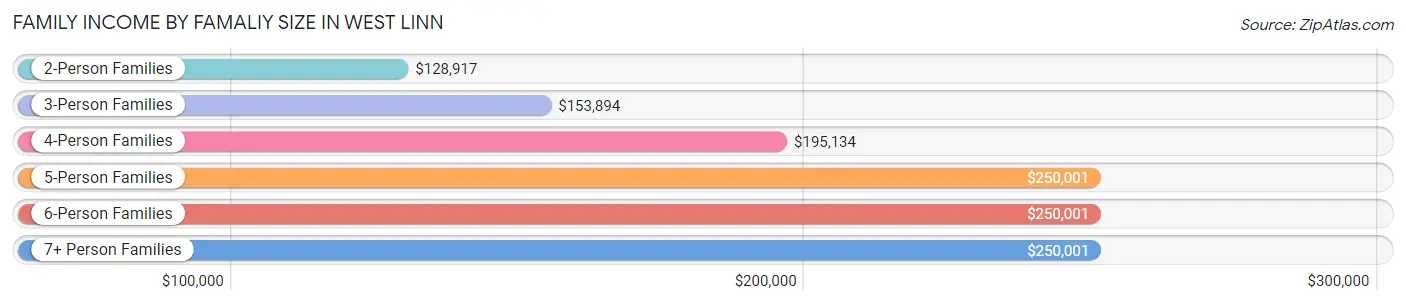
| Income Bracket | # Families | Median Income |
| 2-Person Families | 3,410 (45.2%) | $128,917 |
| 3-Person Families | 1,387 (18.4%) | $153,894 |
| 4-Person Families | 1,933 (25.6%) | $195,134 |
| 5-Person Families | 638 (8.5%) | $250,001 |
| 6-Person Families | 117 (1.5%) | $250,001 |
| 7+ Person Families | 62 (0.8%) | $250,001 |
| Total | 7,547 (100.0%) | $159,344 |
Family Income by Number of Earners in West Linn
The median family income in West Linn is $159,344, with families comprising 3+ earners (725) having the highest median family income of $205,750, while families with no earners (1,189) have the lowest median family income of $85,493, accounting for 9.6% and 15.8% of families, respectively.
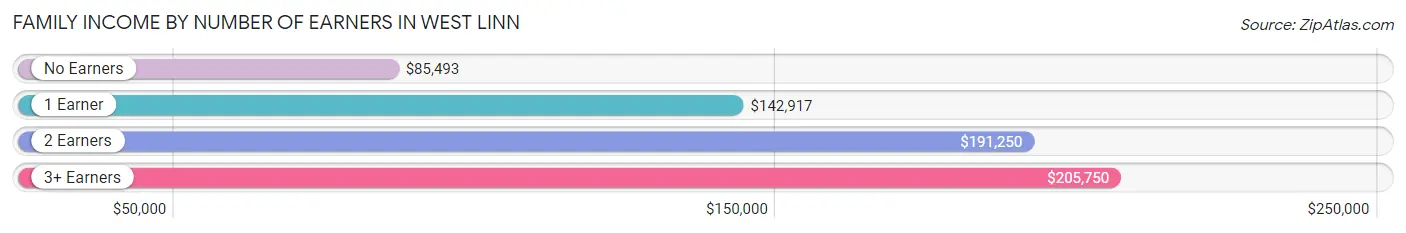
| Number of Earners | # Families | Median Income |
| No Earners | 1,189 (15.8%) | $85,493 |
| 1 Earner | 2,576 (34.1%) | $142,917 |
| 2 Earners | 3,057 (40.5%) | $191,250 |
| 3+ Earners | 725 (9.6%) | $205,750 |
| Total | 7,547 (100.0%) | $159,344 |
Household Income in West Linn
Household Income Brackets in West Linn
With 2,852 households falling in the category, the $200,000+ income range is the most frequent in West Linn, accounting for 28.5% of all households. In contrast, only 180 households (1.8%) fall into the $10,000 to $14,999 income bracket, making it the least populous group.
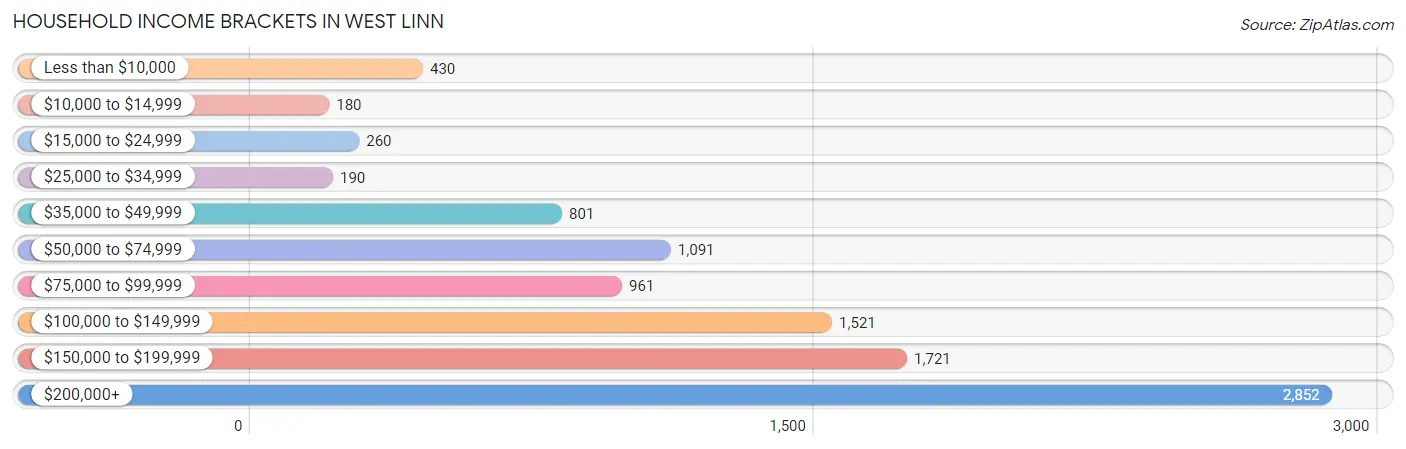
| Income Bracket | # Households | % Households |
| Less than $10,000 | 430 | 4.3% |
| $10,000 to $14,999 | 180 | 1.8% |
| $15,000 to $24,999 | 260 | 2.6% |
| $25,000 to $34,999 | 190 | 1.9% |
| $35,000 to $49,999 | 801 | 8.0% |
| $50,000 to $74,999 | 1,091 | 10.9% |
| $75,000 to $99,999 | 961 | 9.6% |
| $100,000 to $149,999 | 1,521 | 15.2% |
| $150,000 to $199,999 | 1,721 | 17.2% |
| $200,000+ | 2,852 | 28.5% |
Household Income by Householder Age in West Linn
The median household income in West Linn is $134,116, with the highest median household income of $158,147 found in the 25 to 44 years age bracket for the primary householder. A total of 2,557 households (25.6%) fall into this category. Meanwhile, the 15 to 24 years age bracket for the primary householder has the lowest median household income of $0, with 87 households (0.9%) in this group.
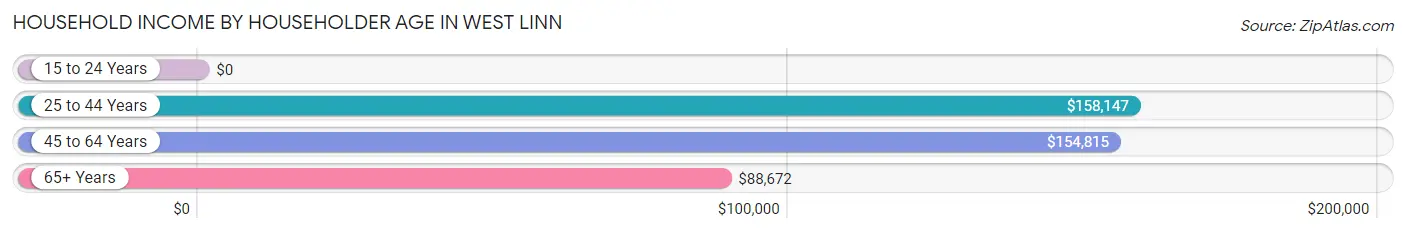
| Income Bracket | # Households | Median Income |
| 15 to 24 Years | 87 (0.9%) | $0 |
| 25 to 44 Years | 2,557 (25.6%) | $158,147 |
| 45 to 64 Years | 4,571 (45.7%) | $154,815 |
| 65+ Years | 2,793 (27.9%) | $88,672 |
| Total | 10,008 (100.0%) | $134,116 |
Poverty in West Linn
Income Below Poverty by Sex and Age in West Linn
With 5.4% poverty level for males and 5.7% for females among the residents of West Linn, 18 to 24 year old males and 75 year old and over females are the most vulnerable to poverty, with 179 males (19.9%) and 143 females (12.4%) in their respective age groups living below the poverty level.
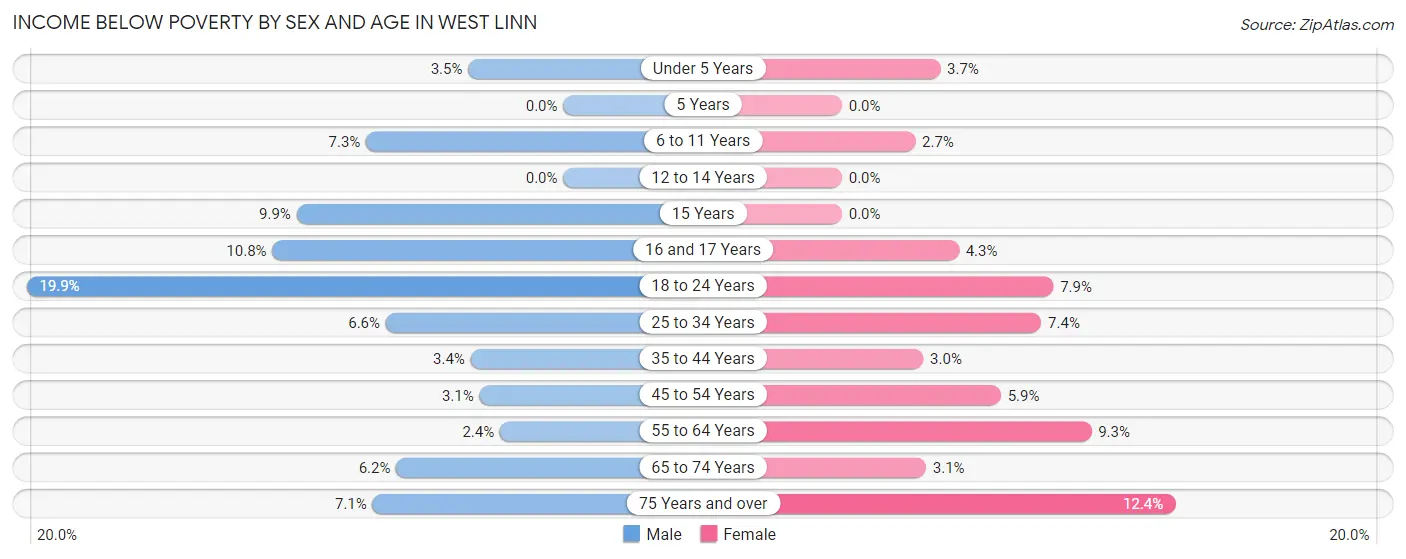
| Age Bracket | Male | Female |
| Under 5 Years | 22 (3.5%) | 26 (3.6%) |
| 5 Years | 0 (0.0%) | 0 (0.0%) |
| 6 to 11 Years | 102 (7.3%) | 24 (2.7%) |
| 12 to 14 Years | 0 (0.0%) | 0 (0.0%) |
| 15 Years | 10 (9.9%) | 0 (0.0%) |
| 16 and 17 Years | 47 (10.8%) | 20 (4.3%) |
| 18 to 24 Years | 179 (19.9%) | 61 (7.9%) |
| 25 to 34 Years | 68 (6.6%) | 60 (7.4%) |
| 35 to 44 Years | 56 (3.4%) | 58 (3.0%) |
| 45 to 54 Years | 62 (3.1%) | 114 (5.9%) |
| 55 to 64 Years | 50 (2.4%) | 210 (9.3%) |
| 65 to 74 Years | 81 (6.2%) | 50 (3.1%) |
| 75 Years and over | 58 (7.1%) | 143 (12.4%) |
| Total | 735 (5.4%) | 766 (5.7%) |
Income Above Poverty by Sex and Age in West Linn
According to the poverty statistics in West Linn, males aged 5 years and females aged 5 years are the age groups that are most secure financially, with 100.0% of males and 100.0% of females in these age groups living above the poverty line.
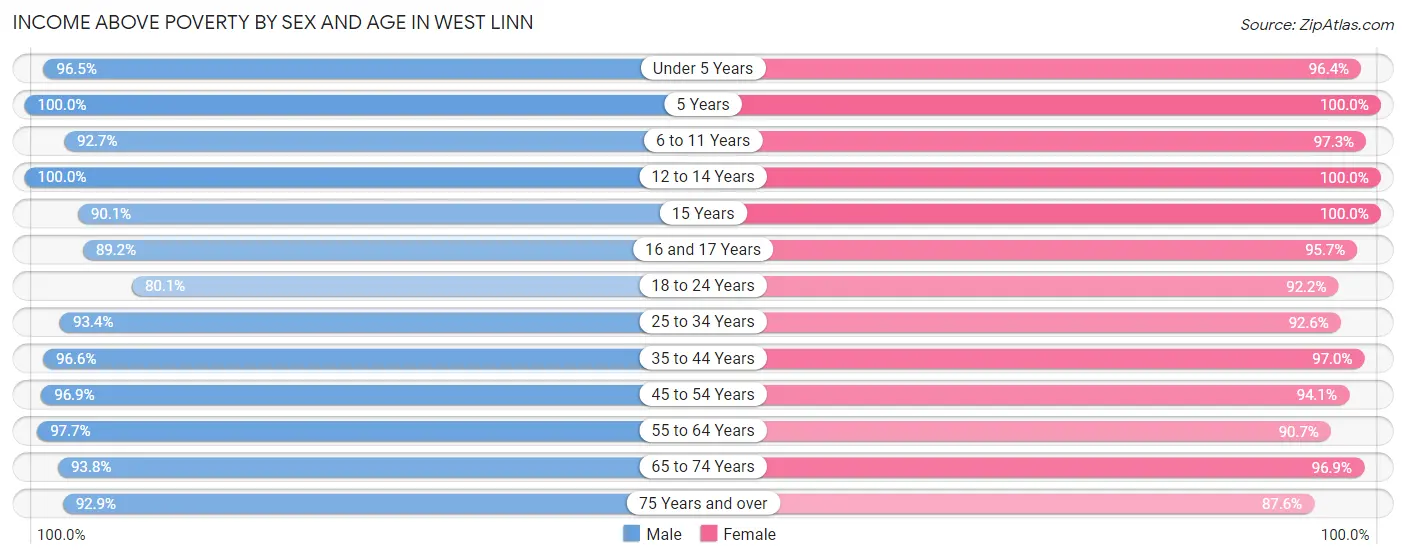
| Age Bracket | Male | Female |
| Under 5 Years | 602 (96.5%) | 687 (96.4%) |
| 5 Years | 262 (100.0%) | 94 (100.0%) |
| 6 to 11 Years | 1,291 (92.7%) | 859 (97.3%) |
| 12 to 14 Years | 879 (100.0%) | 665 (100.0%) |
| 15 Years | 91 (90.1%) | 239 (100.0%) |
| 16 and 17 Years | 388 (89.2%) | 441 (95.7%) |
| 18 to 24 Years | 719 (80.1%) | 716 (92.1%) |
| 25 to 34 Years | 964 (93.4%) | 751 (92.6%) |
| 35 to 44 Years | 1,571 (96.6%) | 1,860 (97.0%) |
| 45 to 54 Years | 1,930 (96.9%) | 1,819 (94.1%) |
| 55 to 64 Years | 2,074 (97.7%) | 2,057 (90.7%) |
| 65 to 74 Years | 1,225 (93.8%) | 1,552 (96.9%) |
| 75 Years and over | 761 (92.9%) | 1,013 (87.6%) |
| Total | 12,757 (94.6%) | 12,753 (94.3%) |
Income Below Poverty Among Married-Couple Families in West Linn
The poverty statistics for married-couple families in West Linn show that 2.0% or 131 of the total 6,493 families live below the poverty line. Families with 3 or 4 children have the highest poverty rate of 4.1%, comprising of 25 families. On the other hand, families with 5 or more children have the lowest poverty rate of 0.0%, which includes 0 families.
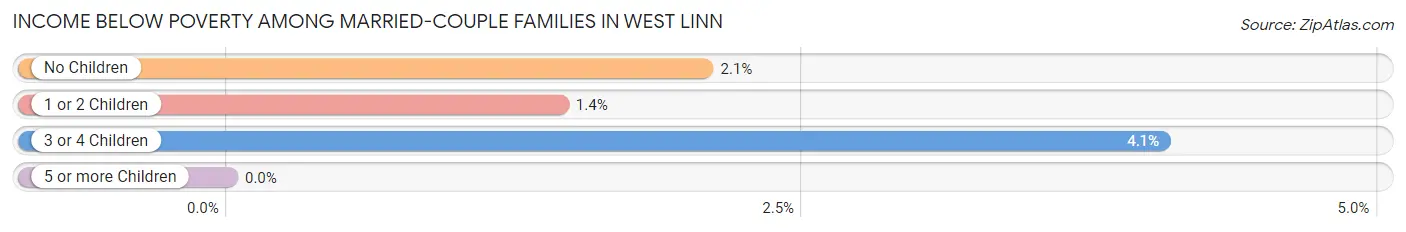
| Children | Above Poverty | Below Poverty |
| No Children | 3,360 (97.9%) | 71 (2.1%) |
| 1 or 2 Children | 2,398 (98.6%) | 35 (1.4%) |
| 3 or 4 Children | 591 (95.9%) | 25 (4.1%) |
| 5 or more Children | 13 (100.0%) | 0 (0.0%) |
| Total | 6,362 (98.0%) | 131 (2.0%) |
Income Below Poverty Among Single-Parent Households in West Linn
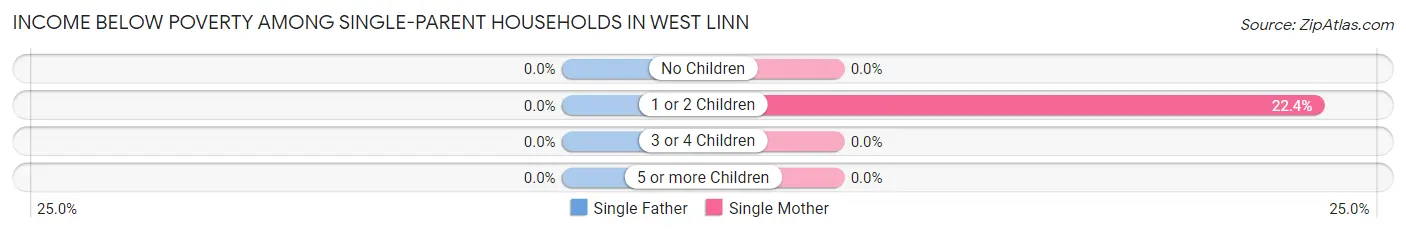
| Children | Single Father | Single Mother |
| No Children | 0 (0.0%) | 0 (0.0%) |
| 1 or 2 Children | 0 (0.0%) | 115 (22.4%) |
| 3 or 4 Children | 0 (0.0%) | 0 (0.0%) |
| 5 or more Children | 0 (0.0%) | 0 (0.0%) |
| Total | 0 (0.0%) | 115 (12.9%) |
Income Below Poverty Among Married-Couple vs Single-Parent Households in West Linn
The poverty data for West Linn shows that 131 of the married-couple family households (2.0%) and 115 of the single-parent households (10.9%) are living below the poverty level. Within the married-couple family households, those with 3 or 4 children have the highest poverty rate, with 25 households (4.1%) falling below the poverty line. Among the single-parent households, those with 1 or 2 children have the highest poverty rate, with 115 household (20.8%) living below poverty.
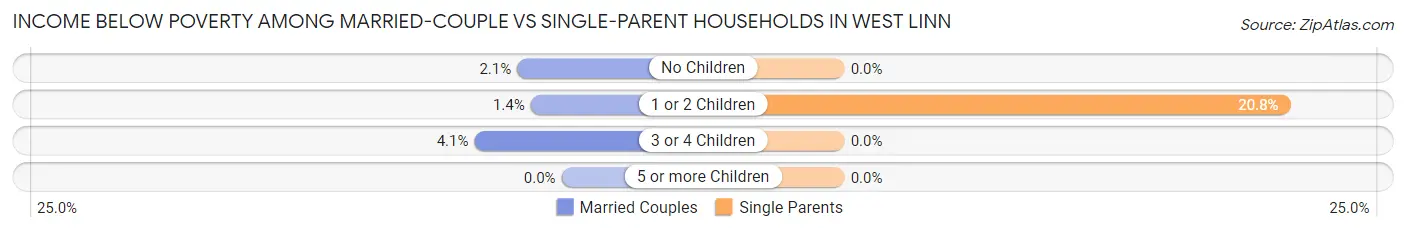
| Children | Married-Couple Families | Single-Parent Households |
| No Children | 71 (2.1%) | 0 (0.0%) |
| 1 or 2 Children | 35 (1.4%) | 115 (20.8%) |
| 3 or 4 Children | 25 (4.1%) | 0 (0.0%) |
| 5 or more Children | 0 (0.0%) | 0 (0.0%) |
| Total | 131 (2.0%) | 115 (10.9%) |
Race in West Linn
The most populous races in West Linn are White / Caucasian (23,008 | 84.7%), Hispanic or Latino (2,140 | 7.9%), and Two or more Races (1,978 | 7.3%).
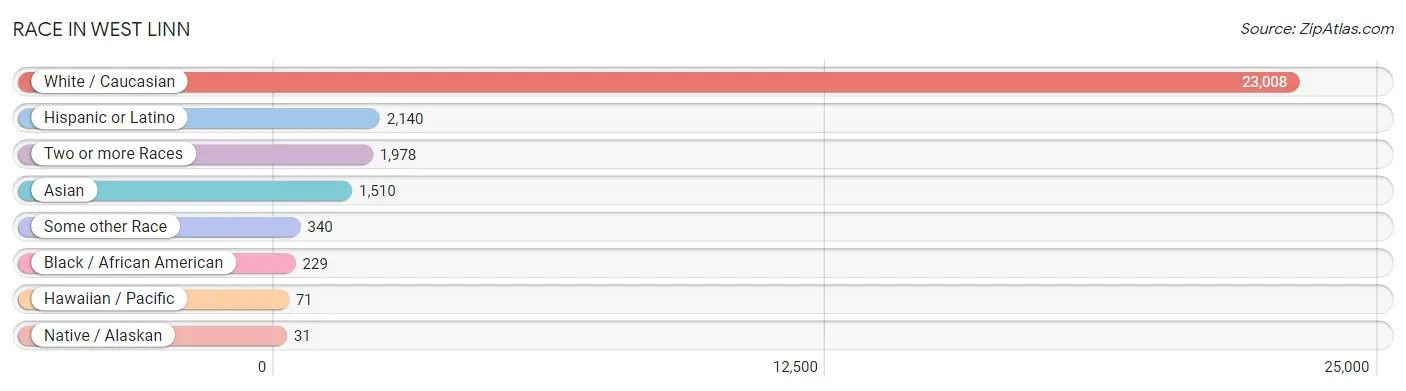
| Race | # Population | % Population |
| Asian | 1,510 | 5.6% |
| Black / African American | 229 | 0.8% |
| Hawaiian / Pacific | 71 | 0.3% |
| Hispanic or Latino | 2,140 | 7.9% |
| Native / Alaskan | 31 | 0.1% |
| White / Caucasian | 23,008 | 84.7% |
| Two or more Races | 1,978 | 7.3% |
| Some other Race | 340 | 1.3% |
| Total | 27,167 | 100.0% |
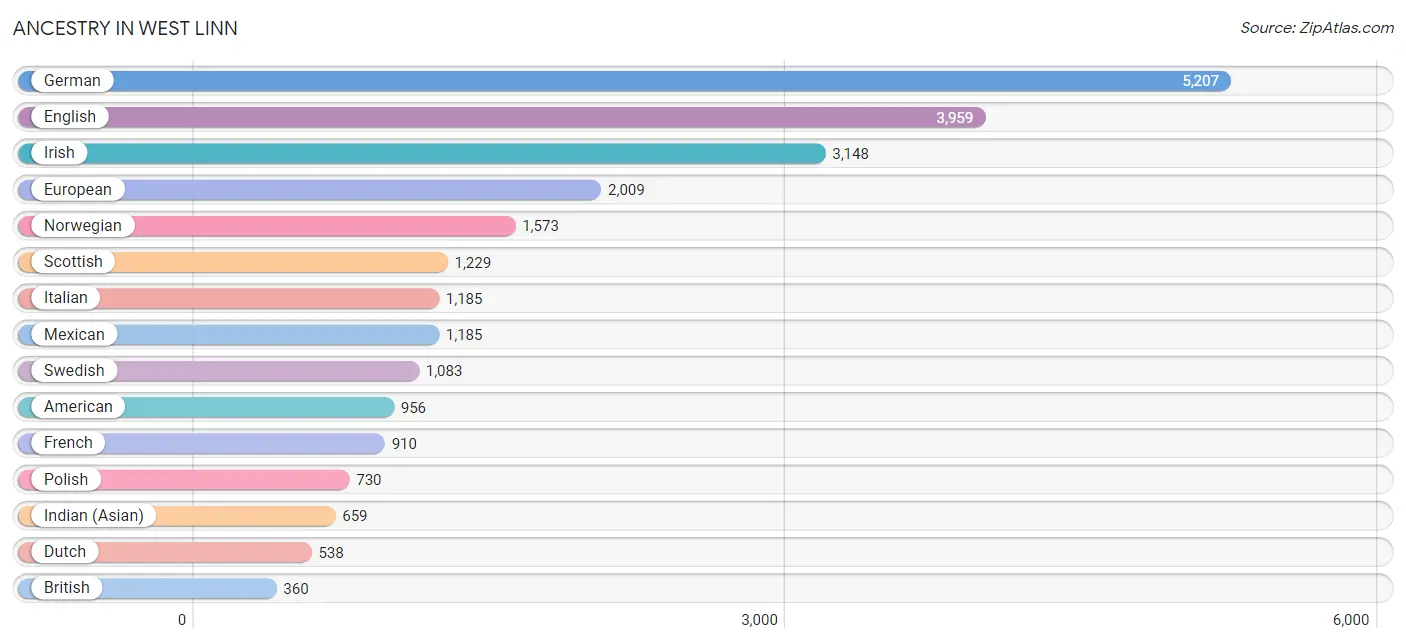
Ancestry in West Linn
The most populous ancestries reported in West Linn are German (5,207 | 19.2%), English (3,959 | 14.6%), Irish (3,148 | 11.6%), European (2,009 | 7.4%), and Norwegian (1,573 | 5.8%), together accounting for 58.5% of all West Linn residents.
| Ancestry | # Population | % Population |
| African | 4 | 0.0% |
| American | 956 | 3.5% |
| Apache | 41 | 0.2% |
| Arab | 115 | 0.4% |
| Austrian | 163 | 0.6% |
| Barbadian | 48 | 0.2% |
| Belgian | 101 | 0.4% |
| Bhutanese | 163 | 0.6% |
| British | 360 | 1.3% |
| Bulgarian | 99 | 0.4% |
| Burmese | 321 | 1.2% |
| Canadian | 84 | 0.3% |
| Central American | 158 | 0.6% |
| Cherokee | 90 | 0.3% |
| Chilean | 107 | 0.4% |
| Colombian | 24 | 0.1% |
| Croatian | 52 | 0.2% |
| Cuban | 196 | 0.7% |
| Cypriot | 19 | 0.1% |
| Czech | 141 | 0.5% |
| Czechoslovakian | 14 | 0.1% |
| Danish | 255 | 0.9% |
| Delaware | 20 | 0.1% |
| Dutch | 538 | 2.0% |
| Eastern European | 25 | 0.1% |
| Ecuadorian | 57 | 0.2% |
| English | 3,959 | 14.6% |
| Estonian | 9 | 0.0% |
| European | 2,009 | 7.4% |
| Filipino | 58 | 0.2% |
| Finnish | 48 | 0.2% |
| French | 910 | 3.4% |
| French American Indian | 24 | 0.1% |
| French Canadian | 178 | 0.7% |
| German | 5,207 | 19.2% |
| Greek | 145 | 0.5% |
| Guamanian / Chamorro | 36 | 0.1% |
| Guatemalan | 16 | 0.1% |
| Hungarian | 186 | 0.7% |
| Indian (Asian) | 659 | 2.4% |
| Iranian | 139 | 0.5% |
| Irish | 3,148 | 11.6% |
| Italian | 1,185 | 4.4% |
| Japanese | 44 | 0.2% |
| Kenyan | 16 | 0.1% |
| Korean | 251 | 0.9% |
| Latvian | 22 | 0.1% |
| Lebanese | 47 | 0.2% |
| Lithuanian | 77 | 0.3% |
| Malaysian | 185 | 0.7% |
| Mexican | 1,185 | 4.4% |
| Native Hawaiian | 22 | 0.1% |
| Navajo | 38 | 0.1% |
| Northern European | 249 | 0.9% |
| Norwegian | 1,573 | 5.8% |
| Paiute | 7 | 0.0% |
| Pakistani | 121 | 0.4% |
| Palestinian | 10 | 0.0% |
| Peruvian | 10 | 0.0% |
| Polish | 730 | 2.7% |
| Portuguese | 175 | 0.6% |
| Puerto Rican | 57 | 0.2% |
| Romanian | 92 | 0.3% |
| Russian | 317 | 1.2% |
| Salvadoran | 99 | 0.4% |
| Scandinavian | 213 | 0.8% |
| Scotch-Irish | 323 | 1.2% |
| Scottish | 1,229 | 4.5% |
| Serbian | 61 | 0.2% |
| Slavic | 16 | 0.1% |
| Slovak | 82 | 0.3% |
| Slovene | 42 | 0.2% |
| South African | 64 | 0.2% |
| South American | 198 | 0.7% |
| Spaniard | 28 | 0.1% |
| Spanish | 172 | 0.6% |
| Sri Lankan | 225 | 0.8% |
| Subsaharan African | 98 | 0.4% |
| Swedish | 1,083 | 4.0% |
| Swiss | 172 | 0.6% |
| Syrian | 58 | 0.2% |
| Thai | 88 | 0.3% |
| Ukrainian | 78 | 0.3% |
| Welsh | 181 | 0.7% |
| Yugoslavian | 40 | 0.2% |
| Zimbabwean | 14 | 0.1% | View All 86 Rows |
Immigrants in West Linn
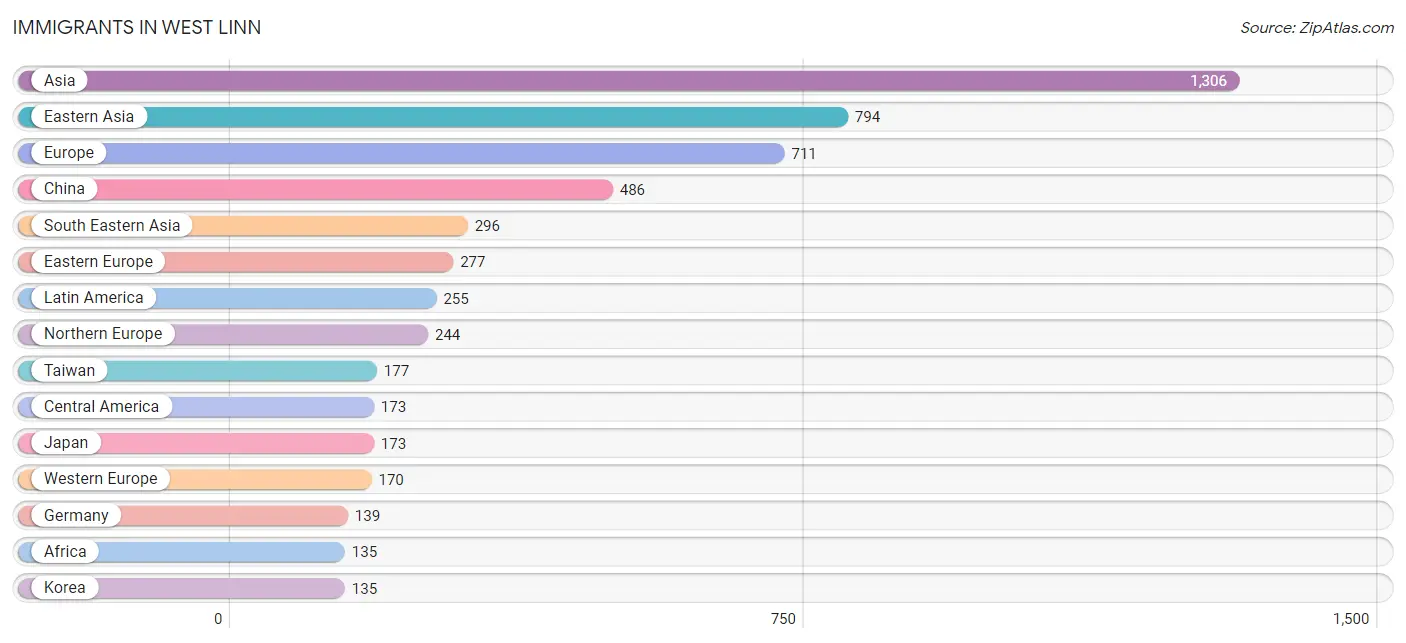
The most numerous immigrant groups reported in West Linn came from Asia (1,306 | 4.8%), Eastern Asia (794 | 2.9%), Europe (711 | 2.6%), China (486 | 1.8%), and South Eastern Asia (296 | 1.1%), together accounting for 13.2% of all West Linn residents.
| Immigration Origin | # Population | % Population |
| Africa | 135 | 0.5% |
| Asia | 1,306 | 4.8% |
| Australia | 11 | 0.0% |
| Barbados | 23 | 0.1% |
| Bosnia and Herzegovina | 18 | 0.1% |
| Bulgaria | 84 | 0.3% |
| Cambodia | 25 | 0.1% |
| Canada | 98 | 0.4% |
| Caribbean | 23 | 0.1% |
| Central America | 173 | 0.6% |
| Chile | 35 | 0.1% |
| China | 486 | 1.8% |
| Czechoslovakia | 21 | 0.1% |
| Denmark | 69 | 0.3% |
| Eastern Africa | 30 | 0.1% |
| Eastern Asia | 794 | 2.9% |
| Eastern Europe | 277 | 1.0% |
| Ecuador | 19 | 0.1% |
| Egypt | 10 | 0.0% |
| El Salvador | 33 | 0.1% |
| England | 35 | 0.1% |
| Europe | 711 | 2.6% |
| Fiji | 35 | 0.1% |
| France | 19 | 0.1% |
| Germany | 139 | 0.5% |
| Guatemala | 16 | 0.1% |
| Hong Kong | 42 | 0.2% |
| Hungary | 17 | 0.1% |
| India | 11 | 0.0% |
| Iran | 44 | 0.2% |
| Iraq | 39 | 0.1% |
| Japan | 173 | 0.6% |
| Kenya | 16 | 0.1% |
| Korea | 135 | 0.5% |
| Laos | 119 | 0.4% |
| Latin America | 255 | 0.9% |
| Lithuania | 19 | 0.1% |
| Mexico | 124 | 0.5% |
| Nepal | 45 | 0.2% |
| Netherlands | 12 | 0.0% |
| Northern Africa | 10 | 0.0% |
| Northern Europe | 244 | 0.9% |
| Oceania | 46 | 0.2% |
| Peru | 5 | 0.0% |
| Philippines | 19 | 0.1% |
| Portugal | 20 | 0.1% |
| Romania | 41 | 0.2% |
| Russia | 40 | 0.2% |
| Scotland | 9 | 0.0% |
| Serbia | 22 | 0.1% |
| South Africa | 95 | 0.4% |
| South America | 59 | 0.2% |
| South Central Asia | 100 | 0.4% |
| South Eastern Asia | 296 | 1.1% |
| Southern Europe | 20 | 0.1% |
| Sweden | 9 | 0.0% |
| Syria | 58 | 0.2% |
| Taiwan | 177 | 0.6% |
| Thailand | 55 | 0.2% |
| Ukraine | 15 | 0.1% |
| Vietnam | 78 | 0.3% |
| Western Asia | 116 | 0.4% |
| Western Europe | 170 | 0.6% |
| Zimbabwe | 14 | 0.1% | View All 64 Rows |
Sex and Age in West Linn
Sex and Age in West Linn
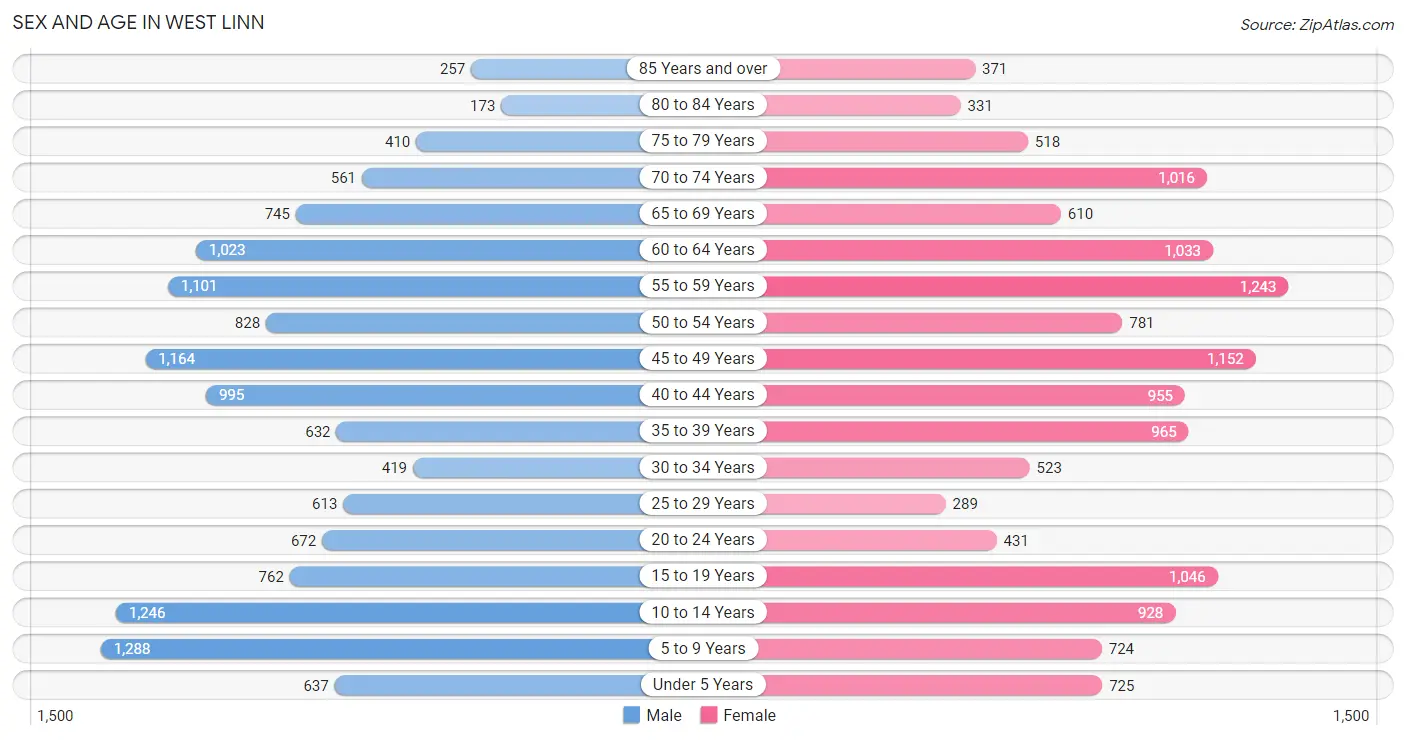
The most populous age groups in West Linn are 5 to 9 Years (1,288 | 9.5%) for men and 55 to 59 Years (1,243 | 9.1%) for women.
| Age Bracket | Male | Female |
| Under 5 Years | 637 (4.7%) | 725 (5.3%) |
| 5 to 9 Years | 1,288 (9.5%) | 724 (5.3%) |
| 10 to 14 Years | 1,246 (9.2%) | 928 (6.8%) |
| 15 to 19 Years | 762 (5.6%) | 1,046 (7.7%) |
| 20 to 24 Years | 672 (5.0%) | 431 (3.2%) |
| 25 to 29 Years | 613 (4.5%) | 289 (2.1%) |
| 30 to 34 Years | 419 (3.1%) | 523 (3.8%) |
| 35 to 39 Years | 632 (4.7%) | 965 (7.1%) |
| 40 to 44 Years | 995 (7.4%) | 955 (7.0%) |
| 45 to 49 Years | 1,164 (8.6%) | 1,152 (8.5%) |
| 50 to 54 Years | 828 (6.1%) | 781 (5.7%) |
| 55 to 59 Years | 1,101 (8.1%) | 1,243 (9.1%) |
| 60 to 64 Years | 1,023 (7.6%) | 1,033 (7.6%) |
| 65 to 69 Years | 745 (5.5%) | 610 (4.5%) |
| 70 to 74 Years | 561 (4.2%) | 1,016 (7.4%) |
| 75 to 79 Years | 410 (3.0%) | 518 (3.8%) |
| 80 to 84 Years | 173 (1.3%) | 331 (2.4%) |
| 85 Years and over | 257 (1.9%) | 371 (2.7%) |
| Total | 13,526 (100.0%) | 13,641 (100.0%) |
Families and Households in West Linn
Median Family Size in West Linn
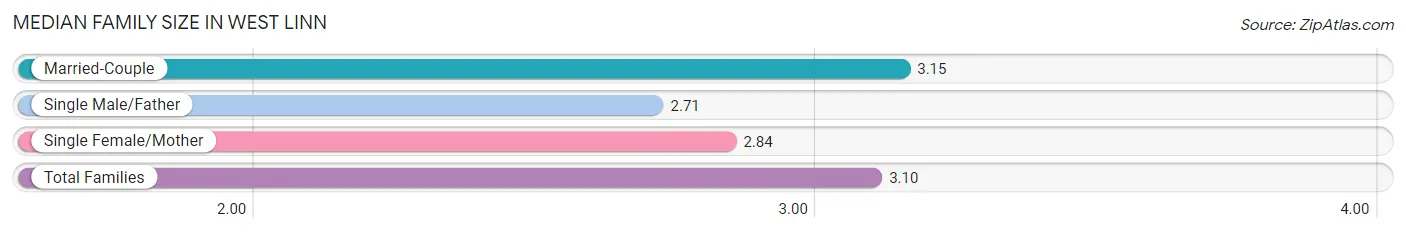
The median family size in West Linn is 3.10 persons per family, with married-couple families (6,493 | 86.0%) accounting for the largest median family size of 3.15 persons per family. On the other hand, single male/father families (161 | 2.1%) represent the smallest median family size with 2.71 persons per family.
| Family Type | # Families | Family Size |
| Married-Couple | 6,493 (86.0%) | 3.15 |
| Single Male/Father | 161 (2.1%) | 2.71 |
| Single Female/Mother | 893 (11.8%) | 2.84 |
| Total Families | 7,547 (100.0%) | 3.10 |
Median Household Size in West Linn
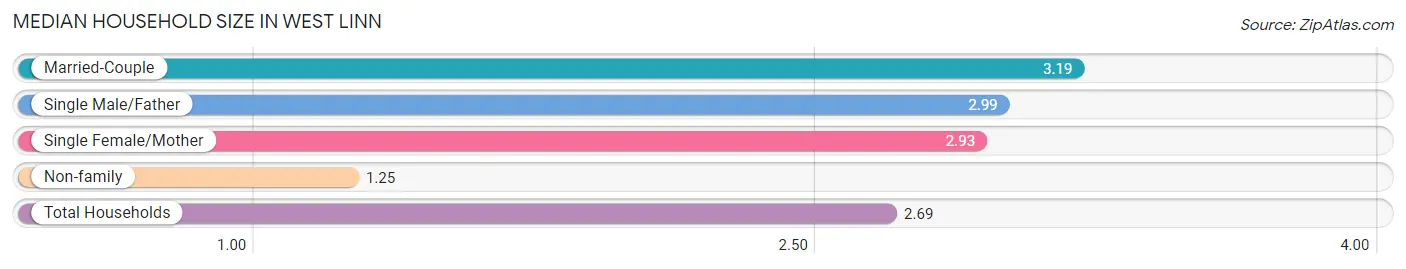
The median household size in West Linn is 2.69 persons per household, with married-couple households (6,493 | 64.9%) accounting for the largest median household size of 3.19 persons per household. non-family households (2,461 | 24.6%) represent the smallest median household size with 1.25 persons per household.
| Household Type | # Households | Household Size |
| Married-Couple | 6,493 (64.9%) | 3.19 |
| Single Male/Father | 161 (1.6%) | 2.99 |
| Single Female/Mother | 893 (8.9%) | 2.93 |
| Non-family | 2,461 (24.6%) | 1.25 |
| Total Households | 10,008 (100.0%) | 2.69 |
Household Size by Marriage Status in West Linn
Out of a total of 10,008 households in West Linn, 7,547 (75.4%) are family households, while 2,461 (24.6%) are nonfamily households. The most numerous type of family households are 2-person households, comprising 3,260, and the most common type of nonfamily households are 1-person households, comprising 1,970.
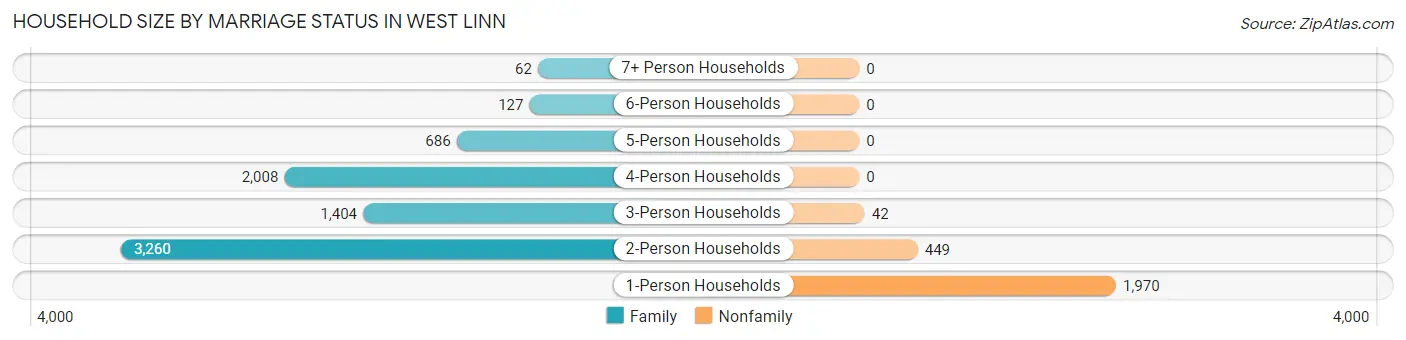
| Household Size | Family Households | Nonfamily Households |
| 1-Person Households | - | 1,970 (19.7%) |
| 2-Person Households | 3,260 (32.6%) | 449 (4.5%) |
| 3-Person Households | 1,404 (14.0%) | 42 (0.4%) |
| 4-Person Households | 2,008 (20.1%) | 0 (0.0%) |
| 5-Person Households | 686 (6.9%) | 0 (0.0%) |
| 6-Person Households | 127 (1.3%) | 0 (0.0%) |
| 7+ Person Households | 62 (0.6%) | 0 (0.0%) |
| Total | 7,547 (75.4%) | 2,461 (24.6%) |
Female Fertility in West Linn
Fertility by Age in West Linn
Average fertility rate in West Linn is 45.0 births per 1,000 women. Women in the age bracket of 20 to 34 years have the highest fertility rate with 84.0 births per 1,000 women. Women in the age bracket of 35 to 50 years acount for 57.7% of all women with births.
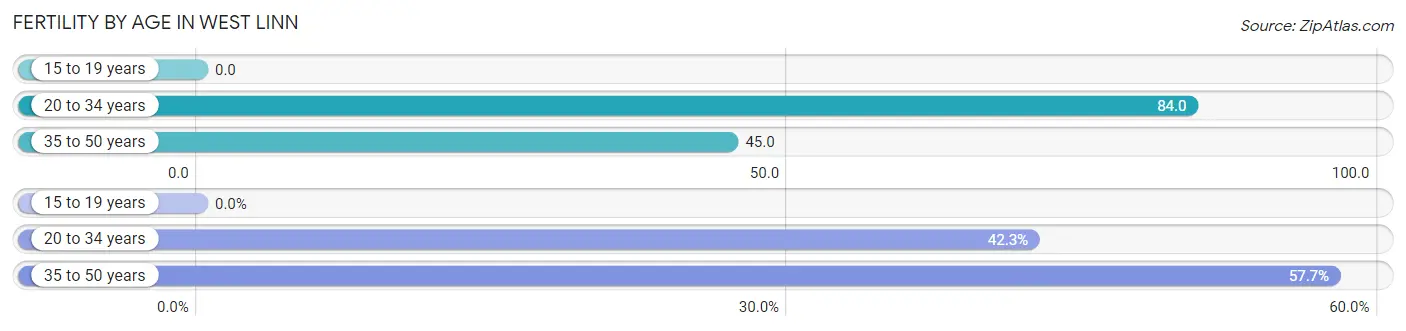
| Age Bracket | Women with Births | Births / 1,000 Women |
| 15 to 19 years | 0 (0.0%) | 0.0 |
| 20 to 34 years | 105 (42.3%) | 84.0 |
| 35 to 50 years | 143 (57.7%) | 45.0 |
| Total | 248 (100.0%) | 45.0 |
Fertility by Age by Marriage Status in West Linn
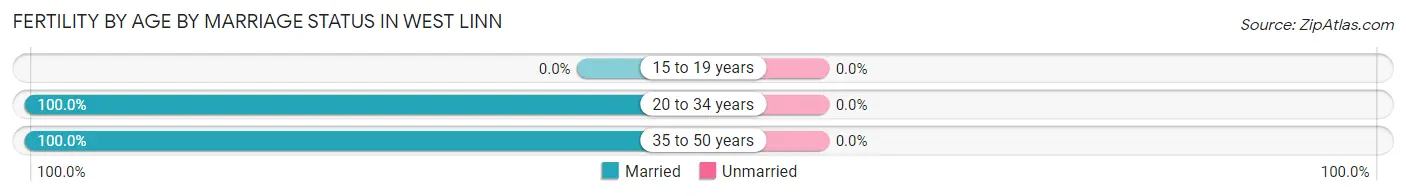
| Age Bracket | Married | Unmarried |
| 15 to 19 years | 0 (0.0%) | 0 (0.0%) |
| 20 to 34 years | 105 (100.0%) | 0 (0.0%) |
| 35 to 50 years | 143 (100.0%) | 0 (0.0%) |
| Total | 248 (100.0%) | 0 (0.0%) |
Fertility by Education in West Linn
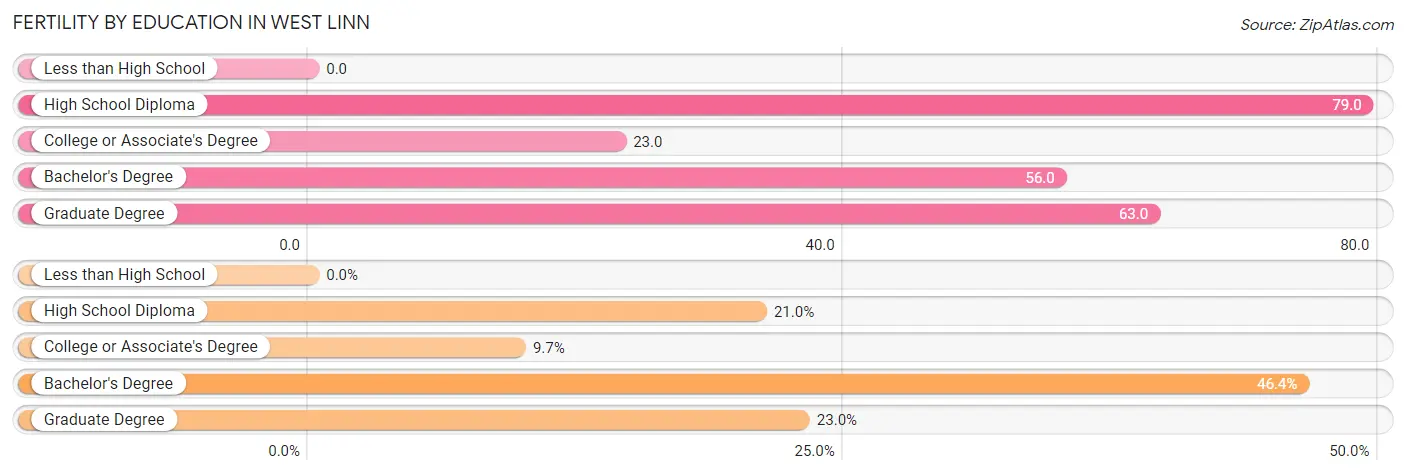
| Educational Attainment | Women with Births | Births / 1,000 Women |
| Less than High School | 0 (0.0%) | 0.0 |
| High School Diploma | 52 (21.0%) | 79.0 |
| College or Associate's Degree | 24 (9.7%) | 23.0 |
| Bachelor's Degree | 115 (46.4%) | 56.0 |
| Graduate Degree | 57 (23.0%) | 63.0 |
| Total | 248 (100.0%) | 45.0 |
Fertility by Education by Marriage Status in West Linn
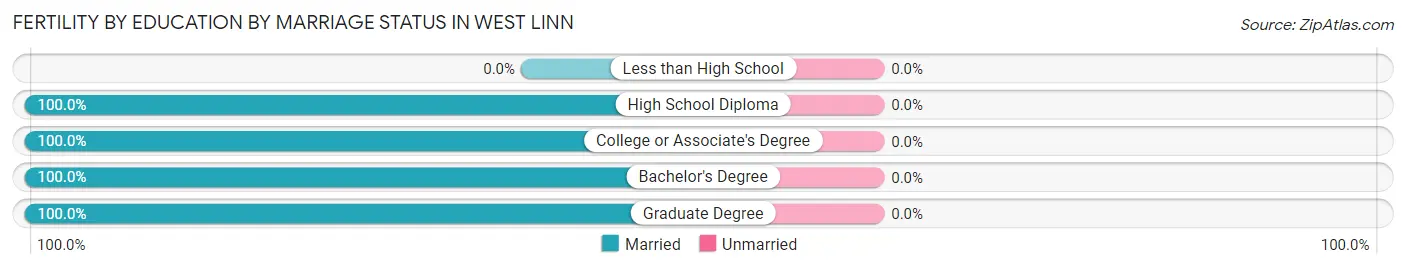
| Educational Attainment | Married | Unmarried |
| Less than High School | 0 (0.0%) | 0 (0.0%) |
| High School Diploma | 52 (100.0%) | 0 (0.0%) |
| College or Associate's Degree | 24 (100.0%) | 0 (0.0%) |
| Bachelor's Degree | 115 (100.0%) | 0 (0.0%) |
| Graduate Degree | 57 (100.0%) | 0 (0.0%) |
| Total | 248 (100.0%) | 0 (0.0%) |
Employment Characteristics in West Linn
Employment by Class of Employer in West Linn
Among the 12,014 employed individuals in West Linn, private company employees (7,494 | 62.4%), not-for-profit organizations (1,113 | 9.3%), and self-employed (not incorporated) (1,012 | 8.4%) make up the most common classes of employment.
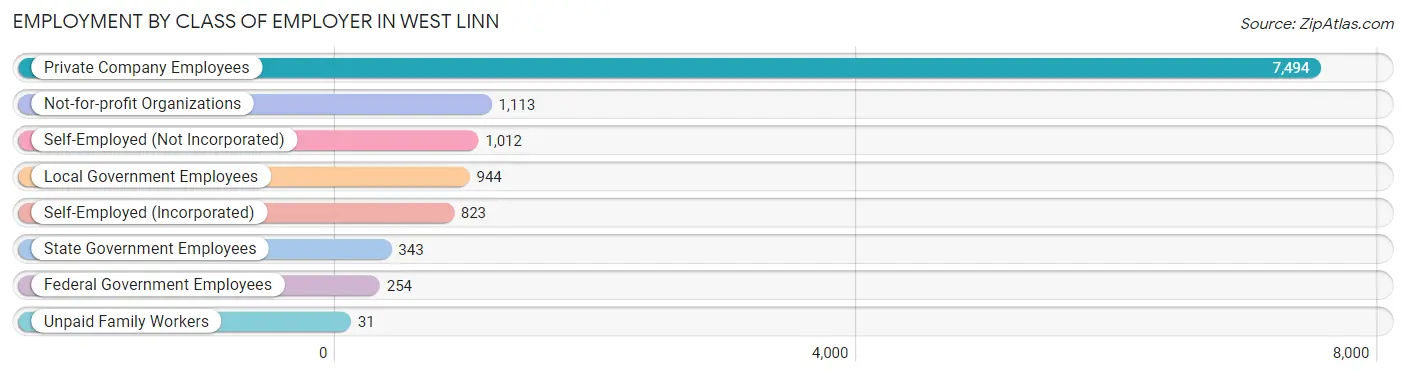
| Employer Class | # Employees | % Employees |
| Private Company Employees | 7,494 | 62.4% |
| Self-Employed (Incorporated) | 823 | 6.9% |
| Self-Employed (Not Incorporated) | 1,012 | 8.4% |
| Not-for-profit Organizations | 1,113 | 9.3% |
| Local Government Employees | 944 | 7.9% |
| State Government Employees | 343 | 2.9% |
| Federal Government Employees | 254 | 2.1% |
| Unpaid Family Workers | 31 | 0.3% |
| Total | 12,014 | 100.0% |
Employment Status by Age in West Linn
According to the labor force statistics for West Linn, out of the total population over 16 years of age (21,279), 60.0% or 12,767 individuals are in the labor force, with 4.7% or 600 of them unemployed. The age group with the highest labor force participation rate is 25 to 29 years, with 94.2% or 850 individuals in the labor force. Within the labor force, the 20 to 24 years age range has the highest percentage of unemployed individuals, with 12.1% or 95 of them being unemployed.
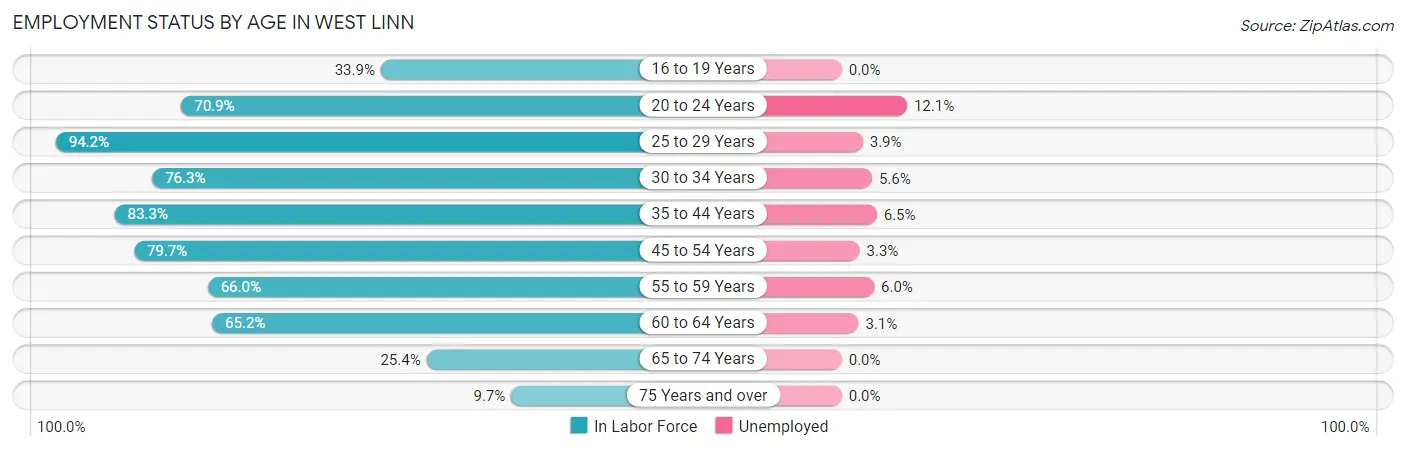
| Age Bracket | In Labor Force | Unemployed |
| 16 to 19 Years | 498 (33.9%) | 0 (0.0%) |
| 20 to 24 Years | 782 (70.9%) | 95 (12.1%) |
| 25 to 29 Years | 850 (94.2%) | 33 (3.9%) |
| 30 to 34 Years | 719 (76.3%) | 40 (5.6%) |
| 35 to 44 Years | 2,955 (83.3%) | 192 (6.5%) |
| 45 to 54 Years | 3,128 (79.7%) | 103 (3.3%) |
| 55 to 59 Years | 1,547 (66.0%) | 93 (6.0%) |
| 60 to 64 Years | 1,341 (65.2%) | 42 (3.1%) |
| 65 to 74 Years | 745 (25.4%) | 0 (0.0%) |
| 75 Years and over | 200 (9.7%) | 0 (0.0%) |
| Total | 12,767 (60.0%) | 600 (4.7%) |
Employment Status by Educational Attainment in West Linn
According to labor force statistics for West Linn, 76.9% of individuals (10,548) out of the total population between 25 and 64 years of age (13,716) are in the labor force, with 4.8% or 506 of them being unemployed. The group with the highest labor force participation rate are those with the educational attainment of bachelor's degree or higher, with 82.8% or 7,352 individuals in the labor force. Within the labor force, individuals with high school diploma education have the highest percentage of unemployment, with 11.0% or 91 of them being unemployed.
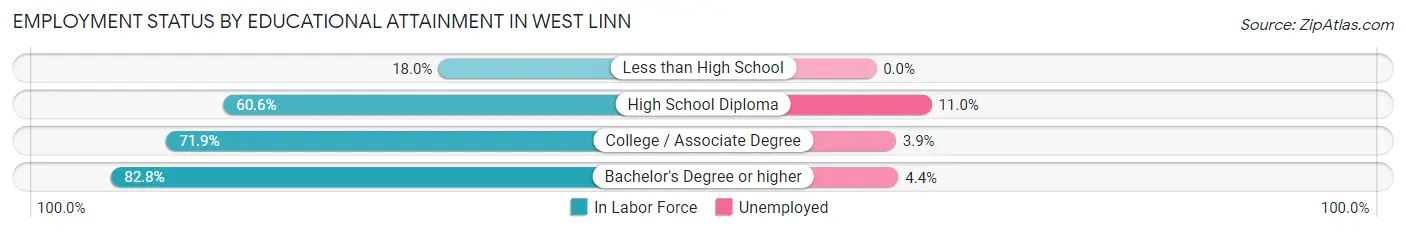
| Educational Attainment | In Labor Force | Unemployed |
| Less than High School | 46 (18.0%) | 0 (0.0%) |
| High School Diploma | 828 (60.6%) | 150 (11.0%) |
| College / Associate Degree | 2,312 (71.9%) | 125 (3.9%) |
| Bachelor's Degree or higher | 7,352 (82.8%) | 391 (4.4%) |
| Total | 10,548 (76.9%) | 658 (4.8%) |
Employment Occupations by Sex in West Linn
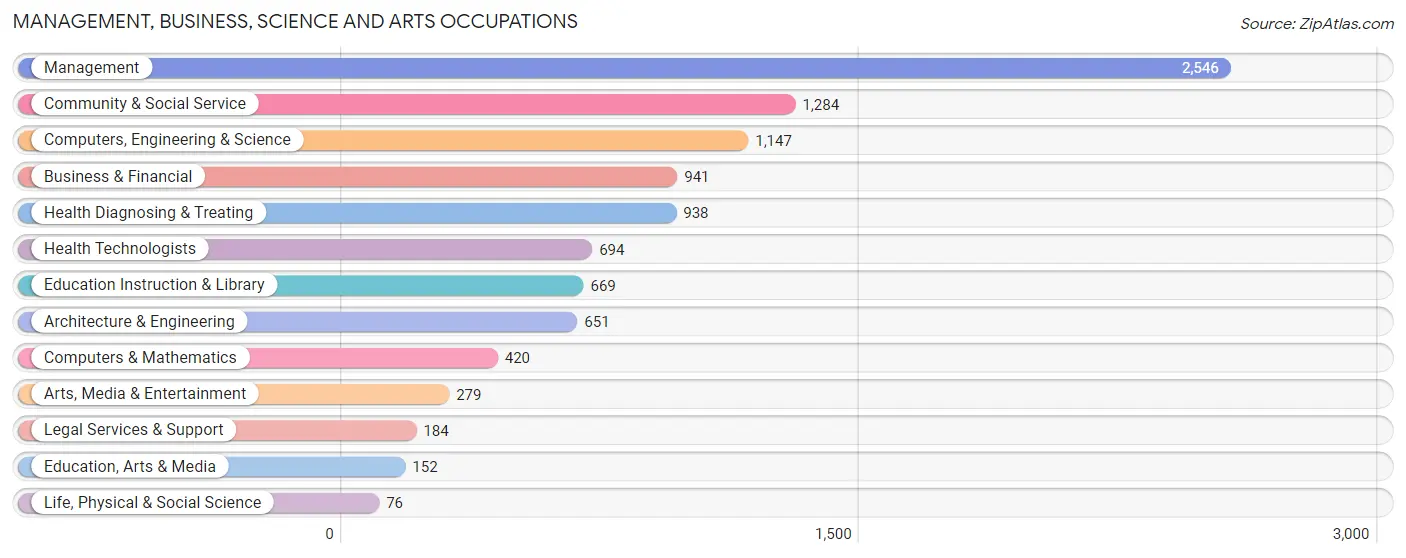
Management, Business, Science and Arts Occupations
The most common Management, Business, Science and Arts occupations in West Linn are Management (2,546 | 20.9%), Community & Social Service (1,284 | 10.5%), Computers, Engineering & Science (1,147 | 9.4%), Business & Financial (941 | 7.7%), and Health Diagnosing & Treating (938 | 7.7%).
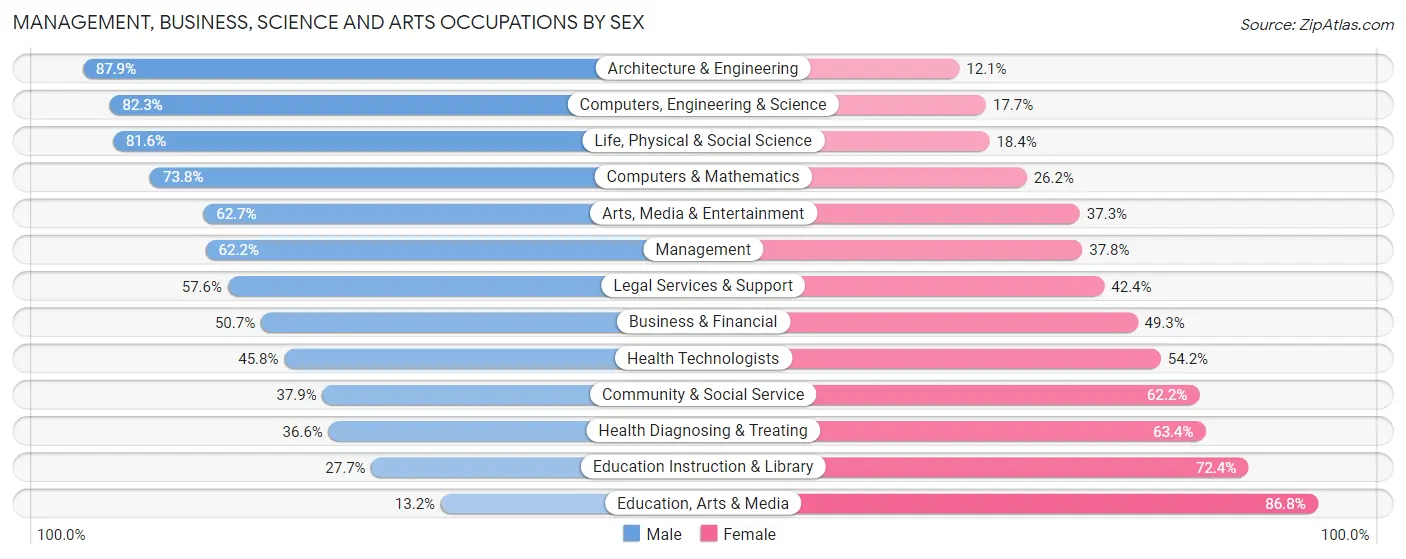
Management, Business, Science and Arts Occupations by Sex
Within the Management, Business, Science and Arts occupations in West Linn, the most male-oriented occupations are Architecture & Engineering (87.9%), Computers, Engineering & Science (82.3%), and Life, Physical & Social Science (81.6%), while the most female-oriented occupations are Education, Arts & Media (86.8%), Education Instruction & Library (72.4%), and Health Diagnosing & Treating (63.4%).
| Occupation | Male | Female |
| Management | 1,584 (62.2%) | 962 (37.8%) |
| Business & Financial | 477 (50.7%) | 464 (49.3%) |
| Computers, Engineering & Science | 944 (82.3%) | 203 (17.7%) |
| Computers & Mathematics | 310 (73.8%) | 110 (26.2%) |
| Architecture & Engineering | 572 (87.9%) | 79 (12.1%) |
| Life, Physical & Social Science | 62 (81.6%) | 14 (18.4%) |
| Community & Social Service | 486 (37.9%) | 798 (62.2%) |
| Education, Arts & Media | 20 (13.2%) | 132 (86.8%) |
| Legal Services & Support | 106 (57.6%) | 78 (42.4%) |
| Education Instruction & Library | 185 (27.7%) | 484 (72.4%) |
| Arts, Media & Entertainment | 175 (62.7%) | 104 (37.3%) |
| Health Diagnosing & Treating | 343 (36.6%) | 595 (63.4%) |
| Health Technologists | 318 (45.8%) | 376 (54.2%) |
| Total (Category) | 3,834 (55.9%) | 3,022 (44.1%) |
| Total (Overall) | 6,654 (54.7%) | 5,514 (45.3%) |
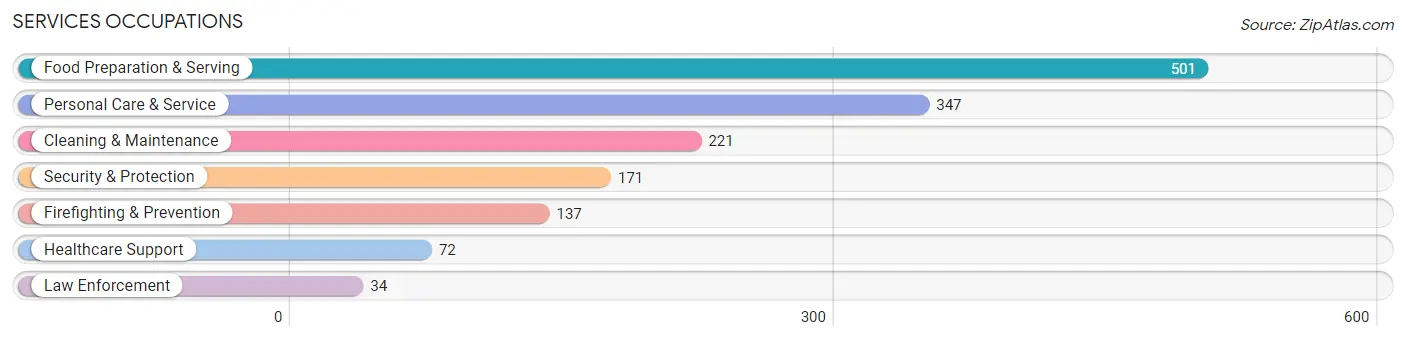
Services Occupations
The most common Services occupations in West Linn are Food Preparation & Serving (501 | 4.1%), Personal Care & Service (347 | 2.9%), Cleaning & Maintenance (221 | 1.8%), Security & Protection (171 | 1.4%), and Firefighting & Prevention (137 | 1.1%).
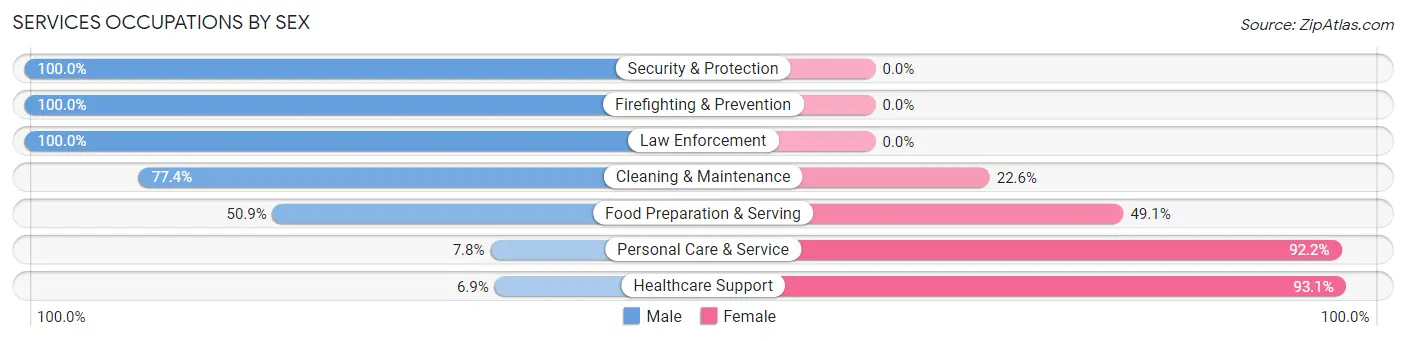
Services Occupations by Sex
Within the Services occupations in West Linn, the most male-oriented occupations are Security & Protection (100.0%), Firefighting & Prevention (100.0%), and Law Enforcement (100.0%), while the most female-oriented occupations are Healthcare Support (93.1%), Personal Care & Service (92.2%), and Food Preparation & Serving (49.1%).
| Occupation | Male | Female |
| Healthcare Support | 5 (6.9%) | 67 (93.1%) |
| Security & Protection | 171 (100.0%) | 0 (0.0%) |
| Firefighting & Prevention | 137 (100.0%) | 0 (0.0%) |
| Law Enforcement | 34 (100.0%) | 0 (0.0%) |
| Food Preparation & Serving | 255 (50.9%) | 246 (49.1%) |
| Cleaning & Maintenance | 171 (77.4%) | 50 (22.6%) |
| Personal Care & Service | 27 (7.8%) | 320 (92.2%) |
| Total (Category) | 629 (47.9%) | 683 (52.1%) |
| Total (Overall) | 6,654 (54.7%) | 5,514 (45.3%) |
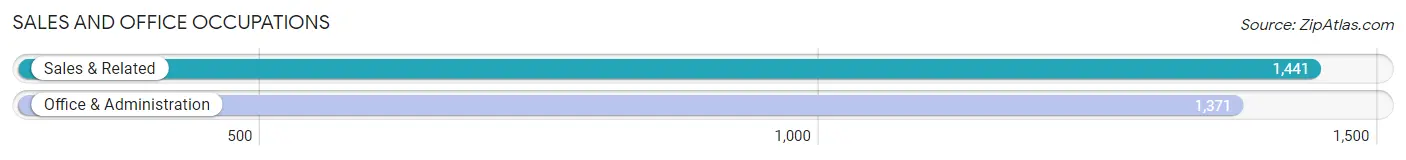
Sales and Office Occupations
The most common Sales and Office occupations in West Linn are Sales & Related (1,441 | 11.8%), and Office & Administration (1,371 | 11.3%).
Sales and Office Occupations by Sex
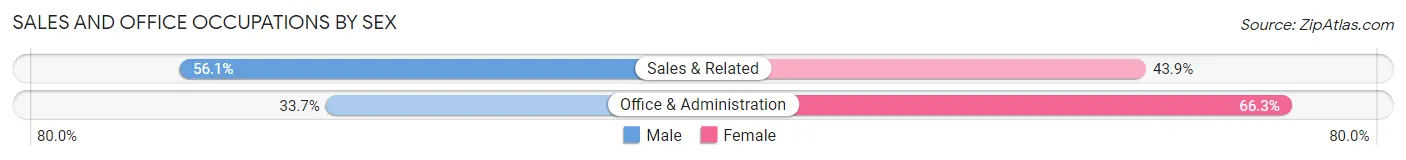
| Occupation | Male | Female |
| Sales & Related | 808 (56.1%) | 633 (43.9%) |
| Office & Administration | 462 (33.7%) | 909 (66.3%) |
| Total (Category) | 1,270 (45.2%) | 1,542 (54.8%) |
| Total (Overall) | 6,654 (54.7%) | 5,514 (45.3%) |
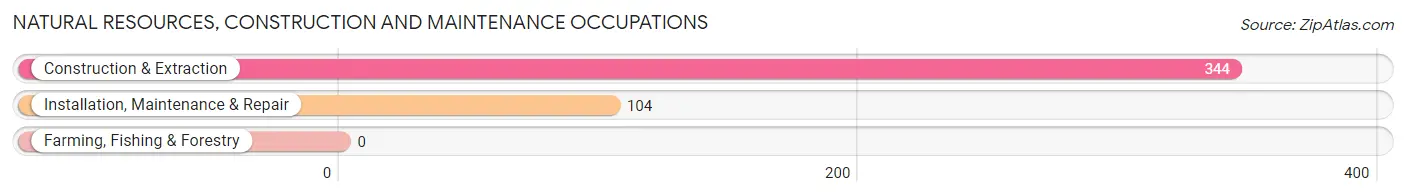
Natural Resources, Construction and Maintenance Occupations
The most common Natural Resources, Construction and Maintenance occupations in West Linn are Construction & Extraction (344 | 2.8%), and Installation, Maintenance & Repair (104 | 0.9%).
Natural Resources, Construction and Maintenance Occupations by Sex
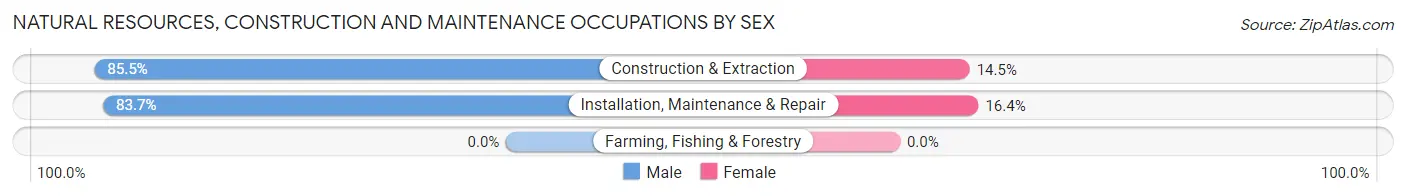
| Occupation | Male | Female |
| Farming, Fishing & Forestry | 0 (0.0%) | 0 (0.0%) |
| Construction & Extraction | 294 (85.5%) | 50 (14.5%) |
| Installation, Maintenance & Repair | 87 (83.7%) | 17 (16.4%) |
| Total (Category) | 381 (85.0%) | 67 (15.0%) |
| Total (Overall) | 6,654 (54.7%) | 5,514 (45.3%) |
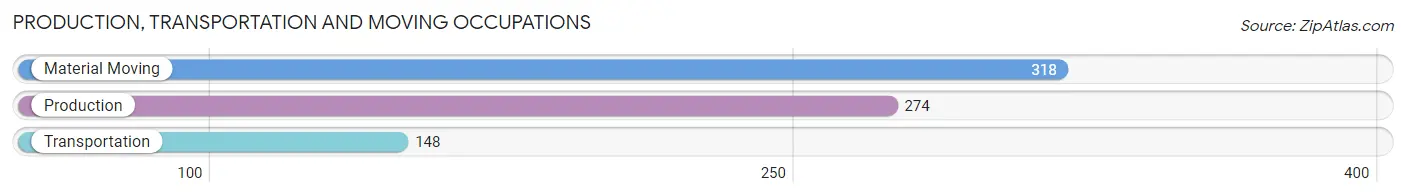
Production, Transportation and Moving Occupations
The most common Production, Transportation and Moving occupations in West Linn are Material Moving (318 | 2.6%), Production (274 | 2.2%), and Transportation (148 | 1.2%).
Production, Transportation and Moving Occupations by Sex
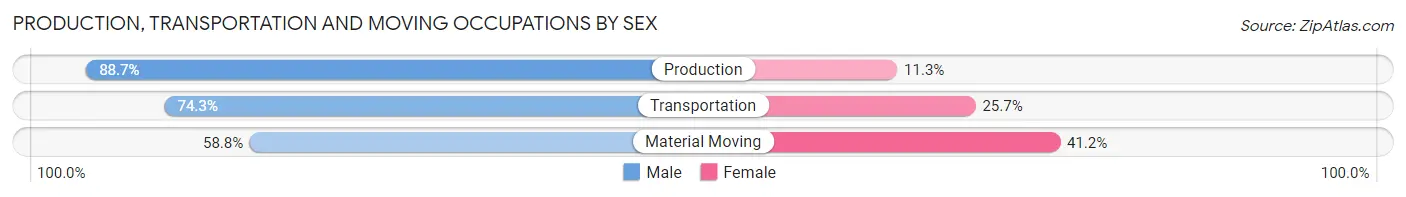
| Occupation | Male | Female |
| Production | 243 (88.7%) | 31 (11.3%) |
| Transportation | 110 (74.3%) | 38 (25.7%) |
| Material Moving | 187 (58.8%) | 131 (41.2%) |
| Total (Category) | 540 (73.0%) | 200 (27.0%) |
| Total (Overall) | 6,654 (54.7%) | 5,514 (45.3%) |
Employment Industries by Sex in West Linn
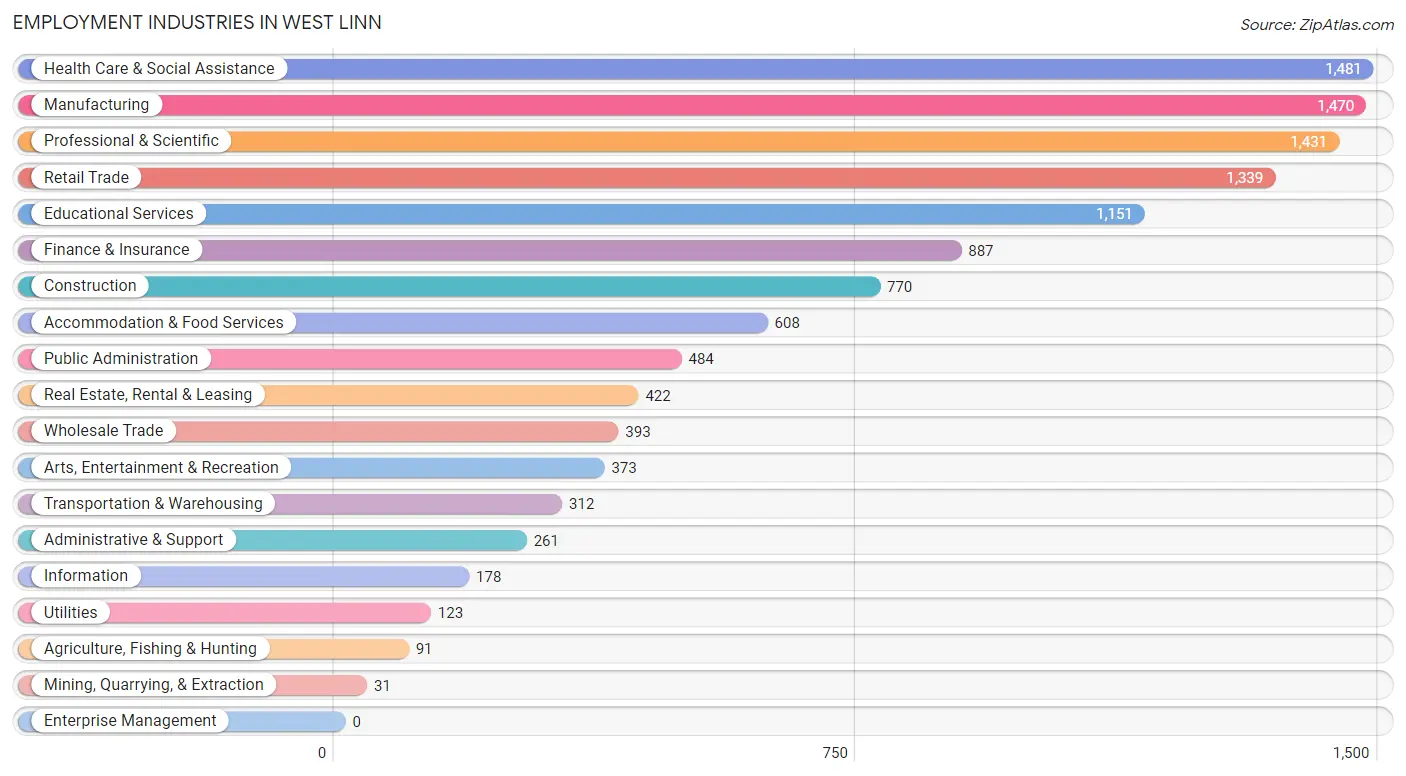
Employment Industries in West Linn
The major employment industries in West Linn include Health Care & Social Assistance (1,481 | 12.2%), Manufacturing (1,470 | 12.1%), Professional & Scientific (1,431 | 11.8%), Retail Trade (1,339 | 11.0%), and Educational Services (1,151 | 9.5%).
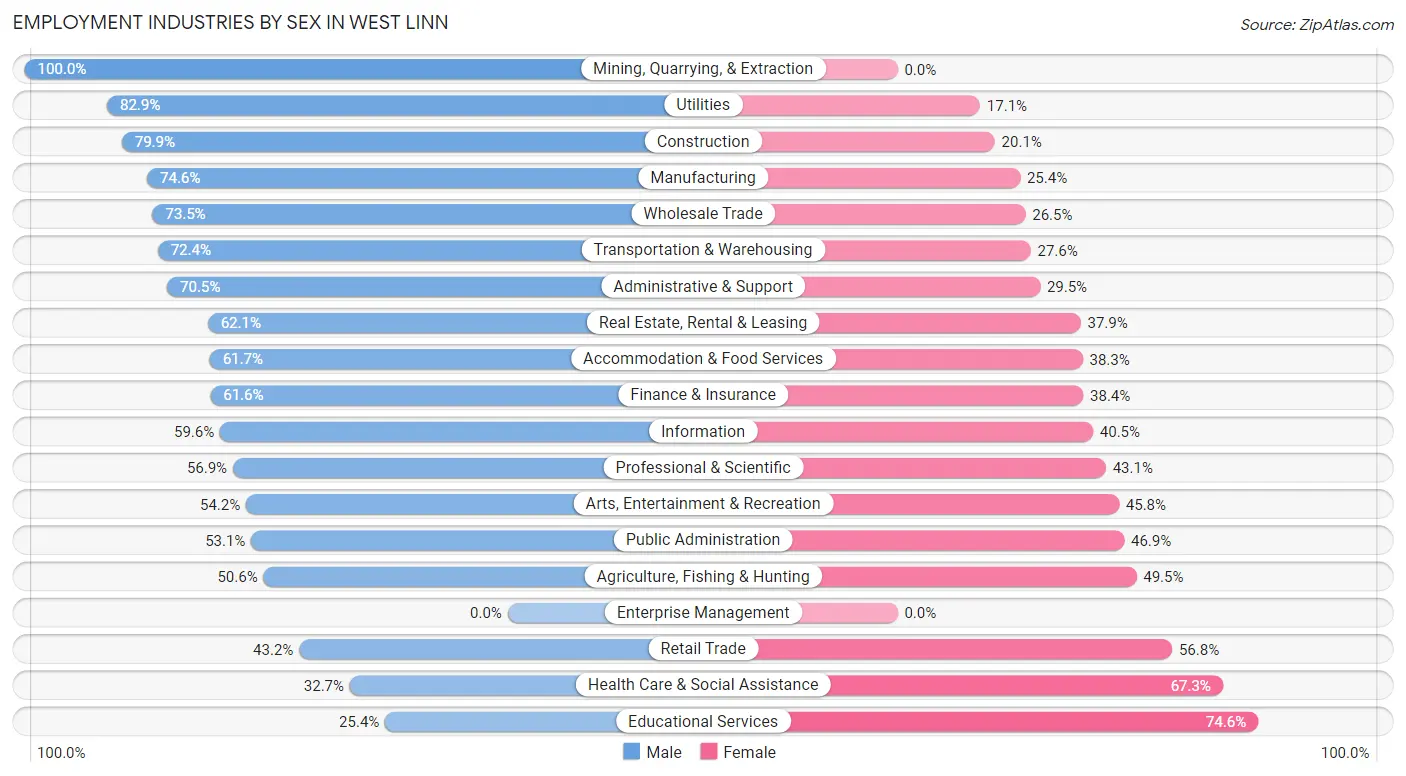
Employment Industries by Sex in West Linn
The West Linn industries that see more men than women are Mining, Quarrying, & Extraction (100.0%), Utilities (82.9%), and Construction (79.9%), whereas the industries that tend to have a higher number of women are Educational Services (74.6%), Health Care & Social Assistance (67.3%), and Retail Trade (56.8%).
| Industry | Male | Female |
| Agriculture, Fishing & Hunting | 46 (50.5%) | 45 (49.4%) |
| Mining, Quarrying, & Extraction | 31 (100.0%) | 0 (0.0%) |
| Construction | 615 (79.9%) | 155 (20.1%) |
| Manufacturing | 1,097 (74.6%) | 373 (25.4%) |
| Wholesale Trade | 289 (73.5%) | 104 (26.5%) |
| Retail Trade | 578 (43.2%) | 761 (56.8%) |
| Transportation & Warehousing | 226 (72.4%) | 86 (27.6%) |
| Utilities | 102 (82.9%) | 21 (17.1%) |
| Information | 106 (59.6%) | 72 (40.5%) |
| Finance & Insurance | 546 (61.6%) | 341 (38.4%) |
| Real Estate, Rental & Leasing | 262 (62.1%) | 160 (37.9%) |
| Professional & Scientific | 814 (56.9%) | 617 (43.1%) |
| Enterprise Management | 0 (0.0%) | 0 (0.0%) |
| Administrative & Support | 184 (70.5%) | 77 (29.5%) |
| Educational Services | 292 (25.4%) | 859 (74.6%) |
| Health Care & Social Assistance | 484 (32.7%) | 997 (67.3%) |
| Arts, Entertainment & Recreation | 202 (54.2%) | 171 (45.8%) |
| Accommodation & Food Services | 375 (61.7%) | 233 (38.3%) |
| Public Administration | 257 (53.1%) | 227 (46.9%) |
| Total | 6,654 (54.7%) | 5,514 (45.3%) |
Education in West Linn
School Enrollment in West Linn
The most common levels of schooling among the 7,306 students in West Linn are middle school (1,892 | 25.9%), high school (1,649 | 22.6%), and elementary school (1,348 | 18.4%).
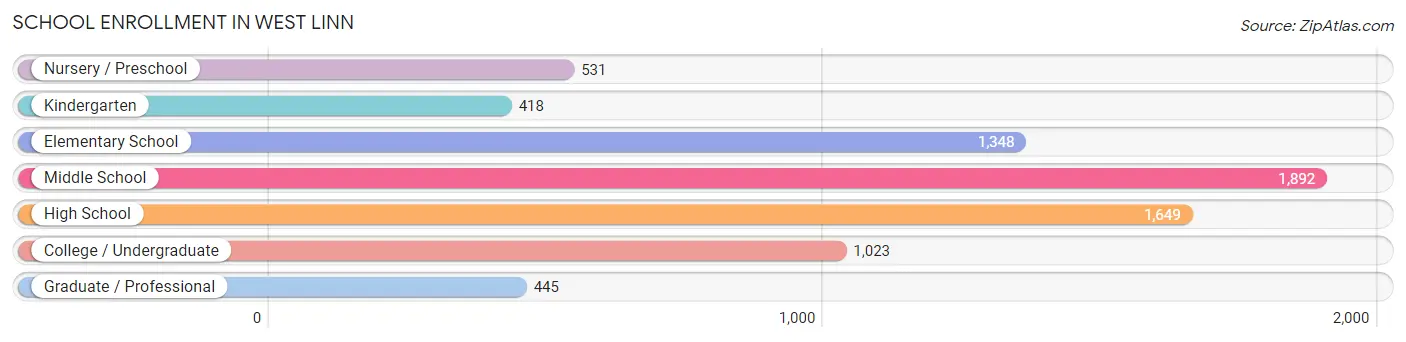
| School Level | # Students | % Students |
| Nursery / Preschool | 531 | 7.3% |
| Kindergarten | 418 | 5.7% |
| Elementary School | 1,348 | 18.4% |
| Middle School | 1,892 | 25.9% |
| High School | 1,649 | 22.6% |
| College / Undergraduate | 1,023 | 14.0% |
| Graduate / Professional | 445 | 6.1% |
| Total | 7,306 | 100.0% |
School Enrollment by Age by Funding Source in West Linn
Out of a total of 7,306 students who are enrolled in schools in West Linn, 1,169 (16.0%) attend a private institution, while the remaining 6,137 (84.0%) are enrolled in public schools. The age group of 3 to 4 year olds has the highest likelihood of being enrolled in private schools, with 237 (62.2% in the age bracket) enrolled. Conversely, the age group of 15 to 17 year olds has the lowest likelihood of being enrolled in a private school, with 1,195 (99.4% in the age bracket) attending a public institution.
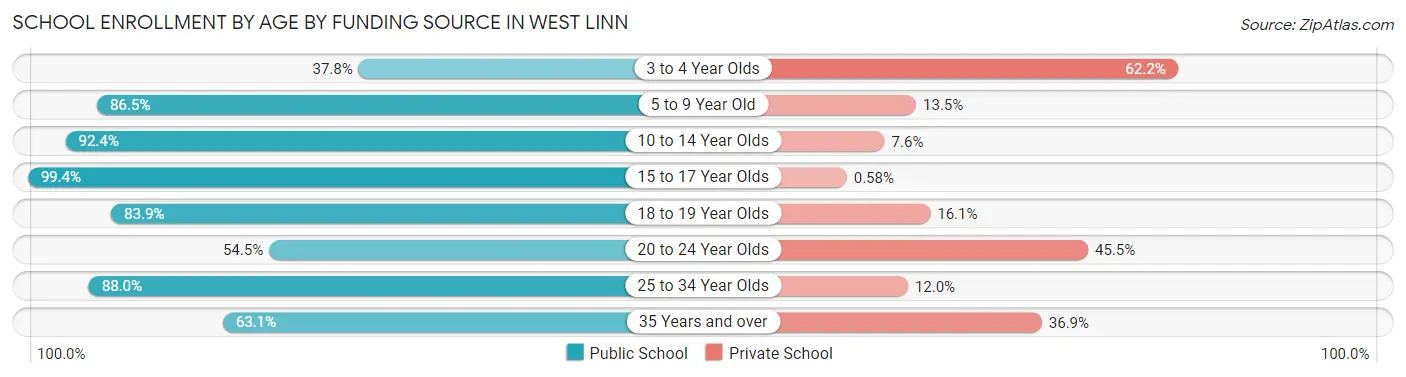
| Age Bracket | Public School | Private School |
| 3 to 4 Year Olds | 144 (37.8%) | 237 (62.2%) |
| 5 to 9 Year Old | 1,584 (86.5%) | 247 (13.5%) |
| 10 to 14 Year Olds | 1,985 (92.4%) | 164 (7.6%) |
| 15 to 17 Year Olds | 1,195 (99.4%) | 7 (0.6%) |
| 18 to 19 Year Olds | 473 (83.9%) | 91 (16.1%) |
| 20 to 24 Year Olds | 292 (54.5%) | 244 (45.5%) |
| 25 to 34 Year Olds | 206 (88.0%) | 28 (12.0%) |
| 35 Years and over | 258 (63.1%) | 151 (36.9%) |
| Total | 6,137 (84.0%) | 1,169 (16.0%) |
Educational Attainment by Field of Study in West Linn
Business (2,636 | 19.8%), bio, nature & agricultural (1,271 | 9.6%), social sciences (1,196 | 9.0%), engineering (1,190 | 8.9%), and education (1,099 | 8.3%) are the most common fields of study among 13,302 individuals in West Linn who have obtained a bachelor's degree or higher.
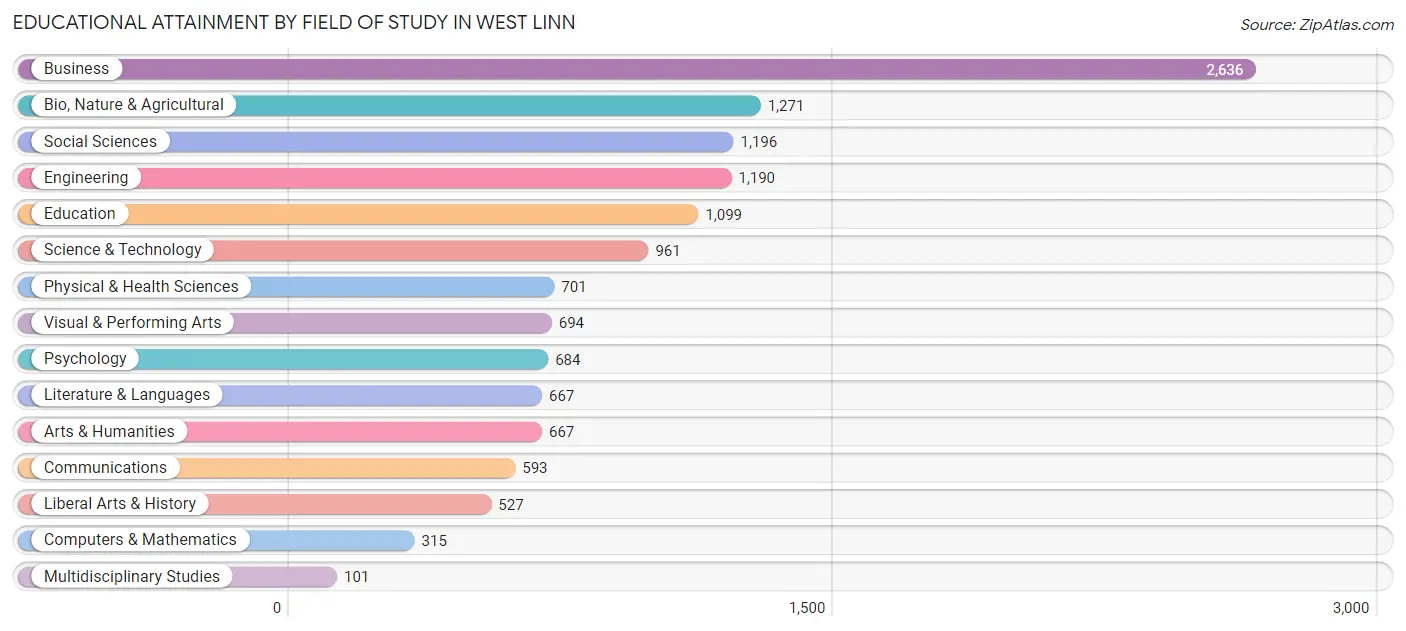
| Field of Study | # Graduates | % Graduates |
| Computers & Mathematics | 315 | 2.4% |
| Bio, Nature & Agricultural | 1,271 | 9.6% |
| Physical & Health Sciences | 701 | 5.3% |
| Psychology | 684 | 5.1% |
| Social Sciences | 1,196 | 9.0% |
| Engineering | 1,190 | 8.9% |
| Multidisciplinary Studies | 101 | 0.8% |
| Science & Technology | 961 | 7.2% |
| Business | 2,636 | 19.8% |
| Education | 1,099 | 8.3% |
| Literature & Languages | 667 | 5.0% |
| Liberal Arts & History | 527 | 4.0% |
| Visual & Performing Arts | 694 | 5.2% |
| Communications | 593 | 4.5% |
| Arts & Humanities | 667 | 5.0% |
| Total | 13,302 | 100.0% |
Transportation & Commute in West Linn
Vehicle Availability by Sex in West Linn
The most prevalent vehicle ownership categories in West Linn are males with 2 vehicles (2,844, accounting for 43.3%) and females with 2 vehicles (2,603, making up 52.3%).
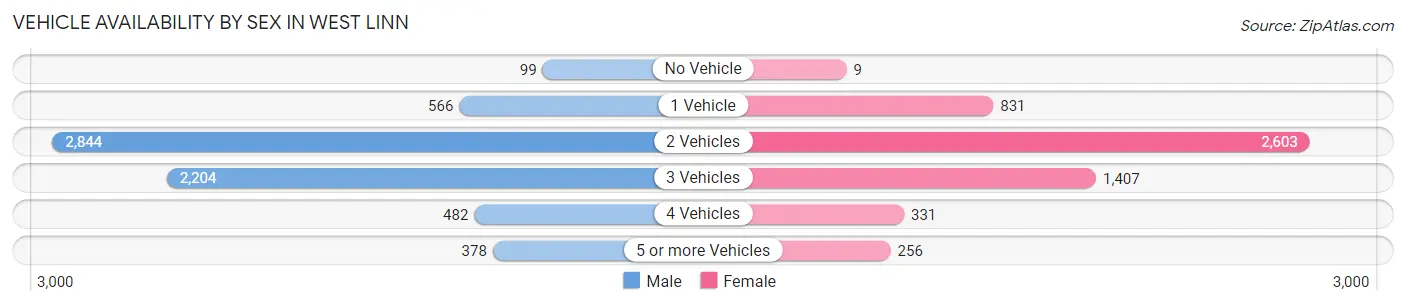
| Vehicles Available | Male | Female |
| No Vehicle | 99 (1.5%) | 9 (0.2%) |
| 1 Vehicle | 566 (8.6%) | 831 (15.3%) |
| 2 Vehicles | 2,844 (43.3%) | 2,603 (47.9%) |
| 3 Vehicles | 2,204 (33.5%) | 1,407 (25.9%) |
| 4 Vehicles | 482 (7.3%) | 331 (6.1%) |
| 5 or more Vehicles | 378 (5.8%) | 256 (4.7%) |
| Total | 6,573 (100.0%) | 5,437 (100.0%) |
Commute Time in West Linn
The most frequently occuring commute durations in West Linn are 20 to 24 minutes (1,849 commuters, 20.6%), 15 to 19 minutes (1,493 commuters, 16.7%), and 30 to 34 minutes (1,141 commuters, 12.7%).
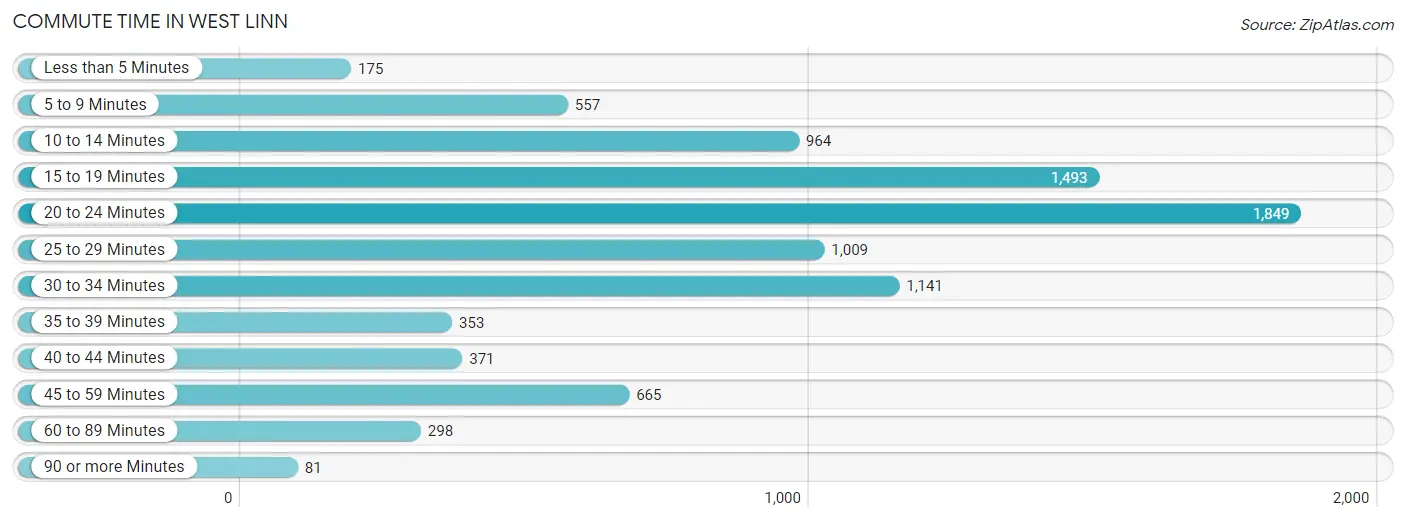
| Commute Time | # Commuters | % Commuters |
| Less than 5 Minutes | 175 | 1.9% |
| 5 to 9 Minutes | 557 | 6.2% |
| 10 to 14 Minutes | 964 | 10.8% |
| 15 to 19 Minutes | 1,493 | 16.7% |
| 20 to 24 Minutes | 1,849 | 20.6% |
| 25 to 29 Minutes | 1,009 | 11.3% |
| 30 to 34 Minutes | 1,141 | 12.7% |
| 35 to 39 Minutes | 353 | 3.9% |
| 40 to 44 Minutes | 371 | 4.1% |
| 45 to 59 Minutes | 665 | 7.4% |
| 60 to 89 Minutes | 298 | 3.3% |
| 90 or more Minutes | 81 | 0.9% |
Commute Time by Sex in West Linn
The most common commute times in West Linn are 20 to 24 minutes (988 commuters, 19.8%) for males and 20 to 24 minutes (861 commuters, 21.7%) for females.
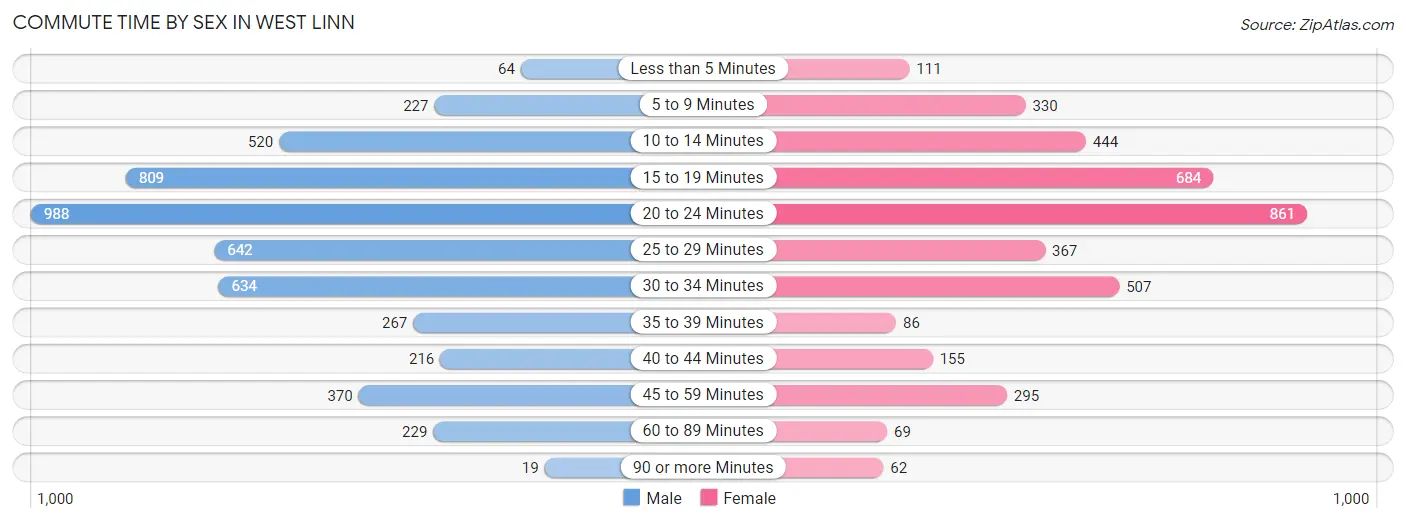
| Commute Time | Male | Female |
| Less than 5 Minutes | 64 (1.3%) | 111 (2.8%) |
| 5 to 9 Minutes | 227 (4.5%) | 330 (8.3%) |
| 10 to 14 Minutes | 520 (10.4%) | 444 (11.2%) |
| 15 to 19 Minutes | 809 (16.2%) | 684 (17.2%) |
| 20 to 24 Minutes | 988 (19.8%) | 861 (21.7%) |
| 25 to 29 Minutes | 642 (12.9%) | 367 (9.2%) |
| 30 to 34 Minutes | 634 (12.7%) | 507 (12.8%) |
| 35 to 39 Minutes | 267 (5.4%) | 86 (2.2%) |
| 40 to 44 Minutes | 216 (4.3%) | 155 (3.9%) |
| 45 to 59 Minutes | 370 (7.4%) | 295 (7.4%) |
| 60 to 89 Minutes | 229 (4.6%) | 69 (1.7%) |
| 90 or more Minutes | 19 (0.4%) | 62 (1.6%) |
Time of Departure to Work by Sex in West Linn
The most frequent times of departure to work in West Linn are 7:00 AM to 7:29 AM (805, 16.2%) for males and 7:00 AM to 7:29 AM (737, 18.6%) for females.
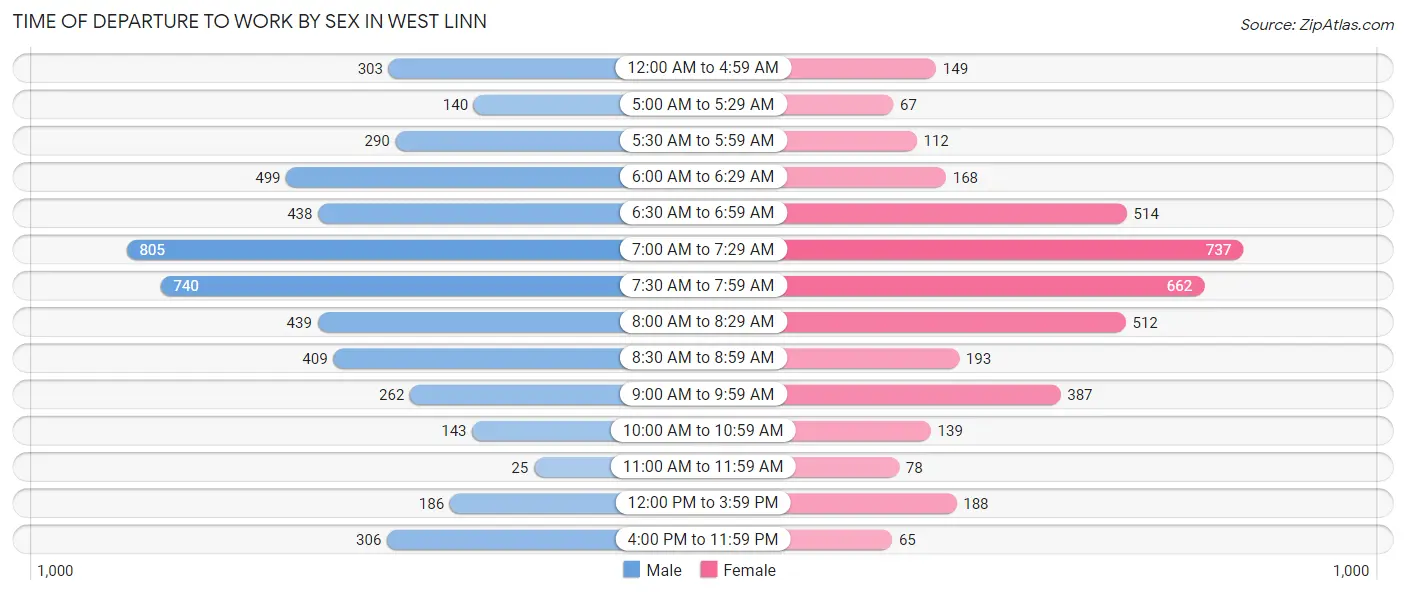
| Time of Departure | Male | Female |
| 12:00 AM to 4:59 AM | 303 (6.1%) | 149 (3.7%) |
| 5:00 AM to 5:29 AM | 140 (2.8%) | 67 (1.7%) |
| 5:30 AM to 5:59 AM | 290 (5.8%) | 112 (2.8%) |
| 6:00 AM to 6:29 AM | 499 (10.0%) | 168 (4.2%) |
| 6:30 AM to 6:59 AM | 438 (8.8%) | 514 (12.9%) |
| 7:00 AM to 7:29 AM | 805 (16.2%) | 737 (18.6%) |
| 7:30 AM to 7:59 AM | 740 (14.8%) | 662 (16.7%) |
| 8:00 AM to 8:29 AM | 439 (8.8%) | 512 (12.9%) |
| 8:30 AM to 8:59 AM | 409 (8.2%) | 193 (4.9%) |
| 9:00 AM to 9:59 AM | 262 (5.3%) | 387 (9.8%) |
| 10:00 AM to 10:59 AM | 143 (2.9%) | 139 (3.5%) |
| 11:00 AM to 11:59 AM | 25 (0.5%) | 78 (2.0%) |
| 12:00 PM to 3:59 PM | 186 (3.7%) | 188 (4.7%) |
| 4:00 PM to 11:59 PM | 306 (6.1%) | 65 (1.6%) |
| Total | 4,985 (100.0%) | 3,971 (100.0%) |
Housing Occupancy in West Linn
Occupancy by Ownership in West Linn
Of the total 10,008 dwellings in West Linn, owner-occupied units account for 8,343 (83.4%), while renter-occupied units make up 1,665 (16.6%).
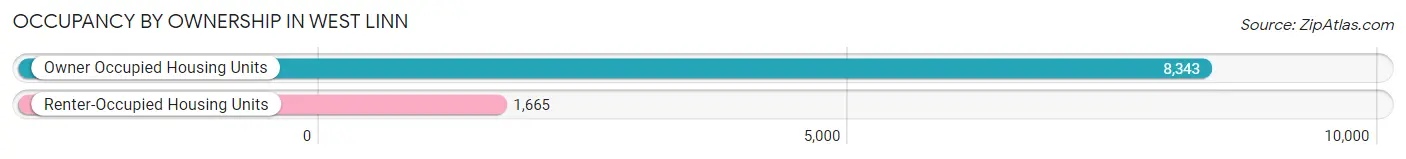
| Occupancy | # Housing Units | % Housing Units |
| Owner Occupied Housing Units | 8,343 | 83.4% |
| Renter-Occupied Housing Units | 1,665 | 16.6% |
| Total Occupied Housing Units | 10,008 | 100.0% |
Occupancy by Household Size in West Linn
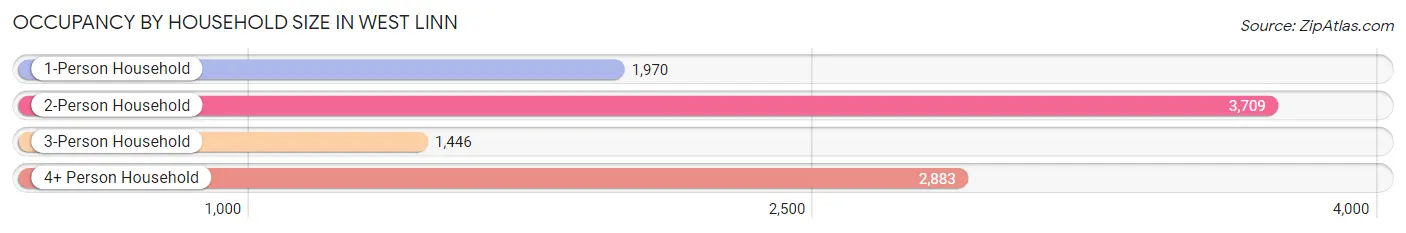
| Household Size | # Housing Units | % Housing Units |
| 1-Person Household | 1,970 | 19.7% |
| 2-Person Household | 3,709 | 37.1% |
| 3-Person Household | 1,446 | 14.4% |
| 4+ Person Household | 2,883 | 28.8% |
| Total Housing Units | 10,008 | 100.0% |
Occupancy by Ownership by Household Size in West Linn
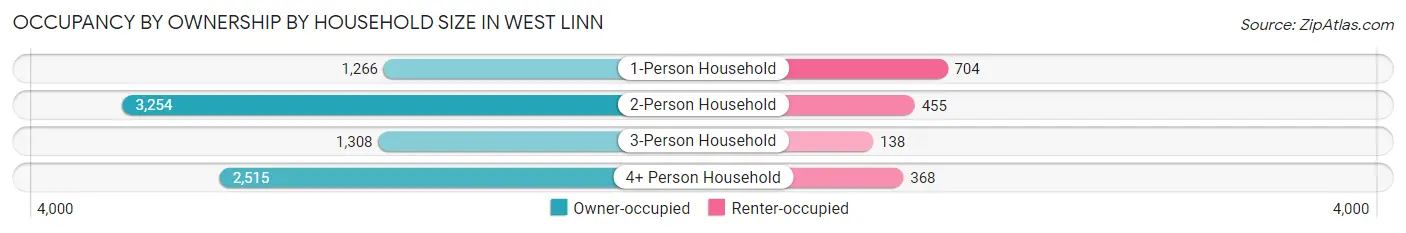
| Household Size | Owner-occupied | Renter-occupied |
| 1-Person Household | 1,266 (64.3%) | 704 (35.7%) |
| 2-Person Household | 3,254 (87.7%) | 455 (12.3%) |
| 3-Person Household | 1,308 (90.5%) | 138 (9.5%) |
| 4+ Person Household | 2,515 (87.2%) | 368 (12.8%) |
| Total Housing Units | 8,343 (83.4%) | 1,665 (16.6%) |
Occupancy by Educational Attainment in West Linn
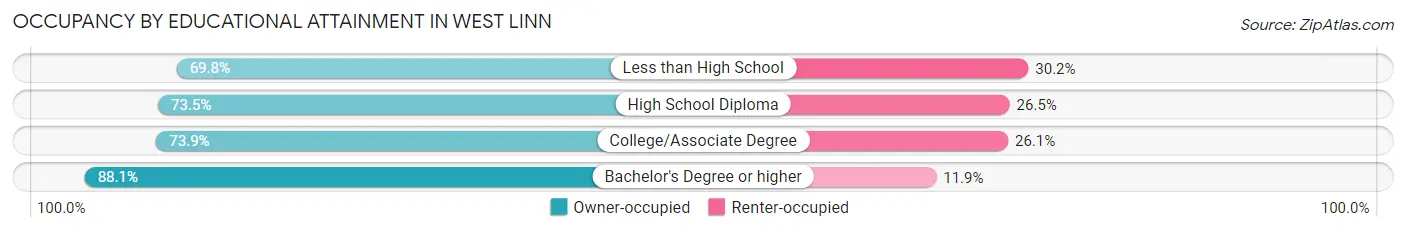
| Household Size | Owner-occupied | Renter-occupied |
| Less than High School | 125 (69.8%) | 54 (30.2%) |
| High School Diploma | 550 (73.5%) | 198 (26.5%) |
| College/Associate Degree | 1,718 (73.9%) | 608 (26.1%) |
| Bachelor's Degree or higher | 5,950 (88.1%) | 805 (11.9%) |
Occupancy by Age of Householder in West Linn
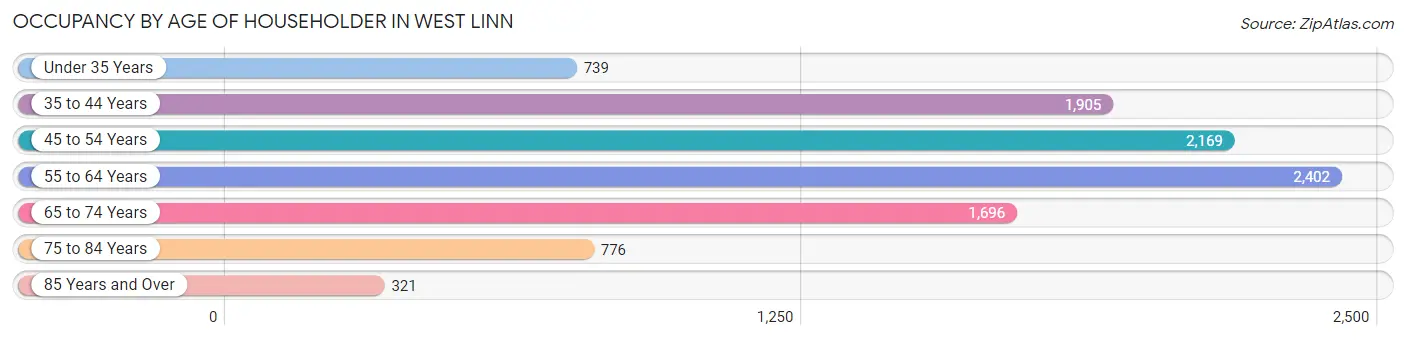
| Age Bracket | # Households | % Households |
| Under 35 Years | 739 | 7.4% |
| 35 to 44 Years | 1,905 | 19.0% |
| 45 to 54 Years | 2,169 | 21.7% |
| 55 to 64 Years | 2,402 | 24.0% |
| 65 to 74 Years | 1,696 | 17.0% |
| 75 to 84 Years | 776 | 7.7% |
| 85 Years and Over | 321 | 3.2% |
| Total | 10,008 | 100.0% |
Housing Finances in West Linn
Median Income by Occupancy in West Linn
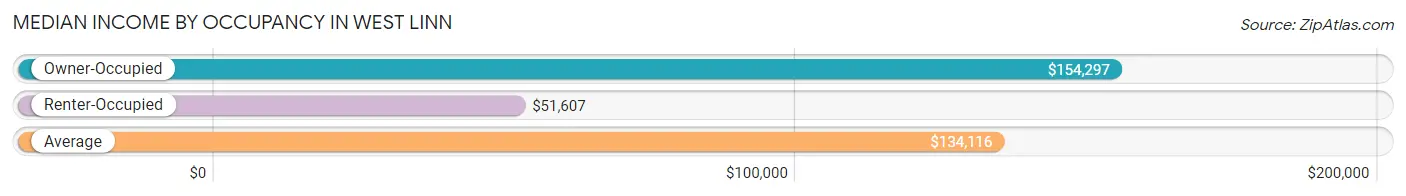
| Occupancy Type | # Households | Median Income |
| Owner-Occupied | 8,343 (83.4%) | $154,297 |
| Renter-Occupied | 1,665 (16.6%) | $51,607 |
| Average | 10,008 (100.0%) | $134,116 |
Occupancy by Householder Income Bracket in West Linn
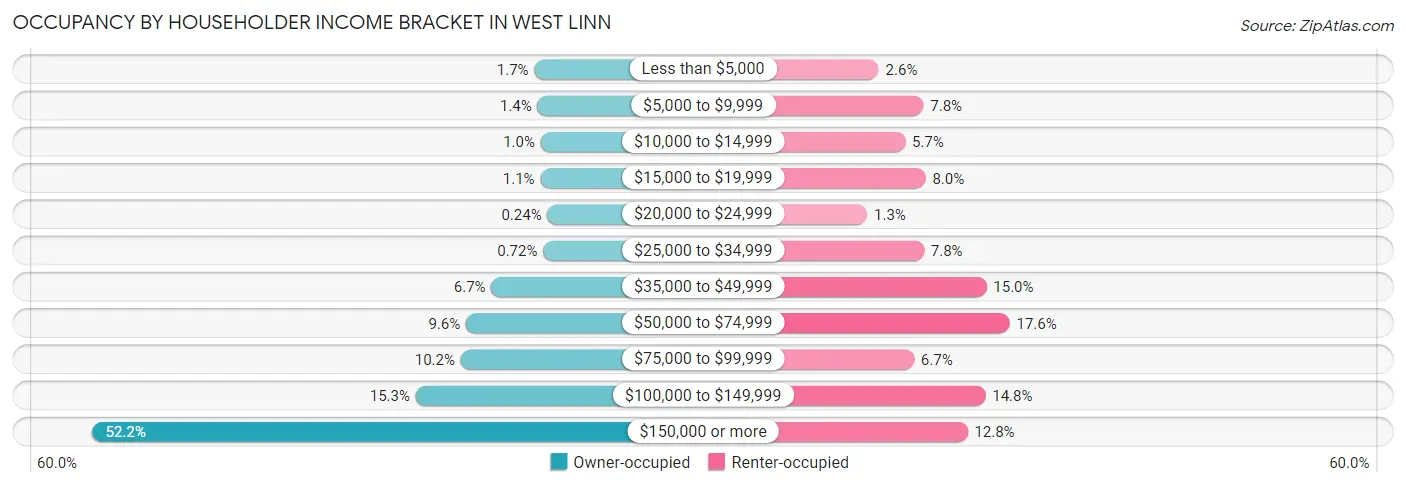
| Income Bracket | Owner-occupied | Renter-occupied |
| Less than $5,000 | 144 (1.7%) | 44 (2.6%) |
| $5,000 to $9,999 | 114 (1.4%) | 129 (7.7%) |
| $10,000 to $14,999 | 84 (1.0%) | 94 (5.7%) |
| $15,000 to $19,999 | 88 (1.1%) | 133 (8.0%) |
| $20,000 to $24,999 | 20 (0.2%) | 22 (1.3%) |
| $25,000 to $34,999 | 60 (0.7%) | 130 (7.8%) |
| $35,000 to $49,999 | 555 (6.7%) | 249 (14.9%) |
| $50,000 to $74,999 | 797 (9.6%) | 293 (17.6%) |
| $75,000 to $99,999 | 847 (10.2%) | 111 (6.7%) |
| $100,000 to $149,999 | 1,276 (15.3%) | 247 (14.8%) |
| $150,000 or more | 4,358 (52.2%) | 213 (12.8%) |
| Total | 8,343 (100.0%) | 1,665 (100.0%) |
Monthly Housing Cost Tiers in West Linn
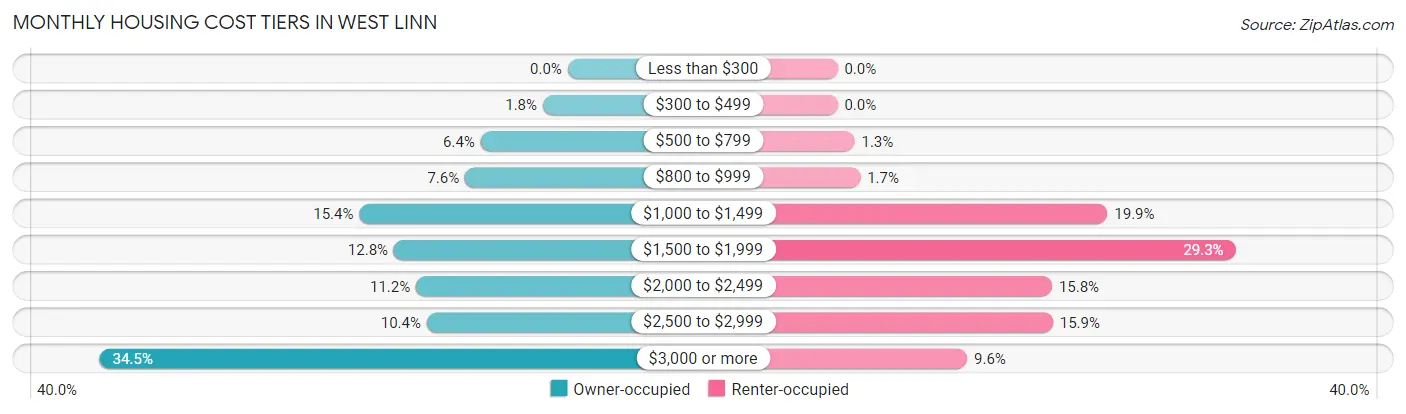
| Monthly Cost | Owner-occupied | Renter-occupied |
| Less than $300 | 0 (0.0%) | 0 (0.0%) |
| $300 to $499 | 153 (1.8%) | 0 (0.0%) |
| $500 to $799 | 535 (6.4%) | 21 (1.3%) |
| $800 to $999 | 631 (7.6%) | 28 (1.7%) |
| $1,000 to $1,499 | 1,281 (15.3%) | 331 (19.9%) |
| $1,500 to $1,999 | 1,068 (12.8%) | 488 (29.3%) |
| $2,000 to $2,499 | 932 (11.2%) | 263 (15.8%) |
| $2,500 to $2,999 | 866 (10.4%) | 264 (15.9%) |
| $3,000 or more | 2,877 (34.5%) | 159 (9.6%) |
| Total | 8,343 (100.0%) | 1,665 (100.0%) |
Physical Housing Characteristics in West Linn
Housing Structures in West Linn
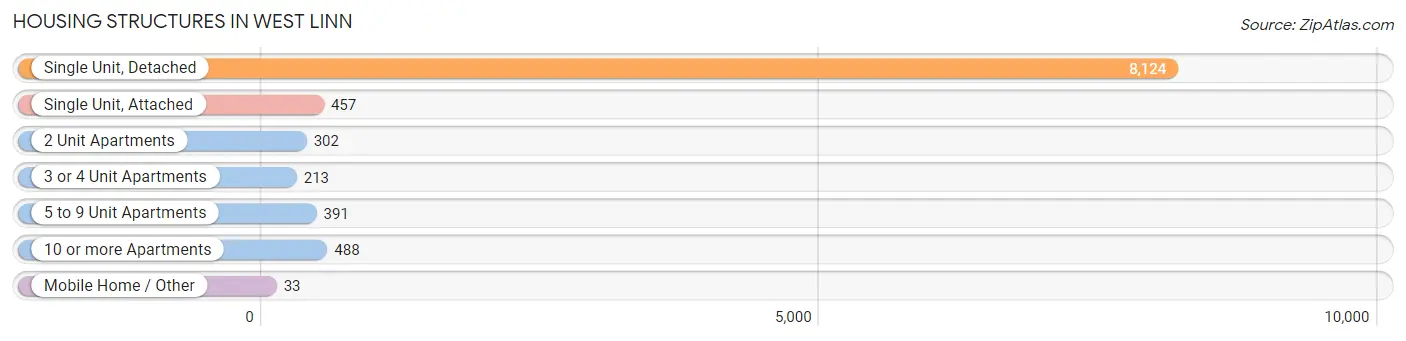
| Structure Type | # Housing Units | % Housing Units |
| Single Unit, Detached | 8,124 | 81.2% |
| Single Unit, Attached | 457 | 4.6% |
| 2 Unit Apartments | 302 | 3.0% |
| 3 or 4 Unit Apartments | 213 | 2.1% |
| 5 to 9 Unit Apartments | 391 | 3.9% |
| 10 or more Apartments | 488 | 4.9% |
| Mobile Home / Other | 33 | 0.3% |
| Total | 10,008 | 100.0% |
Housing Structures by Occupancy in West Linn
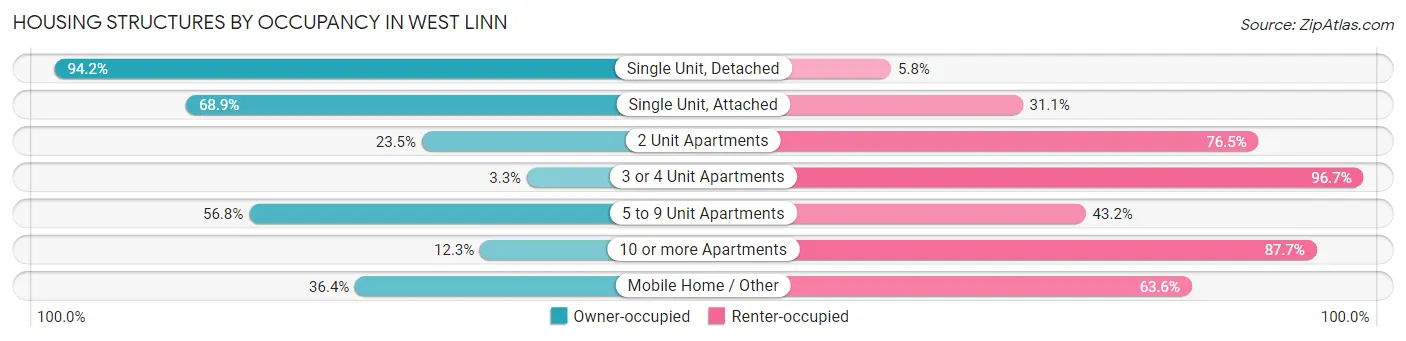
| Structure Type | Owner-occupied | Renter-occupied |
| Single Unit, Detached | 7,656 (94.2%) | 468 (5.8%) |
| Single Unit, Attached | 315 (68.9%) | 142 (31.1%) |
| 2 Unit Apartments | 71 (23.5%) | 231 (76.5%) |
| 3 or 4 Unit Apartments | 7 (3.3%) | 206 (96.7%) |
| 5 to 9 Unit Apartments | 222 (56.8%) | 169 (43.2%) |
| 10 or more Apartments | 60 (12.3%) | 428 (87.7%) |
| Mobile Home / Other | 12 (36.4%) | 21 (63.6%) |
| Total | 8,343 (83.4%) | 1,665 (16.6%) |
Housing Structures by Number of Rooms in West Linn
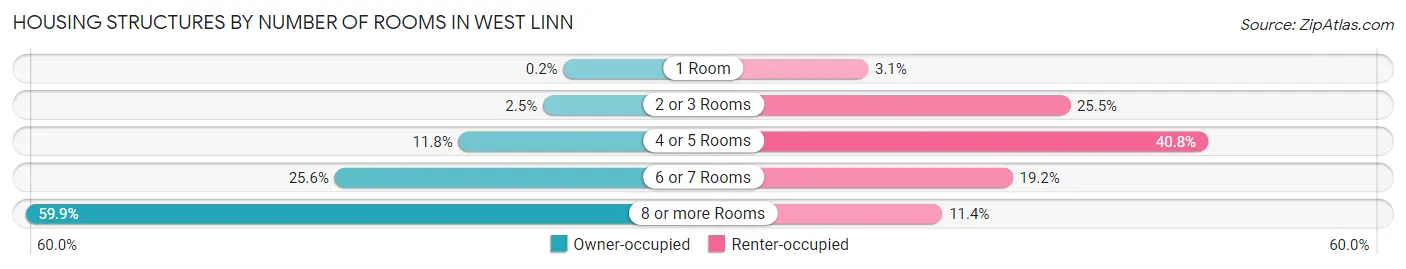
| Number of Rooms | Owner-occupied | Renter-occupied |
| 1 Room | 17 (0.2%) | 52 (3.1%) |
| 2 or 3 Rooms | 206 (2.5%) | 425 (25.5%) |
| 4 or 5 Rooms | 987 (11.8%) | 680 (40.8%) |
| 6 or 7 Rooms | 2,134 (25.6%) | 319 (19.2%) |
| 8 or more Rooms | 4,999 (59.9%) | 189 (11.4%) |
| Total | 8,343 (100.0%) | 1,665 (100.0%) |
Housing Structure by Heating Type in West Linn
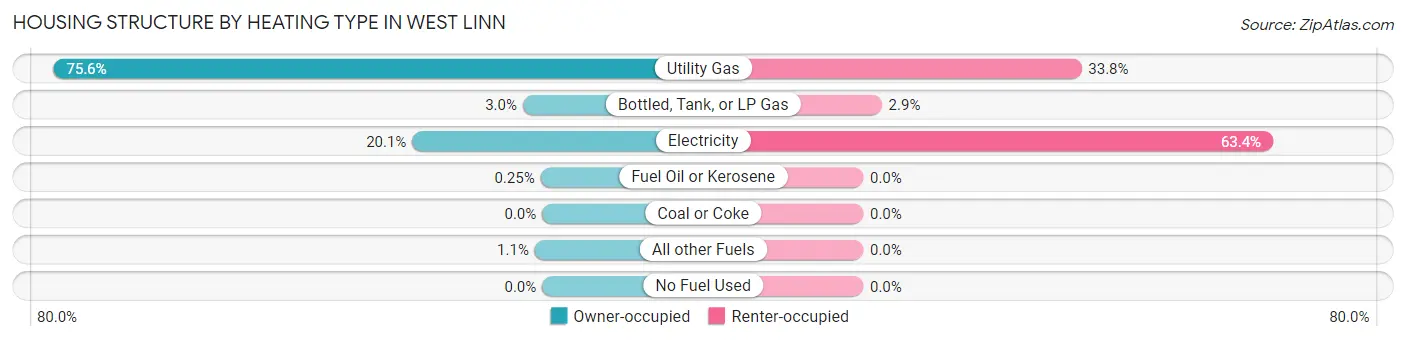
| Heating Type | Owner-occupied | Renter-occupied |
| Utility Gas | 6,303 (75.5%) | 562 (33.8%) |
| Bottled, Tank, or LP Gas | 249 (3.0%) | 48 (2.9%) |
| Electricity | 1,675 (20.1%) | 1,055 (63.4%) |
| Fuel Oil or Kerosene | 21 (0.3%) | 0 (0.0%) |
| Coal or Coke | 0 (0.0%) | 0 (0.0%) |
| All other Fuels | 95 (1.1%) | 0 (0.0%) |
| No Fuel Used | 0 (0.0%) | 0 (0.0%) |
| Total | 8,343 (100.0%) | 1,665 (100.0%) |
Household Vehicle Usage in West Linn
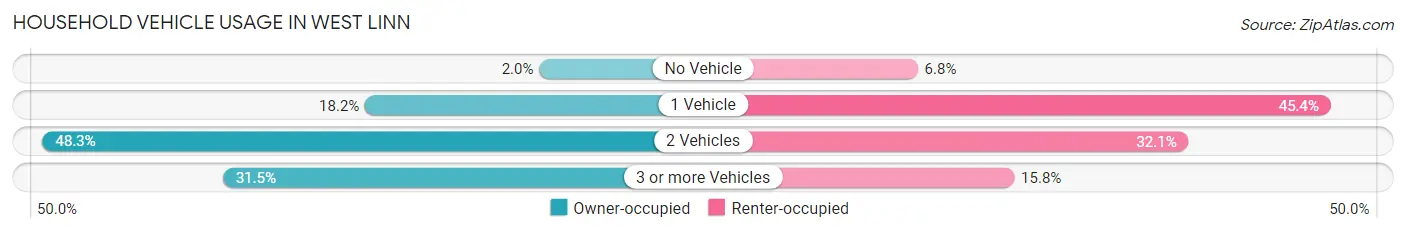
| Vehicles per Household | Owner-occupied | Renter-occupied |
| No Vehicle | 163 (1.9%) | 113 (6.8%) |
| 1 Vehicle | 1,519 (18.2%) | 755 (45.4%) |
| 2 Vehicles | 4,033 (48.3%) | 534 (32.1%) |
| 3 or more Vehicles | 2,628 (31.5%) | 263 (15.8%) |
| Total | 8,343 (100.0%) | 1,665 (100.0%) |
Real Estate & Mortgages in West Linn
Real Estate and Mortgage Overview in West Linn
| Characteristic | Without Mortgage | With Mortgage |
| Housing Units | 2,505 | 5,838 |
| Median Property Value | $645,700 | $689,100 |
| Median Household Income | $107,813 | $3,392 |
| Monthly Housing Costs | $990 | $2,866 |
| Real Estate Taxes | $7,187 | $13 |
Property Value by Mortgage Status in West Linn
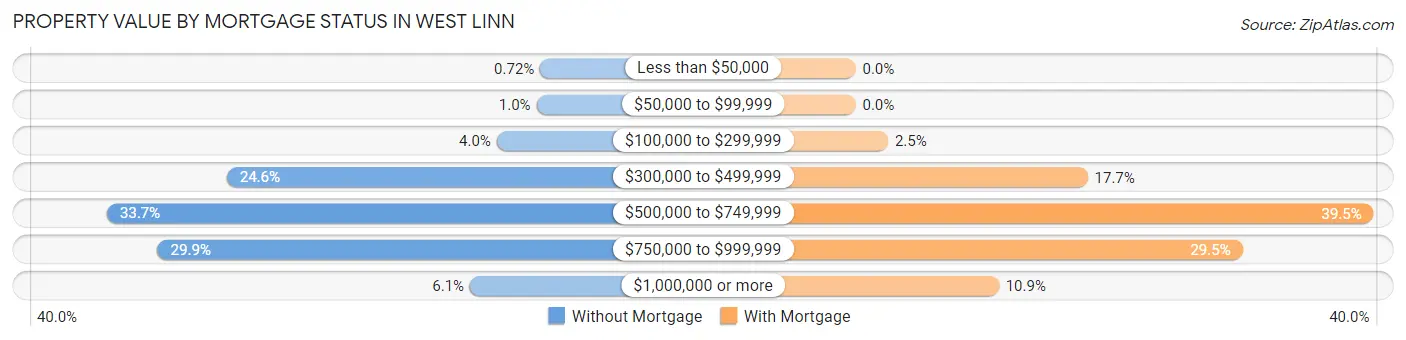
| Property Value | Without Mortgage | With Mortgage |
| Less than $50,000 | 18 (0.7%) | 0 (0.0%) |
| $50,000 to $99,999 | 25 (1.0%) | 0 (0.0%) |
| $100,000 to $299,999 | 101 (4.0%) | 144 (2.5%) |
| $300,000 to $499,999 | 616 (24.6%) | 1,032 (17.7%) |
| $500,000 to $749,999 | 845 (33.7%) | 2,304 (39.5%) |
| $750,000 to $999,999 | 748 (29.9%) | 1,721 (29.5%) |
| $1,000,000 or more | 152 (6.1%) | 637 (10.9%) |
| Total | 2,505 (100.0%) | 5,838 (100.0%) |
Household Income by Mortgage Status in West Linn
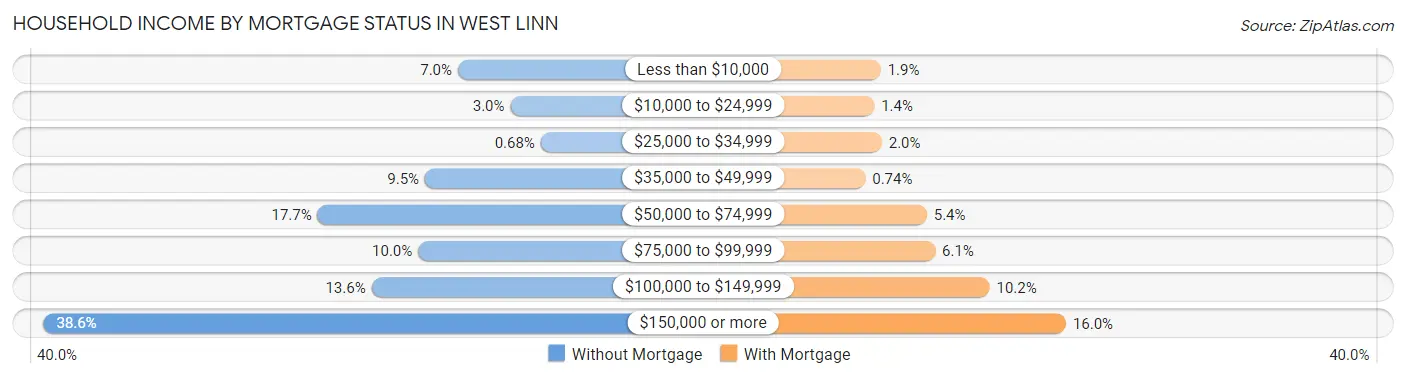
| Household Income | Without Mortgage | With Mortgage |
| Less than $10,000 | 175 (7.0%) | 112 (1.9%) |
| $10,000 to $24,999 | 75 (3.0%) | 83 (1.4%) |
| $25,000 to $34,999 | 17 (0.7%) | 117 (2.0%) |
| $35,000 to $49,999 | 238 (9.5%) | 43 (0.7%) |
| $50,000 to $74,999 | 443 (17.7%) | 317 (5.4%) |
| $75,000 to $99,999 | 251 (10.0%) | 354 (6.1%) |
| $100,000 to $149,999 | 340 (13.6%) | 596 (10.2%) |
| $150,000 or more | 966 (38.6%) | 936 (16.0%) |
| Total | 2,505 (100.0%) | 5,838 (100.0%) |
Property Value to Household Income Ratio in West Linn
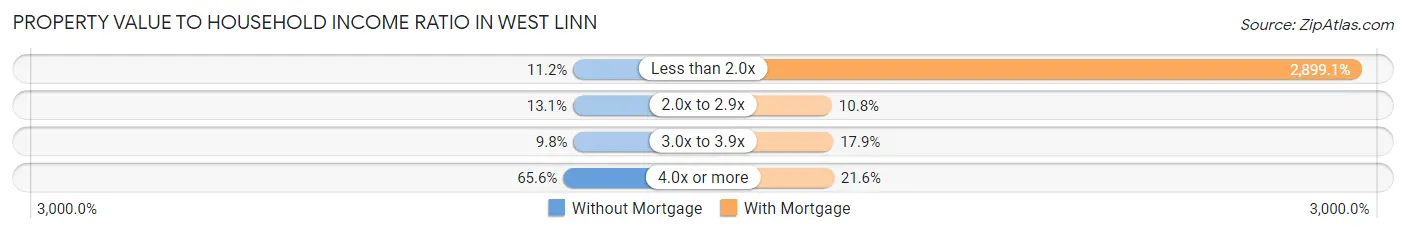
| Value-to-Income Ratio | Without Mortgage | With Mortgage |
| Less than 2.0x | 280 (11.2%) | 169,250 (2,899.1%) |
| 2.0x to 2.9x | 329 (13.1%) | 632 (10.8%) |
| 3.0x to 3.9x | 245 (9.8%) | 1,043 (17.9%) |
| 4.0x or more | 1,642 (65.5%) | 1,260 (21.6%) |
| Total | 2,505 (100.0%) | 5,838 (100.0%) |
Real Estate Taxes by Mortgage Status in West Linn
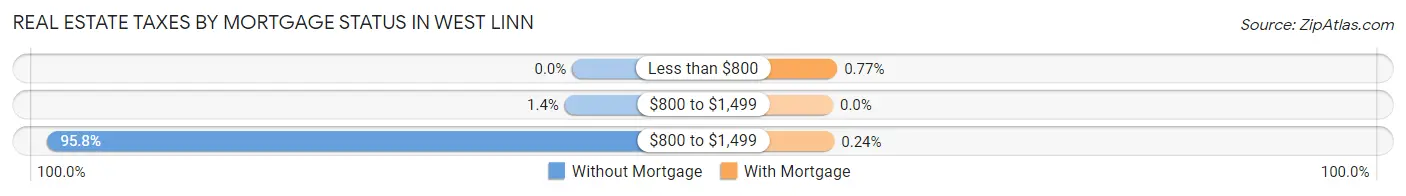
| Property Taxes | Without Mortgage | With Mortgage |
| Less than $800 | 0 (0.0%) | 45 (0.8%) |
| $800 to $1,499 | 34 (1.4%) | 0 (0.0%) |
| $800 to $1,499 | 2,400 (95.8%) | 14 (0.2%) |
| Total | 2,505 (100.0%) | 5,838 (100.0%) |
Health & Disability in West Linn
Health Insurance Coverage by Age in West Linn
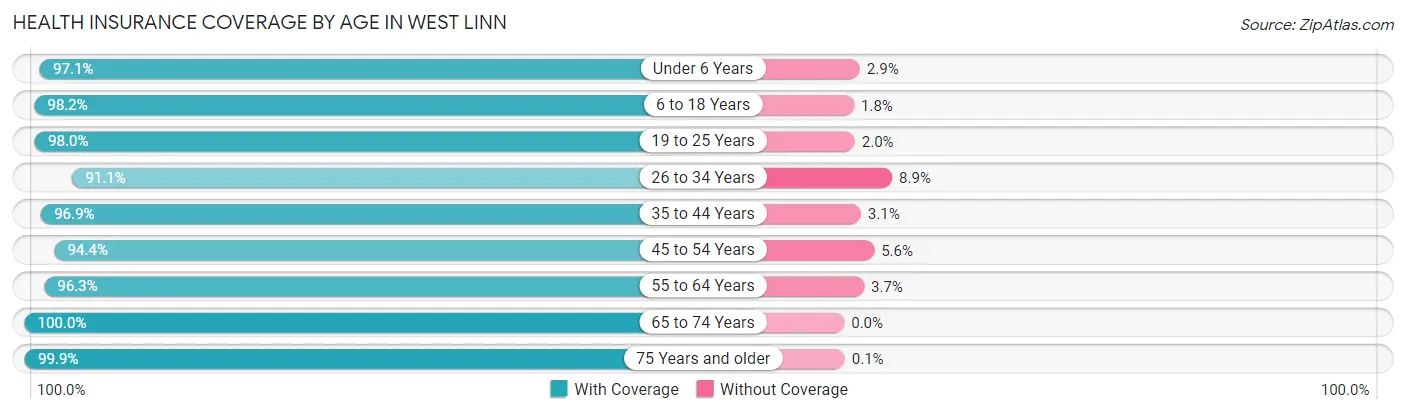
| Age Bracket | With Coverage | Without Coverage |
| Under 6 Years | 1,668 (97.1%) | 50 (2.9%) |
| 6 to 18 Years | 5,253 (98.2%) | 98 (1.8%) |
| 19 to 25 Years | 1,589 (98.0%) | 32 (2.0%) |
| 26 to 34 Years | 1,468 (91.1%) | 144 (8.9%) |
| 35 to 44 Years | 3,435 (96.9%) | 110 (3.1%) |
| 45 to 54 Years | 3,706 (94.4%) | 219 (5.6%) |
| 55 to 64 Years | 4,229 (96.3%) | 162 (3.7%) |
| 65 to 74 Years | 2,908 (100.0%) | 0 (0.0%) |
| 75 Years and older | 1,973 (99.9%) | 2 (0.1%) |
| Total | 26,229 (97.0%) | 817 (3.0%) |
Health Insurance Coverage by Citizenship Status in West Linn
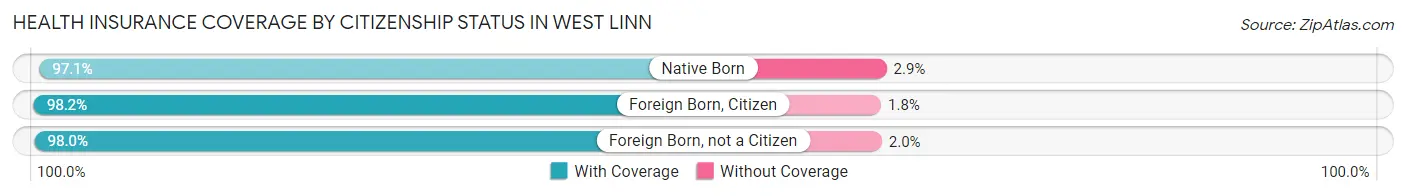
| Citizenship Status | With Coverage | Without Coverage |
| Native Born | 1,668 (97.1%) | 50 (2.9%) |
| Foreign Born, Citizen | 5,253 (98.2%) | 98 (1.8%) |
| Foreign Born, not a Citizen | 1,589 (98.0%) | 32 (2.0%) |
Health Insurance Coverage by Household Income in West Linn
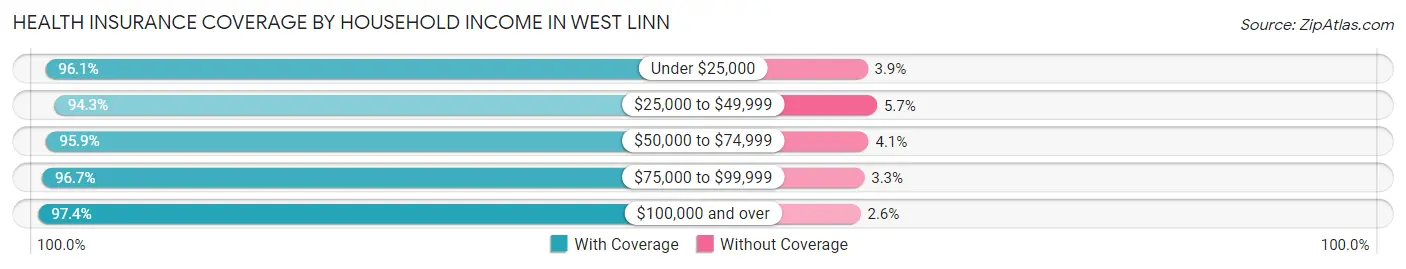
| Household Income | With Coverage | Without Coverage |
| Under $25,000 | 1,437 (96.1%) | 58 (3.9%) |
| $25,000 to $49,999 | 1,617 (94.3%) | 97 (5.7%) |
| $50,000 to $74,999 | 2,213 (95.9%) | 94 (4.1%) |
| $75,000 to $99,999 | 2,244 (96.7%) | 76 (3.3%) |
| $100,000 and over | 18,590 (97.4%) | 490 (2.6%) |
Public vs Private Health Insurance Coverage by Age in West Linn
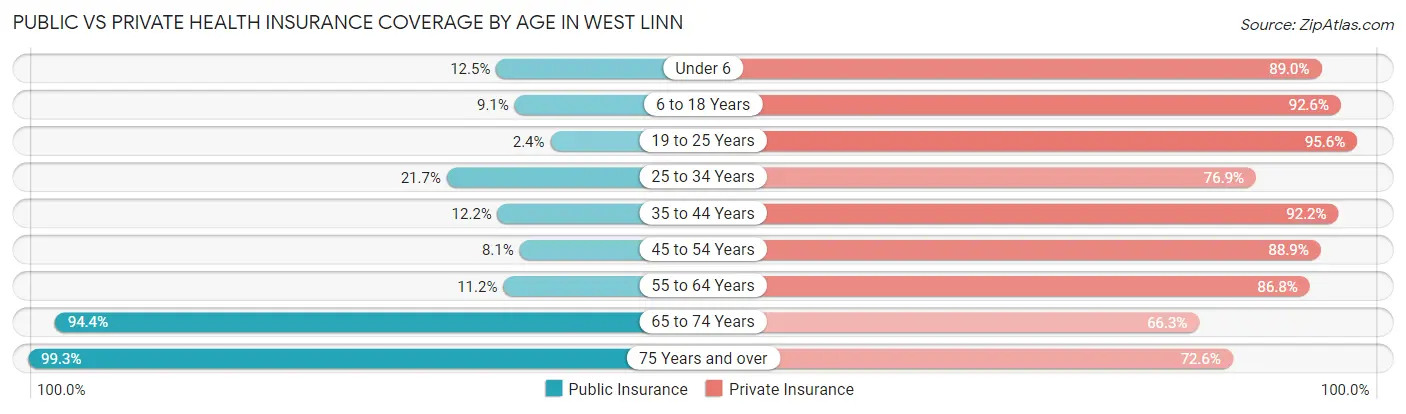
| Age Bracket | Public Insurance | Private Insurance |
| Under 6 | 214 (12.5%) | 1,529 (89.0%) |
| 6 to 18 Years | 484 (9.0%) | 4,956 (92.6%) |
| 19 to 25 Years | 39 (2.4%) | 1,550 (95.6%) |
| 25 to 34 Years | 349 (21.6%) | 1,239 (76.9%) |
| 35 to 44 Years | 432 (12.2%) | 3,267 (92.2%) |
| 45 to 54 Years | 319 (8.1%) | 3,488 (88.9%) |
| 55 to 64 Years | 490 (11.2%) | 3,813 (86.8%) |
| 65 to 74 Years | 2,745 (94.4%) | 1,929 (66.3%) |
| 75 Years and over | 1,962 (99.3%) | 1,433 (72.6%) |
| Total | 7,034 (26.0%) | 23,204 (85.8%) |
Disability Status by Sex by Age in West Linn
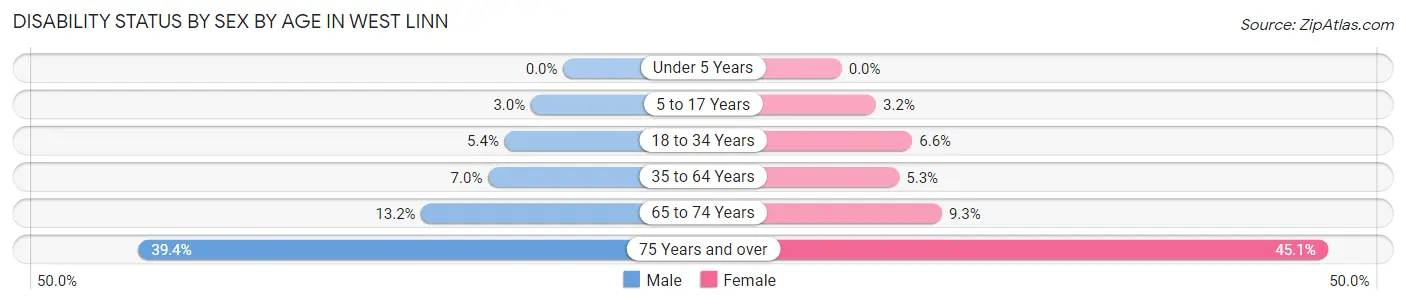
| Age Bracket | Male | Female |
| Under 5 Years | 0 (0.0%) | 0 (0.0%) |
| 5 to 17 Years | 92 (3.0%) | 75 (3.2%) |
| 18 to 34 Years | 105 (5.4%) | 104 (6.6%) |
| 35 to 64 Years | 400 (7.0%) | 327 (5.3%) |
| 65 to 74 Years | 172 (13.2%) | 149 (9.3%) |
| 75 Years and over | 323 (39.4%) | 521 (45.1%) |
Disability Class by Sex by Age in West Linn
Disability Class: Hearing Difficulty
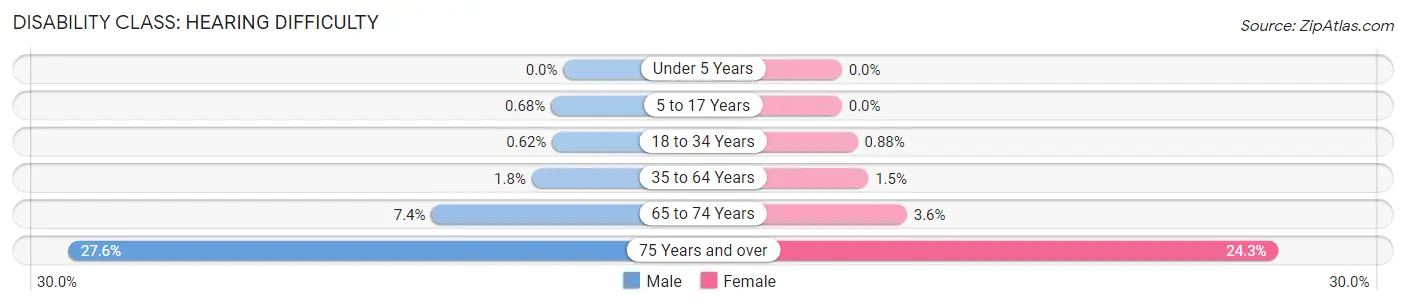
| Age Bracket | Male | Female |
| Under 5 Years | 0 (0.0%) | 0 (0.0%) |
| 5 to 17 Years | 21 (0.7%) | 0 (0.0%) |
| 18 to 34 Years | 12 (0.6%) | 14 (0.9%) |
| 35 to 64 Years | 101 (1.8%) | 90 (1.5%) |
| 65 to 74 Years | 96 (7.3%) | 58 (3.6%) |
| 75 Years and over | 226 (27.6%) | 281 (24.3%) |
Disability Class: Vision Difficulty
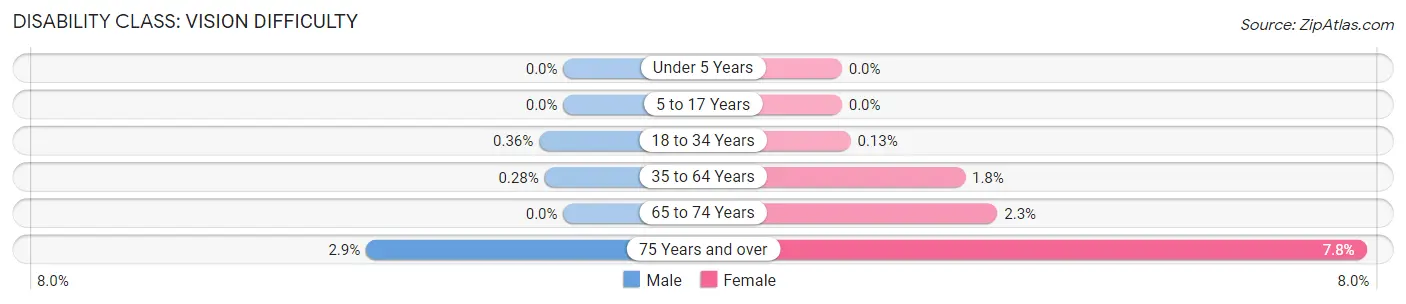
| Age Bracket | Male | Female |
| Under 5 Years | 0 (0.0%) | 0 (0.0%) |
| 5 to 17 Years | 0 (0.0%) | 0 (0.0%) |
| 18 to 34 Years | 7 (0.4%) | 2 (0.1%) |
| 35 to 64 Years | 16 (0.3%) | 112 (1.8%) |
| 65 to 74 Years | 0 (0.0%) | 37 (2.3%) |
| 75 Years and over | 24 (2.9%) | 90 (7.8%) |
Disability Class: Cognitive Difficulty
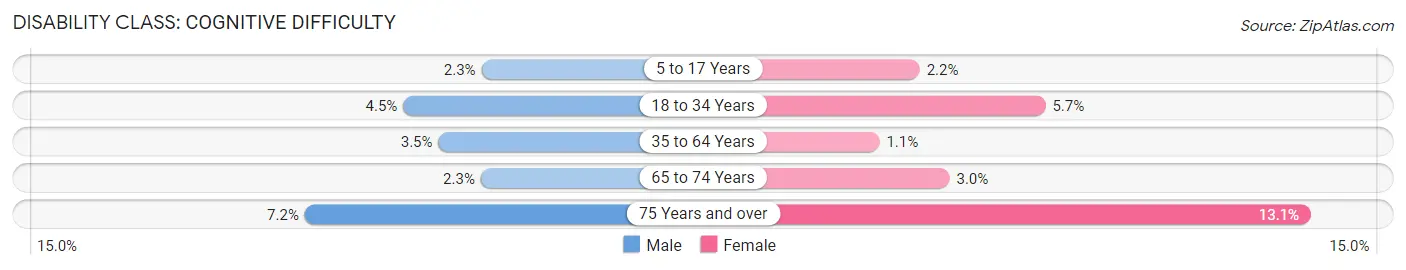
| Age Bracket | Male | Female |
| 5 to 17 Years | 70 (2.3%) | 51 (2.2%) |
| 18 to 34 Years | 86 (4.5%) | 90 (5.7%) |
| 35 to 64 Years | 200 (3.5%) | 64 (1.1%) |
| 65 to 74 Years | 30 (2.3%) | 48 (3.0%) |
| 75 Years and over | 59 (7.2%) | 151 (13.1%) |
Disability Class: Ambulatory Difficulty
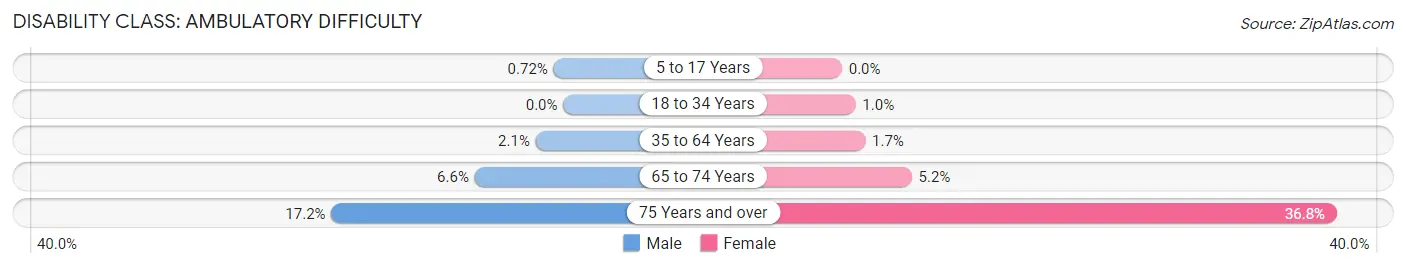
| Age Bracket | Male | Female |
| 5 to 17 Years | 22 (0.7%) | 0 (0.0%) |
| 18 to 34 Years | 0 (0.0%) | 16 (1.0%) |
| 35 to 64 Years | 118 (2.1%) | 106 (1.7%) |
| 65 to 74 Years | 86 (6.6%) | 83 (5.2%) |
| 75 Years and over | 141 (17.2%) | 425 (36.8%) |
Disability Class: Self-Care Difficulty
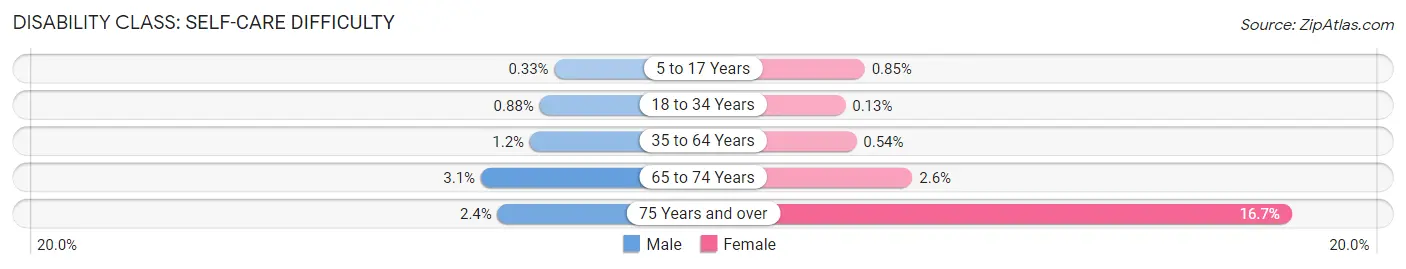
| Age Bracket | Male | Female |
| 5 to 17 Years | 10 (0.3%) | 20 (0.9%) |
| 18 to 34 Years | 17 (0.9%) | 2 (0.1%) |
| 35 to 64 Years | 71 (1.2%) | 33 (0.5%) |
| 65 to 74 Years | 40 (3.1%) | 42 (2.6%) |
| 75 Years and over | 20 (2.4%) | 193 (16.7%) |
Technology Access in West Linn
Computing Device Access in West Linn
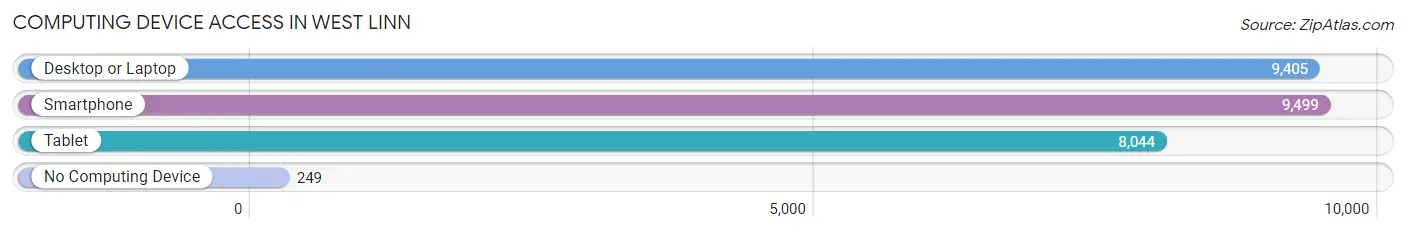
| Device Type | # Households | % Households |
| Desktop or Laptop | 9,405 | 94.0% |
| Smartphone | 9,499 | 94.9% |
| Tablet | 8,044 | 80.4% |
| No Computing Device | 249 | 2.5% |
| Total | 10,008 | 100.0% |
Internet Access in West Linn
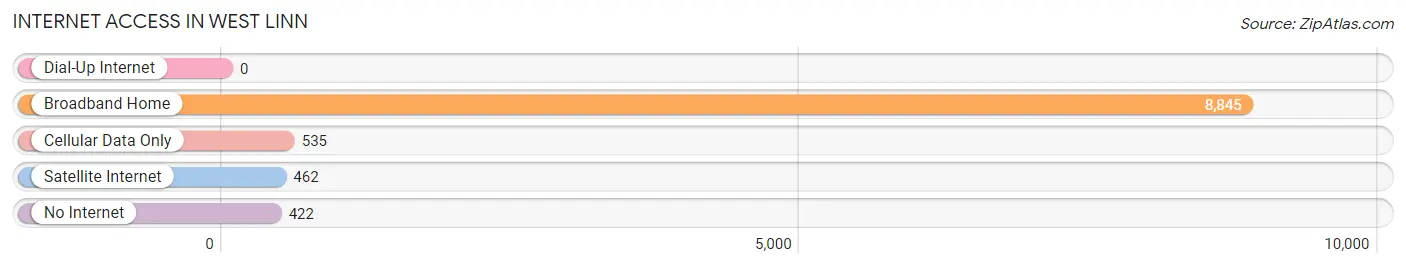
| Internet Type | # Households | % Households |
| Dial-Up Internet | 0 | 0.0% |
| Broadband Home | 8,845 | 88.4% |
| Cellular Data Only | 535 | 5.3% |
| Satellite Internet | 462 | 4.6% |
| No Internet | 422 | 4.2% |
| Total | 10,008 | 100.0% |
West Linn Summary
West Linn, Oregon is a city located in Clackamas County, Oregon, United States. It is located on the Willamette River, just south of Portland. The city has a population of approximately 25,000 people and is part of the Portland metropolitan area.
History
West Linn was founded in 1845 by Robert Moore, a settler from Missouri. Moore named the city after his hometown of West Linn, Missouri. The city was incorporated in 1913 and has since grown to become one of the most affluent suburbs of Portland.
Geography
West Linn is located in Clackamas County, Oregon, on the Willamette River. The city is situated on the west side of the river, just south of Portland. The city has a total area of 8.3 square miles, of which 8.2 square miles is land and 0.1 square miles is water. The city is located in the Tualatin Valley, which is part of the Willamette Valley.
The city is bordered by the cities of Lake Oswego to the north, Oregon City to the south, and Wilsonville to the east. The city is also bordered by the Willamette River to the west.
Economy
West Linn is a primarily residential city, with a strong economy based on the service industry. The city is home to a number of businesses, including banks, restaurants, retail stores, and professional services. The city is also home to a number of technology companies, including Intel, which has a large campus in the city.
The city is also home to a number of educational institutions, including West Linn High School, West Linn-Wilsonville School District, and Clackamas Community College.
Demographics
As of the 2010 census, the population of West Linn was 25,109. The racial makeup of the city was 87.3% White, 4.2% Asian, 2.2% African American, 0.4% Native American, 0.1% Pacific Islander, and 5.8% from other races. The median household income was $90,845, and the median family income was $103,945.
Conclusion
West Linn, Oregon is a city located in Clackamas County, Oregon, United States. It is located on the Willamette River, just south of Portland. The city has a population of approximately 25,000 people and is part of the Portland metropolitan area. The city was founded in 1845 by Robert Moore and has since grown to become one of the most affluent suburbs of Portland. West Linn is a primarily residential city, with a strong economy based on the service industry. The city is home to a number of businesses, including banks, restaurants, retail stores, and professional services. The city is also home to a number of educational institutions, including West Linn High School, West Linn-Wilsonville School District, and Clackamas Community College. As of the 2010 census, the population of West Linn was 25,109. The racial makeup of the city was 87.3% White, 4.2% Asian, 2.2% African American, 0.4% Native American, 0.1% Pacific Islander, and 5.8% from other races. The median household income was $90,845, and the median family income was $103,945.
Common Questions
What is Per Capita Income in West Linn?
Per Capita income in West Linn is $64,714.
What is the Median Family Income in West Linn?
Median Family Income in West Linn is $159,344.
What is the Median Household income in West Linn?
Median Household Income in West Linn is $134,116.
What is Income or Wage Gap in West Linn?
Income or Wage Gap in West Linn is 47.7%.
Women in West Linn earn 52.3 cents for every dollar earned by a man.
What is Family Income Deficit in West Linn?
Family Income Deficit in West Linn is $14,731.
Families that are below poverty line in West Linn earn $14,731 less on average than the poverty threshold level.
What is Inequality or Gini Index in West Linn?
Inequality or Gini Index in West Linn is 0.46.
What is the Total Population of West Linn?
Total Population of West Linn is 27,167.
What is the Total Male Population of West Linn?
Total Male Population of West Linn is 13,526.
What is the Total Female Population of West Linn?
Total Female Population of West Linn is 13,641.
What is the Ratio of Males per 100 Females in West Linn?
There are 99.16 Males per 100 Females in West Linn.
What is the Ratio of Females per 100 Males in West Linn?
There are 100.85 Females per 100 Males in West Linn.
What is the Median Population Age in West Linn?
Median Population Age in West Linn is 44.2 Years.
What is the Average Family Size in West Linn
Average Family Size in West Linn is 3.1 People.
What is the Average Household Size in West Linn
Average Household Size in West Linn is 2.7 People.
How Large is the Labor Force in West Linn?
There are 12,767 People in the Labor Forcein in West Linn.
What is the Percentage of People in the Labor Force in West Linn?
60.0% of People are in the Labor Force in West Linn.
What is the Unemployment Rate in West Linn?
Unemployment Rate in West Linn is 4.7%.