St Helens, OR Map & Demographics
St Helens Map
St Helens Overview
$33,261
PER CAPITA INCOME
$84,753
AVG FAMILY INCOME
$77,475
AVG HOUSEHOLD INCOME
28.3%
WAGE / INCOME GAP [ % ]
71.7¢/ $1
WAGE / INCOME GAP [ $ ]
0.39
INEQUALITY / GINI INDEX
14,015
TOTAL POPULATION
7,259
MALE POPULATION
6,756
FEMALE POPULATION
107.45
MALES / 100 FEMALES
93.07
FEMALES / 100 MALES
36.3
MEDIAN AGE
3.0
AVG FAMILY SIZE
2.6
AVG HOUSEHOLD SIZE
7,201
LABOR FORCE [ PEOPLE ]
64.2%
PERCENT IN LABOR FORCE
4.8%
UNEMPLOYMENT RATE
Income in St Helens
Income Overview in St Helens
Per Capita Income in St Helens is $33,261, while median incomes of families and households are $84,753 and $77,475 respectively.
| Characteristic | Number | Measure |
| Per Capita Income | 14,015 | $33,261 |
| Median Family Income | 3,457 | $84,753 |
| Mean Family Income | 3,457 | $96,891 |
| Median Household Income | 5,172 | $77,475 |
| Mean Household Income | 5,172 | $88,174 |
| Income Deficit | 3,457 | $0 |
| Wage / Income Gap (%) | 14,015 | 28.29% |
| Wage / Income Gap ($) | 14,015 | 71.71¢ per $1 |
| Gini / Inequality Index | 14,015 | 0.39 |
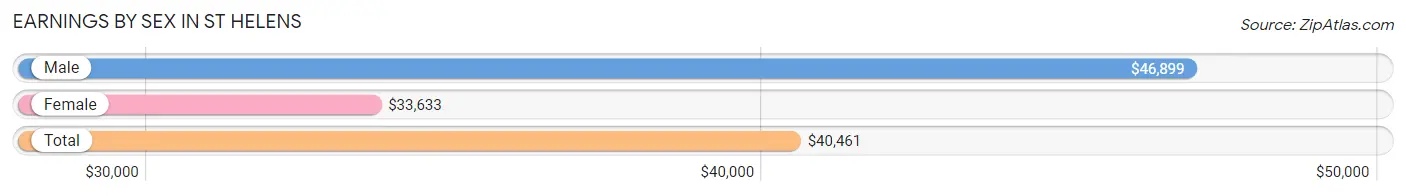
Earnings by Sex in St Helens
Average Earnings in St Helens are $40,461, $46,899 for men and $33,633 for women, a difference of 28.3%.
| Sex | Number | Average Earnings |
| Male | 4,129 (54.9%) | $46,899 |
| Female | 3,393 (45.1%) | $33,633 |
| Total | 7,522 (100.0%) | $40,461 |
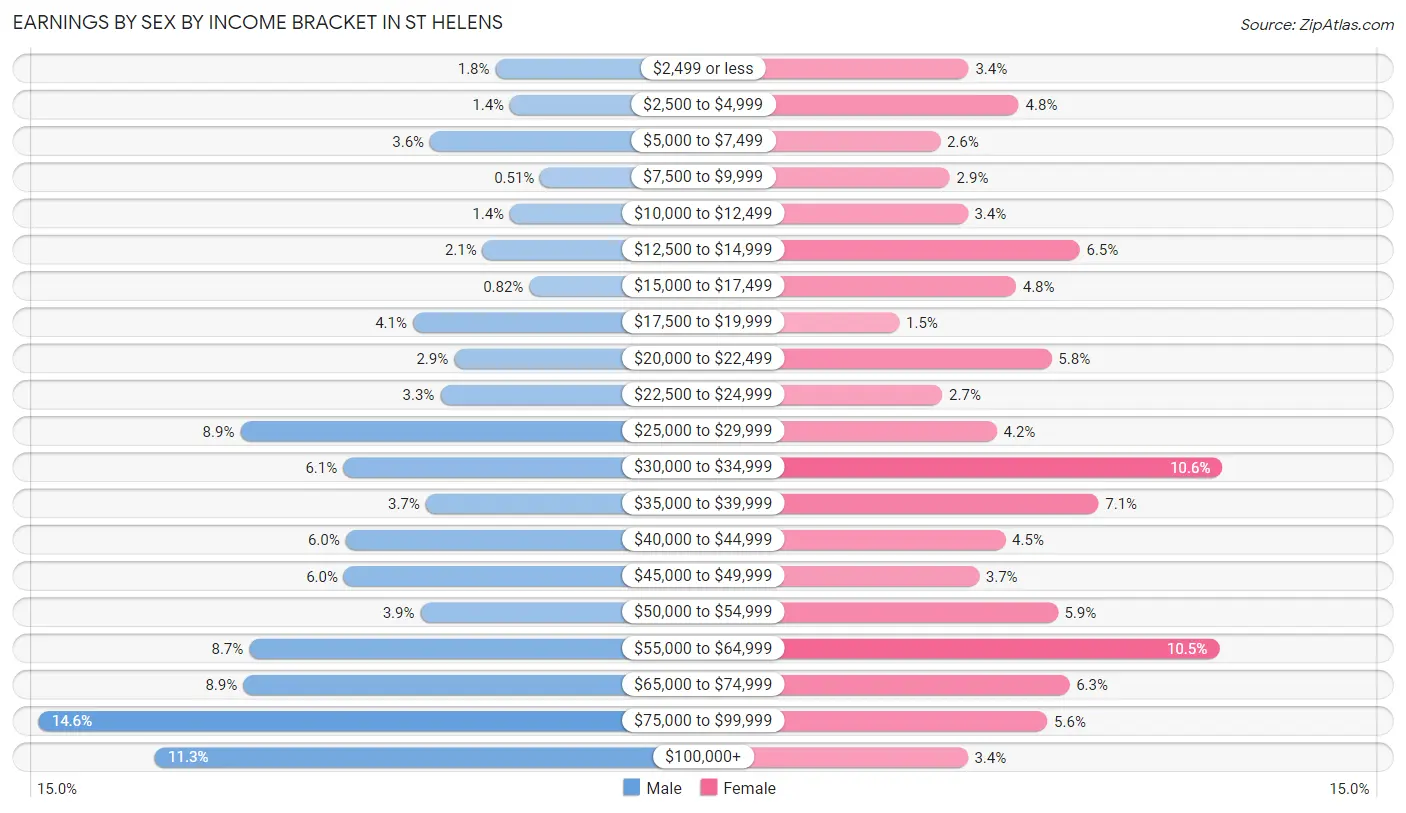
Earnings by Sex by Income Bracket in St Helens
The most common earnings brackets in St Helens are $75,000 to $99,999 for men (603 | 14.6%) and $30,000 to $34,999 for women (358 | 10.5%).
| Income | Male | Female |
| $2,499 or less | 73 (1.8%) | 116 (3.4%) |
| $2,500 to $4,999 | 56 (1.4%) | 164 (4.8%) |
| $5,000 to $7,499 | 149 (3.6%) | 89 (2.6%) |
| $7,500 to $9,999 | 21 (0.5%) | 98 (2.9%) |
| $10,000 to $12,499 | 56 (1.4%) | 115 (3.4%) |
| $12,500 to $14,999 | 88 (2.1%) | 222 (6.5%) |
| $15,000 to $17,499 | 34 (0.8%) | 161 (4.8%) |
| $17,500 to $19,999 | 169 (4.1%) | 50 (1.5%) |
| $20,000 to $22,499 | 121 (2.9%) | 195 (5.8%) |
| $22,500 to $24,999 | 137 (3.3%) | 91 (2.7%) |
| $25,000 to $29,999 | 369 (8.9%) | 143 (4.2%) |
| $30,000 to $34,999 | 250 (6.0%) | 358 (10.5%) |
| $35,000 to $39,999 | 154 (3.7%) | 240 (7.1%) |
| $40,000 to $44,999 | 247 (6.0%) | 151 (4.4%) |
| $45,000 to $49,999 | 249 (6.0%) | 126 (3.7%) |
| $50,000 to $54,999 | 160 (3.9%) | 201 (5.9%) |
| $55,000 to $64,999 | 359 (8.7%) | 355 (10.5%) |
| $65,000 to $74,999 | 366 (8.9%) | 212 (6.2%) |
| $75,000 to $99,999 | 603 (14.6%) | 191 (5.6%) |
| $100,000+ | 468 (11.3%) | 115 (3.4%) |
| Total | 4,129 (100.0%) | 3,393 (100.0%) |
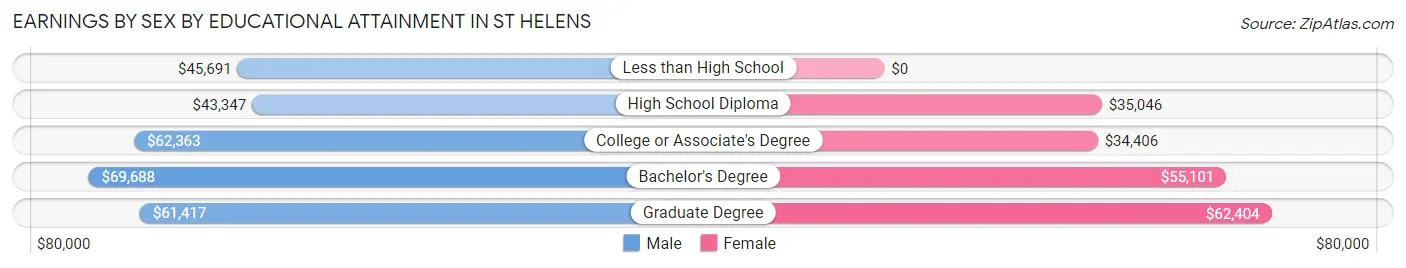
Earnings by Sex by Educational Attainment in St Helens
Average earnings in St Helens are $53,446 for men and $36,717 for women, a difference of 31.3%. Men with an educational attainment of bachelor's degree enjoy the highest average annual earnings of $69,688, while those with high school diploma education earn the least with $43,347. Women with an educational attainment of graduate degree earn the most with the average annual earnings of $62,404, while those with college or associate's degree education have the smallest earnings of $34,406.
| Educational Attainment | Male Income | Female Income |
| Less than High School | $45,691 | $0 |
| High School Diploma | $43,347 | $35,046 |
| College or Associate's Degree | $62,363 | $34,406 |
| Bachelor's Degree | $69,688 | $55,101 |
| Graduate Degree | $61,417 | $62,404 |
| Total | $53,446 | $36,717 |
Family Income in St Helens
Family Income Brackets in St Helens
According to the St Helens family income data, there are 878 families falling into the $100,000 to $149,999 income range, which is the most common income bracket and makes up 25.4% of all families. Conversely, the less than $10,000 income bracket is the least frequent group with only 66 families (1.9%) belonging to this category.
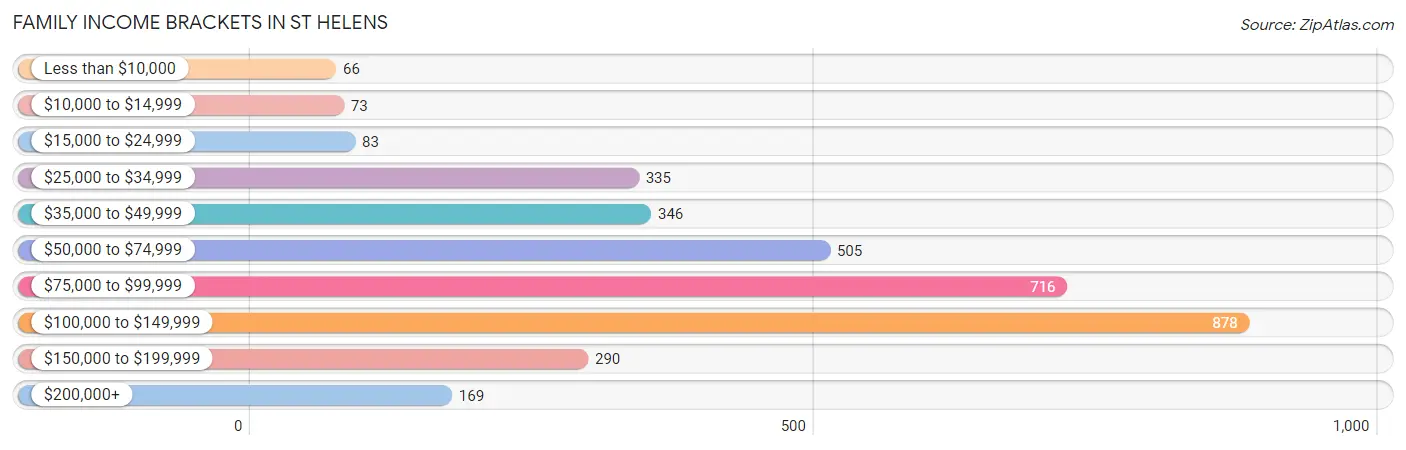
| Income Bracket | # Families | % Families |
| Less than $10,000 | 66 | 1.9% |
| $10,000 to $14,999 | 73 | 2.1% |
| $15,000 to $24,999 | 83 | 2.4% |
| $25,000 to $34,999 | 335 | 9.7% |
| $35,000 to $49,999 | 346 | 10.0% |
| $50,000 to $74,999 | 505 | 14.6% |
| $75,000 to $99,999 | 716 | 20.7% |
| $100,000 to $149,999 | 878 | 25.4% |
| $150,000 to $199,999 | 290 | 8.4% |
| $200,000+ | 169 | 4.9% |
Family Income by Famaliy Size in St Helens
4-person families (634 | 18.3%) account for the highest median family income in St Helens with $105,224 per family, while 2-person families (1,439 | 41.6%) have the highest median income of $40,172 per family member.
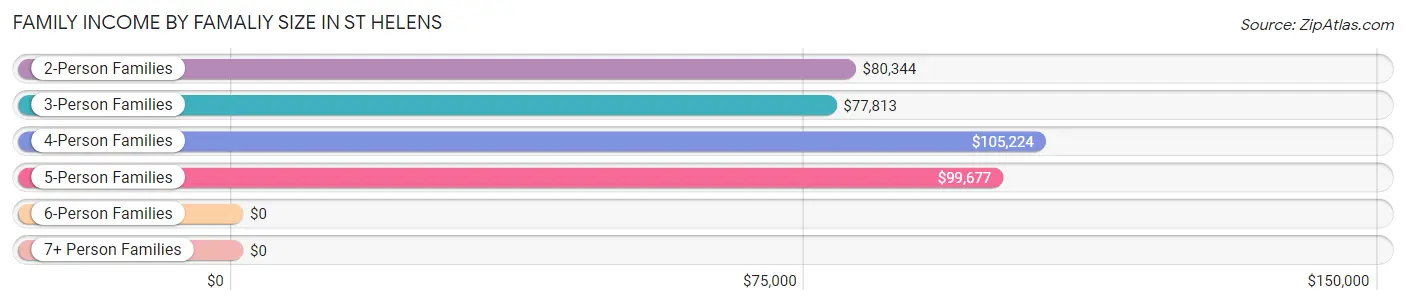
| Income Bracket | # Families | Median Income |
| 2-Person Families | 1,439 (41.6%) | $80,344 |
| 3-Person Families | 1,144 (33.1%) | $77,813 |
| 4-Person Families | 634 (18.3%) | $105,224 |
| 5-Person Families | 124 (3.6%) | $99,677 |
| 6-Person Families | 22 (0.6%) | $0 |
| 7+ Person Families | 94 (2.7%) | $0 |
| Total | 3,457 (100.0%) | $84,753 |
Family Income by Number of Earners in St Helens
The median family income in St Helens is $84,753, with families comprising 3+ earners (391) having the highest median family income of $119,729, while families with no earners (491) have the lowest median family income of $32,659, accounting for 11.3% and 14.2% of families, respectively.
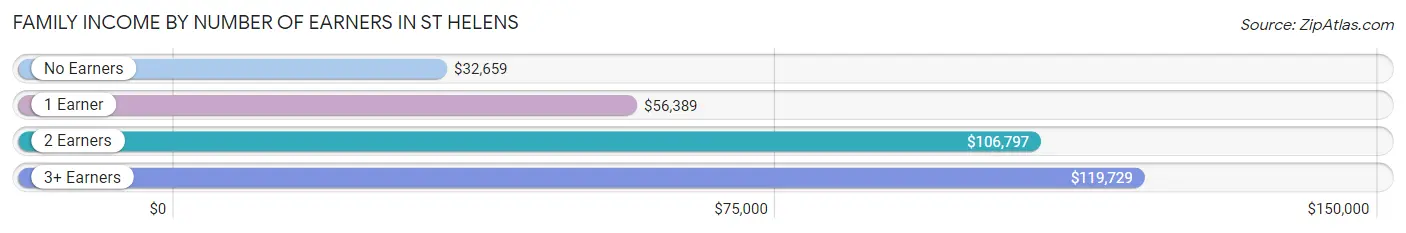
| Number of Earners | # Families | Median Income |
| No Earners | 491 (14.2%) | $32,659 |
| 1 Earner | 1,174 (34.0%) | $56,389 |
| 2 Earners | 1,401 (40.5%) | $106,797 |
| 3+ Earners | 391 (11.3%) | $119,729 |
| Total | 3,457 (100.0%) | $84,753 |
Household Income in St Helens
Household Income Brackets in St Helens
With 1,117 households falling in the category, the $100,000 to $149,999 income range is the most frequent in St Helens, accounting for 21.6% of all households. In contrast, only 124 households (2.4%) fall into the less than $10,000 income bracket, making it the least populous group.
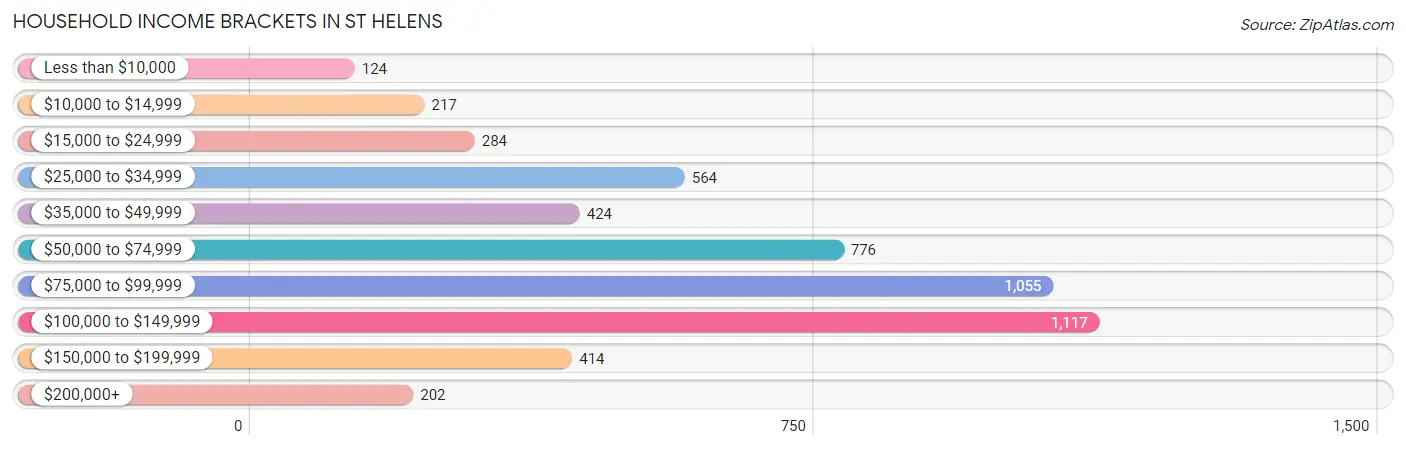
| Income Bracket | # Households | % Households |
| Less than $10,000 | 124 | 2.4% |
| $10,000 to $14,999 | 217 | 4.2% |
| $15,000 to $24,999 | 284 | 5.5% |
| $25,000 to $34,999 | 564 | 10.9% |
| $35,000 to $49,999 | 424 | 8.2% |
| $50,000 to $74,999 | 776 | 15.0% |
| $75,000 to $99,999 | 1,055 | 20.4% |
| $100,000 to $149,999 | 1,117 | 21.6% |
| $150,000 to $199,999 | 414 | 8.0% |
| $200,000+ | 202 | 3.9% |
Household Income by Householder Age in St Helens
The median household income in St Helens is $77,475, with the highest median household income of $89,458 found in the 15 to 24 years age bracket for the primary householder. A total of 225 households (4.3%) fall into this category. Meanwhile, the 65+ years age bracket for the primary householder has the lowest median household income of $49,816, with 1,061 households (20.5%) in this group.
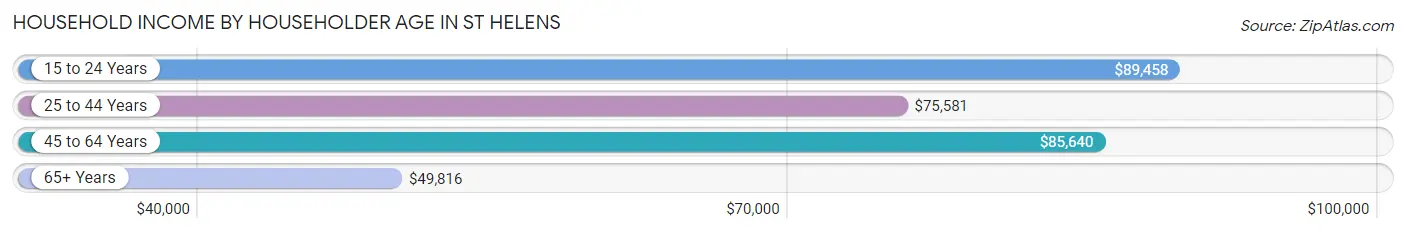
| Income Bracket | # Households | Median Income |
| 15 to 24 Years | 225 (4.3%) | $89,458 |
| 25 to 44 Years | 1,808 (35.0%) | $75,581 |
| 45 to 64 Years | 2,078 (40.2%) | $85,640 |
| 65+ Years | 1,061 (20.5%) | $49,816 |
| Total | 5,172 (100.0%) | $77,475 |
Poverty in St Helens
Income Below Poverty by Sex and Age in St Helens
With 7.4% poverty level for males and 13.0% for females among the residents of St Helens, 16 and 17 year old males and 18 to 24 year old females are the most vulnerable to poverty, with 71 males (36.0%) and 139 females (25.0%) in their respective age groups living below the poverty level.
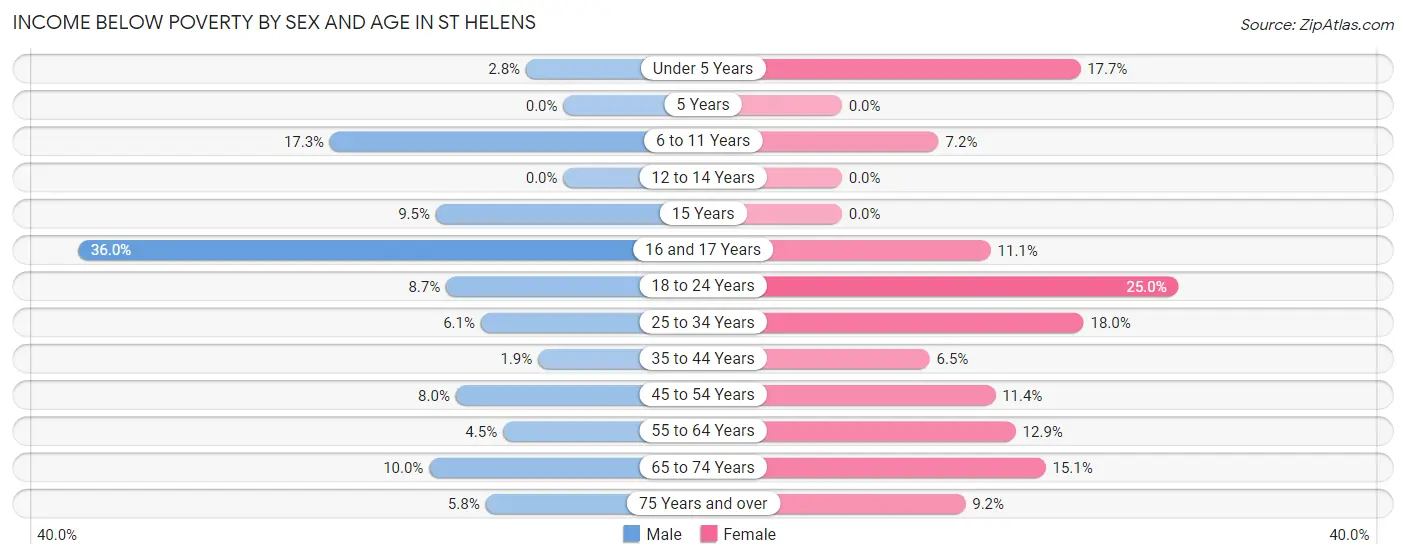
| Age Bracket | Male | Female |
| Under 5 Years | 16 (2.8%) | 57 (17.7%) |
| 5 Years | 0 (0.0%) | 0 (0.0%) |
| 6 to 11 Years | 96 (17.3%) | 24 (7.2%) |
| 12 to 14 Years | 0 (0.0%) | 0 (0.0%) |
| 15 Years | 9 (9.5%) | 0 (0.0%) |
| 16 and 17 Years | 71 (36.0%) | 20 (11.1%) |
| 18 to 24 Years | 64 (8.7%) | 139 (25.0%) |
| 25 to 34 Years | 70 (6.1%) | 203 (17.9%) |
| 35 to 44 Years | 15 (1.9%) | 53 (6.5%) |
| 45 to 54 Years | 65 (8.0%) | 73 (11.4%) |
| 55 to 64 Years | 38 (4.5%) | 155 (12.9%) |
| 65 to 74 Years | 54 (10.0%) | 87 (15.1%) |
| 75 Years and over | 16 (5.8%) | 50 (9.2%) |
| Total | 514 (7.4%) | 861 (13.0%) |
Income Above Poverty by Sex and Age in St Helens
According to the poverty statistics in St Helens, males aged 5 years and females aged 5 years are the age groups that are most secure financially, with 100.0% of males and 100.0% of females in these age groups living above the poverty line.
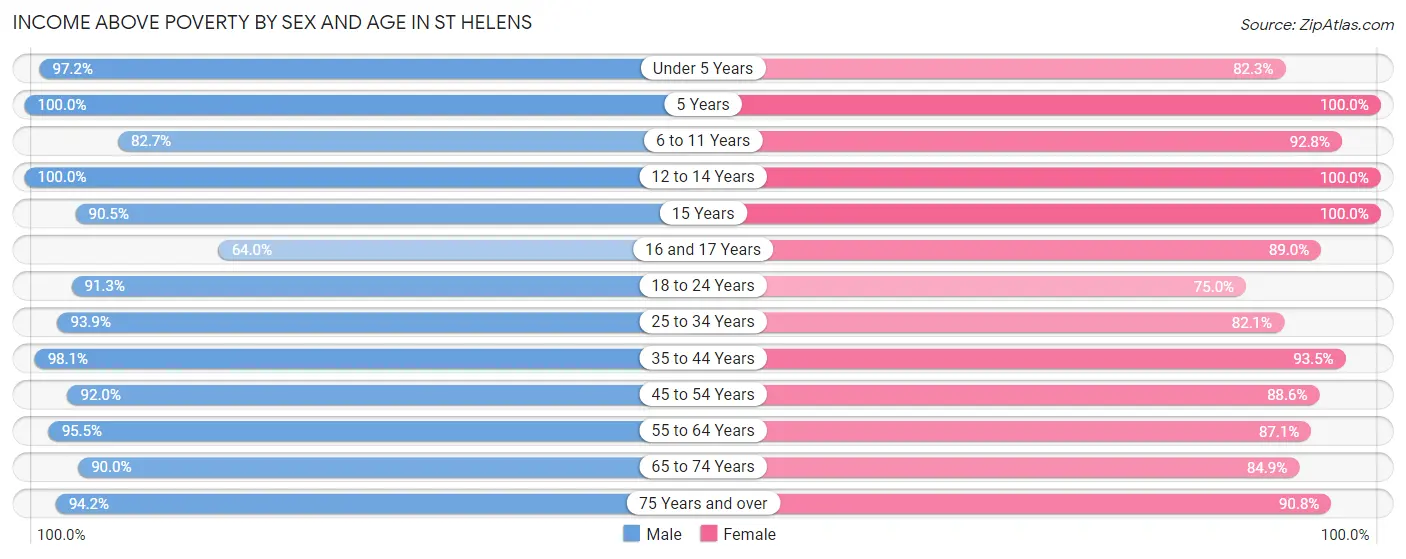
| Age Bracket | Male | Female |
| Under 5 Years | 559 (97.2%) | 265 (82.3%) |
| 5 Years | 118 (100.0%) | 26 (100.0%) |
| 6 to 11 Years | 458 (82.7%) | 310 (92.8%) |
| 12 to 14 Years | 261 (100.0%) | 184 (100.0%) |
| 15 Years | 86 (90.5%) | 140 (100.0%) |
| 16 and 17 Years | 126 (64.0%) | 161 (88.9%) |
| 18 to 24 Years | 671 (91.3%) | 417 (75.0%) |
| 25 to 34 Years | 1,071 (93.9%) | 928 (82.1%) |
| 35 to 44 Years | 783 (98.1%) | 760 (93.5%) |
| 45 to 54 Years | 749 (92.0%) | 568 (88.6%) |
| 55 to 64 Years | 810 (95.5%) | 1,046 (87.1%) |
| 65 to 74 Years | 488 (90.0%) | 488 (84.9%) |
| 75 Years and over | 261 (94.2%) | 495 (90.8%) |
| Total | 6,441 (92.6%) | 5,788 (87.1%) |
Income Below Poverty Among Married-Couple Families in St Helens
The poverty statistics for married-couple families in St Helens show that 1.8% or 42 of the total 2,302 families live below the poverty line. Families with no children have the highest poverty rate of 2.3%, comprising of 30 families. On the other hand, families with 3 or 4 children have the lowest poverty rate of 0.0%, which includes 0 families.
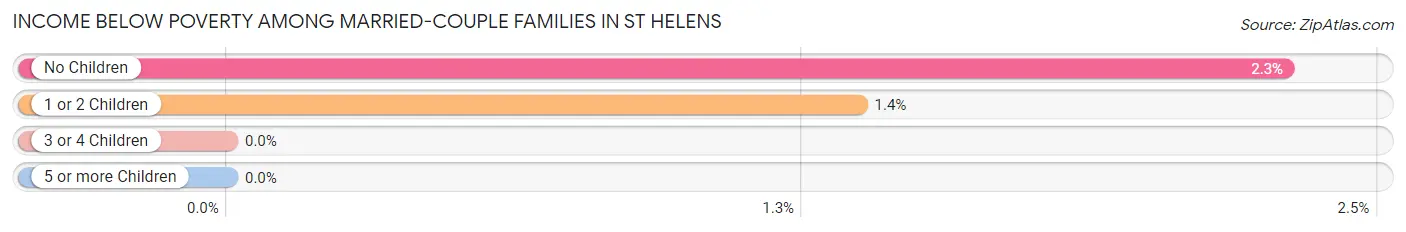
| Children | Above Poverty | Below Poverty |
| No Children | 1,274 (97.7%) | 30 (2.3%) |
| 1 or 2 Children | 862 (98.6%) | 12 (1.4%) |
| 3 or 4 Children | 108 (100.0%) | 0 (0.0%) |
| 5 or more Children | 16 (100.0%) | 0 (0.0%) |
| Total | 2,260 (98.2%) | 42 (1.8%) |
Income Below Poverty Among Single-Parent Households in St Helens
According to the poverty data in St Helens, 4.0% or 15 single-father households and 17.2% or 135 single-mother households are living below the poverty line. Among single-father households, those with no children have the highest poverty rate, with 15 households (13.8%) experiencing poverty. Likewise, among single-mother households, those with 1 or 2 children have the highest poverty rate, with 135 households (25.6%) falling below the poverty line.
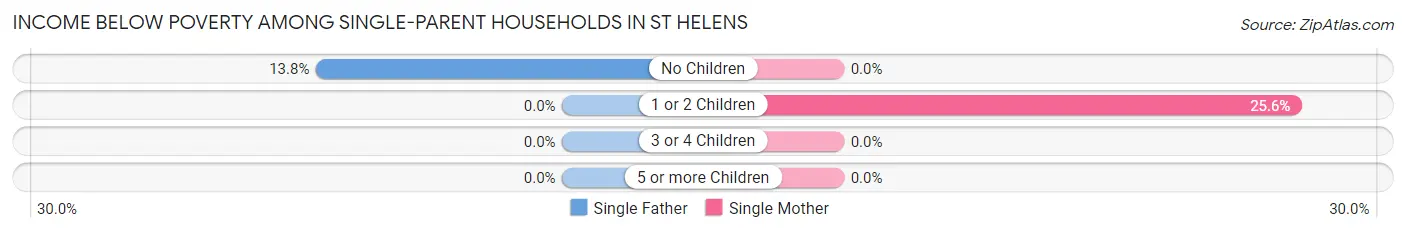
| Children | Single Father | Single Mother |
| No Children | 15 (13.8%) | 0 (0.0%) |
| 1 or 2 Children | 0 (0.0%) | 135 (25.6%) |
| 3 or 4 Children | 0 (0.0%) | 0 (0.0%) |
| 5 or more Children | 0 (0.0%) | 0 (0.0%) |
| Total | 15 (4.0%) | 135 (17.2%) |
Income Below Poverty Among Married-Couple vs Single-Parent Households in St Helens
The poverty data for St Helens shows that 42 of the married-couple family households (1.8%) and 150 of the single-parent households (13.0%) are living below the poverty level. Within the married-couple family households, those with no children have the highest poverty rate, with 30 households (2.3%) falling below the poverty line. Among the single-parent households, those with 1 or 2 children have the highest poverty rate, with 135 household (18.1%) living below poverty.
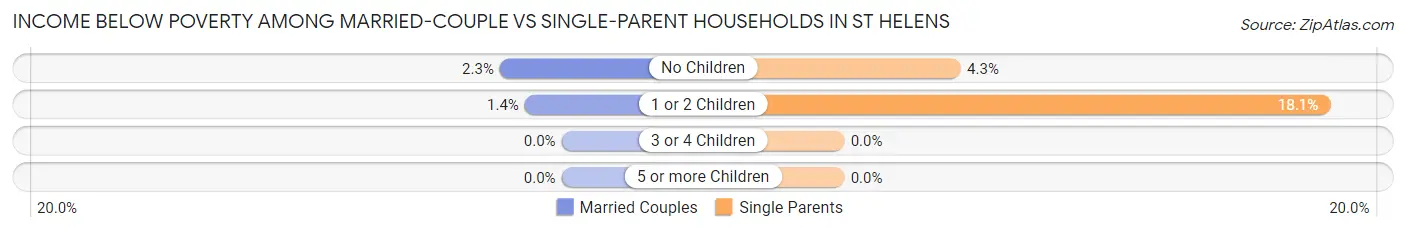
| Children | Married-Couple Families | Single-Parent Households |
| No Children | 30 (2.3%) | 15 (4.3%) |
| 1 or 2 Children | 12 (1.4%) | 135 (18.1%) |
| 3 or 4 Children | 0 (0.0%) | 0 (0.0%) |
| 5 or more Children | 0 (0.0%) | 0 (0.0%) |
| Total | 42 (1.8%) | 150 (13.0%) |
Race in St Helens
The most populous races in St Helens are White / Caucasian (11,827 | 84.4%), Two or more Races (1,866 | 13.3%), and Hispanic or Latino (1,464 | 10.4%).
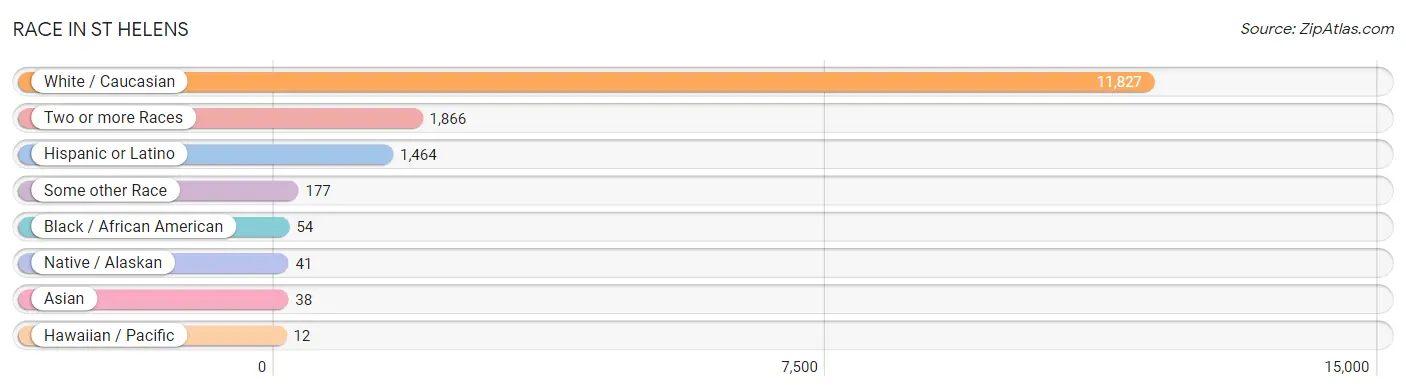
| Race | # Population | % Population |
| Asian | 38 | 0.3% |
| Black / African American | 54 | 0.4% |
| Hawaiian / Pacific | 12 | 0.1% |
| Hispanic or Latino | 1,464 | 10.4% |
| Native / Alaskan | 41 | 0.3% |
| White / Caucasian | 11,827 | 84.4% |
| Two or more Races | 1,866 | 13.3% |
| Some other Race | 177 | 1.3% |
| Total | 14,015 | 100.0% |
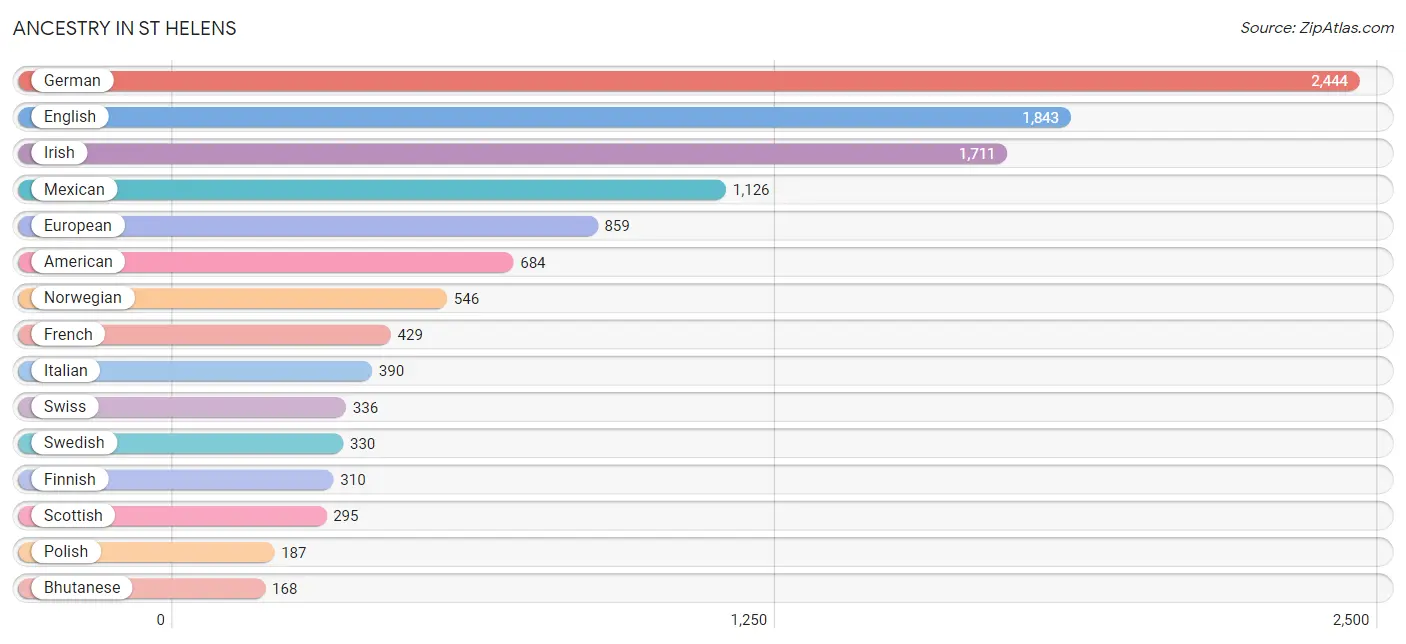
Ancestry in St Helens
The most populous ancestries reported in St Helens are German (2,444 | 17.4%), English (1,843 | 13.2%), Irish (1,711 | 12.2%), Mexican (1,126 | 8.0%), and European (859 | 6.1%), together accounting for 57.0% of all St Helens residents.
| Ancestry | # Population | % Population |
| American | 684 | 4.9% |
| Arab | 7 | 0.1% |
| Austrian | 23 | 0.2% |
| Belgian | 22 | 0.2% |
| Bhutanese | 168 | 1.2% |
| Brazilian | 12 | 0.1% |
| British | 17 | 0.1% |
| Burmese | 80 | 0.6% |
| Canadian | 61 | 0.4% |
| Central American | 138 | 1.0% |
| Cherokee | 68 | 0.5% |
| Chickasaw | 12 | 0.1% |
| Chilean | 16 | 0.1% |
| Cuban | 37 | 0.3% |
| Czech | 16 | 0.1% |
| Danish | 62 | 0.4% |
| Dutch | 144 | 1.0% |
| Eastern European | 17 | 0.1% |
| Ecuadorian | 7 | 0.1% |
| English | 1,843 | 13.2% |
| European | 859 | 6.1% |
| Finnish | 310 | 2.2% |
| French | 429 | 3.1% |
| French Canadian | 39 | 0.3% |
| German | 2,444 | 17.4% |
| Honduran | 36 | 0.3% |
| Indian (Asian) | 53 | 0.4% |
| Irish | 1,711 | 12.2% |
| Italian | 390 | 2.8% |
| Korean | 124 | 0.9% |
| Lithuanian | 13 | 0.1% |
| Malaysian | 26 | 0.2% |
| Mexican | 1,126 | 8.0% |
| Mexican American Indian | 7 | 0.1% |
| Native Hawaiian | 22 | 0.2% |
| Nicaraguan | 102 | 0.7% |
| Northern European | 40 | 0.3% |
| Norwegian | 546 | 3.9% |
| Pakistani | 8 | 0.1% |
| Palestinian | 7 | 0.1% |
| Polish | 187 | 1.3% |
| Portuguese | 9 | 0.1% |
| Potawatomi | 5 | 0.0% |
| Puerto Rican | 74 | 0.5% |
| Russian | 67 | 0.5% |
| Scandinavian | 134 | 1.0% |
| Scotch-Irish | 79 | 0.6% |
| Scottish | 295 | 2.1% |
| Sioux | 25 | 0.2% |
| South African | 4 | 0.0% |
| South American | 23 | 0.2% |
| Spanish | 66 | 0.5% |
| Subsaharan African | 4 | 0.0% |
| Swedish | 330 | 2.4% |
| Swiss | 336 | 2.4% |
| Thai | 21 | 0.2% |
| Welsh | 68 | 0.5% |
| Yakama | 8 | 0.1% |
| Yaqui | 35 | 0.3% |
| Yugoslavian | 29 | 0.2% | View All 60 Rows |
Immigrants in St Helens
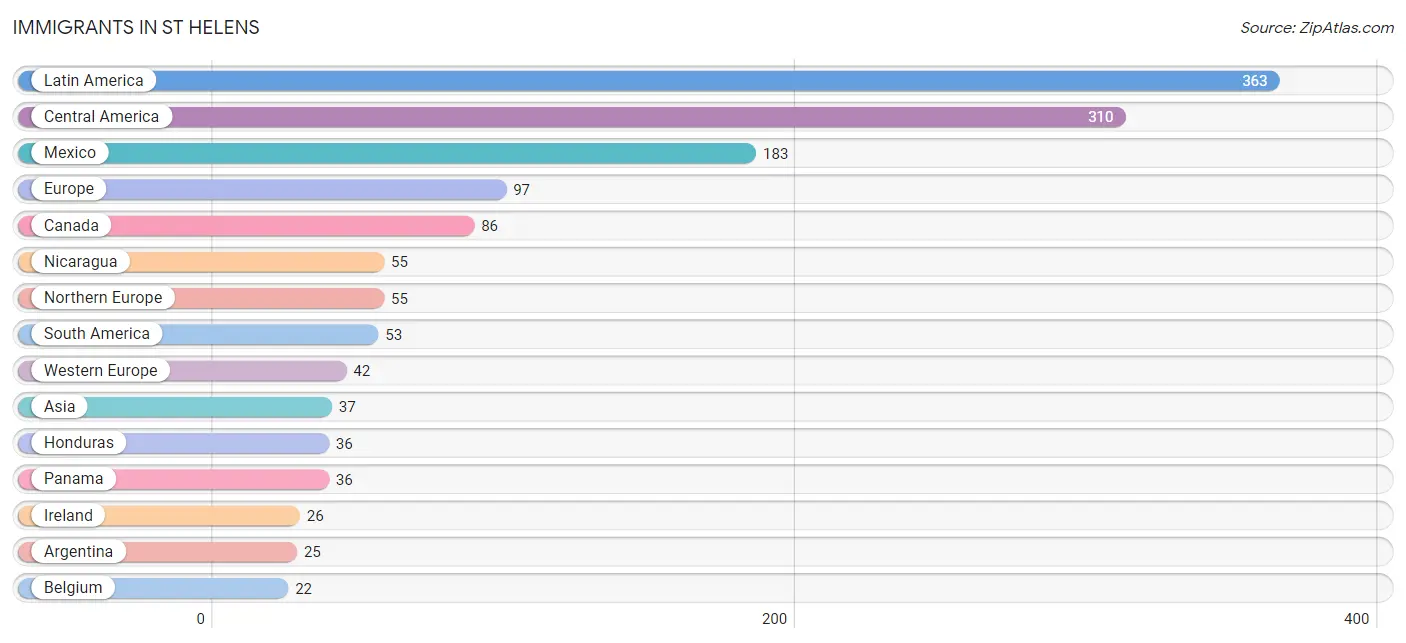
The most numerous immigrant groups reported in St Helens came from Latin America (363 | 2.6%), Central America (310 | 2.2%), Mexico (183 | 1.3%), Europe (97 | 0.7%), and Canada (86 | 0.6%), together accounting for 7.4% of all St Helens residents.
| Immigration Origin | # Population | % Population |
| Africa | 4 | 0.0% |
| Argentina | 25 | 0.2% |
| Asia | 37 | 0.3% |
| Belgium | 22 | 0.2% |
| Brazil | 12 | 0.1% |
| Canada | 86 | 0.6% |
| Central America | 310 | 2.2% |
| Chile | 16 | 0.1% |
| Europe | 97 | 0.7% |
| Fiji | 6 | 0.0% |
| Germany | 20 | 0.1% |
| Honduras | 36 | 0.3% |
| India | 17 | 0.1% |
| Ireland | 26 | 0.2% |
| Latin America | 363 | 2.6% |
| Mexico | 183 | 1.3% |
| Nicaragua | 55 | 0.4% |
| Northern Europe | 55 | 0.4% |
| Oceania | 6 | 0.0% |
| Panama | 36 | 0.3% |
| Philippines | 20 | 0.1% |
| South Africa | 4 | 0.0% |
| South America | 53 | 0.4% |
| South Central Asia | 17 | 0.1% |
| South Eastern Asia | 20 | 0.1% |
| Western Europe | 42 | 0.3% | View All 26 Rows |
Sex and Age in St Helens
Sex and Age in St Helens
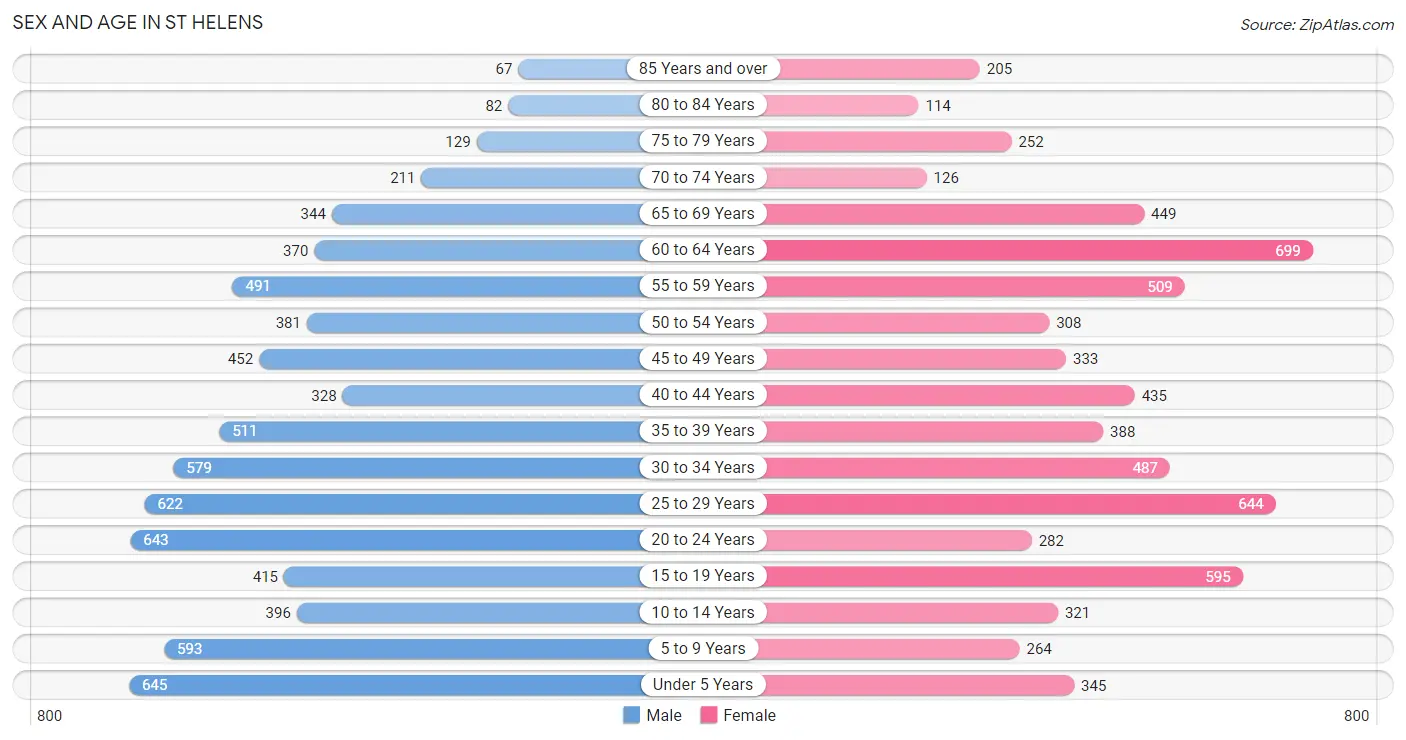
The most populous age groups in St Helens are Under 5 Years (645 | 8.9%) for men and 60 to 64 Years (699 | 10.3%) for women.
| Age Bracket | Male | Female |
| Under 5 Years | 645 (8.9%) | 345 (5.1%) |
| 5 to 9 Years | 593 (8.2%) | 264 (3.9%) |
| 10 to 14 Years | 396 (5.5%) | 321 (4.8%) |
| 15 to 19 Years | 415 (5.7%) | 595 (8.8%) |
| 20 to 24 Years | 643 (8.9%) | 282 (4.2%) |
| 25 to 29 Years | 622 (8.6%) | 644 (9.5%) |
| 30 to 34 Years | 579 (8.0%) | 487 (7.2%) |
| 35 to 39 Years | 511 (7.0%) | 388 (5.7%) |
| 40 to 44 Years | 328 (4.5%) | 435 (6.4%) |
| 45 to 49 Years | 452 (6.2%) | 333 (4.9%) |
| 50 to 54 Years | 381 (5.2%) | 308 (4.6%) |
| 55 to 59 Years | 491 (6.8%) | 509 (7.5%) |
| 60 to 64 Years | 370 (5.1%) | 699 (10.3%) |
| 65 to 69 Years | 344 (4.7%) | 449 (6.7%) |
| 70 to 74 Years | 211 (2.9%) | 126 (1.9%) |
| 75 to 79 Years | 129 (1.8%) | 252 (3.7%) |
| 80 to 84 Years | 82 (1.1%) | 114 (1.7%) |
| 85 Years and over | 67 (0.9%) | 205 (3.0%) |
| Total | 7,259 (100.0%) | 6,756 (100.0%) |
Families and Households in St Helens
Median Family Size in St Helens
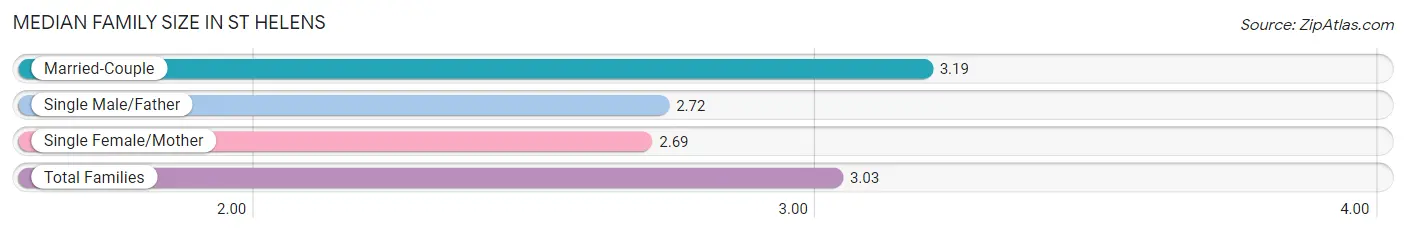
The median family size in St Helens is 3.03 persons per family, with married-couple families (2,302 | 66.6%) accounting for the largest median family size of 3.19 persons per family. On the other hand, single female/mother families (783 | 22.7%) represent the smallest median family size with 2.69 persons per family.
| Family Type | # Families | Family Size |
| Married-Couple | 2,302 (66.6%) | 3.19 |
| Single Male/Father | 372 (10.8%) | 2.72 |
| Single Female/Mother | 783 (22.7%) | 2.69 |
| Total Families | 3,457 (100.0%) | 3.03 |
Median Household Size in St Helens
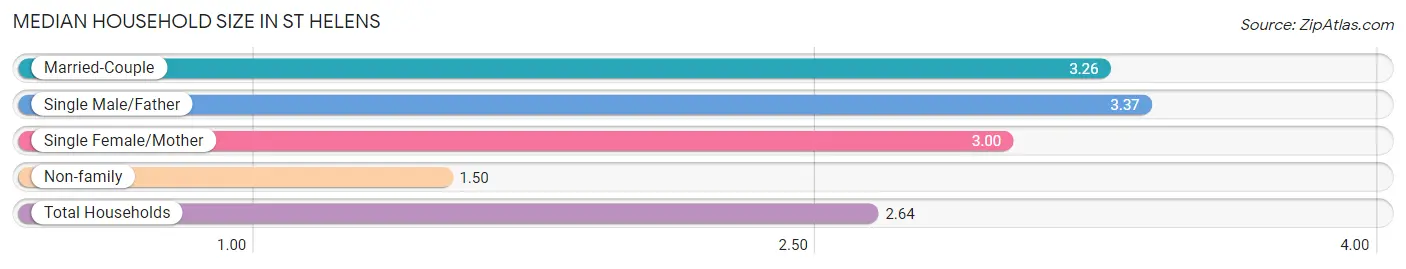
The median household size in St Helens is 2.64 persons per household, with single male/father households (372 | 7.2%) accounting for the largest median household size of 3.37 persons per household. non-family households (1,715 | 33.2%) represent the smallest median household size with 1.50 persons per household.
| Household Type | # Households | Household Size |
| Married-Couple | 2,302 (44.5%) | 3.26 |
| Single Male/Father | 372 (7.2%) | 3.37 |
| Single Female/Mother | 783 (15.1%) | 3.00 |
| Non-family | 1,715 (33.2%) | 1.50 |
| Total Households | 5,172 (100.0%) | 2.64 |
Household Size by Marriage Status in St Helens
Out of a total of 5,172 households in St Helens, 3,457 (66.8%) are family households, while 1,715 (33.2%) are nonfamily households. The most numerous type of family households are 2-person households, comprising 1,316, and the most common type of nonfamily households are 1-person households, comprising 1,084.
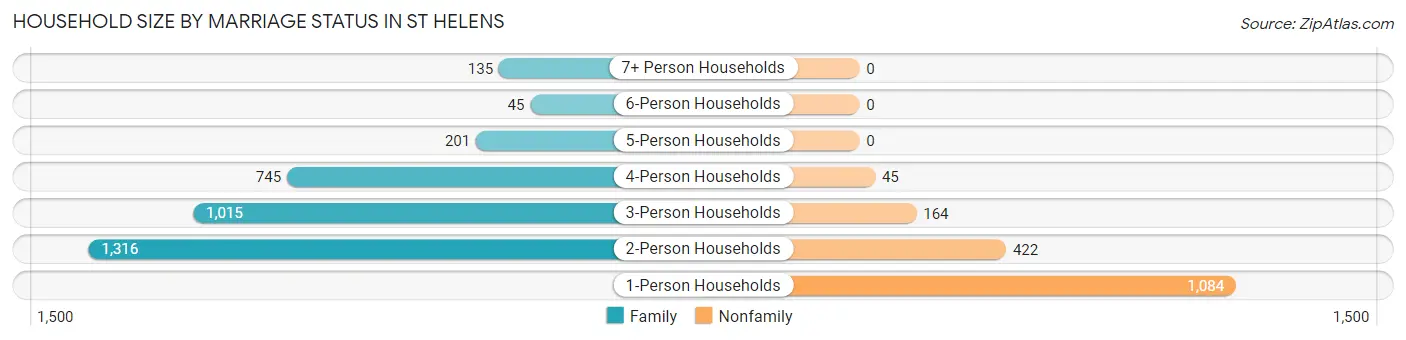
| Household Size | Family Households | Nonfamily Households |
| 1-Person Households | - | 1,084 (21.0%) |
| 2-Person Households | 1,316 (25.4%) | 422 (8.2%) |
| 3-Person Households | 1,015 (19.6%) | 164 (3.2%) |
| 4-Person Households | 745 (14.4%) | 45 (0.9%) |
| 5-Person Households | 201 (3.9%) | 0 (0.0%) |
| 6-Person Households | 45 (0.9%) | 0 (0.0%) |
| 7+ Person Households | 135 (2.6%) | 0 (0.0%) |
| Total | 3,457 (66.8%) | 1,715 (33.2%) |
Female Fertility in St Helens
Fertility by Age in St Helens
Average fertility rate in St Helens is 76.0 births per 1,000 women. Women in the age bracket of 20 to 34 years have the highest fertility rate with 96.0 births per 1,000 women. Women in the age bracket of 20 to 34 years acount for 56.2% of all women with births.
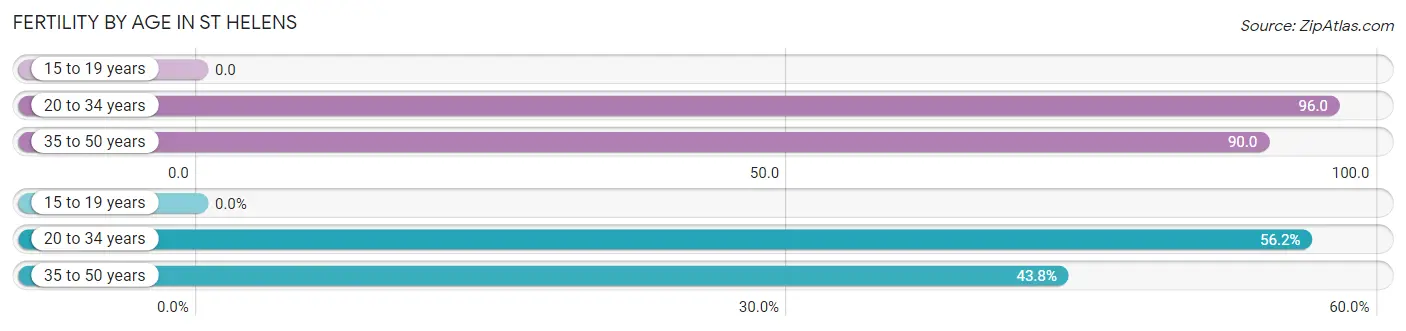
| Age Bracket | Women with Births | Births / 1,000 Women |
| 15 to 19 years | 0 (0.0%) | 0.0 |
| 20 to 34 years | 136 (56.2%) | 96.0 |
| 35 to 50 years | 106 (43.8%) | 90.0 |
| Total | 242 (100.0%) | 76.0 |
Fertility by Age by Marriage Status in St Helens
75.2% of women with births (242) in St Helens are married. The highest percentage of unmarried women with births falls into 20 to 34 years age bracket with 44.1% of them unmarried at the time of birth, while the lowest percentage of unmarried women with births belong to 35 to 50 years age bracket with 0.0% of them unmarried.
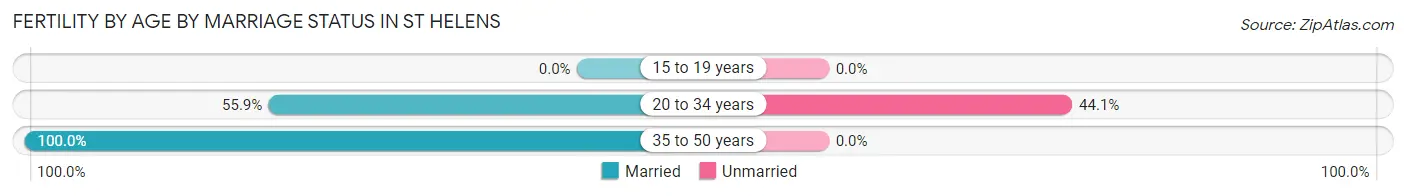
| Age Bracket | Married | Unmarried |
| 15 to 19 years | 0 (0.0%) | 0 (0.0%) |
| 20 to 34 years | 76 (55.9%) | 60 (44.1%) |
| 35 to 50 years | 106 (100.0%) | 0 (0.0%) |
| Total | 182 (75.2%) | 60 (24.8%) |
Fertility by Education in St Helens
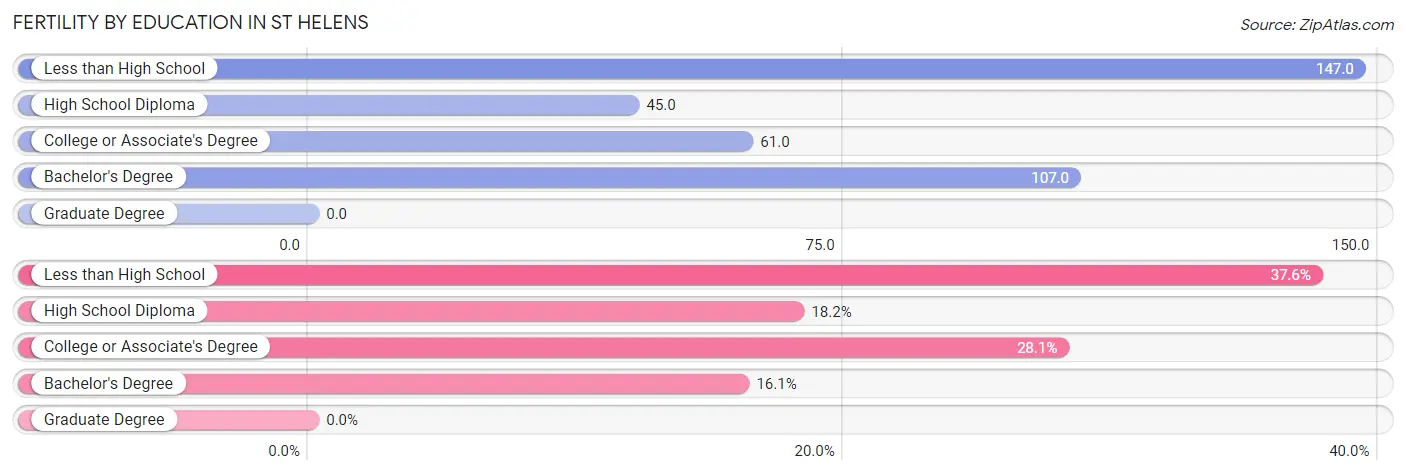
| Educational Attainment | Women with Births | Births / 1,000 Women |
| Less than High School | 91 (37.6%) | 147.0 |
| High School Diploma | 44 (18.2%) | 45.0 |
| College or Associate's Degree | 68 (28.1%) | 61.0 |
| Bachelor's Degree | 39 (16.1%) | 107.0 |
| Graduate Degree | 0 (0.0%) | 0.0 |
| Total | 242 (100.0%) | 76.0 |
Fertility by Education by Marriage Status in St Helens
24.8% of women with births in St Helens are unmarried. Women with the educational attainment of less than high school are most likely to be married with 100.0% of them married at childbirth, while women with the educational attainment of college or associate's degree are least likely to be married with 69.1% of them unmarried at childbirth.
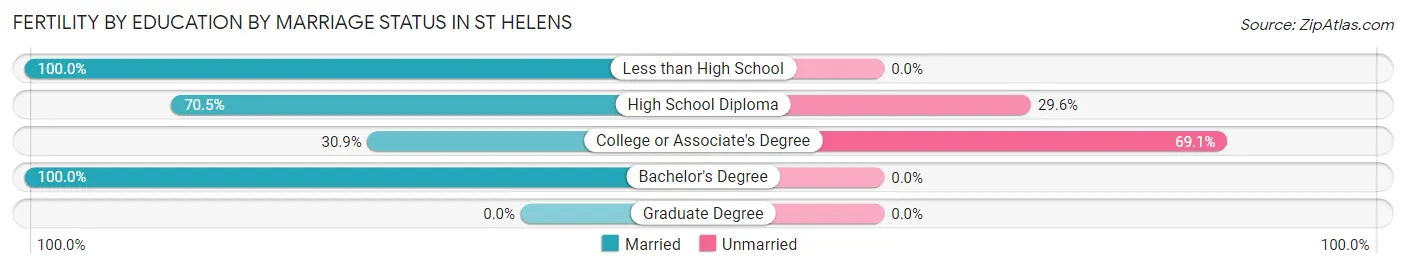
| Educational Attainment | Married | Unmarried |
| Less than High School | 91 (100.0%) | 0 (0.0%) |
| High School Diploma | 31 (70.5%) | 13 (29.5%) |
| College or Associate's Degree | 21 (30.9%) | 47 (69.1%) |
| Bachelor's Degree | 39 (100.0%) | 0 (0.0%) |
| Graduate Degree | 0 (0.0%) | 0 (0.0%) |
| Total | 182 (75.2%) | 60 (24.8%) |
Employment Characteristics in St Helens
Employment by Class of Employer in St Helens
Among the 6,735 employed individuals in St Helens, private company employees (5,121 | 76.0%), not-for-profit organizations (563 | 8.4%), and self-employed (not incorporated) (353 | 5.2%) make up the most common classes of employment.
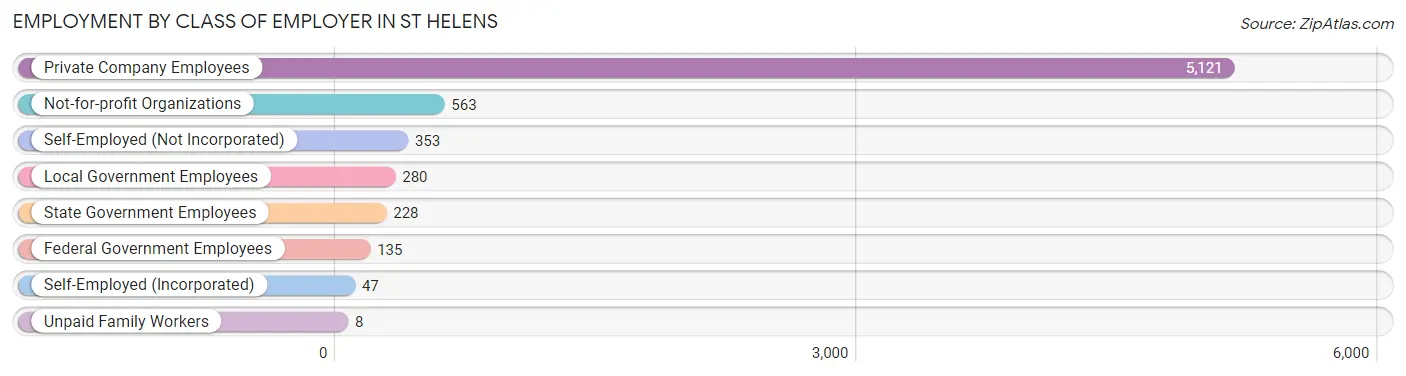
| Employer Class | # Employees | % Employees |
| Private Company Employees | 5,121 | 76.0% |
| Self-Employed (Incorporated) | 47 | 0.7% |
| Self-Employed (Not Incorporated) | 353 | 5.2% |
| Not-for-profit Organizations | 563 | 8.4% |
| Local Government Employees | 280 | 4.2% |
| State Government Employees | 228 | 3.4% |
| Federal Government Employees | 135 | 2.0% |
| Unpaid Family Workers | 8 | 0.1% |
| Total | 6,735 | 100.0% |
Employment Status by Age in St Helens
According to the labor force statistics for St Helens, out of the total population over 16 years of age (11,216), 64.2% or 7,201 individuals are in the labor force, with 4.8% or 346 of them unemployed. The age group with the highest labor force participation rate is 20 to 24 years, with 88.1% or 815 individuals in the labor force. Within the labor force, the 16 to 19 years age range has the highest percentage of unemployed individuals, with 26.6% or 76 of them being unemployed.
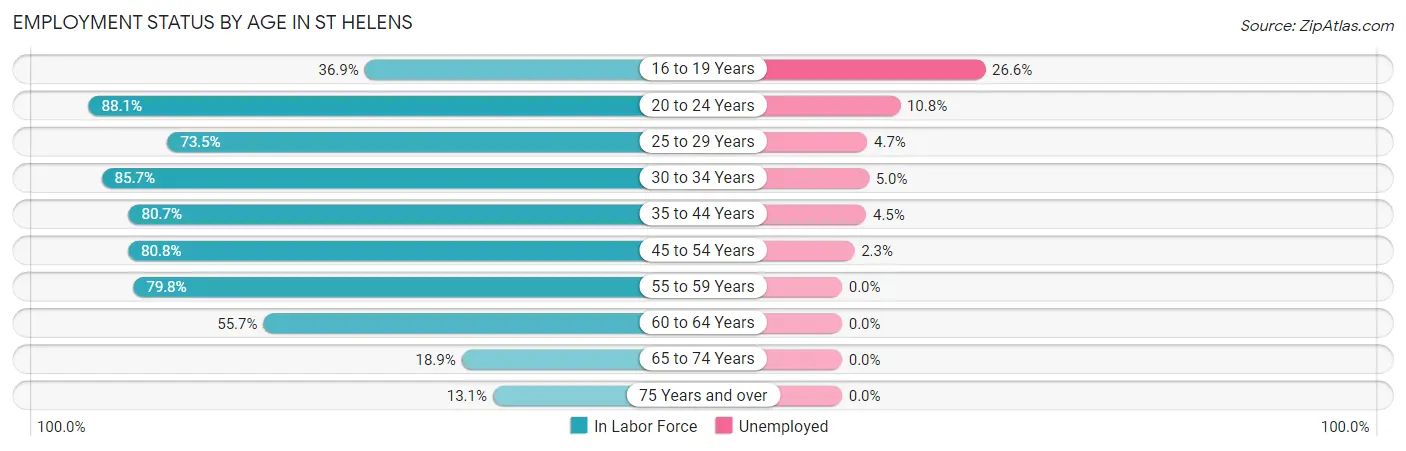
| Age Bracket | In Labor Force | Unemployed |
| 16 to 19 Years | 286 (36.9%) | 76 (26.6%) |
| 20 to 24 Years | 815 (88.1%) | 88 (10.8%) |
| 25 to 29 Years | 931 (73.5%) | 44 (4.7%) |
| 30 to 34 Years | 914 (85.7%) | 46 (5.0%) |
| 35 to 44 Years | 1,341 (80.7%) | 60 (4.5%) |
| 45 to 54 Years | 1,191 (80.8%) | 27 (2.3%) |
| 55 to 59 Years | 798 (79.8%) | 0 (0.0%) |
| 60 to 64 Years | 595 (55.7%) | 0 (0.0%) |
| 65 to 74 Years | 214 (18.9%) | 0 (0.0%) |
| 75 Years and over | 111 (13.1%) | 0 (0.0%) |
| Total | 7,201 (64.2%) | 346 (4.8%) |
Employment Status by Educational Attainment in St Helens
According to labor force statistics for St Helens, 76.6% of individuals (5,773) out of the total population between 25 and 64 years of age (7,537) are in the labor force, with 3.1% or 179 of them being unemployed. The group with the highest labor force participation rate are those with the educational attainment of bachelor's degree or higher, with 86.0% or 947 individuals in the labor force. Within the labor force, individuals with less than high school education have the highest percentage of unemployment, with 4.9% or 23 of them being unemployed.
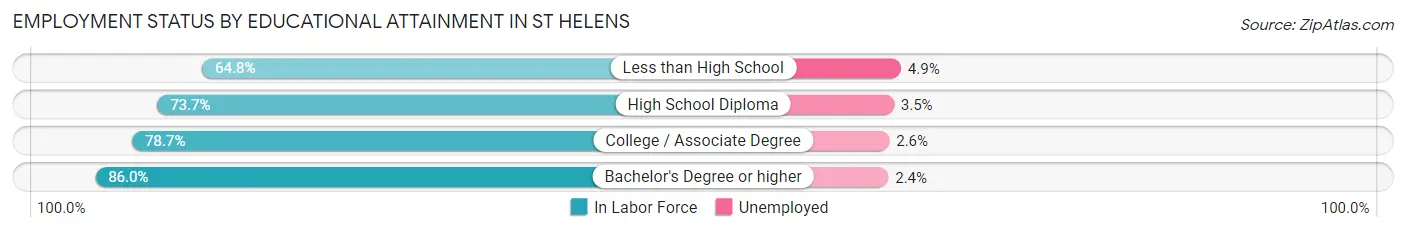
| Educational Attainment | In Labor Force | Unemployed |
| Less than High School | 467 (64.8%) | 35 (4.9%) |
| High School Diploma | 2,050 (73.7%) | 97 (3.5%) |
| College / Associate Degree | 2,308 (78.7%) | 76 (2.6%) |
| Bachelor's Degree or higher | 947 (86.0%) | 26 (2.4%) |
| Total | 5,773 (76.6%) | 234 (3.1%) |
Employment Occupations by Sex in St Helens
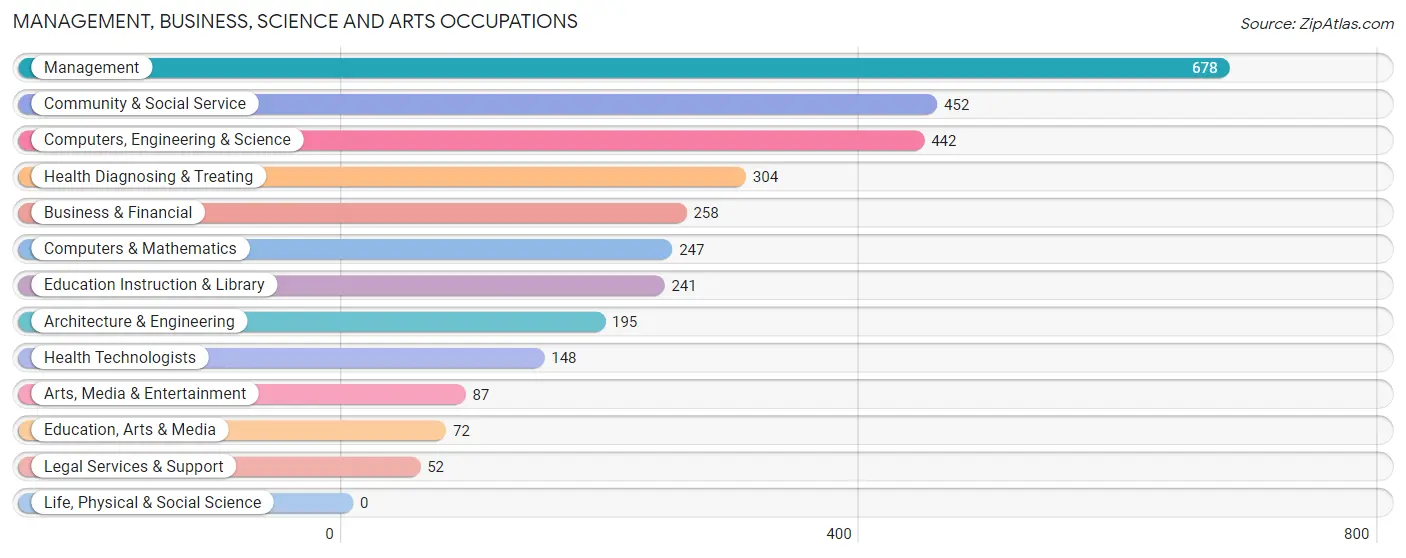
Management, Business, Science and Arts Occupations
The most common Management, Business, Science and Arts occupations in St Helens are Management (678 | 9.9%), Community & Social Service (452 | 6.6%), Computers, Engineering & Science (442 | 6.5%), Health Diagnosing & Treating (304 | 4.4%), and Business & Financial (258 | 3.8%).
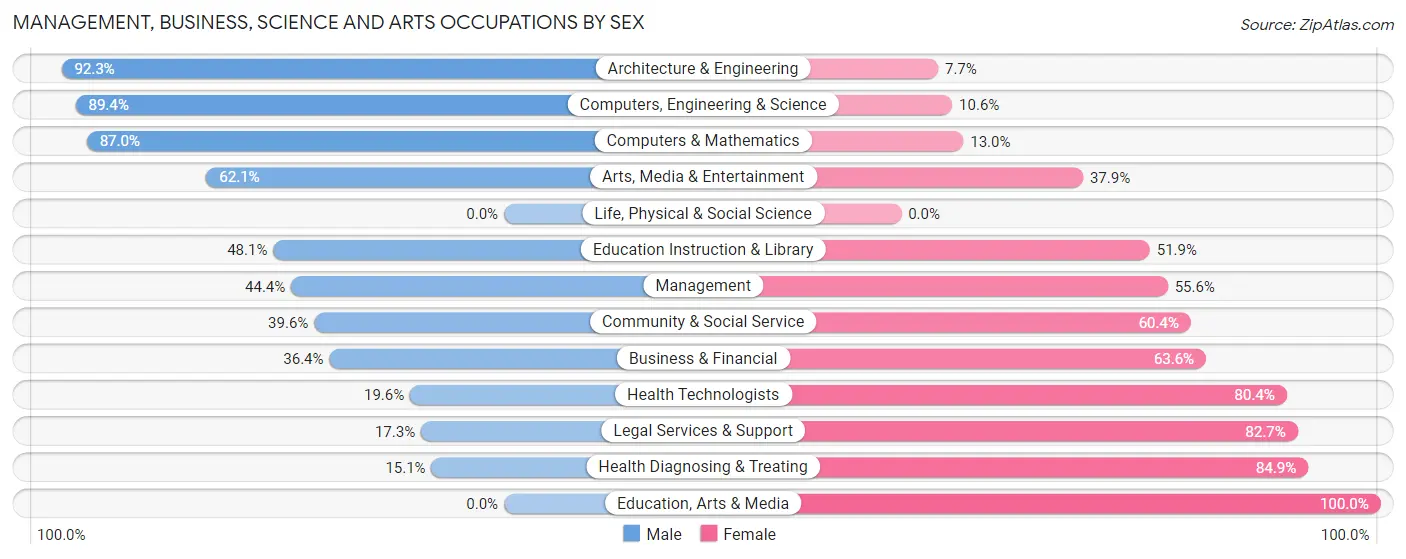
Management, Business, Science and Arts Occupations by Sex
Within the Management, Business, Science and Arts occupations in St Helens, the most male-oriented occupations are Architecture & Engineering (92.3%), Computers, Engineering & Science (89.4%), and Computers & Mathematics (87.0%), while the most female-oriented occupations are Education, Arts & Media (100.0%), Health Diagnosing & Treating (84.9%), and Legal Services & Support (82.7%).
| Occupation | Male | Female |
| Management | 301 (44.4%) | 377 (55.6%) |
| Business & Financial | 94 (36.4%) | 164 (63.6%) |
| Computers, Engineering & Science | 395 (89.4%) | 47 (10.6%) |
| Computers & Mathematics | 215 (87.0%) | 32 (13.0%) |
| Architecture & Engineering | 180 (92.3%) | 15 (7.7%) |
| Life, Physical & Social Science | 0 (0.0%) | 0 (0.0%) |
| Community & Social Service | 179 (39.6%) | 273 (60.4%) |
| Education, Arts & Media | 0 (0.0%) | 72 (100.0%) |
| Legal Services & Support | 9 (17.3%) | 43 (82.7%) |
| Education Instruction & Library | 116 (48.1%) | 125 (51.9%) |
| Arts, Media & Entertainment | 54 (62.1%) | 33 (37.9%) |
| Health Diagnosing & Treating | 46 (15.1%) | 258 (84.9%) |
| Health Technologists | 29 (19.6%) | 119 (80.4%) |
| Total (Category) | 1,015 (47.6%) | 1,119 (52.4%) |
| Total (Overall) | 3,847 (56.1%) | 3,007 (43.9%) |
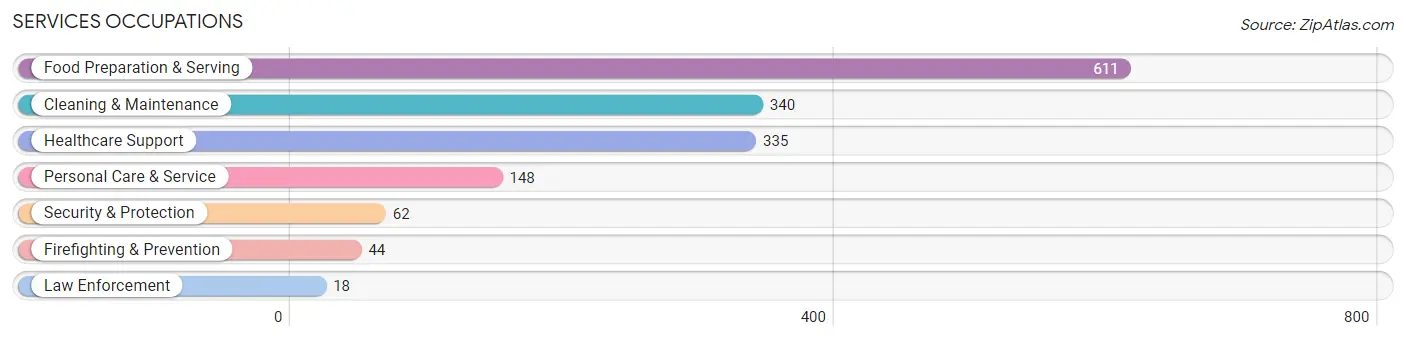
Services Occupations
The most common Services occupations in St Helens are Food Preparation & Serving (611 | 8.9%), Cleaning & Maintenance (340 | 5.0%), Healthcare Support (335 | 4.9%), Personal Care & Service (148 | 2.2%), and Security & Protection (62 | 0.9%).
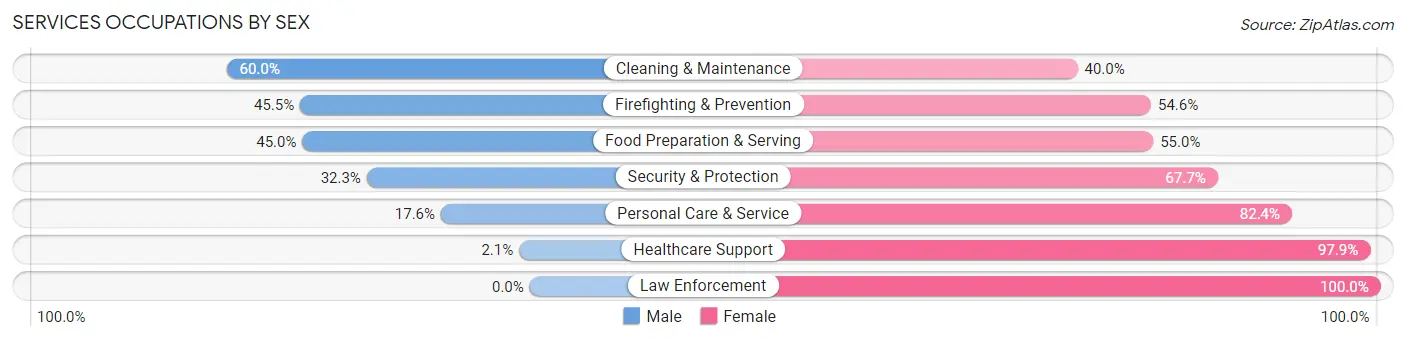
Services Occupations by Sex
Within the Services occupations in St Helens, the most male-oriented occupations are Cleaning & Maintenance (60.0%), Firefighting & Prevention (45.5%), and Food Preparation & Serving (45.0%), while the most female-oriented occupations are Law Enforcement (100.0%), Healthcare Support (97.9%), and Personal Care & Service (82.4%).
| Occupation | Male | Female |
| Healthcare Support | 7 (2.1%) | 328 (97.9%) |
| Security & Protection | 20 (32.3%) | 42 (67.7%) |
| Firefighting & Prevention | 20 (45.5%) | 24 (54.5%) |
| Law Enforcement | 0 (0.0%) | 18 (100.0%) |
| Food Preparation & Serving | 275 (45.0%) | 336 (55.0%) |
| Cleaning & Maintenance | 204 (60.0%) | 136 (40.0%) |
| Personal Care & Service | 26 (17.6%) | 122 (82.4%) |
| Total (Category) | 532 (35.6%) | 964 (64.4%) |
| Total (Overall) | 3,847 (56.1%) | 3,007 (43.9%) |
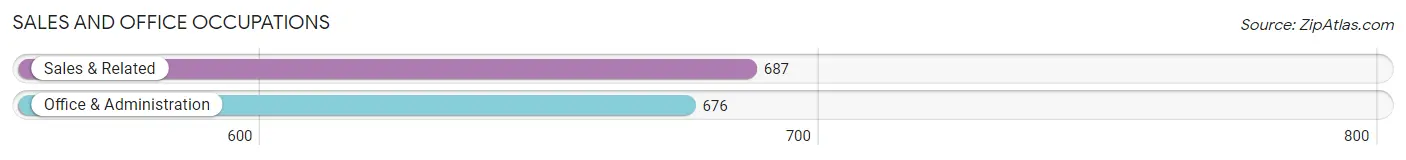
Sales and Office Occupations
The most common Sales and Office occupations in St Helens are Sales & Related (687 | 10.0%), and Office & Administration (676 | 9.9%).
Sales and Office Occupations by Sex
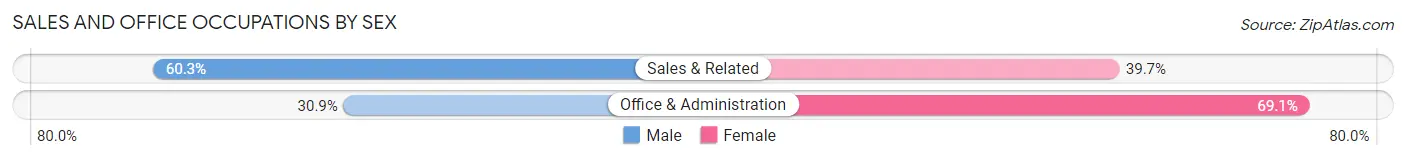
| Occupation | Male | Female |
| Sales & Related | 414 (60.3%) | 273 (39.7%) |
| Office & Administration | 209 (30.9%) | 467 (69.1%) |
| Total (Category) | 623 (45.7%) | 740 (54.3%) |
| Total (Overall) | 3,847 (56.1%) | 3,007 (43.9%) |
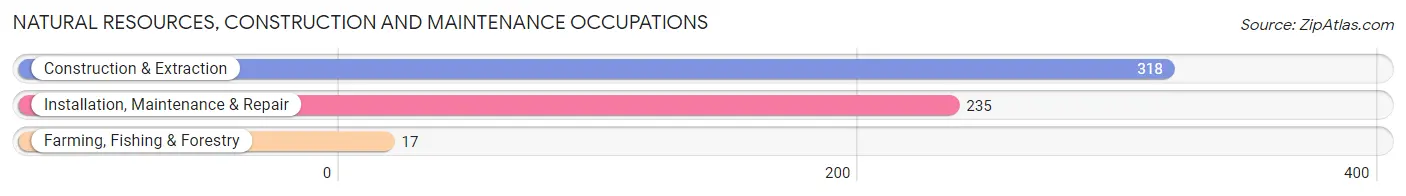
Natural Resources, Construction and Maintenance Occupations
The most common Natural Resources, Construction and Maintenance occupations in St Helens are Construction & Extraction (318 | 4.6%), Installation, Maintenance & Repair (235 | 3.4%), and Farming, Fishing & Forestry (17 | 0.3%).
Natural Resources, Construction and Maintenance Occupations by Sex
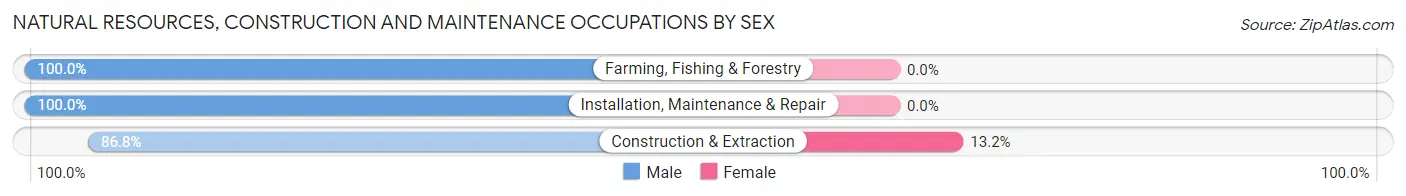
| Occupation | Male | Female |
| Farming, Fishing & Forestry | 17 (100.0%) | 0 (0.0%) |
| Construction & Extraction | 276 (86.8%) | 42 (13.2%) |
| Installation, Maintenance & Repair | 235 (100.0%) | 0 (0.0%) |
| Total (Category) | 528 (92.6%) | 42 (7.4%) |
| Total (Overall) | 3,847 (56.1%) | 3,007 (43.9%) |
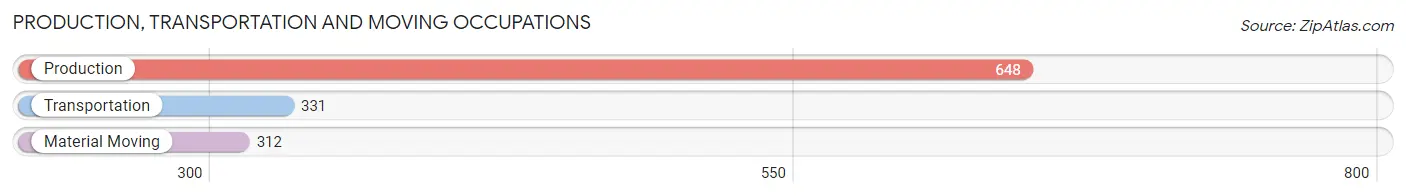
Production, Transportation and Moving Occupations
The most common Production, Transportation and Moving occupations in St Helens are Production (648 | 9.5%), Transportation (331 | 4.8%), and Material Moving (312 | 4.5%).
Production, Transportation and Moving Occupations by Sex
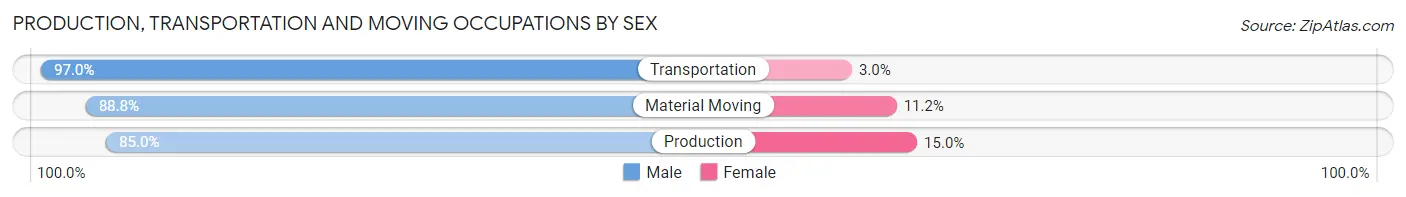
| Occupation | Male | Female |
| Production | 551 (85.0%) | 97 (15.0%) |
| Transportation | 321 (97.0%) | 10 (3.0%) |
| Material Moving | 277 (88.8%) | 35 (11.2%) |
| Total (Category) | 1,149 (89.0%) | 142 (11.0%) |
| Total (Overall) | 3,847 (56.1%) | 3,007 (43.9%) |
Employment Industries by Sex in St Helens
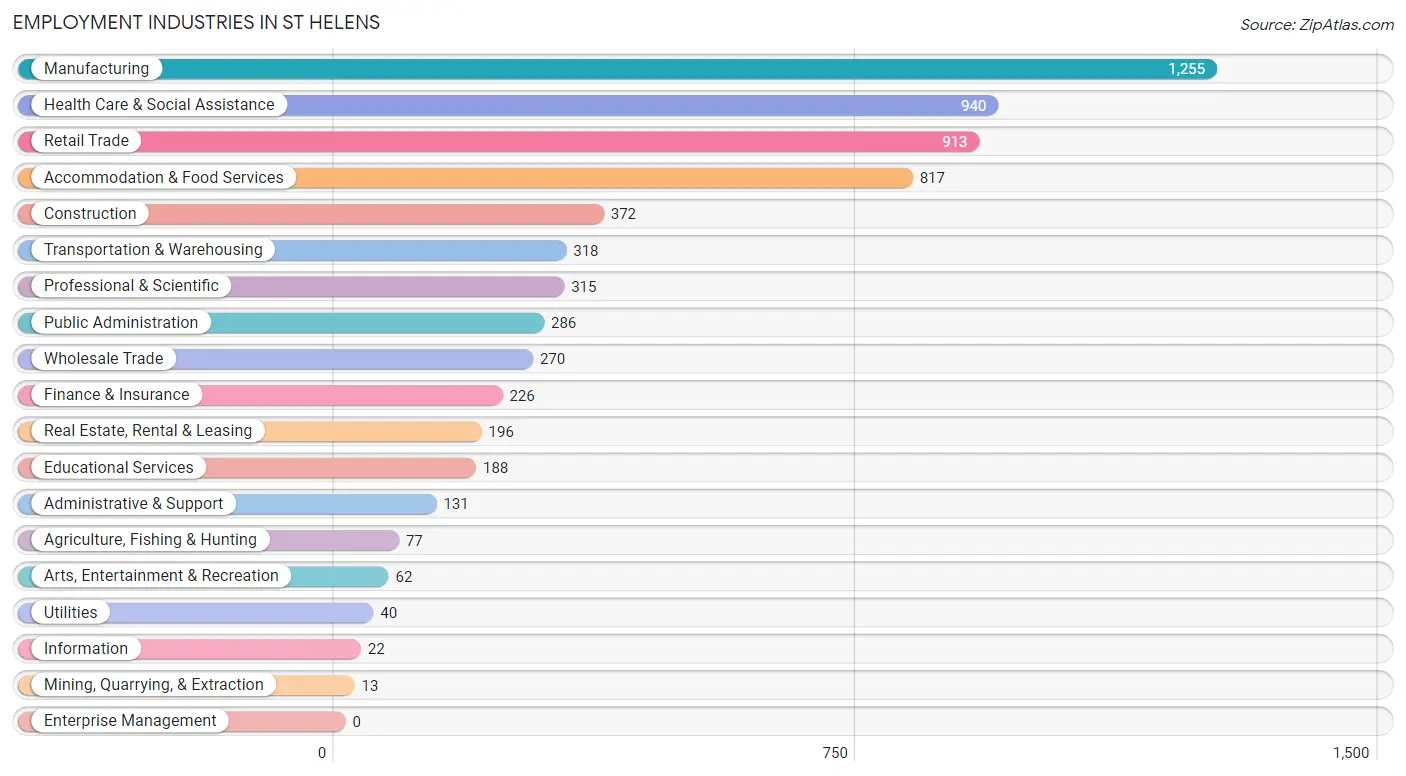
Employment Industries in St Helens
The major employment industries in St Helens include Manufacturing (1,255 | 18.3%), Health Care & Social Assistance (940 | 13.7%), Retail Trade (913 | 13.3%), Accommodation & Food Services (817 | 11.9%), and Construction (372 | 5.4%).
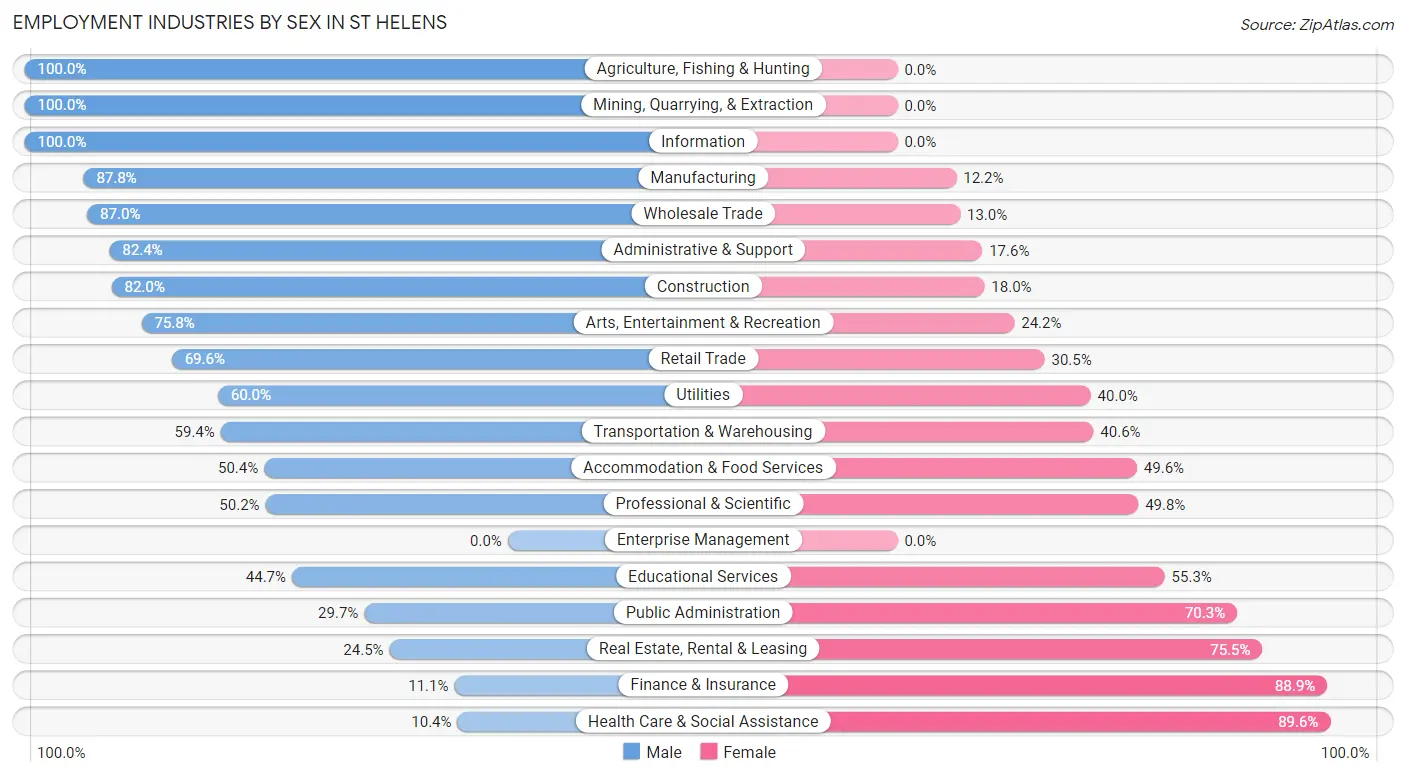
Employment Industries by Sex in St Helens
The St Helens industries that see more men than women are Agriculture, Fishing & Hunting (100.0%), Mining, Quarrying, & Extraction (100.0%), and Information (100.0%), whereas the industries that tend to have a higher number of women are Health Care & Social Assistance (89.6%), Finance & Insurance (88.9%), and Real Estate, Rental & Leasing (75.5%).
| Industry | Male | Female |
| Agriculture, Fishing & Hunting | 77 (100.0%) | 0 (0.0%) |
| Mining, Quarrying, & Extraction | 13 (100.0%) | 0 (0.0%) |
| Construction | 305 (82.0%) | 67 (18.0%) |
| Manufacturing | 1,102 (87.8%) | 153 (12.2%) |
| Wholesale Trade | 235 (87.0%) | 35 (13.0%) |
| Retail Trade | 635 (69.6%) | 278 (30.4%) |
| Transportation & Warehousing | 189 (59.4%) | 129 (40.6%) |
| Utilities | 24 (60.0%) | 16 (40.0%) |
| Information | 22 (100.0%) | 0 (0.0%) |
| Finance & Insurance | 25 (11.1%) | 201 (88.9%) |
| Real Estate, Rental & Leasing | 48 (24.5%) | 148 (75.5%) |
| Professional & Scientific | 158 (50.2%) | 157 (49.8%) |
| Enterprise Management | 0 (0.0%) | 0 (0.0%) |
| Administrative & Support | 108 (82.4%) | 23 (17.6%) |
| Educational Services | 84 (44.7%) | 104 (55.3%) |
| Health Care & Social Assistance | 98 (10.4%) | 842 (89.6%) |
| Arts, Entertainment & Recreation | 47 (75.8%) | 15 (24.2%) |
| Accommodation & Food Services | 412 (50.4%) | 405 (49.6%) |
| Public Administration | 85 (29.7%) | 201 (70.3%) |
| Total | 3,847 (56.1%) | 3,007 (43.9%) |
Education in St Helens
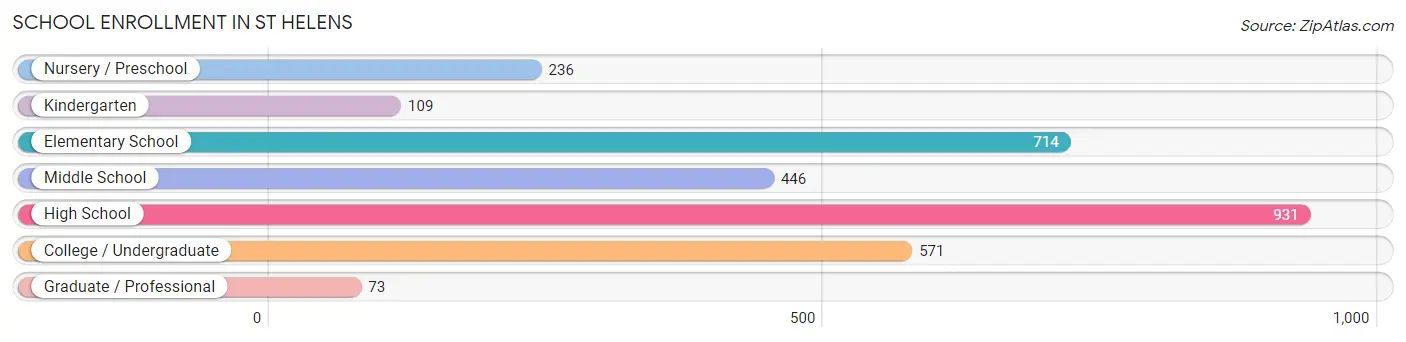
School Enrollment in St Helens
The most common levels of schooling among the 3,080 students in St Helens are high school (931 | 30.2%), elementary school (714 | 23.2%), and college / undergraduate (571 | 18.5%).
| School Level | # Students | % Students |
| Nursery / Preschool | 236 | 7.7% |
| Kindergarten | 109 | 3.5% |
| Elementary School | 714 | 23.2% |
| Middle School | 446 | 14.5% |
| High School | 931 | 30.2% |
| College / Undergraduate | 571 | 18.5% |
| Graduate / Professional | 73 | 2.4% |
| Total | 3,080 | 100.0% |
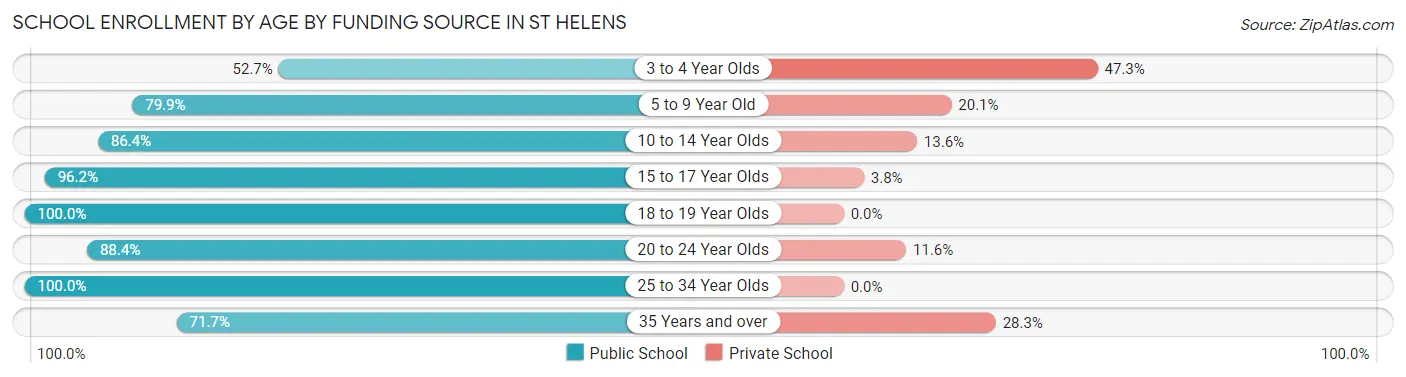
School Enrollment by Age by Funding Source in St Helens
Out of a total of 3,080 students who are enrolled in schools in St Helens, 462 (15.0%) attend a private institution, while the remaining 2,618 (85.0%) are enrolled in public schools. The age group of 3 to 4 year olds has the highest likelihood of being enrolled in private schools, with 105 (47.3% in the age bracket) enrolled. Conversely, the age group of 18 to 19 year olds has the lowest likelihood of being enrolled in a private school, with 310 (100.0% in the age bracket) attending a public institution.
| Age Bracket | Public School | Private School |
| 3 to 4 Year Olds | 117 (52.7%) | 105 (47.3%) |
| 5 to 9 Year Old | 574 (79.9%) | 144 (20.1%) |
| 10 to 14 Year Olds | 614 (86.4%) | 97 (13.6%) |
| 15 to 17 Year Olds | 537 (96.2%) | 21 (3.8%) |
| 18 to 19 Year Olds | 310 (100.0%) | 0 (0.0%) |
| 20 to 24 Year Olds | 114 (88.4%) | 15 (11.6%) |
| 25 to 34 Year Olds | 146 (100.0%) | 0 (0.0%) |
| 35 Years and over | 205 (71.7%) | 81 (28.3%) |
| Total | 2,618 (85.0%) | 462 (15.0%) |
Educational Attainment by Field of Study in St Helens
Business (300 | 19.7%), social sciences (180 | 11.8%), science & technology (175 | 11.5%), liberal arts & history (151 | 9.9%), and education (133 | 8.7%) are the most common fields of study among 1,522 individuals in St Helens who have obtained a bachelor's degree or higher.
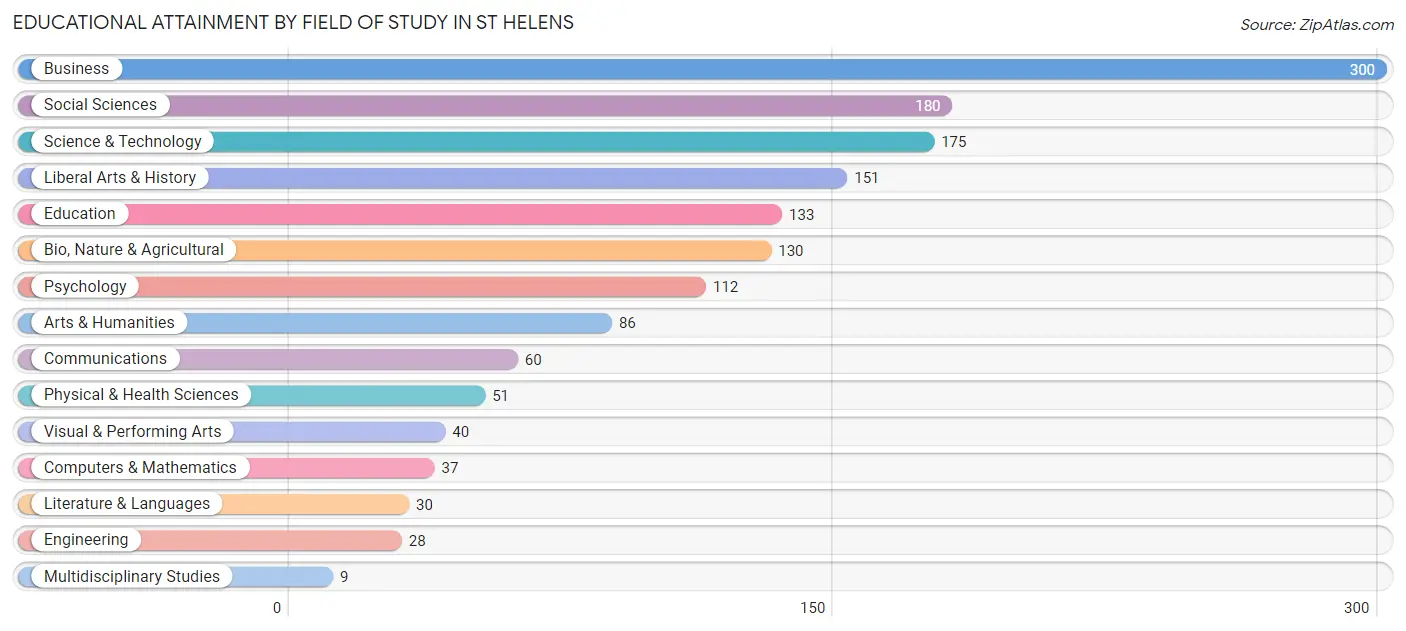
| Field of Study | # Graduates | % Graduates |
| Computers & Mathematics | 37 | 2.4% |
| Bio, Nature & Agricultural | 130 | 8.5% |
| Physical & Health Sciences | 51 | 3.4% |
| Psychology | 112 | 7.4% |
| Social Sciences | 180 | 11.8% |
| Engineering | 28 | 1.8% |
| Multidisciplinary Studies | 9 | 0.6% |
| Science & Technology | 175 | 11.5% |
| Business | 300 | 19.7% |
| Education | 133 | 8.7% |
| Literature & Languages | 30 | 2.0% |
| Liberal Arts & History | 151 | 9.9% |
| Visual & Performing Arts | 40 | 2.6% |
| Communications | 60 | 3.9% |
| Arts & Humanities | 86 | 5.7% |
| Total | 1,522 | 100.0% |
Transportation & Commute in St Helens
Vehicle Availability by Sex in St Helens
The most prevalent vehicle ownership categories in St Helens are males with 2 vehicles (1,333, accounting for 35.5%) and females with 2 vehicles (984, making up 45.0%).
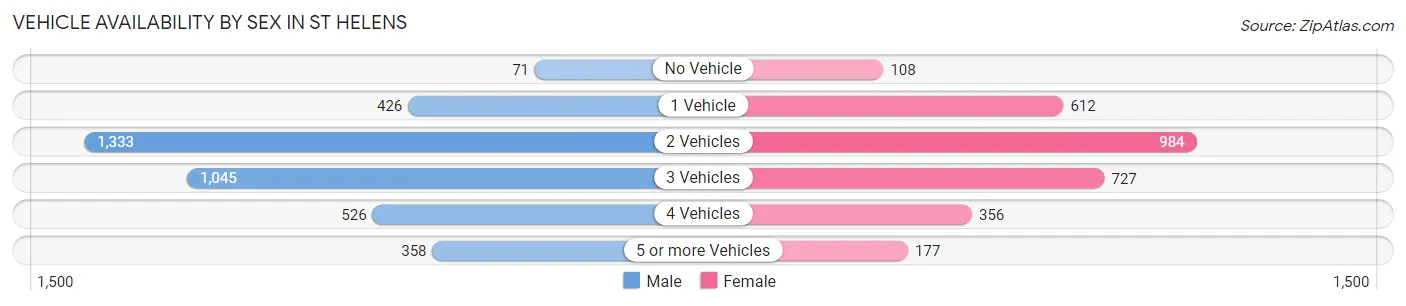
| Vehicles Available | Male | Female |
| No Vehicle | 71 (1.9%) | 108 (3.6%) |
| 1 Vehicle | 426 (11.3%) | 612 (20.6%) |
| 2 Vehicles | 1,333 (35.5%) | 984 (33.2%) |
| 3 Vehicles | 1,045 (27.8%) | 727 (24.5%) |
| 4 Vehicles | 526 (14.0%) | 356 (12.0%) |
| 5 or more Vehicles | 358 (9.5%) | 177 (6.0%) |
| Total | 3,759 (100.0%) | 2,964 (100.0%) |
Commute Time in St Helens
The most frequently occuring commute durations in St Helens are 45 to 59 minutes (1,312 commuters, 21.6%), 5 to 9 minutes (1,190 commuters, 19.6%), and 60 to 89 minutes (684 commuters, 11.3%).
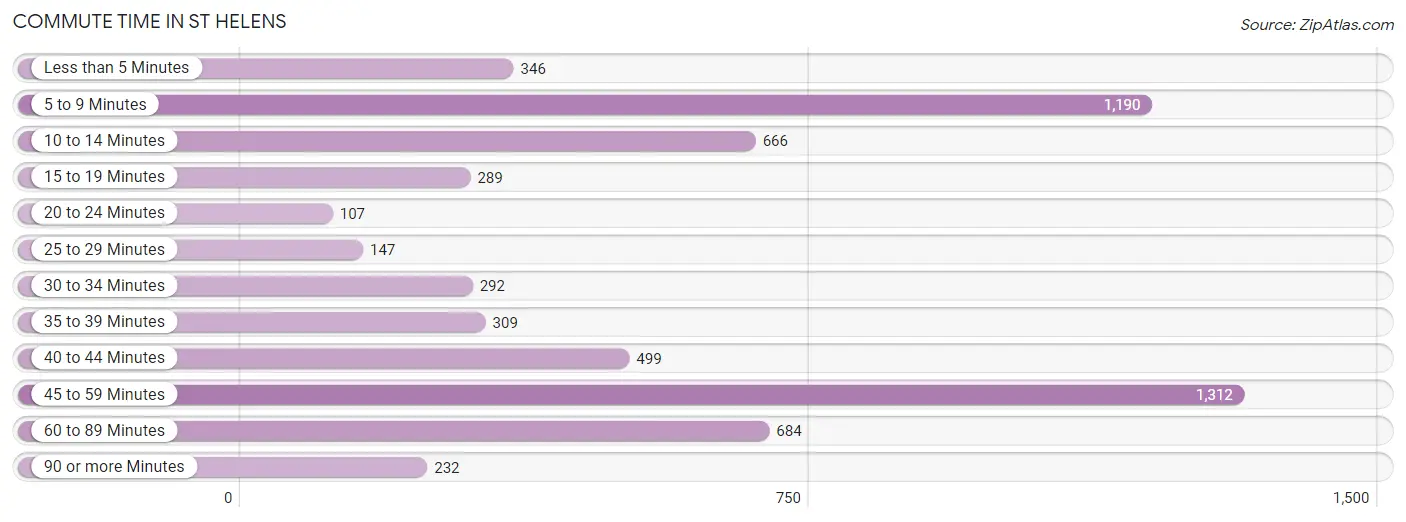
| Commute Time | # Commuters | % Commuters |
| Less than 5 Minutes | 346 | 5.7% |
| 5 to 9 Minutes | 1,190 | 19.6% |
| 10 to 14 Minutes | 666 | 11.0% |
| 15 to 19 Minutes | 289 | 4.8% |
| 20 to 24 Minutes | 107 | 1.8% |
| 25 to 29 Minutes | 147 | 2.4% |
| 30 to 34 Minutes | 292 | 4.8% |
| 35 to 39 Minutes | 309 | 5.1% |
| 40 to 44 Minutes | 499 | 8.2% |
| 45 to 59 Minutes | 1,312 | 21.6% |
| 60 to 89 Minutes | 684 | 11.3% |
| 90 or more Minutes | 232 | 3.8% |
Commute Time by Sex in St Helens
The most common commute times in St Helens are 45 to 59 minutes (771 commuters, 21.9%) for males and 5 to 9 minutes (734 commuters, 28.8%) for females.
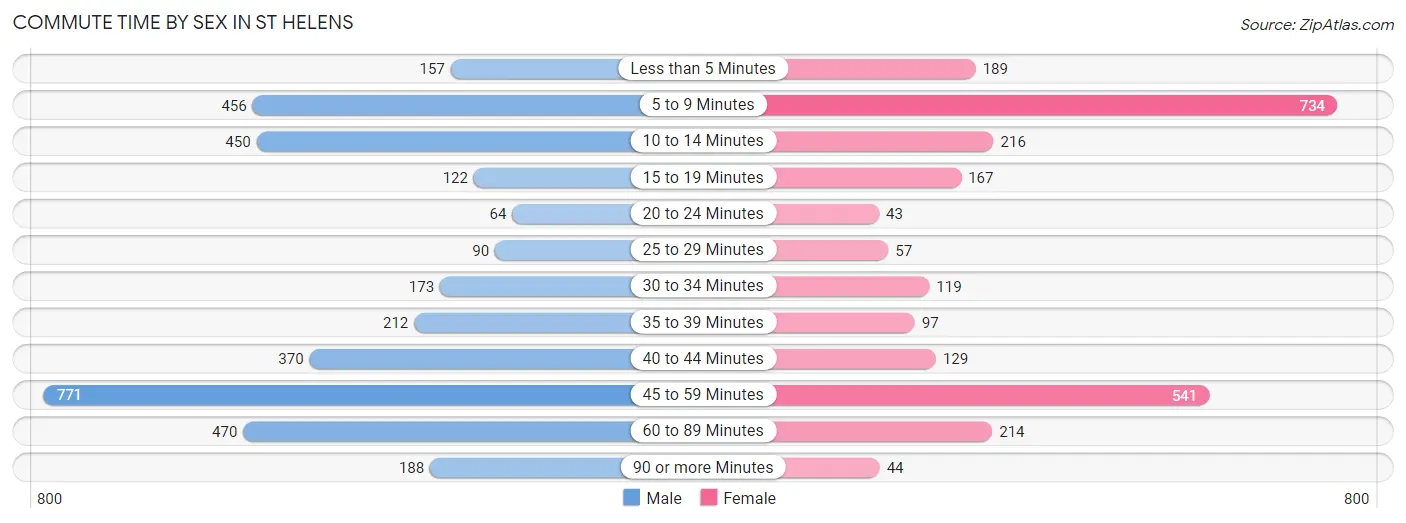
| Commute Time | Male | Female |
| Less than 5 Minutes | 157 (4.5%) | 189 (7.4%) |
| 5 to 9 Minutes | 456 (12.9%) | 734 (28.8%) |
| 10 to 14 Minutes | 450 (12.8%) | 216 (8.5%) |
| 15 to 19 Minutes | 122 (3.5%) | 167 (6.6%) |
| 20 to 24 Minutes | 64 (1.8%) | 43 (1.7%) |
| 25 to 29 Minutes | 90 (2.5%) | 57 (2.2%) |
| 30 to 34 Minutes | 173 (4.9%) | 119 (4.7%) |
| 35 to 39 Minutes | 212 (6.0%) | 97 (3.8%) |
| 40 to 44 Minutes | 370 (10.5%) | 129 (5.1%) |
| 45 to 59 Minutes | 771 (21.9%) | 541 (21.2%) |
| 60 to 89 Minutes | 470 (13.3%) | 214 (8.4%) |
| 90 or more Minutes | 188 (5.3%) | 44 (1.7%) |
Time of Departure to Work by Sex in St Helens
The most frequent times of departure to work in St Helens are 12:00 AM to 4:59 AM (523, 14.8%) for males and 7:30 AM to 7:59 AM (362, 14.2%) for females.
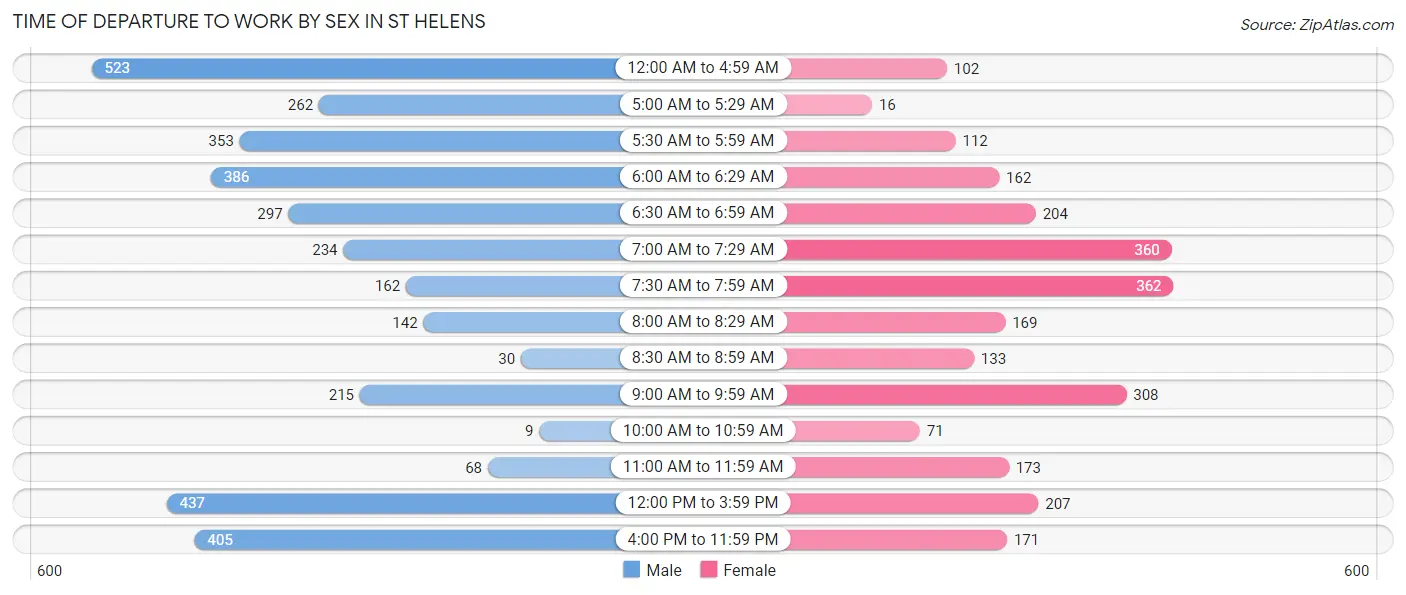
| Time of Departure | Male | Female |
| 12:00 AM to 4:59 AM | 523 (14.8%) | 102 (4.0%) |
| 5:00 AM to 5:29 AM | 262 (7.4%) | 16 (0.6%) |
| 5:30 AM to 5:59 AM | 353 (10.0%) | 112 (4.4%) |
| 6:00 AM to 6:29 AM | 386 (11.0%) | 162 (6.4%) |
| 6:30 AM to 6:59 AM | 297 (8.4%) | 204 (8.0%) |
| 7:00 AM to 7:29 AM | 234 (6.6%) | 360 (14.1%) |
| 7:30 AM to 7:59 AM | 162 (4.6%) | 362 (14.2%) |
| 8:00 AM to 8:29 AM | 142 (4.0%) | 169 (6.6%) |
| 8:30 AM to 8:59 AM | 30 (0.9%) | 133 (5.2%) |
| 9:00 AM to 9:59 AM | 215 (6.1%) | 308 (12.1%) |
| 10:00 AM to 10:59 AM | 9 (0.3%) | 71 (2.8%) |
| 11:00 AM to 11:59 AM | 68 (1.9%) | 173 (6.8%) |
| 12:00 PM to 3:59 PM | 437 (12.4%) | 207 (8.1%) |
| 4:00 PM to 11:59 PM | 405 (11.5%) | 171 (6.7%) |
| Total | 3,523 (100.0%) | 2,550 (100.0%) |
Housing Occupancy in St Helens
Occupancy by Ownership in St Helens
Of the total 5,172 dwellings in St Helens, owner-occupied units account for 3,317 (64.1%), while renter-occupied units make up 1,855 (35.9%).
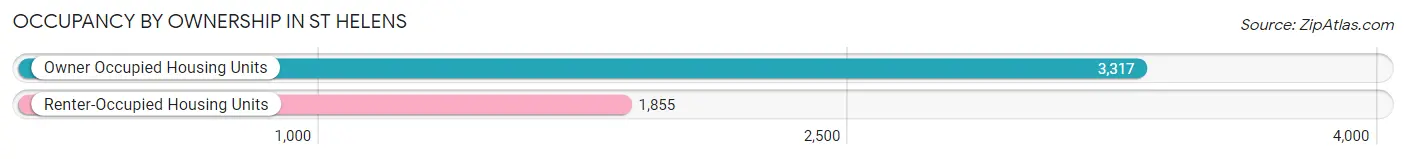
| Occupancy | # Housing Units | % Housing Units |
| Owner Occupied Housing Units | 3,317 | 64.1% |
| Renter-Occupied Housing Units | 1,855 | 35.9% |
| Total Occupied Housing Units | 5,172 | 100.0% |
Occupancy by Household Size in St Helens
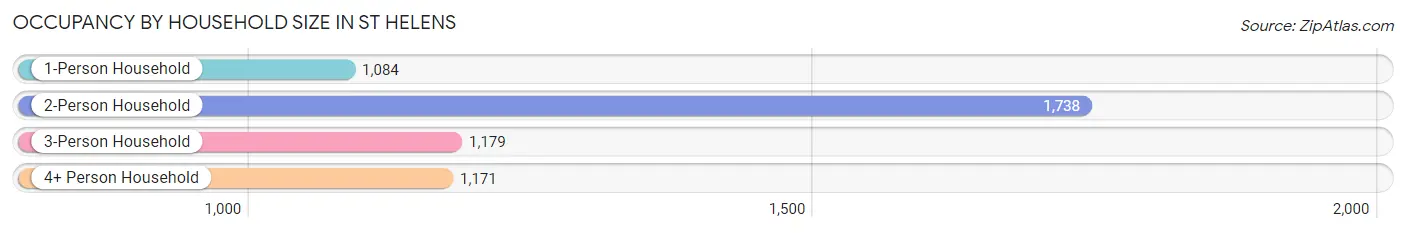
| Household Size | # Housing Units | % Housing Units |
| 1-Person Household | 1,084 | 21.0% |
| 2-Person Household | 1,738 | 33.6% |
| 3-Person Household | 1,179 | 22.8% |
| 4+ Person Household | 1,171 | 22.6% |
| Total Housing Units | 5,172 | 100.0% |
Occupancy by Ownership by Household Size in St Helens
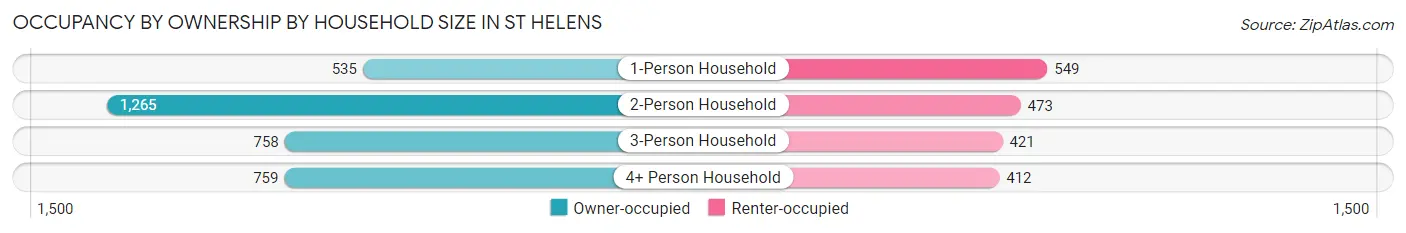
| Household Size | Owner-occupied | Renter-occupied |
| 1-Person Household | 535 (49.3%) | 549 (50.6%) |
| 2-Person Household | 1,265 (72.8%) | 473 (27.2%) |
| 3-Person Household | 758 (64.3%) | 421 (35.7%) |
| 4+ Person Household | 759 (64.8%) | 412 (35.2%) |
| Total Housing Units | 3,317 (64.1%) | 1,855 (35.9%) |
Occupancy by Educational Attainment in St Helens
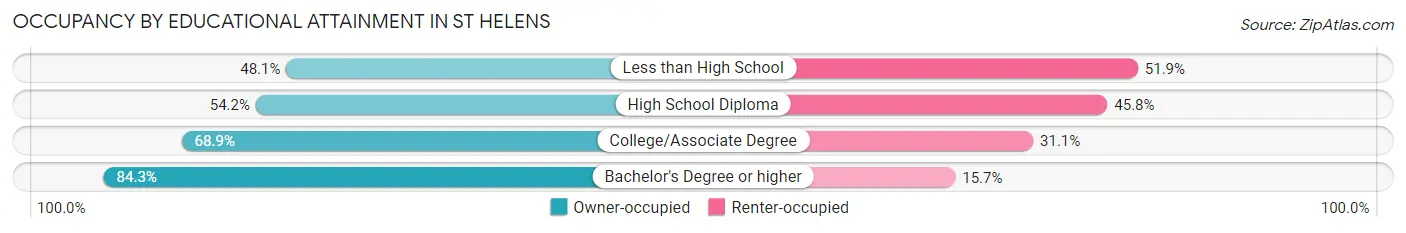
| Household Size | Owner-occupied | Renter-occupied |
| Less than High School | 218 (48.1%) | 235 (51.9%) |
| High School Diploma | 970 (54.2%) | 821 (45.8%) |
| College/Associate Degree | 1,516 (68.9%) | 685 (31.1%) |
| Bachelor's Degree or higher | 613 (84.3%) | 114 (15.7%) |
Occupancy by Age of Householder in St Helens
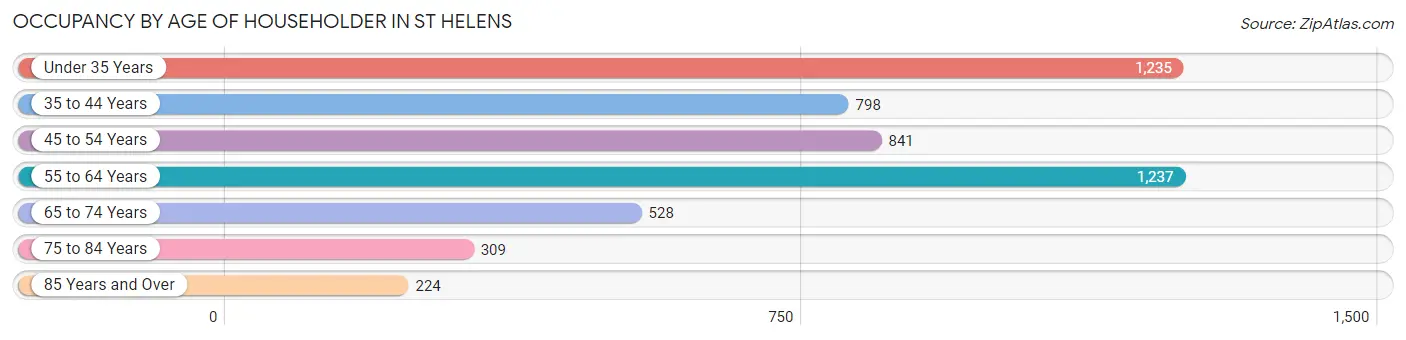
| Age Bracket | # Households | % Households |
| Under 35 Years | 1,235 | 23.9% |
| 35 to 44 Years | 798 | 15.4% |
| 45 to 54 Years | 841 | 16.3% |
| 55 to 64 Years | 1,237 | 23.9% |
| 65 to 74 Years | 528 | 10.2% |
| 75 to 84 Years | 309 | 6.0% |
| 85 Years and Over | 224 | 4.3% |
| Total | 5,172 | 100.0% |
Housing Finances in St Helens
Median Income by Occupancy in St Helens
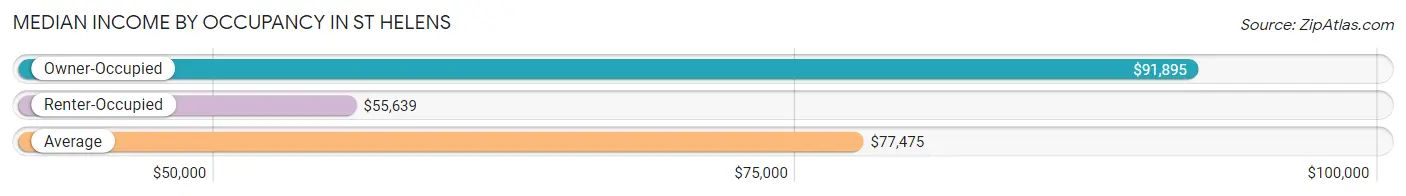
| Occupancy Type | # Households | Median Income |
| Owner-Occupied | 3,317 (64.1%) | $91,895 |
| Renter-Occupied | 1,855 (35.9%) | $55,639 |
| Average | 5,172 (100.0%) | $77,475 |
Occupancy by Householder Income Bracket in St Helens
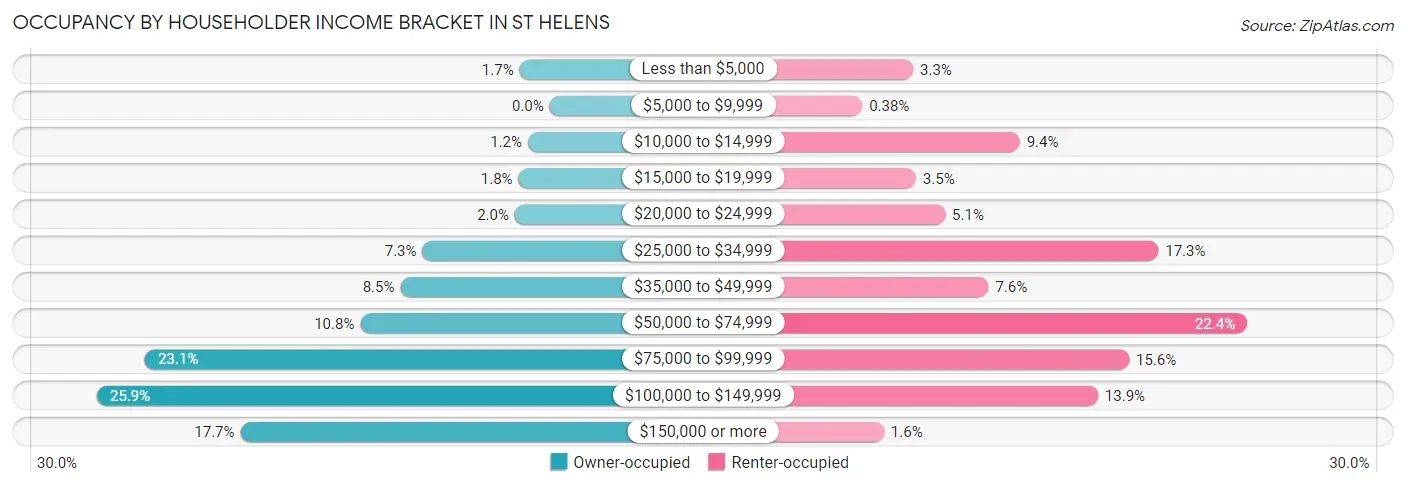
| Income Bracket | Owner-occupied | Renter-occupied |
| Less than $5,000 | 57 (1.7%) | 61 (3.3%) |
| $5,000 to $9,999 | 0 (0.0%) | 7 (0.4%) |
| $10,000 to $14,999 | 41 (1.2%) | 174 (9.4%) |
| $15,000 to $19,999 | 59 (1.8%) | 64 (3.5%) |
| $20,000 to $24,999 | 66 (2.0%) | 95 (5.1%) |
| $25,000 to $34,999 | 241 (7.3%) | 321 (17.3%) |
| $35,000 to $49,999 | 283 (8.5%) | 141 (7.6%) |
| $50,000 to $74,999 | 359 (10.8%) | 415 (22.4%) |
| $75,000 to $99,999 | 767 (23.1%) | 290 (15.6%) |
| $100,000 to $149,999 | 858 (25.9%) | 257 (13.9%) |
| $150,000 or more | 586 (17.7%) | 30 (1.6%) |
| Total | 3,317 (100.0%) | 1,855 (100.0%) |
Monthly Housing Cost Tiers in St Helens
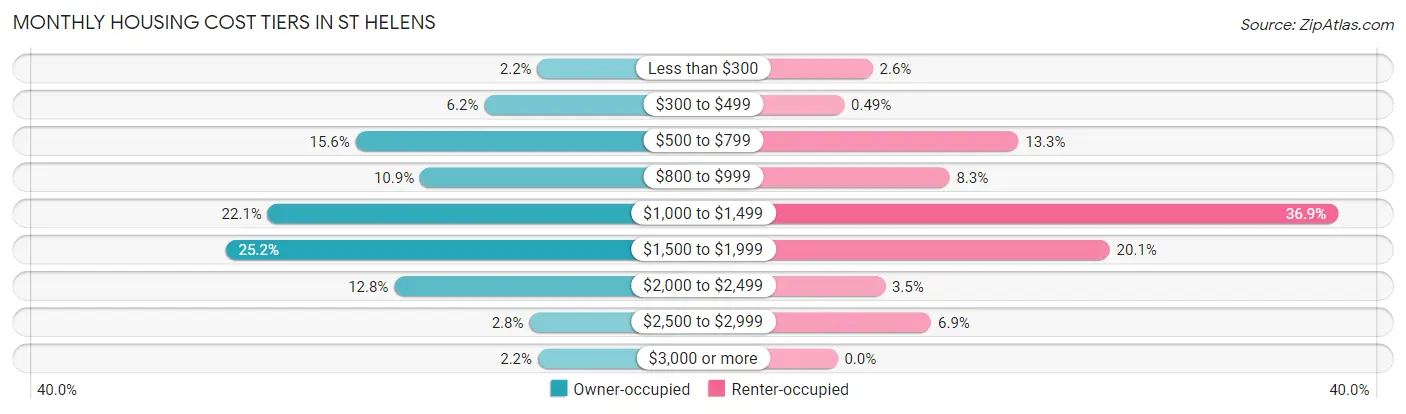
| Monthly Cost | Owner-occupied | Renter-occupied |
| Less than $300 | 74 (2.2%) | 48 (2.6%) |
| $300 to $499 | 204 (6.1%) | 9 (0.5%) |
| $500 to $799 | 518 (15.6%) | 247 (13.3%) |
| $800 to $999 | 361 (10.9%) | 153 (8.3%) |
| $1,000 to $1,499 | 733 (22.1%) | 684 (36.9%) |
| $1,500 to $1,999 | 836 (25.2%) | 372 (20.1%) |
| $2,000 to $2,499 | 424 (12.8%) | 65 (3.5%) |
| $2,500 to $2,999 | 94 (2.8%) | 128 (6.9%) |
| $3,000 or more | 73 (2.2%) | 0 (0.0%) |
| Total | 3,317 (100.0%) | 1,855 (100.0%) |
Physical Housing Characteristics in St Helens
Housing Structures in St Helens
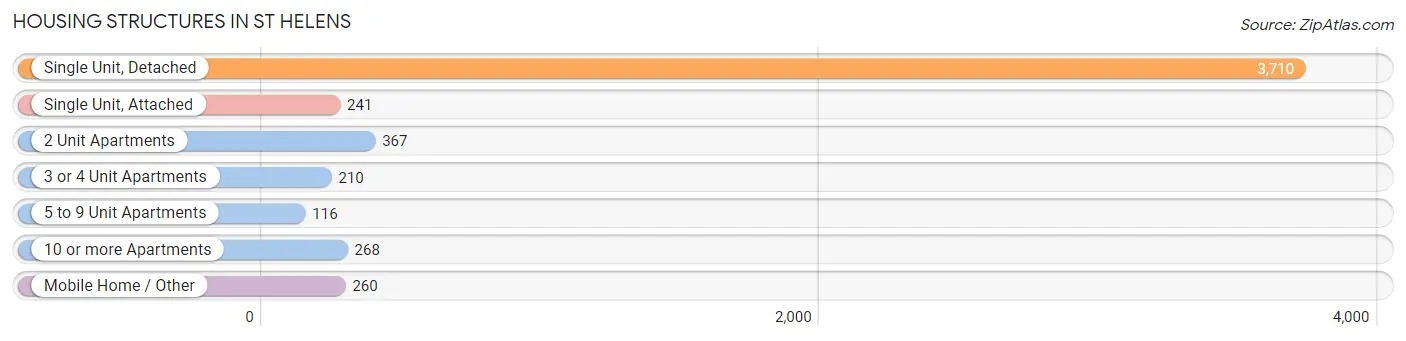
| Structure Type | # Housing Units | % Housing Units |
| Single Unit, Detached | 3,710 | 71.7% |
| Single Unit, Attached | 241 | 4.7% |
| 2 Unit Apartments | 367 | 7.1% |
| 3 or 4 Unit Apartments | 210 | 4.1% |
| 5 to 9 Unit Apartments | 116 | 2.2% |
| 10 or more Apartments | 268 | 5.2% |
| Mobile Home / Other | 260 | 5.0% |
| Total | 5,172 | 100.0% |
Housing Structures by Occupancy in St Helens
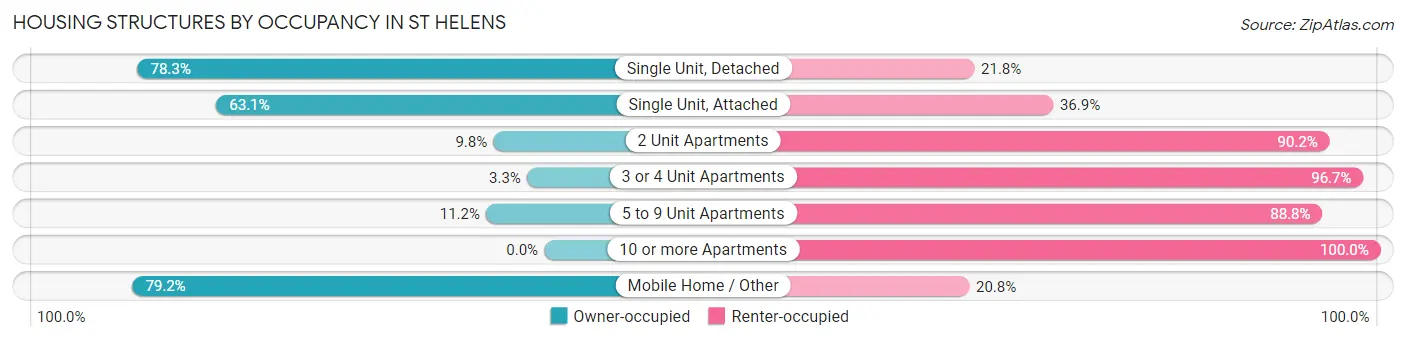
| Structure Type | Owner-occupied | Renter-occupied |
| Single Unit, Detached | 2,903 (78.2%) | 807 (21.7%) |
| Single Unit, Attached | 152 (63.1%) | 89 (36.9%) |
| 2 Unit Apartments | 36 (9.8%) | 331 (90.2%) |
| 3 or 4 Unit Apartments | 7 (3.3%) | 203 (96.7%) |
| 5 to 9 Unit Apartments | 13 (11.2%) | 103 (88.8%) |
| 10 or more Apartments | 0 (0.0%) | 268 (100.0%) |
| Mobile Home / Other | 206 (79.2%) | 54 (20.8%) |
| Total | 3,317 (64.1%) | 1,855 (35.9%) |
Housing Structures by Number of Rooms in St Helens
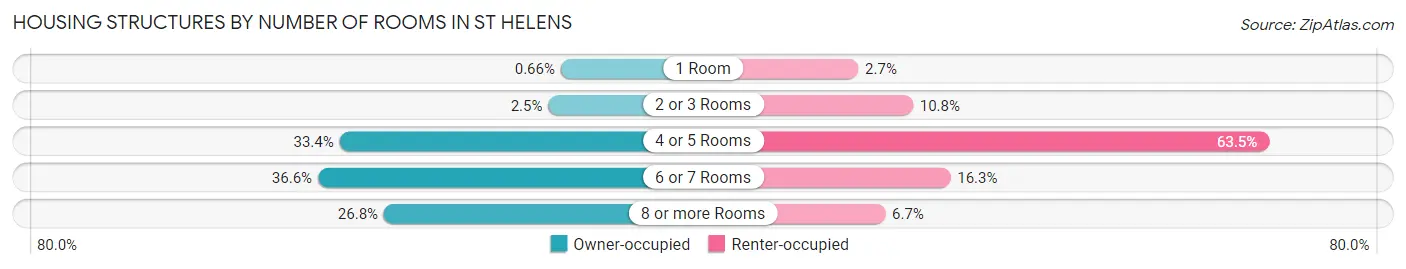
| Number of Rooms | Owner-occupied | Renter-occupied |
| 1 Room | 22 (0.7%) | 50 (2.7%) |
| 2 or 3 Rooms | 83 (2.5%) | 200 (10.8%) |
| 4 or 5 Rooms | 1,108 (33.4%) | 1,178 (63.5%) |
| 6 or 7 Rooms | 1,214 (36.6%) | 303 (16.3%) |
| 8 or more Rooms | 890 (26.8%) | 124 (6.7%) |
| Total | 3,317 (100.0%) | 1,855 (100.0%) |
Housing Structure by Heating Type in St Helens
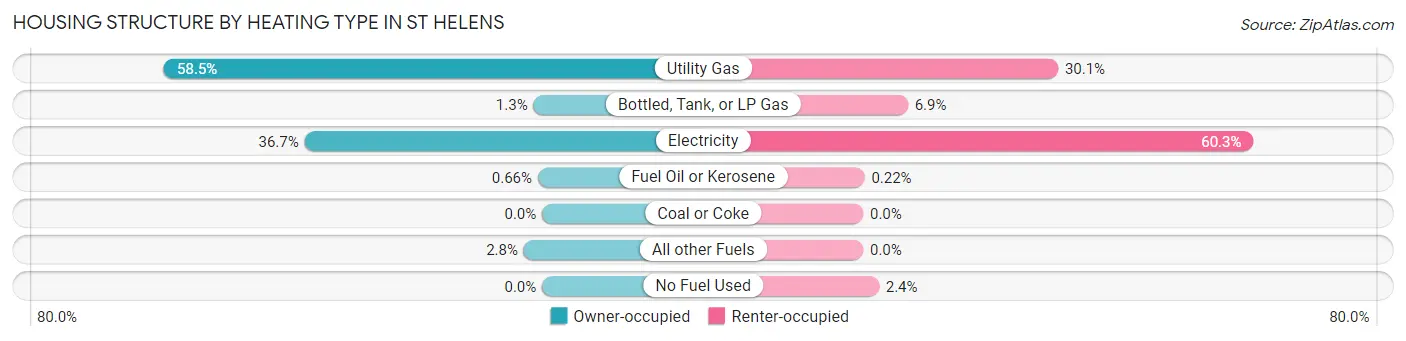
| Heating Type | Owner-occupied | Renter-occupied |
| Utility Gas | 1,939 (58.5%) | 559 (30.1%) |
| Bottled, Tank, or LP Gas | 44 (1.3%) | 128 (6.9%) |
| Electricity | 1,218 (36.7%) | 1,119 (60.3%) |
| Fuel Oil or Kerosene | 22 (0.7%) | 4 (0.2%) |
| Coal or Coke | 0 (0.0%) | 0 (0.0%) |
| All other Fuels | 94 (2.8%) | 0 (0.0%) |
| No Fuel Used | 0 (0.0%) | 45 (2.4%) |
| Total | 3,317 (100.0%) | 1,855 (100.0%) |
Household Vehicle Usage in St Helens
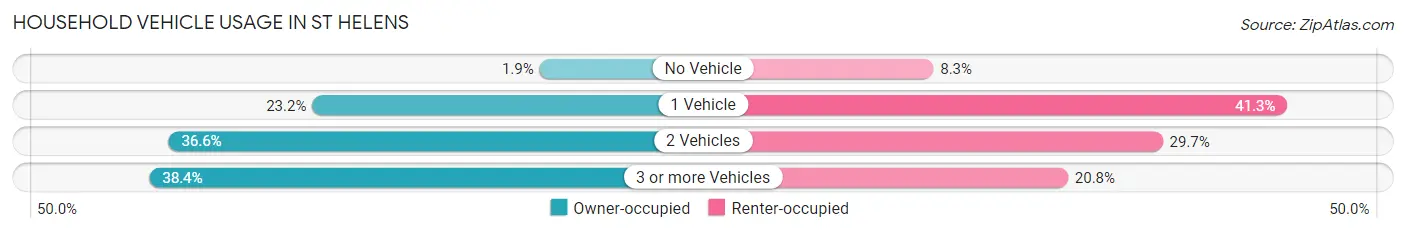
| Vehicles per Household | Owner-occupied | Renter-occupied |
| No Vehicle | 64 (1.9%) | 153 (8.3%) |
| 1 Vehicle | 768 (23.2%) | 766 (41.3%) |
| 2 Vehicles | 1,213 (36.6%) | 550 (29.6%) |
| 3 or more Vehicles | 1,272 (38.4%) | 386 (20.8%) |
| Total | 3,317 (100.0%) | 1,855 (100.0%) |
Real Estate & Mortgages in St Helens
Real Estate and Mortgage Overview in St Helens
| Characteristic | Without Mortgage | With Mortgage |
| Housing Units | 721 | 2,596 |
| Median Property Value | $280,300 | $320,300 |
| Median Household Income | $69,583 | $518 |
| Monthly Housing Costs | $573 | $73 |
| Real Estate Taxes | $2,454 | $64 |
Property Value by Mortgage Status in St Helens
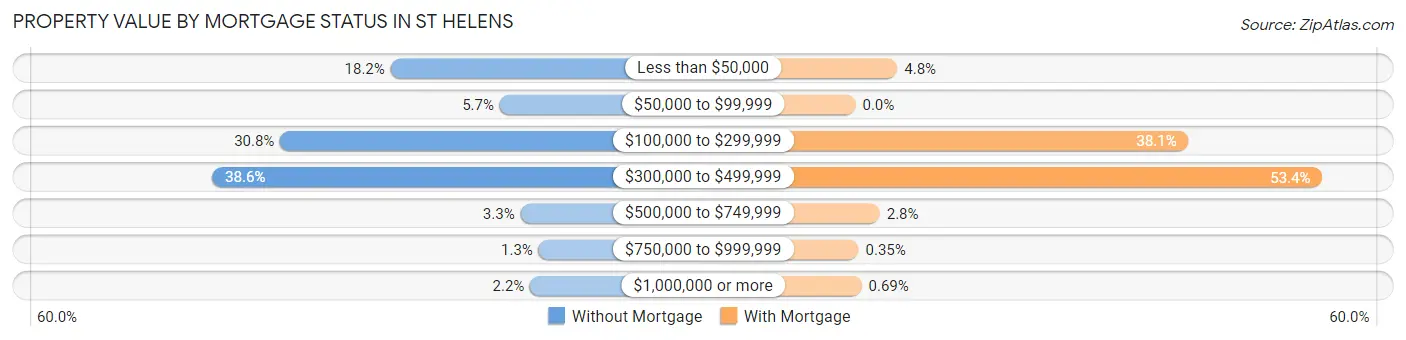
| Property Value | Without Mortgage | With Mortgage |
| Less than $50,000 | 131 (18.2%) | 124 (4.8%) |
| $50,000 to $99,999 | 41 (5.7%) | 0 (0.0%) |
| $100,000 to $299,999 | 222 (30.8%) | 988 (38.1%) |
| $300,000 to $499,999 | 278 (38.6%) | 1,385 (53.3%) |
| $500,000 to $749,999 | 24 (3.3%) | 72 (2.8%) |
| $750,000 to $999,999 | 9 (1.3%) | 9 (0.4%) |
| $1,000,000 or more | 16 (2.2%) | 18 (0.7%) |
| Total | 721 (100.0%) | 2,596 (100.0%) |
Household Income by Mortgage Status in St Helens
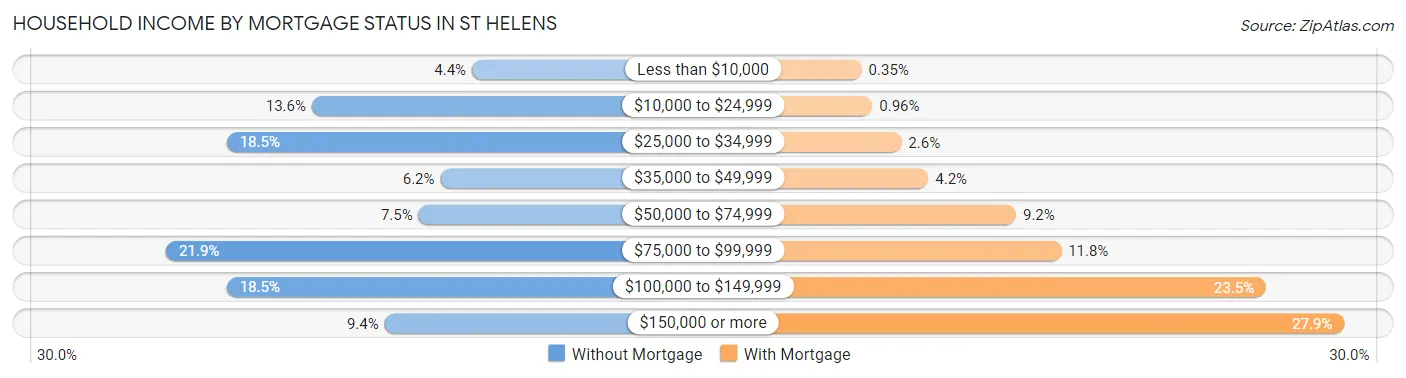
| Household Income | Without Mortgage | With Mortgage |
| Less than $10,000 | 32 (4.4%) | 9 (0.4%) |
| $10,000 to $24,999 | 98 (13.6%) | 25 (1.0%) |
| $25,000 to $34,999 | 133 (18.4%) | 68 (2.6%) |
| $35,000 to $49,999 | 45 (6.2%) | 108 (4.2%) |
| $50,000 to $74,999 | 54 (7.5%) | 238 (9.2%) |
| $75,000 to $99,999 | 158 (21.9%) | 305 (11.7%) |
| $100,000 to $149,999 | 133 (18.4%) | 609 (23.5%) |
| $150,000 or more | 68 (9.4%) | 725 (27.9%) |
| Total | 721 (100.0%) | 2,596 (100.0%) |
Property Value to Household Income Ratio in St Helens
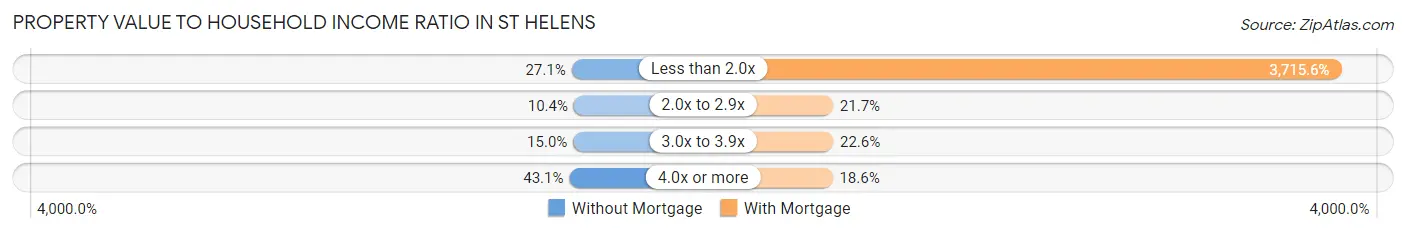
| Value-to-Income Ratio | Without Mortgage | With Mortgage |
| Less than 2.0x | 195 (27.1%) | 96,458 (3,715.6%) |
| 2.0x to 2.9x | 75 (10.4%) | 563 (21.7%) |
| 3.0x to 3.9x | 108 (15.0%) | 587 (22.6%) |
| 4.0x or more | 311 (43.1%) | 484 (18.6%) |
| Total | 721 (100.0%) | 2,596 (100.0%) |
Real Estate Taxes by Mortgage Status in St Helens
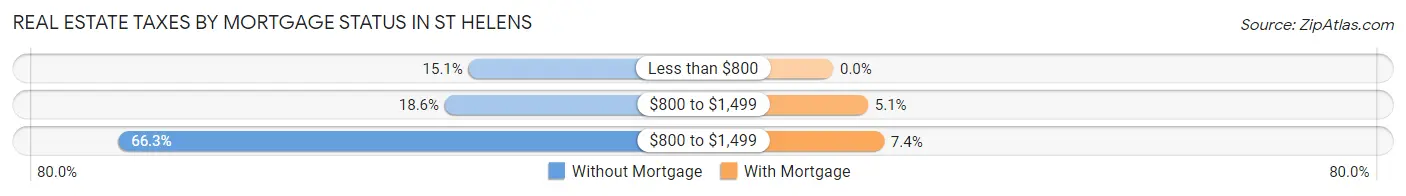
| Property Taxes | Without Mortgage | With Mortgage |
| Less than $800 | 109 (15.1%) | 0 (0.0%) |
| $800 to $1,499 | 134 (18.6%) | 132 (5.1%) |
| $800 to $1,499 | 478 (66.3%) | 193 (7.4%) |
| Total | 721 (100.0%) | 2,596 (100.0%) |
Health & Disability in St Helens
Health Insurance Coverage by Age in St Helens
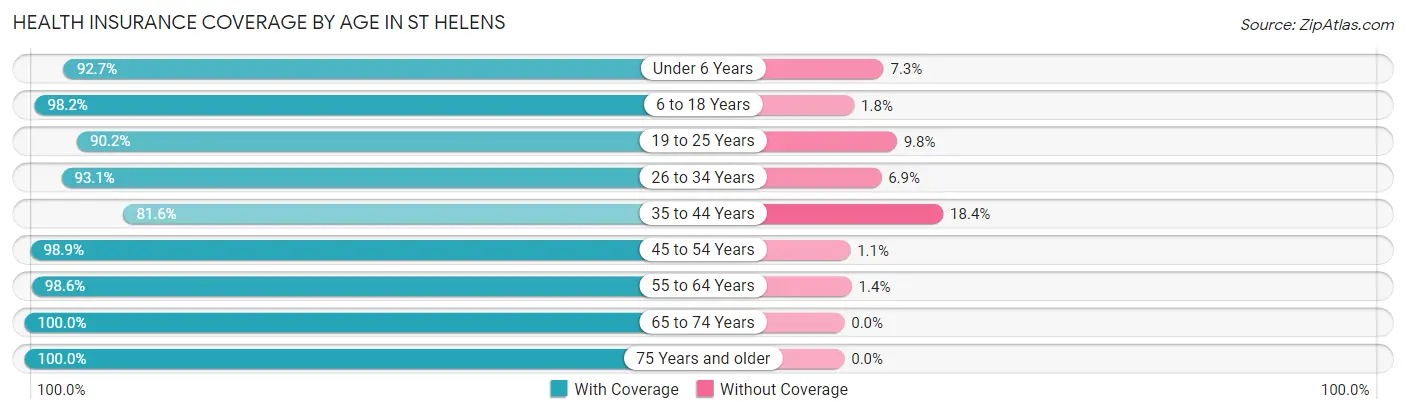
| Age Bracket | With Coverage | Without Coverage |
| Under 6 Years | 1,051 (92.7%) | 83 (7.3%) |
| 6 to 18 Years | 2,191 (98.2%) | 41 (1.8%) |
| 19 to 25 Years | 1,209 (90.2%) | 131 (9.8%) |
| 26 to 34 Years | 1,894 (93.1%) | 140 (6.9%) |
| 35 to 44 Years | 1,314 (81.6%) | 297 (18.4%) |
| 45 to 54 Years | 1,439 (98.9%) | 16 (1.1%) |
| 55 to 64 Years | 2,021 (98.6%) | 28 (1.4%) |
| 65 to 74 Years | 1,117 (100.0%) | 0 (0.0%) |
| 75 Years and older | 822 (100.0%) | 0 (0.0%) |
| Total | 13,058 (94.7%) | 736 (5.3%) |
Health Insurance Coverage by Citizenship Status in St Helens
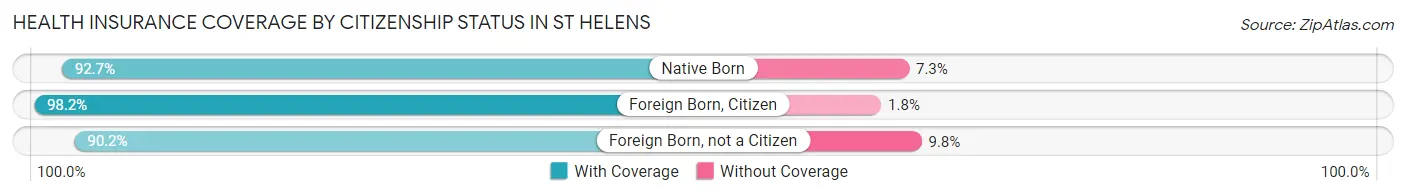
| Citizenship Status | With Coverage | Without Coverage |
| Native Born | 1,051 (92.7%) | 83 (7.3%) |
| Foreign Born, Citizen | 2,191 (98.2%) | 41 (1.8%) |
| Foreign Born, not a Citizen | 1,209 (90.2%) | 131 (9.8%) |
Health Insurance Coverage by Household Income in St Helens
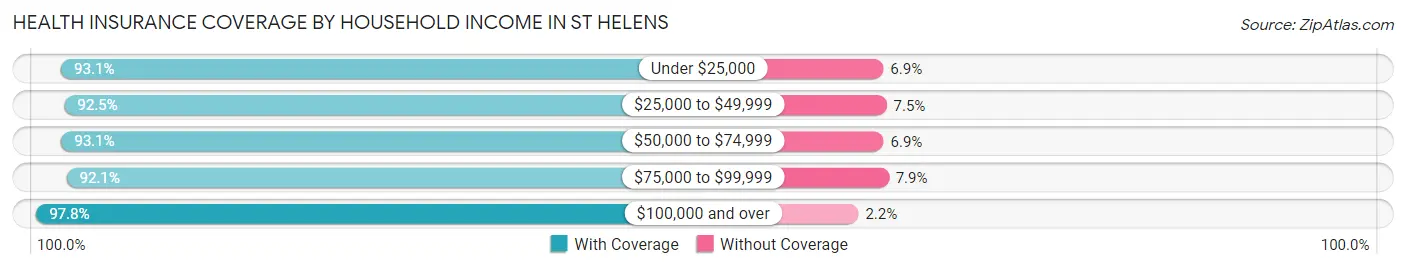
| Household Income | With Coverage | Without Coverage |
| Under $25,000 | 855 (93.1%) | 63 (6.9%) |
| $25,000 to $49,999 | 1,984 (92.5%) | 160 (7.5%) |
| $50,000 to $74,999 | 1,771 (93.1%) | 131 (6.9%) |
| $75,000 to $99,999 | 3,105 (92.1%) | 265 (7.9%) |
| $100,000 and over | 5,222 (97.8%) | 117 (2.2%) |
Public vs Private Health Insurance Coverage by Age in St Helens
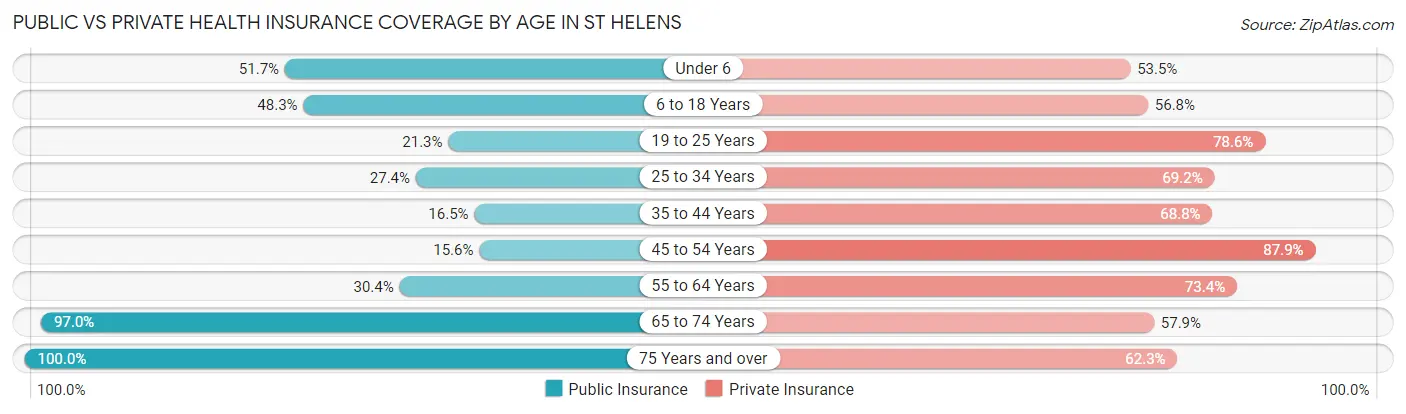
| Age Bracket | Public Insurance | Private Insurance |
| Under 6 | 586 (51.7%) | 607 (53.5%) |
| 6 to 18 Years | 1,077 (48.2%) | 1,268 (56.8%) |
| 19 to 25 Years | 286 (21.3%) | 1,053 (78.6%) |
| 25 to 34 Years | 557 (27.4%) | 1,407 (69.2%) |
| 35 to 44 Years | 266 (16.5%) | 1,108 (68.8%) |
| 45 to 54 Years | 227 (15.6%) | 1,279 (87.9%) |
| 55 to 64 Years | 623 (30.4%) | 1,503 (73.4%) |
| 65 to 74 Years | 1,083 (97.0%) | 647 (57.9%) |
| 75 Years and over | 822 (100.0%) | 512 (62.3%) |
| Total | 5,527 (40.1%) | 9,384 (68.0%) |
Disability Status by Sex by Age in St Helens
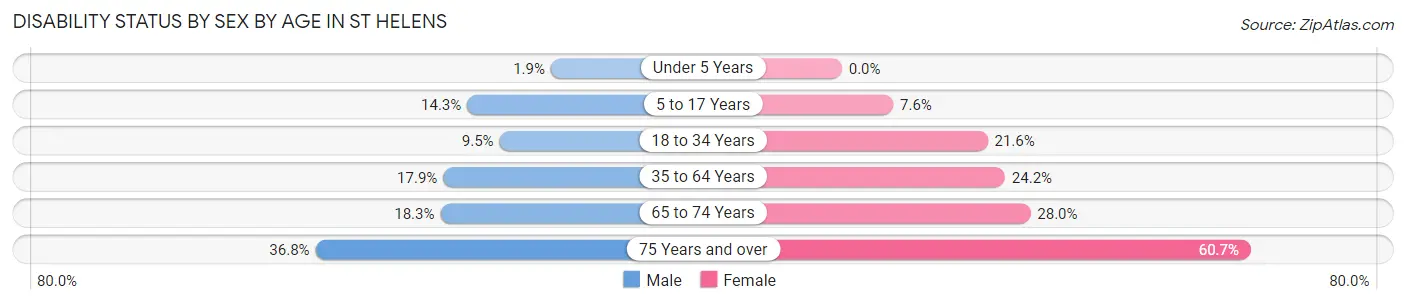
| Age Bracket | Male | Female |
| Under 5 Years | 12 (1.9%) | 0 (0.0%) |
| 5 to 17 Years | 183 (14.3%) | 69 (7.6%) |
| 18 to 34 Years | 178 (9.5%) | 365 (21.6%) |
| 35 to 64 Years | 439 (17.8%) | 643 (24.2%) |
| 65 to 74 Years | 99 (18.3%) | 161 (28.0%) |
| 75 Years and over | 102 (36.8%) | 331 (60.7%) |
Disability Class by Sex by Age in St Helens
Disability Class: Hearing Difficulty
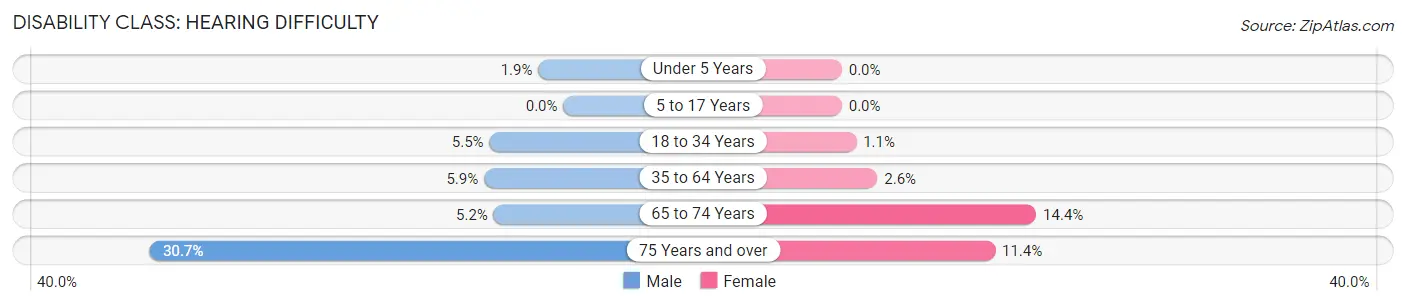
| Age Bracket | Male | Female |
| Under 5 Years | 12 (1.9%) | 0 (0.0%) |
| 5 to 17 Years | 0 (0.0%) | 0 (0.0%) |
| 18 to 34 Years | 103 (5.5%) | 18 (1.1%) |
| 35 to 64 Years | 145 (5.9%) | 70 (2.6%) |
| 65 to 74 Years | 28 (5.2%) | 83 (14.4%) |
| 75 Years and over | 85 (30.7%) | 62 (11.4%) |
Disability Class: Vision Difficulty
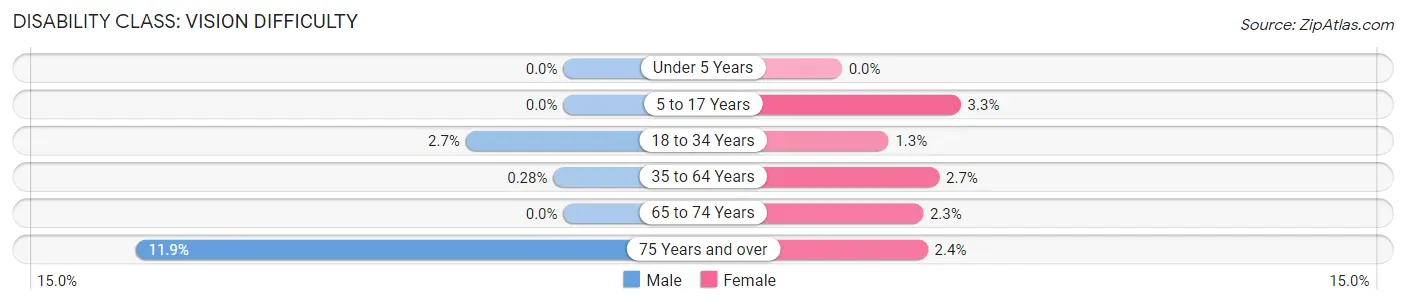
| Age Bracket | Male | Female |
| Under 5 Years | 0 (0.0%) | 0 (0.0%) |
| 5 to 17 Years | 0 (0.0%) | 30 (3.3%) |
| 18 to 34 Years | 51 (2.7%) | 22 (1.3%) |
| 35 to 64 Years | 7 (0.3%) | 72 (2.7%) |
| 65 to 74 Years | 0 (0.0%) | 13 (2.3%) |
| 75 Years and over | 33 (11.9%) | 13 (2.4%) |
Disability Class: Cognitive Difficulty
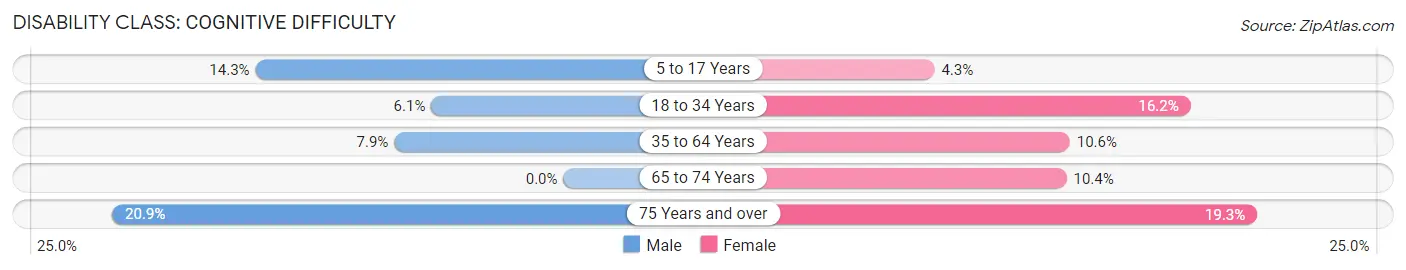
| Age Bracket | Male | Female |
| 5 to 17 Years | 183 (14.3%) | 39 (4.3%) |
| 18 to 34 Years | 115 (6.1%) | 273 (16.2%) |
| 35 to 64 Years | 193 (7.9%) | 281 (10.6%) |
| 65 to 74 Years | 0 (0.0%) | 60 (10.4%) |
| 75 Years and over | 58 (20.9%) | 105 (19.3%) |
Disability Class: Ambulatory Difficulty
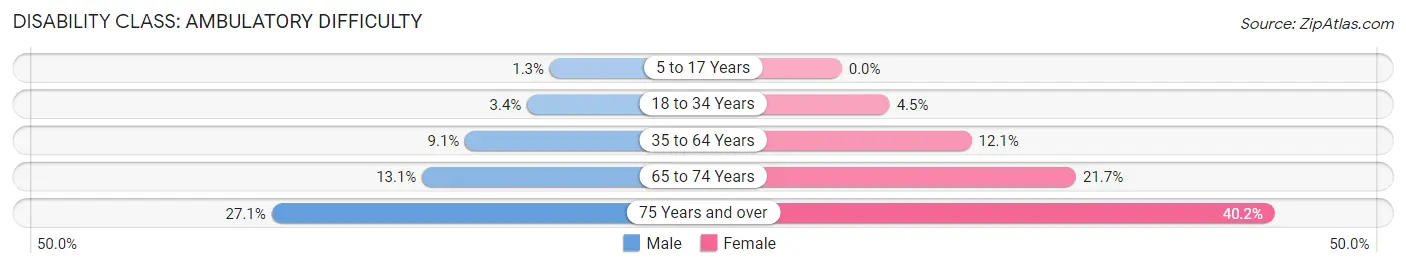
| Age Bracket | Male | Female |
| 5 to 17 Years | 16 (1.3%) | 0 (0.0%) |
| 18 to 34 Years | 63 (3.4%) | 75 (4.4%) |
| 35 to 64 Years | 224 (9.1%) | 320 (12.0%) |
| 65 to 74 Years | 71 (13.1%) | 125 (21.7%) |
| 75 Years and over | 75 (27.1%) | 219 (40.2%) |
Disability Class: Self-Care Difficulty
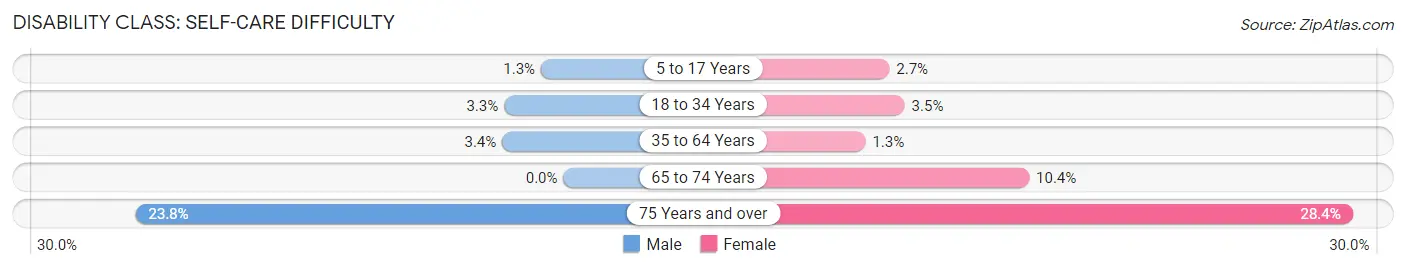
| Age Bracket | Male | Female |
| 5 to 17 Years | 16 (1.3%) | 24 (2.6%) |
| 18 to 34 Years | 62 (3.3%) | 59 (3.5%) |
| 35 to 64 Years | 84 (3.4%) | 35 (1.3%) |
| 65 to 74 Years | 0 (0.0%) | 60 (10.4%) |
| 75 Years and over | 66 (23.8%) | 155 (28.4%) |
Technology Access in St Helens
Computing Device Access in St Helens
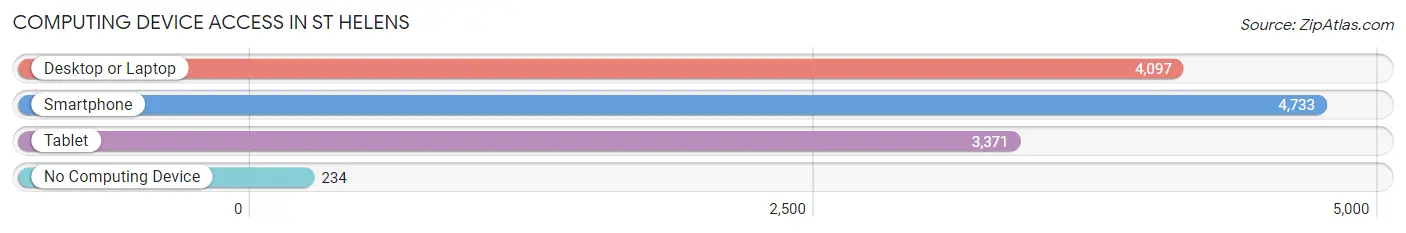
| Device Type | # Households | % Households |
| Desktop or Laptop | 4,097 | 79.2% |
| Smartphone | 4,733 | 91.5% |
| Tablet | 3,371 | 65.2% |
| No Computing Device | 234 | 4.5% |
| Total | 5,172 | 100.0% |
Internet Access in St Helens
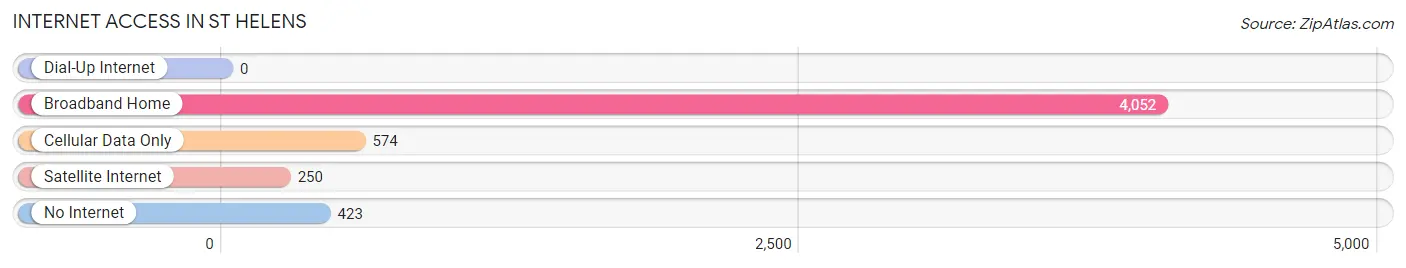
| Internet Type | # Households | % Households |
| Dial-Up Internet | 0 | 0.0% |
| Broadband Home | 4,052 | 78.3% |
| Cellular Data Only | 574 | 11.1% |
| Satellite Internet | 250 | 4.8% |
| No Internet | 423 | 8.2% |
| Total | 5,172 | 100.0% |
St Helens Summary
St Helens is a city located in Columbia County, Oregon, United States. It is situated on the Columbia River, approximately 30 miles northwest of Portland. The city is the county seat of Columbia County and is part of the Portland-Vancouver-Hillsboro Metropolitan Statistical Area. As of the 2010 census, the city had a population of 12,883.
History
The area that is now St Helens was first inhabited by the Clatsop and Chinook tribes. The first European settlers arrived in the area in the early 1800s. The first permanent settlement was established in 1845 by William H. Gray, who named the settlement St Helens after the nearby mountain. The city was incorporated in 1889.
In the early 1900s, St Helens was a major port on the Columbia River, with a large lumber industry. The city was also home to several canneries and a shipbuilding industry. The city experienced a period of growth in the 1950s and 1960s, when the population increased from 4,000 to over 10,000.
Geography
St Helens is located at 45°52'N 122°51'W (45.867, -122.850). The city is situated on the Columbia River, approximately 30 miles northwest of Portland. The city has a total area of 5.3 square miles, of which 5.2 square miles is land and 0.1 square miles is water.
The city is located in the foothills of the Cascade Mountains, and is surrounded by forests and rivers. The city is home to several parks, including the St Helens National Wildlife Refuge, which is home to a variety of wildlife, including bald eagles, ospreys, and elk.
Economy
St Helens is home to a variety of industries, including manufacturing, retail, and tourism. The city is home to several large employers, including Columbia Plywood, Columbia Forest Products, and Columbia River Paper. The city is also home to several small businesses, including restaurants, shops, and galleries.
The city is also home to a variety of recreational activities, including fishing, boating, and camping. The city is home to several parks, including the St Helens National Wildlife Refuge, which is home to a variety of wildlife, including bald eagles, ospreys, and elk.
Demographics
As of the 2010 census, the city had a population of 12,883. The racial makeup of the city was 90.2% White, 0.7% African American, 1.2% Native American, 1.2% Asian, 0.2% Pacific Islander, 3.2% from other races, and 3.3% from two or more races. Hispanic or Latino of any race were 6.3% of the population.
The median income for a household in the city was $41,945, and the median income for a family was $50,945. The per capita income for the city was $20,945. About 11.2% of families and 14.2% of the population were below the poverty line, including 19.2% of those under age 18 and 8.2% of those age 65 or over.
Common Questions
What is Per Capita Income in St Helens?
Per Capita income in St Helens is $33,261.
What is the Median Family Income in St Helens?
Median Family Income in St Helens is $84,753.
What is the Median Household income in St Helens?
Median Household Income in St Helens is $77,475.
What is Income or Wage Gap in St Helens?
Income or Wage Gap in St Helens is 28.3%.
Women in St Helens earn 71.7 cents for every dollar earned by a man.
What is Inequality or Gini Index in St Helens?
Inequality or Gini Index in St Helens is 0.39.
What is the Total Population of St Helens?
Total Population of St Helens is 14,015.
What is the Total Male Population of St Helens?
Total Male Population of St Helens is 7,259.
What is the Total Female Population of St Helens?
Total Female Population of St Helens is 6,756.
What is the Ratio of Males per 100 Females in St Helens?
There are 107.45 Males per 100 Females in St Helens.
What is the Ratio of Females per 100 Males in St Helens?
There are 93.07 Females per 100 Males in St Helens.
What is the Median Population Age in St Helens?
Median Population Age in St Helens is 36.3 Years.
What is the Average Family Size in St Helens
Average Family Size in St Helens is 3.0 People.
What is the Average Household Size in St Helens
Average Household Size in St Helens is 2.6 People.
How Large is the Labor Force in St Helens?
There are 7,201 People in the Labor Forcein in St Helens.
What is the Percentage of People in the Labor Force in St Helens?
64.2% of People are in the Labor Force in St Helens.
What is the Unemployment Rate in St Helens?
Unemployment Rate in St Helens is 4.8%.