Oregon City, OR Map & Demographics
Oregon City Map
Oregon City Overview
$40,837
PER CAPITA INCOME
$106,291
AVG FAMILY INCOME
$90,174
AVG HOUSEHOLD INCOME
29.7%
WAGE / INCOME GAP [ % ]
70.3¢/ $1
WAGE / INCOME GAP [ $ ]
0.38
INEQUALITY / GINI INDEX
37,418
TOTAL POPULATION
18,536
MALE POPULATION
18,882
FEMALE POPULATION
98.17
MALES / 100 FEMALES
101.87
FEMALES / 100 MALES
37.1
MEDIAN AGE
3.1
AVG FAMILY SIZE
2.6
AVG HOUSEHOLD SIZE
19,951
LABOR FORCE [ PEOPLE ]
66.4%
PERCENT IN LABOR FORCE
5.0%
UNEMPLOYMENT RATE
Oregon City Zip Codes
Income in Oregon City
Income Overview in Oregon City
Per Capita Income in Oregon City is $40,837, while median incomes of families and households are $106,291 and $90,174 respectively.
| Characteristic | Number | Measure |
| Per Capita Income | 37,418 | $40,837 |
| Median Family Income | 9,350 | $106,291 |
| Mean Family Income | 9,350 | $121,018 |
| Median Household Income | 13,802 | $90,174 |
| Mean Household Income | 13,802 | $107,755 |
| Income Deficit | 9,350 | $0 |
| Wage / Income Gap (%) | 37,418 | 29.67% |
| Wage / Income Gap ($) | 37,418 | 70.33¢ per $1 |
| Gini / Inequality Index | 37,418 | 0.38 |
Earnings by Sex in Oregon City
Average Earnings in Oregon City are $48,842, $56,744 for men and $39,906 for women, a difference of 29.7%.
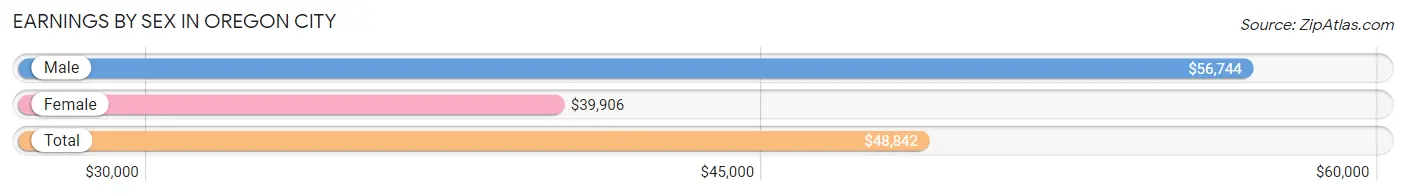
| Sex | Number | Average Earnings |
| Male | 11,249 (53.9%) | $56,744 |
| Female | 9,617 (46.1%) | $39,906 |
| Total | 20,866 (100.0%) | $48,842 |
Earnings by Sex by Income Bracket in Oregon City
The most common earnings brackets in Oregon City are $100,000+ for men (2,327 | 20.7%) and $75,000 to $99,999 for women (1,039 | 10.8%).
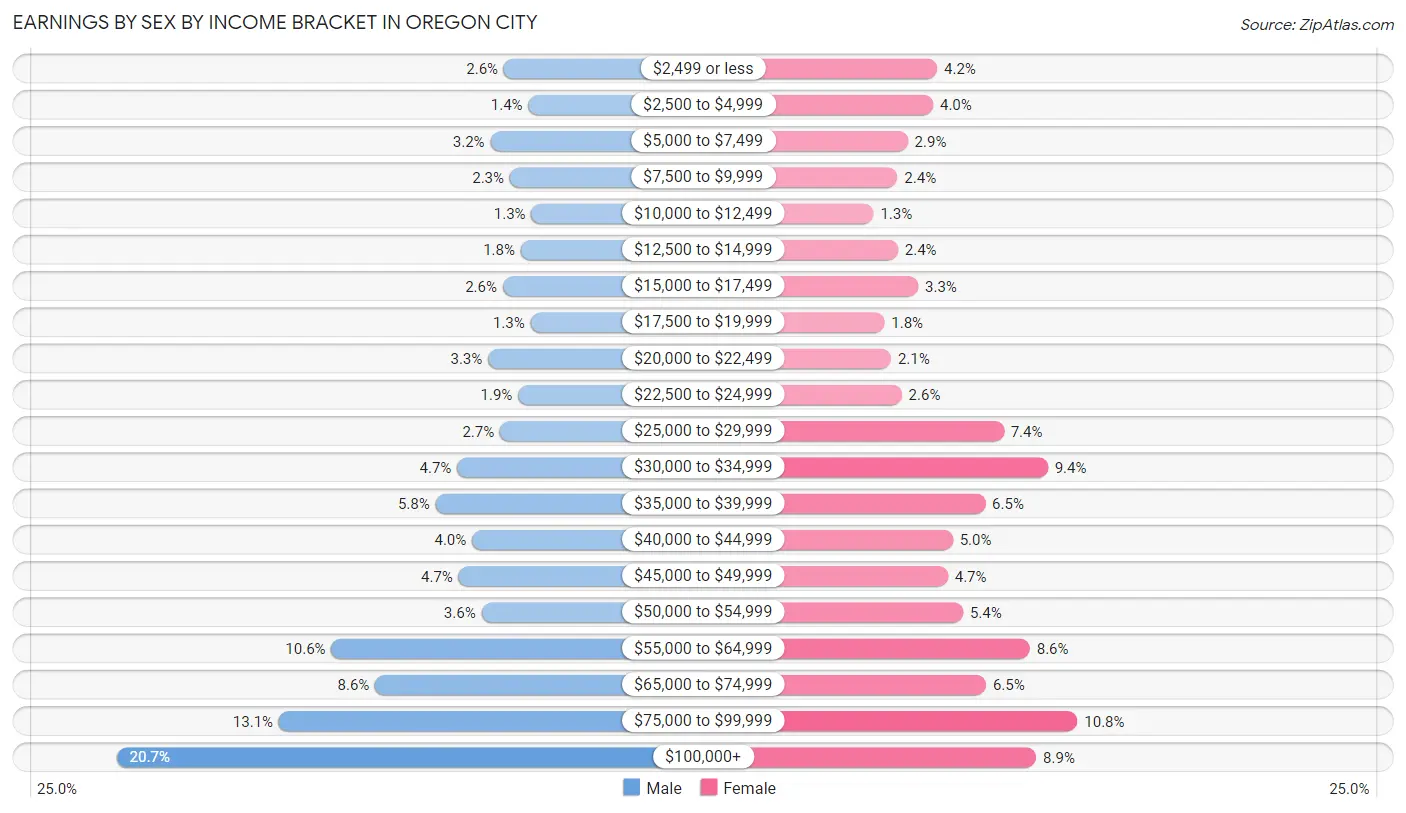
| Income | Male | Female |
| $2,499 or less | 287 (2.5%) | 407 (4.2%) |
| $2,500 to $4,999 | 158 (1.4%) | 389 (4.0%) |
| $5,000 to $7,499 | 358 (3.2%) | 274 (2.9%) |
| $7,500 to $9,999 | 255 (2.3%) | 228 (2.4%) |
| $10,000 to $12,499 | 142 (1.3%) | 120 (1.3%) |
| $12,500 to $14,999 | 198 (1.8%) | 230 (2.4%) |
| $15,000 to $17,499 | 293 (2.6%) | 321 (3.3%) |
| $17,500 to $19,999 | 146 (1.3%) | 169 (1.8%) |
| $20,000 to $22,499 | 370 (3.3%) | 199 (2.1%) |
| $22,500 to $24,999 | 211 (1.9%) | 247 (2.6%) |
| $25,000 to $29,999 | 307 (2.7%) | 707 (7.3%) |
| $30,000 to $34,999 | 533 (4.7%) | 905 (9.4%) |
| $35,000 to $39,999 | 647 (5.8%) | 623 (6.5%) |
| $40,000 to $44,999 | 454 (4.0%) | 477 (5.0%) |
| $45,000 to $49,999 | 525 (4.7%) | 455 (4.7%) |
| $50,000 to $54,999 | 405 (3.6%) | 523 (5.4%) |
| $55,000 to $64,999 | 1,196 (10.6%) | 824 (8.6%) |
| $65,000 to $74,999 | 965 (8.6%) | 627 (6.5%) |
| $75,000 to $99,999 | 1,472 (13.1%) | 1,039 (10.8%) |
| $100,000+ | 2,327 (20.7%) | 853 (8.9%) |
| Total | 11,249 (100.0%) | 9,617 (100.0%) |
Earnings by Sex by Educational Attainment in Oregon City
Average earnings in Oregon City are $62,175 for men and $45,912 for women, a difference of 26.2%. Men with an educational attainment of graduate degree enjoy the highest average annual earnings of $87,431, while those with less than high school education earn the least with $27,250. Women with an educational attainment of graduate degree earn the most with the average annual earnings of $72,745, while those with high school diploma education have the smallest earnings of $36,142.
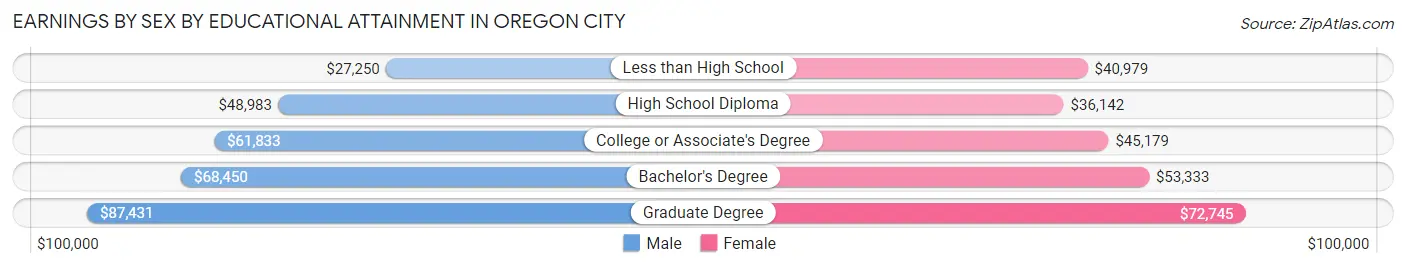
| Educational Attainment | Male Income | Female Income |
| Less than High School | $27,250 | $40,979 |
| High School Diploma | $48,983 | $36,142 |
| College or Associate's Degree | $61,833 | $45,179 |
| Bachelor's Degree | $68,450 | $53,333 |
| Graduate Degree | $87,431 | $72,745 |
| Total | $62,175 | $45,912 |
Family Income in Oregon City
Family Income Brackets in Oregon City
According to the Oregon City family income data, there are 2,179 families falling into the $100,000 to $149,999 income range, which is the most common income bracket and makes up 23.3% of all families. Conversely, the less than $10,000 income bracket is the least frequent group with only 159 families (1.7%) belonging to this category.
| Income Bracket | # Families | % Families |
| Less than $10,000 | 159 | 1.7% |
| $10,000 to $14,999 | 196 | 2.1% |
| $15,000 to $24,999 | 159 | 1.7% |
| $25,000 to $34,999 | 290 | 3.1% |
| $35,000 to $49,999 | 505 | 5.4% |
| $50,000 to $74,999 | 1,580 | 16.9% |
| $75,000 to $99,999 | 1,505 | 16.1% |
| $100,000 to $149,999 | 2,179 | 23.3% |
| $150,000 to $199,999 | 1,590 | 17.0% |
| $200,000+ | 1,187 | 12.7% |
Family Income by Famaliy Size in Oregon City
4-person families (1,794 | 19.2%) account for the highest median family income in Oregon City with $142,635 per family, while 2-person families (4,242 | 45.4%) have the highest median income of $44,175 per family member.
| Income Bracket | # Families | Median Income |
| 2-Person Families | 4,242 (45.4%) | $88,350 |
| 3-Person Families | 2,225 (23.8%) | $112,708 |
| 4-Person Families | 1,794 (19.2%) | $142,635 |
| 5-Person Families | 834 (8.9%) | $111,607 |
| 6-Person Families | 82 (0.9%) | $128,462 |
| 7+ Person Families | 173 (1.8%) | $0 |
| Total | 9,350 (100.0%) | $106,291 |
Family Income by Number of Earners in Oregon City
The median family income in Oregon City is $106,291, with families comprising 3+ earners (1,122) having the highest median family income of $169,306, while families with no earners (1,167) have the lowest median family income of $71,458, accounting for 12.0% and 12.5% of families, respectively.
| Number of Earners | # Families | Median Income |
| No Earners | 1,167 (12.5%) | $71,458 |
| 1 Earner | 2,839 (30.4%) | $72,986 |
| 2 Earners | 4,222 (45.2%) | $124,918 |
| 3+ Earners | 1,122 (12.0%) | $169,306 |
| Total | 9,350 (100.0%) | $106,291 |
Household Income in Oregon City
Household Income Brackets in Oregon City
With 2,788 households falling in the category, the $100,000 to $149,999 income range is the most frequent in Oregon City, accounting for 20.2% of all households. In contrast, only 345 households (2.5%) fall into the less than $10,000 income bracket, making it the least populous group.
| Income Bracket | # Households | % Households |
| Less than $10,000 | 345 | 2.5% |
| $10,000 to $14,999 | 373 | 2.7% |
| $15,000 to $24,999 | 552 | 4.0% |
| $25,000 to $34,999 | 649 | 4.7% |
| $35,000 to $49,999 | 1,187 | 8.6% |
| $50,000 to $74,999 | 2,457 | 17.8% |
| $75,000 to $99,999 | 2,167 | 15.7% |
| $100,000 to $149,999 | 2,788 | 20.2% |
| $150,000 to $199,999 | 1,808 | 13.1% |
| $200,000+ | 1,504 | 10.9% |
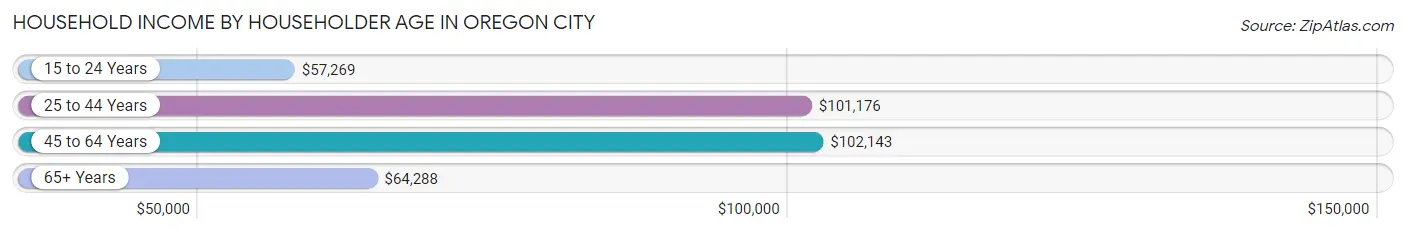
Household Income by Householder Age in Oregon City
The median household income in Oregon City is $90,174, with the highest median household income of $102,143 found in the 45 to 64 years age bracket for the primary householder. A total of 5,324 households (38.6%) fall into this category. Meanwhile, the 15 to 24 years age bracket for the primary householder has the lowest median household income of $57,269, with 295 households (2.1%) in this group.
| Income Bracket | # Households | Median Income |
| 15 to 24 Years | 295 (2.1%) | $57,269 |
| 25 to 44 Years | 4,902 (35.5%) | $101,176 |
| 45 to 64 Years | 5,324 (38.6%) | $102,143 |
| 65+ Years | 3,281 (23.8%) | $64,288 |
| Total | 13,802 (100.0%) | $90,174 |
Poverty in Oregon City
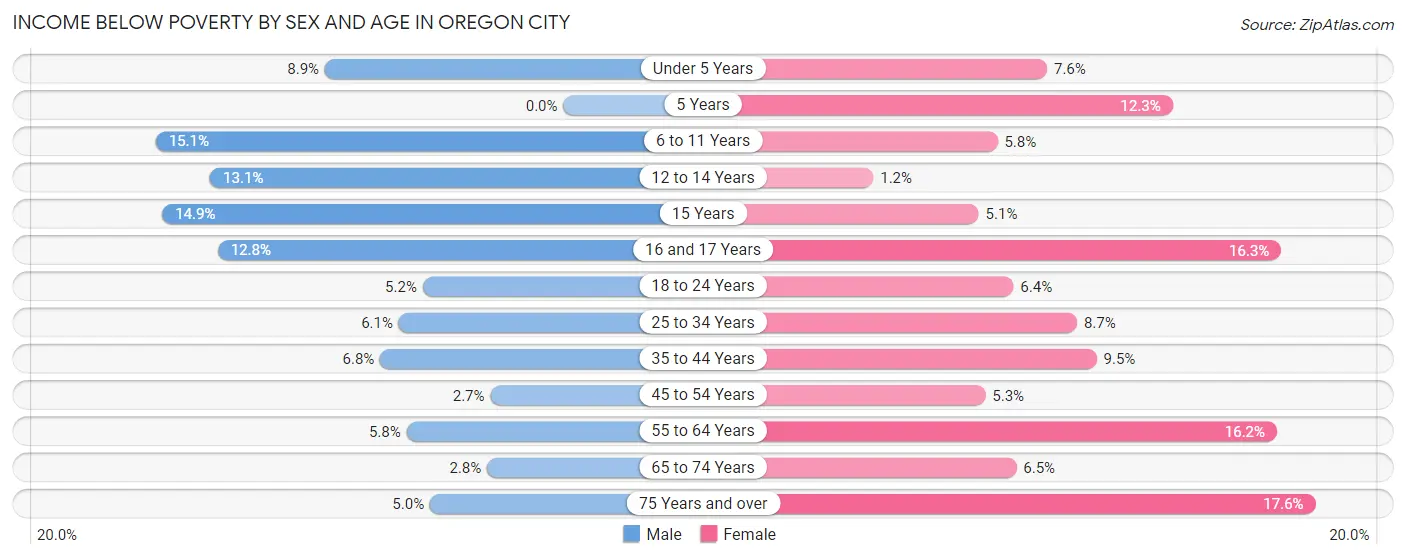
Income Below Poverty by Sex and Age in Oregon City
With 6.5% poverty level for males and 9.1% for females among the residents of Oregon City, 6 to 11 year old males and 75 year old and over females are the most vulnerable to poverty, with 182 males (15.1%) and 199 females (17.6%) in their respective age groups living below the poverty level.
| Age Bracket | Male | Female |
| Under 5 Years | 102 (8.8%) | 76 (7.6%) |
| 5 Years | 0 (0.0%) | 41 (12.3%) |
| 6 to 11 Years | 182 (15.1%) | 92 (5.8%) |
| 12 to 14 Years | 67 (13.1%) | 7 (1.2%) |
| 15 Years | 35 (14.9%) | 15 (5.1%) |
| 16 and 17 Years | 59 (12.8%) | 61 (16.3%) |
| 18 to 24 Years | 79 (5.2%) | 94 (6.4%) |
| 25 to 34 Years | 181 (6.1%) | 245 (8.7%) |
| 35 to 44 Years | 191 (6.8%) | 228 (9.5%) |
| 45 to 54 Years | 67 (2.7%) | 130 (5.3%) |
| 55 to 64 Years | 122 (5.8%) | 385 (16.2%) |
| 65 to 74 Years | 43 (2.8%) | 111 (6.5%) |
| 75 Years and over | 41 (5.0%) | 199 (17.6%) |
| Total | 1,169 (6.5%) | 1,684 (9.1%) |
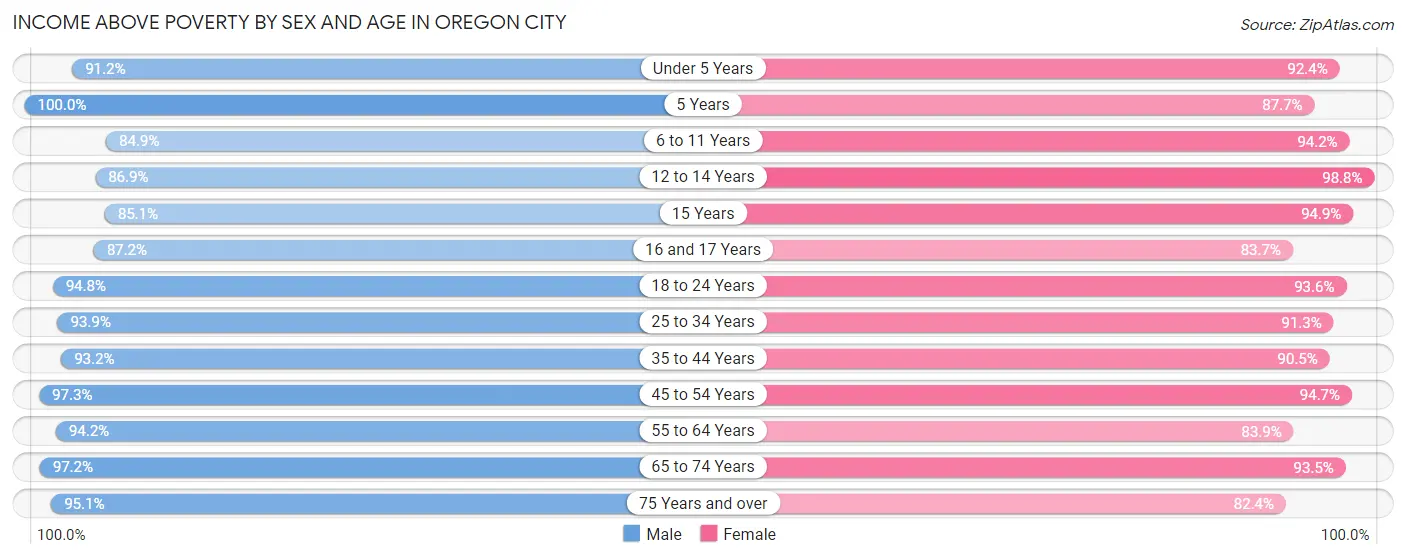
Income Above Poverty by Sex and Age in Oregon City
According to the poverty statistics in Oregon City, males aged 5 years and females aged 12 to 14 years are the age groups that are most secure financially, with 100.0% of males and 98.8% of females in these age groups living above the poverty line.
| Age Bracket | Male | Female |
| Under 5 Years | 1,050 (91.1%) | 922 (92.4%) |
| 5 Years | 262 (100.0%) | 293 (87.7%) |
| 6 to 11 Years | 1,021 (84.9%) | 1,501 (94.2%) |
| 12 to 14 Years | 444 (86.9%) | 590 (98.8%) |
| 15 Years | 200 (85.1%) | 280 (94.9%) |
| 16 and 17 Years | 401 (87.2%) | 313 (83.7%) |
| 18 to 24 Years | 1,433 (94.8%) | 1,382 (93.6%) |
| 25 to 34 Years | 2,779 (93.9%) | 2,561 (91.3%) |
| 35 to 44 Years | 2,618 (93.2%) | 2,183 (90.5%) |
| 45 to 54 Years | 2,408 (97.3%) | 2,310 (94.7%) |
| 55 to 64 Years | 1,975 (94.2%) | 1,999 (83.9%) |
| 65 to 74 Years | 1,475 (97.2%) | 1,602 (93.5%) |
| 75 Years and over | 787 (95.1%) | 933 (82.4%) |
| Total | 16,853 (93.5%) | 16,869 (90.9%) |
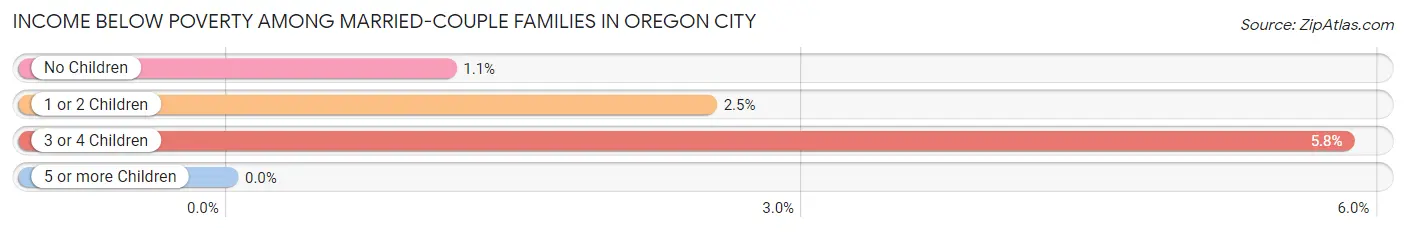
Income Below Poverty Among Married-Couple Families in Oregon City
The poverty statistics for married-couple families in Oregon City show that 1.9% or 137 of the total 7,216 families live below the poverty line. Families with 3 or 4 children have the highest poverty rate of 5.8%, comprising of 26 families. On the other hand, families with 5 or more children have the lowest poverty rate of 0.0%, which includes 0 families.
| Children | Above Poverty | Below Poverty |
| No Children | 3,985 (98.9%) | 46 (1.1%) |
| 1 or 2 Children | 2,533 (97.5%) | 65 (2.5%) |
| 3 or 4 Children | 420 (94.2%) | 26 (5.8%) |
| 5 or more Children | 141 (100.0%) | 0 (0.0%) |
| Total | 7,079 (98.1%) | 137 (1.9%) |
Income Below Poverty Among Single-Parent Households in Oregon City
According to the poverty data in Oregon City, 3.4% or 21 single-father households and 21.0% or 318 single-mother households are living below the poverty line. Among single-father households, those with no children have the highest poverty rate, with 21 households (5.7%) experiencing poverty. Likewise, among single-mother households, those with 1 or 2 children have the highest poverty rate, with 290 households (30.3%) falling below the poverty line.
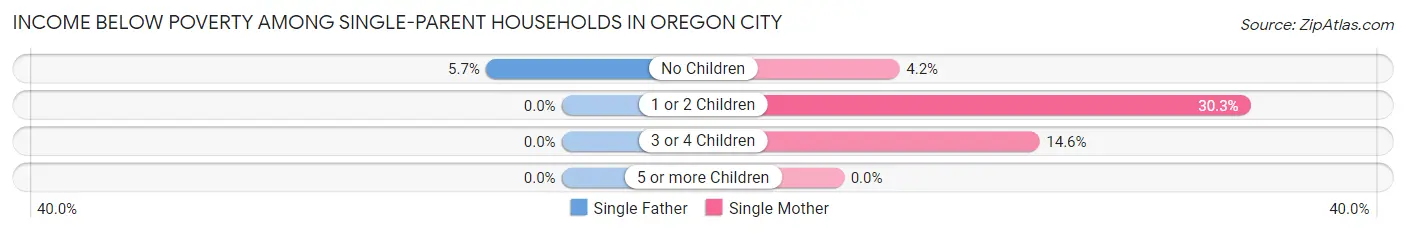
| Children | Single Father | Single Mother |
| No Children | 21 (5.7%) | 21 (4.2%) |
| 1 or 2 Children | 0 (0.0%) | 290 (30.3%) |
| 3 or 4 Children | 0 (0.0%) | 7 (14.6%) |
| 5 or more Children | 0 (0.0%) | 0 (0.0%) |
| Total | 21 (3.4%) | 318 (21.0%) |
Income Below Poverty Among Married-Couple vs Single-Parent Households in Oregon City
The poverty data for Oregon City shows that 137 of the married-couple family households (1.9%) and 339 of the single-parent households (15.9%) are living below the poverty level. Within the married-couple family households, those with 3 or 4 children have the highest poverty rate, with 26 households (5.8%) falling below the poverty line. Among the single-parent households, those with 1 or 2 children have the highest poverty rate, with 290 household (24.2%) living below poverty.
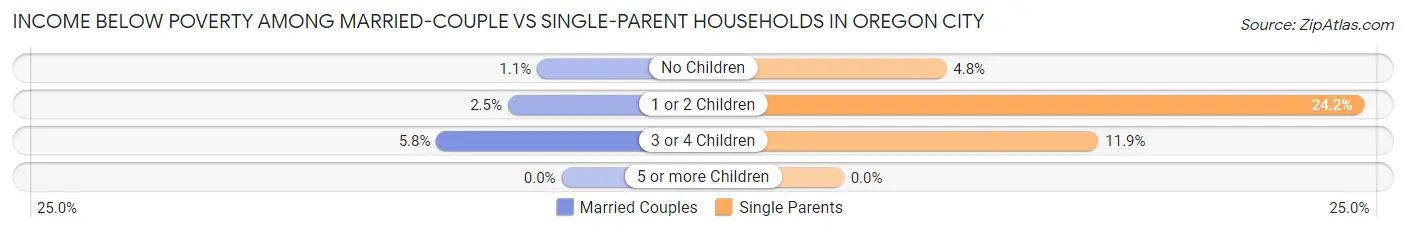
| Children | Married-Couple Families | Single-Parent Households |
| No Children | 46 (1.1%) | 42 (4.8%) |
| 1 or 2 Children | 65 (2.5%) | 290 (24.2%) |
| 3 or 4 Children | 26 (5.8%) | 7 (11.9%) |
| 5 or more Children | 0 (0.0%) | 0 (0.0%) |
| Total | 137 (1.9%) | 339 (15.9%) |
Race in Oregon City
The most populous races in Oregon City are White / Caucasian (33,890 | 90.6%), Two or more Races (2,048 | 5.5%), and Hispanic or Latino (1,850 | 4.9%).
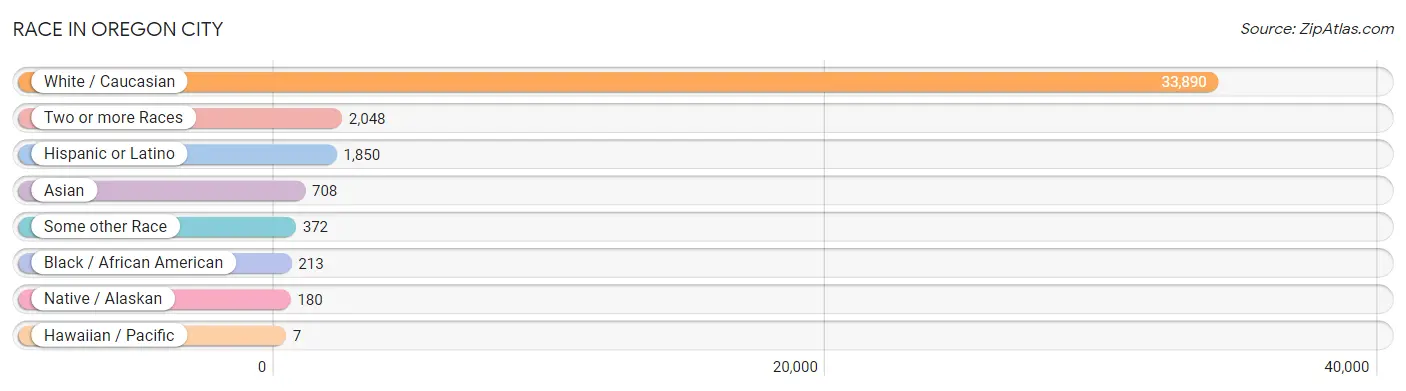
| Race | # Population | % Population |
| Asian | 708 | 1.9% |
| Black / African American | 213 | 0.6% |
| Hawaiian / Pacific | 7 | 0.0% |
| Hispanic or Latino | 1,850 | 4.9% |
| Native / Alaskan | 180 | 0.5% |
| White / Caucasian | 33,890 | 90.6% |
| Two or more Races | 2,048 | 5.5% |
| Some other Race | 372 | 1.0% |
| Total | 37,418 | 100.0% |
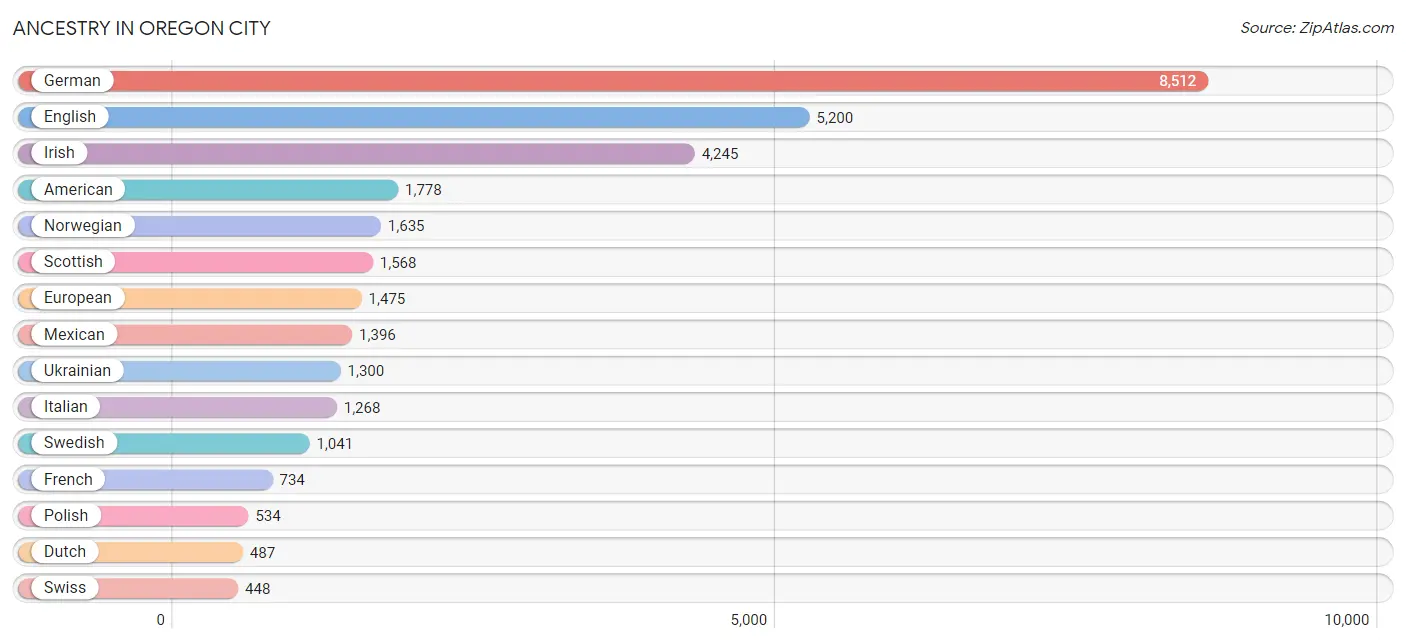
Ancestry in Oregon City
The most populous ancestries reported in Oregon City are German (8,512 | 22.8%), English (5,200 | 13.9%), Irish (4,245 | 11.3%), American (1,778 | 4.8%), and Norwegian (1,635 | 4.4%), together accounting for 57.1% of all Oregon City residents.
| Ancestry | # Population | % Population |
| African | 9 | 0.0% |
| American | 1,778 | 4.8% |
| Apache | 25 | 0.1% |
| Arab | 60 | 0.2% |
| Australian | 58 | 0.2% |
| Austrian | 69 | 0.2% |
| Bahamian | 16 | 0.0% |
| Belgian | 26 | 0.1% |
| Bhutanese | 117 | 0.3% |
| Blackfeet | 10 | 0.0% |
| Bolivian | 13 | 0.0% |
| British | 187 | 0.5% |
| Bulgarian | 16 | 0.0% |
| Burmese | 52 | 0.1% |
| Canadian | 123 | 0.3% |
| Central American | 43 | 0.1% |
| Cherokee | 161 | 0.4% |
| Chickasaw | 27 | 0.1% |
| Chilean | 18 | 0.1% |
| Chippewa | 19 | 0.1% |
| Choctaw | 26 | 0.1% |
| Creek | 24 | 0.1% |
| Croatian | 91 | 0.2% |
| Cuban | 8 | 0.0% |
| Czech | 117 | 0.3% |
| Czechoslovakian | 93 | 0.3% |
| Danish | 434 | 1.2% |
| Dutch | 487 | 1.3% |
| Eastern European | 114 | 0.3% |
| Ecuadorian | 55 | 0.2% |
| English | 5,200 | 13.9% |
| European | 1,475 | 3.9% |
| Finnish | 268 | 0.7% |
| French | 734 | 2.0% |
| French American Indian | 2 | 0.0% |
| French Canadian | 162 | 0.4% |
| German | 8,512 | 22.8% |
| German Russian | 90 | 0.2% |
| Greek | 170 | 0.4% |
| Hungarian | 182 | 0.5% |
| Indian (Asian) | 388 | 1.0% |
| Iranian | 44 | 0.1% |
| Irish | 4,245 | 11.3% |
| Iroquois | 9 | 0.0% |
| Italian | 1,268 | 3.4% |
| Jamaican | 6 | 0.0% |
| Kenyan | 9 | 0.0% |
| Korean | 354 | 0.9% |
| Laotian | 26 | 0.1% |
| Lebanese | 37 | 0.1% |
| Lithuanian | 74 | 0.2% |
| Malaysian | 132 | 0.4% |
| Maltese | 26 | 0.1% |
| Mexican | 1,396 | 3.7% |
| Native Hawaiian | 39 | 0.1% |
| Navajo | 7 | 0.0% |
| New Zealander | 2 | 0.0% |
| Nicaraguan | 20 | 0.1% |
| Nigerian | 103 | 0.3% |
| Northern European | 202 | 0.5% |
| Norwegian | 1,635 | 4.4% |
| Ottawa | 9 | 0.0% |
| Pakistani | 29 | 0.1% |
| Polish | 534 | 1.4% |
| Portuguese | 264 | 0.7% |
| Potawatomi | 14 | 0.0% |
| Puerto Rican | 139 | 0.4% |
| Romanian | 413 | 1.1% |
| Russian | 265 | 0.7% |
| Salvadoran | 23 | 0.1% |
| Scandinavian | 289 | 0.8% |
| Scotch-Irish | 386 | 1.0% |
| Scottish | 1,568 | 4.2% |
| Sioux | 36 | 0.1% |
| Slovak | 19 | 0.1% |
| Slovene | 26 | 0.1% |
| Somali | 8 | 0.0% |
| South American | 124 | 0.3% |
| South American Indian | 13 | 0.0% |
| Spaniard | 34 | 0.1% |
| Spanish | 86 | 0.2% |
| Sri Lankan | 86 | 0.2% |
| Subsaharan African | 129 | 0.3% |
| Swedish | 1,041 | 2.8% |
| Swiss | 448 | 1.2% |
| Syrian | 12 | 0.0% |
| Thai | 4 | 0.0% |
| Ukrainian | 1,300 | 3.5% |
| Uruguayan | 38 | 0.1% |
| Welsh | 385 | 1.0% |
| Yakama | 50 | 0.1% | View All 91 Rows |
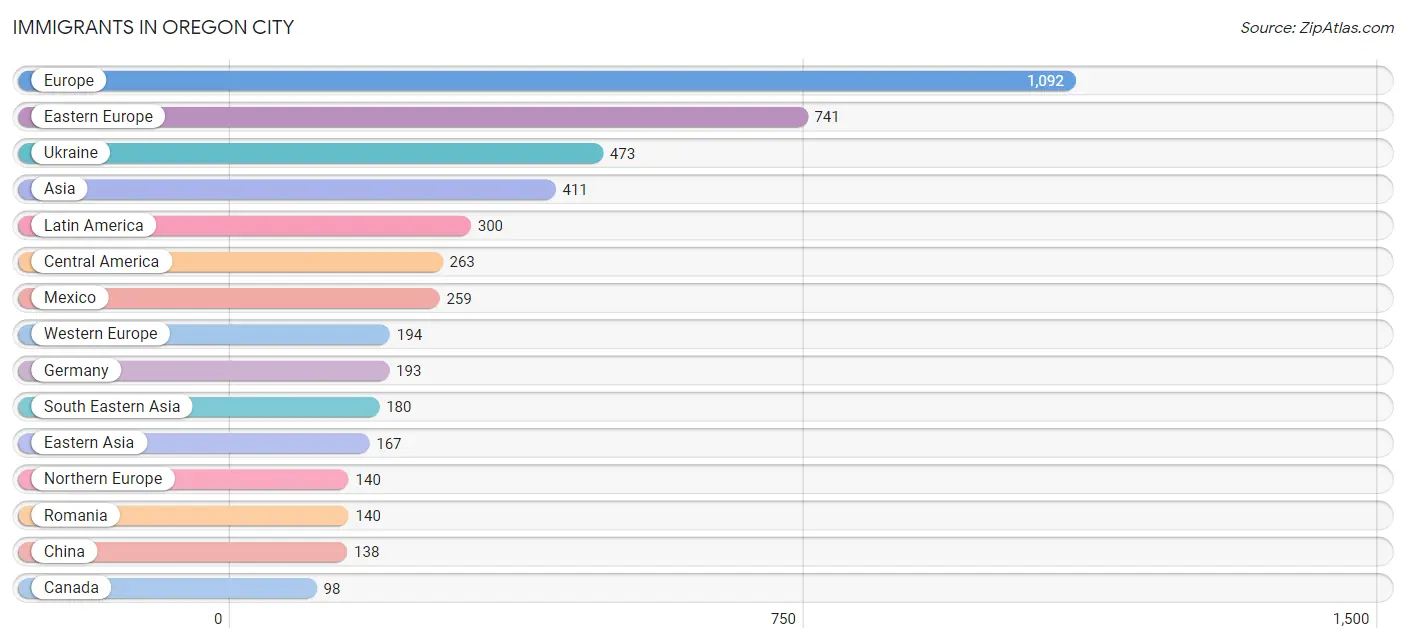
Immigrants in Oregon City
The most numerous immigrant groups reported in Oregon City came from Europe (1,092 | 2.9%), Eastern Europe (741 | 2.0%), Ukraine (473 | 1.3%), Asia (411 | 1.1%), and Latin America (300 | 0.8%), together accounting for 8.1% of all Oregon City residents.
| Immigration Origin | # Population | % Population |
| Africa | 22 | 0.1% |
| Asia | 411 | 1.1% |
| Bahamas | 16 | 0.0% |
| Bolivia | 13 | 0.0% |
| Brazil | 8 | 0.0% |
| Canada | 98 | 0.3% |
| Caribbean | 16 | 0.0% |
| Central America | 263 | 0.7% |
| China | 138 | 0.4% |
| Croatia | 9 | 0.0% |
| Czechoslovakia | 31 | 0.1% |
| Eastern Africa | 8 | 0.0% |
| Eastern Asia | 167 | 0.4% |
| Eastern Europe | 741 | 2.0% |
| England | 76 | 0.2% |
| Europe | 1,092 | 2.9% |
| Germany | 193 | 0.5% |
| Hong Kong | 11 | 0.0% |
| Iran | 27 | 0.1% |
| Israel | 16 | 0.0% |
| Italy | 17 | 0.1% |
| Japan | 9 | 0.0% |
| Korea | 20 | 0.1% |
| Laos | 13 | 0.0% |
| Latin America | 300 | 0.8% |
| Mexico | 259 | 0.7% |
| Netherlands | 1 | 0.0% |
| Nicaragua | 4 | 0.0% |
| Northern Europe | 140 | 0.4% |
| Oceania | 17 | 0.1% |
| Philippines | 93 | 0.3% |
| Romania | 140 | 0.4% |
| Russia | 18 | 0.1% |
| Singapore | 18 | 0.1% |
| Somalia | 8 | 0.0% |
| South America | 21 | 0.1% |
| South Central Asia | 48 | 0.1% |
| South Eastern Asia | 180 | 0.5% |
| Southern Europe | 17 | 0.1% |
| Thailand | 29 | 0.1% |
| Ukraine | 473 | 1.3% |
| Vietnam | 27 | 0.1% |
| Western Africa | 14 | 0.0% |
| Western Asia | 16 | 0.0% |
| Western Europe | 194 | 0.5% | View All 45 Rows |
Sex and Age in Oregon City
Sex and Age in Oregon City
The most populous age groups in Oregon City are 25 to 29 Years (1,853 | 10.0%) for men and 25 to 29 Years (1,422 | 7.5%) for women.
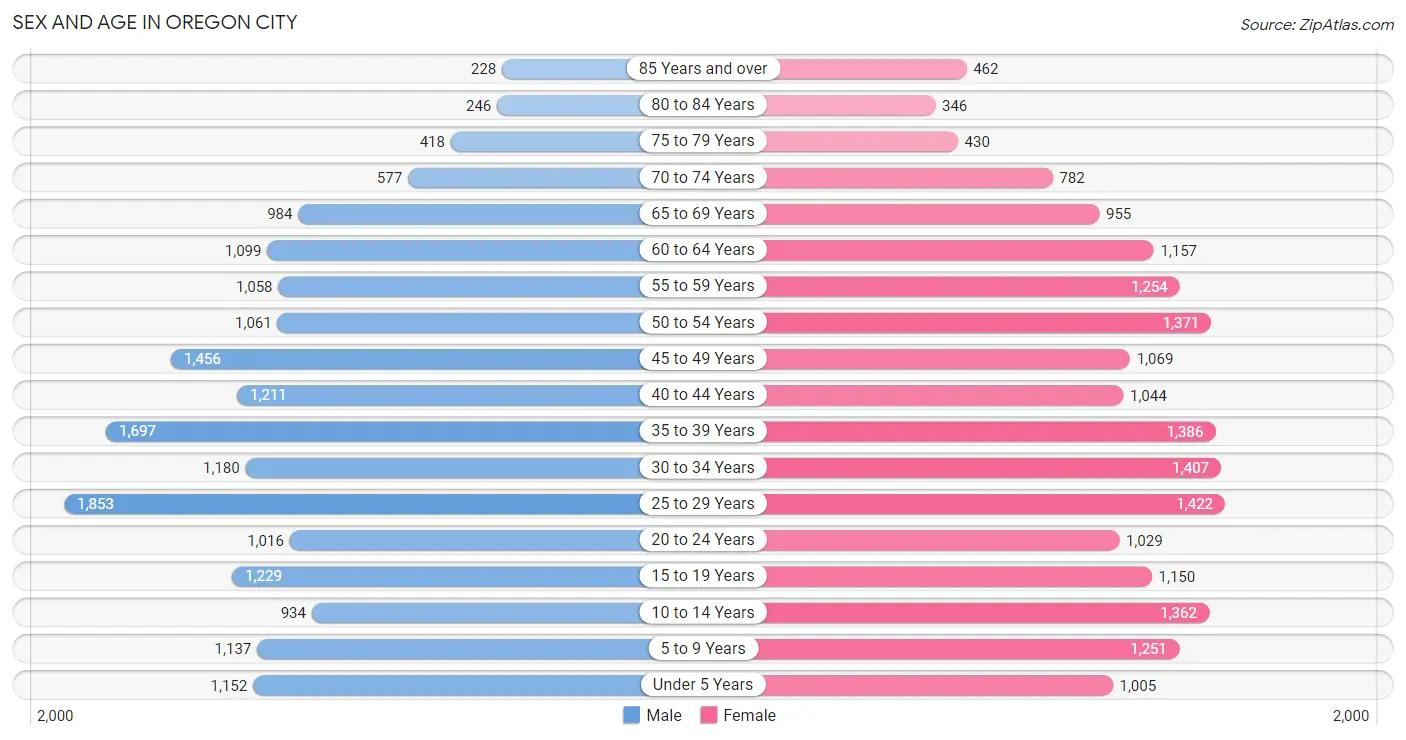
| Age Bracket | Male | Female |
| Under 5 Years | 1,152 (6.2%) | 1,005 (5.3%) |
| 5 to 9 Years | 1,137 (6.1%) | 1,251 (6.6%) |
| 10 to 14 Years | 934 (5.0%) | 1,362 (7.2%) |
| 15 to 19 Years | 1,229 (6.6%) | 1,150 (6.1%) |
| 20 to 24 Years | 1,016 (5.5%) | 1,029 (5.4%) |
| 25 to 29 Years | 1,853 (10.0%) | 1,422 (7.5%) |
| 30 to 34 Years | 1,180 (6.4%) | 1,407 (7.4%) |
| 35 to 39 Years | 1,697 (9.2%) | 1,386 (7.3%) |
| 40 to 44 Years | 1,211 (6.5%) | 1,044 (5.5%) |
| 45 to 49 Years | 1,456 (7.9%) | 1,069 (5.7%) |
| 50 to 54 Years | 1,061 (5.7%) | 1,371 (7.3%) |
| 55 to 59 Years | 1,058 (5.7%) | 1,254 (6.6%) |
| 60 to 64 Years | 1,099 (5.9%) | 1,157 (6.1%) |
| 65 to 69 Years | 984 (5.3%) | 955 (5.1%) |
| 70 to 74 Years | 577 (3.1%) | 782 (4.1%) |
| 75 to 79 Years | 418 (2.3%) | 430 (2.3%) |
| 80 to 84 Years | 246 (1.3%) | 346 (1.8%) |
| 85 Years and over | 228 (1.2%) | 462 (2.5%) |
| Total | 18,536 (100.0%) | 18,882 (100.0%) |
Families and Households in Oregon City
Median Family Size in Oregon City
The median family size in Oregon City is 3.10 persons per family, with married-couple families (7,216 | 77.2%) accounting for the largest median family size of 3.22 persons per family. On the other hand, single female/mother families (1,511 | 16.2%) represent the smallest median family size with 2.69 persons per family.
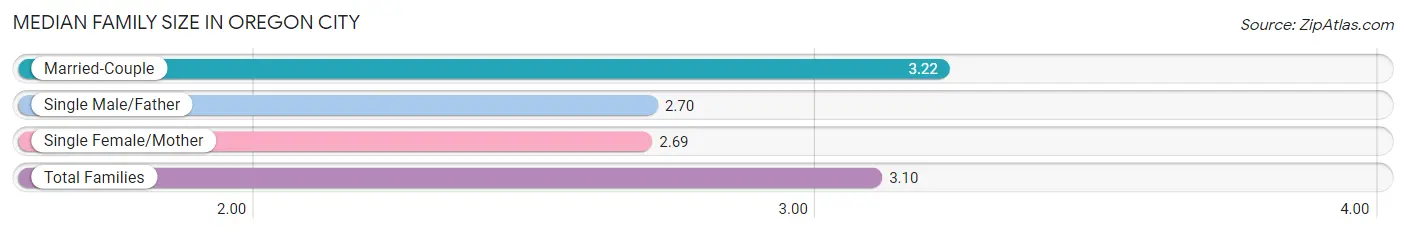
| Family Type | # Families | Family Size |
| Married-Couple | 7,216 (77.2%) | 3.22 |
| Single Male/Father | 623 (6.7%) | 2.70 |
| Single Female/Mother | 1,511 (16.2%) | 2.69 |
| Total Families | 9,350 (100.0%) | 3.10 |
Median Household Size in Oregon City
The median household size in Oregon City is 2.64 persons per household, with married-couple households (7,216 | 52.3%) accounting for the largest median household size of 3.28 persons per household. non-family households (4,452 | 32.3%) represent the smallest median household size with 1.42 persons per household.
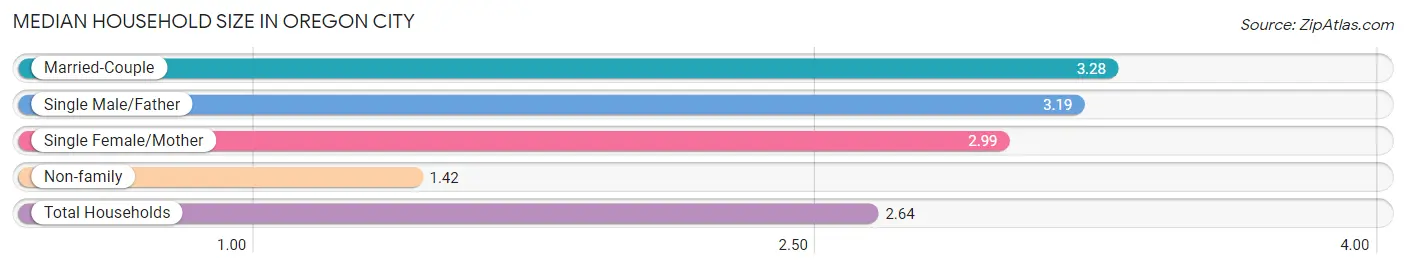
| Household Type | # Households | Household Size |
| Married-Couple | 7,216 (52.3%) | 3.28 |
| Single Male/Father | 623 (4.5%) | 3.19 |
| Single Female/Mother | 1,511 (11.0%) | 2.99 |
| Non-family | 4,452 (32.3%) | 1.42 |
| Total Households | 13,802 (100.0%) | 2.64 |
Household Size by Marriage Status in Oregon City
Out of a total of 13,802 households in Oregon City, 9,350 (67.7%) are family households, while 4,452 (32.3%) are nonfamily households. The most numerous type of family households are 2-person households, comprising 3,880, and the most common type of nonfamily households are 1-person households, comprising 3,059.
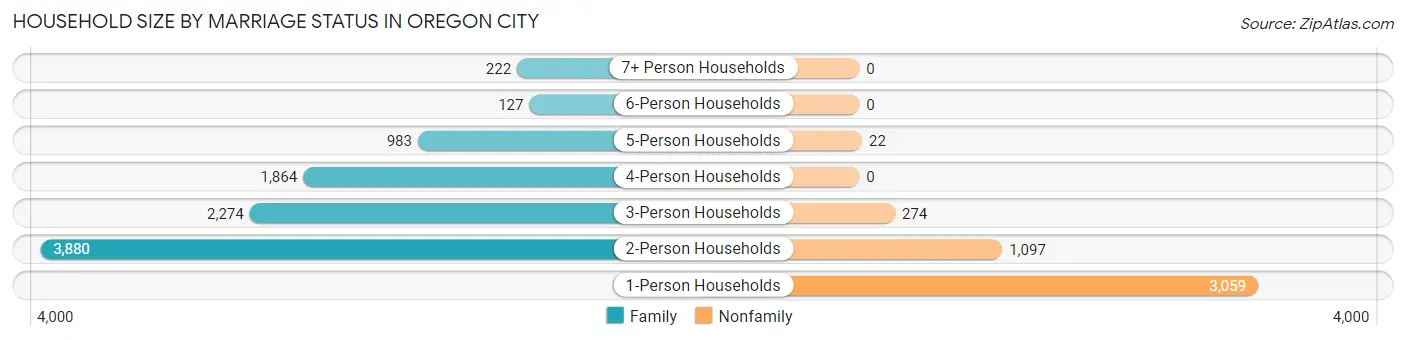
| Household Size | Family Households | Nonfamily Households |
| 1-Person Households | - | 3,059 (22.2%) |
| 2-Person Households | 3,880 (28.1%) | 1,097 (8.0%) |
| 3-Person Households | 2,274 (16.5%) | 274 (2.0%) |
| 4-Person Households | 1,864 (13.5%) | 0 (0.0%) |
| 5-Person Households | 983 (7.1%) | 22 (0.2%) |
| 6-Person Households | 127 (0.9%) | 0 (0.0%) |
| 7+ Person Households | 222 (1.6%) | 0 (0.0%) |
| Total | 9,350 (67.7%) | 4,452 (32.3%) |
Female Fertility in Oregon City
Fertility by Age in Oregon City
Average fertility rate in Oregon City is 72.0 births per 1,000 women. Women in the age bracket of 20 to 34 years have the highest fertility rate with 124.0 births per 1,000 women. Women in the age bracket of 20 to 34 years acount for 75.6% of all women with births.
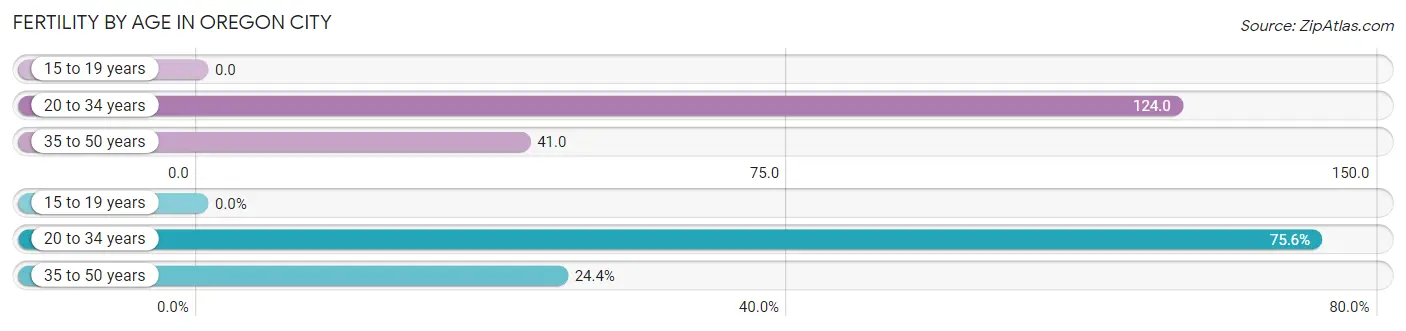
| Age Bracket | Women with Births | Births / 1,000 Women |
| 15 to 19 years | 0 (0.0%) | 0.0 |
| 20 to 34 years | 480 (75.6%) | 124.0 |
| 35 to 50 years | 155 (24.4%) | 41.0 |
| Total | 635 (100.0%) | 72.0 |
Fertility by Age by Marriage Status in Oregon City
79.7% of women with births (635) in Oregon City are married. The highest percentage of unmarried women with births falls into 35 to 50 years age bracket with 32.9% of them unmarried at the time of birth, while the lowest percentage of unmarried women with births belong to 20 to 34 years age bracket with 16.2% of them unmarried.
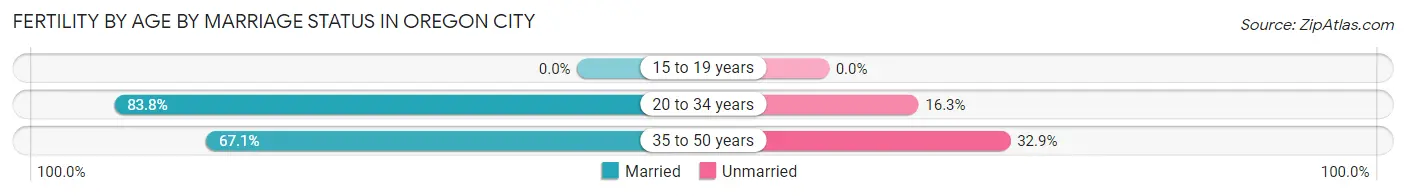
| Age Bracket | Married | Unmarried |
| 15 to 19 years | 0 (0.0%) | 0 (0.0%) |
| 20 to 34 years | 402 (83.8%) | 78 (16.3%) |
| 35 to 50 years | 104 (67.1%) | 51 (32.9%) |
| Total | 506 (79.7%) | 129 (20.3%) |
Fertility by Education in Oregon City
Average fertility rate in Oregon City is 72.0 births per 1,000 women. Women with the education attainment of bachelor's degree have the highest fertility rate of 119.0 births per 1,000 women, while women with the education attainment of college or associate's degree have the lowest fertility at 43.0 births per 1,000 women. Women with the education attainment of bachelor's degree represent 43.3% of all women with births.
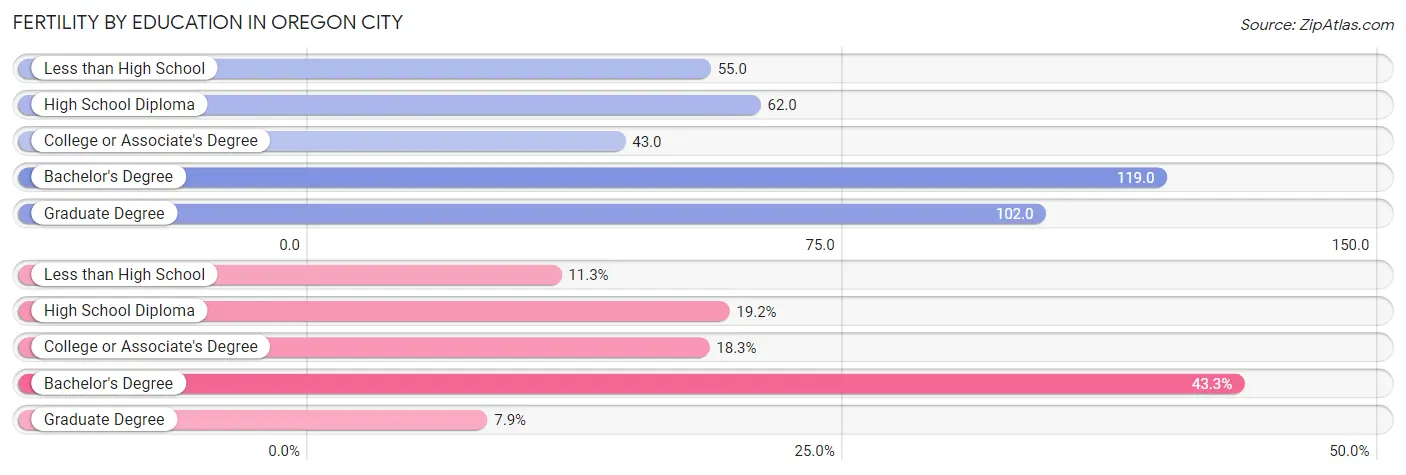
| Educational Attainment | Women with Births | Births / 1,000 Women |
| Less than High School | 72 (11.3%) | 55.0 |
| High School Diploma | 122 (19.2%) | 62.0 |
| College or Associate's Degree | 116 (18.3%) | 43.0 |
| Bachelor's Degree | 275 (43.3%) | 119.0 |
| Graduate Degree | 50 (7.9%) | 102.0 |
| Total | 635 (100.0%) | 72.0 |
Fertility by Education by Marriage Status in Oregon City
20.3% of women with births in Oregon City are unmarried. Women with the educational attainment of bachelor's degree are most likely to be married with 100.0% of them married at childbirth, while women with the educational attainment of high school diploma are least likely to be married with 50.8% of them unmarried at childbirth.
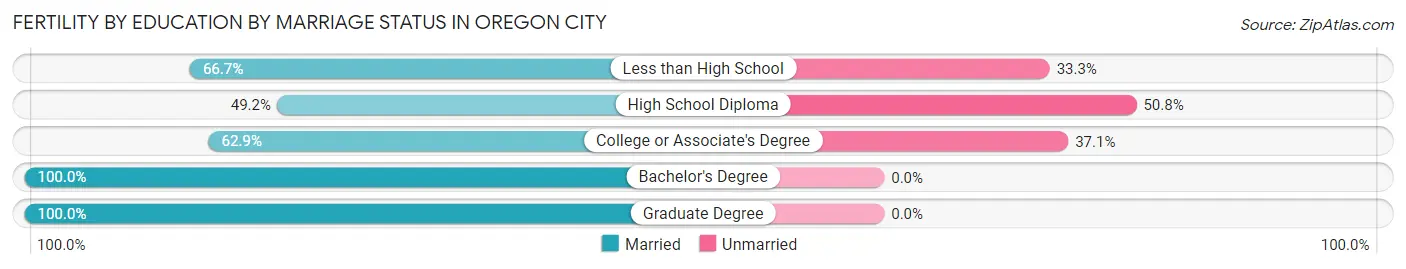
| Educational Attainment | Married | Unmarried |
| Less than High School | 48 (66.7%) | 24 (33.3%) |
| High School Diploma | 60 (49.2%) | 62 (50.8%) |
| College or Associate's Degree | 73 (62.9%) | 43 (37.1%) |
| Bachelor's Degree | 275 (100.0%) | 0 (0.0%) |
| Graduate Degree | 50 (100.0%) | 0 (0.0%) |
| Total | 506 (79.7%) | 129 (20.3%) |
Employment Characteristics in Oregon City
Employment by Class of Employer in Oregon City
Among the 18,741 employed individuals in Oregon City, private company employees (13,140 | 70.1%), not-for-profit organizations (1,629 | 8.7%), and local government employees (1,315 | 7.0%) make up the most common classes of employment.
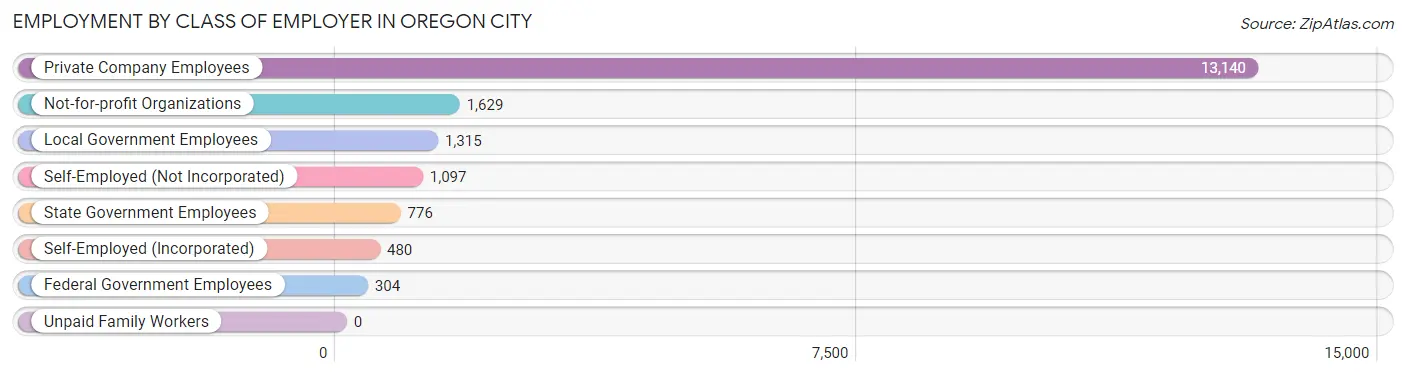
| Employer Class | # Employees | % Employees |
| Private Company Employees | 13,140 | 70.1% |
| Self-Employed (Incorporated) | 480 | 2.6% |
| Self-Employed (Not Incorporated) | 1,097 | 5.9% |
| Not-for-profit Organizations | 1,629 | 8.7% |
| Local Government Employees | 1,315 | 7.0% |
| State Government Employees | 776 | 4.1% |
| Federal Government Employees | 304 | 1.6% |
| Unpaid Family Workers | 0 | 0.0% |
| Total | 18,741 | 100.0% |
Employment Status by Age in Oregon City
According to the labor force statistics for Oregon City, out of the total population over 16 years of age (30,047), 66.4% or 19,951 individuals are in the labor force, with 5.0% or 998 of them unemployed. The age group with the highest labor force participation rate is 25 to 29 years, with 87.0% or 2,849 individuals in the labor force. Within the labor force, the 16 to 19 years age range has the highest percentage of unemployed individuals, with 27.1% or 221 of them being unemployed.
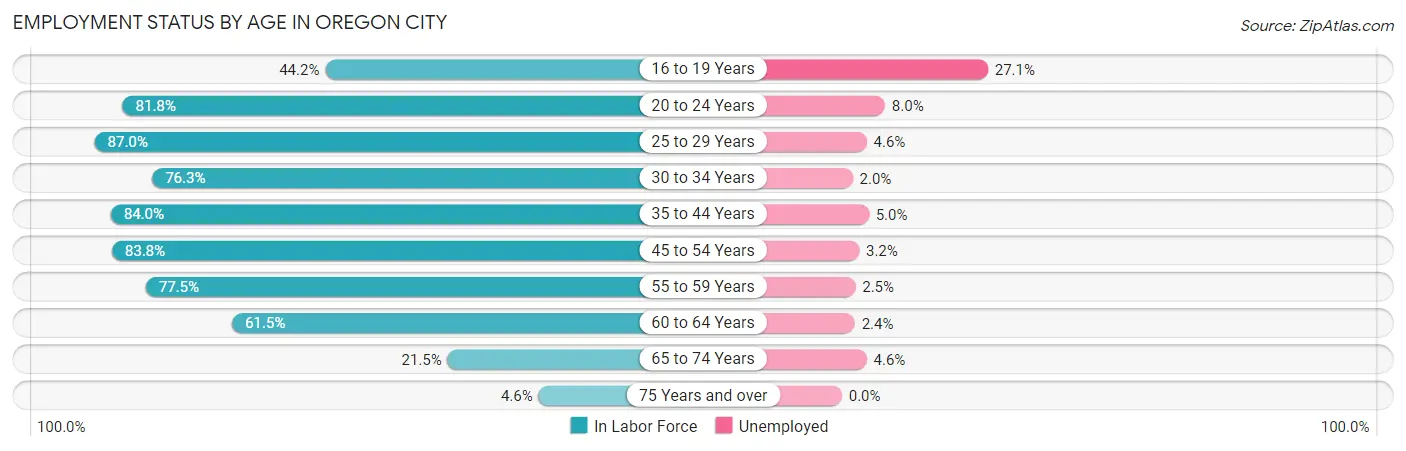
| Age Bracket | In Labor Force | Unemployed |
| 16 to 19 Years | 817 (44.2%) | 221 (27.1%) |
| 20 to 24 Years | 1,673 (81.8%) | 134 (8.0%) |
| 25 to 29 Years | 2,849 (87.0%) | 131 (4.6%) |
| 30 to 34 Years | 1,974 (76.3%) | 39 (2.0%) |
| 35 to 44 Years | 4,484 (84.0%) | 224 (5.0%) |
| 45 to 54 Years | 4,154 (83.8%) | 133 (3.2%) |
| 55 to 59 Years | 1,792 (77.5%) | 45 (2.5%) |
| 60 to 64 Years | 1,387 (61.5%) | 33 (2.4%) |
| 65 to 74 Years | 709 (21.5%) | 33 (4.6%) |
| 75 Years and over | 98 (4.6%) | 0 (0.0%) |
| Total | 19,951 (66.4%) | 998 (5.0%) |
Employment Status by Educational Attainment in Oregon City
According to labor force statistics for Oregon City, 80.3% of individuals (16,642) out of the total population between 25 and 64 years of age (20,725) are in the labor force, with 3.6% or 599 of them being unemployed. The group with the highest labor force participation rate are those with the educational attainment of bachelor's degree or higher, with 89.8% or 5,791 individuals in the labor force. Within the labor force, individuals with less than high school education have the highest percentage of unemployment, with 9.8% or 56 of them being unemployed.
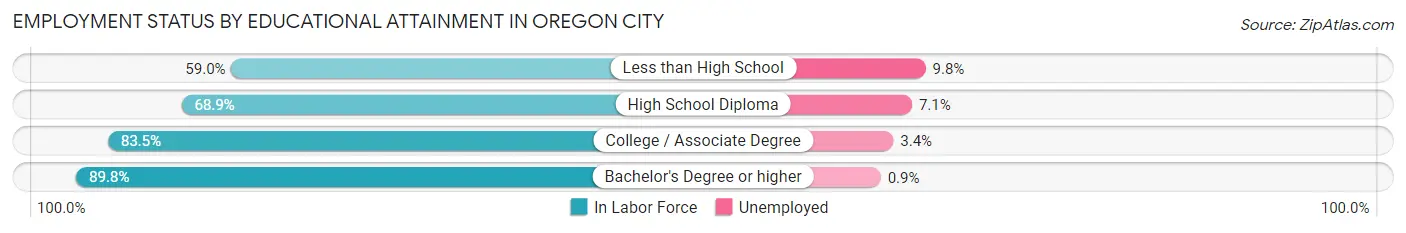
| Educational Attainment | In Labor Force | Unemployed |
| Less than High School | 574 (59.0%) | 95 (9.8%) |
| High School Diploma | 3,921 (68.9%) | 404 (7.1%) |
| College / Associate Degree | 6,356 (83.5%) | 259 (3.4%) |
| Bachelor's Degree or higher | 5,791 (89.8%) | 58 (0.9%) |
| Total | 16,642 (80.3%) | 746 (3.6%) |
Employment Occupations by Sex in Oregon City
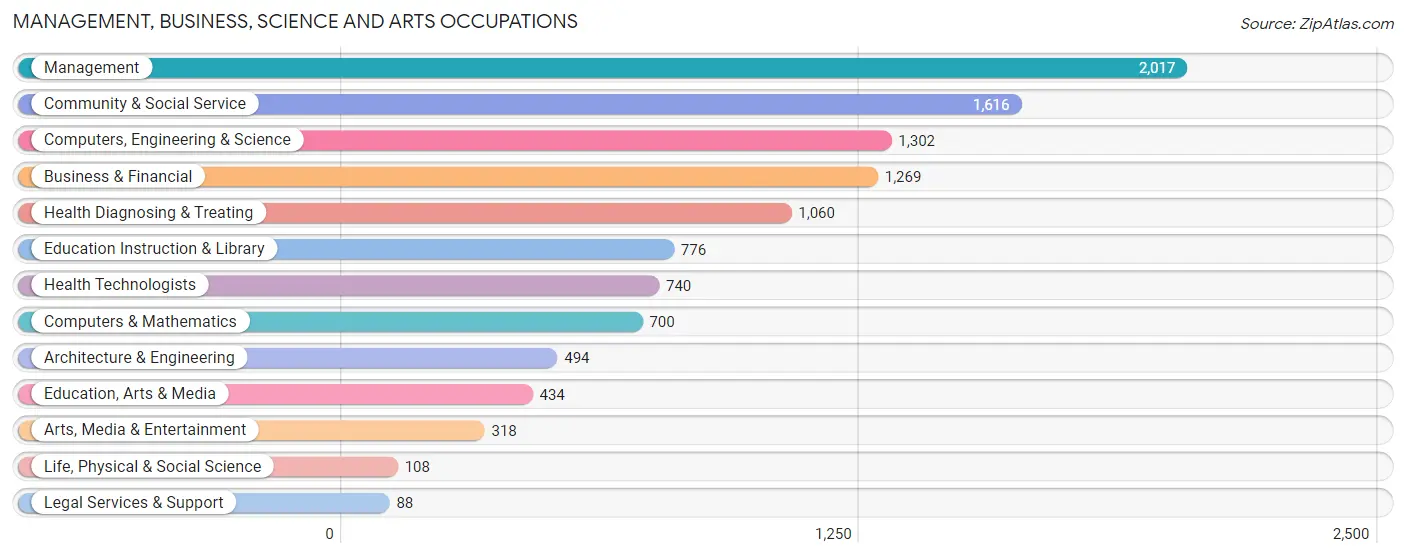
Management, Business, Science and Arts Occupations
The most common Management, Business, Science and Arts occupations in Oregon City are Management (2,017 | 10.7%), Community & Social Service (1,616 | 8.5%), Computers, Engineering & Science (1,302 | 6.9%), Business & Financial (1,269 | 6.7%), and Health Diagnosing & Treating (1,060 | 5.6%).
Management, Business, Science and Arts Occupations by Sex
Within the Management, Business, Science and Arts occupations in Oregon City, the most male-oriented occupations are Architecture & Engineering (83.0%), Life, Physical & Social Science (76.8%), and Computers, Engineering & Science (72.4%), while the most female-oriented occupations are Health Technologists (97.6%), Health Diagnosing & Treating (92.5%), and Legal Services & Support (81.8%).
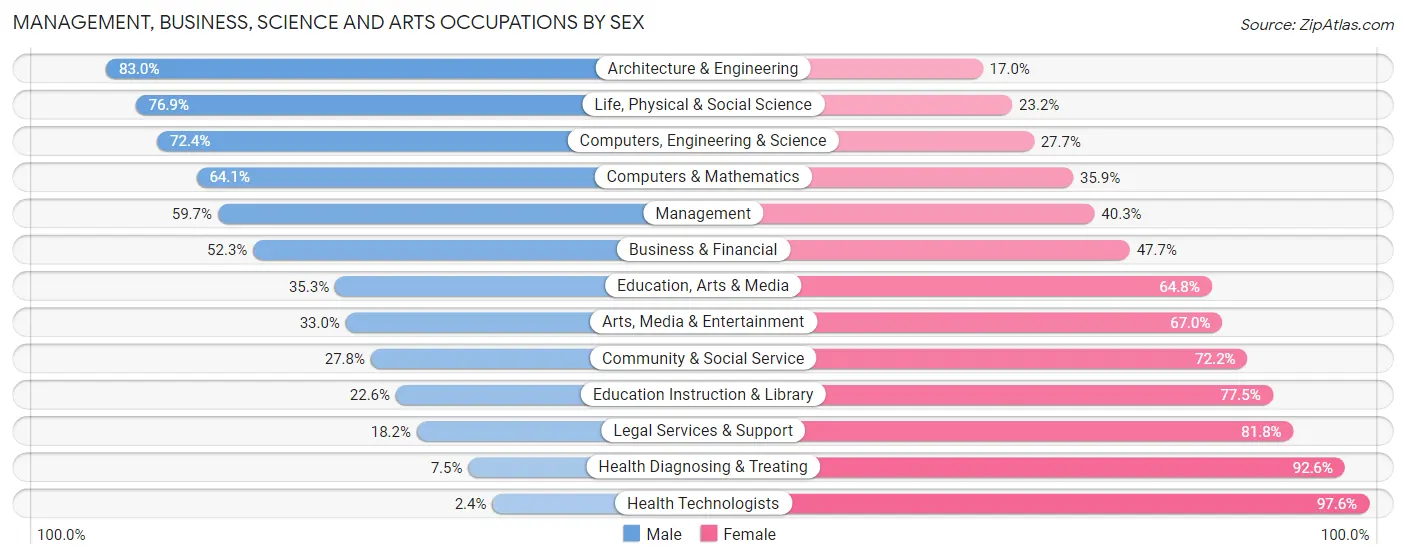
| Occupation | Male | Female |
| Management | 1,204 (59.7%) | 813 (40.3%) |
| Business & Financial | 664 (52.3%) | 605 (47.7%) |
| Computers, Engineering & Science | 942 (72.4%) | 360 (27.7%) |
| Computers & Mathematics | 449 (64.1%) | 251 (35.9%) |
| Architecture & Engineering | 410 (83.0%) | 84 (17.0%) |
| Life, Physical & Social Science | 83 (76.8%) | 25 (23.2%) |
| Community & Social Service | 449 (27.8%) | 1,167 (72.2%) |
| Education, Arts & Media | 153 (35.2%) | 281 (64.7%) |
| Legal Services & Support | 16 (18.2%) | 72 (81.8%) |
| Education Instruction & Library | 175 (22.6%) | 601 (77.4%) |
| Arts, Media & Entertainment | 105 (33.0%) | 213 (67.0%) |
| Health Diagnosing & Treating | 79 (7.4%) | 981 (92.5%) |
| Health Technologists | 18 (2.4%) | 722 (97.6%) |
| Total (Category) | 3,338 (46.0%) | 3,926 (54.0%) |
| Total (Overall) | 10,258 (54.2%) | 8,663 (45.8%) |
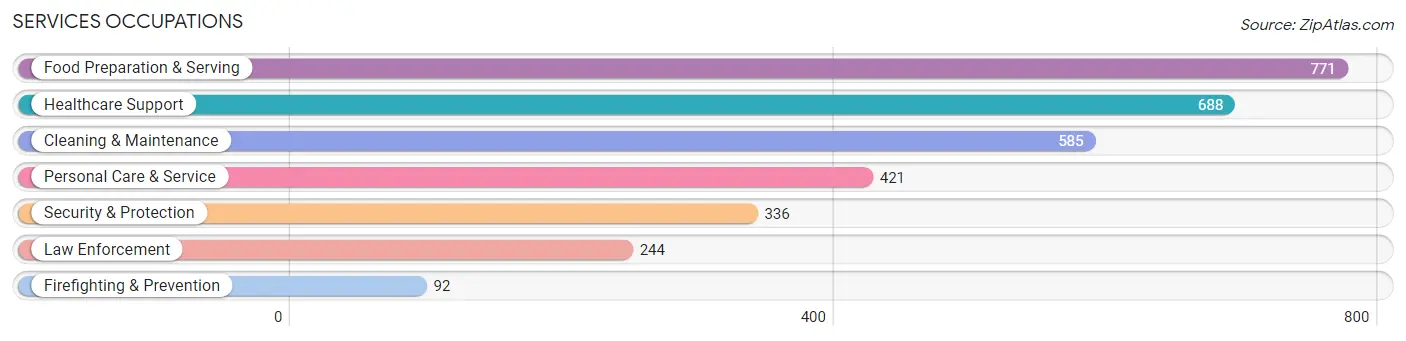
Services Occupations
The most common Services occupations in Oregon City are Food Preparation & Serving (771 | 4.1%), Healthcare Support (688 | 3.6%), Cleaning & Maintenance (585 | 3.1%), Personal Care & Service (421 | 2.2%), and Security & Protection (336 | 1.8%).
Services Occupations by Sex
Within the Services occupations in Oregon City, the most male-oriented occupations are Firefighting & Prevention (100.0%), Security & Protection (90.2%), and Law Enforcement (86.5%), while the most female-oriented occupations are Healthcare Support (91.3%), Personal Care & Service (76.2%), and Food Preparation & Serving (61.7%).
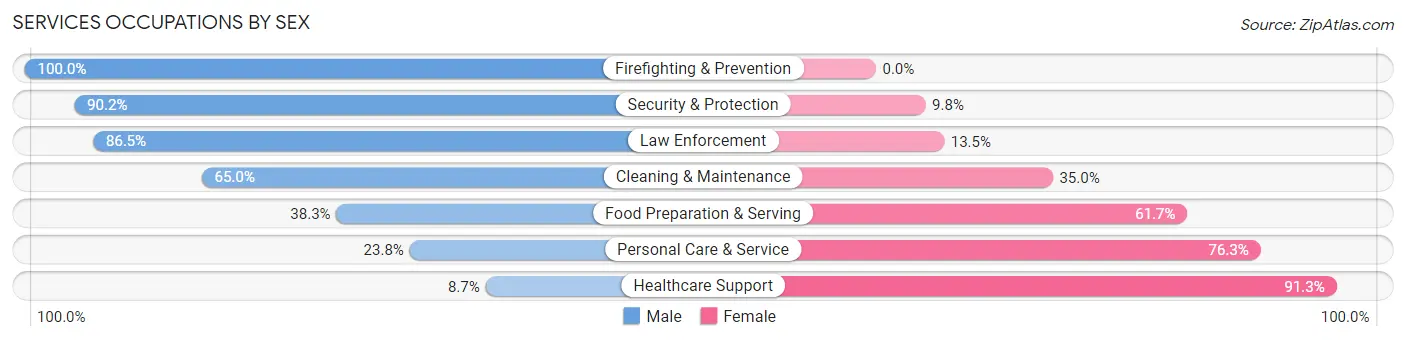
| Occupation | Male | Female |
| Healthcare Support | 60 (8.7%) | 628 (91.3%) |
| Security & Protection | 303 (90.2%) | 33 (9.8%) |
| Firefighting & Prevention | 92 (100.0%) | 0 (0.0%) |
| Law Enforcement | 211 (86.5%) | 33 (13.5%) |
| Food Preparation & Serving | 295 (38.3%) | 476 (61.7%) |
| Cleaning & Maintenance | 380 (65.0%) | 205 (35.0%) |
| Personal Care & Service | 100 (23.7%) | 321 (76.2%) |
| Total (Category) | 1,138 (40.6%) | 1,663 (59.4%) |
| Total (Overall) | 10,258 (54.2%) | 8,663 (45.8%) |
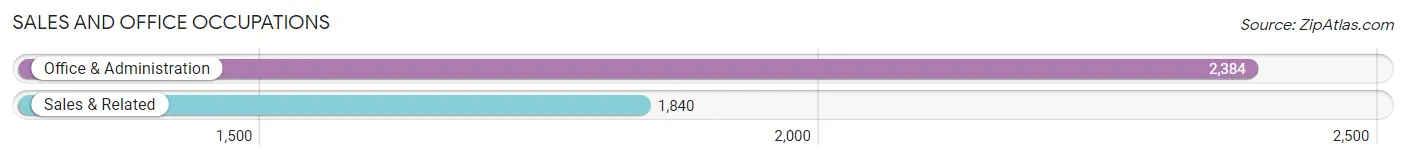
Sales and Office Occupations
The most common Sales and Office occupations in Oregon City are Office & Administration (2,384 | 12.6%), and Sales & Related (1,840 | 9.7%).
Sales and Office Occupations by Sex
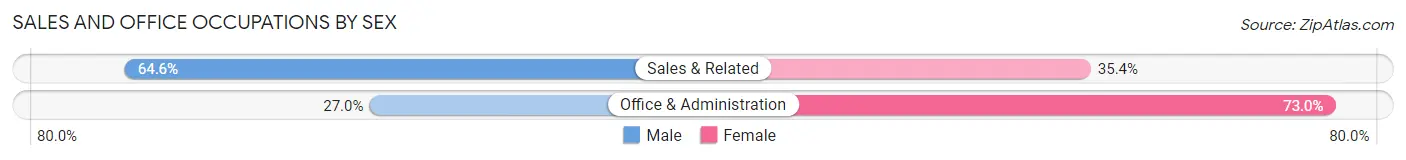
| Occupation | Male | Female |
| Sales & Related | 1,188 (64.6%) | 652 (35.4%) |
| Office & Administration | 643 (27.0%) | 1,741 (73.0%) |
| Total (Category) | 1,831 (43.3%) | 2,393 (56.7%) |
| Total (Overall) | 10,258 (54.2%) | 8,663 (45.8%) |
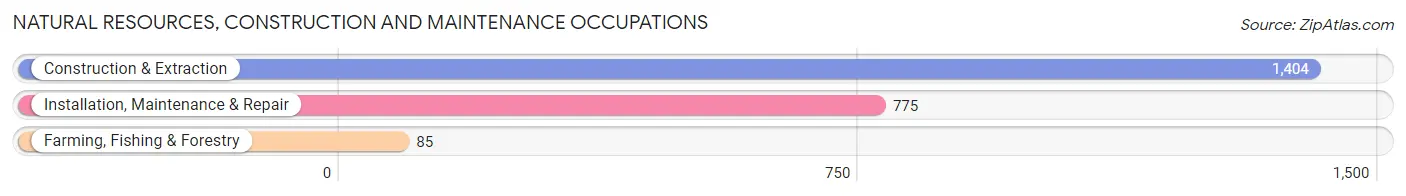
Natural Resources, Construction and Maintenance Occupations
The most common Natural Resources, Construction and Maintenance occupations in Oregon City are Construction & Extraction (1,404 | 7.4%), Installation, Maintenance & Repair (775 | 4.1%), and Farming, Fishing & Forestry (85 | 0.4%).
Natural Resources, Construction and Maintenance Occupations by Sex
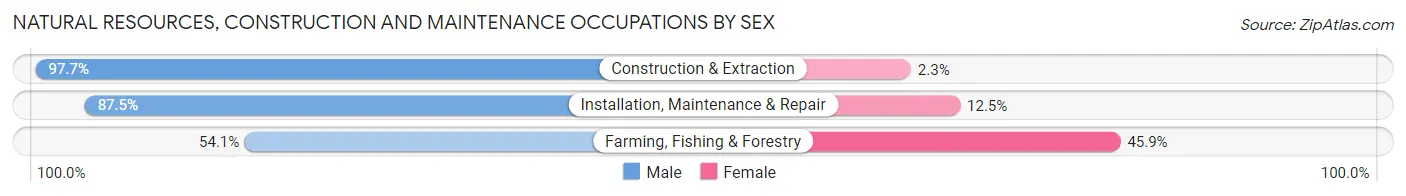
| Occupation | Male | Female |
| Farming, Fishing & Forestry | 46 (54.1%) | 39 (45.9%) |
| Construction & Extraction | 1,372 (97.7%) | 32 (2.3%) |
| Installation, Maintenance & Repair | 678 (87.5%) | 97 (12.5%) |
| Total (Category) | 2,096 (92.6%) | 168 (7.4%) |
| Total (Overall) | 10,258 (54.2%) | 8,663 (45.8%) |
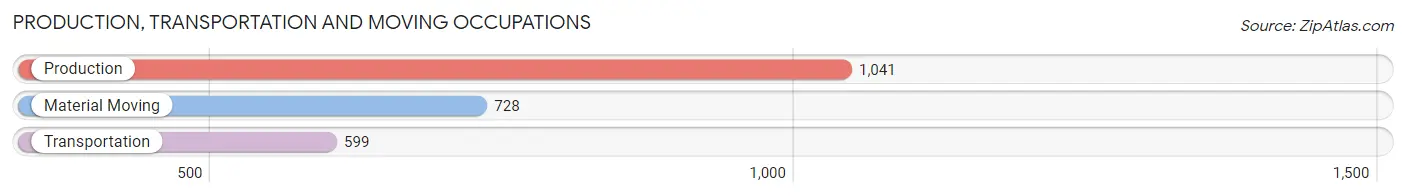
Production, Transportation and Moving Occupations
The most common Production, Transportation and Moving occupations in Oregon City are Production (1,041 | 5.5%), Material Moving (728 | 3.8%), and Transportation (599 | 3.2%).
Production, Transportation and Moving Occupations by Sex
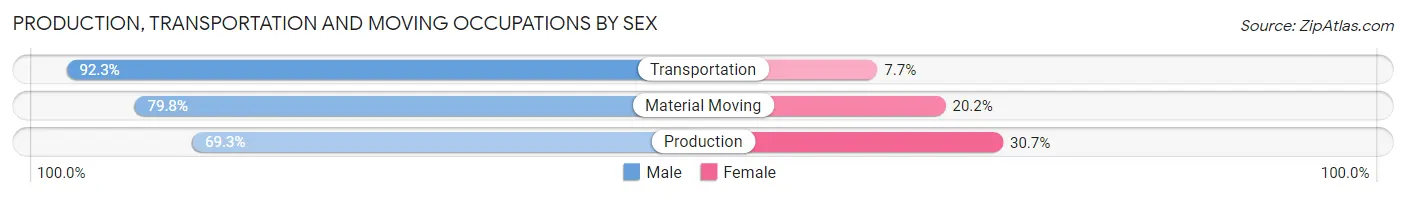
| Occupation | Male | Female |
| Production | 721 (69.3%) | 320 (30.7%) |
| Transportation | 553 (92.3%) | 46 (7.7%) |
| Material Moving | 581 (79.8%) | 147 (20.2%) |
| Total (Category) | 1,855 (78.3%) | 513 (21.7%) |
| Total (Overall) | 10,258 (54.2%) | 8,663 (45.8%) |
Employment Industries by Sex in Oregon City
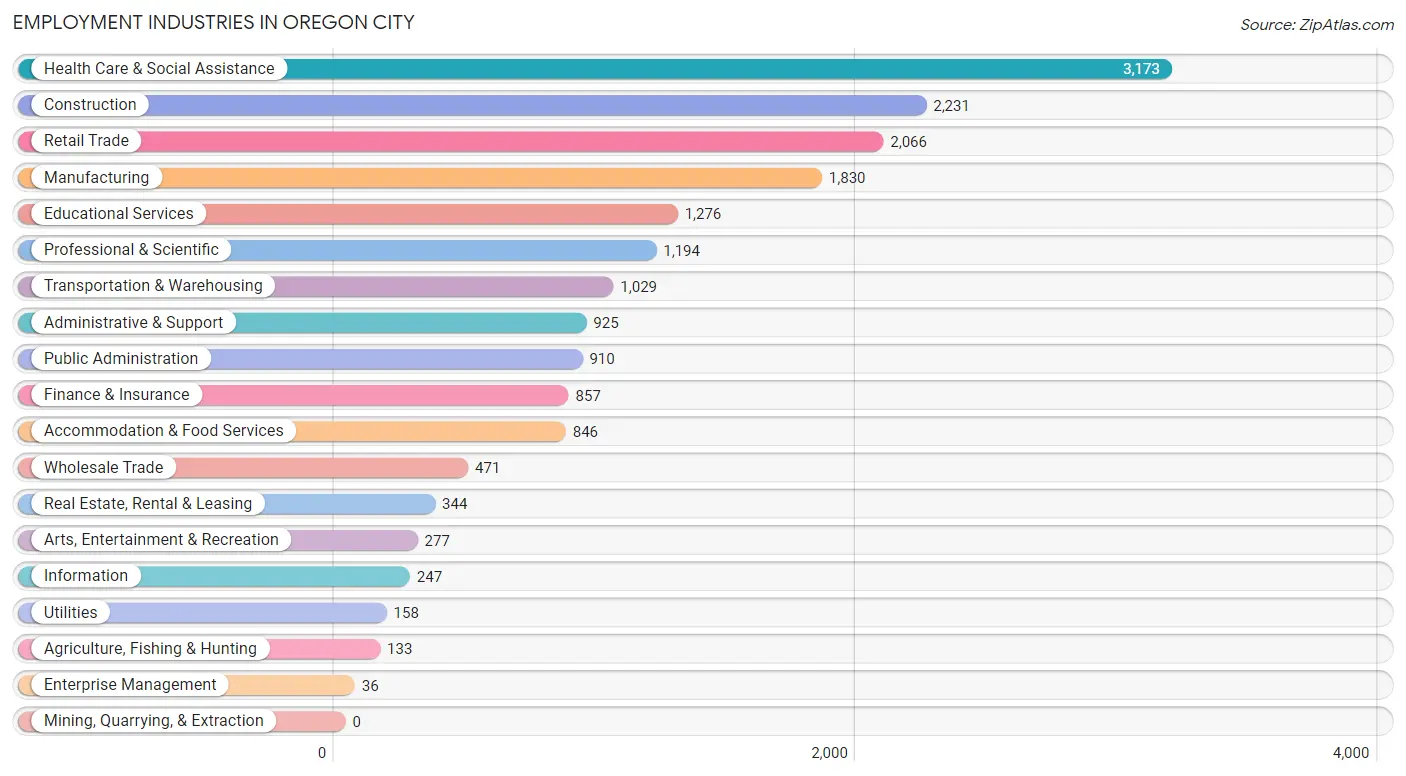
Employment Industries in Oregon City
The major employment industries in Oregon City include Health Care & Social Assistance (3,173 | 16.8%), Construction (2,231 | 11.8%), Retail Trade (2,066 | 10.9%), Manufacturing (1,830 | 9.7%), and Educational Services (1,276 | 6.7%).
Employment Industries by Sex in Oregon City
The Oregon City industries that see more men than women are Enterprise Management (100.0%), Construction (86.9%), and Transportation & Warehousing (82.2%), whereas the industries that tend to have a higher number of women are Health Care & Social Assistance (82.5%), Finance & Insurance (75.5%), and Educational Services (70.1%).
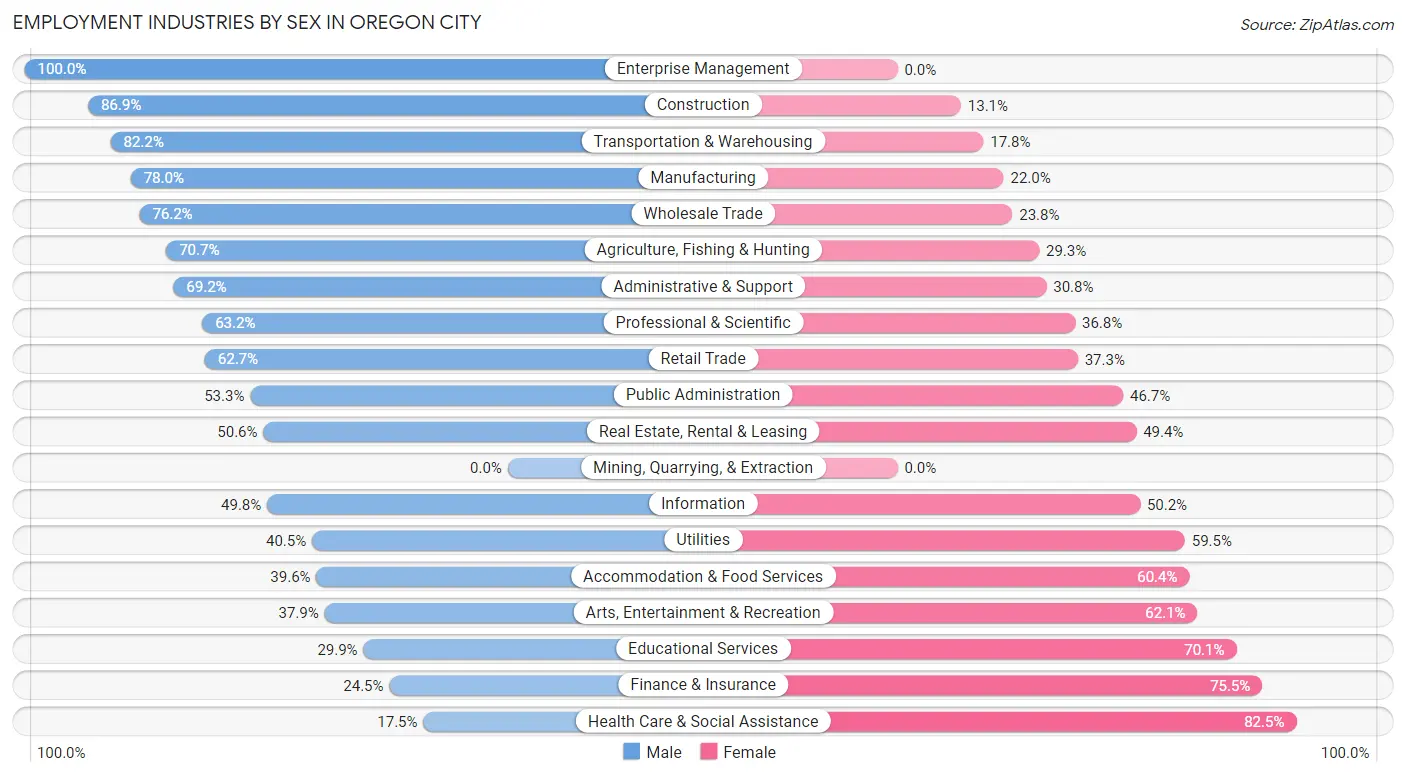
| Industry | Male | Female |
| Agriculture, Fishing & Hunting | 94 (70.7%) | 39 (29.3%) |
| Mining, Quarrying, & Extraction | 0 (0.0%) | 0 (0.0%) |
| Construction | 1,938 (86.9%) | 293 (13.1%) |
| Manufacturing | 1,428 (78.0%) | 402 (22.0%) |
| Wholesale Trade | 359 (76.2%) | 112 (23.8%) |
| Retail Trade | 1,295 (62.7%) | 771 (37.3%) |
| Transportation & Warehousing | 846 (82.2%) | 183 (17.8%) |
| Utilities | 64 (40.5%) | 94 (59.5%) |
| Information | 123 (49.8%) | 124 (50.2%) |
| Finance & Insurance | 210 (24.5%) | 647 (75.5%) |
| Real Estate, Rental & Leasing | 174 (50.6%) | 170 (49.4%) |
| Professional & Scientific | 755 (63.2%) | 439 (36.8%) |
| Enterprise Management | 36 (100.0%) | 0 (0.0%) |
| Administrative & Support | 640 (69.2%) | 285 (30.8%) |
| Educational Services | 381 (29.9%) | 895 (70.1%) |
| Health Care & Social Assistance | 554 (17.5%) | 2,619 (82.5%) |
| Arts, Entertainment & Recreation | 105 (37.9%) | 172 (62.1%) |
| Accommodation & Food Services | 335 (39.6%) | 511 (60.4%) |
| Public Administration | 485 (53.3%) | 425 (46.7%) |
| Total | 10,258 (54.2%) | 8,663 (45.8%) |
Education in Oregon City
School Enrollment in Oregon City
The most common levels of schooling among the 7,988 students in Oregon City are high school (1,909 | 23.9%), elementary school (1,817 | 22.8%), and middle school (1,635 | 20.5%).
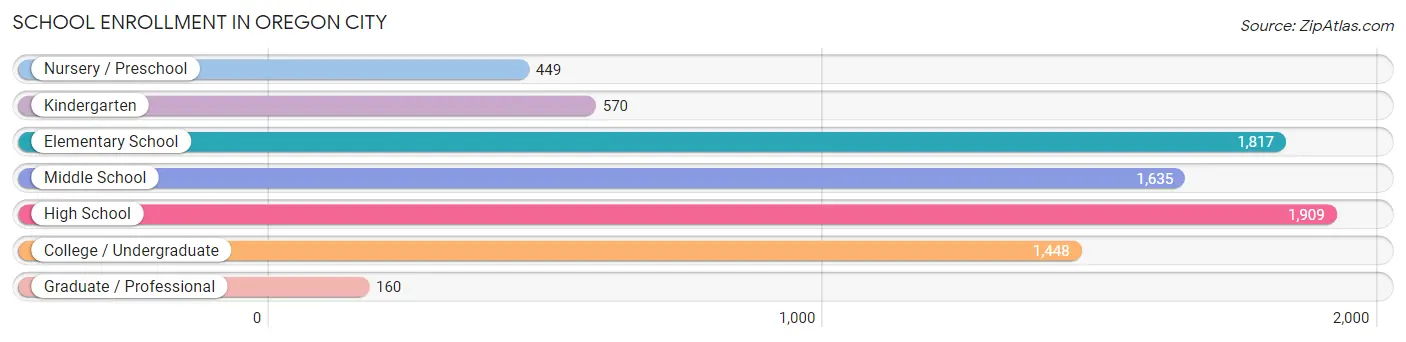
| School Level | # Students | % Students |
| Nursery / Preschool | 449 | 5.6% |
| Kindergarten | 570 | 7.1% |
| Elementary School | 1,817 | 22.8% |
| Middle School | 1,635 | 20.5% |
| High School | 1,909 | 23.9% |
| College / Undergraduate | 1,448 | 18.1% |
| Graduate / Professional | 160 | 2.0% |
| Total | 7,988 | 100.0% |
School Enrollment by Age by Funding Source in Oregon City
Out of a total of 7,988 students who are enrolled in schools in Oregon City, 1,725 (21.6%) attend a private institution, while the remaining 6,263 (78.4%) are enrolled in public schools. The age group of 3 to 4 year olds has the highest likelihood of being enrolled in private schools, with 91 (33.3% in the age bracket) enrolled. Conversely, the age group of 15 to 17 year olds has the lowest likelihood of being enrolled in a private school, with 1,289 (96.6% in the age bracket) attending a public institution.
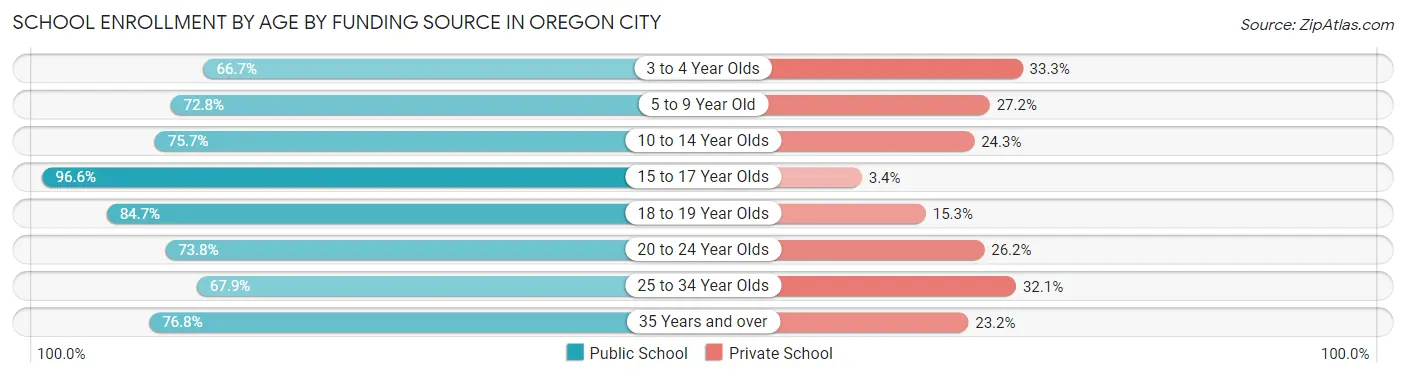
| Age Bracket | Public School | Private School |
| 3 to 4 Year Olds | 182 (66.7%) | 91 (33.3%) |
| 5 to 9 Year Old | 1,616 (72.8%) | 604 (27.2%) |
| 10 to 14 Year Olds | 1,677 (75.7%) | 539 (24.3%) |
| 15 to 17 Year Olds | 1,289 (96.6%) | 45 (3.4%) |
| 18 to 19 Year Olds | 548 (84.7%) | 99 (15.3%) |
| 20 to 24 Year Olds | 338 (73.8%) | 120 (26.2%) |
| 25 to 34 Year Olds | 275 (67.9%) | 130 (32.1%) |
| 35 Years and over | 334 (76.8%) | 101 (23.2%) |
| Total | 6,263 (78.4%) | 1,725 (21.6%) |
Educational Attainment by Field of Study in Oregon City
Business (1,687 | 19.3%), science & technology (988 | 11.3%), social sciences (880 | 10.1%), education (687 | 7.9%), and visual & performing arts (681 | 7.8%) are the most common fields of study among 8,731 individuals in Oregon City who have obtained a bachelor's degree or higher.
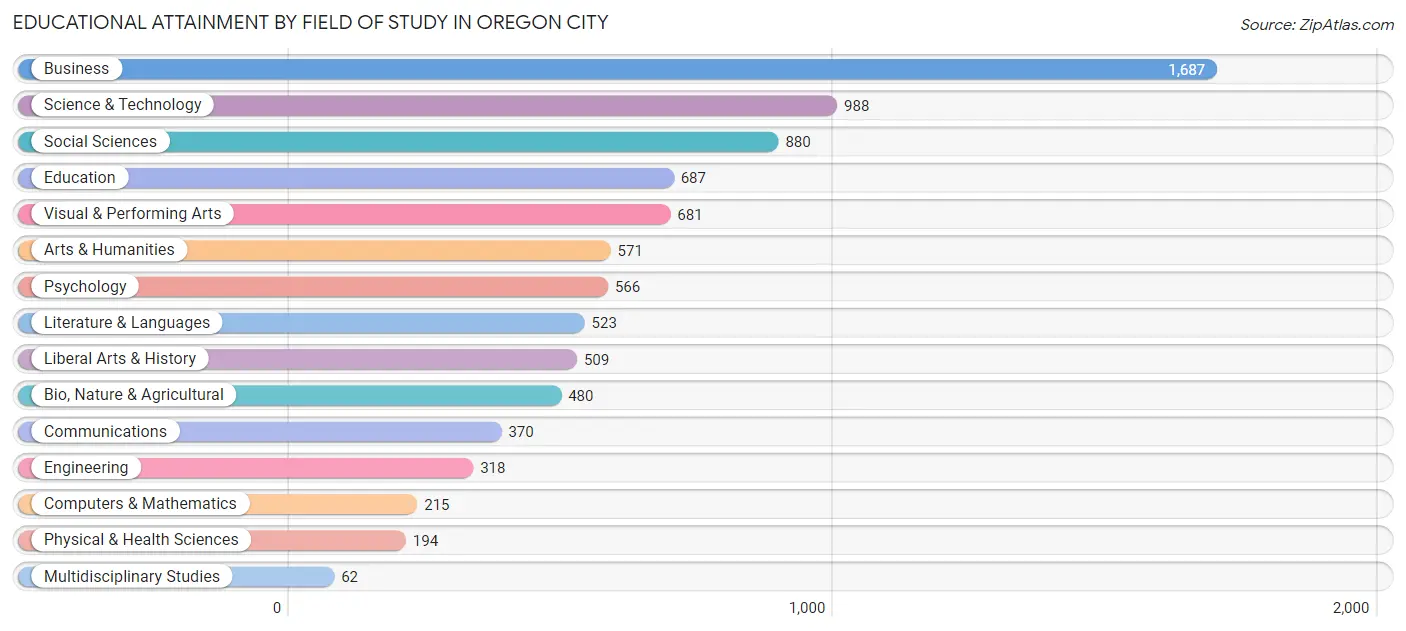
| Field of Study | # Graduates | % Graduates |
| Computers & Mathematics | 215 | 2.5% |
| Bio, Nature & Agricultural | 480 | 5.5% |
| Physical & Health Sciences | 194 | 2.2% |
| Psychology | 566 | 6.5% |
| Social Sciences | 880 | 10.1% |
| Engineering | 318 | 3.6% |
| Multidisciplinary Studies | 62 | 0.7% |
| Science & Technology | 988 | 11.3% |
| Business | 1,687 | 19.3% |
| Education | 687 | 7.9% |
| Literature & Languages | 523 | 6.0% |
| Liberal Arts & History | 509 | 5.8% |
| Visual & Performing Arts | 681 | 7.8% |
| Communications | 370 | 4.2% |
| Arts & Humanities | 571 | 6.5% |
| Total | 8,731 | 100.0% |
Transportation & Commute in Oregon City
Vehicle Availability by Sex in Oregon City
The most prevalent vehicle ownership categories in Oregon City are males with 2 vehicles (4,343, accounting for 42.9%) and females with 2 vehicles (4,105, making up 50.7%).
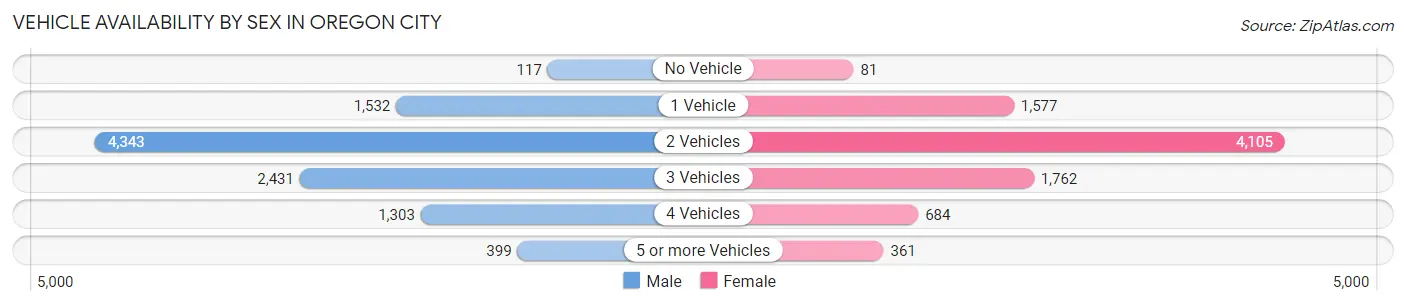
| Vehicles Available | Male | Female |
| No Vehicle | 117 (1.2%) | 81 (0.9%) |
| 1 Vehicle | 1,532 (15.1%) | 1,577 (18.4%) |
| 2 Vehicles | 4,343 (42.9%) | 4,105 (47.9%) |
| 3 Vehicles | 2,431 (24.0%) | 1,762 (20.6%) |
| 4 Vehicles | 1,303 (12.9%) | 684 (8.0%) |
| 5 or more Vehicles | 399 (3.9%) | 361 (4.2%) |
| Total | 10,125 (100.0%) | 8,570 (100.0%) |
Commute Time in Oregon City
The most frequently occuring commute durations in Oregon City are 20 to 24 minutes (2,575 commuters, 15.8%), 30 to 34 minutes (2,529 commuters, 15.5%), and 45 to 59 minutes (1,786 commuters, 10.9%).
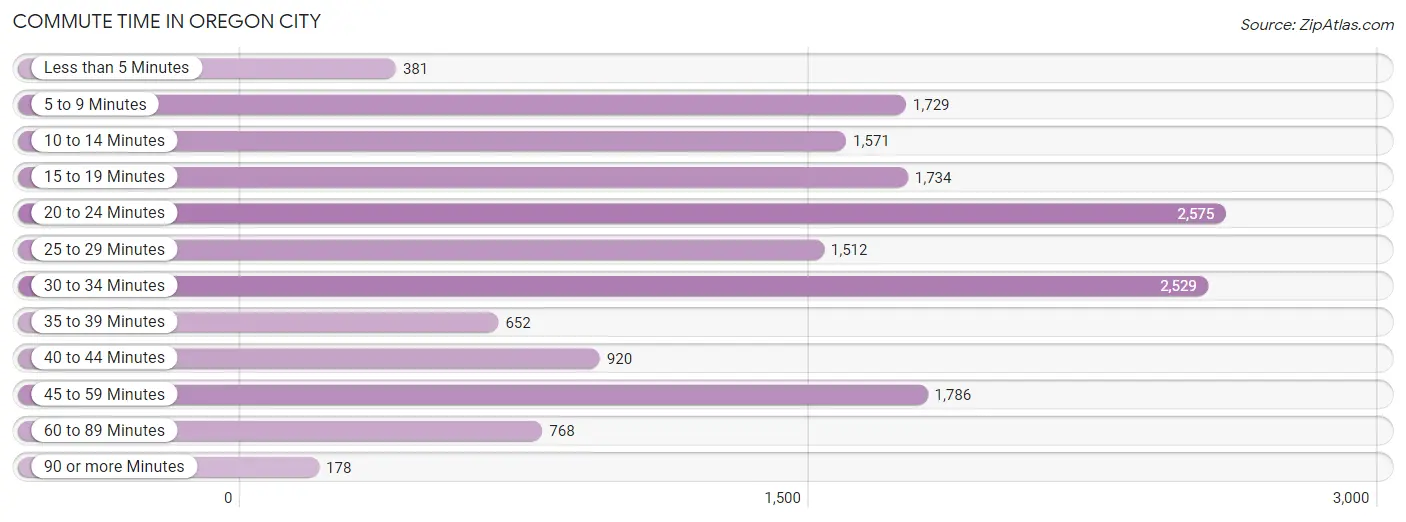
| Commute Time | # Commuters | % Commuters |
| Less than 5 Minutes | 381 | 2.3% |
| 5 to 9 Minutes | 1,729 | 10.6% |
| 10 to 14 Minutes | 1,571 | 9.6% |
| 15 to 19 Minutes | 1,734 | 10.6% |
| 20 to 24 Minutes | 2,575 | 15.8% |
| 25 to 29 Minutes | 1,512 | 9.3% |
| 30 to 34 Minutes | 2,529 | 15.5% |
| 35 to 39 Minutes | 652 | 4.0% |
| 40 to 44 Minutes | 920 | 5.6% |
| 45 to 59 Minutes | 1,786 | 10.9% |
| 60 to 89 Minutes | 768 | 4.7% |
| 90 or more Minutes | 178 | 1.1% |
Commute Time by Sex in Oregon City
The most common commute times in Oregon City are 30 to 34 minutes (1,723 commuters, 18.6%) for males and 20 to 24 minutes (1,173 commuters, 16.5%) for females.
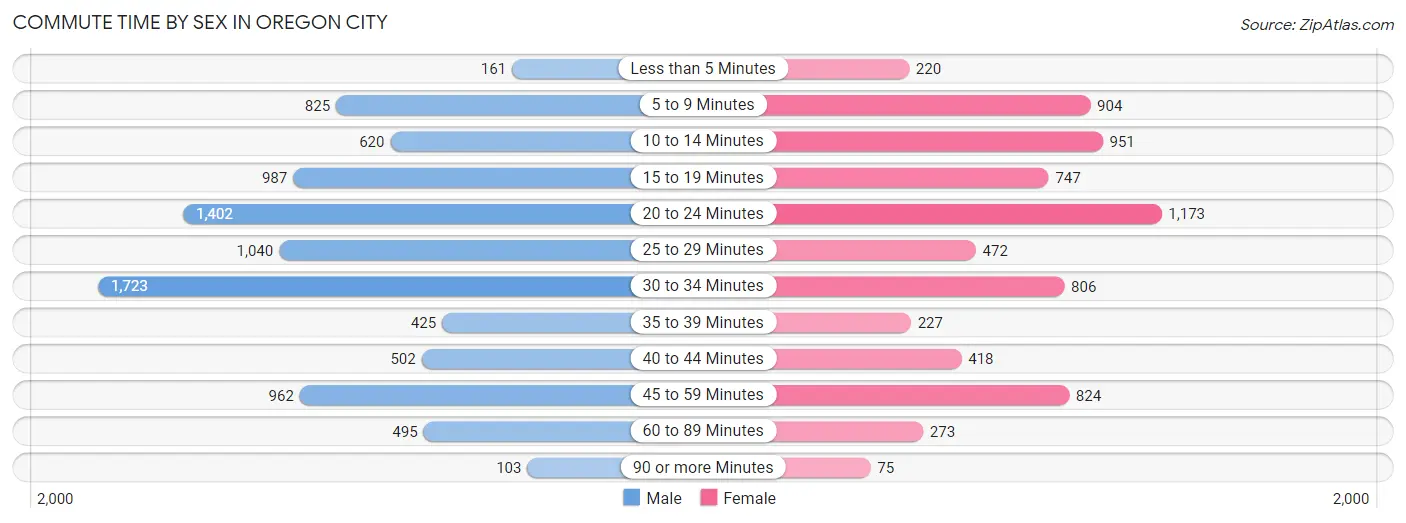
| Commute Time | Male | Female |
| Less than 5 Minutes | 161 (1.7%) | 220 (3.1%) |
| 5 to 9 Minutes | 825 (8.9%) | 904 (12.8%) |
| 10 to 14 Minutes | 620 (6.7%) | 951 (13.4%) |
| 15 to 19 Minutes | 987 (10.7%) | 747 (10.5%) |
| 20 to 24 Minutes | 1,402 (15.2%) | 1,173 (16.5%) |
| 25 to 29 Minutes | 1,040 (11.3%) | 472 (6.7%) |
| 30 to 34 Minutes | 1,723 (18.6%) | 806 (11.4%) |
| 35 to 39 Minutes | 425 (4.6%) | 227 (3.2%) |
| 40 to 44 Minutes | 502 (5.4%) | 418 (5.9%) |
| 45 to 59 Minutes | 962 (10.4%) | 824 (11.6%) |
| 60 to 89 Minutes | 495 (5.3%) | 273 (3.8%) |
| 90 or more Minutes | 103 (1.1%) | 75 (1.1%) |
Time of Departure to Work by Sex in Oregon City
The most frequent times of departure to work in Oregon City are 7:00 AM to 7:29 AM (1,281, 13.9%) for males and 7:00 AM to 7:29 AM (1,583, 22.3%) for females.
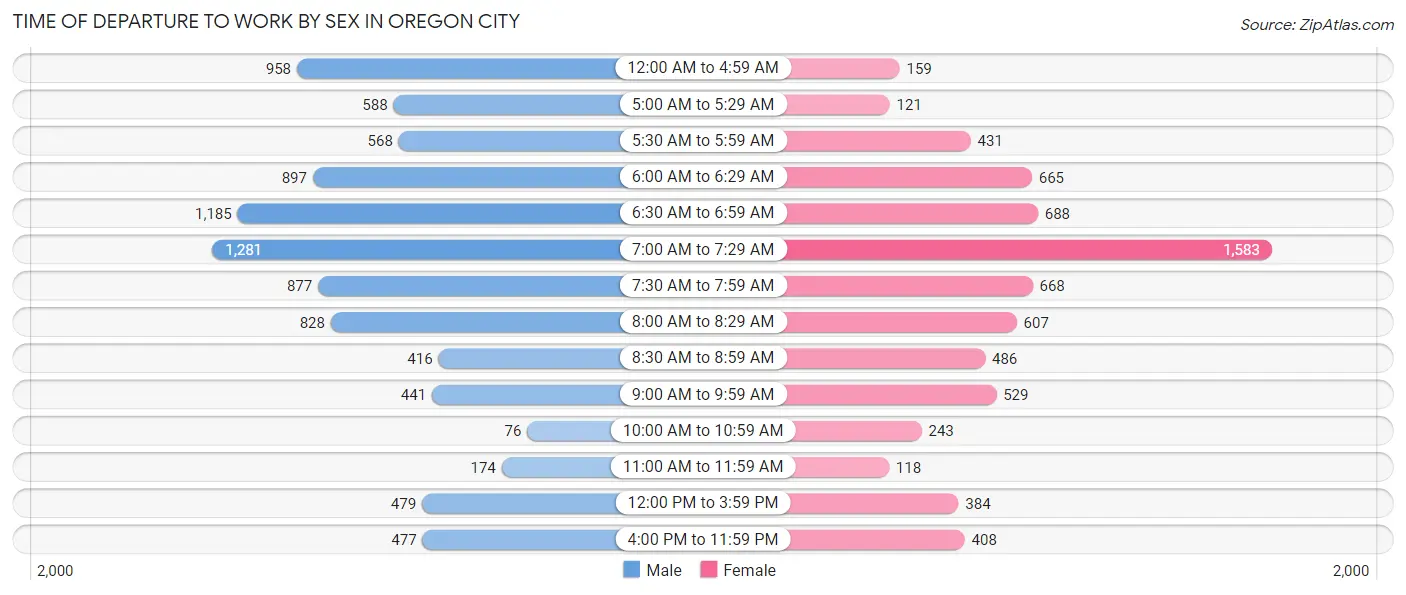
| Time of Departure | Male | Female |
| 12:00 AM to 4:59 AM | 958 (10.4%) | 159 (2.2%) |
| 5:00 AM to 5:29 AM | 588 (6.4%) | 121 (1.7%) |
| 5:30 AM to 5:59 AM | 568 (6.1%) | 431 (6.1%) |
| 6:00 AM to 6:29 AM | 897 (9.7%) | 665 (9.4%) |
| 6:30 AM to 6:59 AM | 1,185 (12.8%) | 688 (9.7%) |
| 7:00 AM to 7:29 AM | 1,281 (13.9%) | 1,583 (22.3%) |
| 7:30 AM to 7:59 AM | 877 (9.5%) | 668 (9.4%) |
| 8:00 AM to 8:29 AM | 828 (9.0%) | 607 (8.6%) |
| 8:30 AM to 8:59 AM | 416 (4.5%) | 486 (6.9%) |
| 9:00 AM to 9:59 AM | 441 (4.8%) | 529 (7.5%) |
| 10:00 AM to 10:59 AM | 76 (0.8%) | 243 (3.4%) |
| 11:00 AM to 11:59 AM | 174 (1.9%) | 118 (1.7%) |
| 12:00 PM to 3:59 PM | 479 (5.2%) | 384 (5.4%) |
| 4:00 PM to 11:59 PM | 477 (5.2%) | 408 (5.8%) |
| Total | 9,245 (100.0%) | 7,090 (100.0%) |
Housing Occupancy in Oregon City
Occupancy by Ownership in Oregon City
Of the total 13,802 dwellings in Oregon City, owner-occupied units account for 9,010 (65.3%), while renter-occupied units make up 4,792 (34.7%).
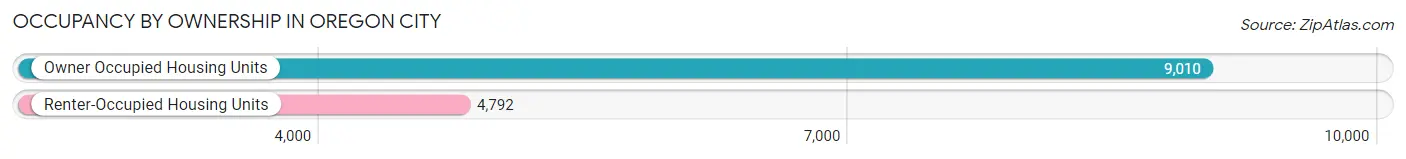
| Occupancy | # Housing Units | % Housing Units |
| Owner Occupied Housing Units | 9,010 | 65.3% |
| Renter-Occupied Housing Units | 4,792 | 34.7% |
| Total Occupied Housing Units | 13,802 | 100.0% |
Occupancy by Household Size in Oregon City
| Household Size | # Housing Units | % Housing Units |
| 1-Person Household | 3,059 | 22.2% |
| 2-Person Household | 4,977 | 36.1% |
| 3-Person Household | 2,548 | 18.5% |
| 4+ Person Household | 3,218 | 23.3% |
| Total Housing Units | 13,802 | 100.0% |
Occupancy by Ownership by Household Size in Oregon City
| Household Size | Owner-occupied | Renter-occupied |
| 1-Person Household | 1,428 (46.7%) | 1,631 (53.3%) |
| 2-Person Household | 3,504 (70.4%) | 1,473 (29.6%) |
| 3-Person Household | 1,690 (66.3%) | 858 (33.7%) |
| 4+ Person Household | 2,388 (74.2%) | 830 (25.8%) |
| Total Housing Units | 9,010 (65.3%) | 4,792 (34.7%) |
Occupancy by Educational Attainment in Oregon City
| Household Size | Owner-occupied | Renter-occupied |
| Less than High School | 242 (37.6%) | 401 (62.4%) |
| High School Diploma | 1,869 (57.4%) | 1,387 (42.6%) |
| College/Associate Degree | 3,656 (65.5%) | 1,924 (34.5%) |
| Bachelor's Degree or higher | 3,243 (75.0%) | 1,080 (25.0%) |
Occupancy by Age of Householder in Oregon City
| Age Bracket | # Households | % Households |
| Under 35 Years | 2,689 | 19.5% |
| 35 to 44 Years | 2,508 | 18.2% |
| 45 to 54 Years | 2,697 | 19.5% |
| 55 to 64 Years | 2,627 | 19.0% |
| 65 to 74 Years | 2,028 | 14.7% |
| 75 to 84 Years | 853 | 6.2% |
| 85 Years and Over | 400 | 2.9% |
| Total | 13,802 | 100.0% |
Housing Finances in Oregon City
Median Income by Occupancy in Oregon City
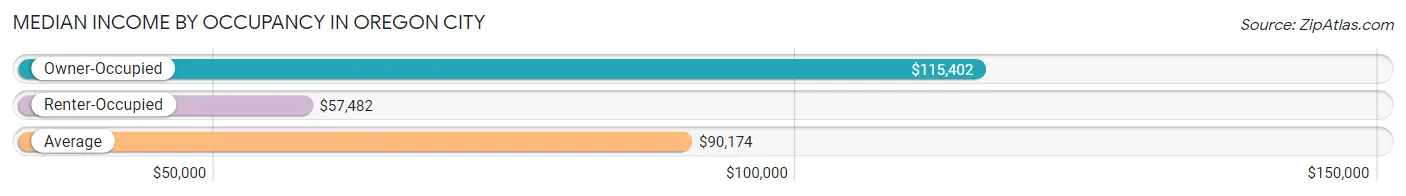
| Occupancy Type | # Households | Median Income |
| Owner-Occupied | 9,010 (65.3%) | $115,402 |
| Renter-Occupied | 4,792 (34.7%) | $57,482 |
| Average | 13,802 (100.0%) | $90,174 |
Occupancy by Householder Income Bracket in Oregon City
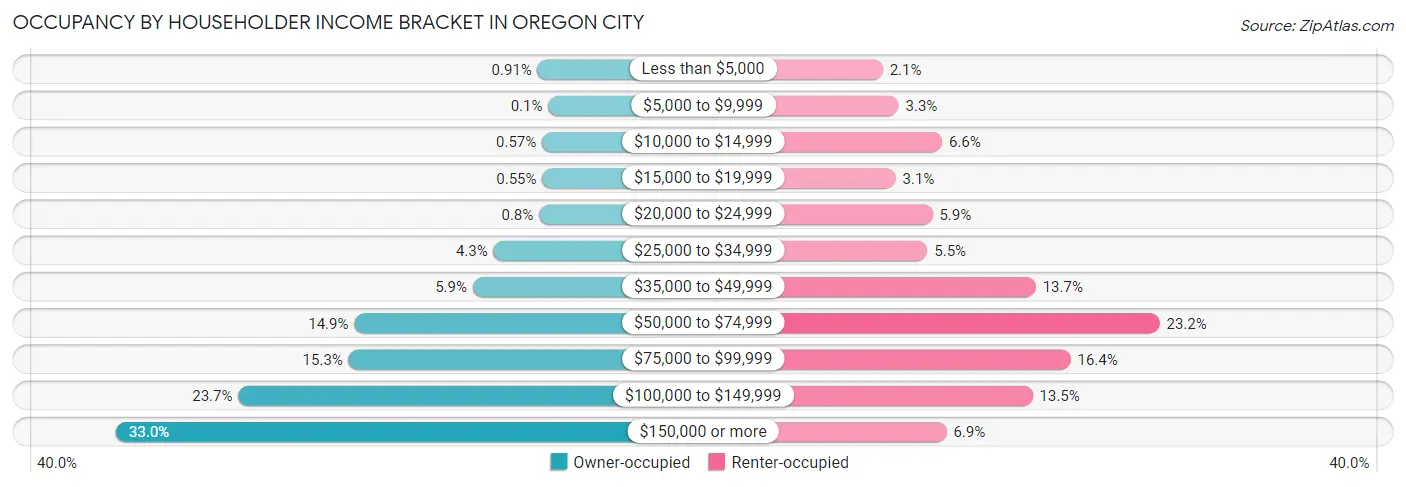
| Income Bracket | Owner-occupied | Renter-occupied |
| Less than $5,000 | 82 (0.9%) | 99 (2.1%) |
| $5,000 to $9,999 | 9 (0.1%) | 157 (3.3%) |
| $10,000 to $14,999 | 51 (0.6%) | 316 (6.6%) |
| $15,000 to $19,999 | 50 (0.5%) | 146 (3.0%) |
| $20,000 to $24,999 | 72 (0.8%) | 281 (5.9%) |
| $25,000 to $34,999 | 385 (4.3%) | 262 (5.5%) |
| $35,000 to $49,999 | 527 (5.9%) | 658 (13.7%) |
| $50,000 to $74,999 | 1,341 (14.9%) | 1,110 (23.2%) |
| $75,000 to $99,999 | 1,379 (15.3%) | 785 (16.4%) |
| $100,000 to $149,999 | 2,137 (23.7%) | 646 (13.5%) |
| $150,000 or more | 2,977 (33.0%) | 332 (6.9%) |
| Total | 9,010 (100.0%) | 4,792 (100.0%) |
Monthly Housing Cost Tiers in Oregon City
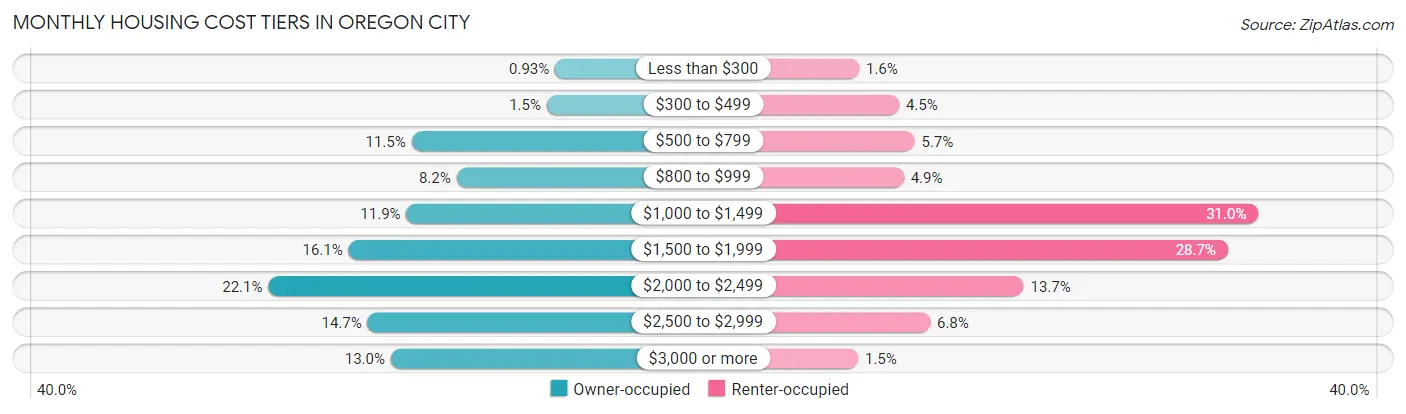
| Monthly Cost | Owner-occupied | Renter-occupied |
| Less than $300 | 84 (0.9%) | 76 (1.6%) |
| $300 to $499 | 139 (1.5%) | 217 (4.5%) |
| $500 to $799 | 1,036 (11.5%) | 272 (5.7%) |
| $800 to $999 | 738 (8.2%) | 234 (4.9%) |
| $1,000 to $1,499 | 1,070 (11.9%) | 1,485 (31.0%) |
| $1,500 to $1,999 | 1,454 (16.1%) | 1,377 (28.7%) |
| $2,000 to $2,499 | 1,987 (22.1%) | 657 (13.7%) |
| $2,500 to $2,999 | 1,328 (14.7%) | 327 (6.8%) |
| $3,000 or more | 1,174 (13.0%) | 73 (1.5%) |
| Total | 9,010 (100.0%) | 4,792 (100.0%) |
Physical Housing Characteristics in Oregon City
Housing Structures in Oregon City
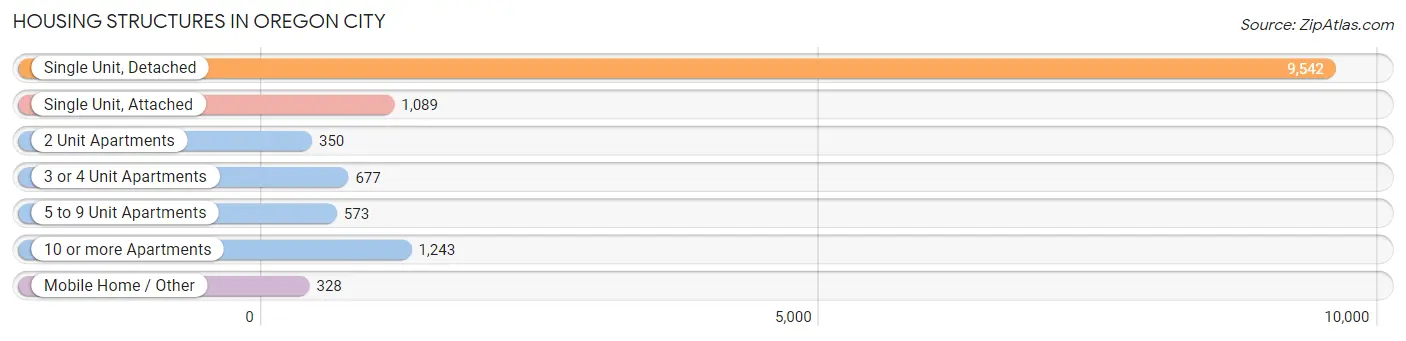
| Structure Type | # Housing Units | % Housing Units |
| Single Unit, Detached | 9,542 | 69.1% |
| Single Unit, Attached | 1,089 | 7.9% |
| 2 Unit Apartments | 350 | 2.5% |
| 3 or 4 Unit Apartments | 677 | 4.9% |
| 5 to 9 Unit Apartments | 573 | 4.2% |
| 10 or more Apartments | 1,243 | 9.0% |
| Mobile Home / Other | 328 | 2.4% |
| Total | 13,802 | 100.0% |
Housing Structures by Occupancy in Oregon City
| Structure Type | Owner-occupied | Renter-occupied |
| Single Unit, Detached | 8,350 (87.5%) | 1,192 (12.5%) |
| Single Unit, Attached | 331 (30.4%) | 758 (69.6%) |
| 2 Unit Apartments | 19 (5.4%) | 331 (94.6%) |
| 3 or 4 Unit Apartments | 0 (0.0%) | 677 (100.0%) |
| 5 to 9 Unit Apartments | 0 (0.0%) | 573 (100.0%) |
| 10 or more Apartments | 12 (1.0%) | 1,231 (99.0%) |
| Mobile Home / Other | 298 (90.8%) | 30 (9.1%) |
| Total | 9,010 (65.3%) | 4,792 (34.7%) |
Housing Structures by Number of Rooms in Oregon City
| Number of Rooms | Owner-occupied | Renter-occupied |
| 1 Room | 0 (0.0%) | 456 (9.5%) |
| 2 or 3 Rooms | 94 (1.0%) | 945 (19.7%) |
| 4 or 5 Rooms | 2,365 (26.3%) | 2,319 (48.4%) |
| 6 or 7 Rooms | 3,926 (43.6%) | 848 (17.7%) |
| 8 or more Rooms | 2,625 (29.1%) | 224 (4.7%) |
| Total | 9,010 (100.0%) | 4,792 (100.0%) |
Housing Structure by Heating Type in Oregon City
| Heating Type | Owner-occupied | Renter-occupied |
| Utility Gas | 6,809 (75.6%) | 832 (17.4%) |
| Bottled, Tank, or LP Gas | 103 (1.1%) | 83 (1.7%) |
| Electricity | 1,841 (20.4%) | 3,809 (79.5%) |
| Fuel Oil or Kerosene | 65 (0.7%) | 0 (0.0%) |
| Coal or Coke | 9 (0.1%) | 0 (0.0%) |
| All other Fuels | 183 (2.0%) | 54 (1.1%) |
| No Fuel Used | 0 (0.0%) | 14 (0.3%) |
| Total | 9,010 (100.0%) | 4,792 (100.0%) |
Household Vehicle Usage in Oregon City
| Vehicles per Household | Owner-occupied | Renter-occupied |
| No Vehicle | 66 (0.7%) | 598 (12.5%) |
| 1 Vehicle | 1,867 (20.7%) | 1,912 (39.9%) |
| 2 Vehicles | 4,156 (46.1%) | 1,626 (33.9%) |
| 3 or more Vehicles | 2,921 (32.4%) | 656 (13.7%) |
| Total | 9,010 (100.0%) | 4,792 (100.0%) |
Real Estate & Mortgages in Oregon City
Real Estate and Mortgage Overview in Oregon City
| Characteristic | Without Mortgage | With Mortgage |
| Housing Units | 2,139 | 6,871 |
| Median Property Value | $460,500 | $477,600 |
| Median Household Income | $75,250 | $2,678 |
| Monthly Housing Costs | $757 | $1,174 |
| Real Estate Taxes | $4,684 | $34 |
Property Value by Mortgage Status in Oregon City
| Property Value | Without Mortgage | With Mortgage |
| Less than $50,000 | 205 (9.6%) | 77 (1.1%) |
| $50,000 to $99,999 | 51 (2.4%) | 16 (0.2%) |
| $100,000 to $299,999 | 81 (3.8%) | 286 (4.2%) |
| $300,000 to $499,999 | 972 (45.4%) | 3,544 (51.6%) |
| $500,000 to $749,999 | 707 (33.1%) | 2,675 (38.9%) |
| $750,000 to $999,999 | 107 (5.0%) | 210 (3.1%) |
| $1,000,000 or more | 16 (0.7%) | 63 (0.9%) |
| Total | 2,139 (100.0%) | 6,871 (100.0%) |
Household Income by Mortgage Status in Oregon City
| Household Income | Without Mortgage | With Mortgage |
| Less than $10,000 | 33 (1.5%) | 131 (1.9%) |
| $10,000 to $24,999 | 81 (3.8%) | 58 (0.8%) |
| $25,000 to $34,999 | 258 (12.1%) | 92 (1.3%) |
| $35,000 to $49,999 | 224 (10.5%) | 127 (1.8%) |
| $50,000 to $74,999 | 471 (22.0%) | 303 (4.4%) |
| $75,000 to $99,999 | 297 (13.9%) | 870 (12.7%) |
| $100,000 to $149,999 | 476 (22.3%) | 1,082 (15.8%) |
| $150,000 or more | 299 (14.0%) | 1,661 (24.2%) |
| Total | 2,139 (100.0%) | 6,871 (100.0%) |
Property Value to Household Income Ratio in Oregon City
| Value-to-Income Ratio | Without Mortgage | With Mortgage |
| Less than 2.0x | 279 (13.0%) | 125,378 (1,824.7%) |
| 2.0x to 2.9x | 167 (7.8%) | 492 (7.2%) |
| 3.0x to 3.9x | 314 (14.7%) | 1,759 (25.6%) |
| 4.0x or more | 1,377 (64.4%) | 1,431 (20.8%) |
| Total | 2,139 (100.0%) | 6,871 (100.0%) |
Real Estate Taxes by Mortgage Status in Oregon City
| Property Taxes | Without Mortgage | With Mortgage |
| Less than $800 | 118 (5.5%) | 14 (0.2%) |
| $800 to $1,499 | 54 (2.5%) | 128 (1.9%) |
| $800 to $1,499 | 1,848 (86.4%) | 130 (1.9%) |
| Total | 2,139 (100.0%) | 6,871 (100.0%) |
Health & Disability in Oregon City
Health Insurance Coverage by Age in Oregon City
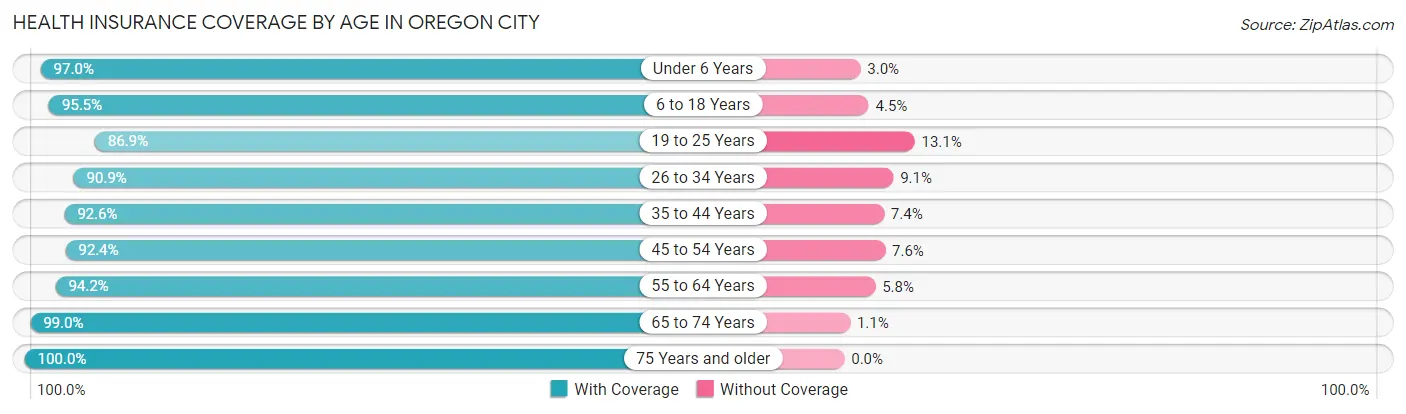
| Age Bracket | With Coverage | Without Coverage |
| Under 6 Years | 2,697 (97.0%) | 83 (3.0%) |
| 6 to 18 Years | 5,608 (95.5%) | 266 (4.5%) |
| 19 to 25 Years | 2,527 (86.9%) | 381 (13.1%) |
| 26 to 34 Years | 4,880 (90.9%) | 490 (9.1%) |
| 35 to 44 Years | 4,834 (92.6%) | 386 (7.4%) |
| 45 to 54 Years | 4,541 (92.4%) | 374 (7.6%) |
| 55 to 64 Years | 4,223 (94.2%) | 258 (5.8%) |
| 65 to 74 Years | 3,197 (99.0%) | 34 (1.1%) |
| 75 Years and older | 1,960 (100.0%) | 0 (0.0%) |
| Total | 34,467 (93.8%) | 2,272 (6.2%) |
Health Insurance Coverage by Citizenship Status in Oregon City
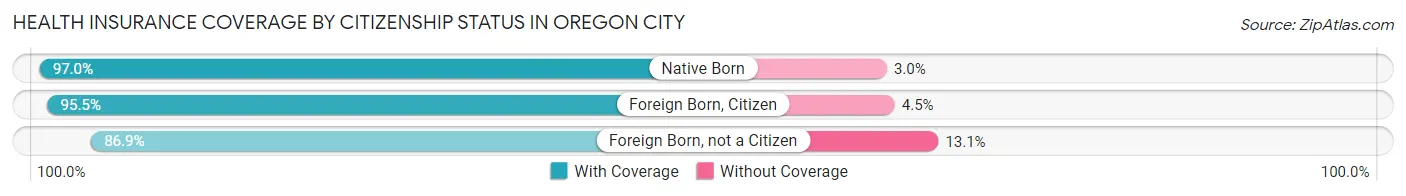
| Citizenship Status | With Coverage | Without Coverage |
| Native Born | 2,697 (97.0%) | 83 (3.0%) |
| Foreign Born, Citizen | 5,608 (95.5%) | 266 (4.5%) |
| Foreign Born, not a Citizen | 2,527 (86.9%) | 381 (13.1%) |
Health Insurance Coverage by Household Income in Oregon City
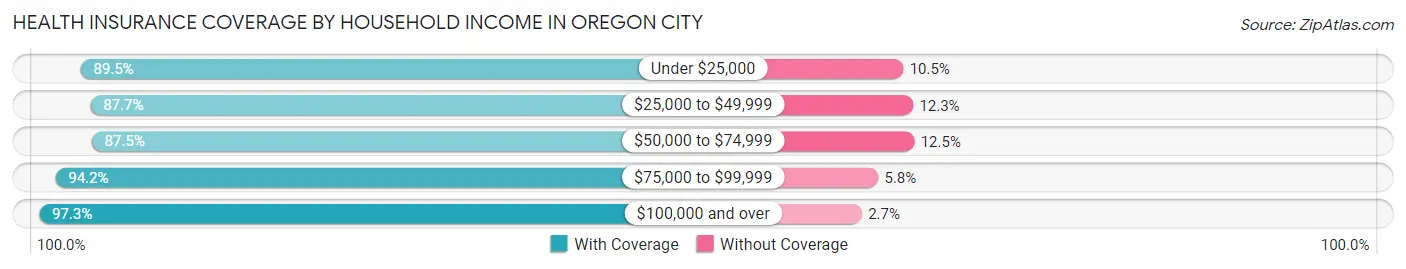
| Household Income | With Coverage | Without Coverage |
| Under $25,000 | 1,933 (89.5%) | 226 (10.5%) |
| $25,000 to $49,999 | 3,037 (87.7%) | 426 (12.3%) |
| $50,000 to $74,999 | 5,259 (87.5%) | 754 (12.5%) |
| $75,000 to $99,999 | 5,547 (94.2%) | 339 (5.8%) |
| $100,000 and over | 18,434 (97.3%) | 511 (2.7%) |
Public vs Private Health Insurance Coverage by Age in Oregon City
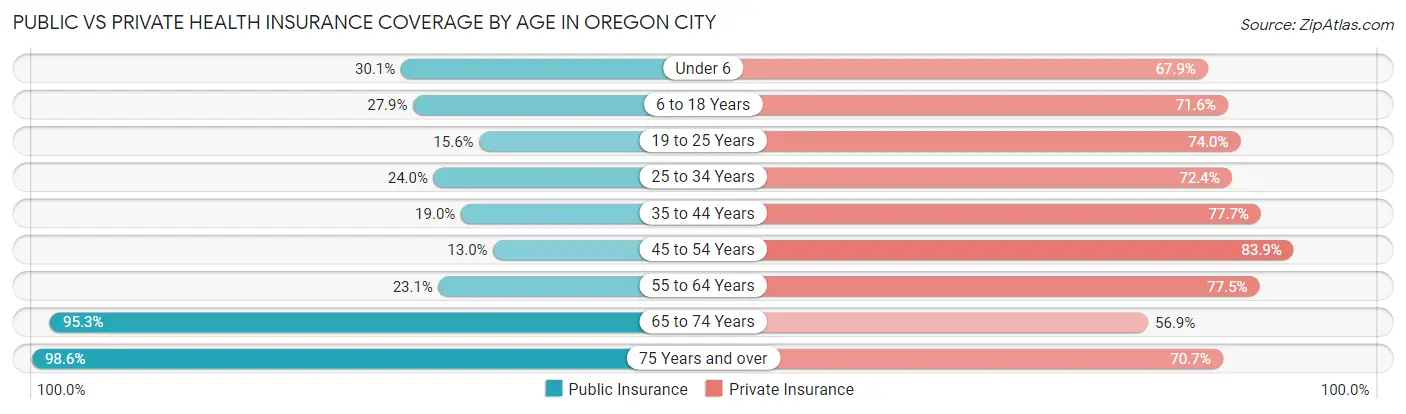
| Age Bracket | Public Insurance | Private Insurance |
| Under 6 | 837 (30.1%) | 1,888 (67.9%) |
| 6 to 18 Years | 1,636 (27.9%) | 4,207 (71.6%) |
| 19 to 25 Years | 453 (15.6%) | 2,151 (74.0%) |
| 25 to 34 Years | 1,291 (24.0%) | 3,885 (72.4%) |
| 35 to 44 Years | 990 (19.0%) | 4,058 (77.7%) |
| 45 to 54 Years | 638 (13.0%) | 4,122 (83.9%) |
| 55 to 64 Years | 1,037 (23.1%) | 3,473 (77.5%) |
| 65 to 74 Years | 3,078 (95.3%) | 1,837 (56.9%) |
| 75 Years and over | 1,933 (98.6%) | 1,385 (70.7%) |
| Total | 11,893 (32.4%) | 27,006 (73.5%) |
Disability Status by Sex by Age in Oregon City
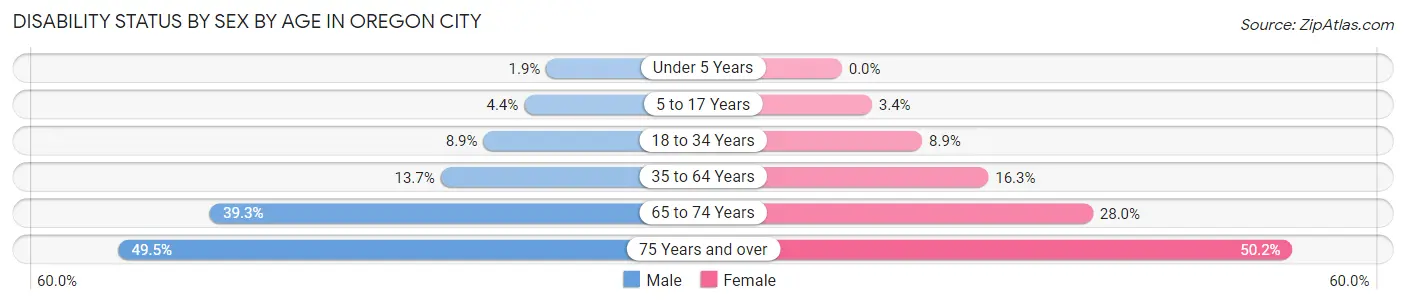
| Age Bracket | Male | Female |
| Under 5 Years | 22 (1.9%) | 0 (0.0%) |
| 5 to 17 Years | 121 (4.4%) | 110 (3.4%) |
| 18 to 34 Years | 396 (8.9%) | 383 (8.9%) |
| 35 to 64 Years | 1,010 (13.7%) | 1,181 (16.3%) |
| 65 to 74 Years | 597 (39.3%) | 479 (28.0%) |
| 75 Years and over | 410 (49.5%) | 568 (50.2%) |
Disability Class by Sex by Age in Oregon City
Disability Class: Hearing Difficulty
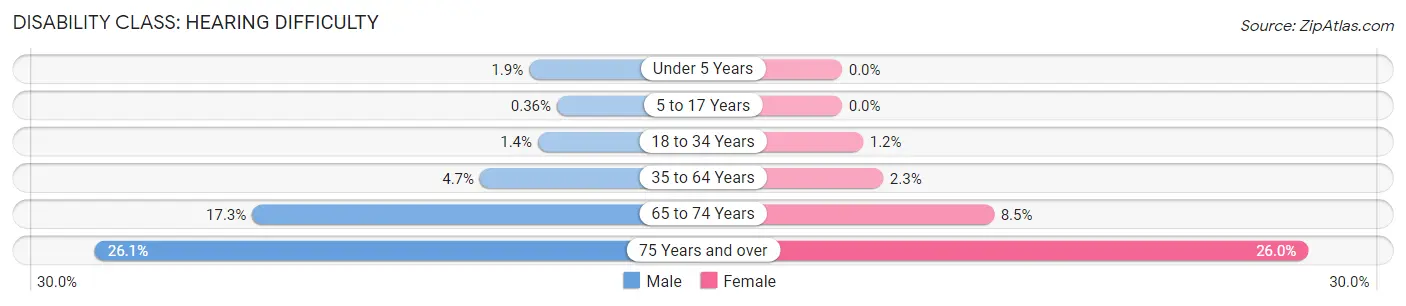
| Age Bracket | Male | Female |
| Under 5 Years | 22 (1.9%) | 0 (0.0%) |
| 5 to 17 Years | 10 (0.4%) | 0 (0.0%) |
| 18 to 34 Years | 63 (1.4%) | 50 (1.2%) |
| 35 to 64 Years | 343 (4.6%) | 166 (2.3%) |
| 65 to 74 Years | 263 (17.3%) | 145 (8.5%) |
| 75 Years and over | 216 (26.1%) | 294 (26.0%) |
Disability Class: Vision Difficulty
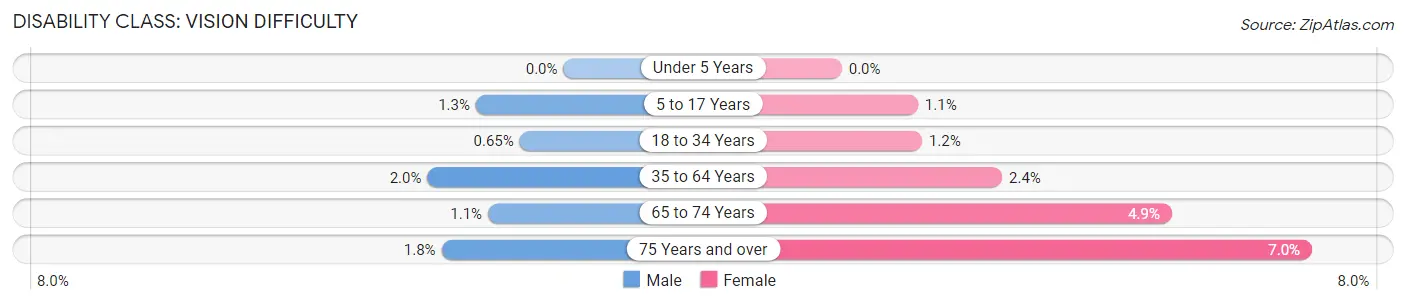
| Age Bracket | Male | Female |
| Under 5 Years | 0 (0.0%) | 0 (0.0%) |
| 5 to 17 Years | 36 (1.3%) | 37 (1.1%) |
| 18 to 34 Years | 29 (0.6%) | 51 (1.2%) |
| 35 to 64 Years | 149 (2.0%) | 172 (2.4%) |
| 65 to 74 Years | 17 (1.1%) | 84 (4.9%) |
| 75 Years and over | 15 (1.8%) | 79 (7.0%) |
Disability Class: Cognitive Difficulty
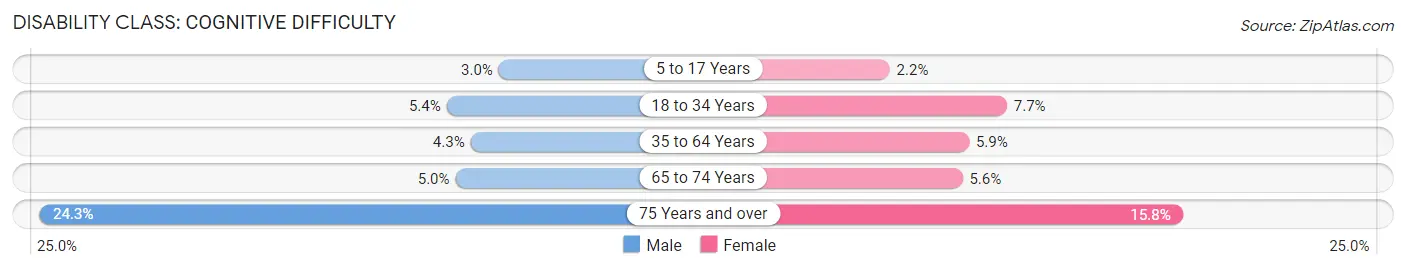
| Age Bracket | Male | Female |
| 5 to 17 Years | 83 (3.0%) | 73 (2.2%) |
| 18 to 34 Years | 241 (5.4%) | 328 (7.7%) |
| 35 to 64 Years | 318 (4.3%) | 427 (5.9%) |
| 65 to 74 Years | 76 (5.0%) | 96 (5.6%) |
| 75 Years and over | 201 (24.3%) | 179 (15.8%) |
Disability Class: Ambulatory Difficulty
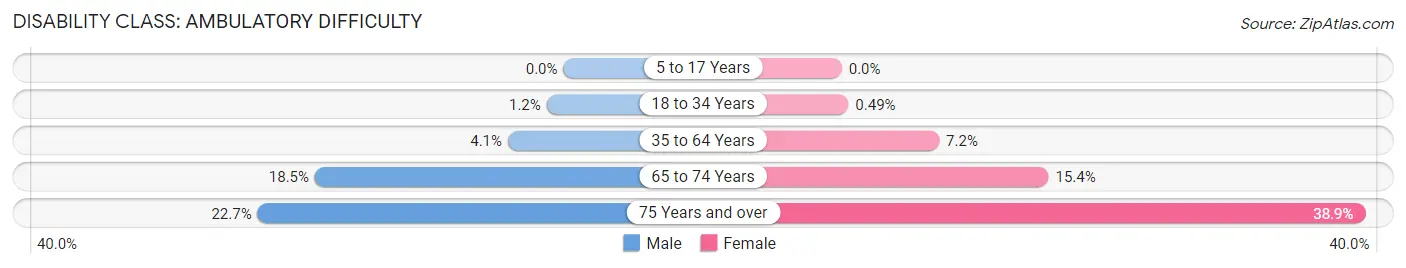
| Age Bracket | Male | Female |
| 5 to 17 Years | 0 (0.0%) | 0 (0.0%) |
| 18 to 34 Years | 55 (1.2%) | 21 (0.5%) |
| 35 to 64 Years | 304 (4.1%) | 523 (7.2%) |
| 65 to 74 Years | 280 (18.4%) | 263 (15.3%) |
| 75 Years and over | 188 (22.7%) | 440 (38.9%) |
Disability Class: Self-Care Difficulty
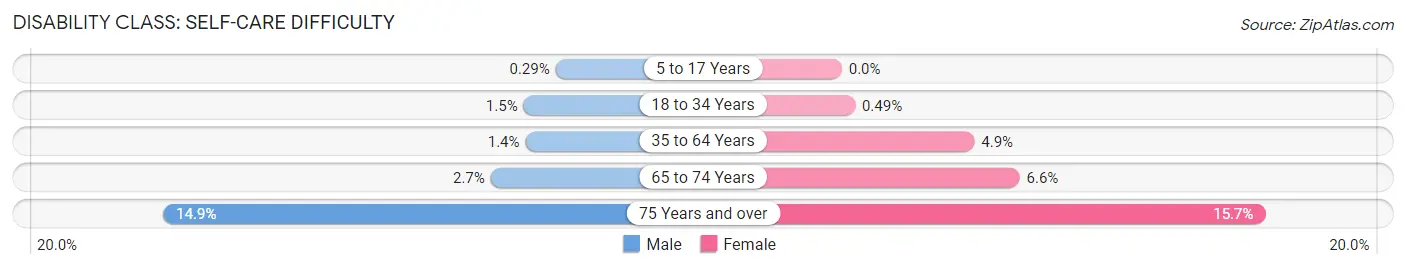
| Age Bracket | Male | Female |
| 5 to 17 Years | 8 (0.3%) | 0 (0.0%) |
| 18 to 34 Years | 66 (1.5%) | 21 (0.5%) |
| 35 to 64 Years | 104 (1.4%) | 356 (4.9%) |
| 65 to 74 Years | 41 (2.7%) | 113 (6.6%) |
| 75 Years and over | 123 (14.9%) | 178 (15.7%) |
Technology Access in Oregon City
Computing Device Access in Oregon City
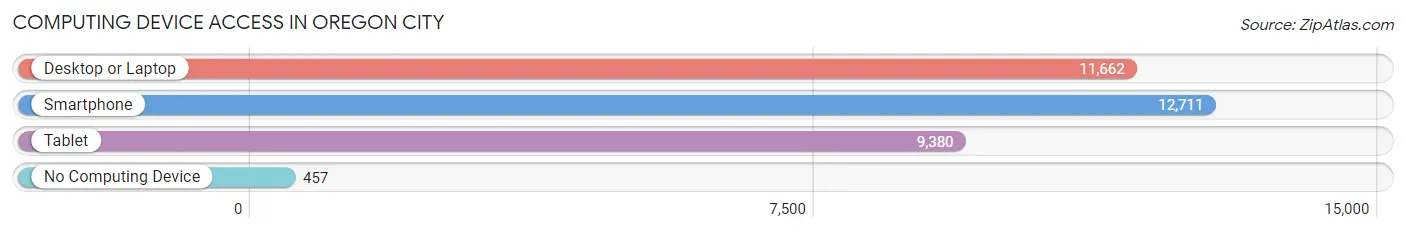
| Device Type | # Households | % Households |
| Desktop or Laptop | 11,662 | 84.5% |
| Smartphone | 12,711 | 92.1% |
| Tablet | 9,380 | 68.0% |
| No Computing Device | 457 | 3.3% |
| Total | 13,802 | 100.0% |
Internet Access in Oregon City
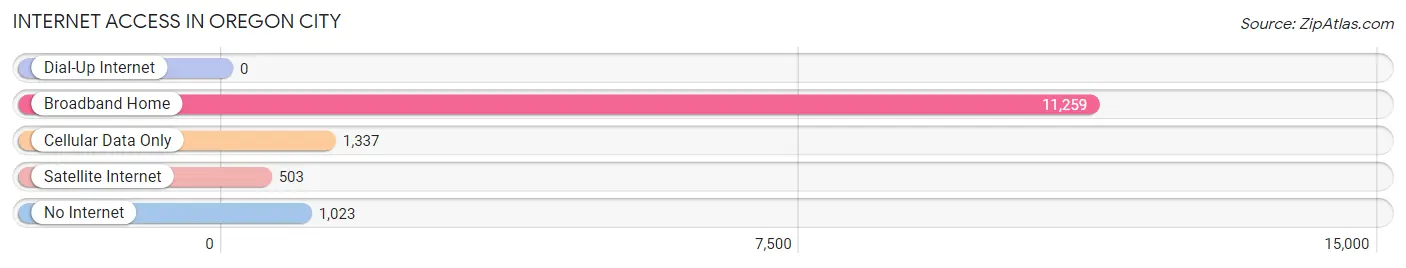
| Internet Type | # Households | % Households |
| Dial-Up Internet | 0 | 0.0% |
| Broadband Home | 11,259 | 81.6% |
| Cellular Data Only | 1,337 | 9.7% |
| Satellite Internet | 503 | 3.6% |
| No Internet | 1,023 | 7.4% |
| Total | 13,802 | 100.0% |
Oregon City Summary
Oregon City is a city located in the U.S. state of Oregon. It is the county seat of Clackamas County and is located on the Willamette River near the southern end of the Portland metropolitan area. As of the 2010 census, the city had a population of 31,859, making it the largest city in Clackamas County.
History
Oregon City was founded in 1829 by Dr. John McLoughlin, a former Chief Factor of the Hudson's Bay Company. McLoughlin was a major force in the settlement of the Oregon Country and was later known as the "Father of Oregon". The city was incorporated in 1844 and was the first incorporated city west of the Rocky Mountains.
Oregon City was the site of the first federal court west of the Rockies and the first public school in the Oregon Territory. It was also the site of the first post office in the Oregon Territory and the first newspaper in the Oregon Territory.
Geography
Oregon City is located in the Willamette Valley at the confluence of the Willamette and Clackamas Rivers. It is approximately 15 miles (24 km) south of Portland and 40 miles (64 km) north of Salem. The city is situated on a bluff overlooking the Willamette River and is surrounded by rolling hills and forests.
The city has a total area of 8.3 square miles (21.5 km2), of which 8.2 square miles (21.3 km2) is land and 0.1 square miles (0.2 km2) is water.
Economy
Oregon City is a major economic center for the region. The city is home to several large employers, including the Oregon City School District, Clackamas Community College, and the Oregon Department of Transportation. The city is also home to several large retail stores, including Fred Meyer, Walmart, and Target.
The city is also home to several industrial and manufacturing companies, including Cascade Steel Rolling Mills, Oregon Steel Mills, and Oregon Freeze Dry.
Demographics
As of the 2010 census, there were 31,859 people, 11,945 households, and 8,072 families residing in the city. The population density was 3,867.3 people per square mile (1,491.2/km2). There were 12,845 housing units at an average density of 1,564.2 per square mile (604.3/km2). The racial makeup of the city was 79.2% White, 1.3% African American, 0.9% Native American, 5.2% Asian, 0.4% Pacific Islander, 8.7% from other races, and 4.3% from two or more races. Hispanic or Latino of any race were 16.2% of the population.
The median income for a household in the city was $50,837, and the median income for a family was $60,945. Males had a median income of $45,844 versus $35,927 for females. The per capita income for the city was $24,837. About 8.2% of families and 11.2% of the population were below the poverty line, including 15.2% of those under age 18 and 6.2% of those age 65 or over.
Common Questions
What is Per Capita Income in Oregon City?
Per Capita income in Oregon City is $40,837.
What is the Median Family Income in Oregon City?
Median Family Income in Oregon City is $106,291.
What is the Median Household income in Oregon City?
Median Household Income in Oregon City is $90,174.
What is Income or Wage Gap in Oregon City?
Income or Wage Gap in Oregon City is 29.7%.
Women in Oregon City earn 70.3 cents for every dollar earned by a man.
What is Inequality or Gini Index in Oregon City?
Inequality or Gini Index in Oregon City is 0.38.
What is the Total Population of Oregon City?
Total Population of Oregon City is 37,418.
What is the Total Male Population of Oregon City?
Total Male Population of Oregon City is 18,536.
What is the Total Female Population of Oregon City?
Total Female Population of Oregon City is 18,882.
What is the Ratio of Males per 100 Females in Oregon City?
There are 98.17 Males per 100 Females in Oregon City.
What is the Ratio of Females per 100 Males in Oregon City?
There are 101.87 Females per 100 Males in Oregon City.
What is the Median Population Age in Oregon City?
Median Population Age in Oregon City is 37.1 Years.
What is the Average Family Size in Oregon City
Average Family Size in Oregon City is 3.1 People.
What is the Average Household Size in Oregon City
Average Household Size in Oregon City is 2.6 People.
How Large is the Labor Force in Oregon City?
There are 19,951 People in the Labor Forcein in Oregon City.
What is the Percentage of People in the Labor Force in Oregon City?
66.4% of People are in the Labor Force in Oregon City.
What is the Unemployment Rate in Oregon City?
Unemployment Rate in Oregon City is 5.0%.