Hermiston, OR Map & Demographics
Hermiston Map
Hermiston Overview
$28,035
PER CAPITA INCOME
$76,327
AVG FAMILY INCOME
$65,502
AVG HOUSEHOLD INCOME
38.0%
WAGE / INCOME GAP [ % ]
62.0¢/ $1
WAGE / INCOME GAP [ $ ]
0.39
INEQUALITY / GINI INDEX
19,267
TOTAL POPULATION
9,565
MALE POPULATION
9,702
FEMALE POPULATION
98.59
MALES / 100 FEMALES
101.43
FEMALES / 100 MALES
31.5
MEDIAN AGE
3.4
AVG FAMILY SIZE
2.9
AVG HOUSEHOLD SIZE
10,022
LABOR FORCE [ PEOPLE ]
70.7%
PERCENT IN LABOR FORCE
7.4%
UNEMPLOYMENT RATE
Hermiston Zip Codes
Hermiston Area Codes
Income in Hermiston
Income Overview in Hermiston
Per Capita Income in Hermiston is $28,035, while median incomes of families and households are $76,327 and $65,502 respectively.
| Characteristic | Number | Measure |
| Per Capita Income | 19,267 | $28,035 |
| Median Family Income | 4,542 | $76,327 |
| Mean Family Income | 4,542 | $86,054 |
| Median Household Income | 6,551 | $65,502 |
| Mean Household Income | 6,551 | $81,113 |
| Income Deficit | 4,542 | $0 |
| Wage / Income Gap (%) | 19,267 | 38.02% |
| Wage / Income Gap ($) | 19,267 | 61.98¢ per $1 |
| Gini / Inequality Index | 19,267 | 0.39 |
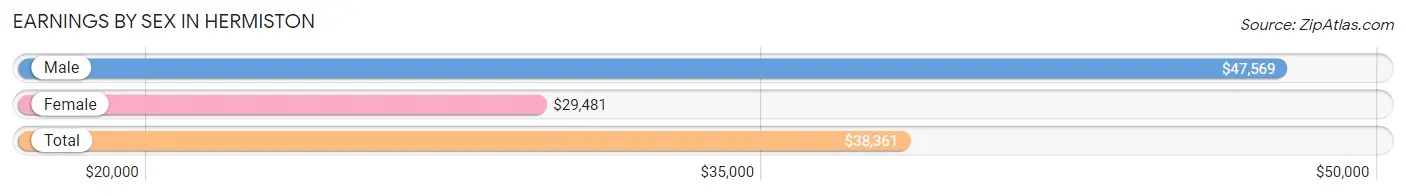
Earnings by Sex in Hermiston
Average Earnings in Hermiston are $38,361, $47,569 for men and $29,481 for women, a difference of 38.0%.
| Sex | Number | Average Earnings |
| Male | 5,654 (55.9%) | $47,569 |
| Female | 4,465 (44.1%) | $29,481 |
| Total | 10,119 (100.0%) | $38,361 |
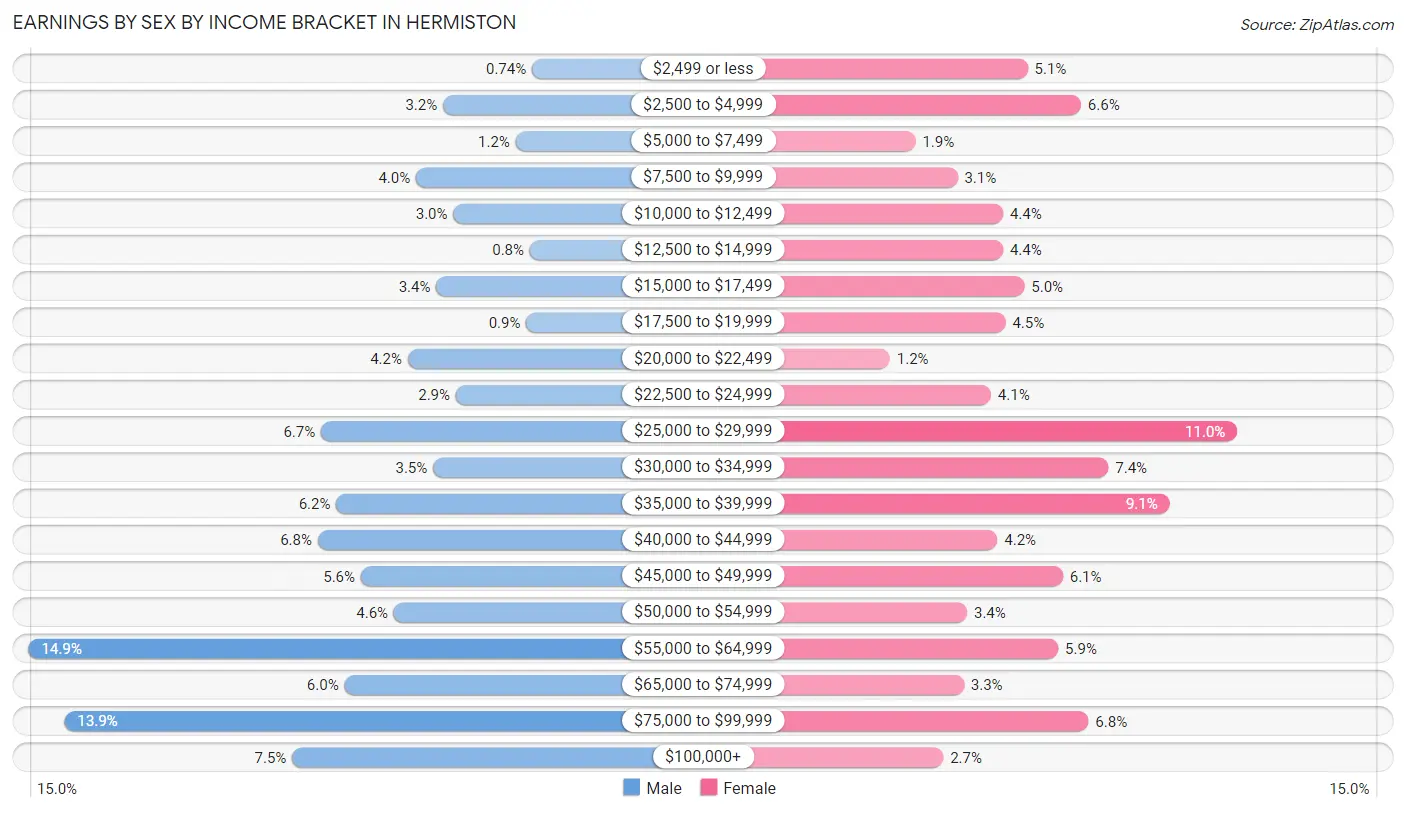
Earnings by Sex by Income Bracket in Hermiston
The most common earnings brackets in Hermiston are $55,000 to $64,999 for men (842 | 14.9%) and $25,000 to $29,999 for women (490 | 11.0%).
| Income | Male | Female |
| $2,499 or less | 42 (0.7%) | 227 (5.1%) |
| $2,500 to $4,999 | 183 (3.2%) | 294 (6.6%) |
| $5,000 to $7,499 | 68 (1.2%) | 86 (1.9%) |
| $7,500 to $9,999 | 226 (4.0%) | 139 (3.1%) |
| $10,000 to $12,499 | 167 (2.9%) | 196 (4.4%) |
| $12,500 to $14,999 | 45 (0.8%) | 196 (4.4%) |
| $15,000 to $17,499 | 194 (3.4%) | 223 (5.0%) |
| $17,500 to $19,999 | 51 (0.9%) | 199 (4.5%) |
| $20,000 to $22,499 | 239 (4.2%) | 54 (1.2%) |
| $22,500 to $24,999 | 163 (2.9%) | 181 (4.1%) |
| $25,000 to $29,999 | 377 (6.7%) | 490 (11.0%) |
| $30,000 to $34,999 | 199 (3.5%) | 328 (7.3%) |
| $35,000 to $39,999 | 353 (6.2%) | 405 (9.1%) |
| $40,000 to $44,999 | 382 (6.8%) | 189 (4.2%) |
| $45,000 to $49,999 | 314 (5.6%) | 271 (6.1%) |
| $50,000 to $54,999 | 261 (4.6%) | 151 (3.4%) |
| $55,000 to $64,999 | 842 (14.9%) | 265 (5.9%) |
| $65,000 to $74,999 | 340 (6.0%) | 147 (3.3%) |
| $75,000 to $99,999 | 785 (13.9%) | 303 (6.8%) |
| $100,000+ | 423 (7.5%) | 121 (2.7%) |
| Total | 5,654 (100.0%) | 4,465 (100.0%) |
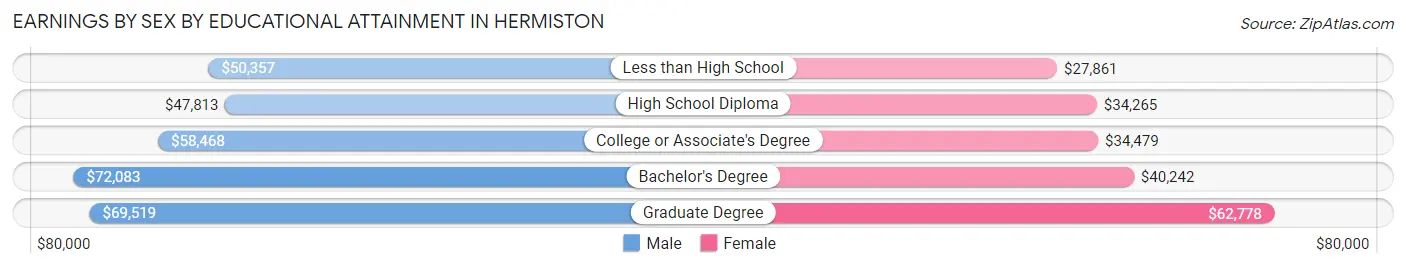
Earnings by Sex by Educational Attainment in Hermiston
Average earnings in Hermiston are $53,278 for men and $35,164 for women, a difference of 34.0%. Men with an educational attainment of bachelor's degree enjoy the highest average annual earnings of $72,083, while those with high school diploma education earn the least with $47,813. Women with an educational attainment of graduate degree earn the most with the average annual earnings of $62,778, while those with less than high school education have the smallest earnings of $27,861.
| Educational Attainment | Male Income | Female Income |
| Less than High School | $50,357 | $27,861 |
| High School Diploma | $47,813 | $34,265 |
| College or Associate's Degree | $58,468 | $34,479 |
| Bachelor's Degree | $72,083 | $40,242 |
| Graduate Degree | $69,519 | $62,778 |
| Total | $53,278 | $35,164 |
Family Income in Hermiston
Family Income Brackets in Hermiston
According to the Hermiston family income data, there are 1,045 families falling into the $50,000 to $74,999 income range, which is the most common income bracket and makes up 23.0% of all families. Conversely, the $10,000 to $14,999 income bracket is the least frequent group with only 82 families (1.8%) belonging to this category.
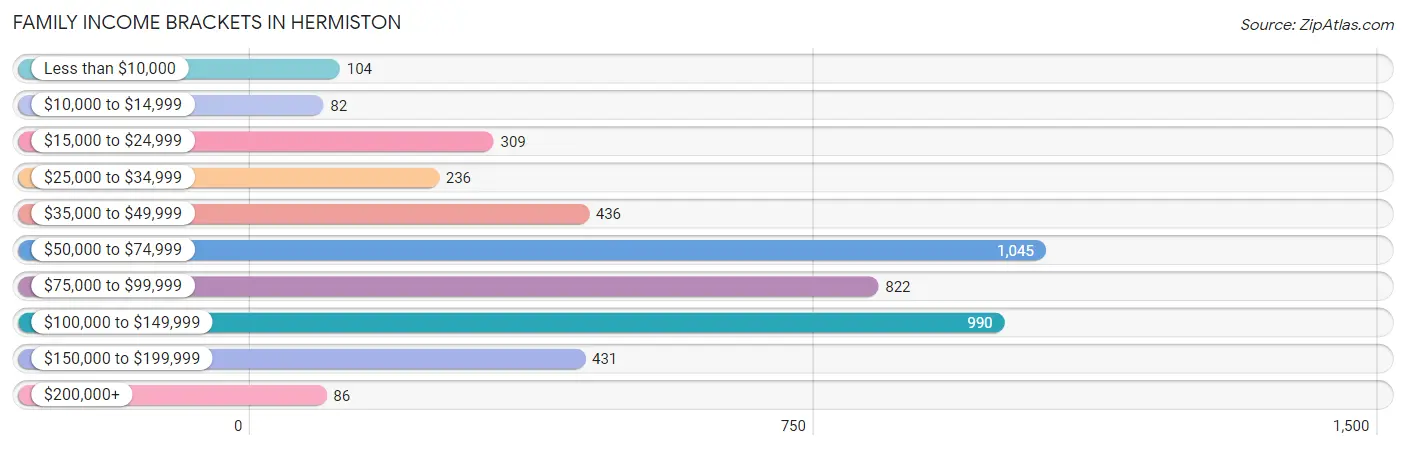
| Income Bracket | # Families | % Families |
| Less than $10,000 | 104 | 2.3% |
| $10,000 to $14,999 | 82 | 1.8% |
| $15,000 to $24,999 | 309 | 6.8% |
| $25,000 to $34,999 | 236 | 5.2% |
| $35,000 to $49,999 | 436 | 9.6% |
| $50,000 to $74,999 | 1,045 | 23.0% |
| $75,000 to $99,999 | 822 | 18.1% |
| $100,000 to $149,999 | 990 | 21.8% |
| $150,000 to $199,999 | 431 | 9.5% |
| $200,000+ | 86 | 1.9% |
Family Income by Famaliy Size in Hermiston
5-person families (416 | 9.2%) account for the highest median family income in Hermiston with $99,167 per family, while 2-person families (1,722 | 37.9%) have the highest median income of $28,750 per family member.
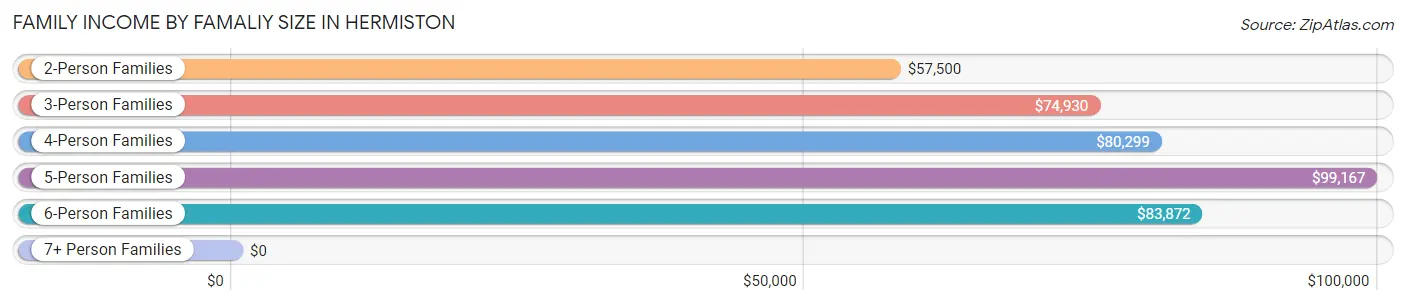
| Income Bracket | # Families | Median Income |
| 2-Person Families | 1,722 (37.9%) | $57,500 |
| 3-Person Families | 1,210 (26.6%) | $74,930 |
| 4-Person Families | 927 (20.4%) | $80,299 |
| 5-Person Families | 416 (9.2%) | $99,167 |
| 6-Person Families | 155 (3.4%) | $83,872 |
| 7+ Person Families | 112 (2.5%) | $0 |
| Total | 4,542 (100.0%) | $76,327 |
Family Income by Number of Earners in Hermiston
The median family income in Hermiston is $76,327, with families comprising 3+ earners (664) having the highest median family income of $114,235, while families with no earners (483) have the lowest median family income of $48,897, accounting for 14.6% and 10.6% of families, respectively.
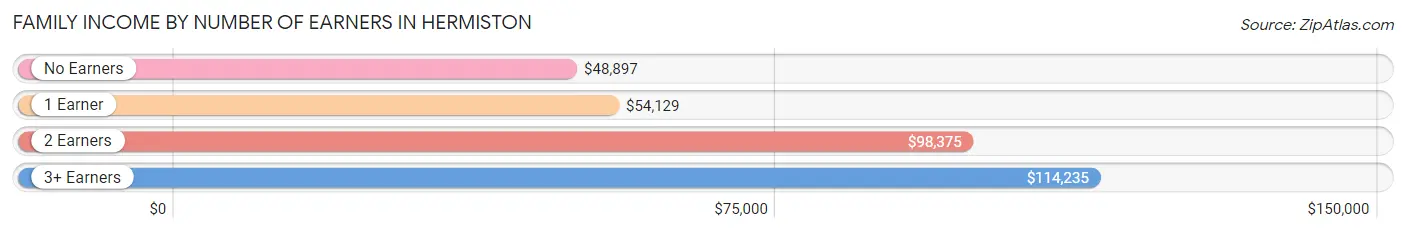
| Number of Earners | # Families | Median Income |
| No Earners | 483 (10.6%) | $48,897 |
| 1 Earner | 1,732 (38.1%) | $54,129 |
| 2 Earners | 1,663 (36.6%) | $98,375 |
| 3+ Earners | 664 (14.6%) | $114,235 |
| Total | 4,542 (100.0%) | $76,327 |
Household Income in Hermiston
Household Income Brackets in Hermiston
With 1,297 households falling in the category, the $100,000 to $149,999 income range is the most frequent in Hermiston, accounting for 19.8% of all households. In contrast, only 164 households (2.5%) fall into the less than $10,000 income bracket, making it the least populous group.
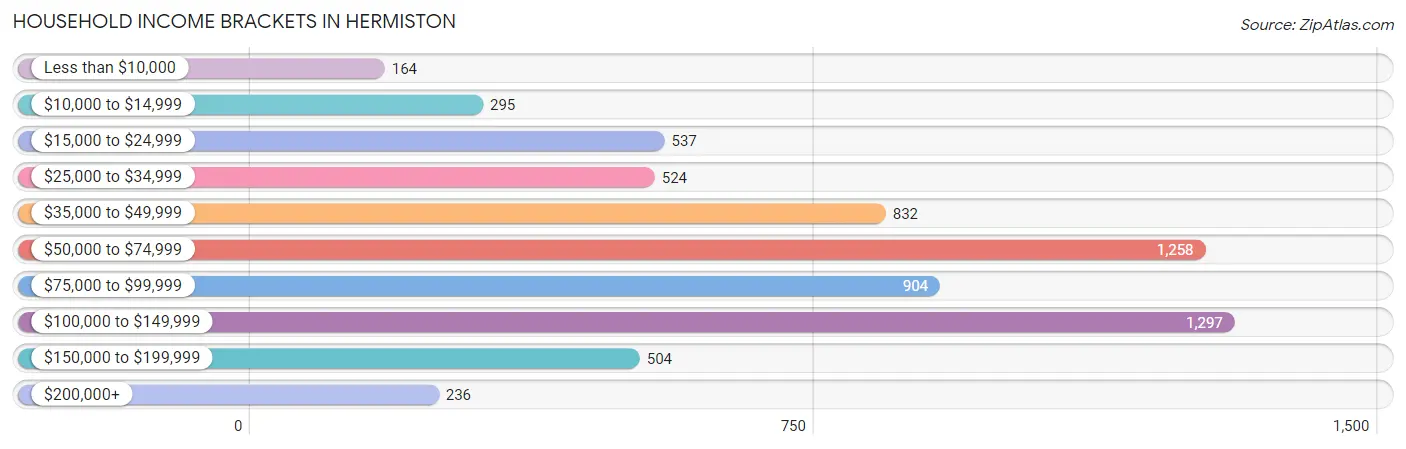
| Income Bracket | # Households | % Households |
| Less than $10,000 | 164 | 2.5% |
| $10,000 to $14,999 | 295 | 4.5% |
| $15,000 to $24,999 | 537 | 8.2% |
| $25,000 to $34,999 | 524 | 8.0% |
| $35,000 to $49,999 | 832 | 12.7% |
| $50,000 to $74,999 | 1,258 | 19.2% |
| $75,000 to $99,999 | 904 | 13.8% |
| $100,000 to $149,999 | 1,297 | 19.8% |
| $150,000 to $199,999 | 504 | 7.7% |
| $200,000+ | 236 | 3.6% |
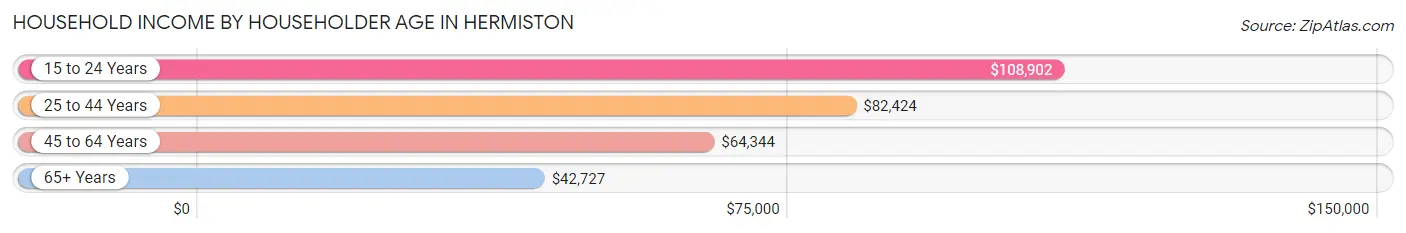
Household Income by Householder Age in Hermiston
The median household income in Hermiston is $65,502, with the highest median household income of $108,902 found in the 15 to 24 years age bracket for the primary householder. A total of 355 households (5.4%) fall into this category. Meanwhile, the 65+ years age bracket for the primary householder has the lowest median household income of $42,727, with 1,464 households (22.4%) in this group.
| Income Bracket | # Households | Median Income |
| 15 to 24 Years | 355 (5.4%) | $108,902 |
| 25 to 44 Years | 2,837 (43.3%) | $82,424 |
| 45 to 64 Years | 1,895 (28.9%) | $64,344 |
| 65+ Years | 1,464 (22.4%) | $42,727 |
| Total | 6,551 (100.0%) | $65,502 |
Poverty in Hermiston
Income Below Poverty by Sex and Age in Hermiston
With 8.2% poverty level for males and 14.1% for females among the residents of Hermiston, 6 to 11 year old males and 75 year old and over females are the most vulnerable to poverty, with 161 males (22.9%) and 113 females (25.7%) in their respective age groups living below the poverty level.
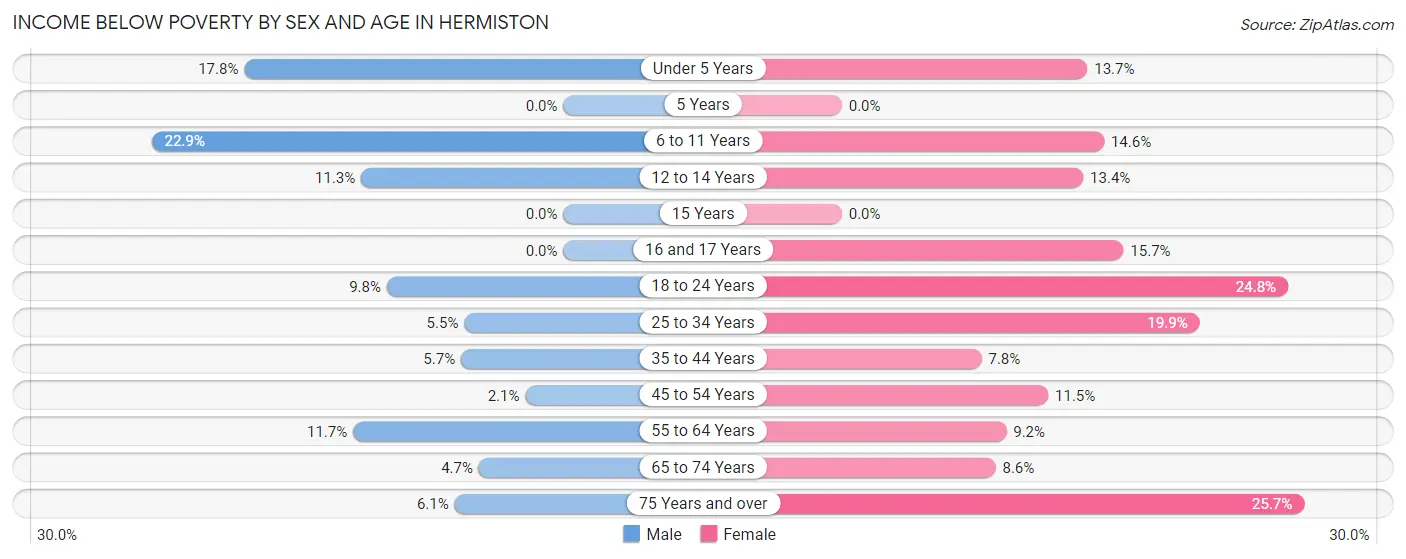
| Age Bracket | Male | Female |
| Under 5 Years | 113 (17.8%) | 83 (13.7%) |
| 5 Years | 0 (0.0%) | 0 (0.0%) |
| 6 to 11 Years | 161 (22.9%) | 191 (14.6%) |
| 12 to 14 Years | 59 (11.3%) | 79 (13.4%) |
| 15 Years | 0 (0.0%) | 0 (0.0%) |
| 16 and 17 Years | 0 (0.0%) | 77 (15.7%) |
| 18 to 24 Years | 116 (9.8%) | 191 (24.8%) |
| 25 to 34 Years | 92 (5.5%) | 257 (19.9%) |
| 35 to 44 Years | 81 (5.7%) | 94 (7.8%) |
| 45 to 54 Years | 23 (2.1%) | 141 (11.5%) |
| 55 to 64 Years | 83 (11.7%) | 60 (9.2%) |
| 65 to 74 Years | 32 (4.7%) | 68 (8.6%) |
| 75 Years and over | 16 (6.1%) | 113 (25.7%) |
| Total | 776 (8.2%) | 1,354 (14.1%) |
Income Above Poverty by Sex and Age in Hermiston
According to the poverty statistics in Hermiston, males aged 5 years and females aged 5 years are the age groups that are most secure financially, with 100.0% of males and 100.0% of females in these age groups living above the poverty line.
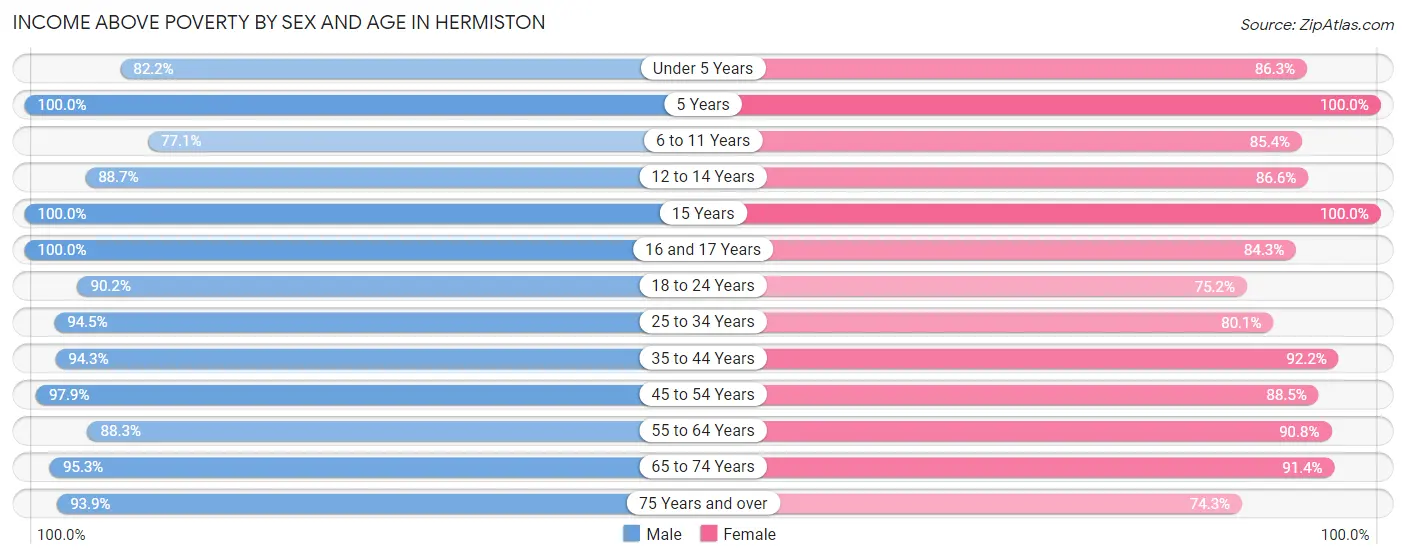
| Age Bracket | Male | Female |
| Under 5 Years | 523 (82.2%) | 524 (86.3%) |
| 5 Years | 325 (100.0%) | 68 (100.0%) |
| 6 to 11 Years | 541 (77.1%) | 1,117 (85.4%) |
| 12 to 14 Years | 465 (88.7%) | 509 (86.6%) |
| 15 Years | 172 (100.0%) | 162 (100.0%) |
| 16 and 17 Years | 133 (100.0%) | 414 (84.3%) |
| 18 to 24 Years | 1,064 (90.2%) | 578 (75.2%) |
| 25 to 34 Years | 1,574 (94.5%) | 1,033 (80.1%) |
| 35 to 44 Years | 1,340 (94.3%) | 1,115 (92.2%) |
| 45 to 54 Years | 1,064 (97.9%) | 1,086 (88.5%) |
| 55 to 64 Years | 626 (88.3%) | 595 (90.8%) |
| 65 to 74 Years | 647 (95.3%) | 726 (91.4%) |
| 75 Years and over | 248 (93.9%) | 326 (74.3%) |
| Total | 8,722 (91.8%) | 8,253 (85.9%) |
Income Below Poverty Among Married-Couple Families in Hermiston
The poverty statistics for married-couple families in Hermiston show that 4.4% or 134 of the total 3,010 families live below the poverty line. Families with 1 or 2 children have the highest poverty rate of 8.2%, comprising of 106 families. On the other hand, families with 3 or 4 children have the lowest poverty rate of 0.0%, which includes 0 families.
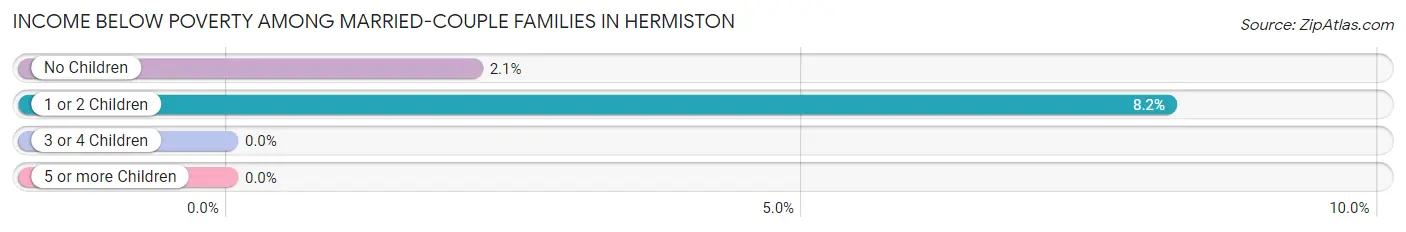
| Children | Above Poverty | Below Poverty |
| No Children | 1,289 (97.9%) | 28 (2.1%) |
| 1 or 2 Children | 1,191 (91.8%) | 106 (8.2%) |
| 3 or 4 Children | 347 (100.0%) | 0 (0.0%) |
| 5 or more Children | 49 (100.0%) | 0 (0.0%) |
| Total | 2,876 (95.6%) | 134 (4.4%) |
Income Below Poverty Among Single-Parent Households in Hermiston
According to the poverty data in Hermiston, 6.8% or 40 single-father households and 23.4% or 220 single-mother households are living below the poverty line. Among single-father households, those with 3 or 4 children have the highest poverty rate, with 23 households (13.7%) experiencing poverty. Likewise, among single-mother households, those with 3 or 4 children have the highest poverty rate, with 36 households (33.0%) falling below the poverty line.
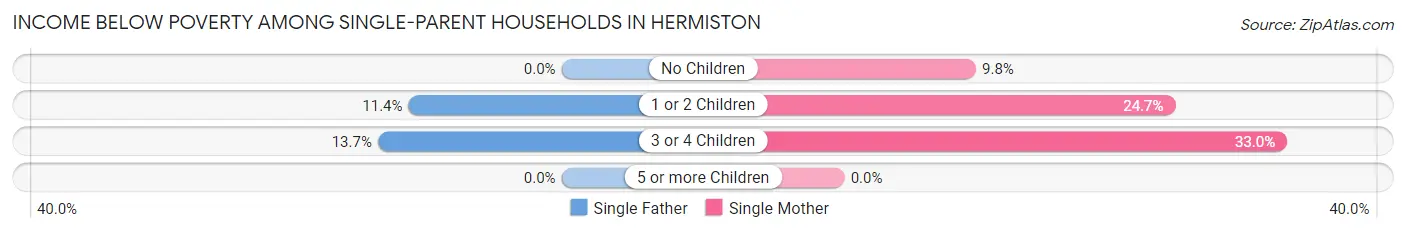
| Children | Single Father | Single Mother |
| No Children | 0 (0.0%) | 14 (9.8%) |
| 1 or 2 Children | 17 (11.4%) | 170 (24.7%) |
| 3 or 4 Children | 23 (13.7%) | 36 (33.0%) |
| 5 or more Children | 0 (0.0%) | 0 (0.0%) |
| Total | 40 (6.8%) | 220 (23.4%) |
Income Below Poverty Among Married-Couple vs Single-Parent Households in Hermiston
The poverty data for Hermiston shows that 134 of the married-couple family households (4.4%) and 260 of the single-parent households (17.0%) are living below the poverty level. Within the married-couple family households, those with 1 or 2 children have the highest poverty rate, with 106 households (8.2%) falling below the poverty line. Among the single-parent households, those with 1 or 2 children have the highest poverty rate, with 187 household (22.3%) living below poverty.
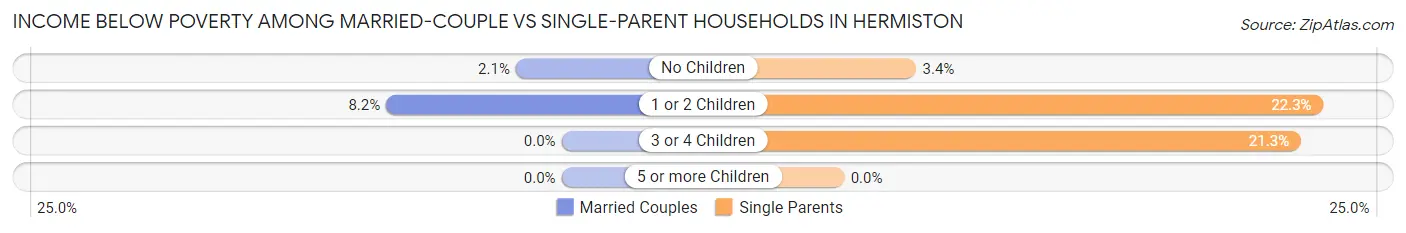
| Children | Married-Couple Families | Single-Parent Households |
| No Children | 28 (2.1%) | 14 (3.4%) |
| 1 or 2 Children | 106 (8.2%) | 187 (22.3%) |
| 3 or 4 Children | 0 (0.0%) | 59 (21.3%) |
| 5 or more Children | 0 (0.0%) | 0 (0.0%) |
| Total | 134 (4.4%) | 260 (17.0%) |
Race in Hermiston
The most populous races in Hermiston are White / Caucasian (13,260 | 68.8%), Hispanic or Latino (10,062 | 52.2%), and Some other Race (3,448 | 17.9%).
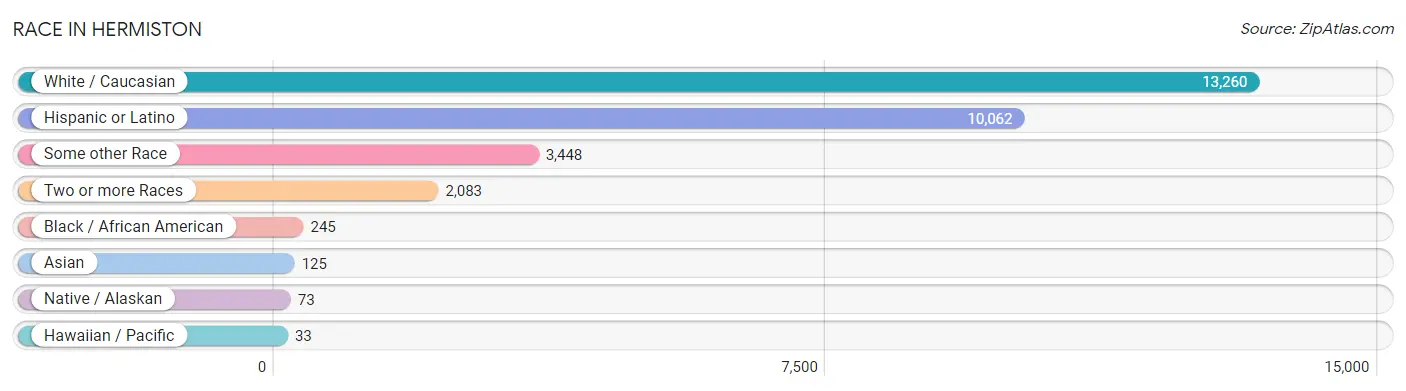
| Race | # Population | % Population |
| Asian | 125 | 0.6% |
| Black / African American | 245 | 1.3% |
| Hawaiian / Pacific | 33 | 0.2% |
| Hispanic or Latino | 10,062 | 52.2% |
| Native / Alaskan | 73 | 0.4% |
| White / Caucasian | 13,260 | 68.8% |
| Two or more Races | 2,083 | 10.8% |
| Some other Race | 3,448 | 17.9% |
| Total | 19,267 | 100.0% |
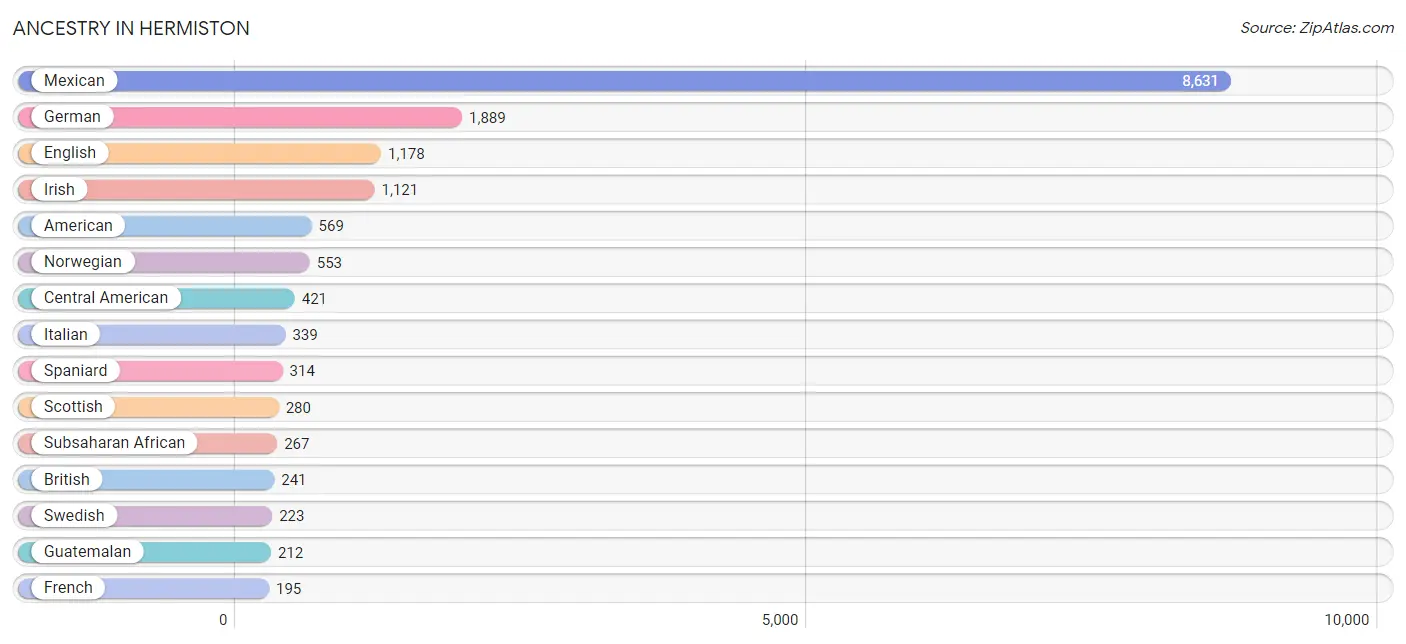
Ancestry in Hermiston
The most populous ancestries reported in Hermiston are Mexican (8,631 | 44.8%), German (1,889 | 9.8%), English (1,178 | 6.1%), Irish (1,121 | 5.8%), and American (569 | 2.9%), together accounting for 69.5% of all Hermiston residents.
| Ancestry | # Population | % Population |
| American | 569 | 2.9% |
| Argentinean | 5 | 0.0% |
| Blackfeet | 59 | 0.3% |
| British | 241 | 1.3% |
| Burmese | 1 | 0.0% |
| Celtic | 17 | 0.1% |
| Central American | 421 | 2.2% |
| Cherokee | 28 | 0.2% |
| Costa Rican | 18 | 0.1% |
| Croatian | 23 | 0.1% |
| Cuban | 119 | 0.6% |
| Czech | 79 | 0.4% |
| Czechoslovakian | 51 | 0.3% |
| Danish | 22 | 0.1% |
| Dutch | 80 | 0.4% |
| English | 1,178 | 6.1% |
| European | 111 | 0.6% |
| Finnish | 15 | 0.1% |
| French | 195 | 1.0% |
| French Canadian | 22 | 0.1% |
| German | 1,889 | 9.8% |
| Guamanian / Chamorro | 21 | 0.1% |
| Guatemalan | 212 | 1.1% |
| Hungarian | 13 | 0.1% |
| Icelander | 7 | 0.0% |
| Indian (Asian) | 24 | 0.1% |
| Irish | 1,121 | 5.8% |
| Italian | 339 | 1.8% |
| Korean | 8 | 0.0% |
| Laotian | 13 | 0.1% |
| Mexican | 8,631 | 44.8% |
| Mexican American Indian | 125 | 0.6% |
| Norwegian | 553 | 2.9% |
| Peruvian | 110 | 0.6% |
| Polish | 148 | 0.8% |
| Romanian | 2 | 0.0% |
| Russian | 35 | 0.2% |
| Salvadoran | 191 | 1.0% |
| Scandinavian | 10 | 0.1% |
| Scotch-Irish | 158 | 0.8% |
| Scottish | 280 | 1.5% |
| South African | 90 | 0.5% |
| South American | 115 | 0.6% |
| Spaniard | 314 | 1.6% |
| Spanish | 121 | 0.6% |
| Subsaharan African | 267 | 1.4% |
| Swedish | 223 | 1.2% |
| Swiss | 55 | 0.3% |
| Thai | 12 | 0.1% |
| Tlingit-Haida | 17 | 0.1% |
| Welsh | 169 | 0.9% | View All 51 Rows |
Immigrants in Hermiston
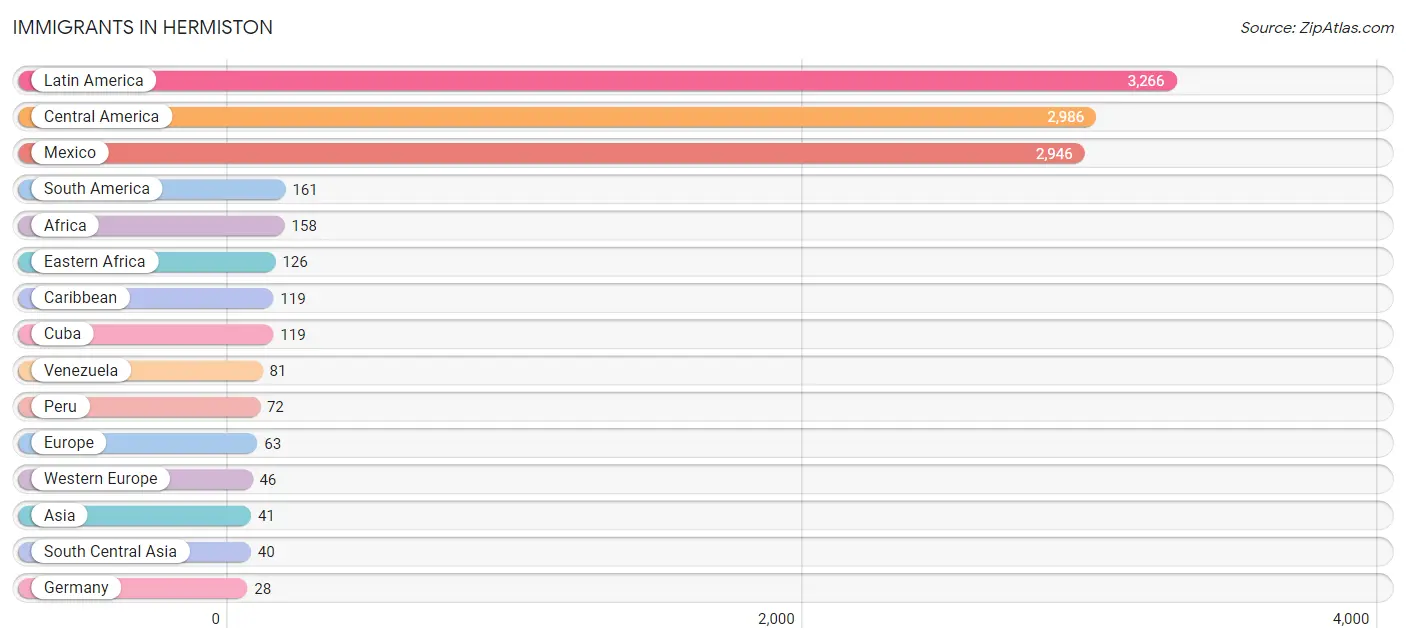
The most numerous immigrant groups reported in Hermiston came from Latin America (3,266 | 17.0%), Central America (2,986 | 15.5%), Mexico (2,946 | 15.3%), South America (161 | 0.8%), and Africa (158 | 0.8%), together accounting for 49.4% of all Hermiston residents.
| Immigration Origin | # Population | % Population |
| Africa | 158 | 0.8% |
| Argentina | 8 | 0.0% |
| Asia | 41 | 0.2% |
| Caribbean | 119 | 0.6% |
| Central America | 2,986 | 15.5% |
| Costa Rica | 18 | 0.1% |
| Cuba | 119 | 0.6% |
| Eastern Africa | 126 | 0.6% |
| Eastern Asia | 1 | 0.0% |
| Eastern Europe | 2 | 0.0% |
| Europe | 63 | 0.3% |
| France | 18 | 0.1% |
| Germany | 28 | 0.2% |
| Guatemala | 22 | 0.1% |
| India | 13 | 0.1% |
| Korea | 1 | 0.0% |
| Latin America | 3,266 | 17.0% |
| Mexico | 2,946 | 15.3% |
| Nepal | 27 | 0.1% |
| Northern Europe | 15 | 0.1% |
| Oceania | 8 | 0.0% |
| Peru | 72 | 0.4% |
| Romania | 2 | 0.0% |
| South America | 161 | 0.8% |
| South Central Asia | 40 | 0.2% |
| Venezuela | 81 | 0.4% |
| Western Europe | 46 | 0.2% | View All 27 Rows |
Sex and Age in Hermiston
Sex and Age in Hermiston
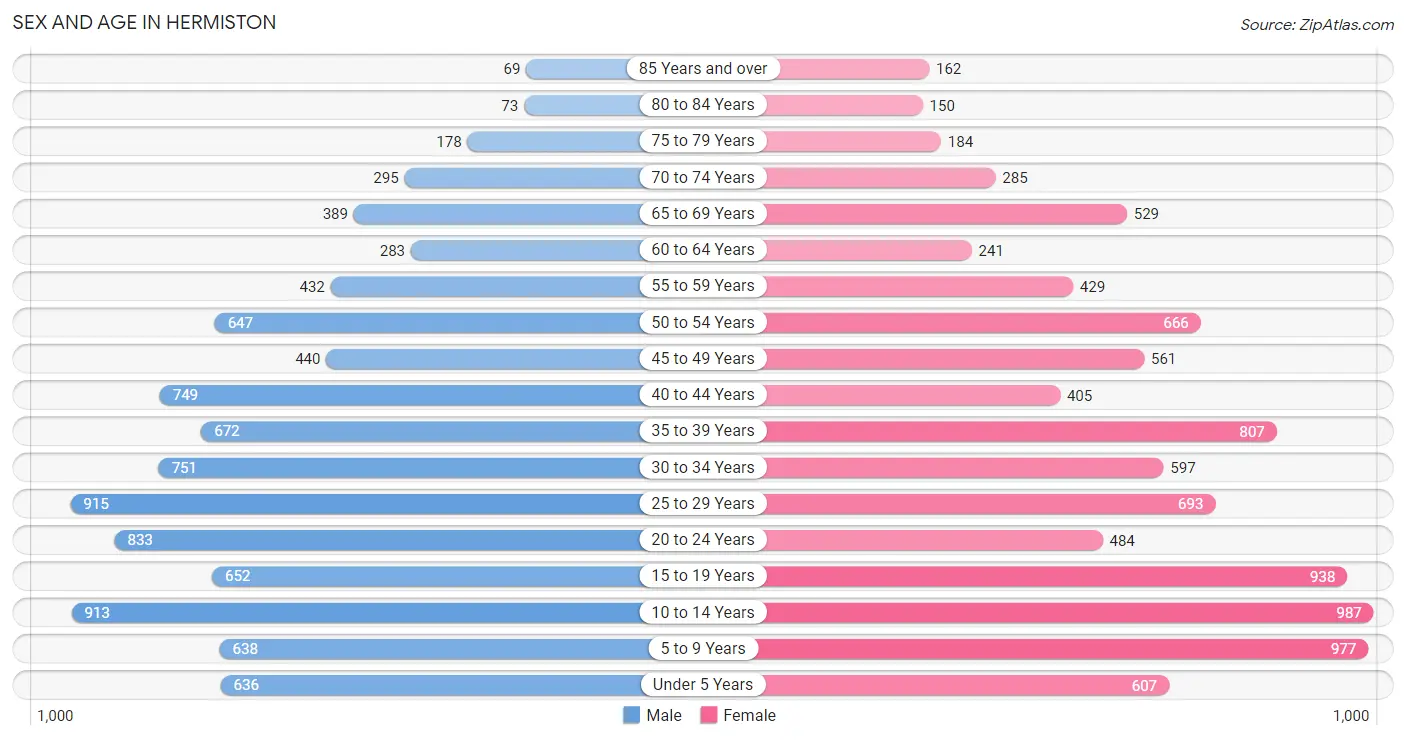
The most populous age groups in Hermiston are 25 to 29 Years (915 | 9.6%) for men and 10 to 14 Years (987 | 10.2%) for women.
| Age Bracket | Male | Female |
| Under 5 Years | 636 (6.7%) | 607 (6.3%) |
| 5 to 9 Years | 638 (6.7%) | 977 (10.1%) |
| 10 to 14 Years | 913 (9.6%) | 987 (10.2%) |
| 15 to 19 Years | 652 (6.8%) | 938 (9.7%) |
| 20 to 24 Years | 833 (8.7%) | 484 (5.0%) |
| 25 to 29 Years | 915 (9.6%) | 693 (7.1%) |
| 30 to 34 Years | 751 (7.9%) | 597 (6.1%) |
| 35 to 39 Years | 672 (7.0%) | 807 (8.3%) |
| 40 to 44 Years | 749 (7.8%) | 405 (4.2%) |
| 45 to 49 Years | 440 (4.6%) | 561 (5.8%) |
| 50 to 54 Years | 647 (6.8%) | 666 (6.9%) |
| 55 to 59 Years | 432 (4.5%) | 429 (4.4%) |
| 60 to 64 Years | 283 (3.0%) | 241 (2.5%) |
| 65 to 69 Years | 389 (4.1%) | 529 (5.4%) |
| 70 to 74 Years | 295 (3.1%) | 285 (2.9%) |
| 75 to 79 Years | 178 (1.9%) | 184 (1.9%) |
| 80 to 84 Years | 73 (0.8%) | 150 (1.5%) |
| 85 Years and over | 69 (0.7%) | 162 (1.7%) |
| Total | 9,565 (100.0%) | 9,702 (100.0%) |
Families and Households in Hermiston
Median Family Size in Hermiston
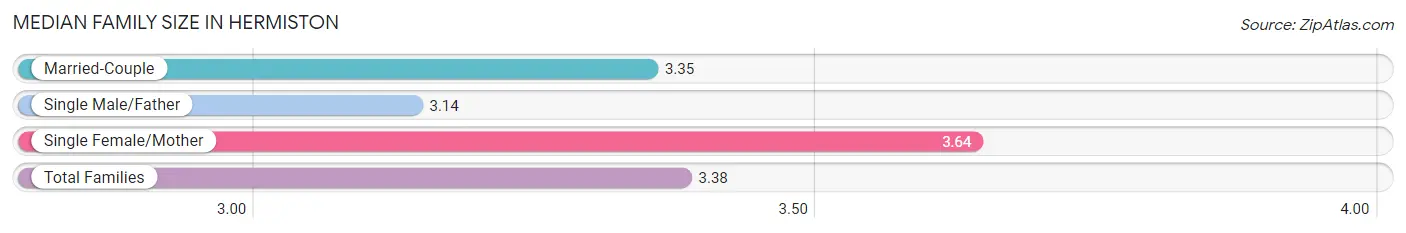
The median family size in Hermiston is 3.38 persons per family, with single female/mother families (940 | 20.7%) accounting for the largest median family size of 3.64 persons per family. On the other hand, single male/father families (592 | 13.0%) represent the smallest median family size with 3.14 persons per family.
| Family Type | # Families | Family Size |
| Married-Couple | 3,010 (66.3%) | 3.35 |
| Single Male/Father | 592 (13.0%) | 3.14 |
| Single Female/Mother | 940 (20.7%) | 3.64 |
| Total Families | 4,542 (100.0%) | 3.38 |
Median Household Size in Hermiston
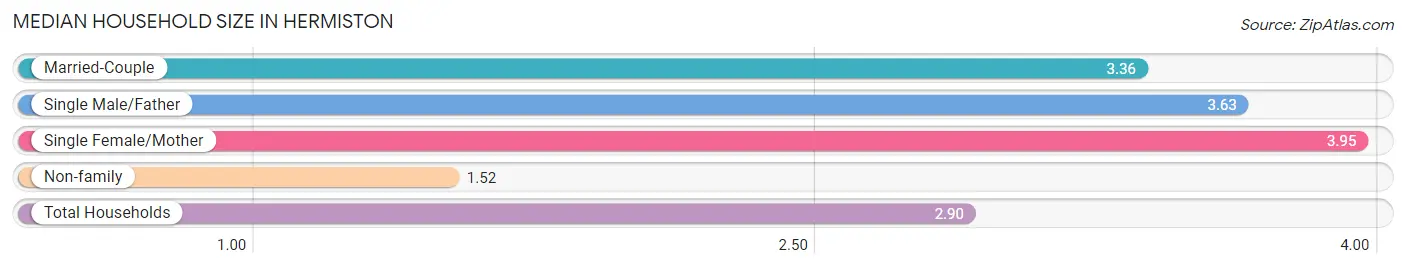
The median household size in Hermiston is 2.90 persons per household, with single female/mother households (940 | 14.3%) accounting for the largest median household size of 3.95 persons per household. non-family households (2,009 | 30.7%) represent the smallest median household size with 1.52 persons per household.
| Household Type | # Households | Household Size |
| Married-Couple | 3,010 (46.0%) | 3.36 |
| Single Male/Father | 592 (9.0%) | 3.63 |
| Single Female/Mother | 940 (14.3%) | 3.95 |
| Non-family | 2,009 (30.7%) | 1.52 |
| Total Households | 6,551 (100.0%) | 2.90 |
Household Size by Marriage Status in Hermiston
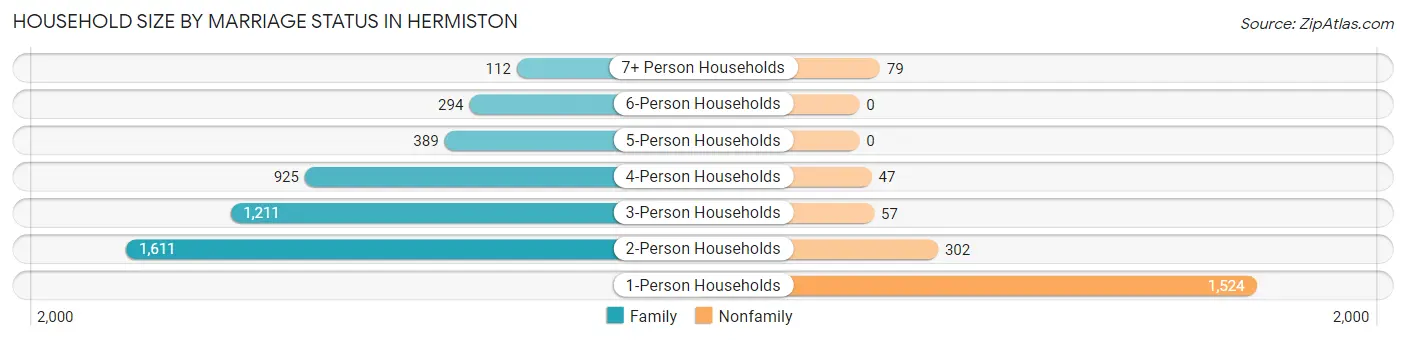
Out of a total of 6,551 households in Hermiston, 4,542 (69.3%) are family households, while 2,009 (30.7%) are nonfamily households. The most numerous type of family households are 2-person households, comprising 1,611, and the most common type of nonfamily households are 1-person households, comprising 1,524.
| Household Size | Family Households | Nonfamily Households |
| 1-Person Households | - | 1,524 (23.3%) |
| 2-Person Households | 1,611 (24.6%) | 302 (4.6%) |
| 3-Person Households | 1,211 (18.5%) | 57 (0.9%) |
| 4-Person Households | 925 (14.1%) | 47 (0.7%) |
| 5-Person Households | 389 (5.9%) | 0 (0.0%) |
| 6-Person Households | 294 (4.5%) | 0 (0.0%) |
| 7+ Person Households | 112 (1.7%) | 79 (1.2%) |
| Total | 4,542 (69.3%) | 2,009 (30.7%) |
Female Fertility in Hermiston
Fertility by Age in Hermiston
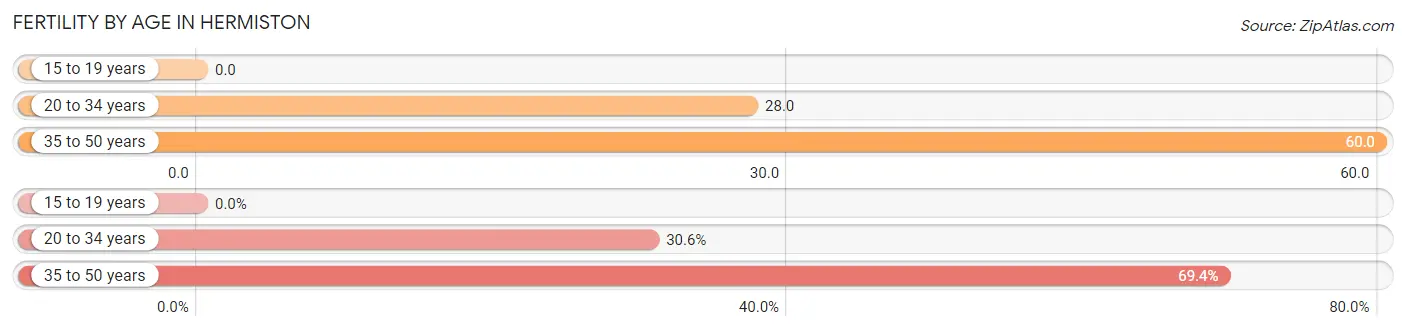
Average fertility rate in Hermiston is 35.0 births per 1,000 women. Women in the age bracket of 35 to 50 years have the highest fertility rate with 60.0 births per 1,000 women. Women in the age bracket of 35 to 50 years acount for 69.4% of all women with births.
| Age Bracket | Women with Births | Births / 1,000 Women |
| 15 to 19 years | 0 (0.0%) | 0.0 |
| 20 to 34 years | 49 (30.6%) | 28.0 |
| 35 to 50 years | 111 (69.4%) | 60.0 |
| Total | 160 (100.0%) | 35.0 |
Fertility by Age by Marriage Status in Hermiston
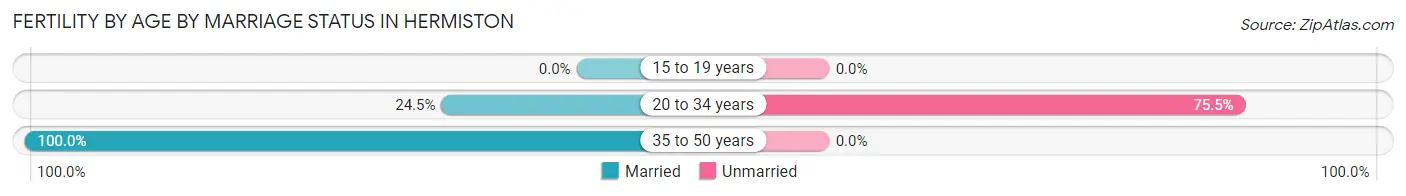
76.9% of women with births (160) in Hermiston are married. The highest percentage of unmarried women with births falls into 20 to 34 years age bracket with 75.5% of them unmarried at the time of birth, while the lowest percentage of unmarried women with births belong to 35 to 50 years age bracket with 0.0% of them unmarried.
| Age Bracket | Married | Unmarried |
| 15 to 19 years | 0 (0.0%) | 0 (0.0%) |
| 20 to 34 years | 12 (24.5%) | 37 (75.5%) |
| 35 to 50 years | 111 (100.0%) | 0 (0.0%) |
| Total | 123 (76.9%) | 37 (23.1%) |
Fertility by Education in Hermiston
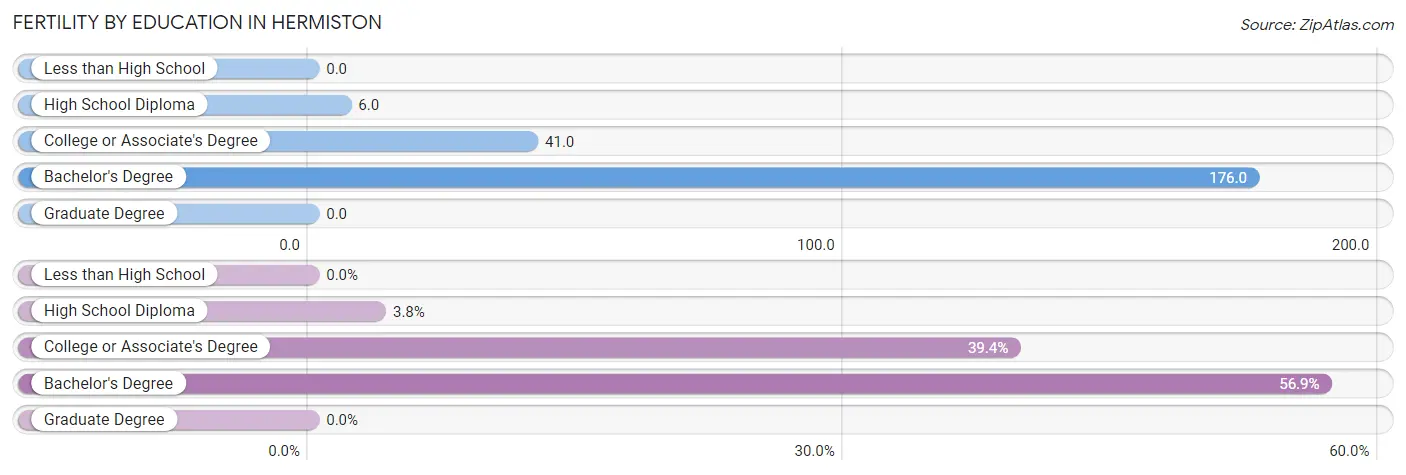
| Educational Attainment | Women with Births | Births / 1,000 Women |
| Less than High School | 0 (0.0%) | 0.0 |
| High School Diploma | 6 (3.7%) | 6.0 |
| College or Associate's Degree | 63 (39.4%) | 41.0 |
| Bachelor's Degree | 91 (56.9%) | 176.0 |
| Graduate Degree | 0 (0.0%) | 0.0 |
| Total | 160 (100.0%) | 35.0 |
Fertility by Education by Marriage Status in Hermiston
23.1% of women with births in Hermiston are unmarried. Women with the educational attainment of bachelor's degree are most likely to be married with 100.0% of them married at childbirth, while women with the educational attainment of high school diploma are least likely to be married with 100.0% of them unmarried at childbirth.
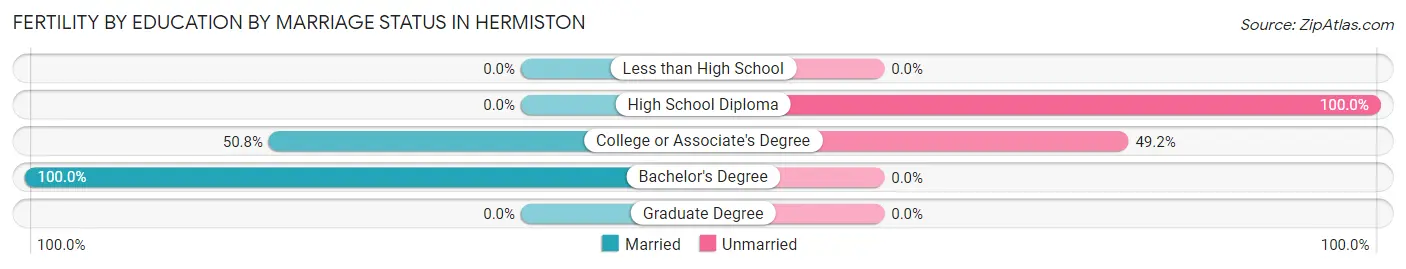
| Educational Attainment | Married | Unmarried |
| Less than High School | 0 (0.0%) | 0 (0.0%) |
| High School Diploma | 0 (0.0%) | 6 (100.0%) |
| College or Associate's Degree | 32 (50.8%) | 31 (49.2%) |
| Bachelor's Degree | 91 (100.0%) | 0 (0.0%) |
| Graduate Degree | 0 (0.0%) | 0 (0.0%) |
| Total | 123 (76.9%) | 37 (23.1%) |
Employment Characteristics in Hermiston
Employment by Class of Employer in Hermiston
Among the 9,188 employed individuals in Hermiston, private company employees (7,048 | 76.7%), local government employees (654 | 7.1%), and not-for-profit organizations (510 | 5.6%) make up the most common classes of employment.
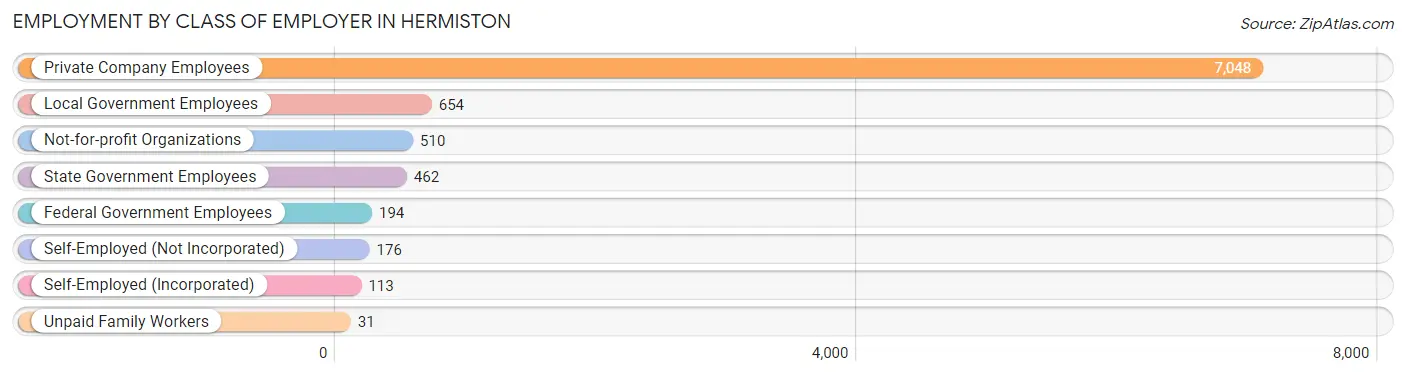
| Employer Class | # Employees | % Employees |
| Private Company Employees | 7,048 | 76.7% |
| Self-Employed (Incorporated) | 113 | 1.2% |
| Self-Employed (Not Incorporated) | 176 | 1.9% |
| Not-for-profit Organizations | 510 | 5.6% |
| Local Government Employees | 654 | 7.1% |
| State Government Employees | 462 | 5.0% |
| Federal Government Employees | 194 | 2.1% |
| Unpaid Family Workers | 31 | 0.3% |
| Total | 9,188 | 100.0% |
Employment Status by Age in Hermiston
According to the labor force statistics for Hermiston, out of the total population over 16 years of age (14,175), 70.7% or 10,022 individuals are in the labor force, with 7.4% or 742 of them unemployed. The age group with the highest labor force participation rate is 35 to 44 years, with 91.0% or 2,396 individuals in the labor force. Within the labor force, the 16 to 19 years age range has the highest percentage of unemployed individuals, with 21.6% or 186 of them being unemployed.
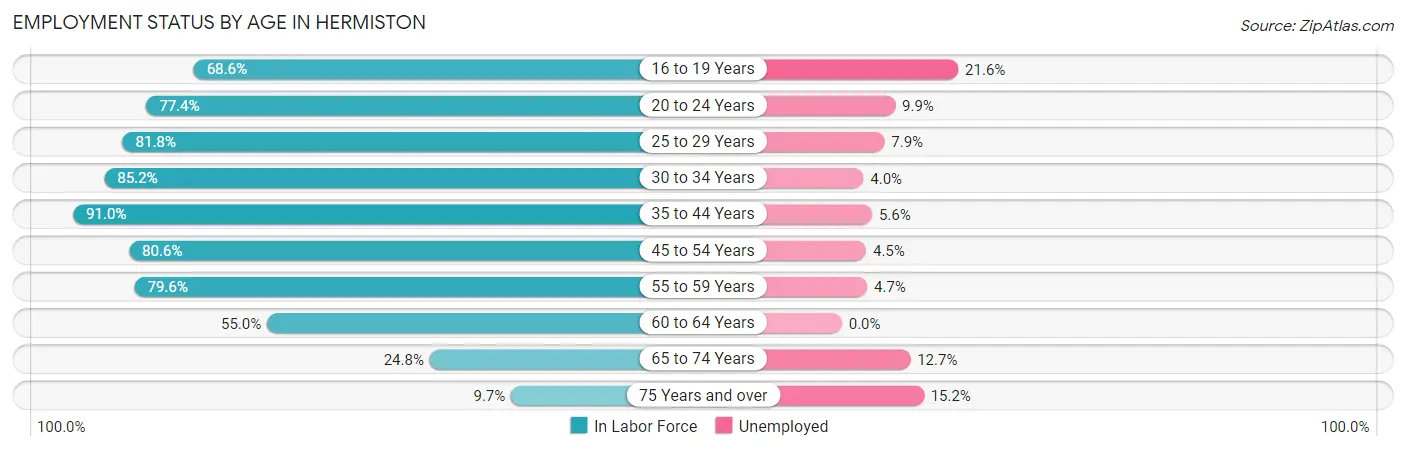
| Age Bracket | In Labor Force | Unemployed |
| 16 to 19 Years | 862 (68.6%) | 186 (21.6%) |
| 20 to 24 Years | 1,019 (77.4%) | 101 (9.9%) |
| 25 to 29 Years | 1,315 (81.8%) | 104 (7.9%) |
| 30 to 34 Years | 1,148 (85.2%) | 46 (4.0%) |
| 35 to 44 Years | 2,396 (91.0%) | 134 (5.6%) |
| 45 to 54 Years | 1,865 (80.6%) | 84 (4.5%) |
| 55 to 59 Years | 685 (79.6%) | 32 (4.7%) |
| 60 to 64 Years | 288 (55.0%) | 0 (0.0%) |
| 65 to 74 Years | 372 (24.8%) | 47 (12.7%) |
| 75 Years and over | 79 (9.7%) | 12 (15.2%) |
| Total | 10,022 (70.7%) | 742 (7.4%) |
Employment Status by Educational Attainment in Hermiston
According to labor force statistics for Hermiston, 82.9% of individuals (7,700) out of the total population between 25 and 64 years of age (9,288) are in the labor force, with 5.2% or 400 of them being unemployed. The group with the highest labor force participation rate are those with the educational attainment of bachelor's degree or higher, with 86.9% or 1,438 individuals in the labor force. Within the labor force, individuals with college / associate degree education have the highest percentage of unemployment, with 10.4% or 253 of them being unemployed.
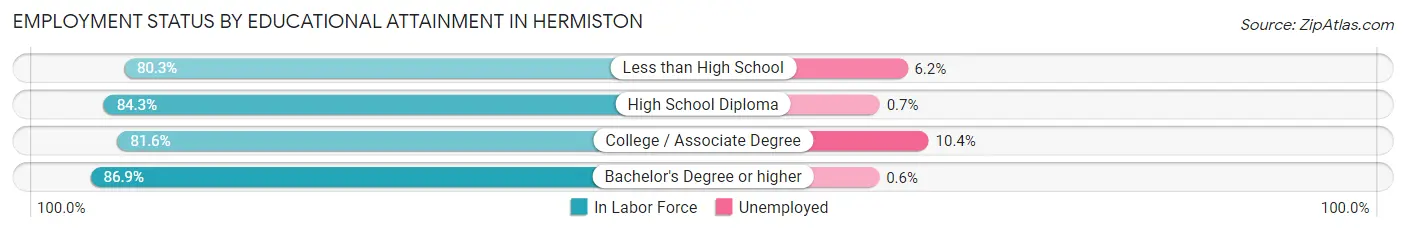
| Educational Attainment | In Labor Force | Unemployed |
| Less than High School | 1,970 (80.3%) | 152 (6.2%) |
| High School Diploma | 1,851 (84.3%) | 15 (0.7%) |
| College / Associate Degree | 2,435 (81.6%) | 310 (10.4%) |
| Bachelor's Degree or higher | 1,438 (86.9%) | 10 (0.6%) |
| Total | 7,700 (82.9%) | 483 (5.2%) |
Employment Occupations by Sex in Hermiston
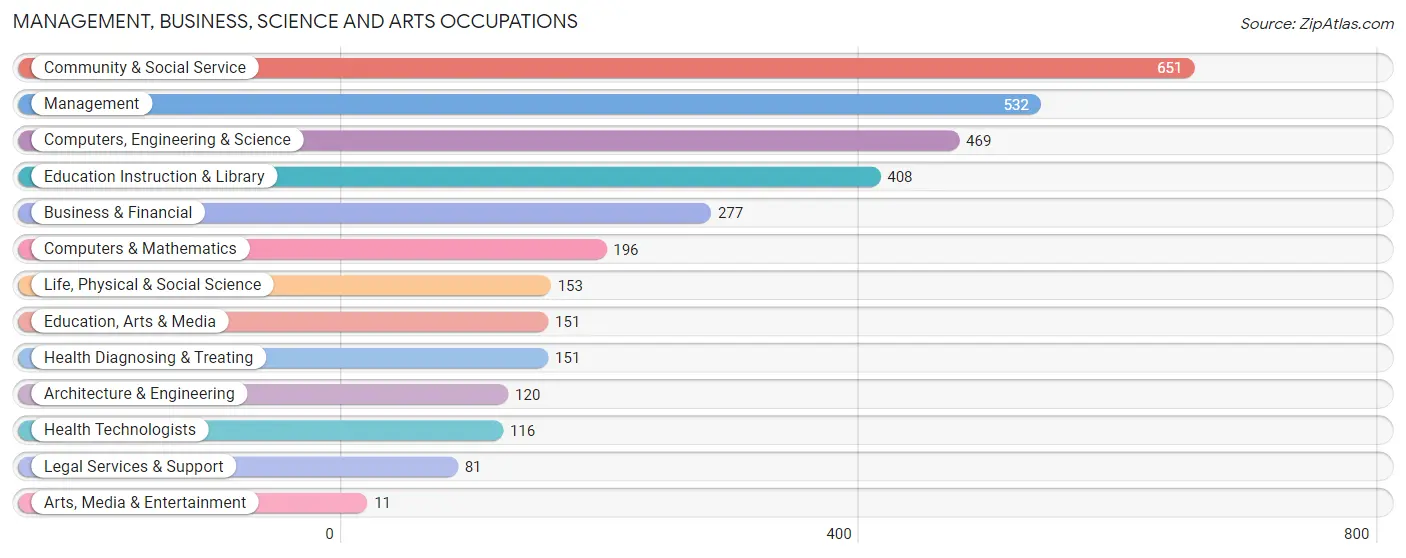
Management, Business, Science and Arts Occupations
The most common Management, Business, Science and Arts occupations in Hermiston are Community & Social Service (651 | 7.0%), Management (532 | 5.7%), Computers, Engineering & Science (469 | 5.1%), Education Instruction & Library (408 | 4.4%), and Business & Financial (277 | 3.0%).
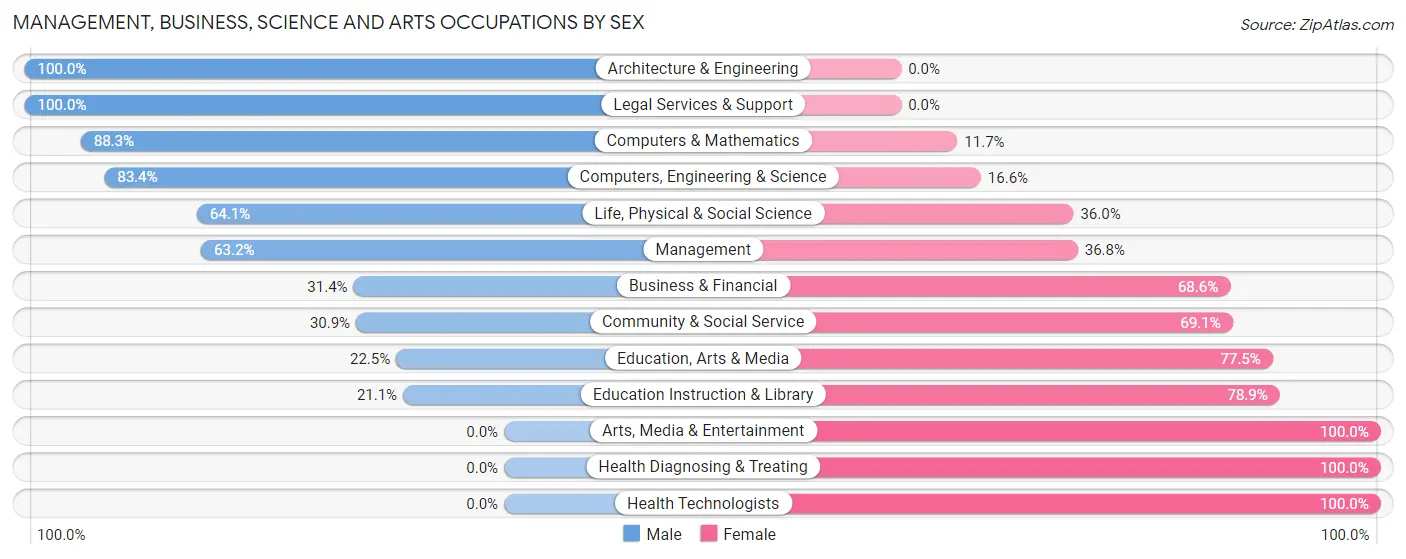
Management, Business, Science and Arts Occupations by Sex
Within the Management, Business, Science and Arts occupations in Hermiston, the most male-oriented occupations are Architecture & Engineering (100.0%), Legal Services & Support (100.0%), and Computers & Mathematics (88.3%), while the most female-oriented occupations are Arts, Media & Entertainment (100.0%), Health Diagnosing & Treating (100.0%), and Health Technologists (100.0%).
| Occupation | Male | Female |
| Management | 336 (63.2%) | 196 (36.8%) |
| Business & Financial | 87 (31.4%) | 190 (68.6%) |
| Computers, Engineering & Science | 391 (83.4%) | 78 (16.6%) |
| Computers & Mathematics | 173 (88.3%) | 23 (11.7%) |
| Architecture & Engineering | 120 (100.0%) | 0 (0.0%) |
| Life, Physical & Social Science | 98 (64.0%) | 55 (35.9%) |
| Community & Social Service | 201 (30.9%) | 450 (69.1%) |
| Education, Arts & Media | 34 (22.5%) | 117 (77.5%) |
| Legal Services & Support | 81 (100.0%) | 0 (0.0%) |
| Education Instruction & Library | 86 (21.1%) | 322 (78.9%) |
| Arts, Media & Entertainment | 0 (0.0%) | 11 (100.0%) |
| Health Diagnosing & Treating | 0 (0.0%) | 151 (100.0%) |
| Health Technologists | 0 (0.0%) | 116 (100.0%) |
| Total (Category) | 1,015 (48.8%) | 1,065 (51.2%) |
| Total (Overall) | 5,202 (56.0%) | 4,081 (44.0%) |
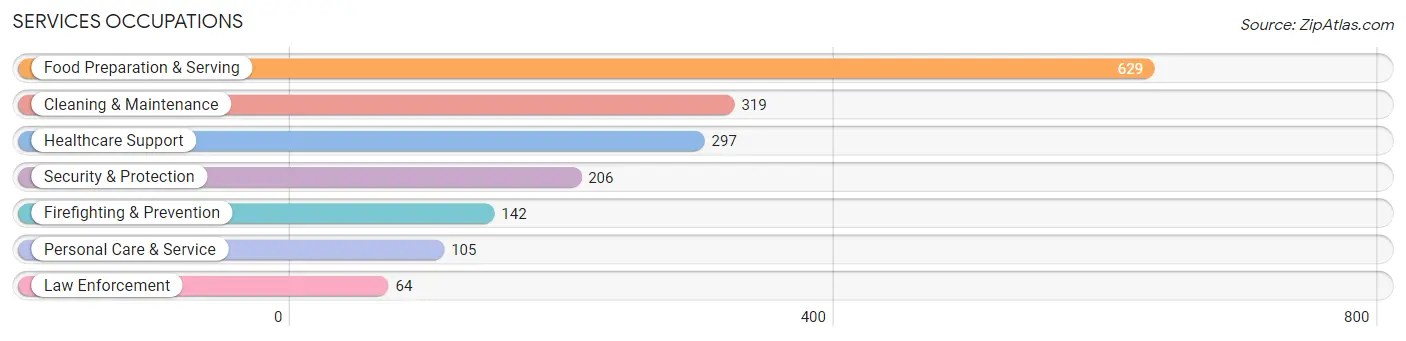
Services Occupations
The most common Services occupations in Hermiston are Food Preparation & Serving (629 | 6.8%), Cleaning & Maintenance (319 | 3.4%), Healthcare Support (297 | 3.2%), Security & Protection (206 | 2.2%), and Firefighting & Prevention (142 | 1.5%).
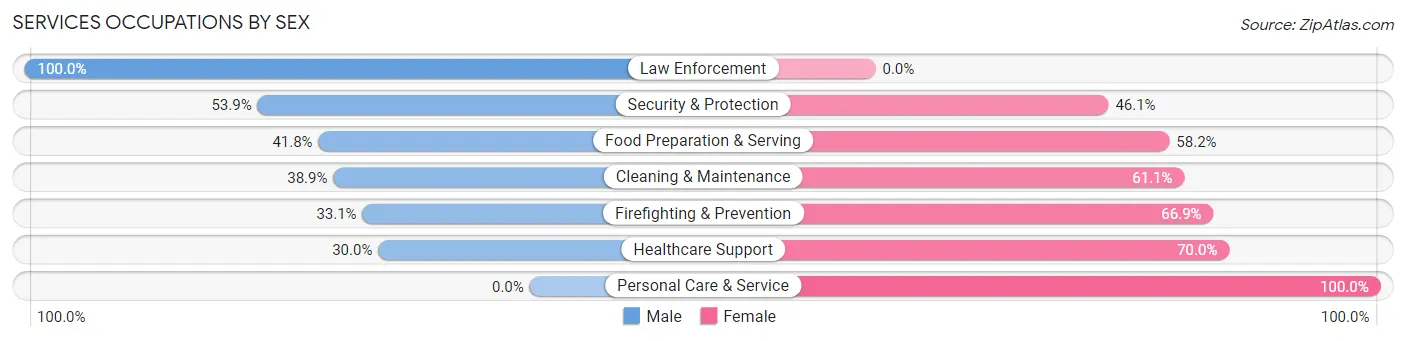
Services Occupations by Sex
Within the Services occupations in Hermiston, the most male-oriented occupations are Law Enforcement (100.0%), Security & Protection (53.9%), and Food Preparation & Serving (41.8%), while the most female-oriented occupations are Personal Care & Service (100.0%), Healthcare Support (70.0%), and Firefighting & Prevention (66.9%).
| Occupation | Male | Female |
| Healthcare Support | 89 (30.0%) | 208 (70.0%) |
| Security & Protection | 111 (53.9%) | 95 (46.1%) |
| Firefighting & Prevention | 47 (33.1%) | 95 (66.9%) |
| Law Enforcement | 64 (100.0%) | 0 (0.0%) |
| Food Preparation & Serving | 263 (41.8%) | 366 (58.2%) |
| Cleaning & Maintenance | 124 (38.9%) | 195 (61.1%) |
| Personal Care & Service | 0 (0.0%) | 105 (100.0%) |
| Total (Category) | 587 (37.7%) | 969 (62.3%) |
| Total (Overall) | 5,202 (56.0%) | 4,081 (44.0%) |
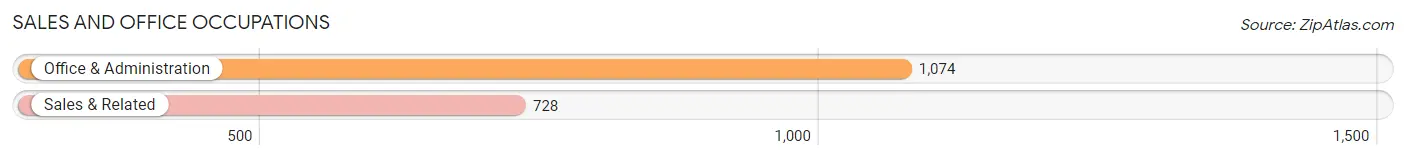
Sales and Office Occupations
The most common Sales and Office occupations in Hermiston are Office & Administration (1,074 | 11.6%), and Sales & Related (728 | 7.8%).
Sales and Office Occupations by Sex
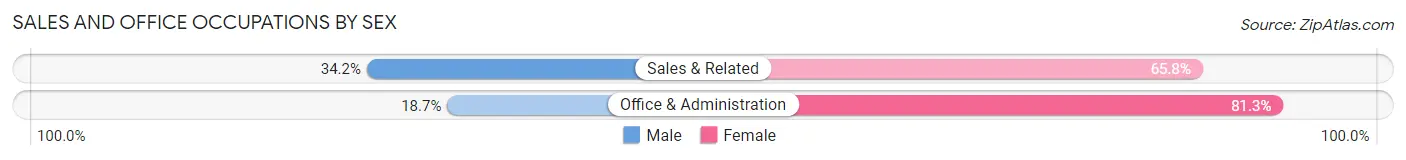
| Occupation | Male | Female |
| Sales & Related | 249 (34.2%) | 479 (65.8%) |
| Office & Administration | 201 (18.7%) | 873 (81.3%) |
| Total (Category) | 450 (25.0%) | 1,352 (75.0%) |
| Total (Overall) | 5,202 (56.0%) | 4,081 (44.0%) |
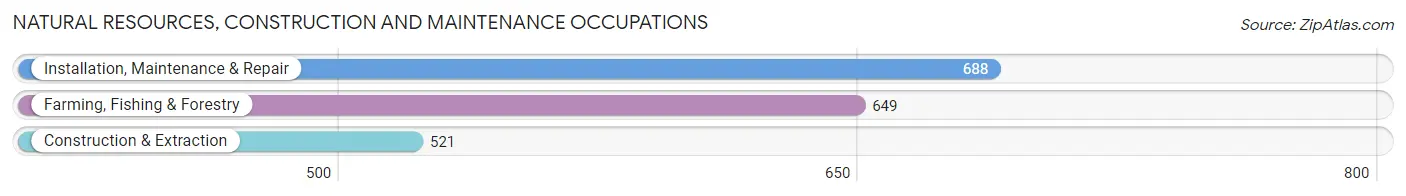
Natural Resources, Construction and Maintenance Occupations
The most common Natural Resources, Construction and Maintenance occupations in Hermiston are Installation, Maintenance & Repair (688 | 7.4%), Farming, Fishing & Forestry (649 | 7.0%), and Construction & Extraction (521 | 5.6%).
Natural Resources, Construction and Maintenance Occupations by Sex
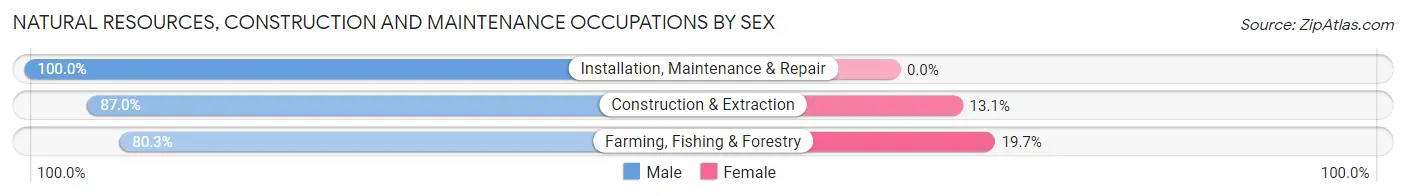
| Occupation | Male | Female |
| Farming, Fishing & Forestry | 521 (80.3%) | 128 (19.7%) |
| Construction & Extraction | 453 (87.0%) | 68 (13.1%) |
| Installation, Maintenance & Repair | 688 (100.0%) | 0 (0.0%) |
| Total (Category) | 1,662 (89.4%) | 196 (10.5%) |
| Total (Overall) | 5,202 (56.0%) | 4,081 (44.0%) |
Production, Transportation and Moving Occupations
The most common Production, Transportation and Moving occupations in Hermiston are Transportation (820 | 8.8%), Material Moving (676 | 7.3%), and Production (491 | 5.3%).
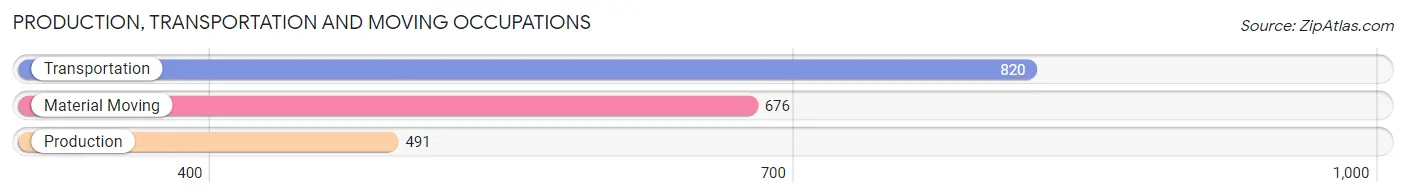
Production, Transportation and Moving Occupations by Sex
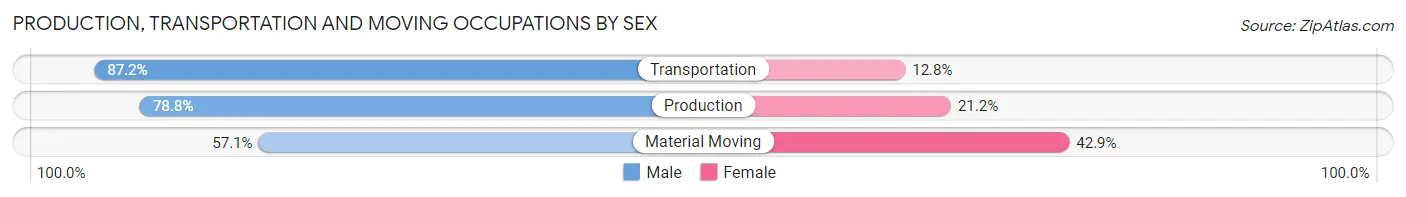
| Occupation | Male | Female |
| Production | 387 (78.8%) | 104 (21.2%) |
| Transportation | 715 (87.2%) | 105 (12.8%) |
| Material Moving | 386 (57.1%) | 290 (42.9%) |
| Total (Category) | 1,488 (74.9%) | 499 (25.1%) |
| Total (Overall) | 5,202 (56.0%) | 4,081 (44.0%) |
Employment Industries by Sex in Hermiston
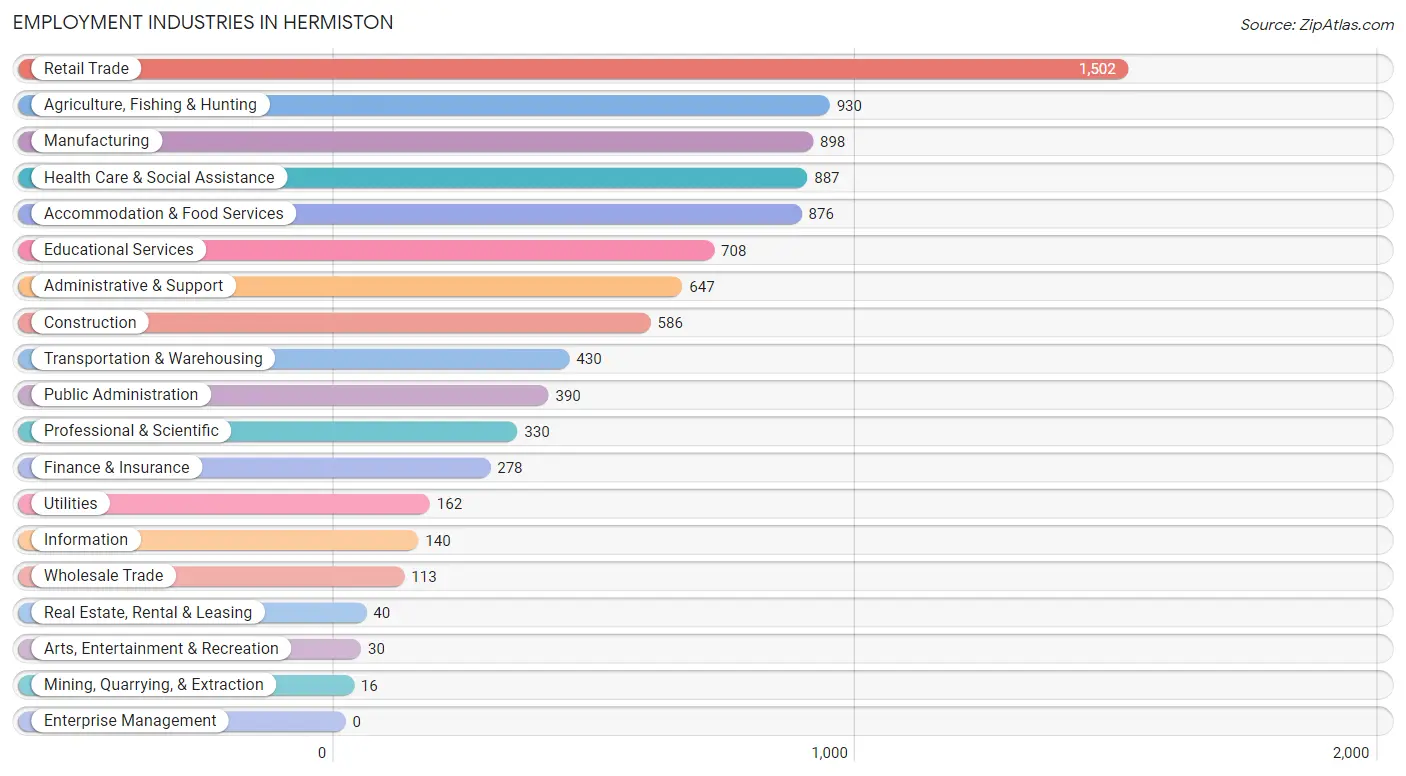
Employment Industries in Hermiston
The major employment industries in Hermiston include Retail Trade (1,502 | 16.2%), Agriculture, Fishing & Hunting (930 | 10.0%), Manufacturing (898 | 9.7%), Health Care & Social Assistance (887 | 9.6%), and Accommodation & Food Services (876 | 9.4%).
Employment Industries by Sex in Hermiston
The Hermiston industries that see more men than women are Mining, Quarrying, & Extraction (100.0%), Wholesale Trade (100.0%), and Information (91.4%), whereas the industries that tend to have a higher number of women are Arts, Entertainment & Recreation (100.0%), Health Care & Social Assistance (85.3%), and Finance & Insurance (74.1%).
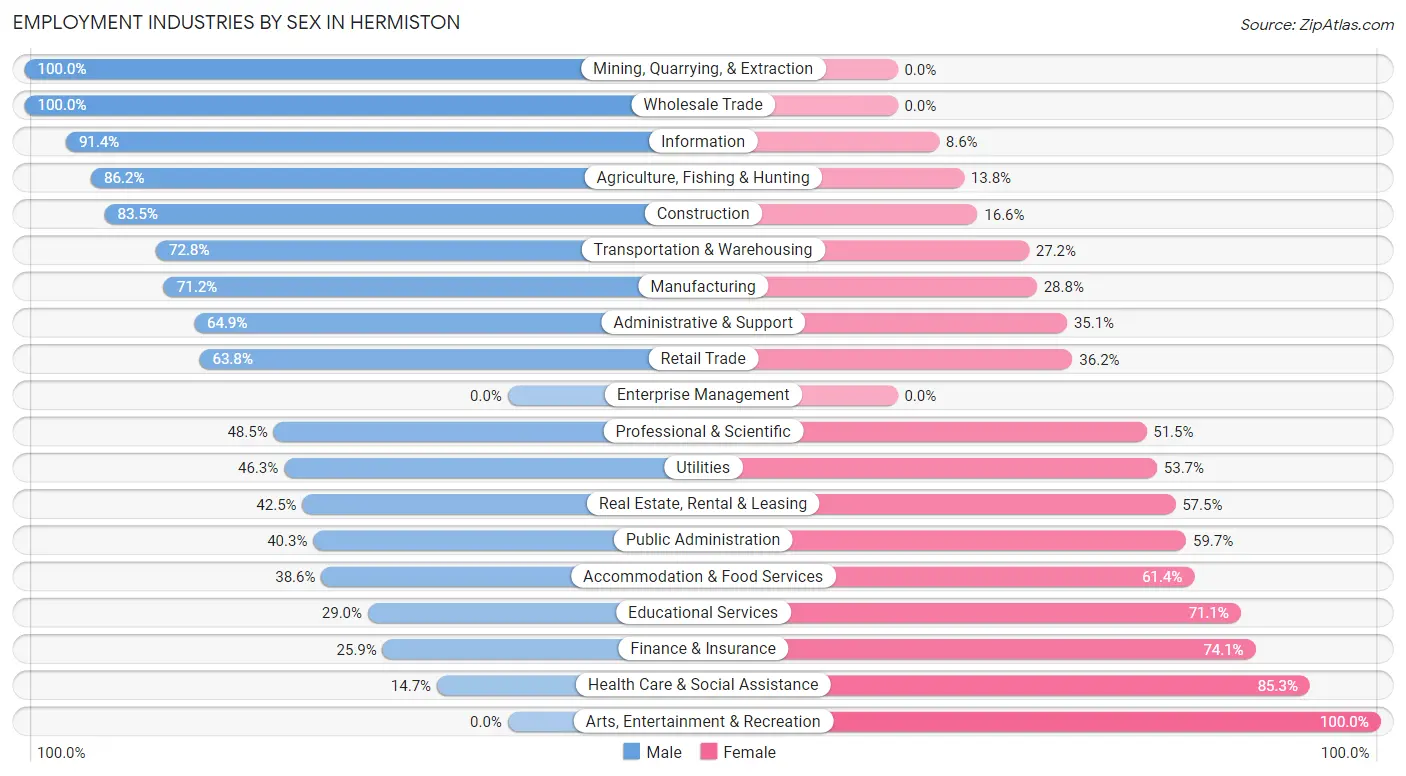
| Industry | Male | Female |
| Agriculture, Fishing & Hunting | 802 (86.2%) | 128 (13.8%) |
| Mining, Quarrying, & Extraction | 16 (100.0%) | 0 (0.0%) |
| Construction | 489 (83.5%) | 97 (16.6%) |
| Manufacturing | 639 (71.2%) | 259 (28.8%) |
| Wholesale Trade | 113 (100.0%) | 0 (0.0%) |
| Retail Trade | 958 (63.8%) | 544 (36.2%) |
| Transportation & Warehousing | 313 (72.8%) | 117 (27.2%) |
| Utilities | 75 (46.3%) | 87 (53.7%) |
| Information | 128 (91.4%) | 12 (8.6%) |
| Finance & Insurance | 72 (25.9%) | 206 (74.1%) |
| Real Estate, Rental & Leasing | 17 (42.5%) | 23 (57.5%) |
| Professional & Scientific | 160 (48.5%) | 170 (51.5%) |
| Enterprise Management | 0 (0.0%) | 0 (0.0%) |
| Administrative & Support | 420 (64.9%) | 227 (35.1%) |
| Educational Services | 205 (28.9%) | 503 (71.1%) |
| Health Care & Social Assistance | 130 (14.7%) | 757 (85.3%) |
| Arts, Entertainment & Recreation | 0 (0.0%) | 30 (100.0%) |
| Accommodation & Food Services | 338 (38.6%) | 538 (61.4%) |
| Public Administration | 157 (40.3%) | 233 (59.7%) |
| Total | 5,202 (56.0%) | 4,081 (44.0%) |
Education in Hermiston
School Enrollment in Hermiston
The most common levels of schooling among the 5,955 students in Hermiston are high school (1,574 | 26.4%), elementary school (1,453 | 24.4%), and middle school (1,135 | 19.1%).
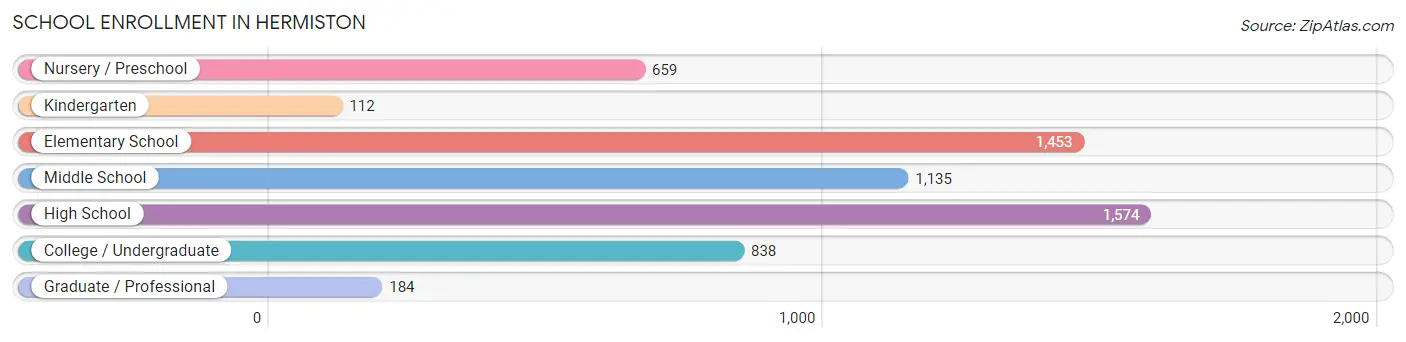
| School Level | # Students | % Students |
| Nursery / Preschool | 659 | 11.1% |
| Kindergarten | 112 | 1.9% |
| Elementary School | 1,453 | 24.4% |
| Middle School | 1,135 | 19.1% |
| High School | 1,574 | 26.4% |
| College / Undergraduate | 838 | 14.1% |
| Graduate / Professional | 184 | 3.1% |
| Total | 5,955 | 100.0% |
School Enrollment by Age by Funding Source in Hermiston
Out of a total of 5,955 students who are enrolled in schools in Hermiston, 453 (7.6%) attend a private institution, while the remaining 5,502 (92.4%) are enrolled in public schools. The age group of 35 years and over has the highest likelihood of being enrolled in private schools, with 131 (46.9% in the age bracket) enrolled. Conversely, the age group of 10 to 14 year olds has the lowest likelihood of being enrolled in a private school, with 1,816 (100.0% in the age bracket) attending a public institution.
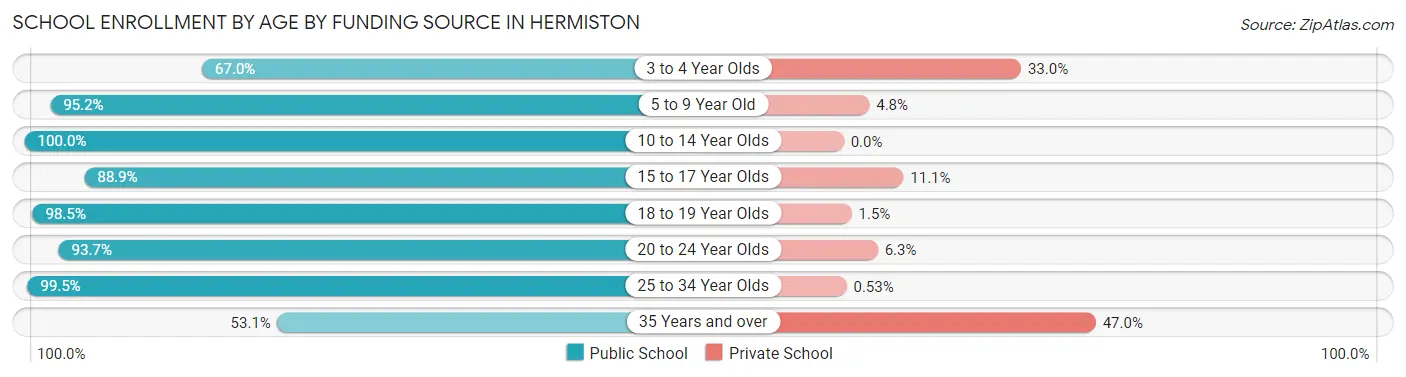
| Age Bracket | Public School | Private School |
| 3 to 4 Year Olds | 219 (67.0%) | 108 (33.0%) |
| 5 to 9 Year Old | 1,459 (95.2%) | 73 (4.8%) |
| 10 to 14 Year Olds | 1,816 (100.0%) | 0 (0.0%) |
| 15 to 17 Year Olds | 831 (88.9%) | 104 (11.1%) |
| 18 to 19 Year Olds | 399 (98.5%) | 6 (1.5%) |
| 20 to 24 Year Olds | 443 (93.7%) | 30 (6.3%) |
| 25 to 34 Year Olds | 187 (99.5%) | 1 (0.5%) |
| 35 Years and over | 148 (53.0%) | 131 (46.9%) |
| Total | 5,502 (92.4%) | 453 (7.6%) |
Educational Attainment by Field of Study in Hermiston
Education (308 | 14.9%), business (300 | 14.6%), social sciences (258 | 12.5%), bio, nature & agricultural (192 | 9.3%), and liberal arts & history (178 | 8.6%) are the most common fields of study among 2,061 individuals in Hermiston who have obtained a bachelor's degree or higher.
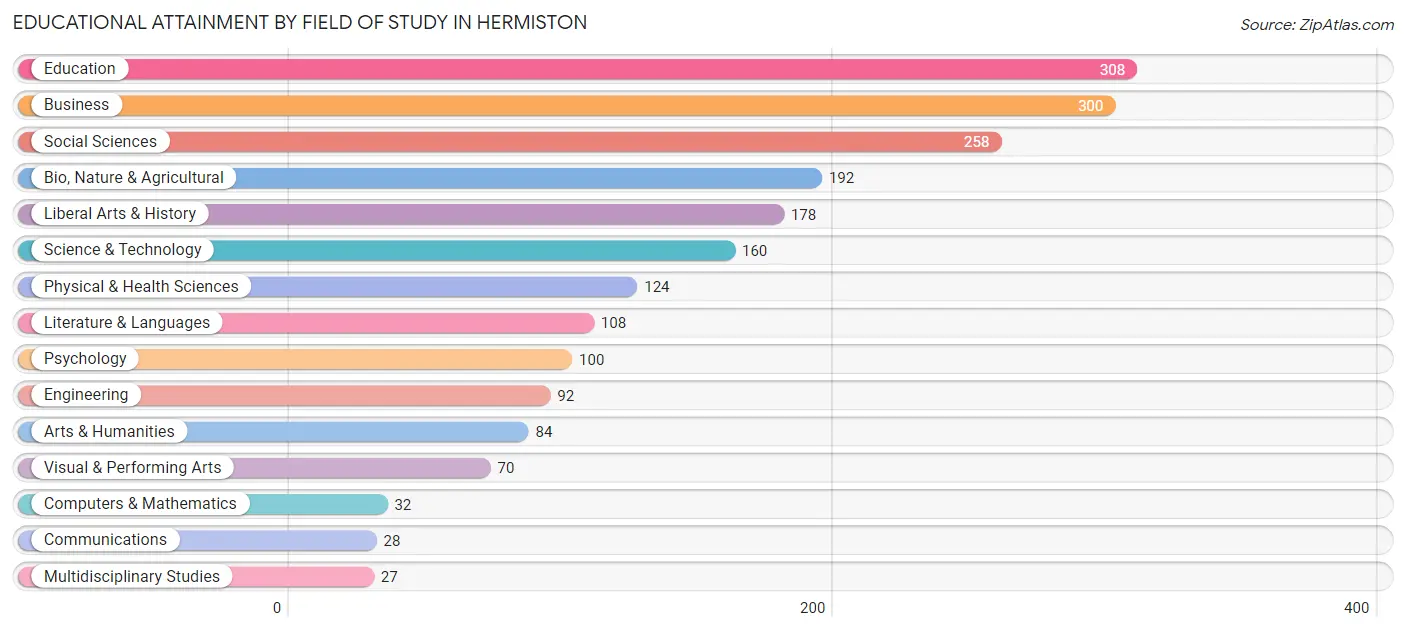
| Field of Study | # Graduates | % Graduates |
| Computers & Mathematics | 32 | 1.5% |
| Bio, Nature & Agricultural | 192 | 9.3% |
| Physical & Health Sciences | 124 | 6.0% |
| Psychology | 100 | 4.9% |
| Social Sciences | 258 | 12.5% |
| Engineering | 92 | 4.5% |
| Multidisciplinary Studies | 27 | 1.3% |
| Science & Technology | 160 | 7.8% |
| Business | 300 | 14.6% |
| Education | 308 | 14.9% |
| Literature & Languages | 108 | 5.2% |
| Liberal Arts & History | 178 | 8.6% |
| Visual & Performing Arts | 70 | 3.4% |
| Communications | 28 | 1.4% |
| Arts & Humanities | 84 | 4.1% |
| Total | 2,061 | 100.0% |
Transportation & Commute in Hermiston
Vehicle Availability by Sex in Hermiston
The most prevalent vehicle ownership categories in Hermiston are males with 2 vehicles (1,853, accounting for 35.8%) and females with 2 vehicles (1,900, making up 46.3%).
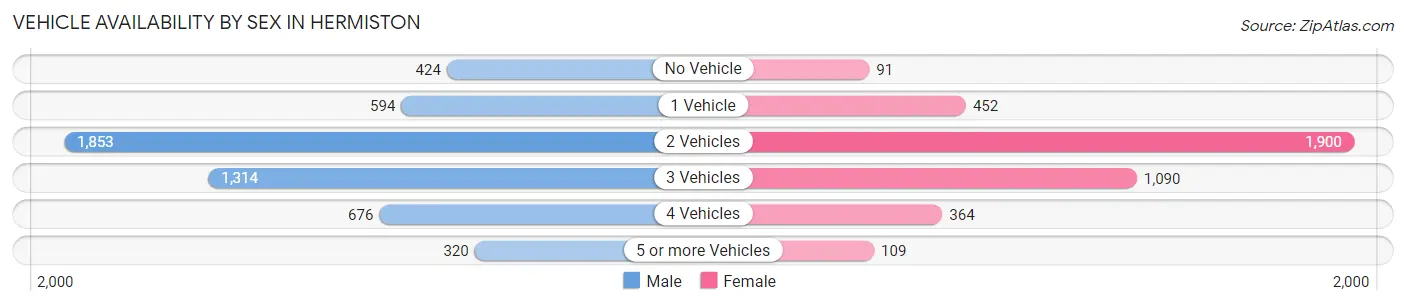
| Vehicles Available | Male | Female |
| No Vehicle | 424 (8.2%) | 91 (2.3%) |
| 1 Vehicle | 594 (11.5%) | 452 (11.3%) |
| 2 Vehicles | 1,853 (35.8%) | 1,900 (47.4%) |
| 3 Vehicles | 1,314 (25.4%) | 1,090 (27.2%) |
| 4 Vehicles | 676 (13.1%) | 364 (9.1%) |
| 5 or more Vehicles | 320 (6.2%) | 109 (2.7%) |
| Total | 5,181 (100.0%) | 4,006 (100.0%) |
Commute Time in Hermiston
The most frequently occuring commute durations in Hermiston are 10 to 14 minutes (2,062 commuters, 22.8%), 5 to 9 minutes (1,981 commuters, 21.9%), and 30 to 34 minutes (1,246 commuters, 13.8%).
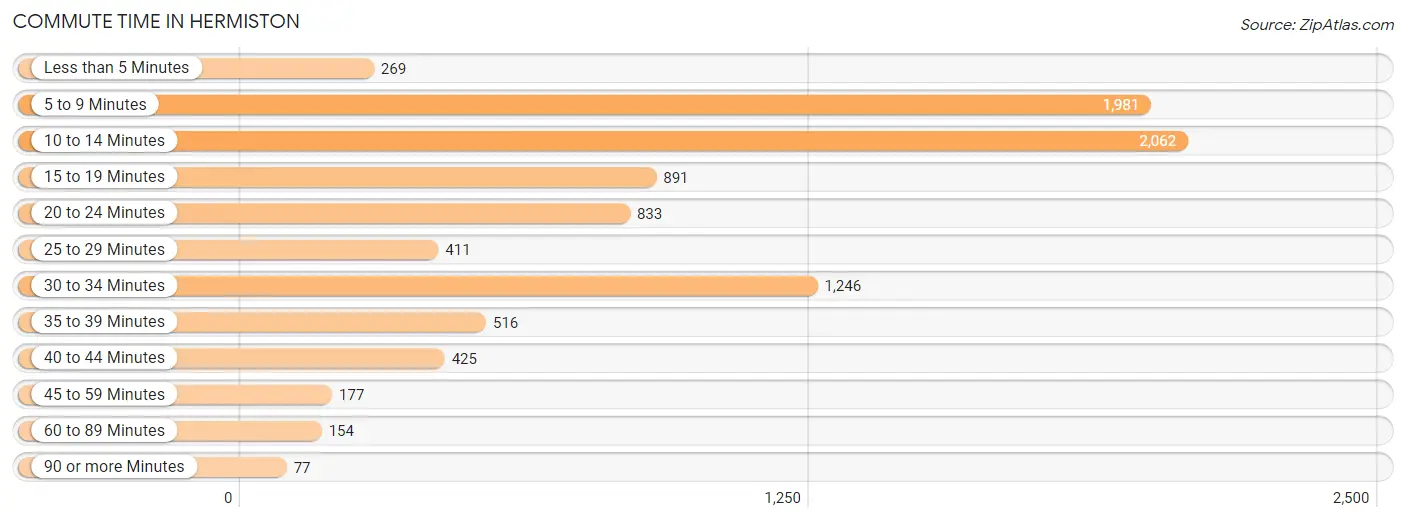
| Commute Time | # Commuters | % Commuters |
| Less than 5 Minutes | 269 | 3.0% |
| 5 to 9 Minutes | 1,981 | 21.9% |
| 10 to 14 Minutes | 2,062 | 22.8% |
| 15 to 19 Minutes | 891 | 9.9% |
| 20 to 24 Minutes | 833 | 9.2% |
| 25 to 29 Minutes | 411 | 4.5% |
| 30 to 34 Minutes | 1,246 | 13.8% |
| 35 to 39 Minutes | 516 | 5.7% |
| 40 to 44 Minutes | 425 | 4.7% |
| 45 to 59 Minutes | 177 | 2.0% |
| 60 to 89 Minutes | 154 | 1.7% |
| 90 or more Minutes | 77 | 0.9% |
Commute Time by Sex in Hermiston
The most common commute times in Hermiston are 10 to 14 minutes (1,011 commuters, 19.7%) for males and 5 to 9 minutes (1,333 commuters, 34.0%) for females.
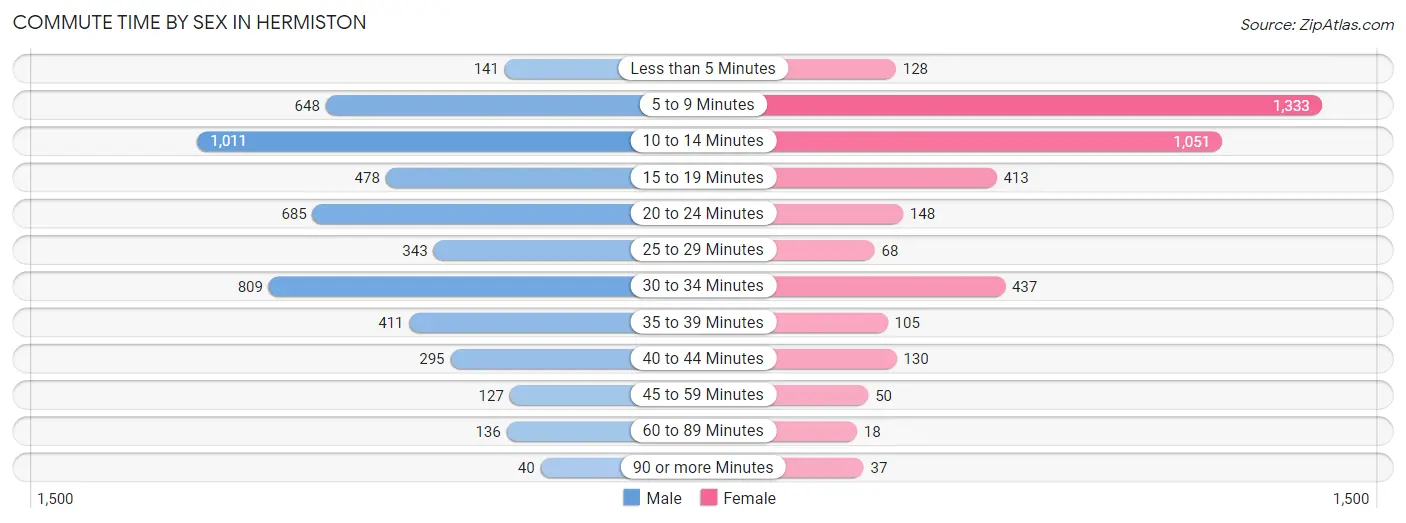
| Commute Time | Male | Female |
| Less than 5 Minutes | 141 (2.8%) | 128 (3.3%) |
| 5 to 9 Minutes | 648 (12.7%) | 1,333 (34.0%) |
| 10 to 14 Minutes | 1,011 (19.7%) | 1,051 (26.8%) |
| 15 to 19 Minutes | 478 (9.3%) | 413 (10.5%) |
| 20 to 24 Minutes | 685 (13.4%) | 148 (3.8%) |
| 25 to 29 Minutes | 343 (6.7%) | 68 (1.7%) |
| 30 to 34 Minutes | 809 (15.8%) | 437 (11.2%) |
| 35 to 39 Minutes | 411 (8.0%) | 105 (2.7%) |
| 40 to 44 Minutes | 295 (5.8%) | 130 (3.3%) |
| 45 to 59 Minutes | 127 (2.5%) | 50 (1.3%) |
| 60 to 89 Minutes | 136 (2.6%) | 18 (0.5%) |
| 90 or more Minutes | 40 (0.8%) | 37 (0.9%) |
Time of Departure to Work by Sex in Hermiston
The most frequent times of departure to work in Hermiston are 5:30 AM to 5:59 AM (903, 17.6%) for males and 4:00 PM to 11:59 PM (652, 16.6%) for females.
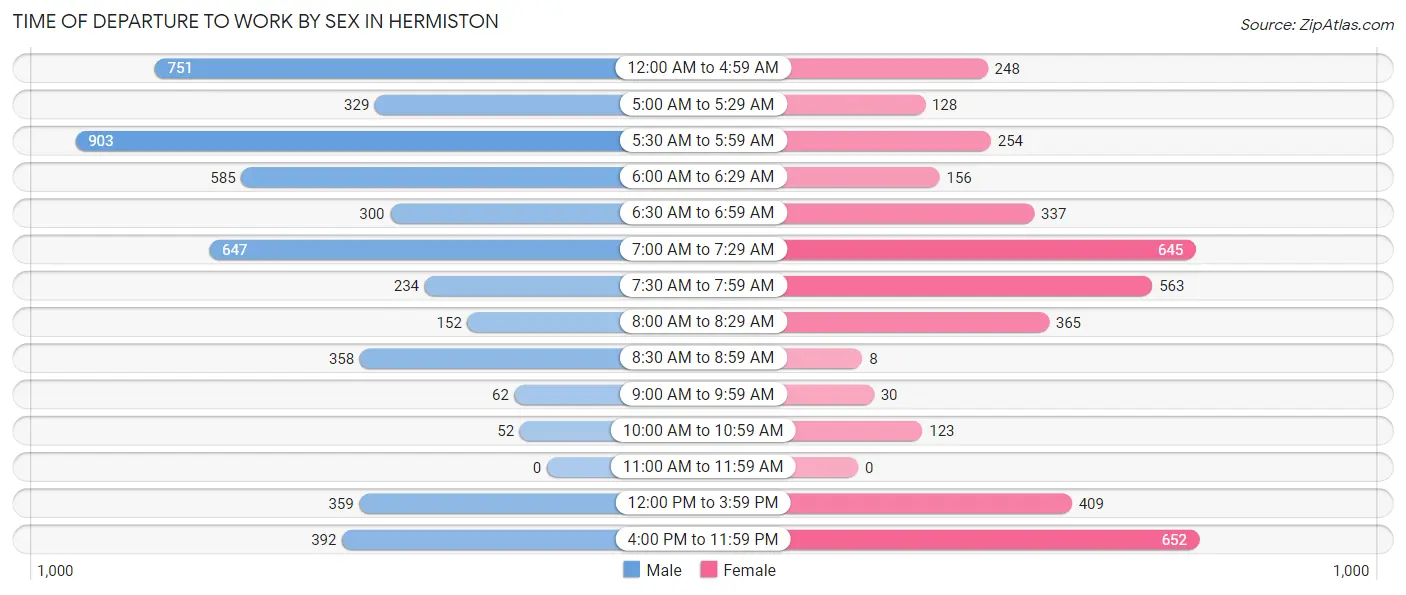
| Time of Departure | Male | Female |
| 12:00 AM to 4:59 AM | 751 (14.7%) | 248 (6.3%) |
| 5:00 AM to 5:29 AM | 329 (6.4%) | 128 (3.3%) |
| 5:30 AM to 5:59 AM | 903 (17.6%) | 254 (6.5%) |
| 6:00 AM to 6:29 AM | 585 (11.4%) | 156 (4.0%) |
| 6:30 AM to 6:59 AM | 300 (5.9%) | 337 (8.6%) |
| 7:00 AM to 7:29 AM | 647 (12.6%) | 645 (16.5%) |
| 7:30 AM to 7:59 AM | 234 (4.6%) | 563 (14.4%) |
| 8:00 AM to 8:29 AM | 152 (3.0%) | 365 (9.3%) |
| 8:30 AM to 8:59 AM | 358 (7.0%) | 8 (0.2%) |
| 9:00 AM to 9:59 AM | 62 (1.2%) | 30 (0.8%) |
| 10:00 AM to 10:59 AM | 52 (1.0%) | 123 (3.1%) |
| 11:00 AM to 11:59 AM | 0 (0.0%) | 0 (0.0%) |
| 12:00 PM to 3:59 PM | 359 (7.0%) | 409 (10.4%) |
| 4:00 PM to 11:59 PM | 392 (7.6%) | 652 (16.6%) |
| Total | 5,124 (100.0%) | 3,918 (100.0%) |
Housing Occupancy in Hermiston
Occupancy by Ownership in Hermiston
Of the total 6,551 dwellings in Hermiston, owner-occupied units account for 4,011 (61.2%), while renter-occupied units make up 2,540 (38.8%).
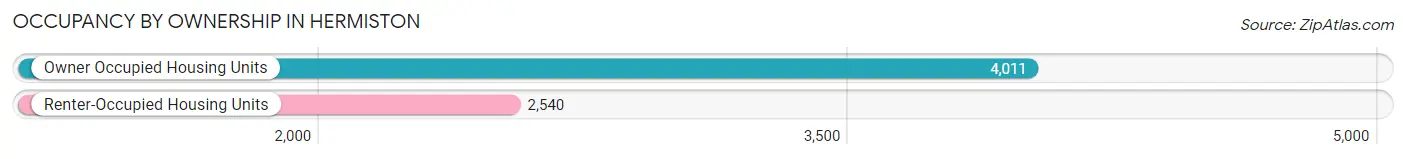
| Occupancy | # Housing Units | % Housing Units |
| Owner Occupied Housing Units | 4,011 | 61.2% |
| Renter-Occupied Housing Units | 2,540 | 38.8% |
| Total Occupied Housing Units | 6,551 | 100.0% |
Occupancy by Household Size in Hermiston
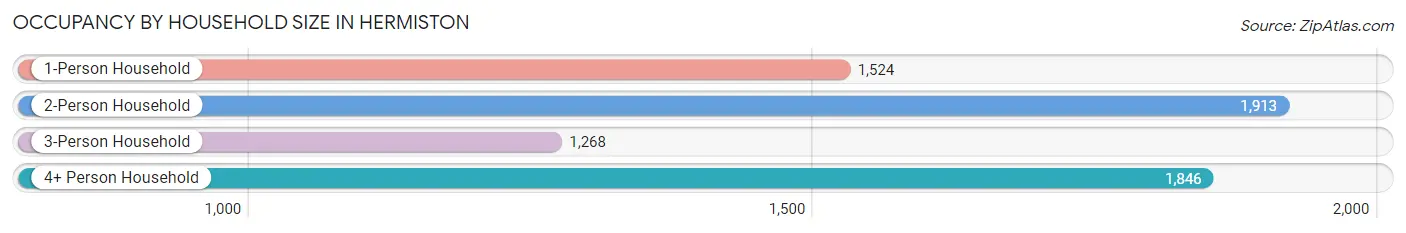
| Household Size | # Housing Units | % Housing Units |
| 1-Person Household | 1,524 | 23.3% |
| 2-Person Household | 1,913 | 29.2% |
| 3-Person Household | 1,268 | 19.4% |
| 4+ Person Household | 1,846 | 28.2% |
| Total Housing Units | 6,551 | 100.0% |
Occupancy by Ownership by Household Size in Hermiston
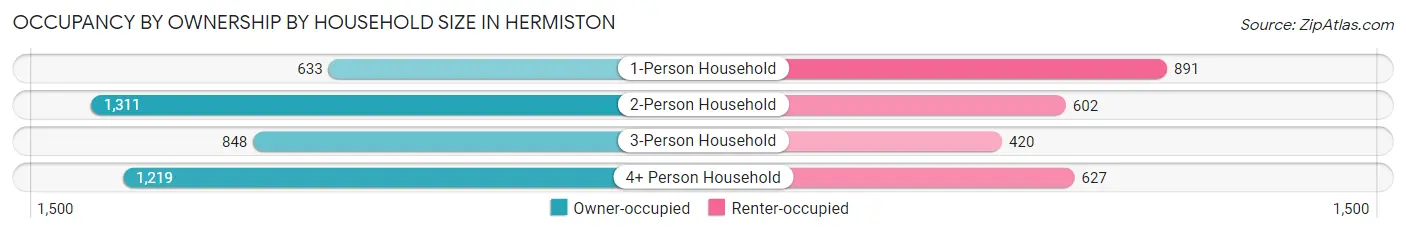
| Household Size | Owner-occupied | Renter-occupied |
| 1-Person Household | 633 (41.5%) | 891 (58.5%) |
| 2-Person Household | 1,311 (68.5%) | 602 (31.5%) |
| 3-Person Household | 848 (66.9%) | 420 (33.1%) |
| 4+ Person Household | 1,219 (66.0%) | 627 (34.0%) |
| Total Housing Units | 4,011 (61.2%) | 2,540 (38.8%) |
Occupancy by Educational Attainment in Hermiston
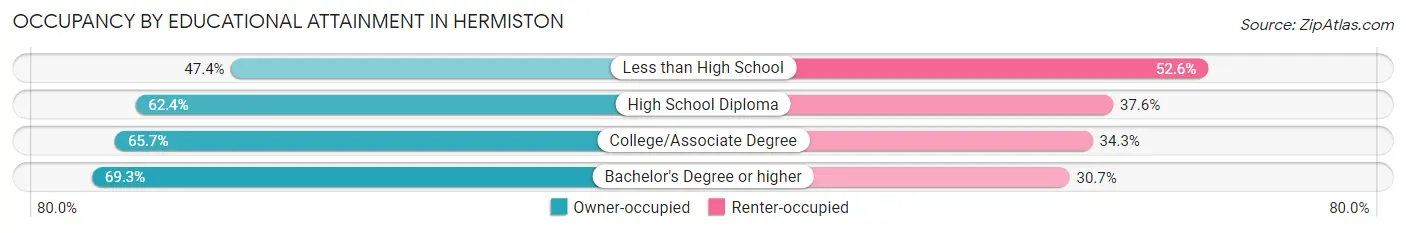
| Household Size | Owner-occupied | Renter-occupied |
| Less than High School | 736 (47.4%) | 818 (52.6%) |
| High School Diploma | 987 (62.4%) | 594 (37.6%) |
| College/Associate Degree | 1,438 (65.7%) | 752 (34.3%) |
| Bachelor's Degree or higher | 850 (69.3%) | 376 (30.7%) |
Occupancy by Age of Householder in Hermiston
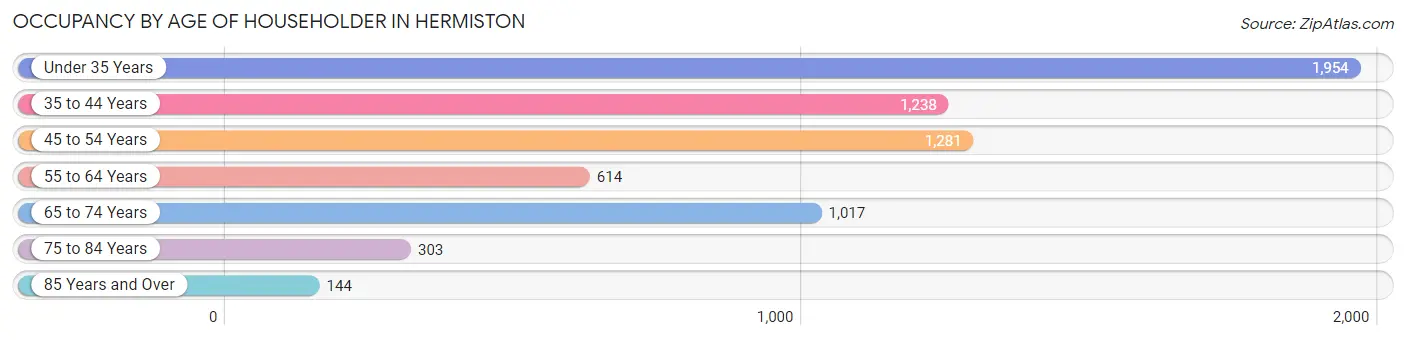
| Age Bracket | # Households | % Households |
| Under 35 Years | 1,954 | 29.8% |
| 35 to 44 Years | 1,238 | 18.9% |
| 45 to 54 Years | 1,281 | 19.6% |
| 55 to 64 Years | 614 | 9.4% |
| 65 to 74 Years | 1,017 | 15.5% |
| 75 to 84 Years | 303 | 4.6% |
| 85 Years and Over | 144 | 2.2% |
| Total | 6,551 | 100.0% |
Housing Finances in Hermiston
Median Income by Occupancy in Hermiston
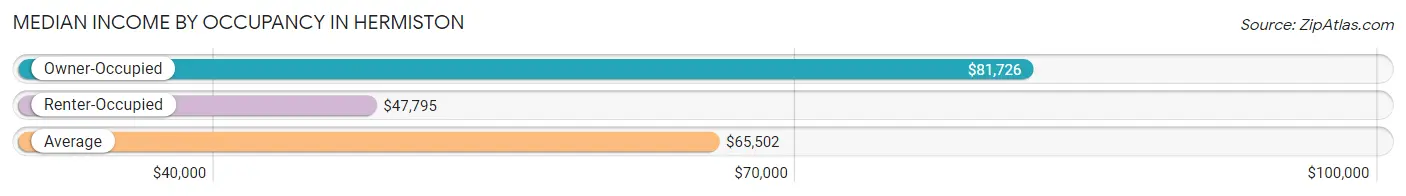
| Occupancy Type | # Households | Median Income |
| Owner-Occupied | 4,011 (61.2%) | $81,726 |
| Renter-Occupied | 2,540 (38.8%) | $47,795 |
| Average | 6,551 (100.0%) | $65,502 |
Occupancy by Householder Income Bracket in Hermiston
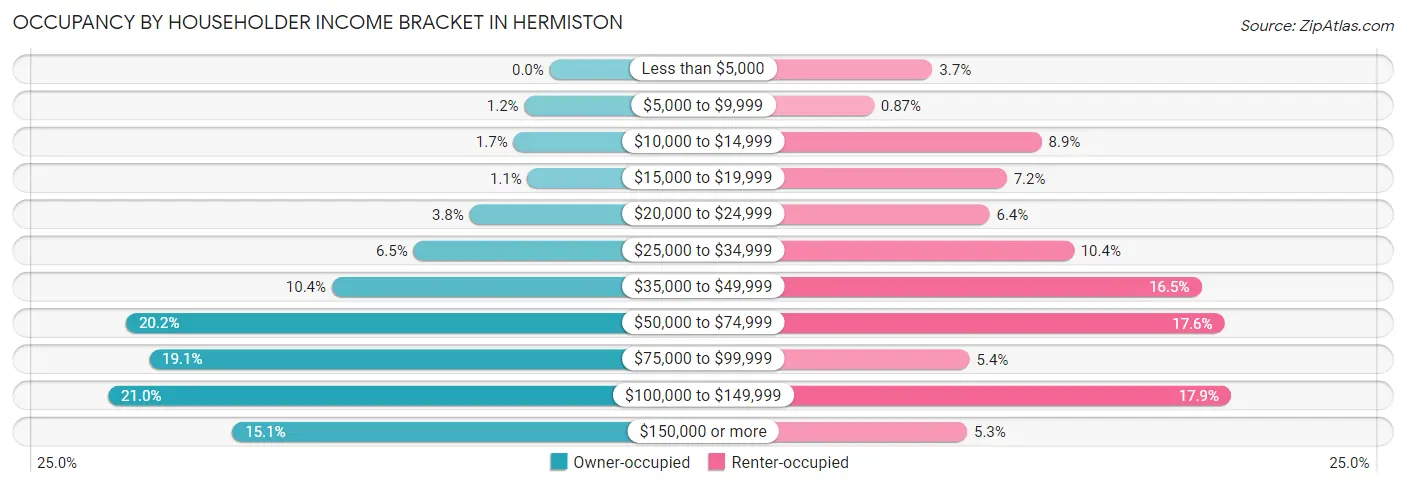
| Income Bracket | Owner-occupied | Renter-occupied |
| Less than $5,000 | 0 (0.0%) | 93 (3.7%) |
| $5,000 to $9,999 | 48 (1.2%) | 22 (0.9%) |
| $10,000 to $14,999 | 69 (1.7%) | 225 (8.9%) |
| $15,000 to $19,999 | 42 (1.1%) | 183 (7.2%) |
| $20,000 to $24,999 | 153 (3.8%) | 162 (6.4%) |
| $25,000 to $34,999 | 260 (6.5%) | 264 (10.4%) |
| $35,000 to $49,999 | 416 (10.4%) | 418 (16.5%) |
| $50,000 to $74,999 | 809 (20.2%) | 446 (17.6%) |
| $75,000 to $99,999 | 765 (19.1%) | 138 (5.4%) |
| $100,000 to $149,999 | 843 (21.0%) | 454 (17.9%) |
| $150,000 or more | 606 (15.1%) | 135 (5.3%) |
| Total | 4,011 (100.0%) | 2,540 (100.0%) |
Monthly Housing Cost Tiers in Hermiston
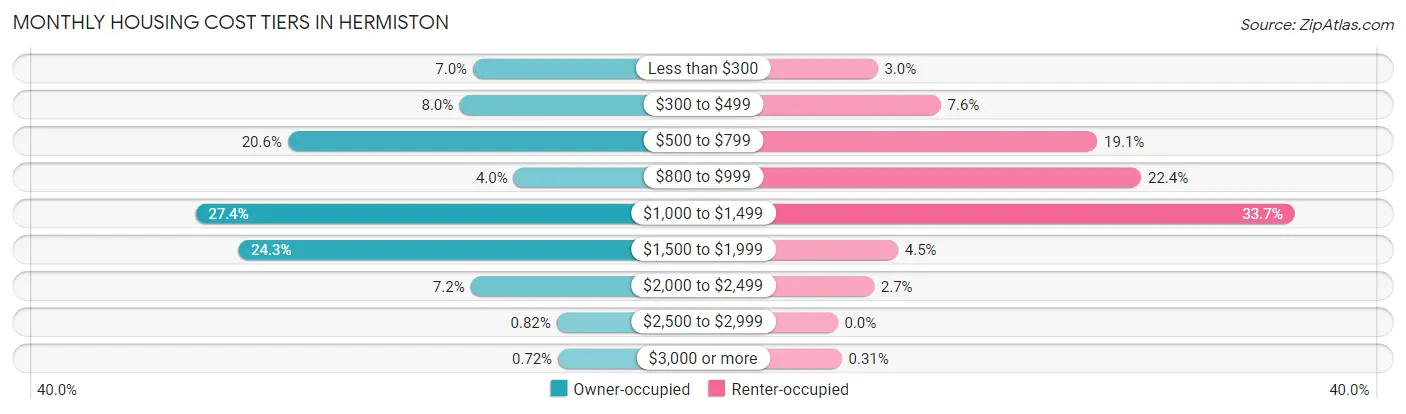
| Monthly Cost | Owner-occupied | Renter-occupied |
| Less than $300 | 280 (7.0%) | 75 (2.9%) |
| $300 to $499 | 321 (8.0%) | 193 (7.6%) |
| $500 to $799 | 827 (20.6%) | 486 (19.1%) |
| $800 to $999 | 160 (4.0%) | 568 (22.4%) |
| $1,000 to $1,499 | 1,100 (27.4%) | 855 (33.7%) |
| $1,500 to $1,999 | 974 (24.3%) | 113 (4.4%) |
| $2,000 to $2,499 | 287 (7.2%) | 68 (2.7%) |
| $2,500 to $2,999 | 33 (0.8%) | 0 (0.0%) |
| $3,000 or more | 29 (0.7%) | 8 (0.3%) |
| Total | 4,011 (100.0%) | 2,540 (100.0%) |
Physical Housing Characteristics in Hermiston
Housing Structures in Hermiston

| Structure Type | # Housing Units | % Housing Units |
| Single Unit, Detached | 3,900 | 59.5% |
| Single Unit, Attached | 179 | 2.7% |
| 2 Unit Apartments | 295 | 4.5% |
| 3 or 4 Unit Apartments | 440 | 6.7% |
| 5 to 9 Unit Apartments | 155 | 2.4% |
| 10 or more Apartments | 838 | 12.8% |
| Mobile Home / Other | 744 | 11.4% |
| Total | 6,551 | 100.0% |
Housing Structures by Occupancy in Hermiston
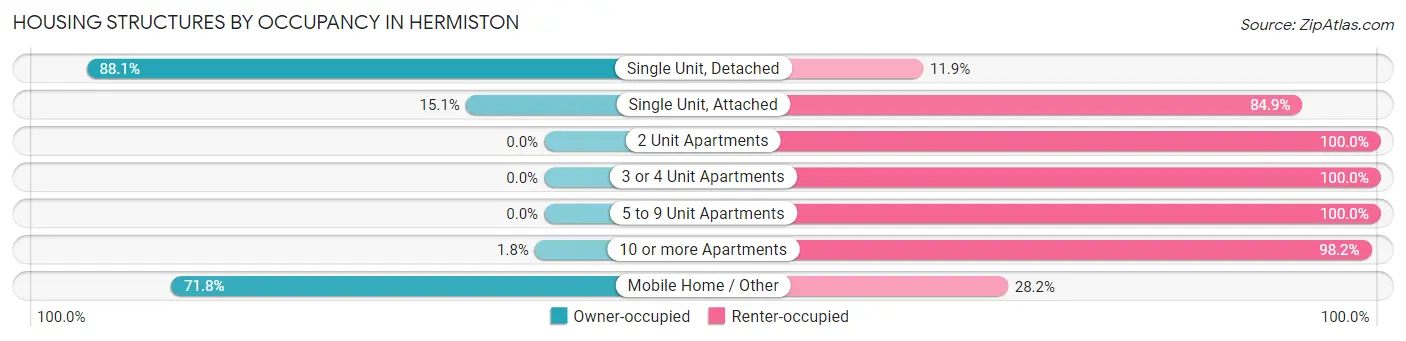
| Structure Type | Owner-occupied | Renter-occupied |
| Single Unit, Detached | 3,435 (88.1%) | 465 (11.9%) |
| Single Unit, Attached | 27 (15.1%) | 152 (84.9%) |
| 2 Unit Apartments | 0 (0.0%) | 295 (100.0%) |
| 3 or 4 Unit Apartments | 0 (0.0%) | 440 (100.0%) |
| 5 to 9 Unit Apartments | 0 (0.0%) | 155 (100.0%) |
| 10 or more Apartments | 15 (1.8%) | 823 (98.2%) |
| Mobile Home / Other | 534 (71.8%) | 210 (28.2%) |
| Total | 4,011 (61.2%) | 2,540 (38.8%) |
Housing Structures by Number of Rooms in Hermiston
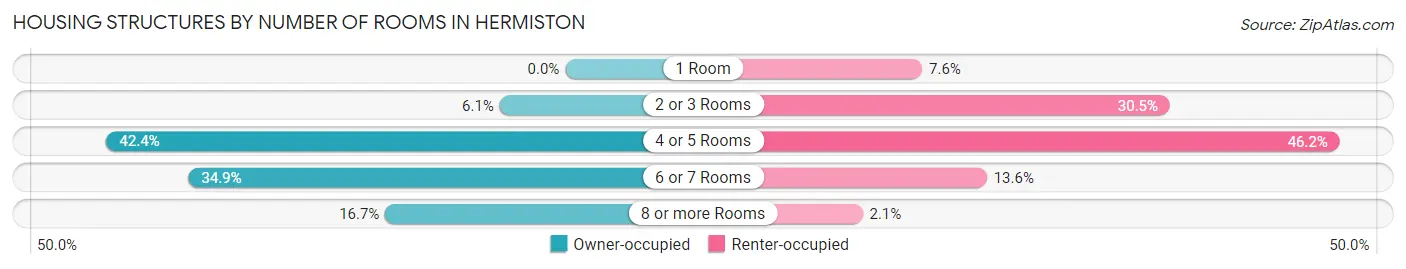
| Number of Rooms | Owner-occupied | Renter-occupied |
| 1 Room | 0 (0.0%) | 193 (7.6%) |
| 2 or 3 Rooms | 243 (6.1%) | 775 (30.5%) |
| 4 or 5 Rooms | 1,702 (42.4%) | 1,174 (46.2%) |
| 6 or 7 Rooms | 1,398 (34.8%) | 345 (13.6%) |
| 8 or more Rooms | 668 (16.7%) | 53 (2.1%) |
| Total | 4,011 (100.0%) | 2,540 (100.0%) |
Housing Structure by Heating Type in Hermiston
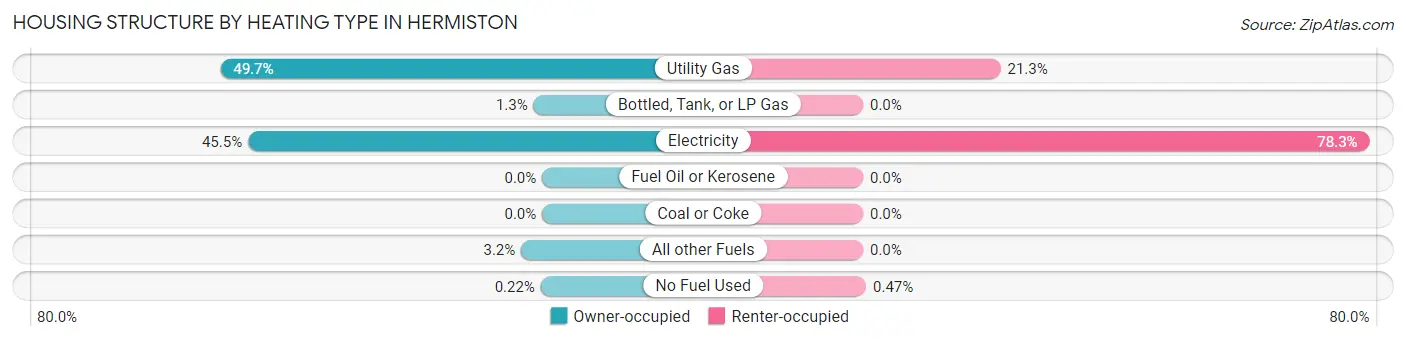
| Heating Type | Owner-occupied | Renter-occupied |
| Utility Gas | 1,995 (49.7%) | 540 (21.3%) |
| Bottled, Tank, or LP Gas | 53 (1.3%) | 0 (0.0%) |
| Electricity | 1,824 (45.5%) | 1,988 (78.3%) |
| Fuel Oil or Kerosene | 0 (0.0%) | 0 (0.0%) |
| Coal or Coke | 0 (0.0%) | 0 (0.0%) |
| All other Fuels | 130 (3.2%) | 0 (0.0%) |
| No Fuel Used | 9 (0.2%) | 12 (0.5%) |
| Total | 4,011 (100.0%) | 2,540 (100.0%) |
Household Vehicle Usage in Hermiston
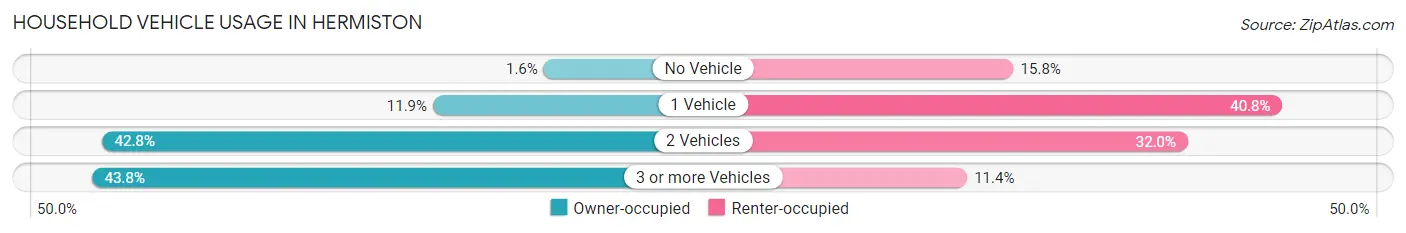
| Vehicles per Household | Owner-occupied | Renter-occupied |
| No Vehicle | 62 (1.5%) | 400 (15.8%) |
| 1 Vehicle | 477 (11.9%) | 1,037 (40.8%) |
| 2 Vehicles | 1,717 (42.8%) | 813 (32.0%) |
| 3 or more Vehicles | 1,755 (43.8%) | 290 (11.4%) |
| Total | 4,011 (100.0%) | 2,540 (100.0%) |
Real Estate & Mortgages in Hermiston
Real Estate and Mortgage Overview in Hermiston
| Characteristic | Without Mortgage | With Mortgage |
| Housing Units | 1,243 | 2,768 |
| Median Property Value | $190,900 | $245,100 |
| Median Household Income | $63,300 | $470 |
| Monthly Housing Costs | $509 | $29 |
| Real Estate Taxes | $2,880 | $7 |
Property Value by Mortgage Status in Hermiston
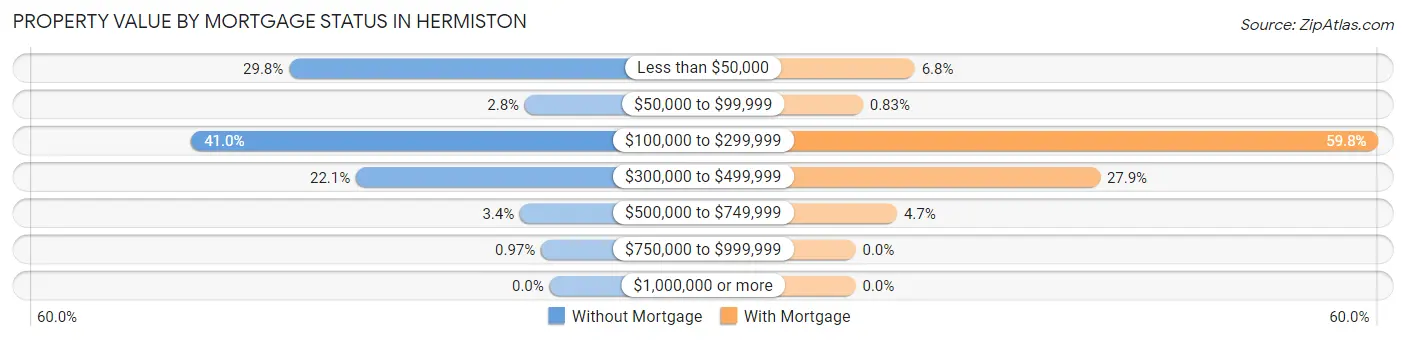
| Property Value | Without Mortgage | With Mortgage |
| Less than $50,000 | 370 (29.8%) | 187 (6.8%) |
| $50,000 to $99,999 | 35 (2.8%) | 23 (0.8%) |
| $100,000 to $299,999 | 509 (40.9%) | 1,654 (59.8%) |
| $300,000 to $499,999 | 275 (22.1%) | 773 (27.9%) |
| $500,000 to $749,999 | 42 (3.4%) | 131 (4.7%) |
| $750,000 to $999,999 | 12 (1.0%) | 0 (0.0%) |
| $1,000,000 or more | 0 (0.0%) | 0 (0.0%) |
| Total | 1,243 (100.0%) | 2,768 (100.0%) |
Household Income by Mortgage Status in Hermiston
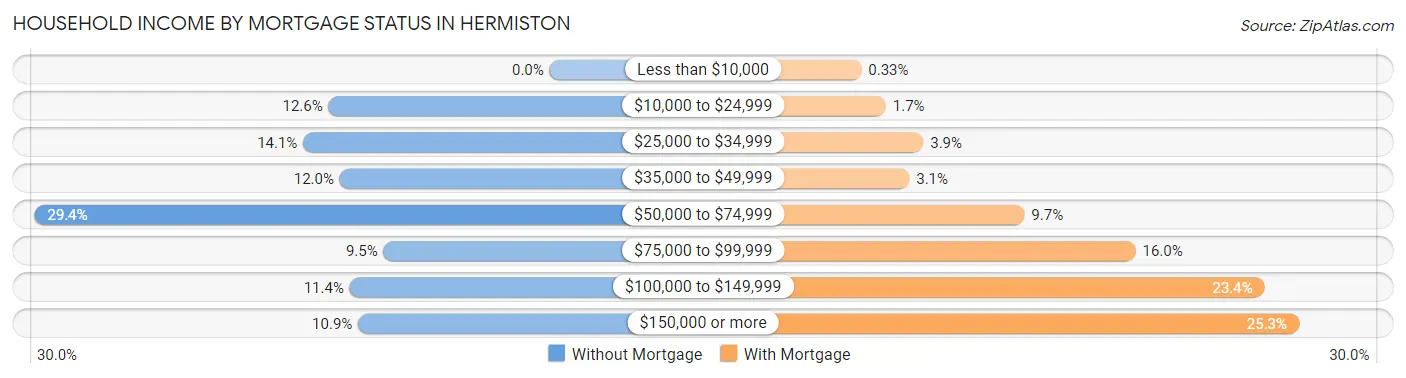
| Household Income | Without Mortgage | With Mortgage |
| Less than $10,000 | 0 (0.0%) | 9 (0.3%) |
| $10,000 to $24,999 | 157 (12.6%) | 48 (1.7%) |
| $25,000 to $34,999 | 175 (14.1%) | 107 (3.9%) |
| $35,000 to $49,999 | 149 (12.0%) | 85 (3.1%) |
| $50,000 to $74,999 | 366 (29.4%) | 267 (9.7%) |
| $75,000 to $99,999 | 118 (9.5%) | 443 (16.0%) |
| $100,000 to $149,999 | 142 (11.4%) | 647 (23.4%) |
| $150,000 or more | 136 (10.9%) | 701 (25.3%) |
| Total | 1,243 (100.0%) | 2,768 (100.0%) |
Property Value to Household Income Ratio in Hermiston
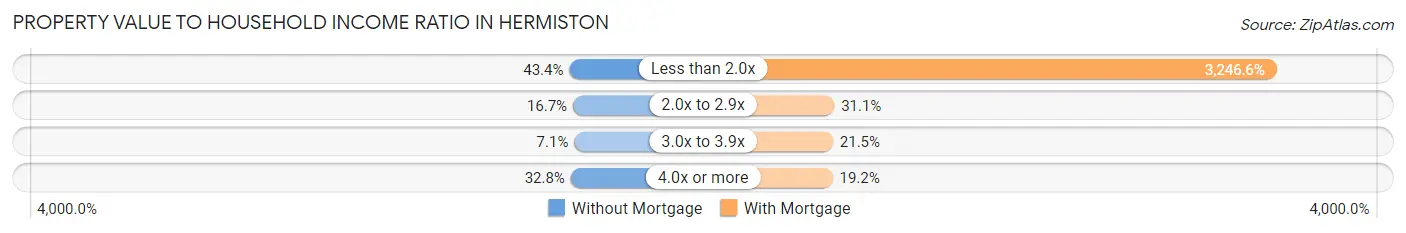
| Value-to-Income Ratio | Without Mortgage | With Mortgage |
| Less than 2.0x | 539 (43.4%) | 89,867 (3,246.6%) |
| 2.0x to 2.9x | 208 (16.7%) | 860 (31.1%) |
| 3.0x to 3.9x | 88 (7.1%) | 595 (21.5%) |
| 4.0x or more | 408 (32.8%) | 530 (19.2%) |
| Total | 1,243 (100.0%) | 2,768 (100.0%) |
Real Estate Taxes by Mortgage Status in Hermiston
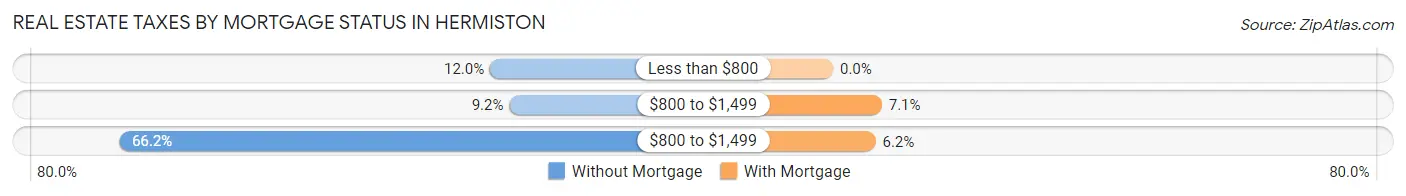
| Property Taxes | Without Mortgage | With Mortgage |
| Less than $800 | 149 (12.0%) | 0 (0.0%) |
| $800 to $1,499 | 114 (9.2%) | 197 (7.1%) |
| $800 to $1,499 | 823 (66.2%) | 172 (6.2%) |
| Total | 1,243 (100.0%) | 2,768 (100.0%) |
Health & Disability in Hermiston
Health Insurance Coverage by Age in Hermiston
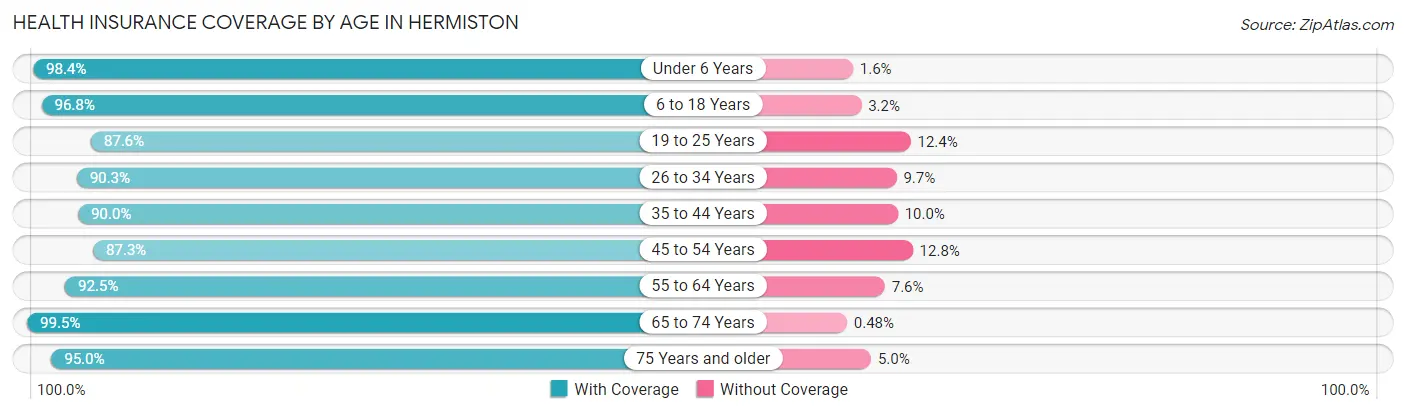
| Age Bracket | With Coverage | Without Coverage |
| Under 6 Years | 1,610 (98.4%) | 26 (1.6%) |
| 6 to 18 Years | 4,316 (96.8%) | 141 (3.2%) |
| 19 to 25 Years | 1,744 (87.6%) | 246 (12.4%) |
| 26 to 34 Years | 2,291 (90.3%) | 247 (9.7%) |
| 35 to 44 Years | 2,368 (90.0%) | 262 (10.0%) |
| 45 to 54 Years | 2,019 (87.3%) | 295 (12.8%) |
| 55 to 64 Years | 1,261 (92.4%) | 103 (7.5%) |
| 65 to 74 Years | 1,466 (99.5%) | 7 (0.5%) |
| 75 Years and older | 668 (95.0%) | 35 (5.0%) |
| Total | 17,743 (92.9%) | 1,362 (7.1%) |
Health Insurance Coverage by Citizenship Status in Hermiston
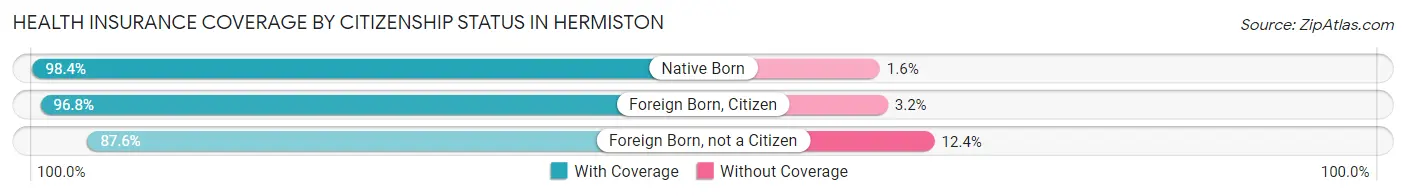
| Citizenship Status | With Coverage | Without Coverage |
| Native Born | 1,610 (98.4%) | 26 (1.6%) |
| Foreign Born, Citizen | 4,316 (96.8%) | 141 (3.2%) |
| Foreign Born, not a Citizen | 1,744 (87.6%) | 246 (12.4%) |
Health Insurance Coverage by Household Income in Hermiston
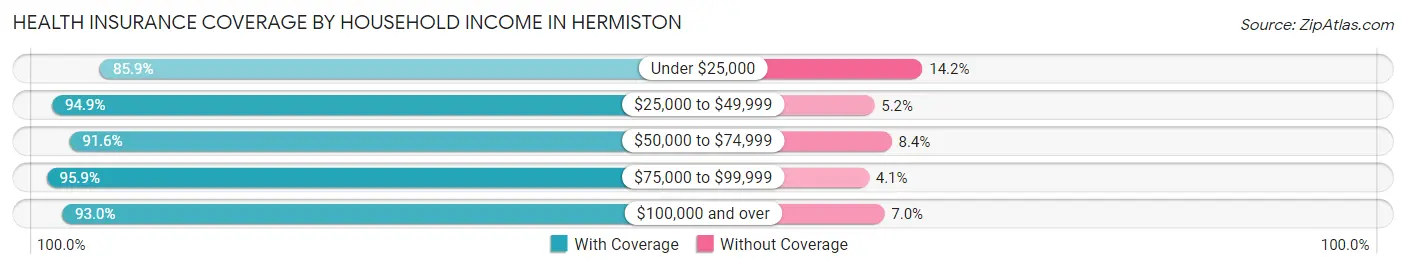
| Household Income | With Coverage | Without Coverage |
| Under $25,000 | 1,432 (85.9%) | 236 (14.1%) |
| $25,000 to $49,999 | 2,819 (94.9%) | 153 (5.1%) |
| $50,000 to $74,999 | 3,576 (91.6%) | 327 (8.4%) |
| $75,000 to $99,999 | 3,074 (95.9%) | 132 (4.1%) |
| $100,000 and over | 6,761 (93.0%) | 512 (7.0%) |
Public vs Private Health Insurance Coverage by Age in Hermiston
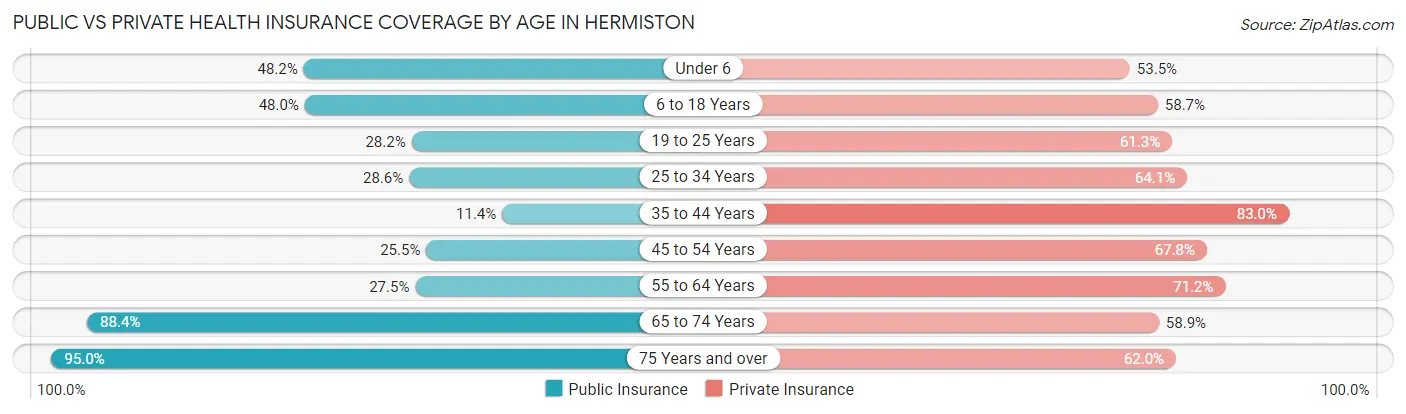
| Age Bracket | Public Insurance | Private Insurance |
| Under 6 | 789 (48.2%) | 875 (53.5%) |
| 6 to 18 Years | 2,140 (48.0%) | 2,615 (58.7%) |
| 19 to 25 Years | 561 (28.2%) | 1,220 (61.3%) |
| 25 to 34 Years | 727 (28.6%) | 1,626 (64.1%) |
| 35 to 44 Years | 299 (11.4%) | 2,182 (83.0%) |
| 45 to 54 Years | 589 (25.5%) | 1,568 (67.8%) |
| 55 to 64 Years | 375 (27.5%) | 971 (71.2%) |
| 65 to 74 Years | 1,302 (88.4%) | 867 (58.9%) |
| 75 Years and over | 668 (95.0%) | 436 (62.0%) |
| Total | 7,450 (39.0%) | 12,360 (64.7%) |
Disability Status by Sex by Age in Hermiston
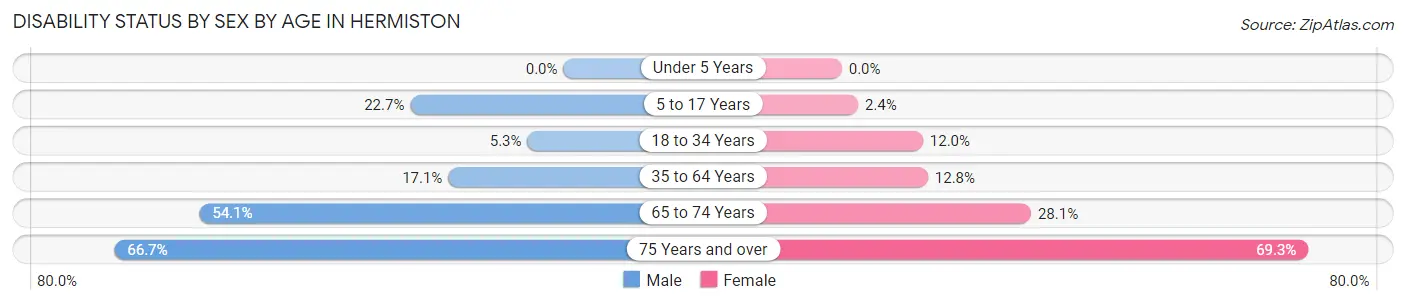
| Age Bracket | Male | Female |
| Under 5 Years | 0 (0.0%) | 0 (0.0%) |
| 5 to 17 Years | 422 (22.7%) | 63 (2.4%) |
| 18 to 34 Years | 152 (5.3%) | 248 (12.0%) |
| 35 to 64 Years | 550 (17.1%) | 395 (12.8%) |
| 65 to 74 Years | 367 (54.0%) | 223 (28.1%) |
| 75 Years and over | 176 (66.7%) | 304 (69.3%) |
Disability Class by Sex by Age in Hermiston
Disability Class: Hearing Difficulty
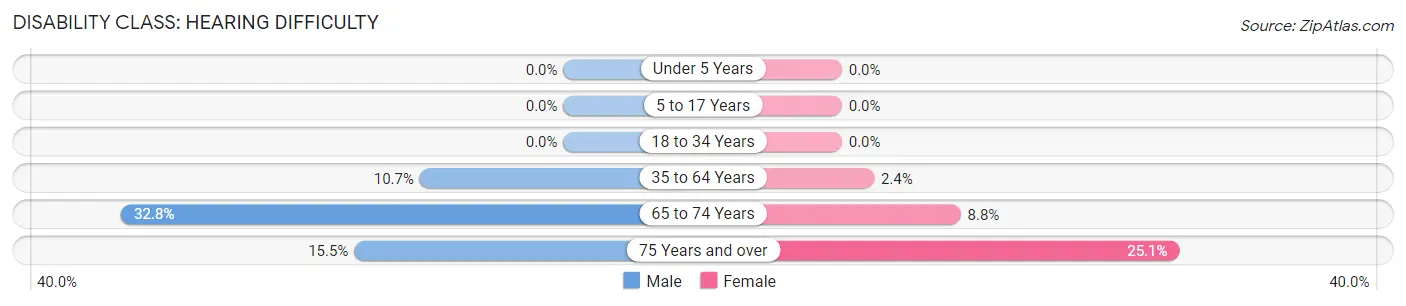
| Age Bracket | Male | Female |
| Under 5 Years | 0 (0.0%) | 0 (0.0%) |
| 5 to 17 Years | 0 (0.0%) | 0 (0.0%) |
| 18 to 34 Years | 0 (0.0%) | 0 (0.0%) |
| 35 to 64 Years | 343 (10.7%) | 74 (2.4%) |
| 65 to 74 Years | 223 (32.8%) | 70 (8.8%) |
| 75 Years and over | 41 (15.5%) | 110 (25.1%) |
Disability Class: Vision Difficulty
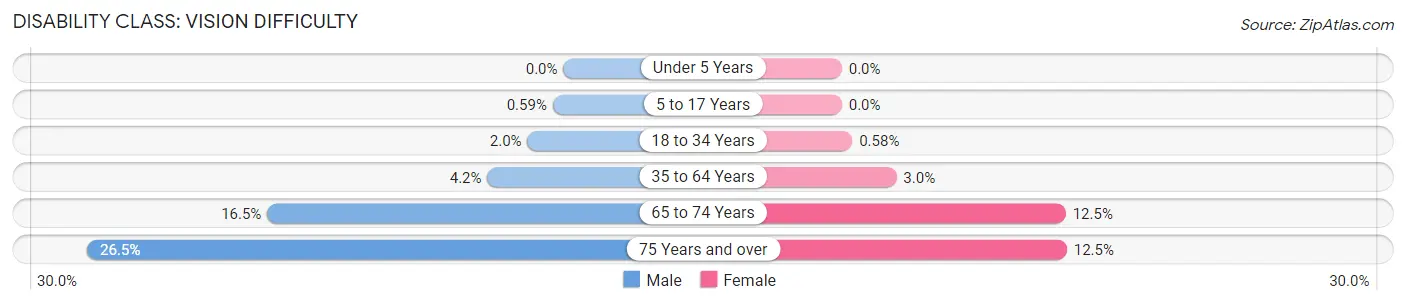
| Age Bracket | Male | Female |
| Under 5 Years | 0 (0.0%) | 0 (0.0%) |
| 5 to 17 Years | 11 (0.6%) | 0 (0.0%) |
| 18 to 34 Years | 57 (2.0%) | 12 (0.6%) |
| 35 to 64 Years | 136 (4.2%) | 94 (3.0%) |
| 65 to 74 Years | 112 (16.5%) | 99 (12.5%) |
| 75 Years and over | 70 (26.5%) | 55 (12.5%) |
Disability Class: Cognitive Difficulty
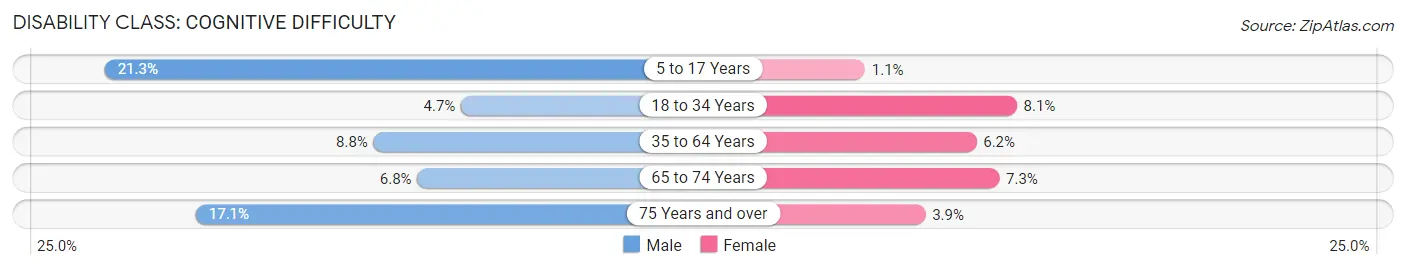
| Age Bracket | Male | Female |
| 5 to 17 Years | 395 (21.3%) | 28 (1.1%) |
| 18 to 34 Years | 135 (4.7%) | 167 (8.1%) |
| 35 to 64 Years | 283 (8.8%) | 193 (6.2%) |
| 65 to 74 Years | 46 (6.8%) | 58 (7.3%) |
| 75 Years and over | 45 (17.1%) | 17 (3.9%) |
Disability Class: Ambulatory Difficulty
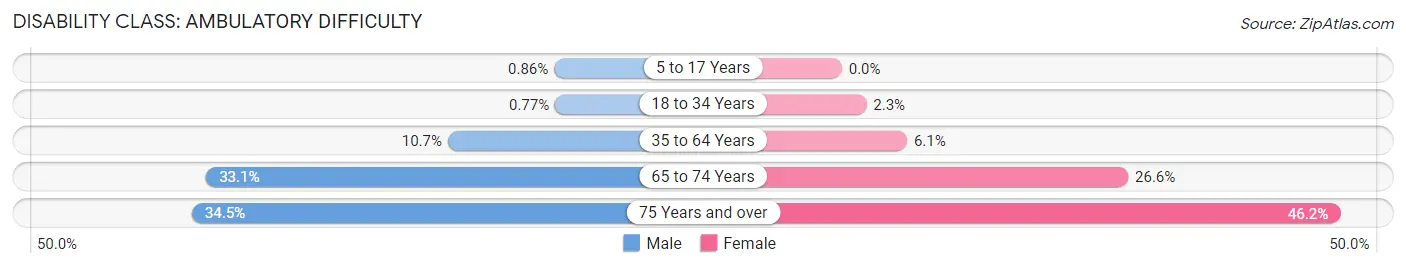
| Age Bracket | Male | Female |
| 5 to 17 Years | 16 (0.9%) | 0 (0.0%) |
| 18 to 34 Years | 22 (0.8%) | 47 (2.3%) |
| 35 to 64 Years | 345 (10.7%) | 187 (6.0%) |
| 65 to 74 Years | 225 (33.1%) | 211 (26.6%) |
| 75 Years and over | 91 (34.5%) | 203 (46.2%) |
Disability Class: Self-Care Difficulty
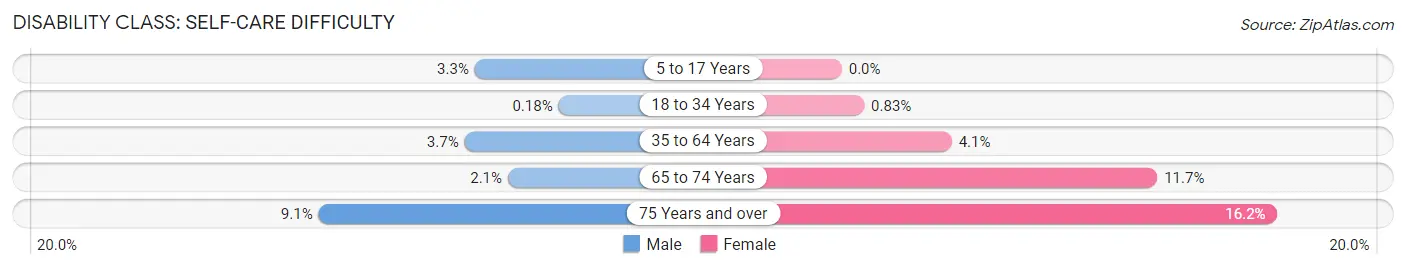
| Age Bracket | Male | Female |
| 5 to 17 Years | 61 (3.3%) | 0 (0.0%) |
| 18 to 34 Years | 5 (0.2%) | 17 (0.8%) |
| 35 to 64 Years | 118 (3.7%) | 126 (4.1%) |
| 65 to 74 Years | 14 (2.1%) | 93 (11.7%) |
| 75 Years and over | 24 (9.1%) | 71 (16.2%) |
Technology Access in Hermiston
Computing Device Access in Hermiston
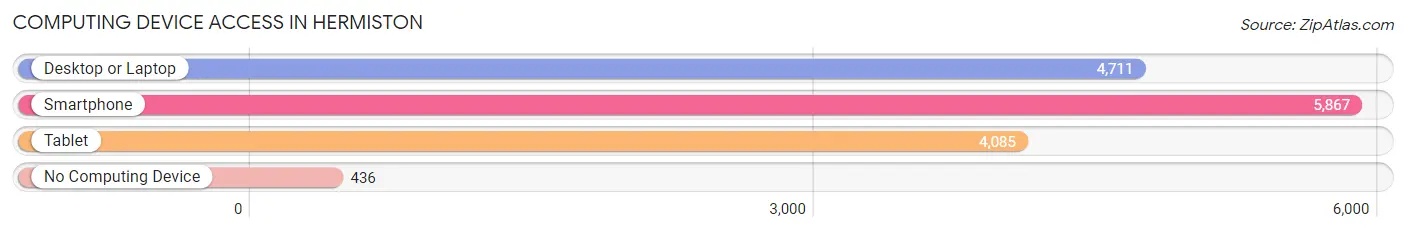
| Device Type | # Households | % Households |
| Desktop or Laptop | 4,711 | 71.9% |
| Smartphone | 5,867 | 89.6% |
| Tablet | 4,085 | 62.4% |
| No Computing Device | 436 | 6.7% |
| Total | 6,551 | 100.0% |
Internet Access in Hermiston
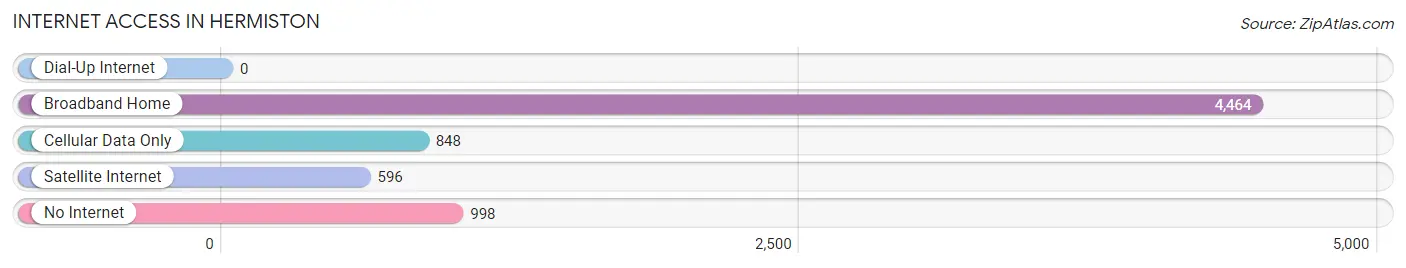
| Internet Type | # Households | % Households |
| Dial-Up Internet | 0 | 0.0% |
| Broadband Home | 4,464 | 68.1% |
| Cellular Data Only | 848 | 12.9% |
| Satellite Internet | 596 | 9.1% |
| No Internet | 998 | 15.2% |
| Total | 6,551 | 100.0% |
Hermiston Summary
History
The city of Hermiston, Oregon is located in the Umatilla County in the northeastern part of the state. It is situated on the Columbia River, near the border of Washington and Idaho. The city was founded in 1881 by William and Mary Hermiston, who were among the first settlers in the area. The city was originally known as Hermiston Station, and was a stop on the Oregon Railway and Navigation Company's line.
The city was officially incorporated in 1901, and the population grew steadily over the next few decades. By the 1950s, the population had grown to over 3,000 people. The city continued to grow throughout the 20th century, and by the 2000 census, the population had grown to over 10,000 people.
Geography
Hermiston is located in the Umatilla County in the northeastern part of the state. It is situated on the Columbia River, near the border of Washington and Idaho. The city is located in the Columbia Plateau, which is a region of rolling hills and basaltic lava flows. The city is located at an elevation of 1,067 feet above sea level.
The climate in Hermiston is semi-arid, with hot summers and cold winters. The average annual temperature is around 50 degrees Fahrenheit, and the average annual precipitation is around 10 inches.
Economy
The economy of Hermiston is largely based on agriculture and food processing. The city is home to several large food processing plants, including the Lamb Weston potato processing plant, which is the largest in the world. The city is also home to several large agricultural companies, including the Oregon Potato Company and the Umatilla Grain Growers.
The city is also home to several large retail stores, including Walmart, Home Depot, and Lowe's. The city is also home to several large manufacturing companies, including the Hermiston Manufacturing Company and the Hermiston Steel Company.
Demographics
As of the 2000 census, the population of Hermiston was 10,743 people. The racial makeup of the city was 79.3% White, 0.7% African American, 0.7% Native American, 0.7% Asian, 0.2% Pacific Islander, 16.2% from other races, and 2.2% from two or more races. Hispanic or Latino of any race were 24.3% of the population.
The median income for a household in the city was $32,917, and the median income for a family was $37,917. The per capita income for the city was $15,917. About 17.2% of families and 20.7% of the population were below the poverty line, including 28.3% of those under age 18 and 8.7% of those age 65 or over.
Common Questions
What is Per Capita Income in Hermiston?
Per Capita income in Hermiston is $28,035.
What is the Median Family Income in Hermiston?
Median Family Income in Hermiston is $76,327.
What is the Median Household income in Hermiston?
Median Household Income in Hermiston is $65,502.
What is Income or Wage Gap in Hermiston?
Income or Wage Gap in Hermiston is 38.0%.
Women in Hermiston earn 62.0 cents for every dollar earned by a man.
What is Inequality or Gini Index in Hermiston?
Inequality or Gini Index in Hermiston is 0.39.
What is the Total Population of Hermiston?
Total Population of Hermiston is 19,267.
What is the Total Male Population of Hermiston?
Total Male Population of Hermiston is 9,565.
What is the Total Female Population of Hermiston?
Total Female Population of Hermiston is 9,702.
What is the Ratio of Males per 100 Females in Hermiston?
There are 98.59 Males per 100 Females in Hermiston.
What is the Ratio of Females per 100 Males in Hermiston?
There are 101.43 Females per 100 Males in Hermiston.
What is the Median Population Age in Hermiston?
Median Population Age in Hermiston is 31.5 Years.
What is the Average Family Size in Hermiston
Average Family Size in Hermiston is 3.4 People.
What is the Average Household Size in Hermiston
Average Household Size in Hermiston is 2.9 People.
How Large is the Labor Force in Hermiston?
There are 10,022 People in the Labor Forcein in Hermiston.
What is the Percentage of People in the Labor Force in Hermiston?
70.7% of People are in the Labor Force in Hermiston.
What is the Unemployment Rate in Hermiston?
Unemployment Rate in Hermiston is 7.4%.