Bend, OR Map & Demographics
Bend Map
Bend Overview
$51,254
PER CAPITA INCOME
$105,957
AVG FAMILY INCOME
$82,671
AVG HOUSEHOLD INCOME
30.5%
WAGE / INCOME GAP [ % ]
69.5¢/ $1
WAGE / INCOME GAP [ $ ]
$12,308
FAMILY INCOME DEFICIT
0.48
INEQUALITY / GINI INDEX
99,442
TOTAL POPULATION
50,211
MALE POPULATION
49,231
FEMALE POPULATION
101.99
MALES / 100 FEMALES
98.05
FEMALES / 100 MALES
39.5
MEDIAN AGE
2.9
AVG FAMILY SIZE
2.3
AVG HOUSEHOLD SIZE
55,151
LABOR FORCE [ PEOPLE ]
68.1%
PERCENT IN LABOR FORCE
3.8%
UNEMPLOYMENT RATE
Income in Bend
Income Overview in Bend
Per Capita Income in Bend is $51,254, while median incomes of families and households are $105,957 and $82,671 respectively.
| Characteristic | Number | Measure |
| Per Capita Income | 99,442 | $51,254 |
| Median Family Income | 25,139 | $105,957 |
| Mean Family Income | 25,139 | $145,703 |
| Median Household Income | 42,151 | $82,671 |
| Mean Household Income | 42,151 | $119,319 |
| Income Deficit | 25,139 | $12,308 |
| Wage / Income Gap (%) | 99,442 | 30.51% |
| Wage / Income Gap ($) | 99,442 | 69.49¢ per $1 |
| Gini / Inequality Index | 99,442 | 0.48 |
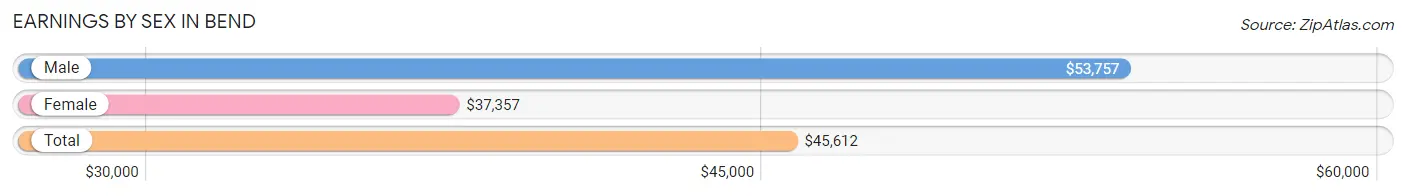
Earnings by Sex in Bend
Average Earnings in Bend are $45,612, $53,757 for men and $37,357 for women, a difference of 30.5%.
| Sex | Number | Average Earnings |
| Male | 30,480 (53.0%) | $53,757 |
| Female | 27,002 (47.0%) | $37,357 |
| Total | 57,482 (100.0%) | $45,612 |
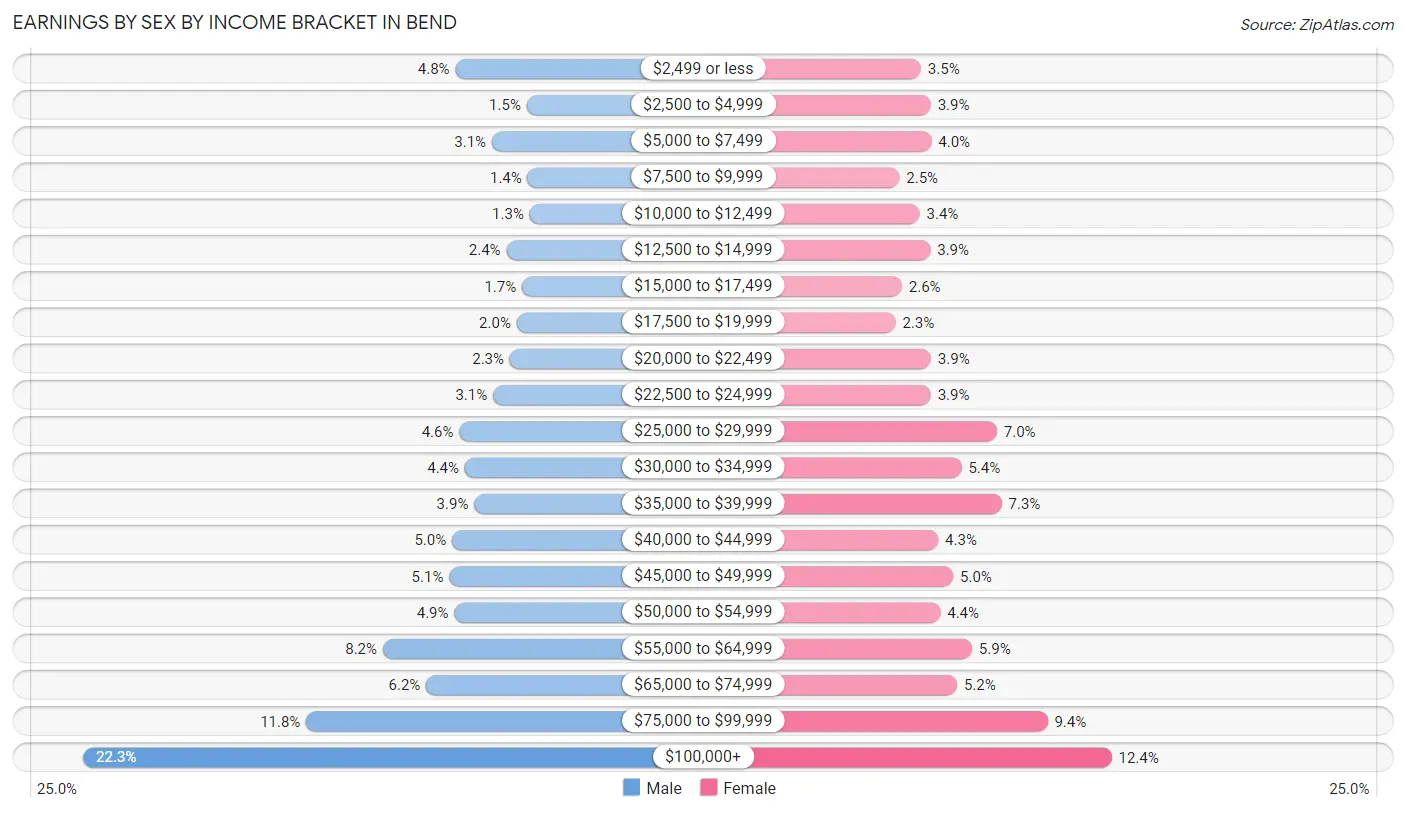
Earnings by Sex by Income Bracket in Bend
The most common earnings brackets in Bend are $100,000+ for men (6,785 | 22.3%) and $100,000+ for women (3,348 | 12.4%).
| Income | Male | Female |
| $2,499 or less | 1,470 (4.8%) | 938 (3.5%) |
| $2,500 to $4,999 | 450 (1.5%) | 1,061 (3.9%) |
| $5,000 to $7,499 | 947 (3.1%) | 1,068 (4.0%) |
| $7,500 to $9,999 | 440 (1.4%) | 665 (2.5%) |
| $10,000 to $12,499 | 408 (1.3%) | 922 (3.4%) |
| $12,500 to $14,999 | 742 (2.4%) | 1,056 (3.9%) |
| $15,000 to $17,499 | 517 (1.7%) | 698 (2.6%) |
| $17,500 to $19,999 | 593 (1.9%) | 615 (2.3%) |
| $20,000 to $22,499 | 692 (2.3%) | 1,065 (3.9%) |
| $22,500 to $24,999 | 933 (3.1%) | 1,062 (3.9%) |
| $25,000 to $29,999 | 1,414 (4.6%) | 1,899 (7.0%) |
| $30,000 to $34,999 | 1,335 (4.4%) | 1,449 (5.4%) |
| $35,000 to $39,999 | 1,200 (3.9%) | 1,957 (7.2%) |
| $40,000 to $44,999 | 1,519 (5.0%) | 1,156 (4.3%) |
| $45,000 to $49,999 | 1,559 (5.1%) | 1,345 (5.0%) |
| $50,000 to $54,999 | 1,484 (4.9%) | 1,184 (4.4%) |
| $55,000 to $64,999 | 2,505 (8.2%) | 1,581 (5.9%) |
| $65,000 to $74,999 | 1,887 (6.2%) | 1,394 (5.2%) |
| $75,000 to $99,999 | 3,600 (11.8%) | 2,539 (9.4%) |
| $100,000+ | 6,785 (22.3%) | 3,348 (12.4%) |
| Total | 30,480 (100.0%) | 27,002 (100.0%) |
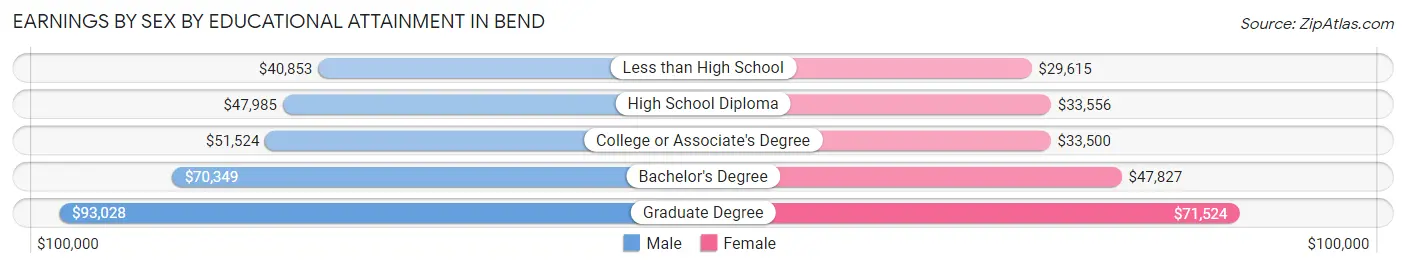
Earnings by Sex by Educational Attainment in Bend
Average earnings in Bend are $59,742 for men and $43,377 for women, a difference of 27.4%. Men with an educational attainment of graduate degree enjoy the highest average annual earnings of $93,028, while those with less than high school education earn the least with $40,853. Women with an educational attainment of graduate degree earn the most with the average annual earnings of $71,524, while those with less than high school education have the smallest earnings of $29,615.
| Educational Attainment | Male Income | Female Income |
| Less than High School | $40,853 | $29,615 |
| High School Diploma | $47,985 | $33,556 |
| College or Associate's Degree | $51,524 | $33,500 |
| Bachelor's Degree | $70,349 | $47,827 |
| Graduate Degree | $93,028 | $71,524 |
| Total | $59,742 | $43,377 |
Family Income in Bend
Family Income Brackets in Bend
According to the Bend family income data, there are 5,329 families falling into the $100,000 to $149,999 income range, which is the most common income bracket and makes up 21.2% of all families. Conversely, the $10,000 to $14,999 income bracket is the least frequent group with only 226 families (0.9%) belonging to this category.
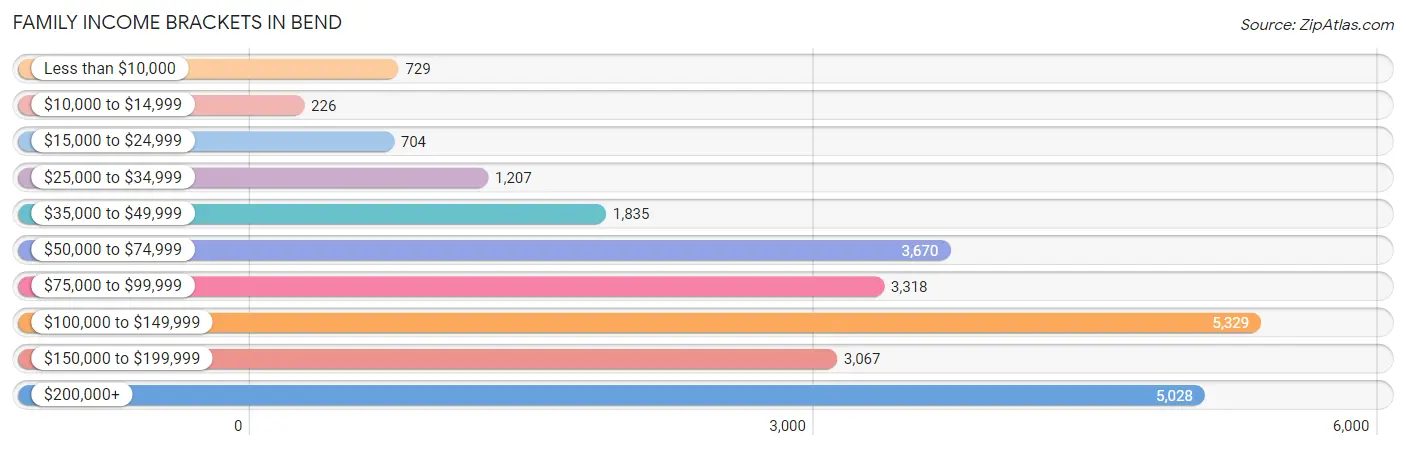
| Income Bracket | # Families | % Families |
| Less than $10,000 | 729 | 2.9% |
| $10,000 to $14,999 | 226 | 0.9% |
| $15,000 to $24,999 | 704 | 2.8% |
| $25,000 to $34,999 | 1,207 | 4.8% |
| $35,000 to $49,999 | 1,835 | 7.3% |
| $50,000 to $74,999 | 3,670 | 14.6% |
| $75,000 to $99,999 | 3,318 | 13.2% |
| $100,000 to $149,999 | 5,329 | 21.2% |
| $150,000 to $199,999 | 3,067 | 12.2% |
| $200,000+ | 5,028 | 20.0% |
Family Income by Famaliy Size in Bend
5-person families (1,244 | 5.0%) account for the highest median family income in Bend with $139,144 per family, while 2-person families (12,971 | 51.6%) have the highest median income of $49,930 per family member.
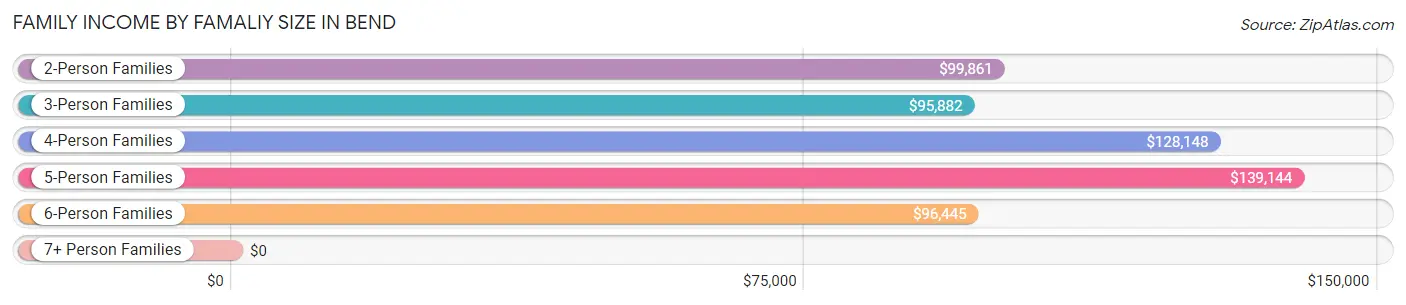
| Income Bracket | # Families | Median Income |
| 2-Person Families | 12,971 (51.6%) | $99,861 |
| 3-Person Families | 5,620 (22.4%) | $95,882 |
| 4-Person Families | 4,693 (18.7%) | $128,148 |
| 5-Person Families | 1,244 (5.0%) | $139,144 |
| 6-Person Families | 360 (1.4%) | $96,445 |
| 7+ Person Families | 251 (1.0%) | $0 |
| Total | 25,139 (100.0%) | $105,957 |
Family Income by Number of Earners in Bend
The median family income in Bend is $105,957, with families comprising 3+ earners (2,442) having the highest median family income of $160,069, while families with 1 earner (6,837) have the lowest median family income of $71,875, accounting for 9.7% and 27.2% of families, respectively.
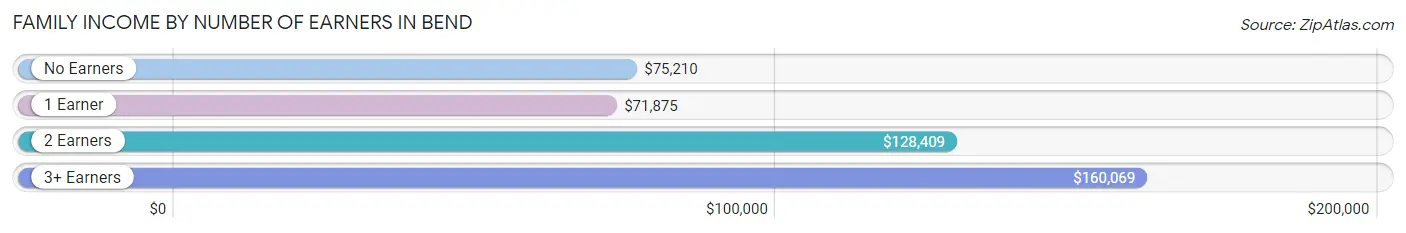
| Number of Earners | # Families | Median Income |
| No Earners | 4,510 (17.9%) | $75,210 |
| 1 Earner | 6,837 (27.2%) | $71,875 |
| 2 Earners | 11,350 (45.2%) | $128,409 |
| 3+ Earners | 2,442 (9.7%) | $160,069 |
| Total | 25,139 (100.0%) | $105,957 |
Household Income in Bend
Household Income Brackets in Bend
With 7,461 households falling in the category, the $50,000 to $74,999 income range is the most frequent in Bend, accounting for 17.7% of all households. In contrast, only 801 households (1.9%) fall into the $10,000 to $14,999 income bracket, making it the least populous group.
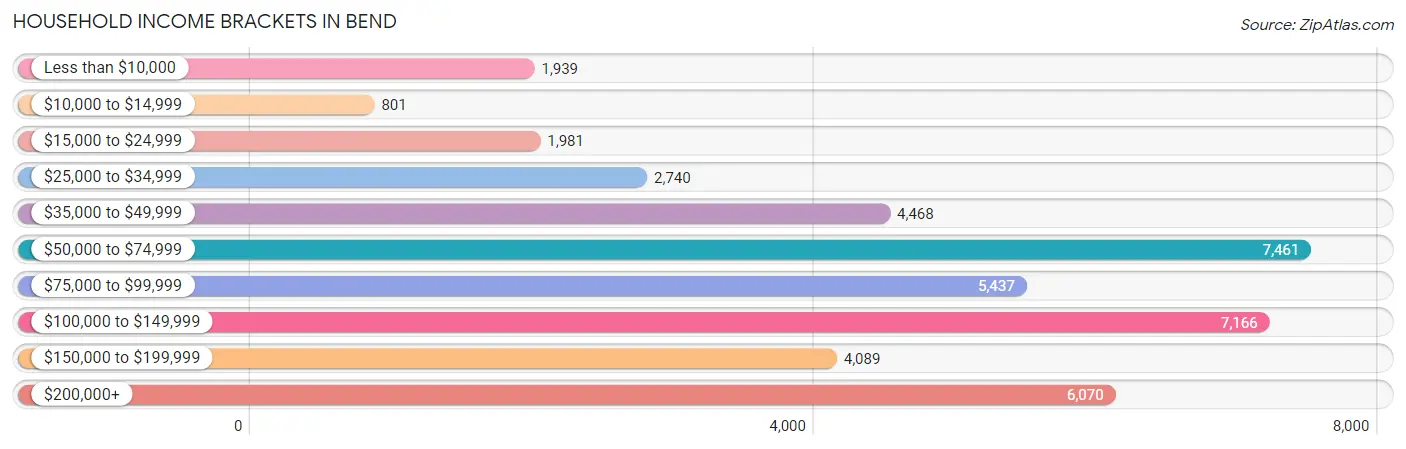
| Income Bracket | # Households | % Households |
| Less than $10,000 | 1,939 | 4.6% |
| $10,000 to $14,999 | 801 | 1.9% |
| $15,000 to $24,999 | 1,981 | 4.7% |
| $25,000 to $34,999 | 2,740 | 6.5% |
| $35,000 to $49,999 | 4,468 | 10.6% |
| $50,000 to $74,999 | 7,461 | 17.7% |
| $75,000 to $99,999 | 5,437 | 12.9% |
| $100,000 to $149,999 | 7,166 | 17.0% |
| $150,000 to $199,999 | 4,089 | 9.7% |
| $200,000+ | 6,070 | 14.4% |
Household Income by Householder Age in Bend
The median household income in Bend is $82,671, with the highest median household income of $99,537 found in the 45 to 64 years age bracket for the primary householder. A total of 14,031 households (33.3%) fall into this category. Meanwhile, the 15 to 24 years age bracket for the primary householder has the lowest median household income of $49,304, with 2,020 households (4.8%) in this group.
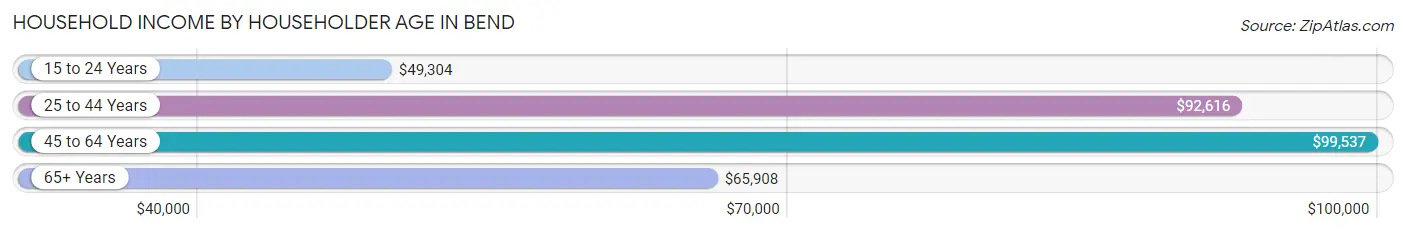
| Income Bracket | # Households | Median Income |
| 15 to 24 Years | 2,020 (4.8%) | $49,304 |
| 25 to 44 Years | 15,209 (36.1%) | $92,616 |
| 45 to 64 Years | 14,031 (33.3%) | $99,537 |
| 65+ Years | 10,891 (25.8%) | $65,908 |
| Total | 42,151 (100.0%) | $82,671 |
Poverty in Bend
Income Below Poverty by Sex and Age in Bend
With 8.5% poverty level for males and 10.6% for females among the residents of Bend, 18 to 24 year old males and 18 to 24 year old females are the most vulnerable to poverty, with 1,044 males (26.7%) and 862 females (24.2%) in their respective age groups living below the poverty level.
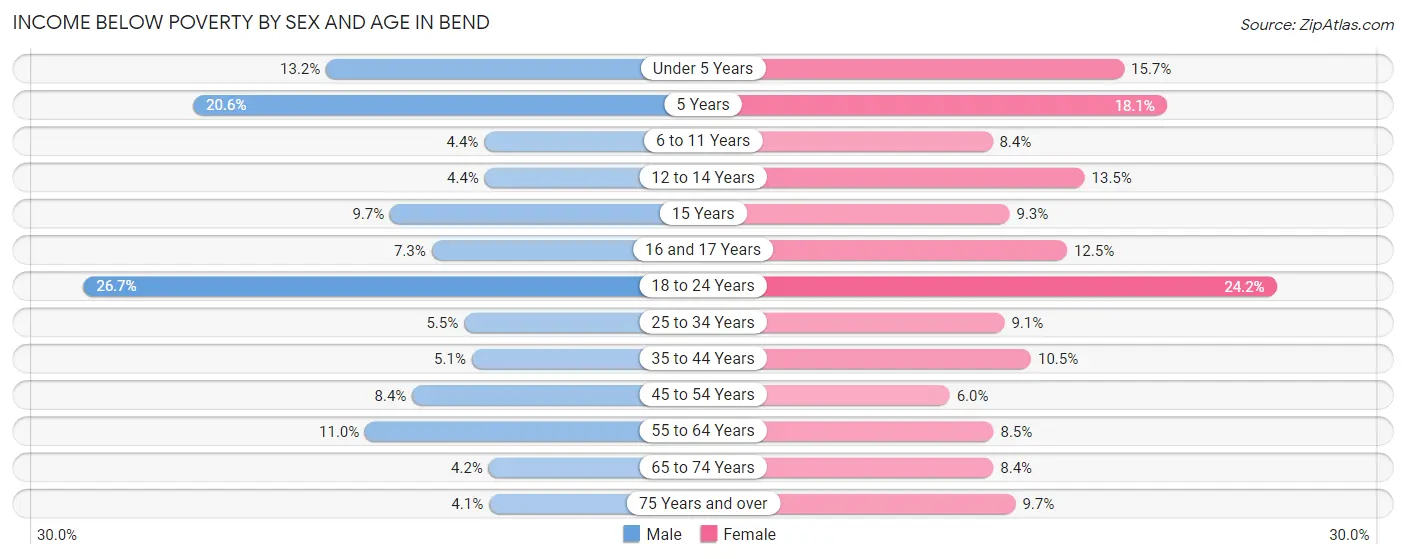
| Age Bracket | Male | Female |
| Under 5 Years | 315 (13.2%) | 398 (15.7%) |
| 5 Years | 152 (20.6%) | 142 (18.1%) |
| 6 to 11 Years | 174 (4.4%) | 245 (8.4%) |
| 12 to 14 Years | 68 (4.4%) | 215 (13.5%) |
| 15 Years | 95 (9.7%) | 77 (9.3%) |
| 16 and 17 Years | 85 (7.3%) | 128 (12.5%) |
| 18 to 24 Years | 1,044 (26.7%) | 862 (24.2%) |
| 25 to 34 Years | 445 (5.5%) | 658 (9.1%) |
| 35 to 44 Years | 381 (5.1%) | 782 (10.5%) |
| 45 to 54 Years | 576 (8.4%) | 372 (6.0%) |
| 55 to 64 Years | 592 (11.0%) | 491 (8.5%) |
| 65 to 74 Years | 196 (4.2%) | 451 (8.4%) |
| 75 Years and over | 121 (4.1%) | 359 (9.7%) |
| Total | 4,244 (8.5%) | 5,180 (10.6%) |
Income Above Poverty by Sex and Age in Bend
According to the poverty statistics in Bend, males aged 75 years and over and females aged 45 to 54 years are the age groups that are most secure financially, with 95.9% of males and 94.0% of females in these age groups living above the poverty line.
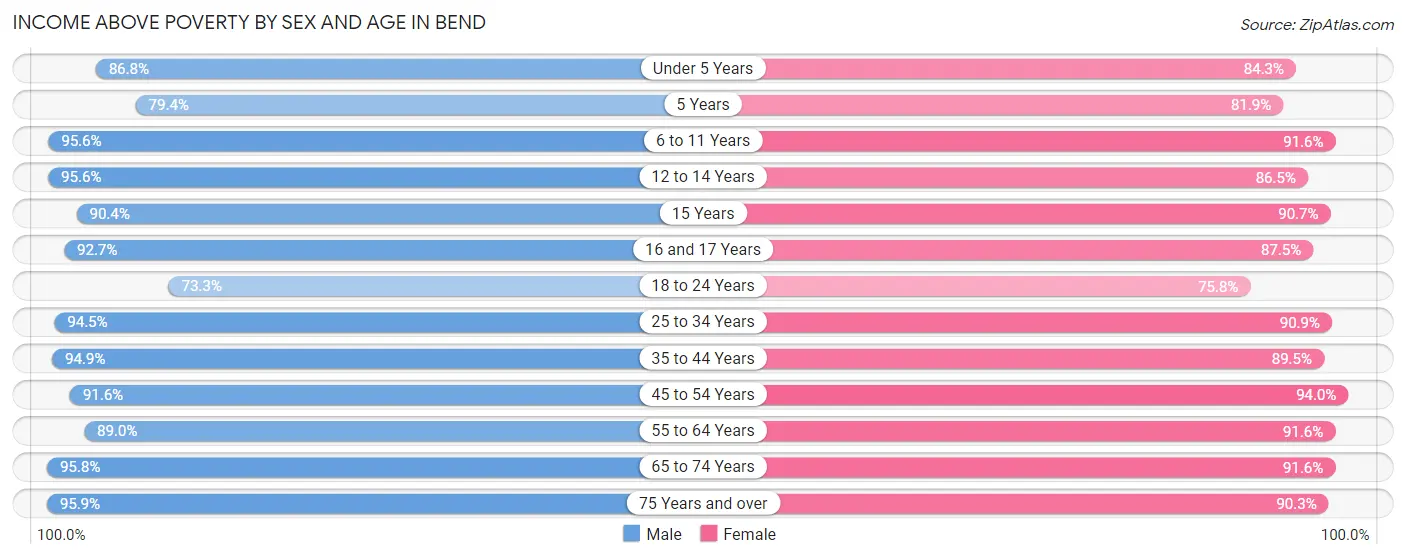
| Age Bracket | Male | Female |
| Under 5 Years | 2,070 (86.8%) | 2,134 (84.3%) |
| 5 Years | 585 (79.4%) | 643 (81.9%) |
| 6 to 11 Years | 3,771 (95.6%) | 2,674 (91.6%) |
| 12 to 14 Years | 1,485 (95.6%) | 1,375 (86.5%) |
| 15 Years | 889 (90.3%) | 747 (90.7%) |
| 16 and 17 Years | 1,073 (92.7%) | 893 (87.5%) |
| 18 to 24 Years | 2,861 (73.3%) | 2,700 (75.8%) |
| 25 to 34 Years | 7,604 (94.5%) | 6,606 (90.9%) |
| 35 to 44 Years | 7,089 (94.9%) | 6,640 (89.5%) |
| 45 to 54 Years | 6,267 (91.6%) | 5,820 (94.0%) |
| 55 to 64 Years | 4,769 (89.0%) | 5,319 (91.5%) |
| 65 to 74 Years | 4,516 (95.8%) | 4,895 (91.6%) |
| 75 Years and over | 2,803 (95.9%) | 3,353 (90.3%) |
| Total | 45,782 (91.5%) | 43,799 (89.4%) |
Income Below Poverty Among Married-Couple Families in Bend
The poverty statistics for married-couple families in Bend show that 2.4% or 472 of the total 19,487 families live below the poverty line. Families with 3 or 4 children have the highest poverty rate of 4.6%, comprising of 42 families. On the other hand, families with 5 or more children have the lowest poverty rate of 0.0%, which includes 0 families.
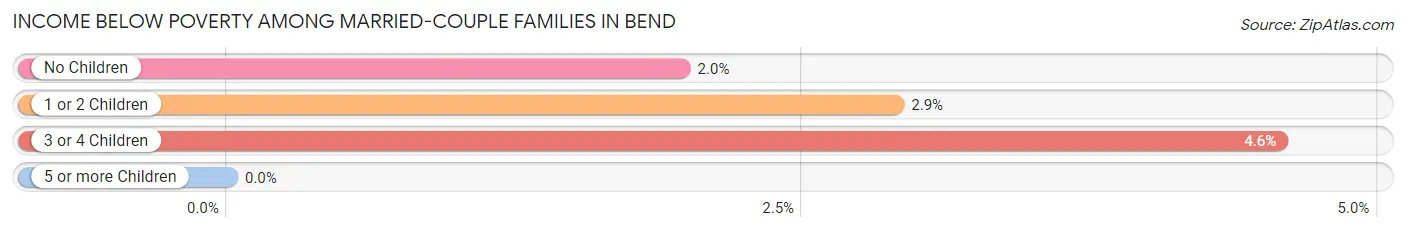
| Children | Above Poverty | Below Poverty |
| No Children | 11,246 (98.0%) | 226 (2.0%) |
| 1 or 2 Children | 6,823 (97.1%) | 204 (2.9%) |
| 3 or 4 Children | 877 (95.4%) | 42 (4.6%) |
| 5 or more Children | 69 (100.0%) | 0 (0.0%) |
| Total | 19,015 (97.6%) | 472 (2.4%) |
Income Below Poverty Among Single-Parent Households in Bend
According to the poverty data in Bend, 9.7% or 217 single-father households and 23.9% or 817 single-mother households are living below the poverty line. Among single-father households, those with 1 or 2 children have the highest poverty rate, with 149 households (12.5%) experiencing poverty. Likewise, among single-mother households, those with 3 or 4 children have the highest poverty rate, with 90 households (58.4%) falling below the poverty line.
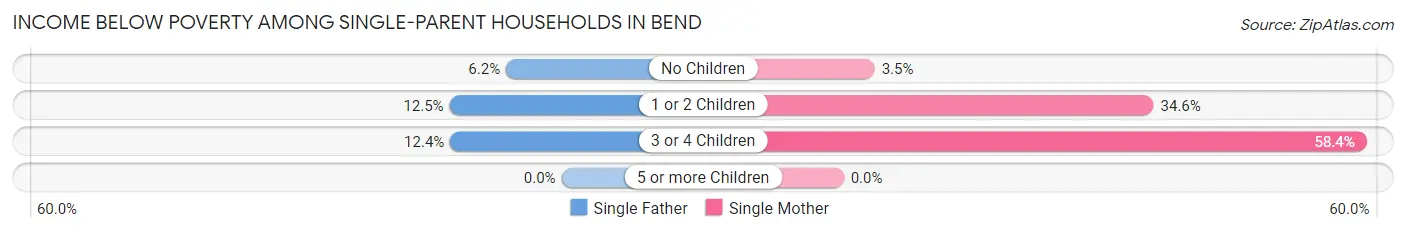
| Children | Single Father | Single Mother |
| No Children | 40 (6.2%) | 45 (3.5%) |
| 1 or 2 Children | 149 (12.5%) | 682 (34.6%) |
| 3 or 4 Children | 28 (12.4%) | 90 (58.4%) |
| 5 or more Children | 0 (0.0%) | 0 (0.0%) |
| Total | 217 (9.7%) | 817 (23.9%) |
Income Below Poverty Among Married-Couple vs Single-Parent Households in Bend
The poverty data for Bend shows that 472 of the married-couple family households (2.4%) and 1,034 of the single-parent households (18.3%) are living below the poverty level. Within the married-couple family households, those with 3 or 4 children have the highest poverty rate, with 42 households (4.6%) falling below the poverty line. Among the single-parent households, those with 3 or 4 children have the highest poverty rate, with 118 household (31.1%) living below poverty.
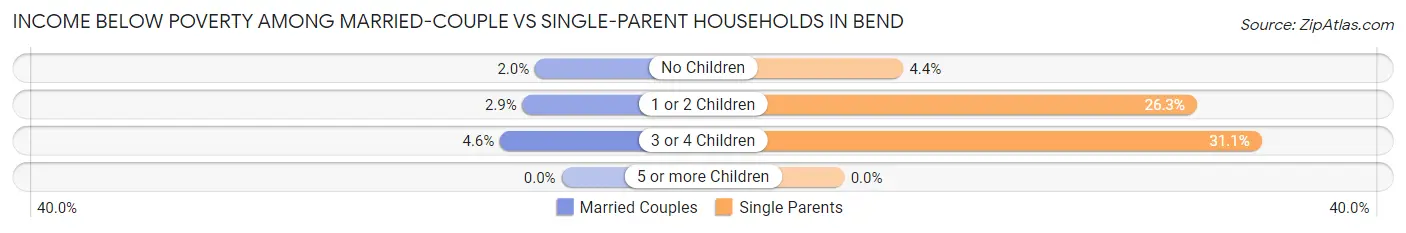
| Children | Married-Couple Families | Single-Parent Households |
| No Children | 226 (2.0%) | 85 (4.4%) |
| 1 or 2 Children | 204 (2.9%) | 831 (26.3%) |
| 3 or 4 Children | 42 (4.6%) | 118 (31.1%) |
| 5 or more Children | 0 (0.0%) | 0 (0.0%) |
| Total | 472 (2.4%) | 1,034 (18.3%) |
Race in Bend
The most populous races in Bend are White / Caucasian (87,801 | 88.3%), Hispanic or Latino (8,919 | 9.0%), and Two or more Races (7,075 | 7.1%).
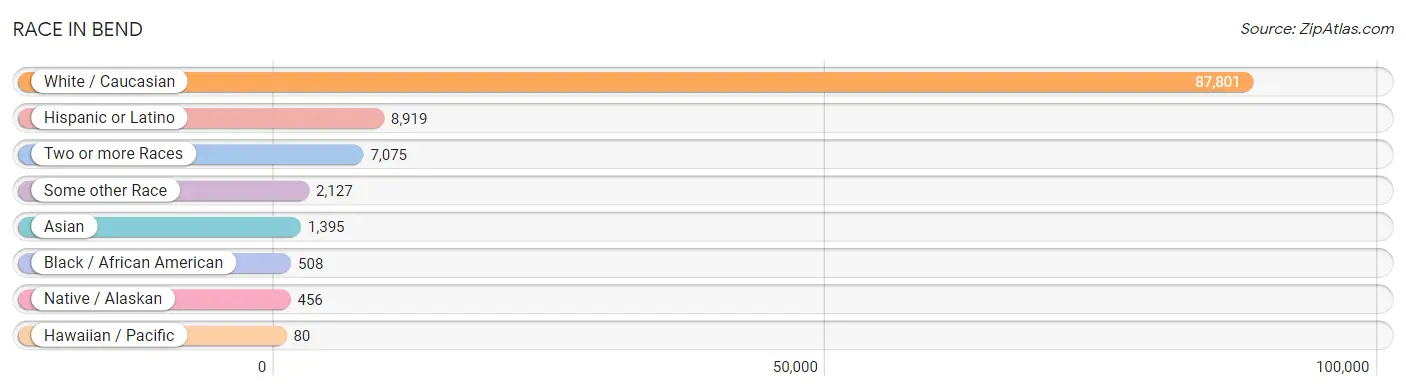
| Race | # Population | % Population |
| Asian | 1,395 | 1.4% |
| Black / African American | 508 | 0.5% |
| Hawaiian / Pacific | 80 | 0.1% |
| Hispanic or Latino | 8,919 | 9.0% |
| Native / Alaskan | 456 | 0.5% |
| White / Caucasian | 87,801 | 88.3% |
| Two or more Races | 7,075 | 7.1% |
| Some other Race | 2,127 | 2.1% |
| Total | 99,442 | 100.0% |
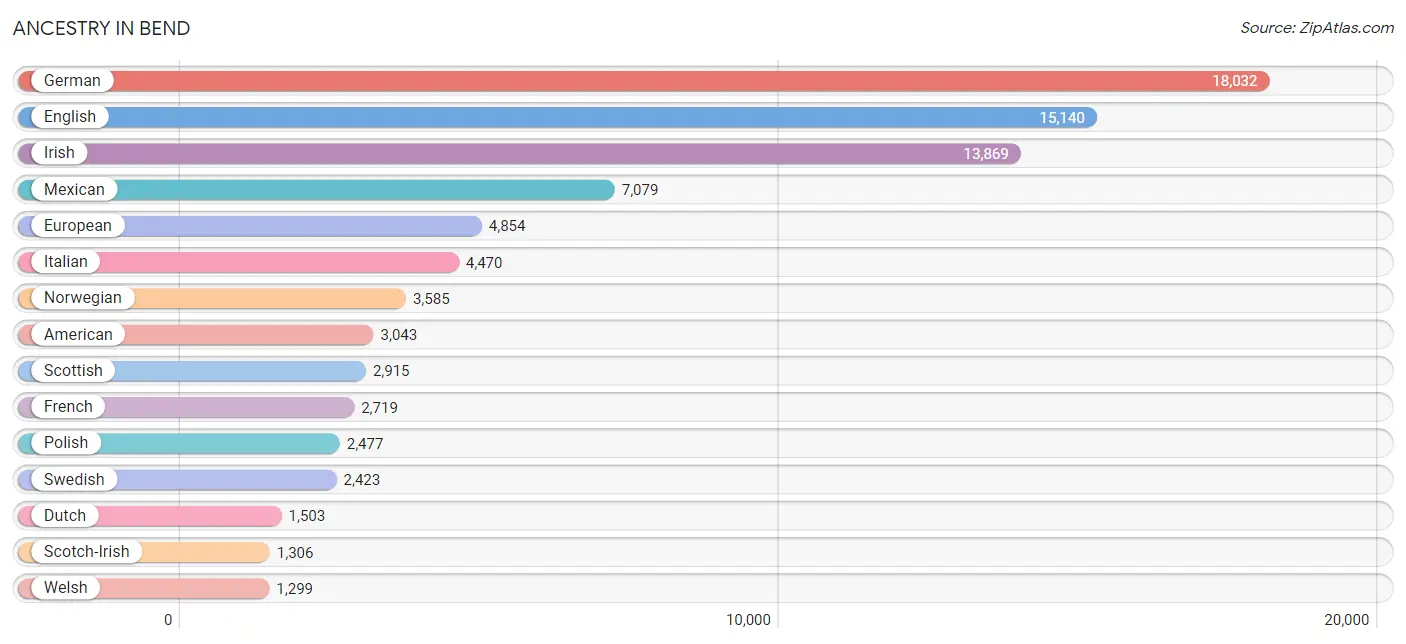
Ancestry in Bend
The most populous ancestries reported in Bend are German (18,032 | 18.1%), English (15,140 | 15.2%), Irish (13,869 | 14.0%), Mexican (7,079 | 7.1%), and European (4,854 | 4.9%), together accounting for 59.3% of all Bend residents.
| Ancestry | # Population | % Population |
| African | 8 | 0.0% |
| American | 3,043 | 3.1% |
| Arab | 293 | 0.3% |
| Argentinean | 53 | 0.1% |
| Armenian | 85 | 0.1% |
| Austrian | 297 | 0.3% |
| Barbadian | 9 | 0.0% |
| Basque | 201 | 0.2% |
| Belgian | 64 | 0.1% |
| Bhutanese | 629 | 0.6% |
| Blackfeet | 75 | 0.1% |
| Brazilian | 40 | 0.0% |
| British | 1,269 | 1.3% |
| Burmese | 453 | 0.5% |
| Cajun | 26 | 0.0% |
| Cambodian | 12 | 0.0% |
| Canadian | 209 | 0.2% |
| Celtic | 32 | 0.0% |
| Central American | 669 | 0.7% |
| Central American Indian | 49 | 0.1% |
| Cherokee | 174 | 0.2% |
| Chilean | 59 | 0.1% |
| Chippewa | 81 | 0.1% |
| Choctaw | 180 | 0.2% |
| Colombian | 95 | 0.1% |
| Comanche | 20 | 0.0% |
| Costa Rican | 68 | 0.1% |
| Cree | 38 | 0.0% |
| Creek | 25 | 0.0% |
| Croatian | 204 | 0.2% |
| Cuban | 24 | 0.0% |
| Czech | 555 | 0.6% |
| Czechoslovakian | 60 | 0.1% |
| Danish | 972 | 1.0% |
| Dutch | 1,503 | 1.5% |
| Eastern European | 376 | 0.4% |
| English | 15,140 | 15.2% |
| Estonian | 34 | 0.0% |
| Ethiopian | 22 | 0.0% |
| European | 4,854 | 4.9% |
| Finnish | 549 | 0.5% |
| French | 2,719 | 2.7% |
| French Canadian | 946 | 0.9% |
| German | 18,032 | 18.1% |
| German Russian | 12 | 0.0% |
| Greek | 459 | 0.5% |
| Guamanian / Chamorro | 28 | 0.0% |
| Guatemalan | 64 | 0.1% |
| Hungarian | 714 | 0.7% |
| Icelander | 166 | 0.2% |
| Indian (Asian) | 538 | 0.5% |
| Indonesian | 44 | 0.0% |
| Inupiat | 134 | 0.1% |
| Iranian | 77 | 0.1% |
| Irish | 13,869 | 14.0% |
| Israeli | 5 | 0.0% |
| Italian | 4,470 | 4.5% |
| Kiowa | 6 | 0.0% |
| Korean | 508 | 0.5% |
| Laotian | 69 | 0.1% |
| Latvian | 48 | 0.1% |
| Lebanese | 209 | 0.2% |
| Lithuanian | 110 | 0.1% |
| Malaysian | 171 | 0.2% |
| Mexican | 7,079 | 7.1% |
| Mexican American Indian | 91 | 0.1% |
| Mongolian | 7 | 0.0% |
| Native Hawaiian | 371 | 0.4% |
| Nicaraguan | 209 | 0.2% |
| Nigerian | 22 | 0.0% |
| Northern European | 740 | 0.7% |
| Norwegian | 3,585 | 3.6% |
| Pakistani | 115 | 0.1% |
| Palestinian | 15 | 0.0% |
| Pennsylvania German | 14 | 0.0% |
| Peruvian | 103 | 0.1% |
| Polish | 2,477 | 2.5% |
| Portuguese | 198 | 0.2% |
| Puerto Rican | 176 | 0.2% |
| Romanian | 87 | 0.1% |
| Russian | 586 | 0.6% |
| Salvadoran | 328 | 0.3% |
| Samoan | 87 | 0.1% |
| Scandinavian | 861 | 0.9% |
| Scotch-Irish | 1,306 | 1.3% |
| Scottish | 2,915 | 2.9% |
| Seminole | 19 | 0.0% |
| Serbian | 174 | 0.2% |
| Sioux | 11 | 0.0% |
| Slavic | 27 | 0.0% |
| Slovak | 188 | 0.2% |
| Slovene | 121 | 0.1% |
| South American | 310 | 0.3% |
| Spaniard | 112 | 0.1% |
| Spanish | 296 | 0.3% |
| Spanish American Indian | 17 | 0.0% |
| Sri Lankan | 377 | 0.4% |
| Subsaharan African | 74 | 0.1% |
| Swedish | 2,423 | 2.4% |
| Swiss | 639 | 0.6% |
| Thai | 25 | 0.0% |
| Tlingit-Haida | 39 | 0.0% |
| Ukrainian | 101 | 0.1% |
| Welsh | 1,299 | 1.3% |
| West Indian | 143 | 0.1% |
| Yaqui | 16 | 0.0% |
| Yugoslavian | 30 | 0.0% | View All 107 Rows |
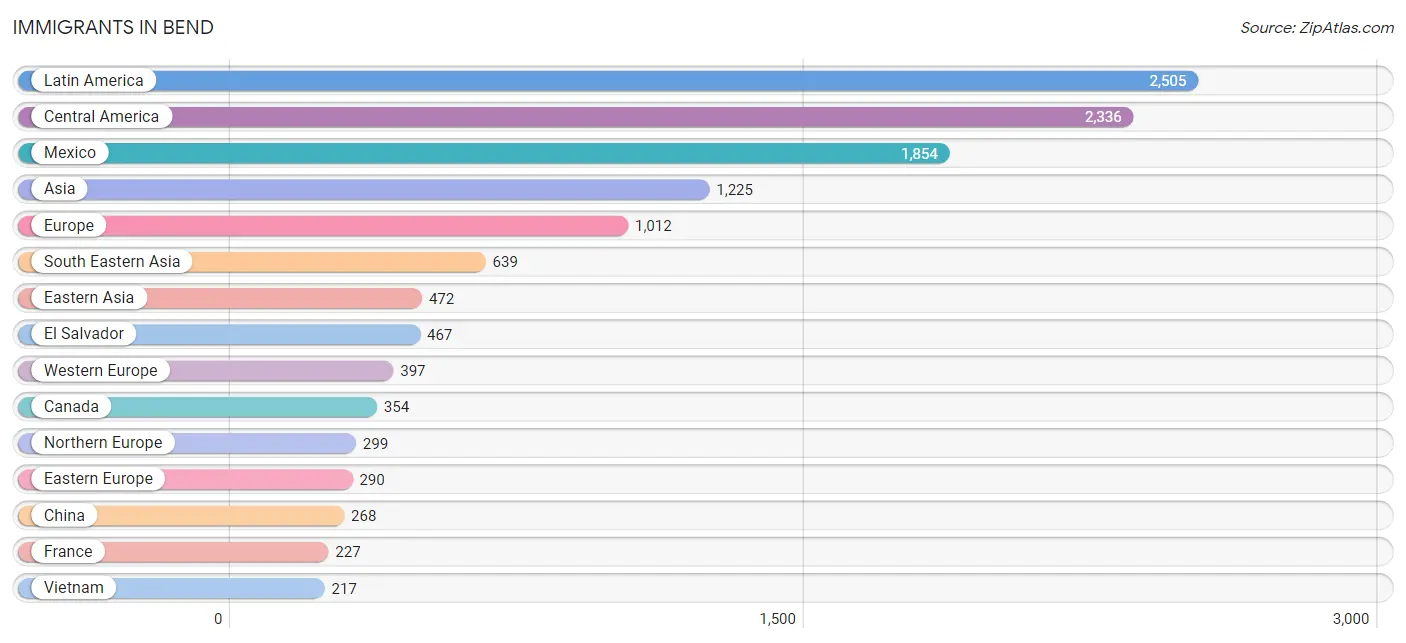
Immigrants in Bend
The most numerous immigrant groups reported in Bend came from Latin America (2,505 | 2.5%), Central America (2,336 | 2.4%), Mexico (1,854 | 1.9%), Asia (1,225 | 1.2%), and Europe (1,012 | 1.0%), together accounting for 9.0% of all Bend residents.
| Immigration Origin | # Population | % Population |
| Africa | 25 | 0.0% |
| Argentina | 51 | 0.1% |
| Asia | 1,225 | 1.2% |
| Australia | 24 | 0.0% |
| Bosnia and Herzegovina | 19 | 0.0% |
| Brazil | 20 | 0.0% |
| Canada | 354 | 0.4% |
| Central America | 2,336 | 2.4% |
| China | 268 | 0.3% |
| Colombia | 64 | 0.1% |
| Croatia | 45 | 0.1% |
| Czechoslovakia | 68 | 0.1% |
| Eastern Asia | 472 | 0.5% |
| Eastern Europe | 290 | 0.3% |
| El Salvador | 467 | 0.5% |
| England | 80 | 0.1% |
| Europe | 1,012 | 1.0% |
| Fiji | 55 | 0.1% |
| France | 227 | 0.2% |
| Germany | 142 | 0.1% |
| Hong Kong | 10 | 0.0% |
| Hungary | 11 | 0.0% |
| India | 13 | 0.0% |
| Indonesia | 8 | 0.0% |
| Israel | 62 | 0.1% |
| Italy | 26 | 0.0% |
| Japan | 38 | 0.0% |
| Korea | 166 | 0.2% |
| Laos | 74 | 0.1% |
| Latin America | 2,505 | 2.5% |
| Lebanon | 39 | 0.0% |
| Malaysia | 7 | 0.0% |
| Mexico | 1,854 | 1.9% |
| Netherlands | 28 | 0.0% |
| Nicaragua | 15 | 0.0% |
| Northern Europe | 299 | 0.3% |
| Oceania | 79 | 0.1% |
| Peru | 34 | 0.0% |
| Philippines | 208 | 0.2% |
| Romania | 67 | 0.1% |
| Russia | 61 | 0.1% |
| Serbia | 19 | 0.0% |
| South Africa | 25 | 0.0% |
| South America | 169 | 0.2% |
| South Central Asia | 13 | 0.0% |
| South Eastern Asia | 639 | 0.6% |
| Southern Europe | 26 | 0.0% |
| Sweden | 14 | 0.0% |
| Taiwan | 34 | 0.0% |
| Thailand | 81 | 0.1% |
| Vietnam | 217 | 0.2% |
| Western Asia | 101 | 0.1% |
| Western Europe | 397 | 0.4% | View All 53 Rows |
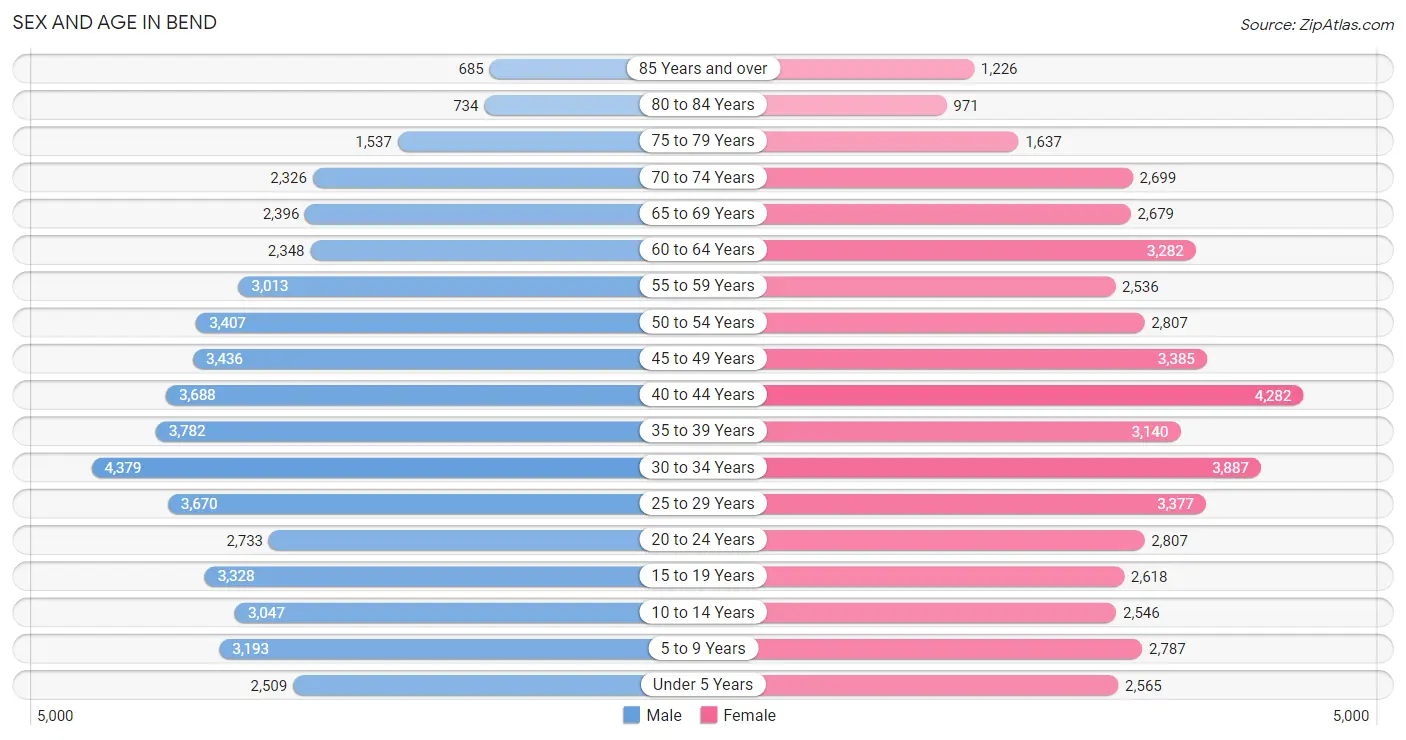
Sex and Age in Bend
Sex and Age in Bend
The most populous age groups in Bend are 30 to 34 Years (4,379 | 8.7%) for men and 40 to 44 Years (4,282 | 8.7%) for women.
| Age Bracket | Male | Female |
| Under 5 Years | 2,509 (5.0%) | 2,565 (5.2%) |
| 5 to 9 Years | 3,193 (6.4%) | 2,787 (5.7%) |
| 10 to 14 Years | 3,047 (6.1%) | 2,546 (5.2%) |
| 15 to 19 Years | 3,328 (6.6%) | 2,618 (5.3%) |
| 20 to 24 Years | 2,733 (5.4%) | 2,807 (5.7%) |
| 25 to 29 Years | 3,670 (7.3%) | 3,377 (6.9%) |
| 30 to 34 Years | 4,379 (8.7%) | 3,887 (7.9%) |
| 35 to 39 Years | 3,782 (7.5%) | 3,140 (6.4%) |
| 40 to 44 Years | 3,688 (7.3%) | 4,282 (8.7%) |
| 45 to 49 Years | 3,436 (6.8%) | 3,385 (6.9%) |
| 50 to 54 Years | 3,407 (6.8%) | 2,807 (5.7%) |
| 55 to 59 Years | 3,013 (6.0%) | 2,536 (5.1%) |
| 60 to 64 Years | 2,348 (4.7%) | 3,282 (6.7%) |
| 65 to 69 Years | 2,396 (4.8%) | 2,679 (5.4%) |
| 70 to 74 Years | 2,326 (4.6%) | 2,699 (5.5%) |
| 75 to 79 Years | 1,537 (3.1%) | 1,637 (3.3%) |
| 80 to 84 Years | 734 (1.5%) | 971 (2.0%) |
| 85 Years and over | 685 (1.4%) | 1,226 (2.5%) |
| Total | 50,211 (100.0%) | 49,231 (100.0%) |
Families and Households in Bend
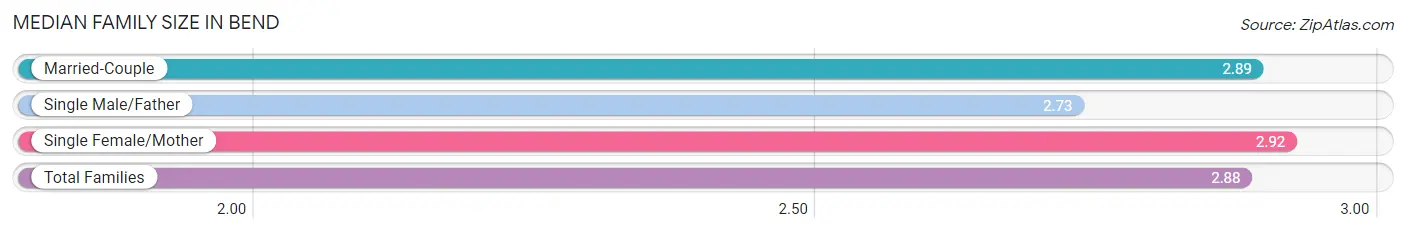
Median Family Size in Bend
The median family size in Bend is 2.88 persons per family, with single female/mother families (3,419 | 13.6%) accounting for the largest median family size of 2.92 persons per family. On the other hand, single male/father families (2,233 | 8.9%) represent the smallest median family size with 2.73 persons per family.
| Family Type | # Families | Family Size |
| Married-Couple | 19,487 (77.5%) | 2.89 |
| Single Male/Father | 2,233 (8.9%) | 2.73 |
| Single Female/Mother | 3,419 (13.6%) | 2.92 |
| Total Families | 25,139 (100.0%) | 2.88 |
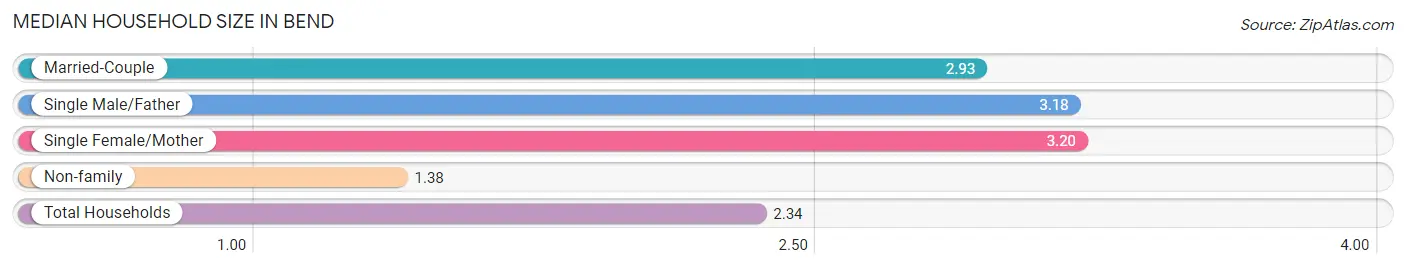
Median Household Size in Bend
The median household size in Bend is 2.34 persons per household, with single female/mother households (3,419 | 8.1%) accounting for the largest median household size of 3.2 persons per household. non-family households (17,012 | 40.4%) represent the smallest median household size with 1.38 persons per household.
| Household Type | # Households | Household Size |
| Married-Couple | 19,487 (46.2%) | 2.93 |
| Single Male/Father | 2,233 (5.3%) | 3.18 |
| Single Female/Mother | 3,419 (8.1%) | 3.20 |
| Non-family | 17,012 (40.4%) | 1.38 |
| Total Households | 42,151 (100.0%) | 2.34 |
Household Size by Marriage Status in Bend
Out of a total of 42,151 households in Bend, 25,139 (59.6%) are family households, while 17,012 (40.4%) are nonfamily households. The most numerous type of family households are 2-person households, comprising 11,949, and the most common type of nonfamily households are 1-person households, comprising 12,213.
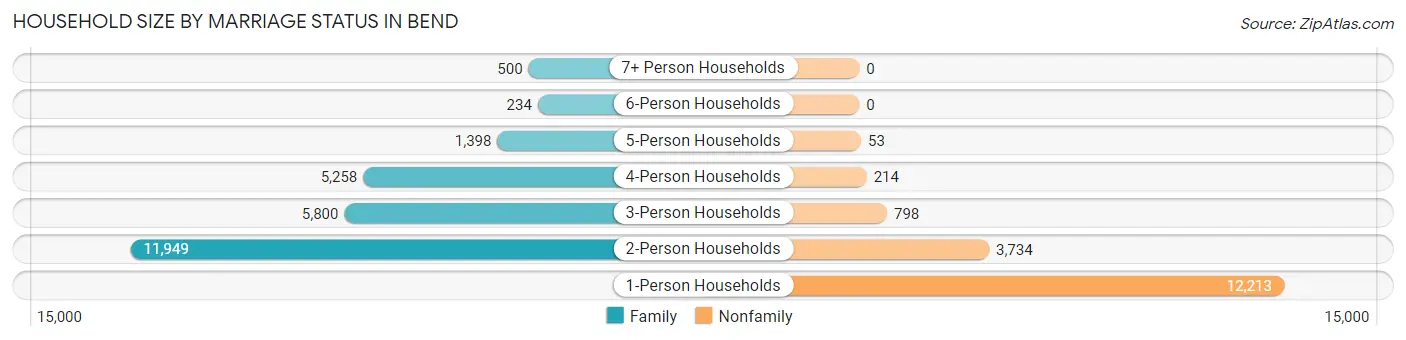
| Household Size | Family Households | Nonfamily Households |
| 1-Person Households | - | 12,213 (29.0%) |
| 2-Person Households | 11,949 (28.3%) | 3,734 (8.9%) |
| 3-Person Households | 5,800 (13.8%) | 798 (1.9%) |
| 4-Person Households | 5,258 (12.5%) | 214 (0.5%) |
| 5-Person Households | 1,398 (3.3%) | 53 (0.1%) |
| 6-Person Households | 234 (0.6%) | 0 (0.0%) |
| 7+ Person Households | 500 (1.2%) | 0 (0.0%) |
| Total | 25,139 (59.6%) | 17,012 (40.4%) |
Female Fertility in Bend
Fertility by Age in Bend
Average fertility rate in Bend is 43.0 births per 1,000 women. Women in the age bracket of 20 to 34 years have the highest fertility rate with 49.0 births per 1,000 women. Women in the age bracket of 20 to 34 years acount for 47.3% of all women with births.
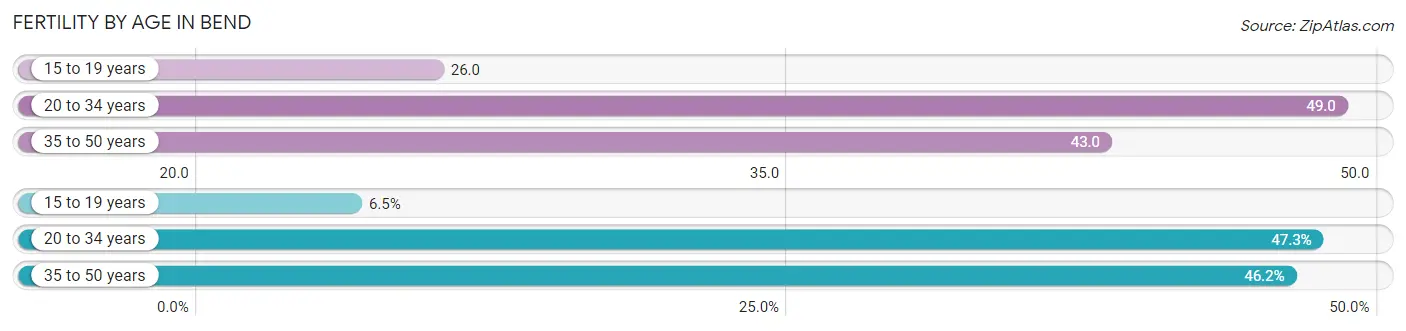
| Age Bracket | Women with Births | Births / 1,000 Women |
| 15 to 19 years | 68 (6.5%) | 26.0 |
| 20 to 34 years | 493 (47.3%) | 49.0 |
| 35 to 50 years | 481 (46.2%) | 43.0 |
| Total | 1,042 (100.0%) | 43.0 |
Fertility by Age by Marriage Status in Bend
81.3% of women with births (1,042) in Bend are married. The highest percentage of unmarried women with births falls into 20 to 34 years age bracket with 22.7% of them unmarried at the time of birth, while the lowest percentage of unmarried women with births belong to 15 to 19 years age bracket with 2.9% of them unmarried.
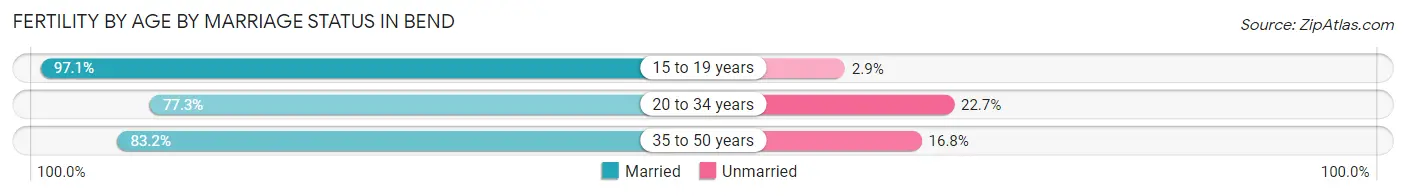
| Age Bracket | Married | Unmarried |
| 15 to 19 years | 66 (97.1%) | 2 (2.9%) |
| 20 to 34 years | 381 (77.3%) | 112 (22.7%) |
| 35 to 50 years | 400 (83.2%) | 81 (16.8%) |
| Total | 847 (81.3%) | 195 (18.7%) |
Fertility by Education in Bend
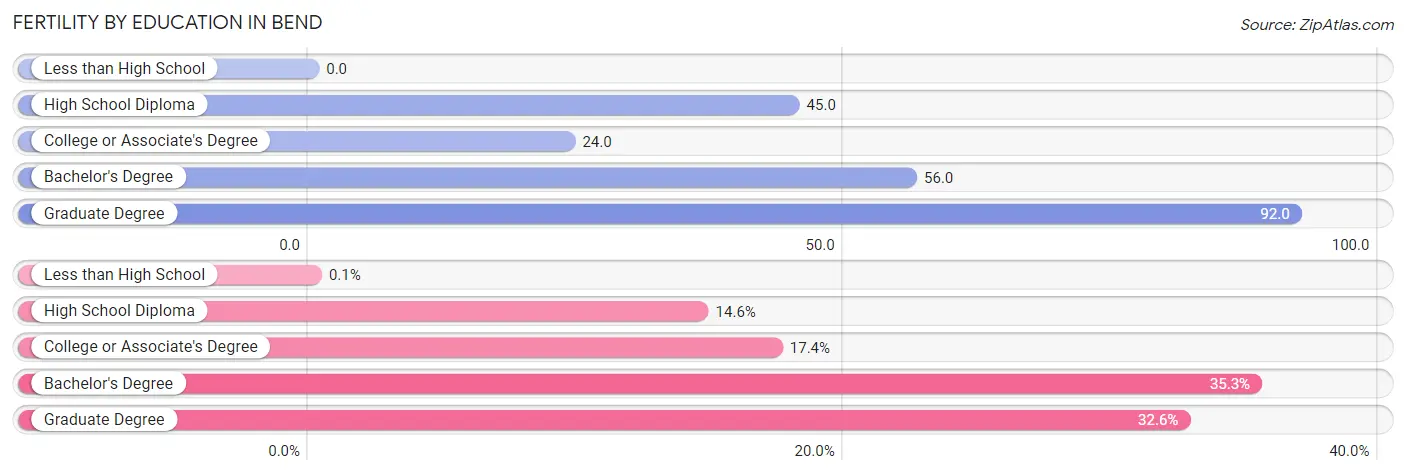
| Educational Attainment | Women with Births | Births / 1,000 Women |
| Less than High School | 1 (0.1%) | 0.0 |
| High School Diploma | 152 (14.6%) | 45.0 |
| College or Associate's Degree | 181 (17.4%) | 24.0 |
| Bachelor's Degree | 368 (35.3%) | 56.0 |
| Graduate Degree | 340 (32.6%) | 92.0 |
| Total | 1,042 (100.0%) | 43.0 |
Fertility by Education by Marriage Status in Bend
18.7% of women with births in Bend are unmarried. Women with the educational attainment of bachelor's degree are most likely to be married with 93.5% of them married at childbirth, while women with the educational attainment of less than high school are least likely to be married with 100.0% of them unmarried at childbirth.
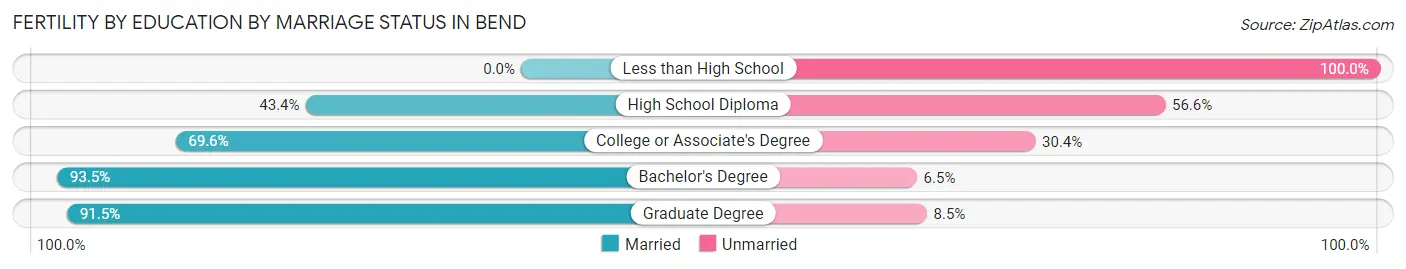
| Educational Attainment | Married | Unmarried |
| Less than High School | 0 (0.0%) | 1 (100.0%) |
| High School Diploma | 66 (43.4%) | 86 (56.6%) |
| College or Associate's Degree | 126 (69.6%) | 55 (30.4%) |
| Bachelor's Degree | 344 (93.5%) | 24 (6.5%) |
| Graduate Degree | 311 (91.5%) | 29 (8.5%) |
| Total | 847 (81.3%) | 195 (18.7%) |
Employment Characteristics in Bend
Employment by Class of Employer in Bend
Among the 51,959 employed individuals in Bend, private company employees (33,047 | 63.6%), self-employed (not incorporated) (5,047 | 9.7%), and not-for-profit organizations (4,242 | 8.2%) make up the most common classes of employment.
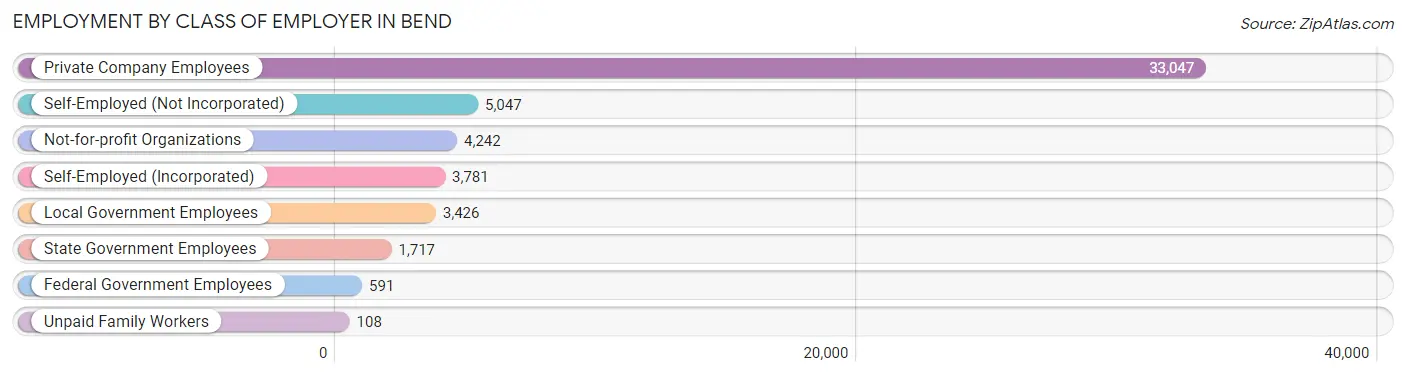
| Employer Class | # Employees | % Employees |
| Private Company Employees | 33,047 | 63.6% |
| Self-Employed (Incorporated) | 3,781 | 7.3% |
| Self-Employed (Not Incorporated) | 5,047 | 9.7% |
| Not-for-profit Organizations | 4,242 | 8.2% |
| Local Government Employees | 3,426 | 6.6% |
| State Government Employees | 1,717 | 3.3% |
| Federal Government Employees | 591 | 1.1% |
| Unpaid Family Workers | 108 | 0.2% |
| Total | 51,959 | 100.0% |
Employment Status by Age in Bend
According to the labor force statistics for Bend, out of the total population over 16 years of age (80,986), 68.1% or 55,151 individuals are in the labor force, with 3.8% or 2,096 of them unemployed. The age group with the highest labor force participation rate is 30 to 34 years, with 91.8% or 7,588 individuals in the labor force. Within the labor force, the 65 to 74 years age range has the highest percentage of unemployed individuals, with 11.1% or 295 of them being unemployed.
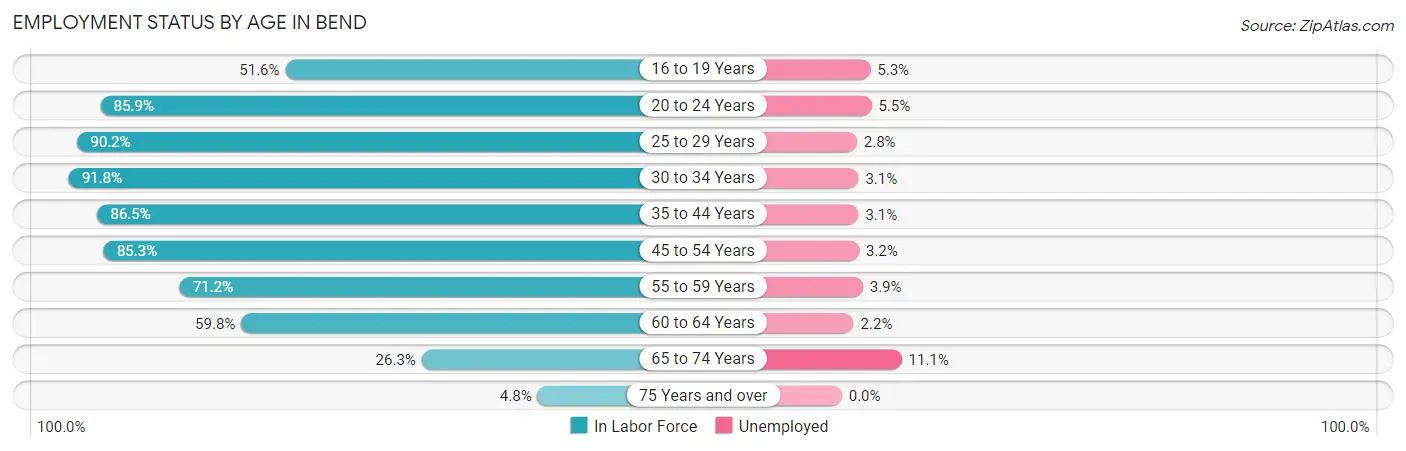
| Age Bracket | In Labor Force | Unemployed |
| 16 to 19 Years | 2,135 (51.6%) | 113 (5.3%) |
| 20 to 24 Years | 4,759 (85.9%) | 262 (5.5%) |
| 25 to 29 Years | 6,356 (90.2%) | 178 (2.8%) |
| 30 to 34 Years | 7,588 (91.8%) | 235 (3.1%) |
| 35 to 44 Years | 12,882 (86.5%) | 399 (3.1%) |
| 45 to 54 Years | 11,119 (85.3%) | 356 (3.2%) |
| 55 to 59 Years | 3,951 (71.2%) | 154 (3.9%) |
| 60 to 64 Years | 3,367 (59.8%) | 74 (2.2%) |
| 65 to 74 Years | 2,656 (26.3%) | 295 (11.1%) |
| 75 Years and over | 326 (4.8%) | 0 (0.0%) |
| Total | 55,151 (68.1%) | 2,096 (3.8%) |
Employment Status by Educational Attainment in Bend
According to labor force statistics for Bend, 83.2% of individuals (45,277) out of the total population between 25 and 64 years of age (54,419) are in the labor force, with 3.1% or 1,404 of them being unemployed. The group with the highest labor force participation rate are those with the educational attainment of bachelor's degree or higher, with 87.8% or 23,471 individuals in the labor force. Within the labor force, individuals with high school diploma education have the highest percentage of unemployment, with 4.5% or 284 of them being unemployed.
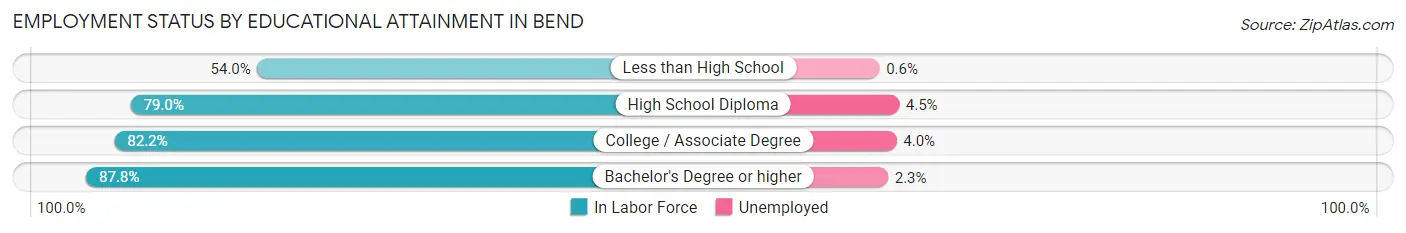
| Educational Attainment | In Labor Force | Unemployed |
| Less than High School | 1,317 (54.0%) | 15 (0.6%) |
| High School Diploma | 6,311 (79.0%) | 359 (4.5%) |
| College / Associate Degree | 14,189 (82.2%) | 690 (4.0%) |
| Bachelor's Degree or higher | 23,471 (87.8%) | 615 (2.3%) |
| Total | 45,277 (83.2%) | 1,687 (3.1%) |
Employment Occupations by Sex in Bend
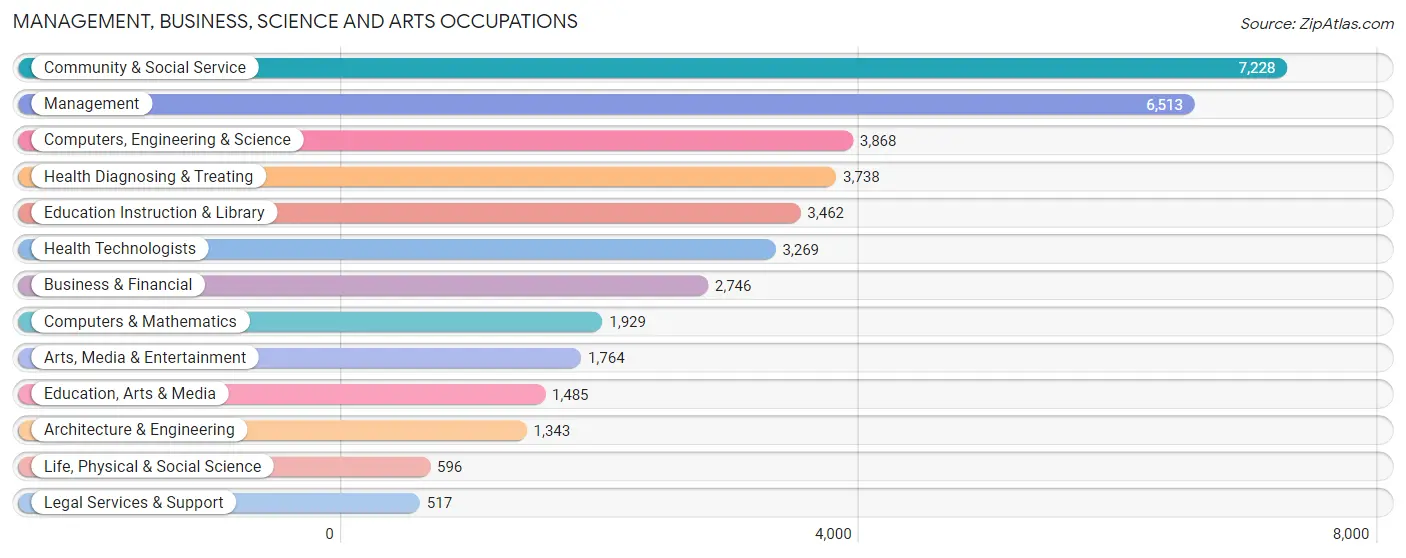
Management, Business, Science and Arts Occupations
The most common Management, Business, Science and Arts occupations in Bend are Community & Social Service (7,228 | 13.6%), Management (6,513 | 12.3%), Computers, Engineering & Science (3,868 | 7.3%), Health Diagnosing & Treating (3,738 | 7.0%), and Education Instruction & Library (3,462 | 6.5%).
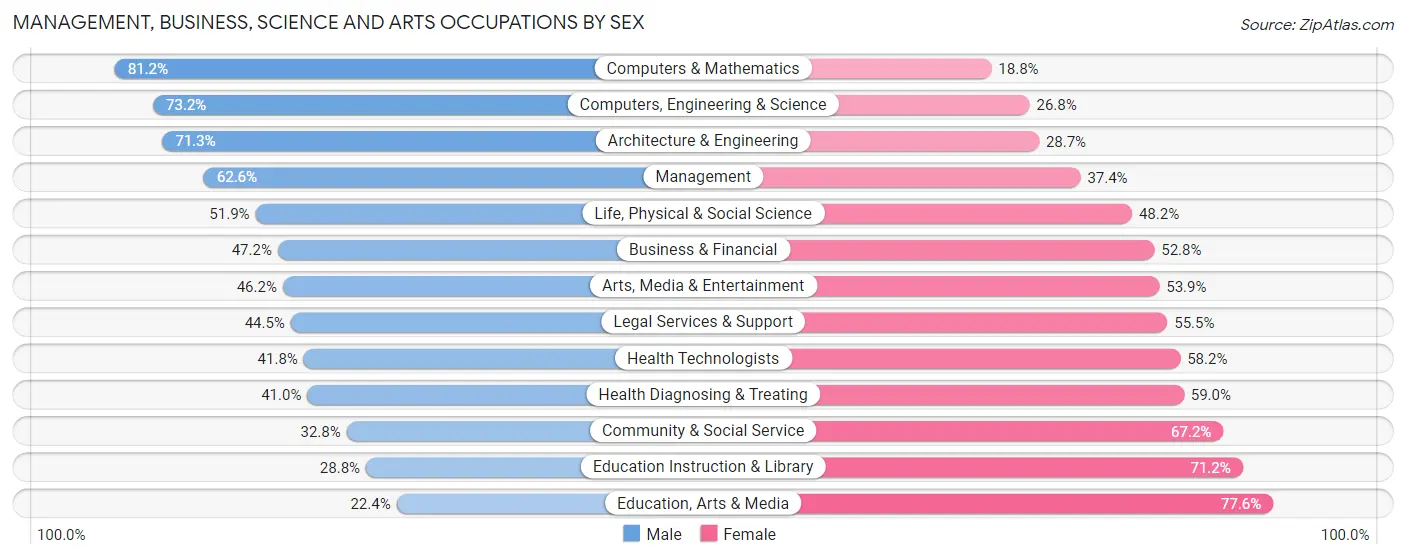
Management, Business, Science and Arts Occupations by Sex
Within the Management, Business, Science and Arts occupations in Bend, the most male-oriented occupations are Computers & Mathematics (81.2%), Computers, Engineering & Science (73.2%), and Architecture & Engineering (71.3%), while the most female-oriented occupations are Education, Arts & Media (77.6%), Education Instruction & Library (71.2%), and Community & Social Service (67.2%).
| Occupation | Male | Female |
| Management | 4,077 (62.6%) | 2,436 (37.4%) |
| Business & Financial | 1,296 (47.2%) | 1,450 (52.8%) |
| Computers, Engineering & Science | 2,832 (73.2%) | 1,036 (26.8%) |
| Computers & Mathematics | 1,566 (81.2%) | 363 (18.8%) |
| Architecture & Engineering | 957 (71.3%) | 386 (28.7%) |
| Life, Physical & Social Science | 309 (51.8%) | 287 (48.1%) |
| Community & Social Service | 2,374 (32.8%) | 4,854 (67.2%) |
| Education, Arts & Media | 333 (22.4%) | 1,152 (77.6%) |
| Legal Services & Support | 230 (44.5%) | 287 (55.5%) |
| Education Instruction & Library | 997 (28.8%) | 2,465 (71.2%) |
| Arts, Media & Entertainment | 814 (46.2%) | 950 (53.8%) |
| Health Diagnosing & Treating | 1,534 (41.0%) | 2,204 (59.0%) |
| Health Technologists | 1,366 (41.8%) | 1,903 (58.2%) |
| Total (Category) | 12,113 (50.3%) | 11,980 (49.7%) |
| Total (Overall) | 28,032 (52.9%) | 24,975 (47.1%) |
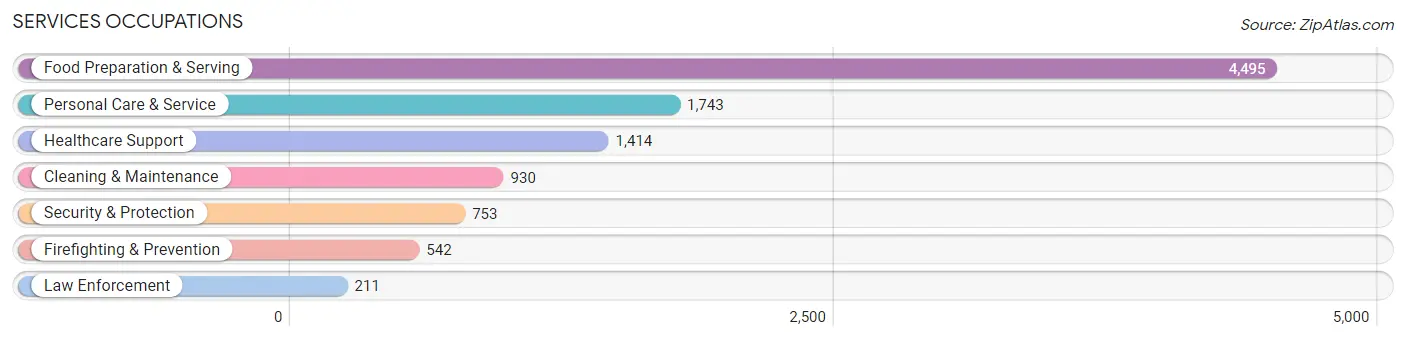
Services Occupations
The most common Services occupations in Bend are Food Preparation & Serving (4,495 | 8.5%), Personal Care & Service (1,743 | 3.3%), Healthcare Support (1,414 | 2.7%), Cleaning & Maintenance (930 | 1.8%), and Security & Protection (753 | 1.4%).
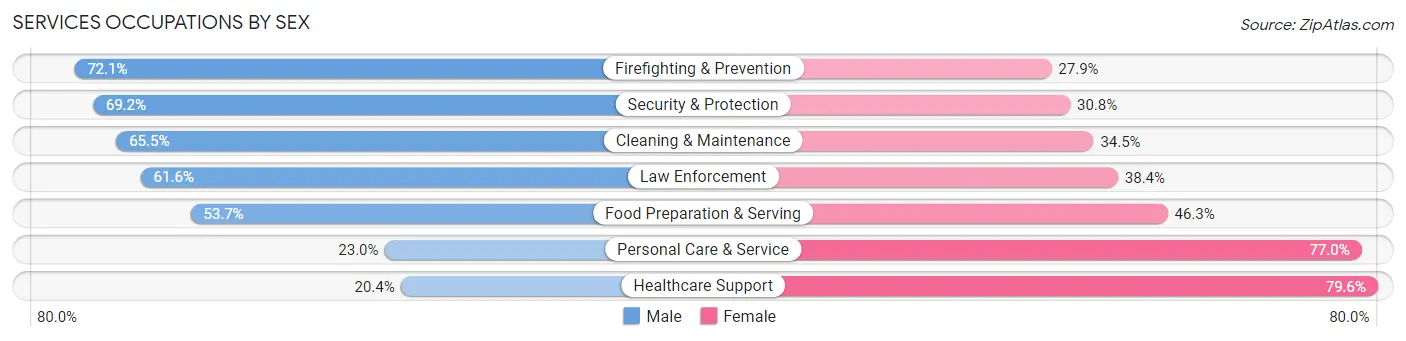
Services Occupations by Sex
Within the Services occupations in Bend, the most male-oriented occupations are Firefighting & Prevention (72.1%), Security & Protection (69.2%), and Cleaning & Maintenance (65.5%), while the most female-oriented occupations are Healthcare Support (79.6%), Personal Care & Service (77.0%), and Food Preparation & Serving (46.3%).
| Occupation | Male | Female |
| Healthcare Support | 289 (20.4%) | 1,125 (79.6%) |
| Security & Protection | 521 (69.2%) | 232 (30.8%) |
| Firefighting & Prevention | 391 (72.1%) | 151 (27.9%) |
| Law Enforcement | 130 (61.6%) | 81 (38.4%) |
| Food Preparation & Serving | 2,415 (53.7%) | 2,080 (46.3%) |
| Cleaning & Maintenance | 609 (65.5%) | 321 (34.5%) |
| Personal Care & Service | 401 (23.0%) | 1,342 (77.0%) |
| Total (Category) | 4,235 (45.4%) | 5,100 (54.6%) |
| Total (Overall) | 28,032 (52.9%) | 24,975 (47.1%) |
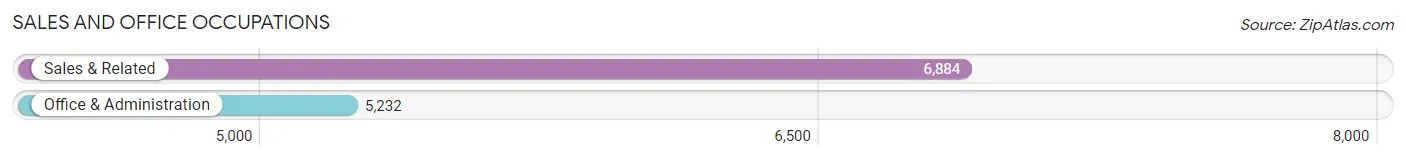
Sales and Office Occupations
The most common Sales and Office occupations in Bend are Sales & Related (6,884 | 13.0%), and Office & Administration (5,232 | 9.9%).
Sales and Office Occupations by Sex
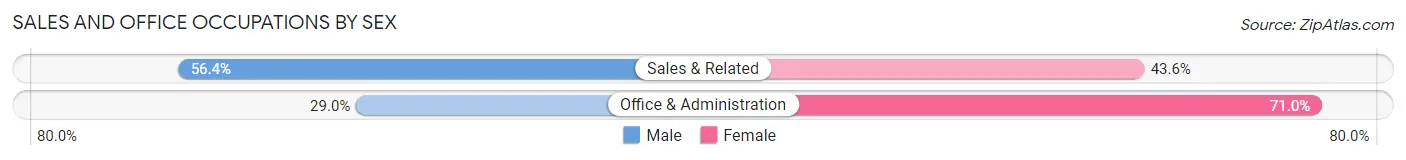
| Occupation | Male | Female |
| Sales & Related | 3,885 (56.4%) | 2,999 (43.6%) |
| Office & Administration | 1,517 (29.0%) | 3,715 (71.0%) |
| Total (Category) | 5,402 (44.6%) | 6,714 (55.4%) |
| Total (Overall) | 28,032 (52.9%) | 24,975 (47.1%) |
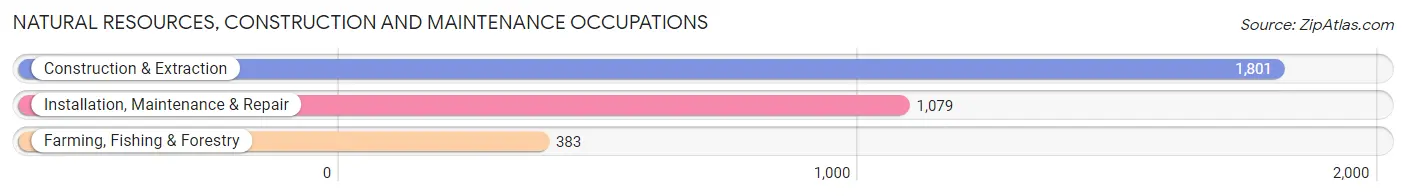
Natural Resources, Construction and Maintenance Occupations
The most common Natural Resources, Construction and Maintenance occupations in Bend are Construction & Extraction (1,801 | 3.4%), Installation, Maintenance & Repair (1,079 | 2.0%), and Farming, Fishing & Forestry (383 | 0.7%).
Natural Resources, Construction and Maintenance Occupations by Sex
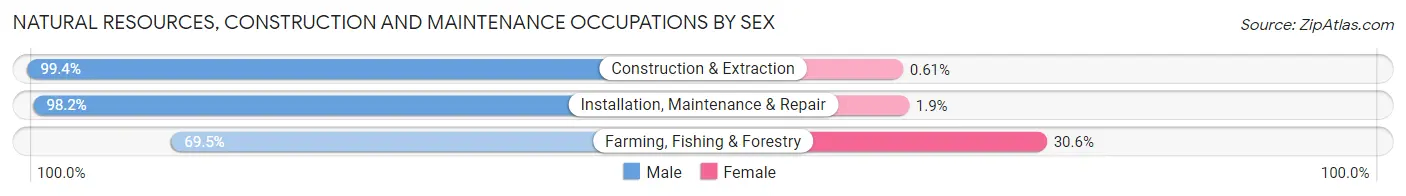
| Occupation | Male | Female |
| Farming, Fishing & Forestry | 266 (69.5%) | 117 (30.5%) |
| Construction & Extraction | 1,790 (99.4%) | 11 (0.6%) |
| Installation, Maintenance & Repair | 1,059 (98.2%) | 20 (1.8%) |
| Total (Category) | 3,115 (95.5%) | 148 (4.5%) |
| Total (Overall) | 28,032 (52.9%) | 24,975 (47.1%) |
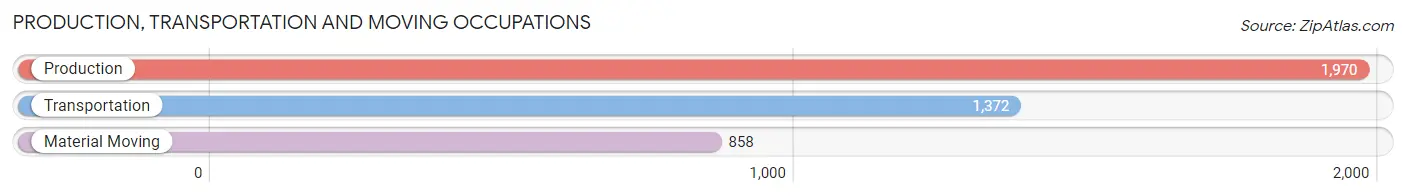
Production, Transportation and Moving Occupations
The most common Production, Transportation and Moving occupations in Bend are Production (1,970 | 3.7%), Transportation (1,372 | 2.6%), and Material Moving (858 | 1.6%).
Production, Transportation and Moving Occupations by Sex
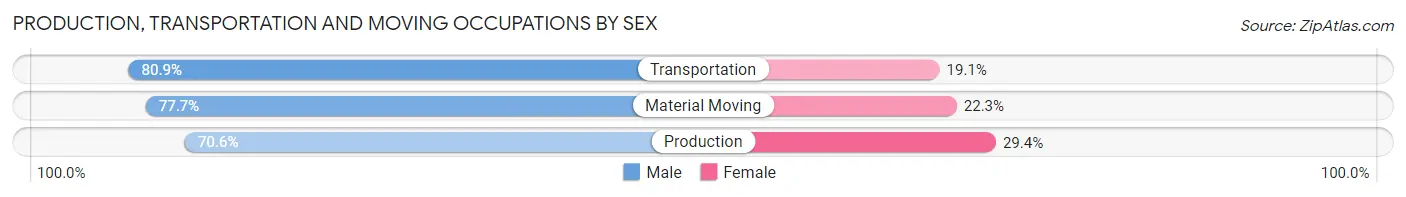
| Occupation | Male | Female |
| Production | 1,390 (70.6%) | 580 (29.4%) |
| Transportation | 1,110 (80.9%) | 262 (19.1%) |
| Material Moving | 667 (77.7%) | 191 (22.3%) |
| Total (Category) | 3,167 (75.4%) | 1,033 (24.6%) |
| Total (Overall) | 28,032 (52.9%) | 24,975 (47.1%) |
Employment Industries by Sex in Bend
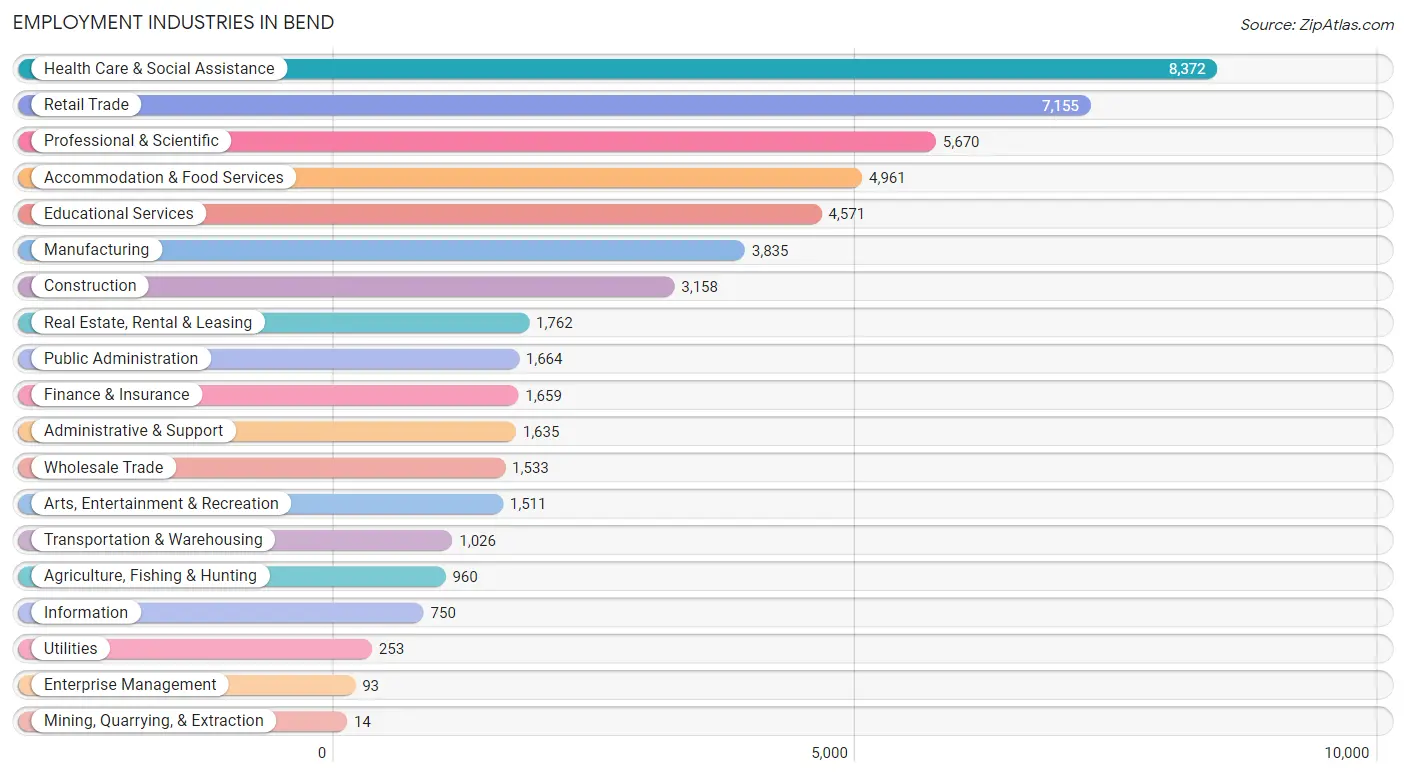
Employment Industries in Bend
The major employment industries in Bend include Health Care & Social Assistance (8,372 | 15.8%), Retail Trade (7,155 | 13.5%), Professional & Scientific (5,670 | 10.7%), Accommodation & Food Services (4,961 | 9.4%), and Educational Services (4,571 | 8.6%).
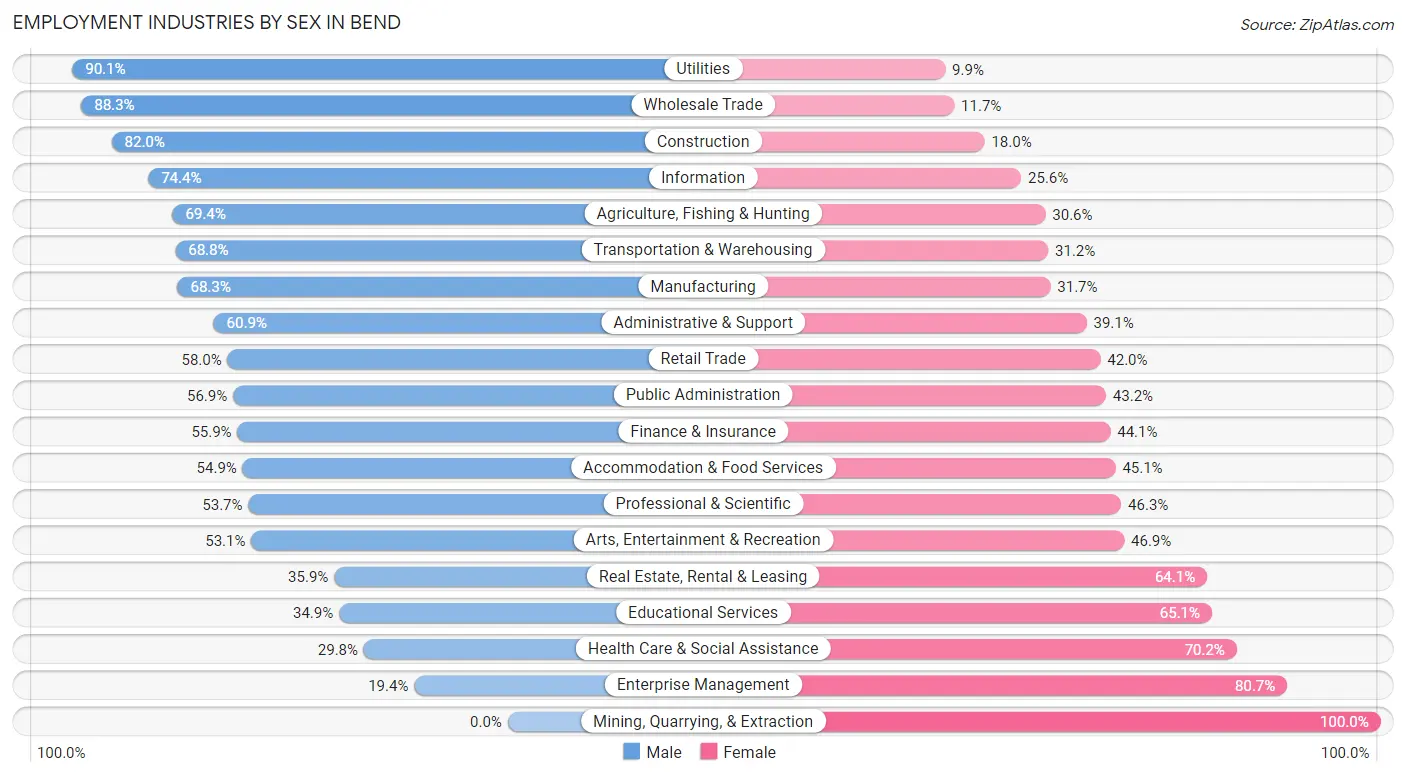
Employment Industries by Sex in Bend
The Bend industries that see more men than women are Utilities (90.1%), Wholesale Trade (88.3%), and Construction (82.0%), whereas the industries that tend to have a higher number of women are Mining, Quarrying, & Extraction (100.0%), Enterprise Management (80.6%), and Health Care & Social Assistance (70.2%).
| Industry | Male | Female |
| Agriculture, Fishing & Hunting | 666 (69.4%) | 294 (30.6%) |
| Mining, Quarrying, & Extraction | 0 (0.0%) | 14 (100.0%) |
| Construction | 2,589 (82.0%) | 569 (18.0%) |
| Manufacturing | 2,621 (68.3%) | 1,214 (31.7%) |
| Wholesale Trade | 1,353 (88.3%) | 180 (11.7%) |
| Retail Trade | 4,150 (58.0%) | 3,005 (42.0%) |
| Transportation & Warehousing | 706 (68.8%) | 320 (31.2%) |
| Utilities | 228 (90.1%) | 25 (9.9%) |
| Information | 558 (74.4%) | 192 (25.6%) |
| Finance & Insurance | 928 (55.9%) | 731 (44.1%) |
| Real Estate, Rental & Leasing | 633 (35.9%) | 1,129 (64.1%) |
| Professional & Scientific | 3,044 (53.7%) | 2,626 (46.3%) |
| Enterprise Management | 18 (19.4%) | 75 (80.6%) |
| Administrative & Support | 995 (60.9%) | 640 (39.1%) |
| Educational Services | 1,596 (34.9%) | 2,975 (65.1%) |
| Health Care & Social Assistance | 2,493 (29.8%) | 5,879 (70.2%) |
| Arts, Entertainment & Recreation | 802 (53.1%) | 709 (46.9%) |
| Accommodation & Food Services | 2,722 (54.9%) | 2,239 (45.1%) |
| Public Administration | 946 (56.9%) | 718 (43.1%) |
| Total | 28,032 (52.9%) | 24,975 (47.1%) |
Education in Bend
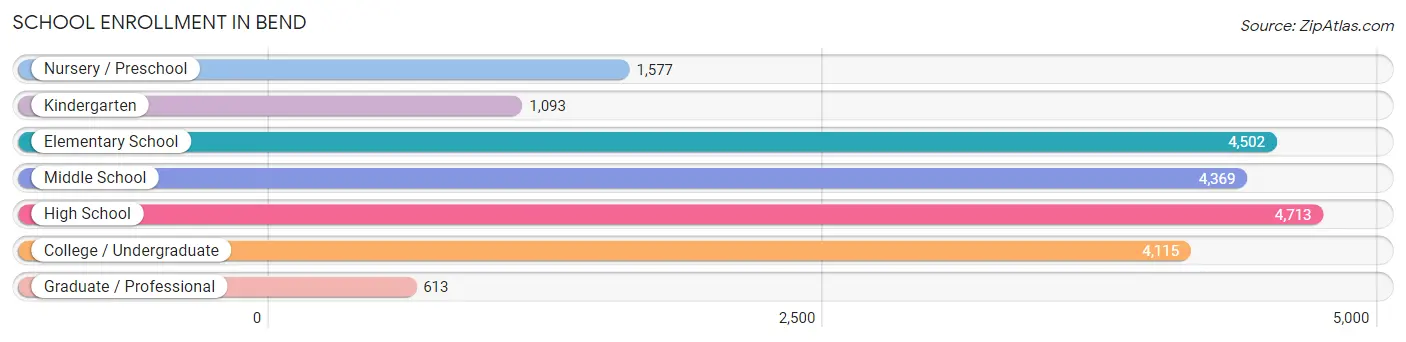
School Enrollment in Bend
The most common levels of schooling among the 20,982 students in Bend are high school (4,713 | 22.5%), elementary school (4,502 | 21.5%), and middle school (4,369 | 20.8%).
| School Level | # Students | % Students |
| Nursery / Preschool | 1,577 | 7.5% |
| Kindergarten | 1,093 | 5.2% |
| Elementary School | 4,502 | 21.5% |
| Middle School | 4,369 | 20.8% |
| High School | 4,713 | 22.5% |
| College / Undergraduate | 4,115 | 19.6% |
| Graduate / Professional | 613 | 2.9% |
| Total | 20,982 | 100.0% |
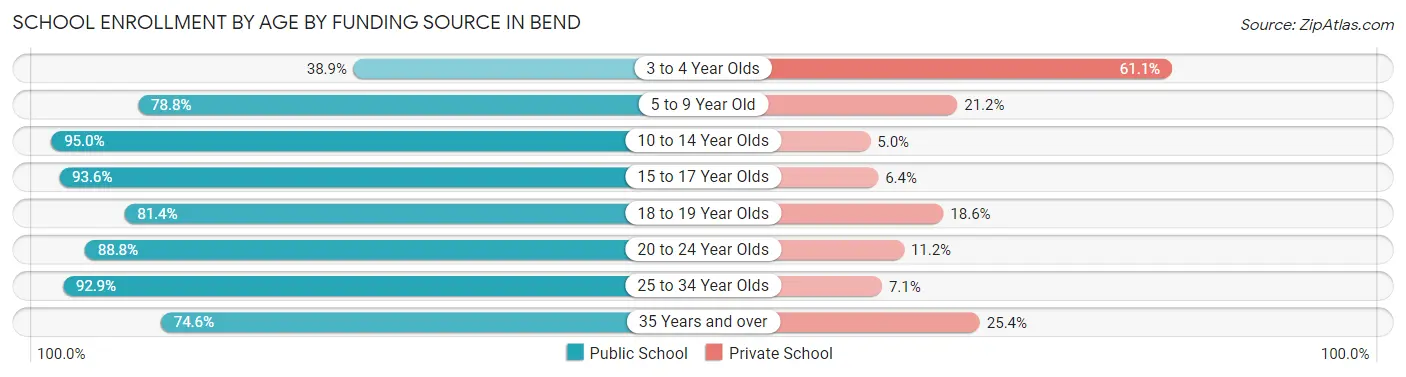
School Enrollment by Age by Funding Source in Bend
Out of a total of 20,982 students who are enrolled in schools in Bend, 3,105 (14.8%) attend a private institution, while the remaining 17,877 (85.2%) are enrolled in public schools. The age group of 3 to 4 year olds has the highest likelihood of being enrolled in private schools, with 692 (61.1% in the age bracket) enrolled. Conversely, the age group of 10 to 14 year olds has the lowest likelihood of being enrolled in a private school, with 5,162 (95.0% in the age bracket) attending a public institution.
| Age Bracket | Public School | Private School |
| 3 to 4 Year Olds | 440 (38.9%) | 692 (61.1%) |
| 5 to 9 Year Old | 4,157 (78.8%) | 1,116 (21.2%) |
| 10 to 14 Year Olds | 5,162 (95.0%) | 270 (5.0%) |
| 15 to 17 Year Olds | 3,389 (93.6%) | 233 (6.4%) |
| 18 to 19 Year Olds | 942 (81.4%) | 215 (18.6%) |
| 20 to 24 Year Olds | 1,486 (88.8%) | 188 (11.2%) |
| 25 to 34 Year Olds | 1,497 (92.9%) | 115 (7.1%) |
| 35 Years and over | 806 (74.6%) | 274 (25.4%) |
| Total | 17,877 (85.2%) | 3,105 (14.8%) |
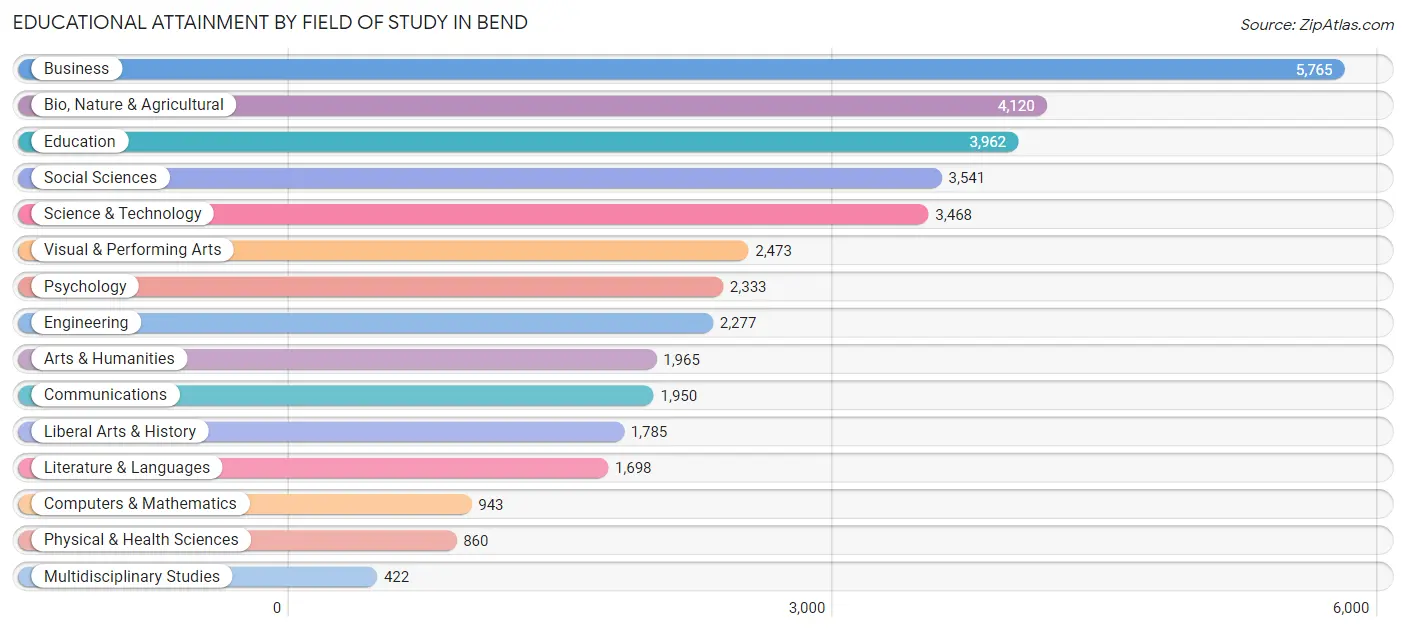
Educational Attainment by Field of Study in Bend
Business (5,765 | 15.3%), bio, nature & agricultural (4,120 | 11.0%), education (3,962 | 10.5%), social sciences (3,541 | 9.4%), and science & technology (3,468 | 9.2%) are the most common fields of study among 37,562 individuals in Bend who have obtained a bachelor's degree or higher.
| Field of Study | # Graduates | % Graduates |
| Computers & Mathematics | 943 | 2.5% |
| Bio, Nature & Agricultural | 4,120 | 11.0% |
| Physical & Health Sciences | 860 | 2.3% |
| Psychology | 2,333 | 6.2% |
| Social Sciences | 3,541 | 9.4% |
| Engineering | 2,277 | 6.1% |
| Multidisciplinary Studies | 422 | 1.1% |
| Science & Technology | 3,468 | 9.2% |
| Business | 5,765 | 15.3% |
| Education | 3,962 | 10.5% |
| Literature & Languages | 1,698 | 4.5% |
| Liberal Arts & History | 1,785 | 4.8% |
| Visual & Performing Arts | 2,473 | 6.6% |
| Communications | 1,950 | 5.2% |
| Arts & Humanities | 1,965 | 5.2% |
| Total | 37,562 | 100.0% |
Transportation & Commute in Bend
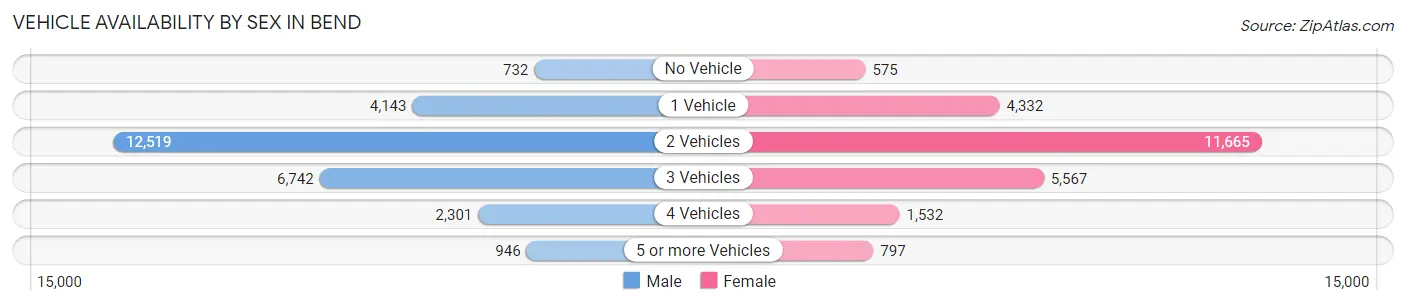
Vehicle Availability by Sex in Bend
The most prevalent vehicle ownership categories in Bend are males with 2 vehicles (12,519, accounting for 45.7%) and females with 2 vehicles (11,665, making up 51.2%).
| Vehicles Available | Male | Female |
| No Vehicle | 732 (2.7%) | 575 (2.4%) |
| 1 Vehicle | 4,143 (15.1%) | 4,332 (17.7%) |
| 2 Vehicles | 12,519 (45.7%) | 11,665 (47.7%) |
| 3 Vehicles | 6,742 (24.6%) | 5,567 (22.8%) |
| 4 Vehicles | 2,301 (8.4%) | 1,532 (6.3%) |
| 5 or more Vehicles | 946 (3.5%) | 797 (3.3%) |
| Total | 27,383 (100.0%) | 24,468 (100.0%) |
Commute Time in Bend
The most frequently occuring commute durations in Bend are 15 to 19 minutes (11,055 commuters, 26.3%), 10 to 14 minutes (10,049 commuters, 23.9%), and 5 to 9 minutes (7,731 commuters, 18.4%).
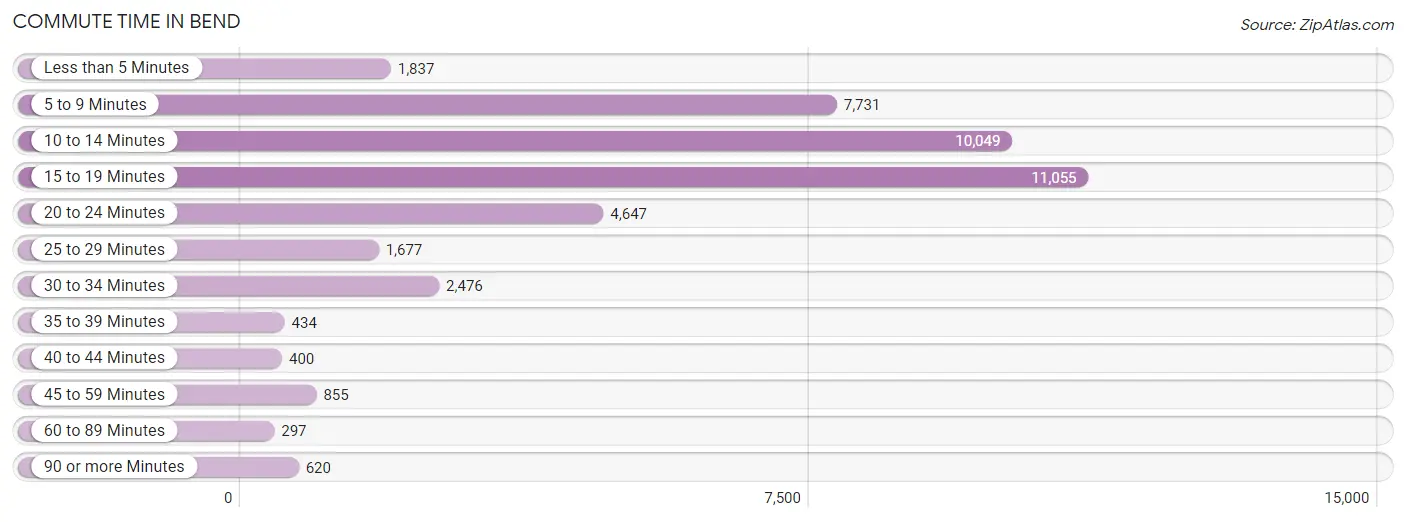
| Commute Time | # Commuters | % Commuters |
| Less than 5 Minutes | 1,837 | 4.4% |
| 5 to 9 Minutes | 7,731 | 18.4% |
| 10 to 14 Minutes | 10,049 | 23.9% |
| 15 to 19 Minutes | 11,055 | 26.3% |
| 20 to 24 Minutes | 4,647 | 11.0% |
| 25 to 29 Minutes | 1,677 | 4.0% |
| 30 to 34 Minutes | 2,476 | 5.9% |
| 35 to 39 Minutes | 434 | 1.0% |
| 40 to 44 Minutes | 400 | 0.9% |
| 45 to 59 Minutes | 855 | 2.0% |
| 60 to 89 Minutes | 297 | 0.7% |
| 90 or more Minutes | 620 | 1.5% |
Commute Time by Sex in Bend
The most common commute times in Bend are 15 to 19 minutes (6,303 commuters, 27.9%) for males and 10 to 14 minutes (5,058 commuters, 25.9%) for females.

| Commute Time | Male | Female |
| Less than 5 Minutes | 1,273 (5.6%) | 564 (2.9%) |
| 5 to 9 Minutes | 3,735 (16.6%) | 3,996 (20.5%) |
| 10 to 14 Minutes | 4,991 (22.1%) | 5,058 (25.9%) |
| 15 to 19 Minutes | 6,303 (27.9%) | 4,752 (24.3%) |
| 20 to 24 Minutes | 2,240 (9.9%) | 2,407 (12.3%) |
| 25 to 29 Minutes | 676 (3.0%) | 1,001 (5.1%) |
| 30 to 34 Minutes | 1,568 (7.0%) | 908 (4.6%) |
| 35 to 39 Minutes | 323 (1.4%) | 111 (0.6%) |
| 40 to 44 Minutes | 144 (0.6%) | 256 (1.3%) |
| 45 to 59 Minutes | 689 (3.0%) | 166 (0.9%) |
| 60 to 89 Minutes | 141 (0.6%) | 156 (0.8%) |
| 90 or more Minutes | 480 (2.1%) | 140 (0.7%) |
Time of Departure to Work by Sex in Bend
The most frequent times of departure to work in Bend are 7:00 AM to 7:29 AM (3,629, 16.1%) for males and 7:30 AM to 7:59 AM (3,418, 17.5%) for females.
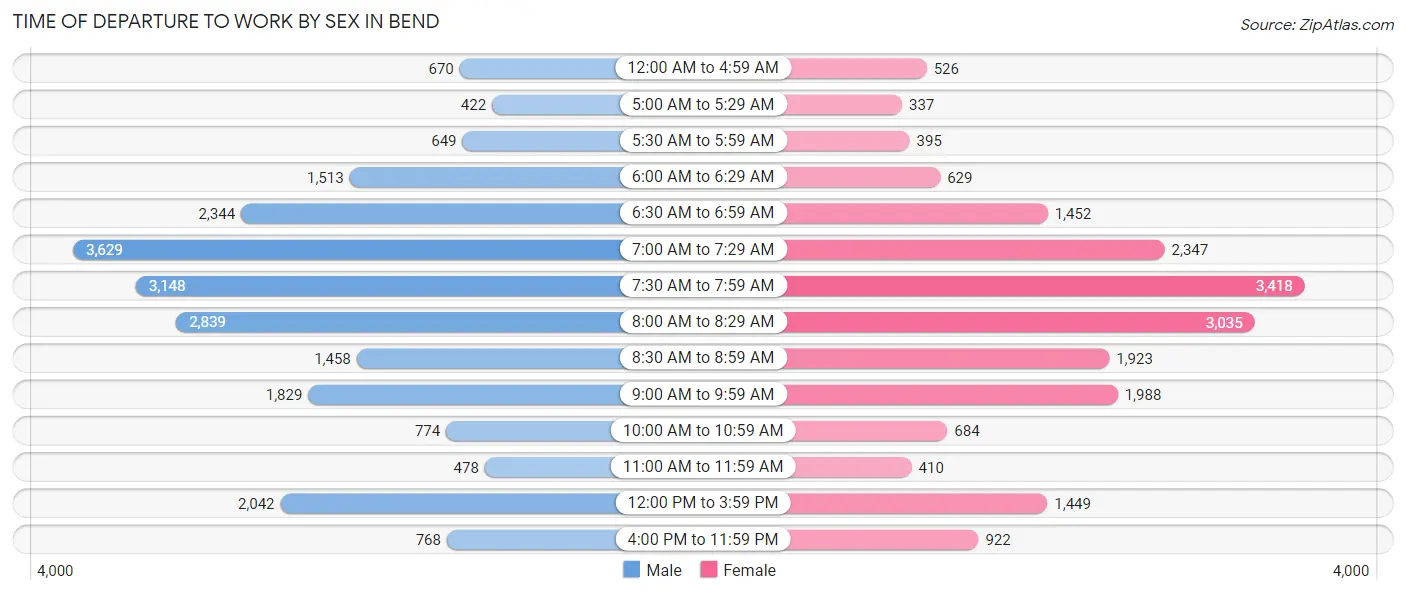
| Time of Departure | Male | Female |
| 12:00 AM to 4:59 AM | 670 (3.0%) | 526 (2.7%) |
| 5:00 AM to 5:29 AM | 422 (1.9%) | 337 (1.7%) |
| 5:30 AM to 5:59 AM | 649 (2.9%) | 395 (2.0%) |
| 6:00 AM to 6:29 AM | 1,513 (6.7%) | 629 (3.2%) |
| 6:30 AM to 6:59 AM | 2,344 (10.4%) | 1,452 (7.4%) |
| 7:00 AM to 7:29 AM | 3,629 (16.1%) | 2,347 (12.0%) |
| 7:30 AM to 7:59 AM | 3,148 (14.0%) | 3,418 (17.5%) |
| 8:00 AM to 8:29 AM | 2,839 (12.6%) | 3,035 (15.5%) |
| 8:30 AM to 8:59 AM | 1,458 (6.5%) | 1,923 (9.9%) |
| 9:00 AM to 9:59 AM | 1,829 (8.1%) | 1,988 (10.2%) |
| 10:00 AM to 10:59 AM | 774 (3.4%) | 684 (3.5%) |
| 11:00 AM to 11:59 AM | 478 (2.1%) | 410 (2.1%) |
| 12:00 PM to 3:59 PM | 2,042 (9.0%) | 1,449 (7.4%) |
| 4:00 PM to 11:59 PM | 768 (3.4%) | 922 (4.7%) |
| Total | 22,563 (100.0%) | 19,515 (100.0%) |
Housing Occupancy in Bend
Occupancy by Ownership in Bend
Of the total 42,151 dwellings in Bend, owner-occupied units account for 25,814 (61.2%), while renter-occupied units make up 16,337 (38.8%).
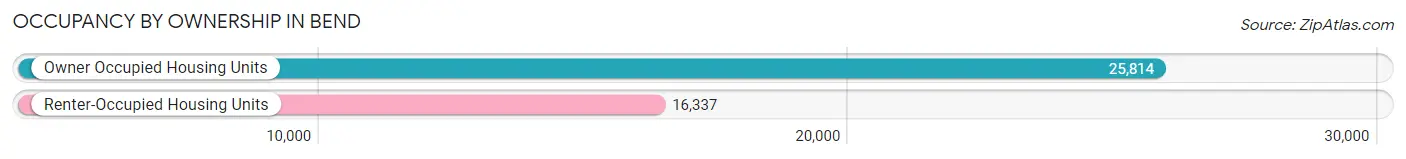
| Occupancy | # Housing Units | % Housing Units |
| Owner Occupied Housing Units | 25,814 | 61.2% |
| Renter-Occupied Housing Units | 16,337 | 38.8% |
| Total Occupied Housing Units | 42,151 | 100.0% |
Occupancy by Household Size in Bend
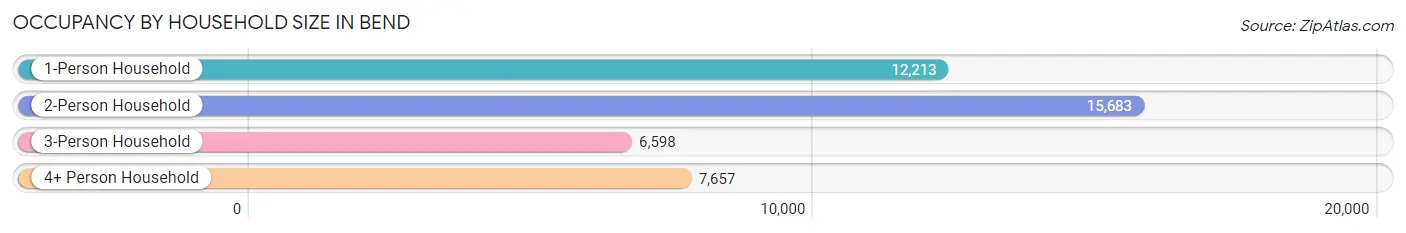
| Household Size | # Housing Units | % Housing Units |
| 1-Person Household | 12,213 | 29.0% |
| 2-Person Household | 15,683 | 37.2% |
| 3-Person Household | 6,598 | 15.7% |
| 4+ Person Household | 7,657 | 18.2% |
| Total Housing Units | 42,151 | 100.0% |
Occupancy by Ownership by Household Size in Bend
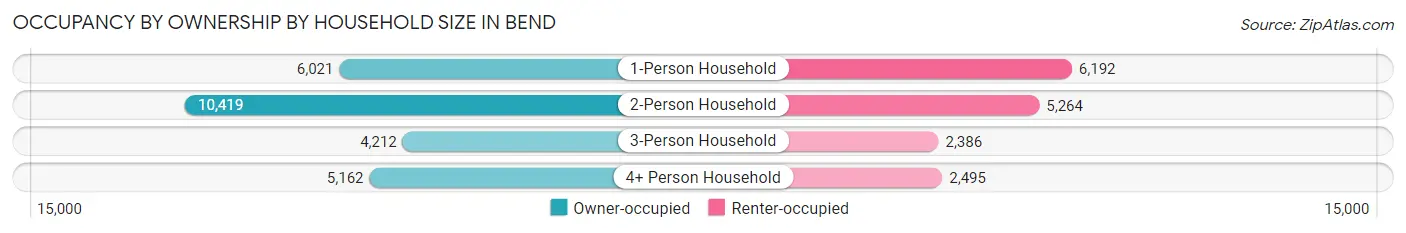
| Household Size | Owner-occupied | Renter-occupied |
| 1-Person Household | 6,021 (49.3%) | 6,192 (50.7%) |
| 2-Person Household | 10,419 (66.4%) | 5,264 (33.6%) |
| 3-Person Household | 4,212 (63.8%) | 2,386 (36.2%) |
| 4+ Person Household | 5,162 (67.4%) | 2,495 (32.6%) |
| Total Housing Units | 25,814 (61.2%) | 16,337 (38.8%) |
Occupancy by Educational Attainment in Bend
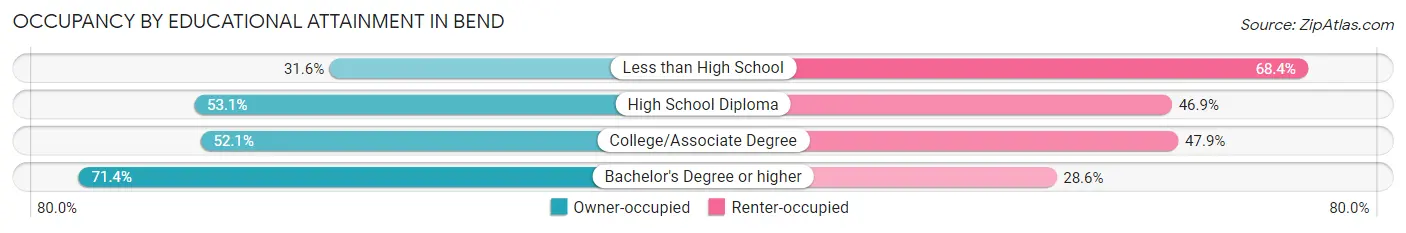
| Household Size | Owner-occupied | Renter-occupied |
| Less than High School | 539 (31.6%) | 1,169 (68.4%) |
| High School Diploma | 2,831 (53.1%) | 2,498 (46.9%) |
| College/Associate Degree | 7,110 (52.1%) | 6,537 (47.9%) |
| Bachelor's Degree or higher | 15,334 (71.4%) | 6,133 (28.6%) |
Occupancy by Age of Householder in Bend
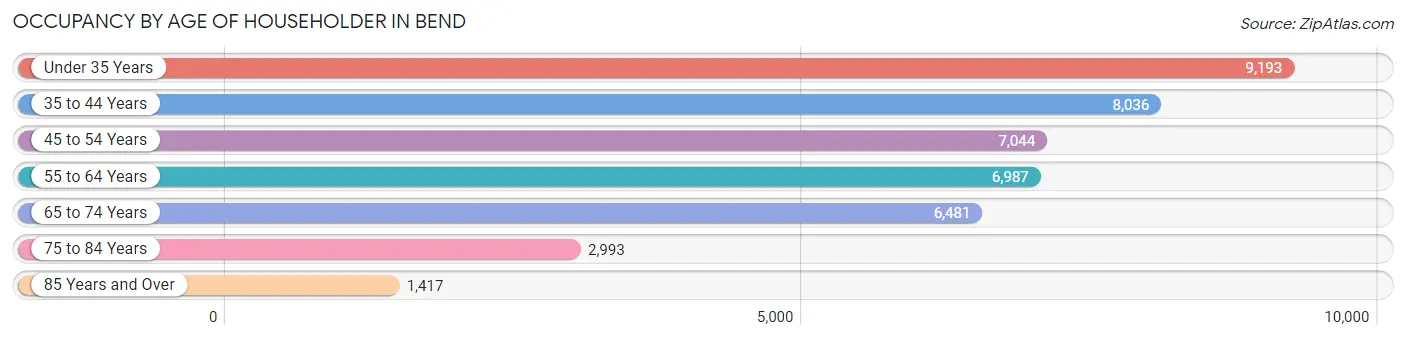
| Age Bracket | # Households | % Households |
| Under 35 Years | 9,193 | 21.8% |
| 35 to 44 Years | 8,036 | 19.1% |
| 45 to 54 Years | 7,044 | 16.7% |
| 55 to 64 Years | 6,987 | 16.6% |
| 65 to 74 Years | 6,481 | 15.4% |
| 75 to 84 Years | 2,993 | 7.1% |
| 85 Years and Over | 1,417 | 3.4% |
| Total | 42,151 | 100.0% |
Housing Finances in Bend
Median Income by Occupancy in Bend
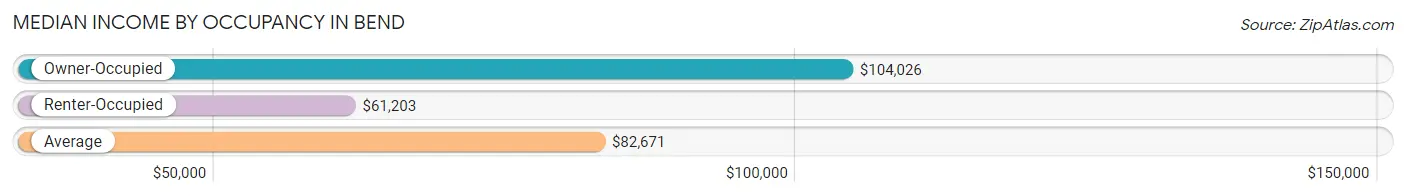
| Occupancy Type | # Households | Median Income |
| Owner-Occupied | 25,814 (61.2%) | $104,026 |
| Renter-Occupied | 16,337 (38.8%) | $61,203 |
| Average | 42,151 (100.0%) | $82,671 |
Occupancy by Householder Income Bracket in Bend
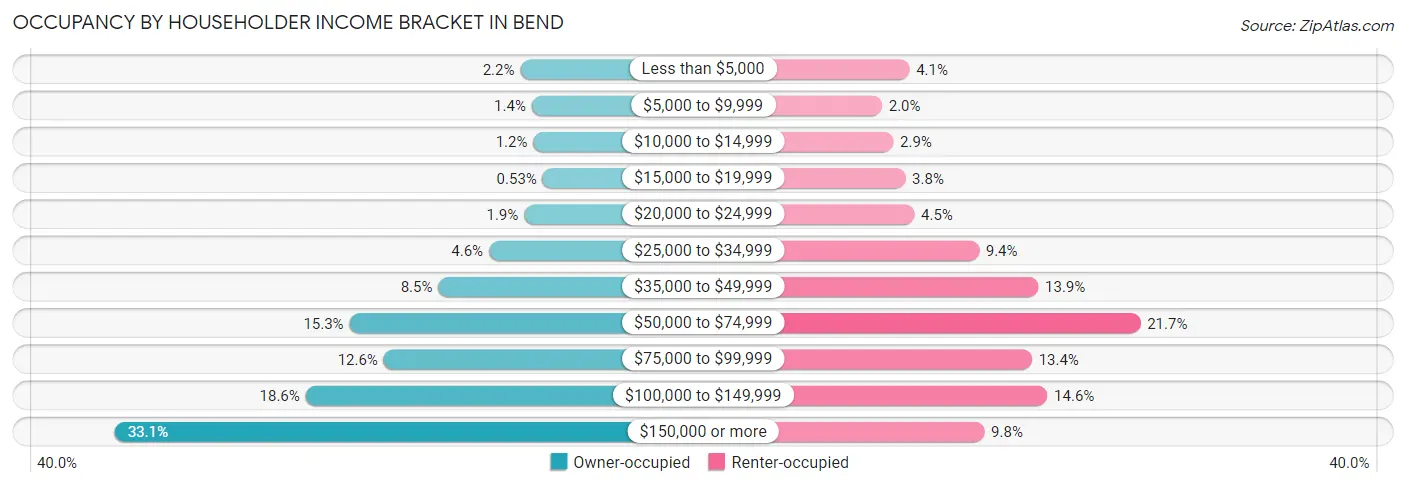
| Income Bracket | Owner-occupied | Renter-occupied |
| Less than $5,000 | 576 (2.2%) | 669 (4.1%) |
| $5,000 to $9,999 | 350 (1.4%) | 326 (2.0%) |
| $10,000 to $14,999 | 320 (1.2%) | 467 (2.9%) |
| $15,000 to $19,999 | 136 (0.5%) | 618 (3.8%) |
| $20,000 to $24,999 | 501 (1.9%) | 728 (4.5%) |
| $25,000 to $34,999 | 1,192 (4.6%) | 1,534 (9.4%) |
| $35,000 to $49,999 | 2,189 (8.5%) | 2,273 (13.9%) |
| $50,000 to $74,999 | 3,936 (15.2%) | 3,543 (21.7%) |
| $75,000 to $99,999 | 3,263 (12.6%) | 2,193 (13.4%) |
| $100,000 to $149,999 | 4,800 (18.6%) | 2,385 (14.6%) |
| $150,000 or more | 8,551 (33.1%) | 1,601 (9.8%) |
| Total | 25,814 (100.0%) | 16,337 (100.0%) |
Monthly Housing Cost Tiers in Bend
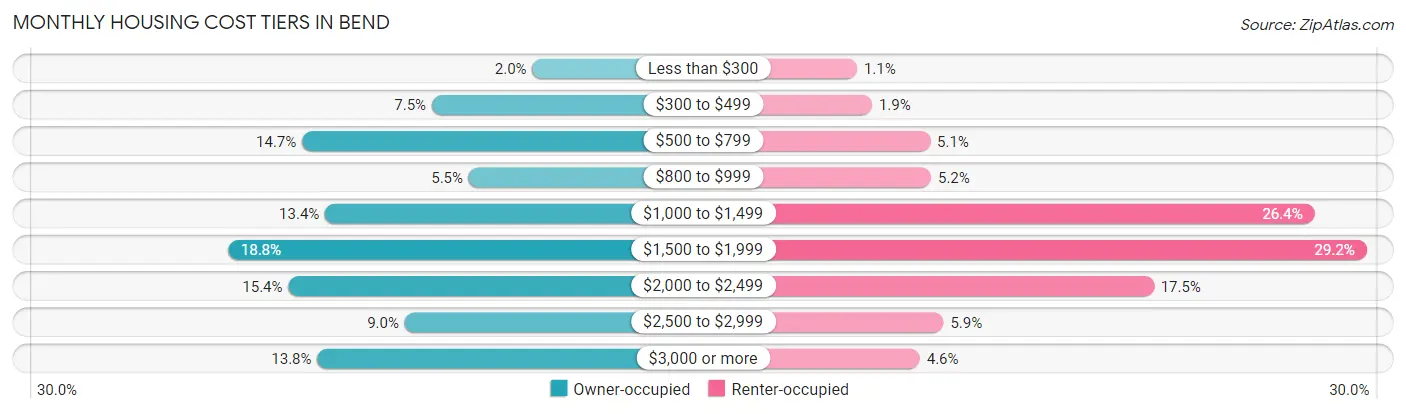
| Monthly Cost | Owner-occupied | Renter-occupied |
| Less than $300 | 504 (1.9%) | 177 (1.1%) |
| $300 to $499 | 1,935 (7.5%) | 312 (1.9%) |
| $500 to $799 | 3,787 (14.7%) | 836 (5.1%) |
| $800 to $999 | 1,409 (5.5%) | 845 (5.2%) |
| $1,000 to $1,499 | 3,459 (13.4%) | 4,305 (26.4%) |
| $1,500 to $1,999 | 4,845 (18.8%) | 4,776 (29.2%) |
| $2,000 to $2,499 | 3,982 (15.4%) | 2,854 (17.5%) |
| $2,500 to $2,999 | 2,323 (9.0%) | 957 (5.9%) |
| $3,000 or more | 3,570 (13.8%) | 744 (4.5%) |
| Total | 25,814 (100.0%) | 16,337 (100.0%) |
Physical Housing Characteristics in Bend
Housing Structures in Bend
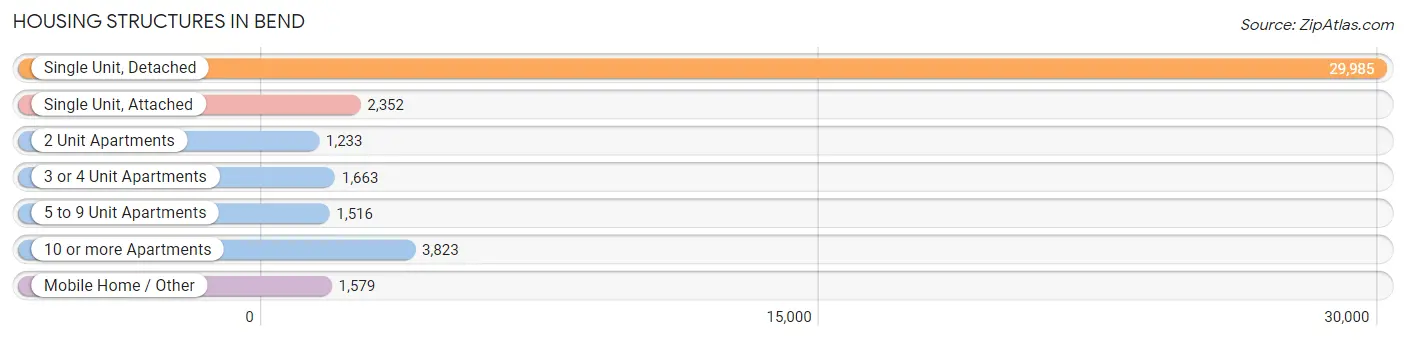
| Structure Type | # Housing Units | % Housing Units |
| Single Unit, Detached | 29,985 | 71.1% |
| Single Unit, Attached | 2,352 | 5.6% |
| 2 Unit Apartments | 1,233 | 2.9% |
| 3 or 4 Unit Apartments | 1,663 | 4.0% |
| 5 to 9 Unit Apartments | 1,516 | 3.6% |
| 10 or more Apartments | 3,823 | 9.1% |
| Mobile Home / Other | 1,579 | 3.7% |
| Total | 42,151 | 100.0% |
Housing Structures by Occupancy in Bend
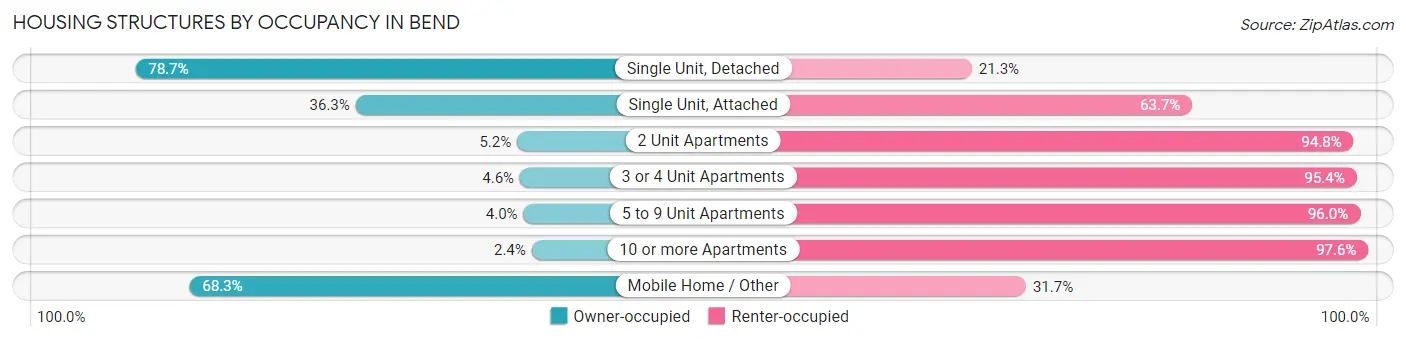
| Structure Type | Owner-occupied | Renter-occupied |
| Single Unit, Detached | 23,591 (78.7%) | 6,394 (21.3%) |
| Single Unit, Attached | 853 (36.3%) | 1,499 (63.7%) |
| 2 Unit Apartments | 64 (5.2%) | 1,169 (94.8%) |
| 3 or 4 Unit Apartments | 77 (4.6%) | 1,586 (95.4%) |
| 5 to 9 Unit Apartments | 60 (4.0%) | 1,456 (96.0%) |
| 10 or more Apartments | 91 (2.4%) | 3,732 (97.6%) |
| Mobile Home / Other | 1,078 (68.3%) | 501 (31.7%) |
| Total | 25,814 (61.2%) | 16,337 (38.8%) |
Housing Structures by Number of Rooms in Bend
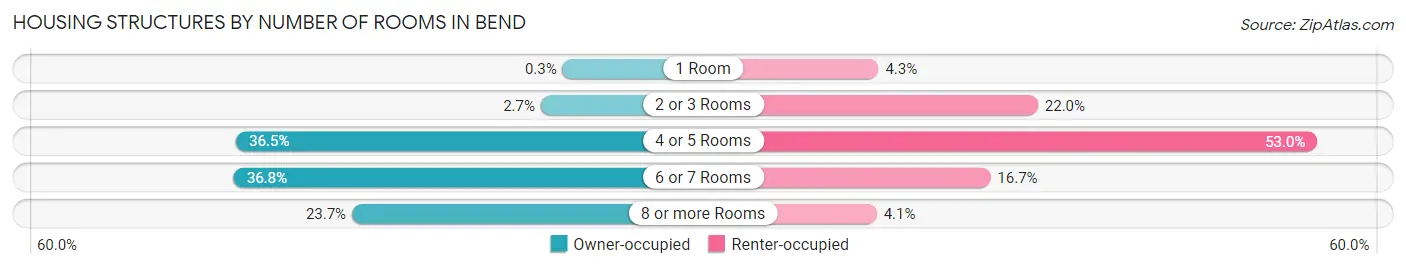
| Number of Rooms | Owner-occupied | Renter-occupied |
| 1 Room | 78 (0.3%) | 700 (4.3%) |
| 2 or 3 Rooms | 700 (2.7%) | 3,589 (22.0%) |
| 4 or 5 Rooms | 9,431 (36.5%) | 8,654 (53.0%) |
| 6 or 7 Rooms | 9,494 (36.8%) | 2,728 (16.7%) |
| 8 or more Rooms | 6,111 (23.7%) | 666 (4.1%) |
| Total | 25,814 (100.0%) | 16,337 (100.0%) |
Housing Structure by Heating Type in Bend

| Heating Type | Owner-occupied | Renter-occupied |
| Utility Gas | 18,219 (70.6%) | 5,600 (34.3%) |
| Bottled, Tank, or LP Gas | 355 (1.4%) | 305 (1.9%) |
| Electricity | 5,994 (23.2%) | 9,824 (60.1%) |
| Fuel Oil or Kerosene | 79 (0.3%) | 89 (0.5%) |
| Coal or Coke | 0 (0.0%) | 0 (0.0%) |
| All other Fuels | 1,124 (4.3%) | 441 (2.7%) |
| No Fuel Used | 43 (0.2%) | 78 (0.5%) |
| Total | 25,814 (100.0%) | 16,337 (100.0%) |
Household Vehicle Usage in Bend
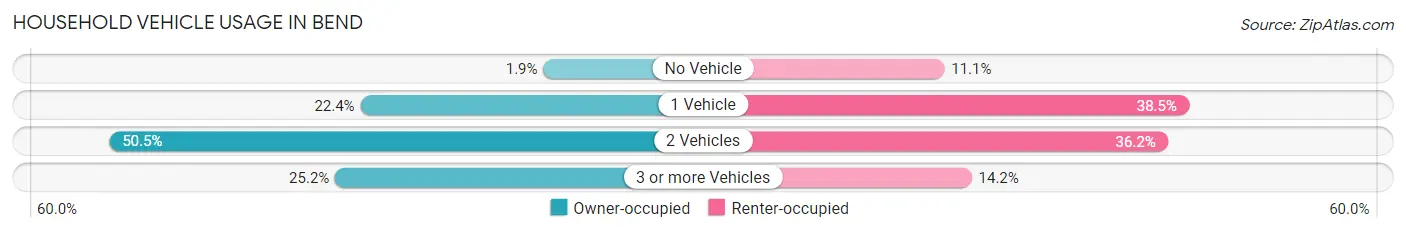
| Vehicles per Household | Owner-occupied | Renter-occupied |
| No Vehicle | 488 (1.9%) | 1,819 (11.1%) |
| 1 Vehicle | 5,777 (22.4%) | 6,293 (38.5%) |
| 2 Vehicles | 13,042 (50.5%) | 5,906 (36.1%) |
| 3 or more Vehicles | 6,507 (25.2%) | 2,319 (14.2%) |
| Total | 25,814 (100.0%) | 16,337 (100.0%) |
Real Estate & Mortgages in Bend
Real Estate and Mortgage Overview in Bend
| Characteristic | Without Mortgage | With Mortgage |
| Housing Units | 8,238 | 17,576 |
| Median Property Value | $553,500 | $584,900 |
| Median Household Income | $72,750 | $6,622 |
| Monthly Housing Costs | $625 | $3,546 |
| Real Estate Taxes | $3,716 | $248 |
Property Value by Mortgage Status in Bend
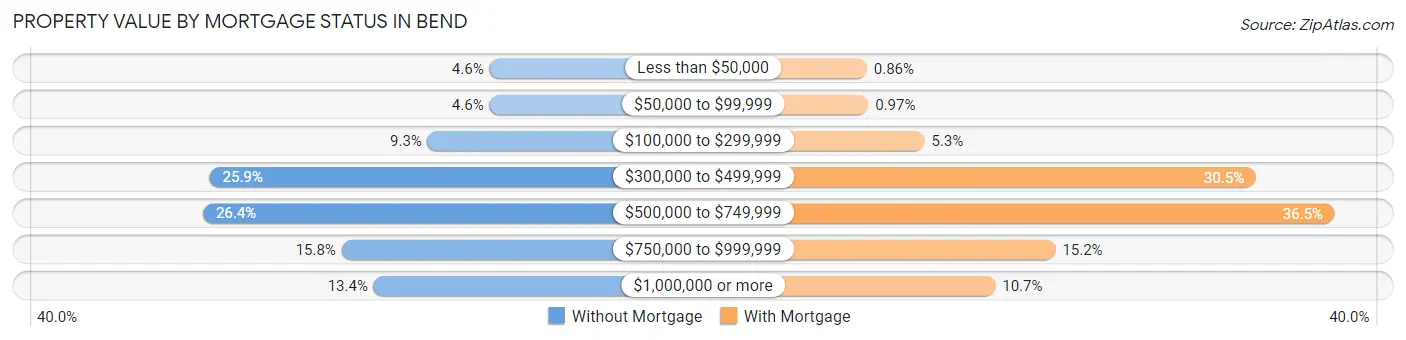
| Property Value | Without Mortgage | With Mortgage |
| Less than $50,000 | 377 (4.6%) | 152 (0.9%) |
| $50,000 to $99,999 | 377 (4.6%) | 171 (1.0%) |
| $100,000 to $299,999 | 765 (9.3%) | 922 (5.2%) |
| $300,000 to $499,999 | 2,134 (25.9%) | 5,364 (30.5%) |
| $500,000 to $749,999 | 2,176 (26.4%) | 6,419 (36.5%) |
| $750,000 to $999,999 | 1,305 (15.8%) | 2,676 (15.2%) |
| $1,000,000 or more | 1,104 (13.4%) | 1,872 (10.6%) |
| Total | 8,238 (100.0%) | 17,576 (100.0%) |
Household Income by Mortgage Status in Bend
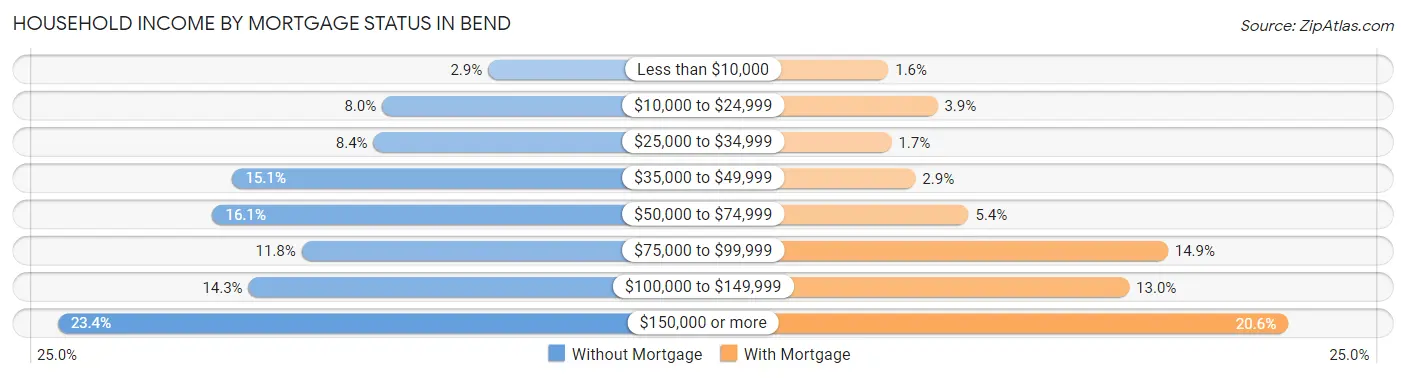
| Household Income | Without Mortgage | With Mortgage |
| Less than $10,000 | 241 (2.9%) | 274 (1.6%) |
| $10,000 to $24,999 | 657 (8.0%) | 685 (3.9%) |
| $25,000 to $34,999 | 691 (8.4%) | 300 (1.7%) |
| $35,000 to $49,999 | 1,244 (15.1%) | 501 (2.9%) |
| $50,000 to $74,999 | 1,322 (16.1%) | 945 (5.4%) |
| $75,000 to $99,999 | 973 (11.8%) | 2,614 (14.9%) |
| $100,000 to $149,999 | 1,181 (14.3%) | 2,290 (13.0%) |
| $150,000 or more | 1,929 (23.4%) | 3,619 (20.6%) |
| Total | 8,238 (100.0%) | 17,576 (100.0%) |
Property Value to Household Income Ratio in Bend
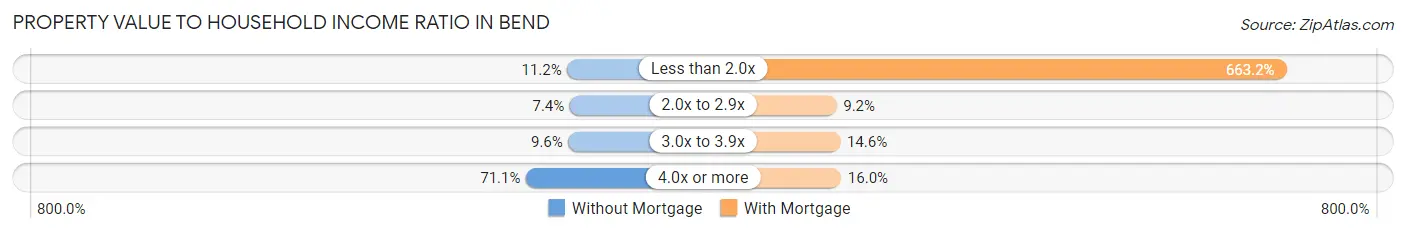
| Value-to-Income Ratio | Without Mortgage | With Mortgage |
| Less than 2.0x | 920 (11.2%) | 116,563 (663.2%) |
| 2.0x to 2.9x | 610 (7.4%) | 1,620 (9.2%) |
| 3.0x to 3.9x | 792 (9.6%) | 2,572 (14.6%) |
| 4.0x or more | 5,855 (71.1%) | 2,807 (16.0%) |
| Total | 8,238 (100.0%) | 17,576 (100.0%) |
Real Estate Taxes by Mortgage Status in Bend
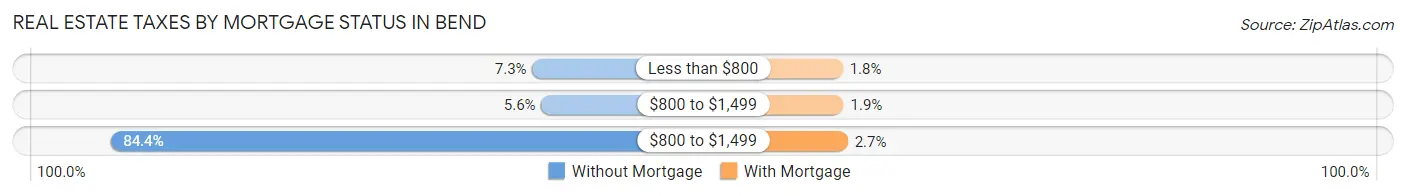
| Property Taxes | Without Mortgage | With Mortgage |
| Less than $800 | 597 (7.2%) | 311 (1.8%) |
| $800 to $1,499 | 461 (5.6%) | 339 (1.9%) |
| $800 to $1,499 | 6,949 (84.4%) | 471 (2.7%) |
| Total | 8,238 (100.0%) | 17,576 (100.0%) |
Health & Disability in Bend
Health Insurance Coverage by Age in Bend
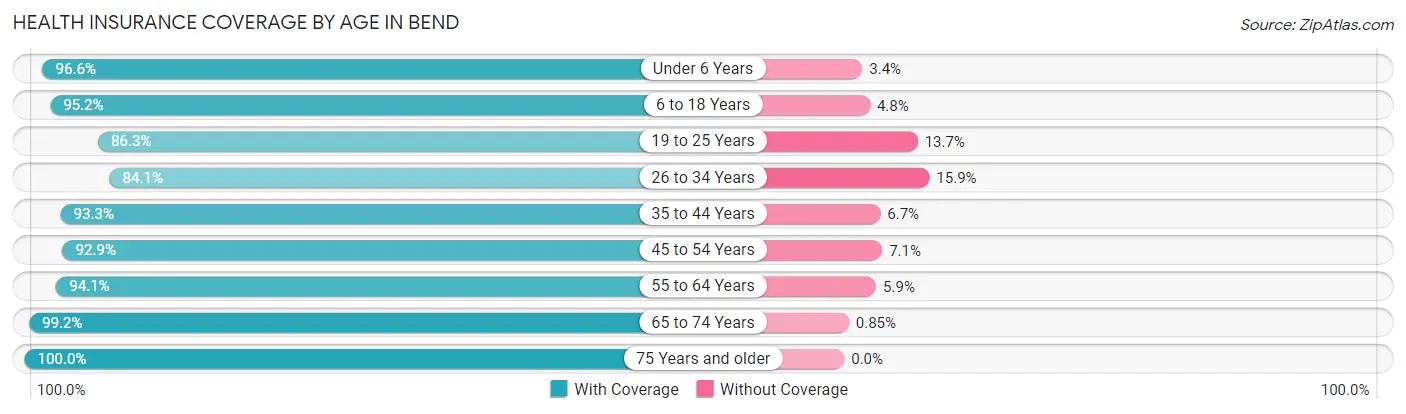
| Age Bracket | With Coverage | Without Coverage |
| Under 6 Years | 6,398 (96.6%) | 223 (3.4%) |
| 6 to 18 Years | 14,361 (95.2%) | 721 (4.8%) |
| 19 to 25 Years | 6,727 (86.3%) | 1,067 (13.7%) |
| 26 to 34 Years | 11,709 (84.1%) | 2,209 (15.9%) |
| 35 to 44 Years | 13,840 (93.3%) | 997 (6.7%) |
| 45 to 54 Years | 12,114 (92.9%) | 921 (7.1%) |
| 55 to 64 Years | 10,508 (94.1%) | 663 (5.9%) |
| 65 to 74 Years | 9,973 (99.2%) | 85 (0.9%) |
| 75 Years and older | 6,636 (100.0%) | 0 (0.0%) |
| Total | 92,266 (93.1%) | 6,886 (6.9%) |
Health Insurance Coverage by Citizenship Status in Bend
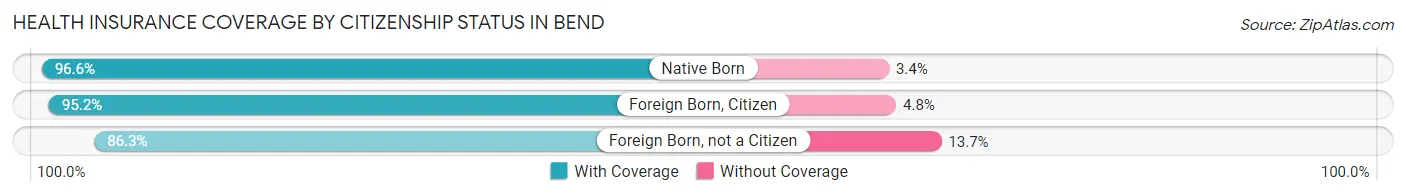
| Citizenship Status | With Coverage | Without Coverage |
| Native Born | 6,398 (96.6%) | 223 (3.4%) |
| Foreign Born, Citizen | 14,361 (95.2%) | 721 (4.8%) |
| Foreign Born, not a Citizen | 6,727 (86.3%) | 1,067 (13.7%) |
Health Insurance Coverage by Household Income in Bend
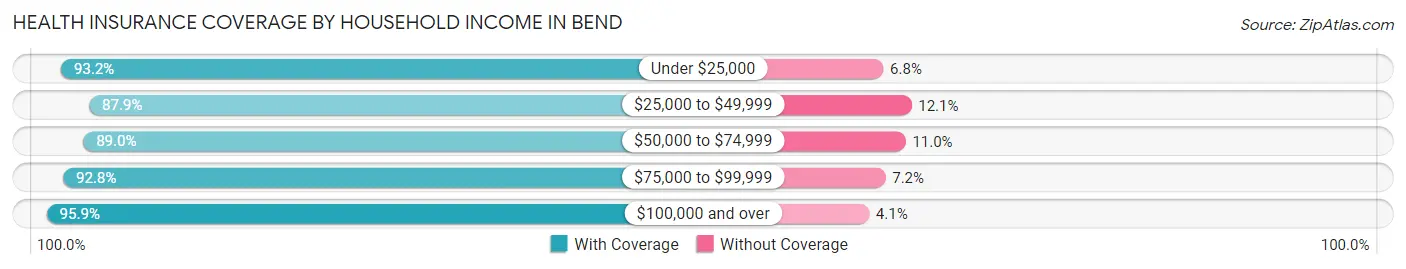
| Household Income | With Coverage | Without Coverage |
| Under $25,000 | 6,324 (93.2%) | 462 (6.8%) |
| $25,000 to $49,999 | 12,341 (87.9%) | 1,698 (12.1%) |
| $50,000 to $74,999 | 13,985 (89.0%) | 1,726 (11.0%) |
| $75,000 to $99,999 | 12,234 (92.8%) | 950 (7.2%) |
| $100,000 and over | 46,889 (95.9%) | 2,027 (4.1%) |
Public vs Private Health Insurance Coverage by Age in Bend
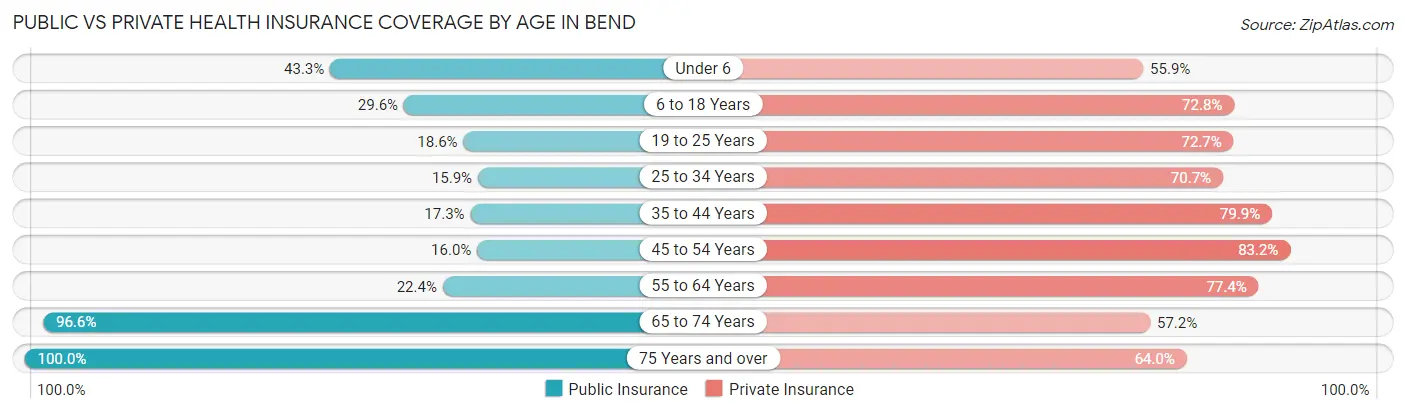
| Age Bracket | Public Insurance | Private Insurance |
| Under 6 | 2,866 (43.3%) | 3,704 (55.9%) |
| 6 to 18 Years | 4,465 (29.6%) | 10,983 (72.8%) |
| 19 to 25 Years | 1,446 (18.5%) | 5,668 (72.7%) |
| 25 to 34 Years | 2,206 (15.9%) | 9,844 (70.7%) |
| 35 to 44 Years | 2,560 (17.2%) | 11,848 (79.8%) |
| 45 to 54 Years | 2,086 (16.0%) | 10,848 (83.2%) |
| 55 to 64 Years | 2,501 (22.4%) | 8,643 (77.4%) |
| 65 to 74 Years | 9,713 (96.6%) | 5,755 (57.2%) |
| 75 Years and over | 6,636 (100.0%) | 4,248 (64.0%) |
| Total | 34,479 (34.8%) | 71,541 (72.2%) |
Disability Status by Sex by Age in Bend
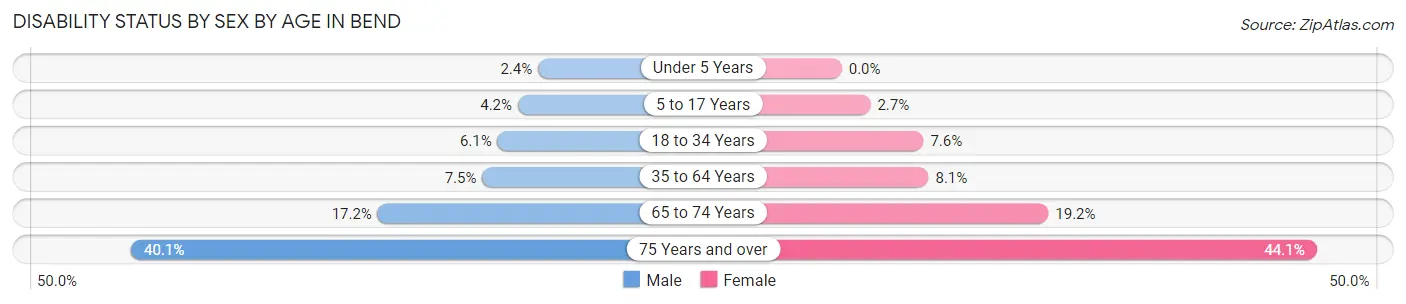
| Age Bracket | Male | Female |
| Under 5 Years | 59 (2.4%) | 0 (0.0%) |
| 5 to 17 Years | 354 (4.2%) | 191 (2.7%) |
| 18 to 34 Years | 730 (6.1%) | 822 (7.6%) |
| 35 to 64 Years | 1,478 (7.5%) | 1,561 (8.1%) |
| 65 to 74 Years | 812 (17.2%) | 1,025 (19.2%) |
| 75 Years and over | 1,173 (40.1%) | 1,635 (44.1%) |
Disability Class by Sex by Age in Bend
Disability Class: Hearing Difficulty
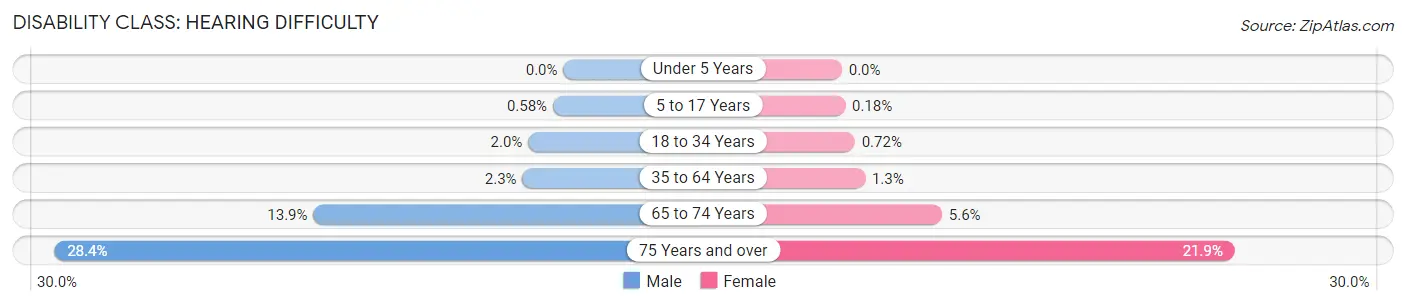
| Age Bracket | Male | Female |
| Under 5 Years | 0 (0.0%) | 0 (0.0%) |
| 5 to 17 Years | 49 (0.6%) | 13 (0.2%) |
| 18 to 34 Years | 234 (2.0%) | 78 (0.7%) |
| 35 to 64 Years | 448 (2.3%) | 251 (1.3%) |
| 65 to 74 Years | 656 (13.9%) | 298 (5.6%) |
| 75 Years and over | 829 (28.3%) | 812 (21.9%) |
Disability Class: Vision Difficulty
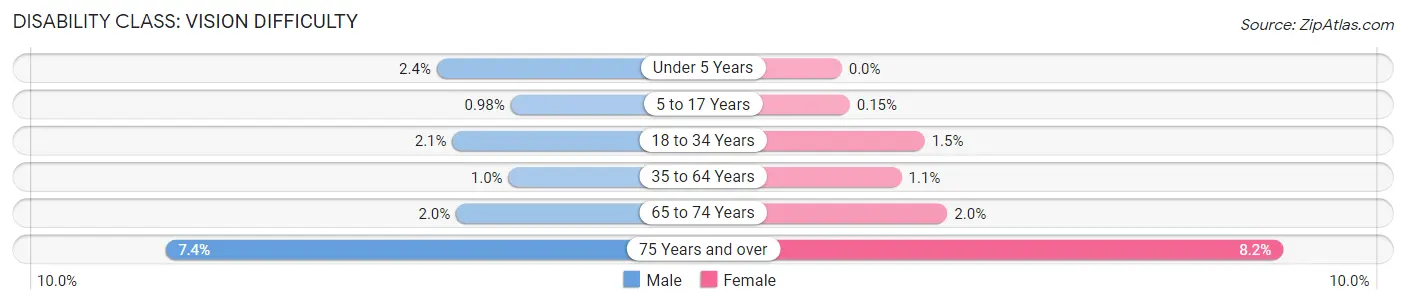
| Age Bracket | Male | Female |
| Under 5 Years | 59 (2.4%) | 0 (0.0%) |
| 5 to 17 Years | 82 (1.0%) | 11 (0.2%) |
| 18 to 34 Years | 246 (2.1%) | 167 (1.5%) |
| 35 to 64 Years | 201 (1.0%) | 216 (1.1%) |
| 65 to 74 Years | 94 (2.0%) | 105 (2.0%) |
| 75 Years and over | 216 (7.4%) | 304 (8.2%) |
Disability Class: Cognitive Difficulty
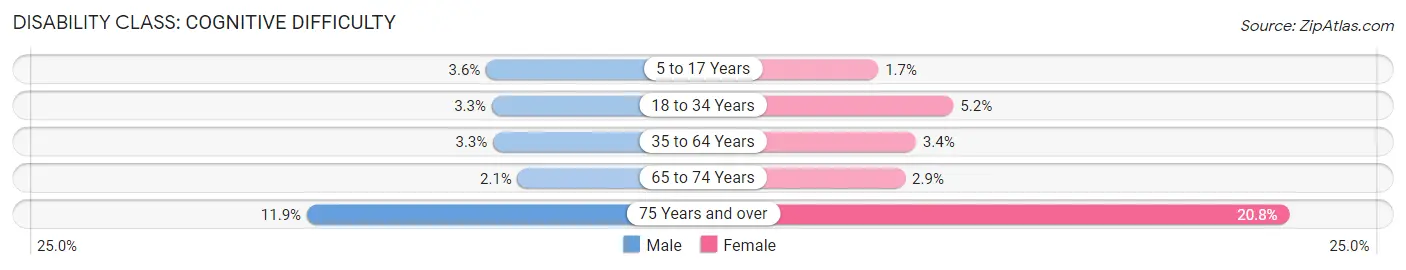
| Age Bracket | Male | Female |
| 5 to 17 Years | 300 (3.6%) | 121 (1.7%) |
| 18 to 34 Years | 396 (3.3%) | 561 (5.2%) |
| 35 to 64 Years | 641 (3.3%) | 668 (3.4%) |
| 65 to 74 Years | 100 (2.1%) | 157 (2.9%) |
| 75 Years and over | 348 (11.9%) | 771 (20.8%) |
Disability Class: Ambulatory Difficulty
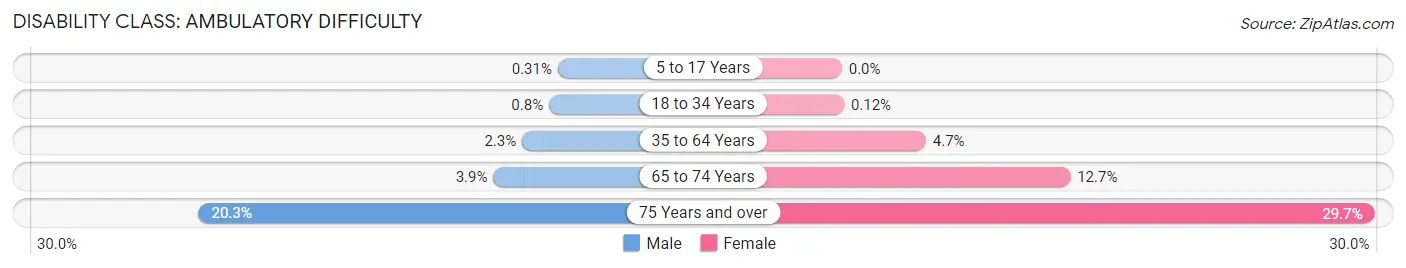
| Age Bracket | Male | Female |
| 5 to 17 Years | 26 (0.3%) | 0 (0.0%) |
| 18 to 34 Years | 95 (0.8%) | 13 (0.1%) |
| 35 to 64 Years | 452 (2.3%) | 908 (4.7%) |
| 65 to 74 Years | 184 (3.9%) | 680 (12.7%) |
| 75 Years and over | 594 (20.3%) | 1,101 (29.7%) |
Disability Class: Self-Care Difficulty
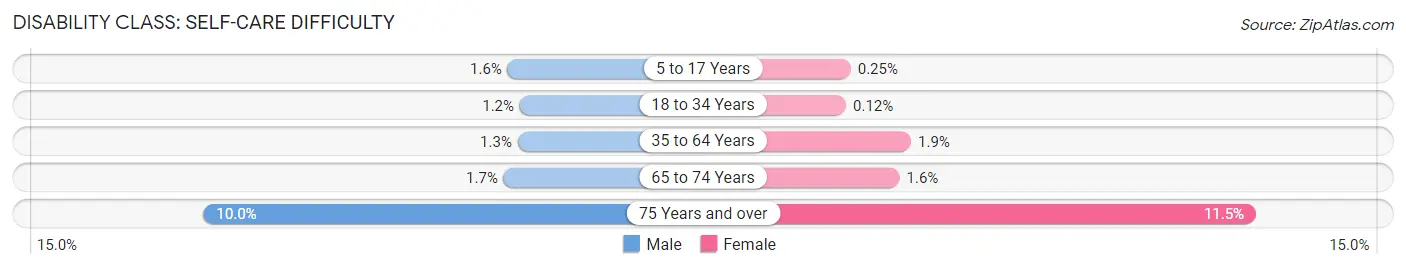
| Age Bracket | Male | Female |
| 5 to 17 Years | 130 (1.5%) | 18 (0.3%) |
| 18 to 34 Years | 144 (1.2%) | 13 (0.1%) |
| 35 to 64 Years | 249 (1.3%) | 374 (1.9%) |
| 65 to 74 Years | 78 (1.7%) | 86 (1.6%) |
| 75 Years and over | 293 (10.0%) | 428 (11.5%) |
Technology Access in Bend
Computing Device Access in Bend
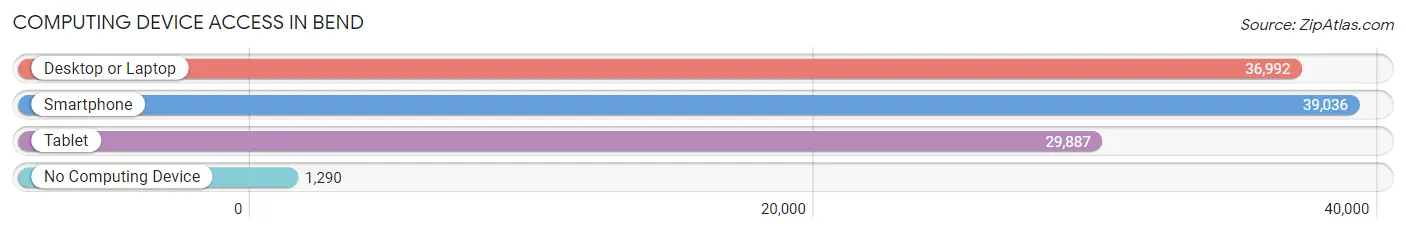
| Device Type | # Households | % Households |
| Desktop or Laptop | 36,992 | 87.8% |
| Smartphone | 39,036 | 92.6% |
| Tablet | 29,887 | 70.9% |
| No Computing Device | 1,290 | 3.1% |
| Total | 42,151 | 100.0% |
Internet Access in Bend
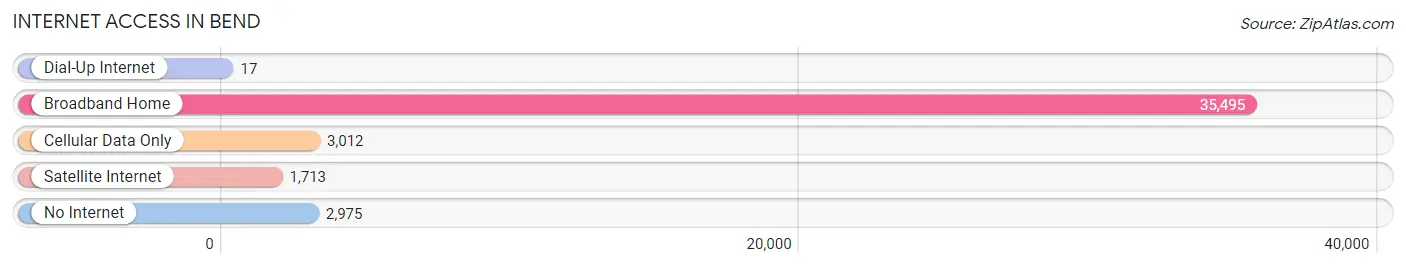
| Internet Type | # Households | % Households |
| Dial-Up Internet | 17 | 0.0% |
| Broadband Home | 35,495 | 84.2% |
| Cellular Data Only | 3,012 | 7.1% |
| Satellite Internet | 1,713 | 4.1% |
| No Internet | 2,975 | 7.1% |
| Total | 42,151 | 100.0% |
Bend Summary
Bend, Oregon is a city located in Deschutes County in the state of Oregon. It is the county seat and the largest city in the county. Bend is located on the eastern edge of the Cascade Range, near the Deschutes River. The city has a population of 81,236 as of the 2019 census, making it the fifth-largest city in the state.
Geography
Bend is located in the high desert of Central Oregon, at an elevation of 3,623 feet (1,105 m). It is situated on the eastern edge of the Cascade Range, near the Deschutes River. The city is surrounded by mountains, including the Three Sisters to the north, Mount Bachelor to the west, and the Cascade Range to the east. The city is located in the rain shadow of the Cascades, and receives an average of only 8 inches (203 mm) of precipitation per year.
The climate in Bend is generally mild, with hot summers and cold winters. The average high temperature in July is 85°F (29°C), and the average low temperature in January is 22°F (-6°C).
Economy
Bend's economy is largely driven by tourism, with the city being a popular destination for outdoor recreation. The city is home to several ski resorts, including Mount Bachelor, and is a popular destination for mountain biking, hiking, fishing, and camping. The city is also home to several breweries, including Deschutes Brewery, which is the largest craft brewery in the state.
Bend is also home to several technology companies, including BendBroadband, a local cable and internet provider, and Bend Research, a pharmaceutical research and development company. The city is also home to several manufacturing companies, including Cascade Designs, a manufacturer of outdoor gear, and BendTec, a manufacturer of medical devices.
Demographics
As of the 2019 census, Bend had a population of 81,236. The racial makeup of the city was 87.2% White, 1.3% African American, 1.2% Native American, 4.2% Asian, 0.3% Pacific Islander, 2.7% from other races, and 3.3% from two or more races. Hispanic or Latino of any race were 8.2% of the population.
The median income for a household in Bend was $50,837, and the median income for a family was $62,917. The per capita income for the city was $30,845. About 11.2% of families and 15.3% of the population were below the poverty line, including 21.2% of those under age 18 and 6.7% of those age 65 or over.
Conclusion
Bend, Oregon is a city located in Deschutes County in the state of Oregon. It is the county seat and the largest city in the county. Bend is located on the eastern edge of the Cascade Range, near the Deschutes River. The city has a population of 81,236 as of the 2019 census, making it the fifth-largest city in the state. The city's economy is largely driven by tourism, with the city being a popular destination for outdoor recreation. Bend is also home to several technology companies, manufacturing companies, and breweries. The city has a diverse population, with the median income for a household being $50,837 and the median income for a family being $62,917.
Common Questions
What is Per Capita Income in Bend?
Per Capita income in Bend is $51,254.
What is the Median Family Income in Bend?
Median Family Income in Bend is $105,957.
What is the Median Household income in Bend?
Median Household Income in Bend is $82,671.
What is Income or Wage Gap in Bend?
Income or Wage Gap in Bend is 30.5%.
Women in Bend earn 69.5 cents for every dollar earned by a man.
What is Family Income Deficit in Bend?
Family Income Deficit in Bend is $12,308.
Families that are below poverty line in Bend earn $12,308 less on average than the poverty threshold level.
What is Inequality or Gini Index in Bend?
Inequality or Gini Index in Bend is 0.48.
What is the Total Population of Bend?
Total Population of Bend is 99,442.
What is the Total Male Population of Bend?
Total Male Population of Bend is 50,211.
What is the Total Female Population of Bend?
Total Female Population of Bend is 49,231.
What is the Ratio of Males per 100 Females in Bend?
There are 101.99 Males per 100 Females in Bend.
What is the Ratio of Females per 100 Males in Bend?
There are 98.05 Females per 100 Males in Bend.
What is the Median Population Age in Bend?
Median Population Age in Bend is 39.5 Years.
What is the Average Family Size in Bend
Average Family Size in Bend is 2.9 People.
What is the Average Household Size in Bend
Average Household Size in Bend is 2.3 People.
How Large is the Labor Force in Bend?
There are 55,151 People in the Labor Forcein in Bend.
What is the Percentage of People in the Labor Force in Bend?
68.1% of People are in the Labor Force in Bend.
What is the Unemployment Rate in Bend?
Unemployment Rate in Bend is 3.8%.