Klamath Falls, OR Map & Demographics
Klamath Falls Map
Klamath Falls Overview
$29,201
PER CAPITA INCOME
$60,558
AVG FAMILY INCOME
$46,695
AVG HOUSEHOLD INCOME
19.5%
WAGE / INCOME GAP [ % ]
80.5¢/ $1
WAGE / INCOME GAP [ $ ]
$9,873
FAMILY INCOME DEFICIT
0.52
INEQUALITY / GINI INDEX
21,806
TOTAL POPULATION
10,879
MALE POPULATION
10,927
FEMALE POPULATION
99.56
MALES / 100 FEMALES
100.44
FEMALES / 100 MALES
35.1
MEDIAN AGE
3.1
AVG FAMILY SIZE
2.4
AVG HOUSEHOLD SIZE
9,838
LABOR FORCE [ PEOPLE ]
55.4%
PERCENT IN LABOR FORCE
8.1%
UNEMPLOYMENT RATE
Klamath Falls Area Codes
Income in Klamath Falls
Income Overview in Klamath Falls
Per Capita Income in Klamath Falls is $29,201, while median incomes of families and households are $60,558 and $46,695 respectively.
| Characteristic | Number | Measure |
| Per Capita Income | 21,806 | $29,201 |
| Median Family Income | 4,772 | $60,558 |
| Mean Family Income | 4,772 | $84,453 |
| Median Household Income | 8,885 | $46,695 |
| Mean Household Income | 8,885 | $68,674 |
| Income Deficit | 4,772 | $9,873 |
| Wage / Income Gap (%) | 21,806 | 19.46% |
| Wage / Income Gap ($) | 21,806 | 80.54¢ per $1 |
| Gini / Inequality Index | 21,806 | 0.52 |
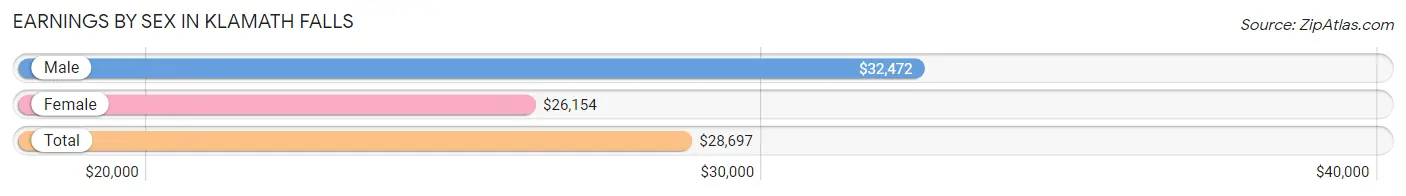
Earnings by Sex in Klamath Falls
Average Earnings in Klamath Falls are $28,697, $32,472 for men and $26,154 for women, a difference of 19.5%.
| Sex | Number | Average Earnings |
| Male | 5,414 (50.6%) | $32,472 |
| Female | 5,277 (49.4%) | $26,154 |
| Total | 10,691 (100.0%) | $28,697 |
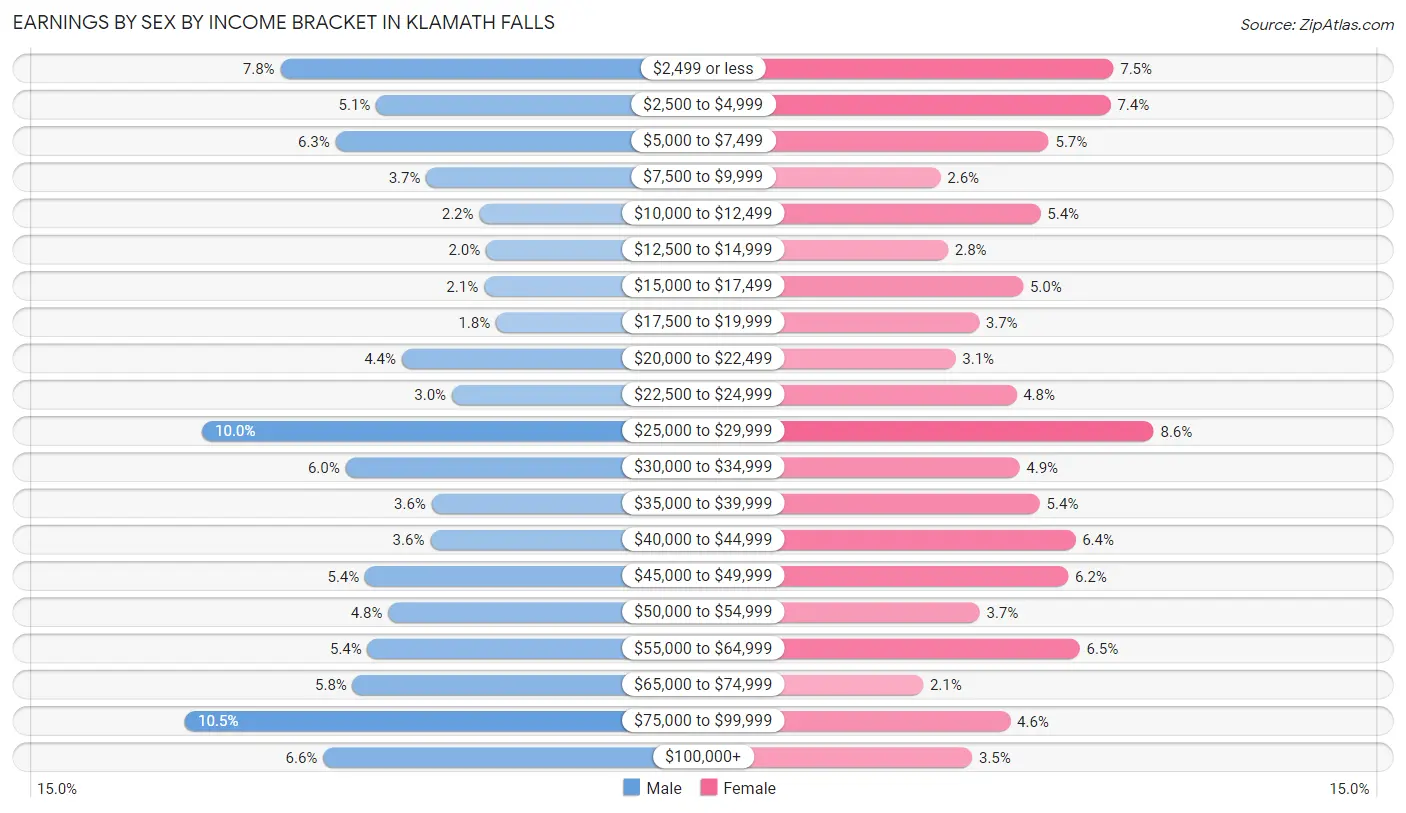
Earnings by Sex by Income Bracket in Klamath Falls
The most common earnings brackets in Klamath Falls are $75,000 to $99,999 for men (568 | 10.5%) and $25,000 to $29,999 for women (455 | 8.6%).
| Income | Male | Female |
| $2,499 or less | 423 (7.8%) | 395 (7.5%) |
| $2,500 to $4,999 | 277 (5.1%) | 391 (7.4%) |
| $5,000 to $7,499 | 339 (6.3%) | 299 (5.7%) |
| $7,500 to $9,999 | 201 (3.7%) | 139 (2.6%) |
| $10,000 to $12,499 | 120 (2.2%) | 287 (5.4%) |
| $12,500 to $14,999 | 110 (2.0%) | 150 (2.8%) |
| $15,000 to $17,499 | 113 (2.1%) | 261 (5.0%) |
| $17,500 to $19,999 | 95 (1.8%) | 196 (3.7%) |
| $20,000 to $22,499 | 238 (4.4%) | 161 (3.0%) |
| $22,500 to $24,999 | 162 (3.0%) | 251 (4.8%) |
| $25,000 to $29,999 | 542 (10.0%) | 455 (8.6%) |
| $30,000 to $34,999 | 324 (6.0%) | 256 (4.9%) |
| $35,000 to $39,999 | 193 (3.6%) | 286 (5.4%) |
| $40,000 to $44,999 | 195 (3.6%) | 339 (6.4%) |
| $45,000 to $49,999 | 294 (5.4%) | 328 (6.2%) |
| $50,000 to $54,999 | 259 (4.8%) | 197 (3.7%) |
| $55,000 to $64,999 | 290 (5.4%) | 345 (6.5%) |
| $65,000 to $74,999 | 313 (5.8%) | 113 (2.1%) |
| $75,000 to $99,999 | 568 (10.5%) | 242 (4.6%) |
| $100,000+ | 358 (6.6%) | 186 (3.5%) |
| Total | 5,414 (100.0%) | 5,277 (100.0%) |
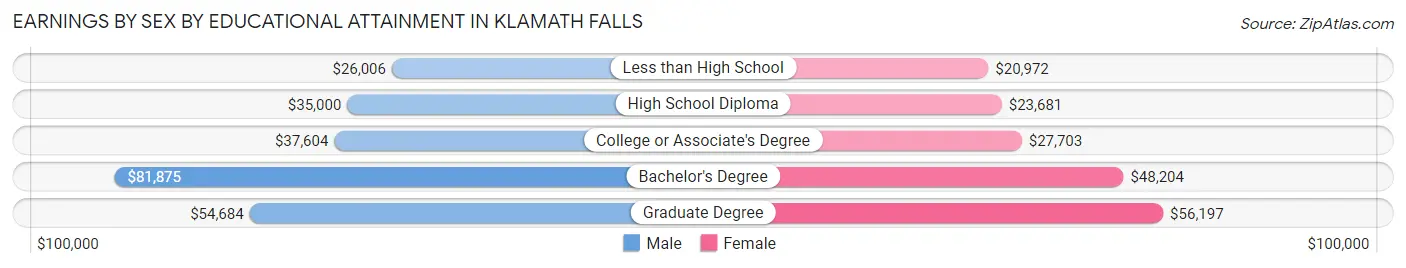
Earnings by Sex by Educational Attainment in Klamath Falls
Average earnings in Klamath Falls are $42,018 for men and $32,224 for women, a difference of 23.3%. Men with an educational attainment of bachelor's degree enjoy the highest average annual earnings of $81,875, while those with less than high school education earn the least with $26,006. Women with an educational attainment of graduate degree earn the most with the average annual earnings of $56,197, while those with less than high school education have the smallest earnings of $20,972.
| Educational Attainment | Male Income | Female Income |
| Less than High School | $26,006 | $20,972 |
| High School Diploma | $35,000 | $23,681 |
| College or Associate's Degree | $37,604 | $27,703 |
| Bachelor's Degree | $81,875 | $48,204 |
| Graduate Degree | $54,684 | $56,197 |
| Total | $42,018 | $32,224 |
Family Income in Klamath Falls
Family Income Brackets in Klamath Falls
According to the Klamath Falls family income data, there are 964 families falling into the $50,000 to $74,999 income range, which is the most common income bracket and makes up 20.2% of all families. Conversely, the $150,000 to $199,999 income bracket is the least frequent group with only 210 families (4.4%) belonging to this category.
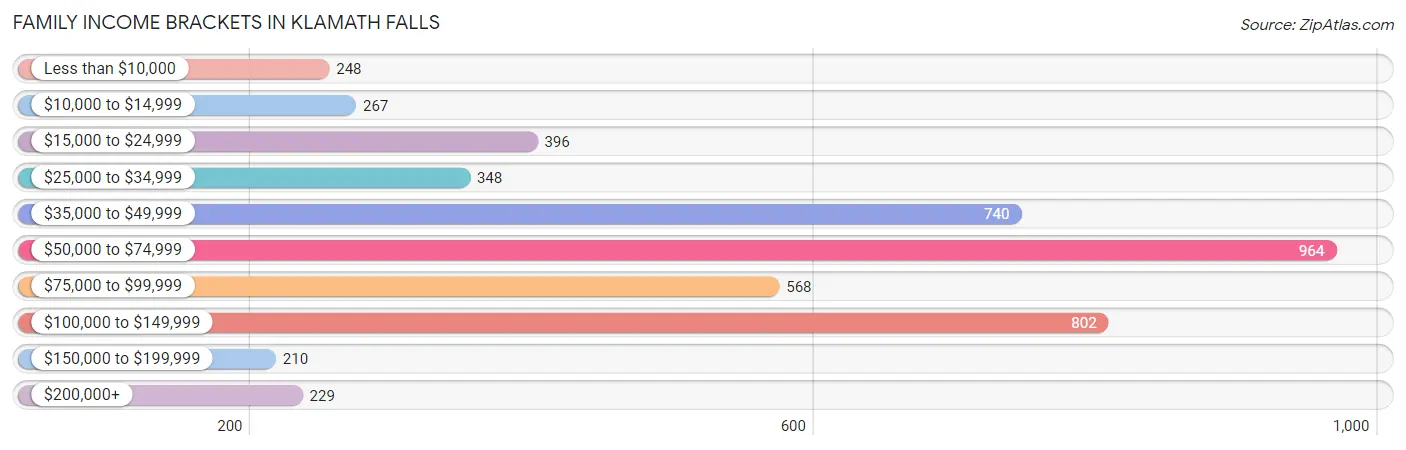
| Income Bracket | # Families | % Families |
| Less than $10,000 | 248 | 5.2% |
| $10,000 to $14,999 | 267 | 5.6% |
| $15,000 to $24,999 | 396 | 8.3% |
| $25,000 to $34,999 | 348 | 7.3% |
| $35,000 to $49,999 | 740 | 15.5% |
| $50,000 to $74,999 | 964 | 20.2% |
| $75,000 to $99,999 | 568 | 11.9% |
| $100,000 to $149,999 | 802 | 16.8% |
| $150,000 to $199,999 | 210 | 4.4% |
| $200,000+ | 229 | 4.8% |
Family Income by Famaliy Size in Klamath Falls
5-person families (429 | 9.0%) account for the highest median family income in Klamath Falls with $107,574 per family, while 2-person families (2,323 | 48.7%) have the highest median income of $26,219 per family member.
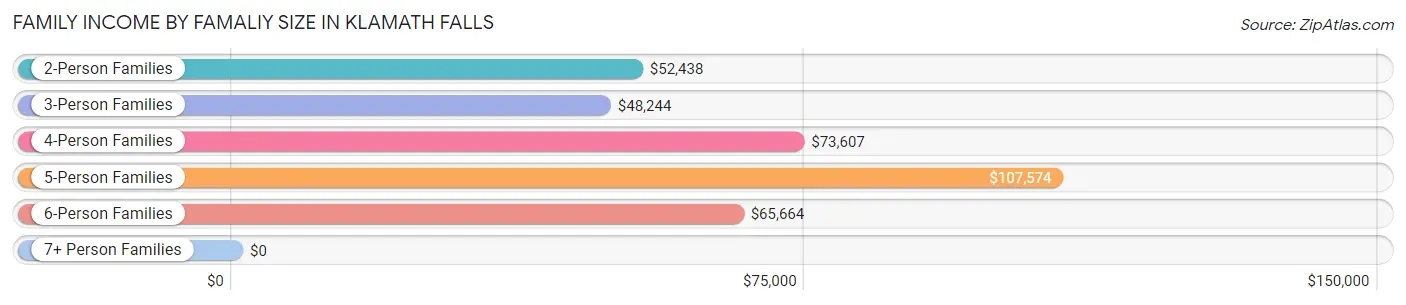
| Income Bracket | # Families | Median Income |
| 2-Person Families | 2,323 (48.7%) | $52,438 |
| 3-Person Families | 1,085 (22.7%) | $48,244 |
| 4-Person Families | 747 (15.7%) | $73,607 |
| 5-Person Families | 429 (9.0%) | $107,574 |
| 6-Person Families | 154 (3.2%) | $65,664 |
| 7+ Person Families | 34 (0.7%) | $0 |
| Total | 4,772 (100.0%) | $60,558 |
Family Income by Number of Earners in Klamath Falls
The median family income in Klamath Falls is $60,558, with families comprising 2 earners (1,811) having the highest median family income of $96,487, while families with no earners (899) have the lowest median family income of $35,341, accounting for 38.0% and 18.8% of families, respectively.
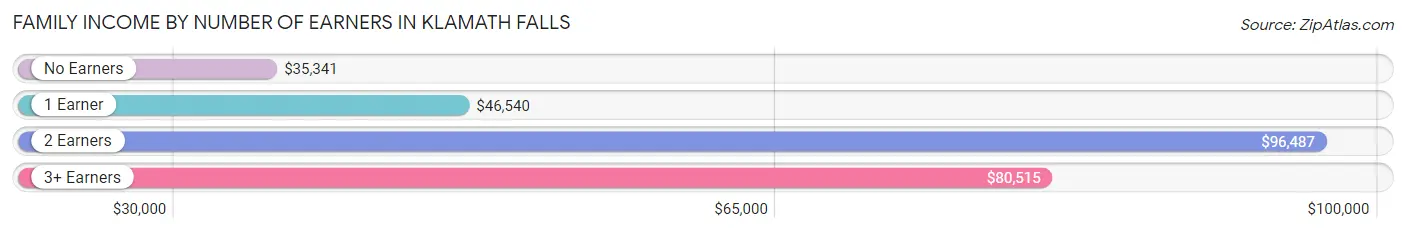
| Number of Earners | # Families | Median Income |
| No Earners | 899 (18.8%) | $35,341 |
| 1 Earner | 1,855 (38.9%) | $46,540 |
| 2 Earners | 1,811 (38.0%) | $96,487 |
| 3+ Earners | 207 (4.3%) | $80,515 |
| Total | 4,772 (100.0%) | $60,558 |
Household Income in Klamath Falls
Household Income Brackets in Klamath Falls
With 1,661 households falling in the category, the $50,000 to $74,999 income range is the most frequent in Klamath Falls, accounting for 18.7% of all households. In contrast, only 267 households (3.0%) fall into the $150,000 to $199,999 income bracket, making it the least populous group.
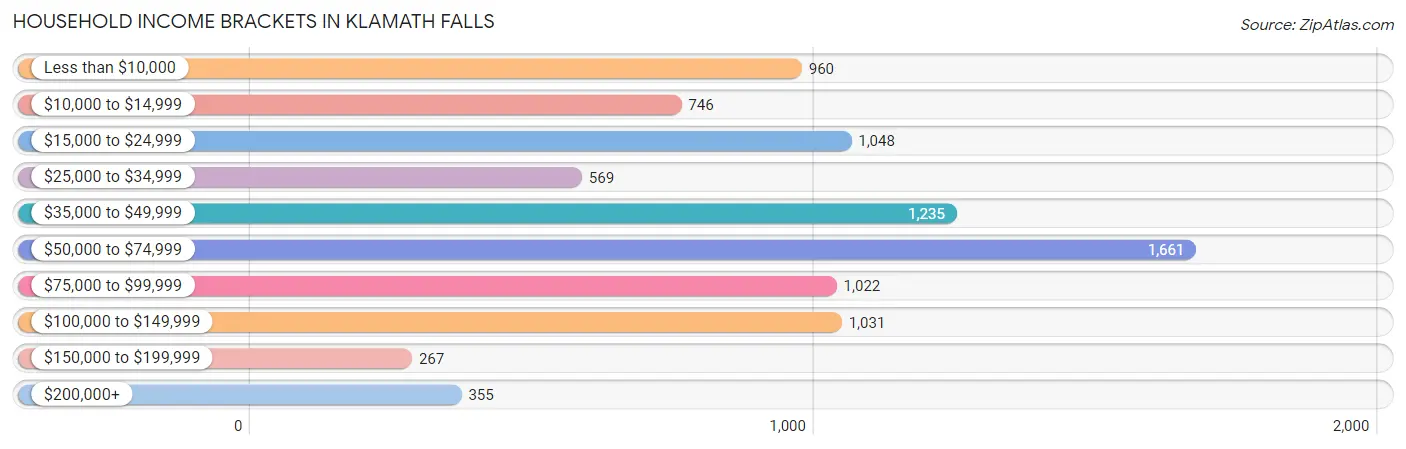
| Income Bracket | # Households | % Households |
| Less than $10,000 | 960 | 10.8% |
| $10,000 to $14,999 | 746 | 8.4% |
| $15,000 to $24,999 | 1,048 | 11.8% |
| $25,000 to $34,999 | 569 | 6.4% |
| $35,000 to $49,999 | 1,235 | 13.9% |
| $50,000 to $74,999 | 1,661 | 18.7% |
| $75,000 to $99,999 | 1,022 | 11.5% |
| $100,000 to $149,999 | 1,031 | 11.6% |
| $150,000 to $199,999 | 267 | 3.0% |
| $200,000+ | 355 | 4.0% |
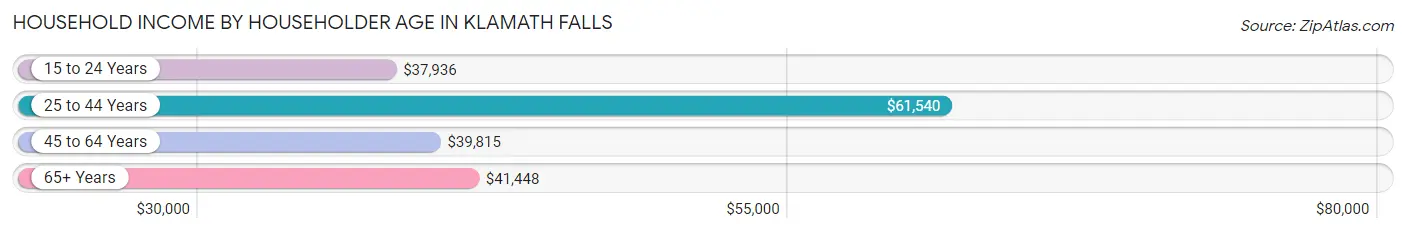
Household Income by Householder Age in Klamath Falls
The median household income in Klamath Falls is $46,695, with the highest median household income of $61,540 found in the 25 to 44 years age bracket for the primary householder. A total of 3,187 households (35.9%) fall into this category. Meanwhile, the 15 to 24 years age bracket for the primary householder has the lowest median household income of $37,936, with 721 households (8.1%) in this group.
| Income Bracket | # Households | Median Income |
| 15 to 24 Years | 721 (8.1%) | $37,936 |
| 25 to 44 Years | 3,187 (35.9%) | $61,540 |
| 45 to 64 Years | 2,840 (32.0%) | $39,815 |
| 65+ Years | 2,137 (24.0%) | $41,448 |
| Total | 8,885 (100.0%) | $46,695 |
Poverty in Klamath Falls
Income Below Poverty by Sex and Age in Klamath Falls
With 23.6% poverty level for males and 20.6% for females among the residents of Klamath Falls, 6 to 11 year old males and 18 to 24 year old females are the most vulnerable to poverty, with 283 males (44.4%) and 419 females (43.6%) in their respective age groups living below the poverty level.
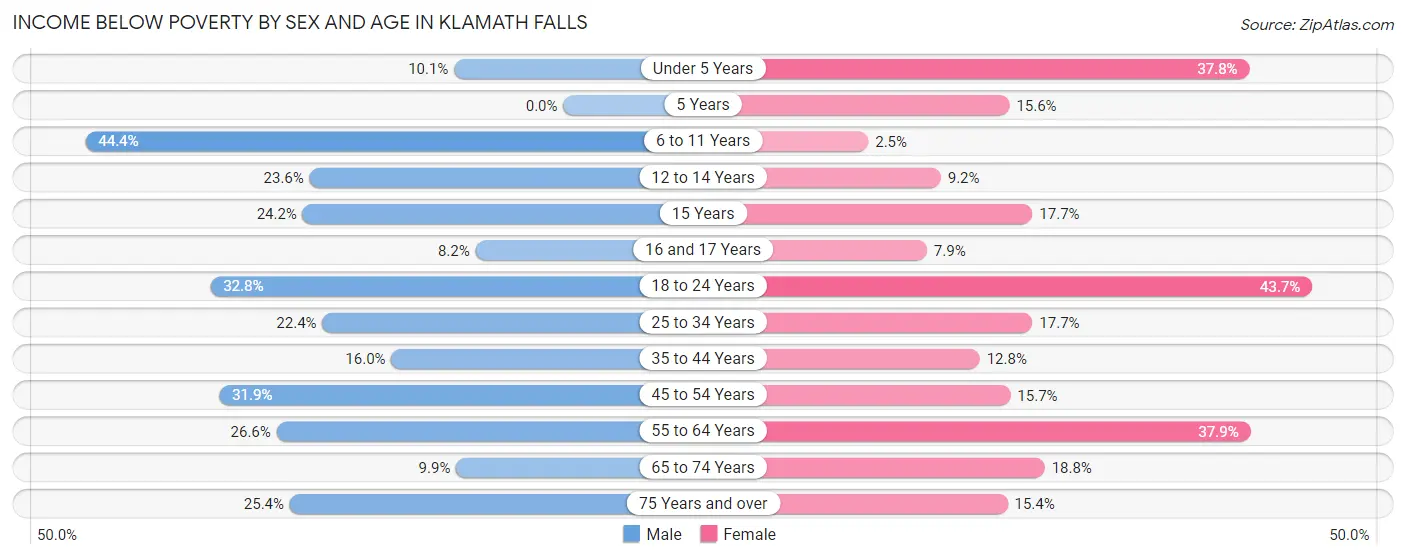
| Age Bracket | Male | Female |
| Under 5 Years | 54 (10.1%) | 174 (37.8%) |
| 5 Years | 0 (0.0%) | 35 (15.6%) |
| 6 to 11 Years | 283 (44.4%) | 18 (2.5%) |
| 12 to 14 Years | 146 (23.5%) | 35 (9.2%) |
| 15 Years | 45 (24.2%) | 23 (17.7%) |
| 16 and 17 Years | 33 (8.2%) | 29 (7.9%) |
| 18 to 24 Years | 449 (32.8%) | 419 (43.6%) |
| 25 to 34 Years | 391 (22.4%) | 280 (17.7%) |
| 35 to 44 Years | 200 (16.0%) | 188 (12.8%) |
| 45 to 54 Years | 368 (31.9%) | 184 (15.7%) |
| 55 to 64 Years | 309 (26.6%) | 459 (37.9%) |
| 65 to 74 Years | 105 (9.9%) | 199 (18.8%) |
| 75 Years and over | 133 (25.4%) | 110 (15.4%) |
| Total | 2,516 (23.6%) | 2,153 (20.6%) |
Income Above Poverty by Sex and Age in Klamath Falls
According to the poverty statistics in Klamath Falls, males aged 5 years and females aged 6 to 11 years are the age groups that are most secure financially, with 100.0% of males and 97.5% of females in these age groups living above the poverty line.
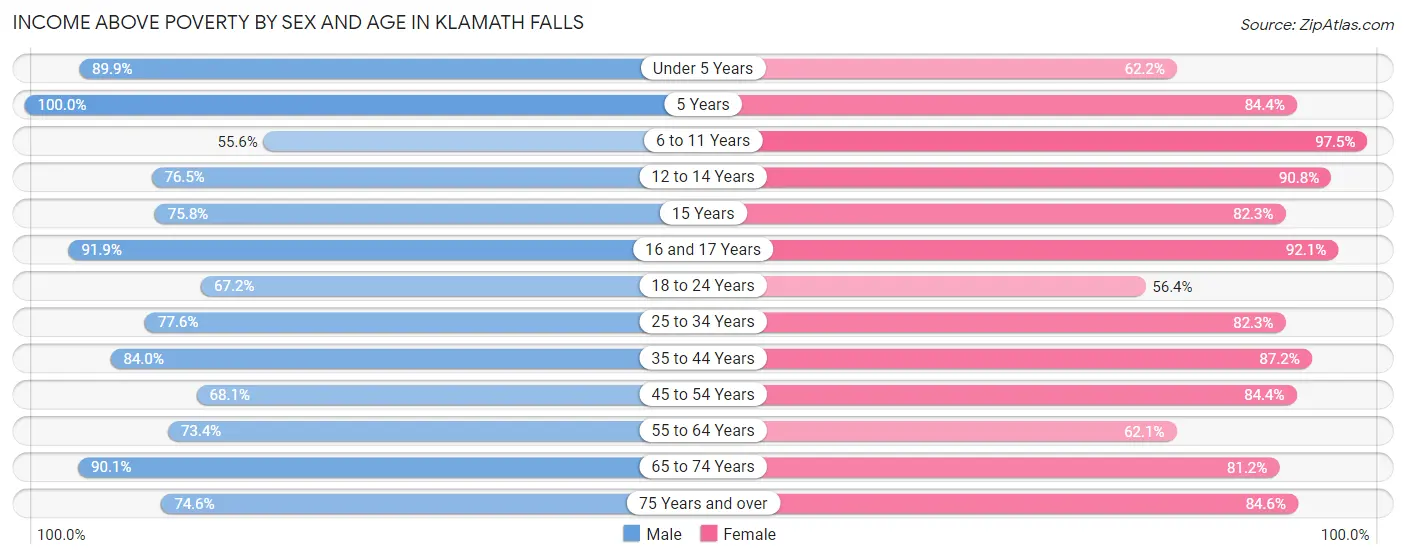
| Age Bracket | Male | Female |
| Under 5 Years | 479 (89.9%) | 286 (62.2%) |
| 5 Years | 31 (100.0%) | 190 (84.4%) |
| 6 to 11 Years | 355 (55.6%) | 713 (97.5%) |
| 12 to 14 Years | 474 (76.4%) | 346 (90.8%) |
| 15 Years | 141 (75.8%) | 107 (82.3%) |
| 16 and 17 Years | 372 (91.8%) | 338 (92.1%) |
| 18 to 24 Years | 921 (67.2%) | 541 (56.4%) |
| 25 to 34 Years | 1,358 (77.6%) | 1,303 (82.3%) |
| 35 to 44 Years | 1,053 (84.0%) | 1,281 (87.2%) |
| 45 to 54 Years | 784 (68.1%) | 992 (84.4%) |
| 55 to 64 Years | 852 (73.4%) | 751 (62.1%) |
| 65 to 74 Years | 951 (90.1%) | 858 (81.2%) |
| 75 Years and over | 391 (74.6%) | 605 (84.6%) |
| Total | 8,162 (76.4%) | 8,311 (79.4%) |
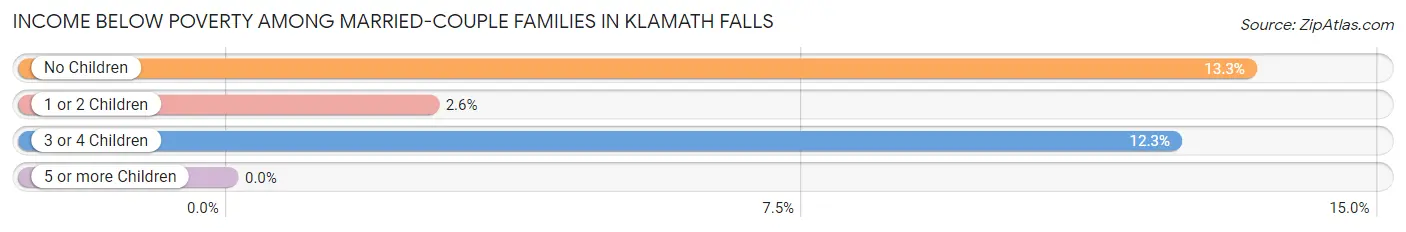
Income Below Poverty Among Married-Couple Families in Klamath Falls
The poverty statistics for married-couple families in Klamath Falls show that 9.7% or 305 of the total 3,160 families live below the poverty line. Families with no children have the highest poverty rate of 13.3%, comprising of 228 families. On the other hand, families with 5 or more children have the lowest poverty rate of 0.0%, which includes 0 families.
| Children | Above Poverty | Below Poverty |
| No Children | 1,486 (86.7%) | 228 (13.3%) |
| 1 or 2 Children | 1,002 (97.4%) | 27 (2.6%) |
| 3 or 4 Children | 356 (87.7%) | 50 (12.3%) |
| 5 or more Children | 11 (100.0%) | 0 (0.0%) |
| Total | 2,855 (90.3%) | 305 (9.7%) |
Income Below Poverty Among Single-Parent Households in Klamath Falls
According to the poverty data in Klamath Falls, 36.3% or 144 single-father households and 27.2% or 331 single-mother households are living below the poverty line. Among single-father households, those with 3 or 4 children have the highest poverty rate, with 13 households (54.2%) experiencing poverty. Likewise, among single-mother households, those with 1 or 2 children have the highest poverty rate, with 271 households (35.8%) falling below the poverty line.
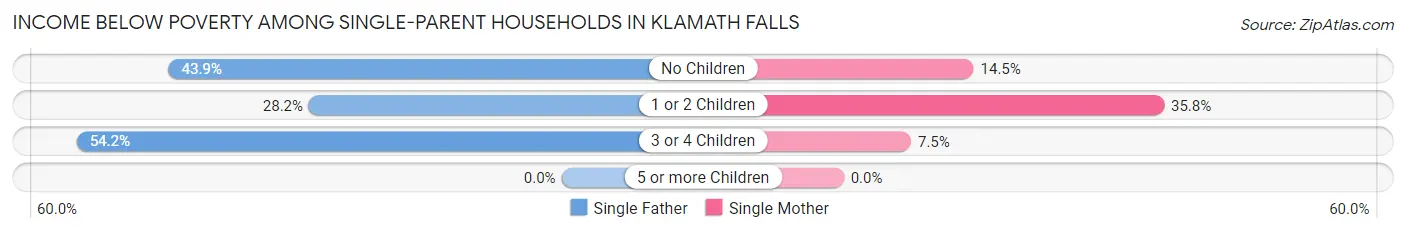
| Children | Single Father | Single Mother |
| No Children | 72 (43.9%) | 53 (14.5%) |
| 1 or 2 Children | 59 (28.2%) | 271 (35.8%) |
| 3 or 4 Children | 13 (54.2%) | 7 (7.5%) |
| 5 or more Children | 0 (0.0%) | 0 (0.0%) |
| Total | 144 (36.3%) | 331 (27.2%) |
Income Below Poverty Among Married-Couple vs Single-Parent Households in Klamath Falls
The poverty data for Klamath Falls shows that 305 of the married-couple family households (9.7%) and 475 of the single-parent households (29.5%) are living below the poverty level. Within the married-couple family households, those with no children have the highest poverty rate, with 228 households (13.3%) falling below the poverty line. Among the single-parent households, those with 1 or 2 children have the highest poverty rate, with 330 household (34.2%) living below poverty.
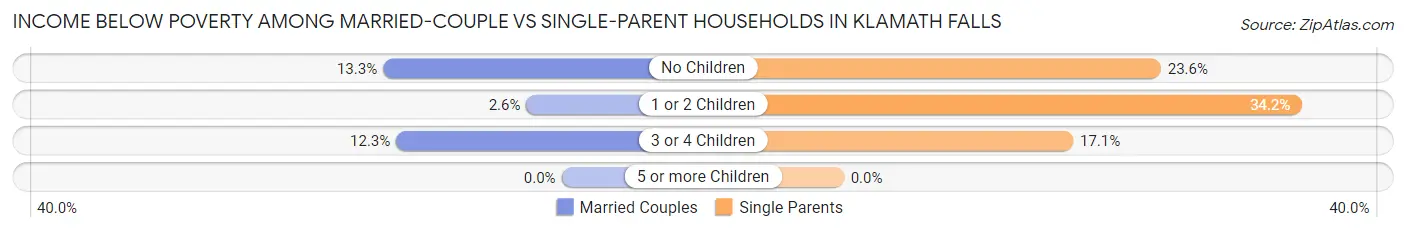
| Children | Married-Couple Families | Single-Parent Households |
| No Children | 228 (13.3%) | 125 (23.6%) |
| 1 or 2 Children | 27 (2.6%) | 330 (34.2%) |
| 3 or 4 Children | 50 (12.3%) | 20 (17.1%) |
| 5 or more Children | 0 (0.0%) | 0 (0.0%) |
| Total | 305 (9.7%) | 475 (29.5%) |
Race in Klamath Falls
The most populous races in Klamath Falls are White / Caucasian (17,800 | 81.6%), Hispanic or Latino (3,394 | 15.6%), and Two or more Races (2,375 | 10.9%).
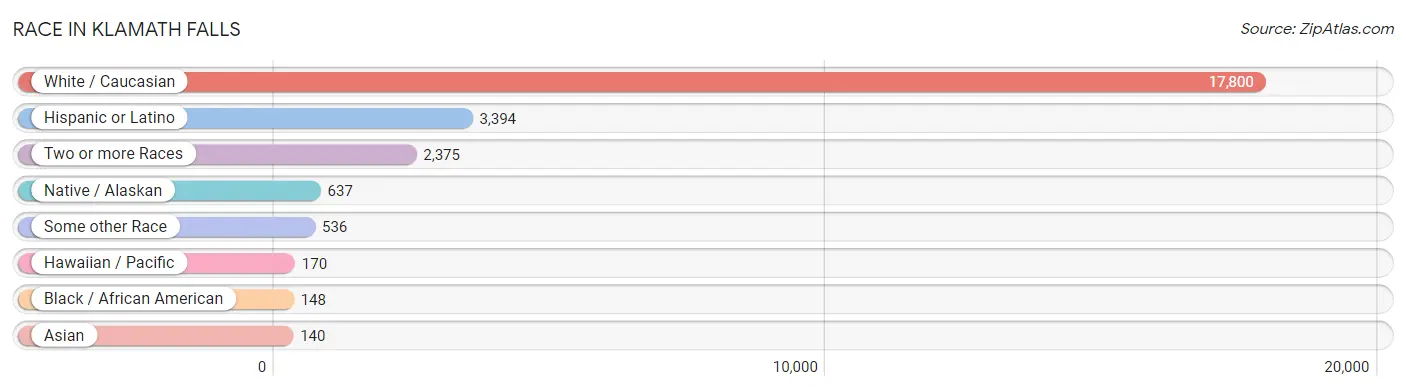
| Race | # Population | % Population |
| Asian | 140 | 0.6% |
| Black / African American | 148 | 0.7% |
| Hawaiian / Pacific | 170 | 0.8% |
| Hispanic or Latino | 3,394 | 15.6% |
| Native / Alaskan | 637 | 2.9% |
| White / Caucasian | 17,800 | 81.6% |
| Two or more Races | 2,375 | 10.9% |
| Some other Race | 536 | 2.5% |
| Total | 21,806 | 100.0% |
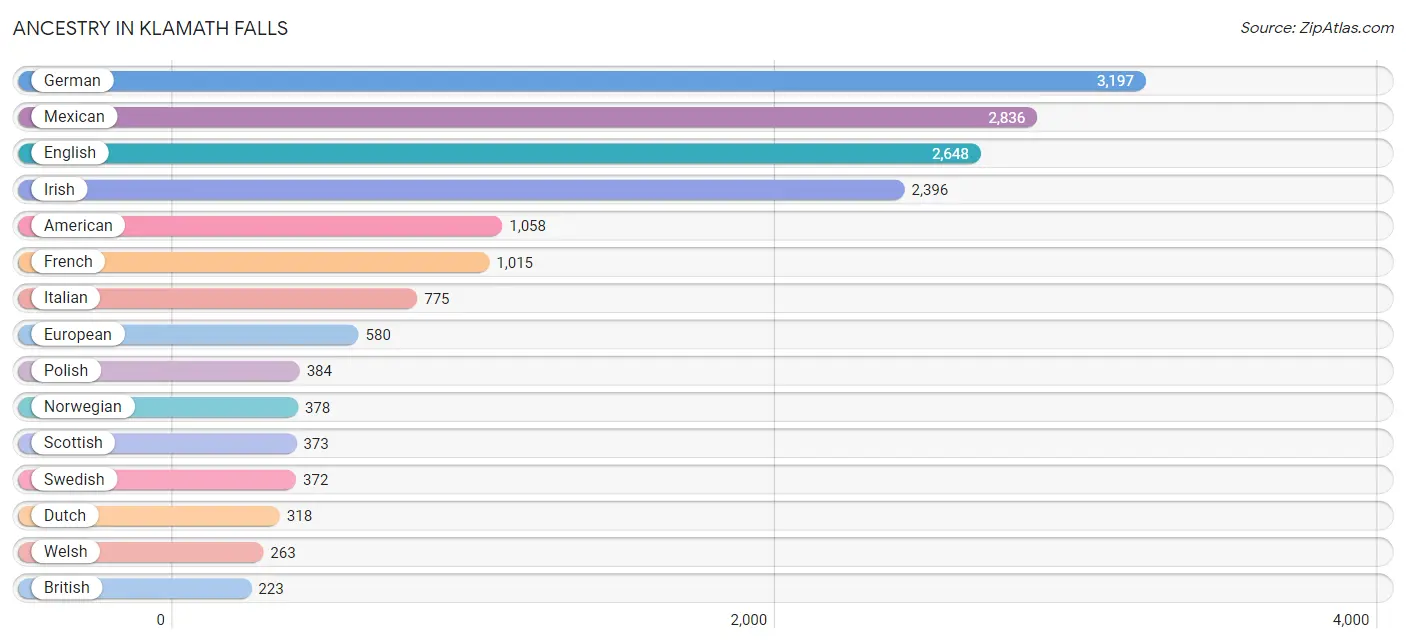
Ancestry in Klamath Falls
The most populous ancestries reported in Klamath Falls are German (3,197 | 14.7%), Mexican (2,836 | 13.0%), English (2,648 | 12.1%), Irish (2,396 | 11.0%), and American (1,058 | 4.9%), together accounting for 55.6% of all Klamath Falls residents.
| Ancestry | # Population | % Population |
| African | 28 | 0.1% |
| Alaska Native | 26 | 0.1% |
| Aleut | 20 | 0.1% |
| American | 1,058 | 4.9% |
| Apache | 51 | 0.2% |
| Arab | 19 | 0.1% |
| Arapaho | 29 | 0.1% |
| Australian | 56 | 0.3% |
| Austrian | 13 | 0.1% |
| Belgian | 18 | 0.1% |
| Bhutanese | 13 | 0.1% |
| Blackfeet | 12 | 0.1% |
| British | 223 | 1.0% |
| Burmese | 50 | 0.2% |
| Canadian | 44 | 0.2% |
| Central American | 211 | 1.0% |
| Cherokee | 178 | 0.8% |
| Chickasaw | 6 | 0.0% |
| Chilean | 11 | 0.1% |
| Chippewa | 5 | 0.0% |
| Choctaw | 111 | 0.5% |
| Colombian | 29 | 0.1% |
| Costa Rican | 56 | 0.3% |
| Croatian | 59 | 0.3% |
| Cuban | 12 | 0.1% |
| Czech | 23 | 0.1% |
| Czechoslovakian | 19 | 0.1% |
| Danish | 204 | 0.9% |
| Dutch | 318 | 1.5% |
| Eastern European | 25 | 0.1% |
| Egyptian | 15 | 0.1% |
| English | 2,648 | 12.1% |
| Estonian | 7 | 0.0% |
| Ethiopian | 13 | 0.1% |
| European | 580 | 2.7% |
| Fijian | 71 | 0.3% |
| Finnish | 103 | 0.5% |
| French | 1,015 | 4.6% |
| French Canadian | 123 | 0.6% |
| German | 3,197 | 14.7% |
| Greek | 5 | 0.0% |
| Guamanian / Chamorro | 7 | 0.0% |
| Guatemalan | 41 | 0.2% |
| Honduran | 84 | 0.4% |
| Hungarian | 21 | 0.1% |
| Icelander | 12 | 0.1% |
| Indian (Asian) | 57 | 0.3% |
| Inupiat | 66 | 0.3% |
| Irish | 2,396 | 11.0% |
| Israeli | 6 | 0.0% |
| Italian | 775 | 3.5% |
| Jamaican | 88 | 0.4% |
| Korean | 199 | 0.9% |
| Laotian | 103 | 0.5% |
| Latvian | 14 | 0.1% |
| Lithuanian | 37 | 0.2% |
| Mexican | 2,836 | 13.0% |
| Mexican American Indian | 113 | 0.5% |
| Native Hawaiian | 125 | 0.6% |
| Navajo | 9 | 0.0% |
| Northern European | 8 | 0.0% |
| Norwegian | 378 | 1.7% |
| Osage | 9 | 0.0% |
| Paiute | 12 | 0.1% |
| Panamanian | 7 | 0.0% |
| Pennsylvania German | 12 | 0.1% |
| Peruvian | 35 | 0.2% |
| Polish | 384 | 1.8% |
| Portuguese | 113 | 0.5% |
| Romanian | 15 | 0.1% |
| Russian | 96 | 0.4% |
| Salvadoran | 23 | 0.1% |
| Samoan | 161 | 0.7% |
| Scandinavian | 84 | 0.4% |
| Scotch-Irish | 176 | 0.8% |
| Scottish | 373 | 1.7% |
| Sierra Leonean | 2 | 0.0% |
| Sioux | 27 | 0.1% |
| Slovak | 7 | 0.0% |
| Slovene | 14 | 0.1% |
| South African | 11 | 0.1% |
| South American | 75 | 0.3% |
| Spaniard | 160 | 0.7% |
| Spanish | 21 | 0.1% |
| Sri Lankan | 13 | 0.1% |
| Subsaharan African | 54 | 0.3% |
| Swedish | 372 | 1.7% |
| Swiss | 138 | 0.6% |
| Ute | 12 | 0.1% |
| Welsh | 263 | 1.2% | View All 90 Rows |
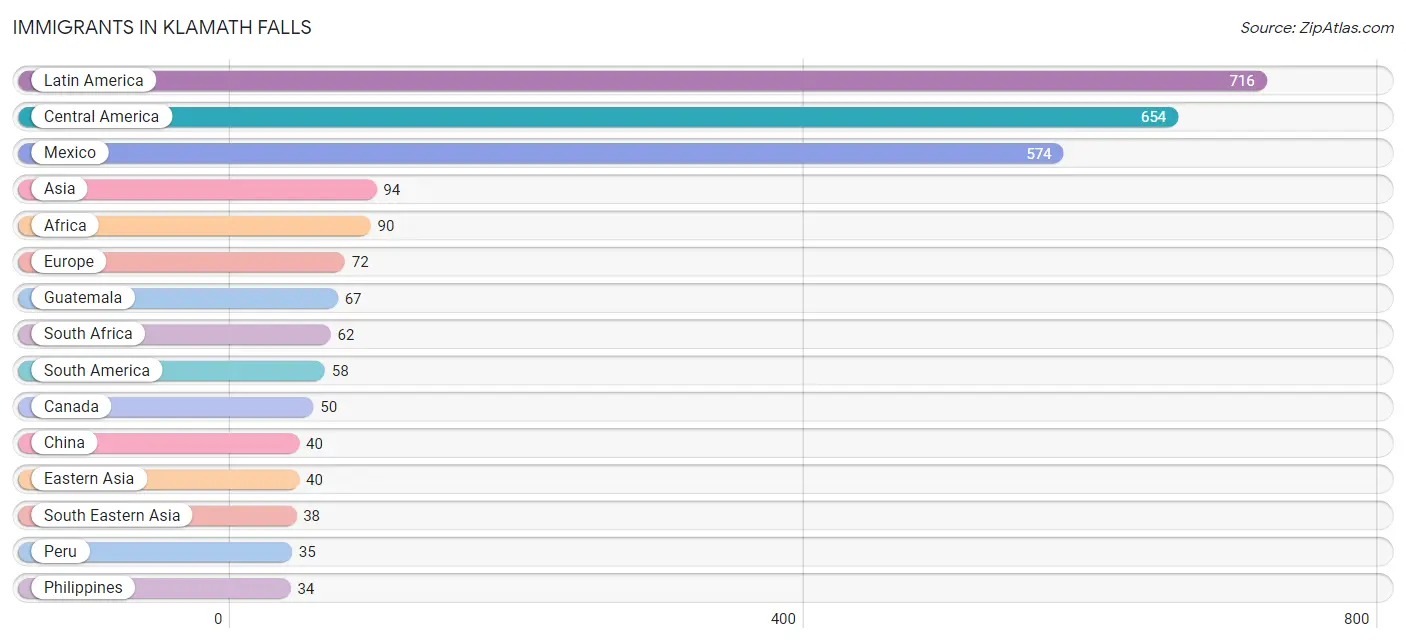
Immigrants in Klamath Falls
The most numerous immigrant groups reported in Klamath Falls came from Latin America (716 | 3.3%), Central America (654 | 3.0%), Mexico (574 | 2.6%), Asia (94 | 0.4%), and Africa (90 | 0.4%), together accounting for 9.8% of all Klamath Falls residents.
| Immigration Origin | # Population | % Population |
| Africa | 90 | 0.4% |
| Asia | 94 | 0.4% |
| Australia | 5 | 0.0% |
| Canada | 50 | 0.2% |
| Caribbean | 4 | 0.0% |
| Central America | 654 | 3.0% |
| Chile | 11 | 0.1% |
| China | 40 | 0.2% |
| Colombia | 12 | 0.1% |
| Costa Rica | 13 | 0.1% |
| Cuba | 4 | 0.0% |
| Eastern Africa | 26 | 0.1% |
| Eastern Asia | 40 | 0.2% |
| Eastern Europe | 21 | 0.1% |
| England | 18 | 0.1% |
| Ethiopia | 13 | 0.1% |
| Europe | 72 | 0.3% |
| Germany | 26 | 0.1% |
| Guatemala | 67 | 0.3% |
| Kenya | 13 | 0.1% |
| Latin America | 716 | 3.3% |
| Mexico | 574 | 2.6% |
| Nepal | 12 | 0.1% |
| Northern Europe | 18 | 0.1% |
| Oceania | 11 | 0.1% |
| Peru | 35 | 0.2% |
| Philippines | 34 | 0.2% |
| Romania | 5 | 0.0% |
| Russia | 9 | 0.0% |
| Saudi Arabia | 4 | 0.0% |
| Sierra Leone | 2 | 0.0% |
| South Africa | 62 | 0.3% |
| South America | 58 | 0.3% |
| South Central Asia | 12 | 0.1% |
| South Eastern Asia | 38 | 0.2% |
| Southern Europe | 7 | 0.0% |
| Taiwan | 4 | 0.0% |
| Vietnam | 4 | 0.0% |
| Western Africa | 2 | 0.0% |
| Western Asia | 4 | 0.0% |
| Western Europe | 26 | 0.1% | View All 41 Rows |
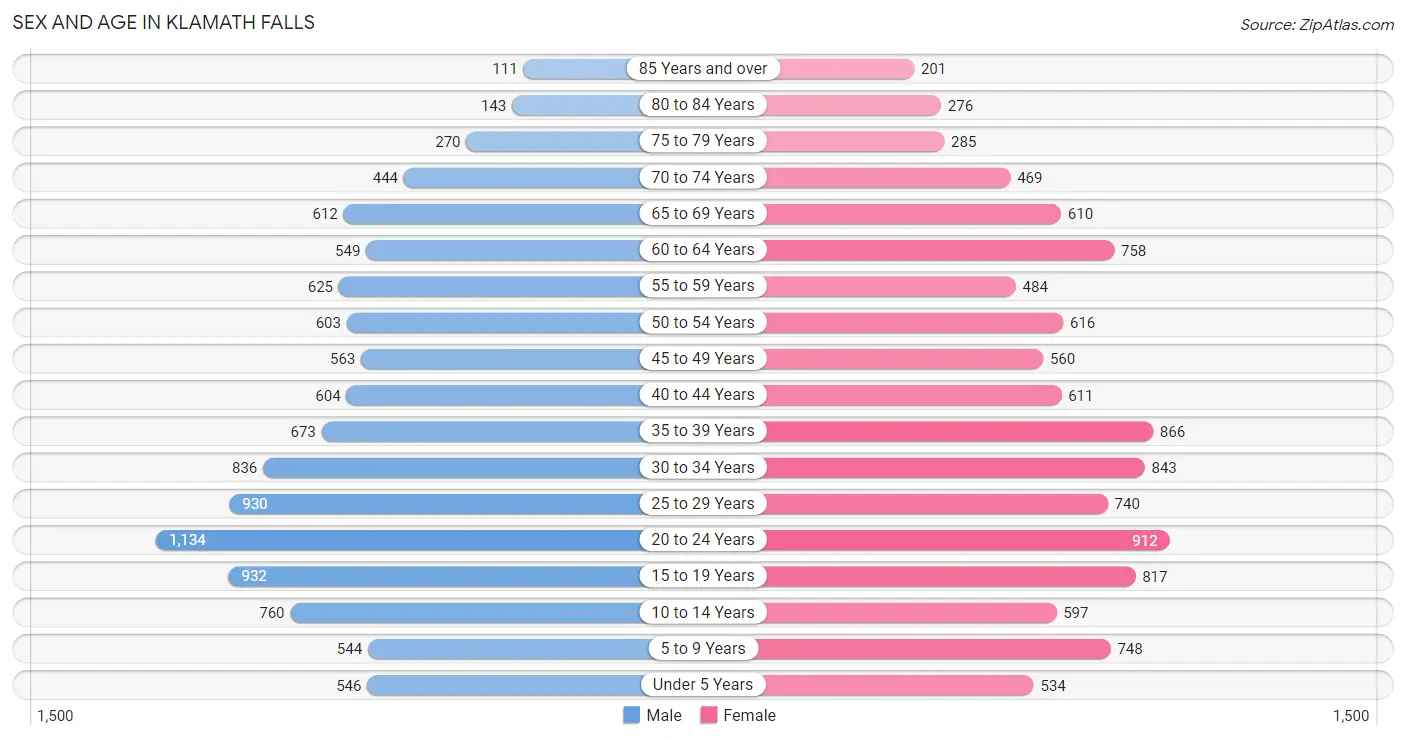
Sex and Age in Klamath Falls
Sex and Age in Klamath Falls
The most populous age groups in Klamath Falls are 20 to 24 Years (1,134 | 10.4%) for men and 20 to 24 Years (912 | 8.4%) for women.
| Age Bracket | Male | Female |
| Under 5 Years | 546 (5.0%) | 534 (4.9%) |
| 5 to 9 Years | 544 (5.0%) | 748 (6.9%) |
| 10 to 14 Years | 760 (7.0%) | 597 (5.5%) |
| 15 to 19 Years | 932 (8.6%) | 817 (7.5%) |
| 20 to 24 Years | 1,134 (10.4%) | 912 (8.4%) |
| 25 to 29 Years | 930 (8.6%) | 740 (6.8%) |
| 30 to 34 Years | 836 (7.7%) | 843 (7.7%) |
| 35 to 39 Years | 673 (6.2%) | 866 (7.9%) |
| 40 to 44 Years | 604 (5.6%) | 611 (5.6%) |
| 45 to 49 Years | 563 (5.2%) | 560 (5.1%) |
| 50 to 54 Years | 603 (5.5%) | 616 (5.6%) |
| 55 to 59 Years | 625 (5.8%) | 484 (4.4%) |
| 60 to 64 Years | 549 (5.1%) | 758 (6.9%) |
| 65 to 69 Years | 612 (5.6%) | 610 (5.6%) |
| 70 to 74 Years | 444 (4.1%) | 469 (4.3%) |
| 75 to 79 Years | 270 (2.5%) | 285 (2.6%) |
| 80 to 84 Years | 143 (1.3%) | 276 (2.5%) |
| 85 Years and over | 111 (1.0%) | 201 (1.8%) |
| Total | 10,879 (100.0%) | 10,927 (100.0%) |
Families and Households in Klamath Falls
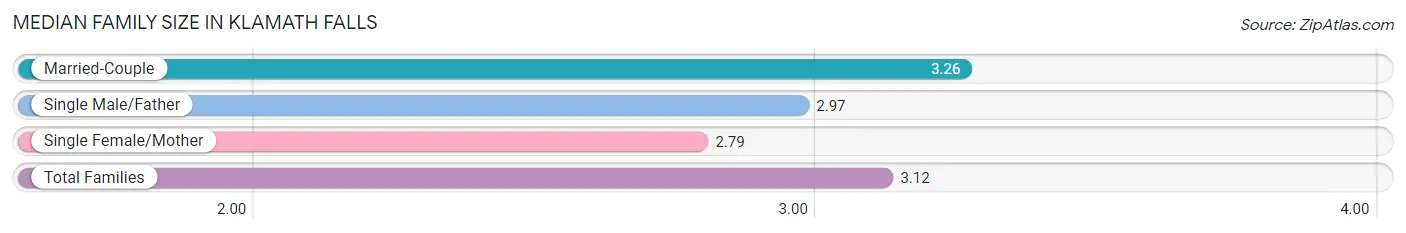
Median Family Size in Klamath Falls
The median family size in Klamath Falls is 3.12 persons per family, with married-couple families (3,160 | 66.2%) accounting for the largest median family size of 3.26 persons per family. On the other hand, single female/mother families (1,215 | 25.5%) represent the smallest median family size with 2.79 persons per family.
| Family Type | # Families | Family Size |
| Married-Couple | 3,160 (66.2%) | 3.26 |
| Single Male/Father | 397 (8.3%) | 2.97 |
| Single Female/Mother | 1,215 (25.5%) | 2.79 |
| Total Families | 4,772 (100.0%) | 3.12 |
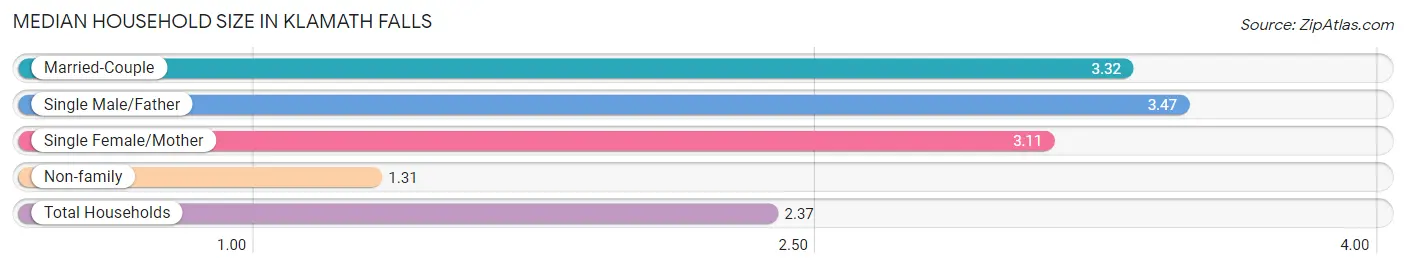
Median Household Size in Klamath Falls
The median household size in Klamath Falls is 2.37 persons per household, with single male/father households (397 | 4.5%) accounting for the largest median household size of 3.47 persons per household. non-family households (4,113 | 46.3%) represent the smallest median household size with 1.31 persons per household.
| Household Type | # Households | Household Size |
| Married-Couple | 3,160 (35.6%) | 3.32 |
| Single Male/Father | 397 (4.5%) | 3.47 |
| Single Female/Mother | 1,215 (13.7%) | 3.11 |
| Non-family | 4,113 (46.3%) | 1.31 |
| Total Households | 8,885 (100.0%) | 2.37 |
Household Size by Marriage Status in Klamath Falls
Out of a total of 8,885 households in Klamath Falls, 4,772 (53.7%) are family households, while 4,113 (46.3%) are nonfamily households. The most numerous type of family households are 2-person households, comprising 2,049, and the most common type of nonfamily households are 1-person households, comprising 3,163.
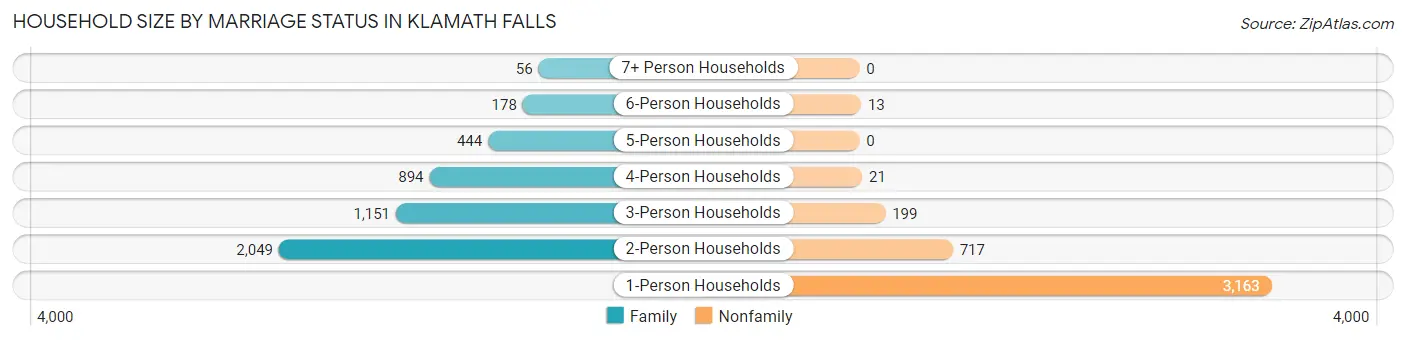
| Household Size | Family Households | Nonfamily Households |
| 1-Person Households | - | 3,163 (35.6%) |
| 2-Person Households | 2,049 (23.1%) | 717 (8.1%) |
| 3-Person Households | 1,151 (13.0%) | 199 (2.2%) |
| 4-Person Households | 894 (10.1%) | 21 (0.2%) |
| 5-Person Households | 444 (5.0%) | 0 (0.0%) |
| 6-Person Households | 178 (2.0%) | 13 (0.2%) |
| 7+ Person Households | 56 (0.6%) | 0 (0.0%) |
| Total | 4,772 (53.7%) | 4,113 (46.3%) |
Female Fertility in Klamath Falls
Fertility by Age in Klamath Falls
Average fertility rate in Klamath Falls is 60.0 births per 1,000 women. Women in the age bracket of 20 to 34 years have the highest fertility rate with 120.0 births per 1,000 women. Women in the age bracket of 20 to 34 years acount for 92.3% of all women with births.
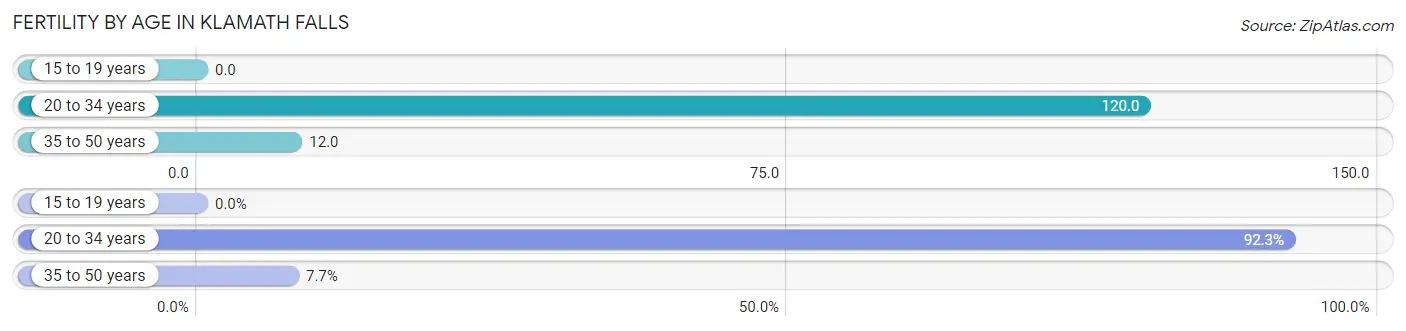
| Age Bracket | Women with Births | Births / 1,000 Women |
| 15 to 19 years | 0 (0.0%) | 0.0 |
| 20 to 34 years | 299 (92.3%) | 120.0 |
| 35 to 50 years | 25 (7.7%) | 12.0 |
| Total | 324 (100.0%) | 60.0 |
Fertility by Age by Marriage Status in Klamath Falls
54.3% of women with births (324) in Klamath Falls are married. The highest percentage of unmarried women with births falls into 35 to 50 years age bracket with 84.0% of them unmarried at the time of birth, while the lowest percentage of unmarried women with births belong to 20 to 34 years age bracket with 42.5% of them unmarried.
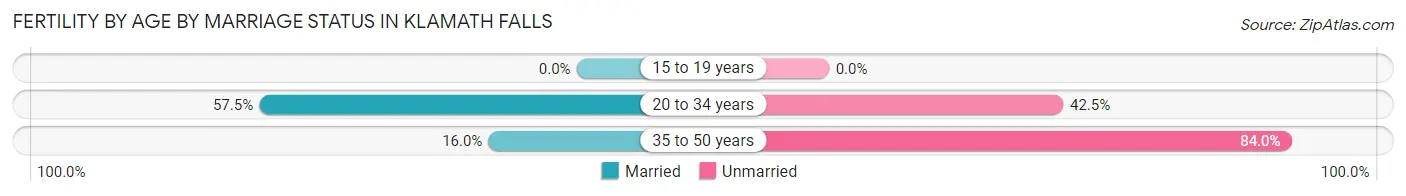
| Age Bracket | Married | Unmarried |
| 15 to 19 years | 0 (0.0%) | 0 (0.0%) |
| 20 to 34 years | 172 (57.5%) | 127 (42.5%) |
| 35 to 50 years | 4 (16.0%) | 21 (84.0%) |
| Total | 176 (54.3%) | 148 (45.7%) |
Fertility by Education in Klamath Falls
Average fertility rate in Klamath Falls is 60.0 births per 1,000 women. Women with the education attainment of graduate degree have the highest fertility rate of 133.0 births per 1,000 women, while women with the education attainment of less than high school have the lowest fertility at 7.0 births per 1,000 women. Women with the education attainment of college or associate's degree represent 39.8% of all women with births.
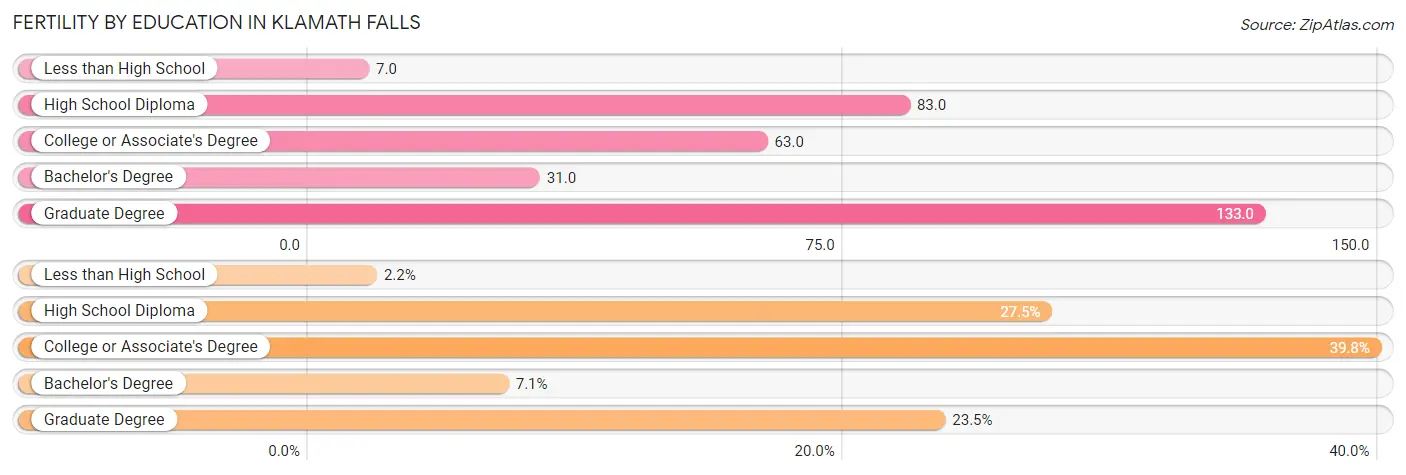
| Educational Attainment | Women with Births | Births / 1,000 Women |
| Less than High School | 7 (2.2%) | 7.0 |
| High School Diploma | 89 (27.5%) | 83.0 |
| College or Associate's Degree | 129 (39.8%) | 63.0 |
| Bachelor's Degree | 23 (7.1%) | 31.0 |
| Graduate Degree | 76 (23.5%) | 133.0 |
| Total | 324 (100.0%) | 60.0 |
Fertility by Education by Marriage Status in Klamath Falls
45.7% of women with births in Klamath Falls are unmarried. Women with the educational attainment of graduate degree are most likely to be married with 100.0% of them married at childbirth, while women with the educational attainment of less than high school are least likely to be married with 100.0% of them unmarried at childbirth.
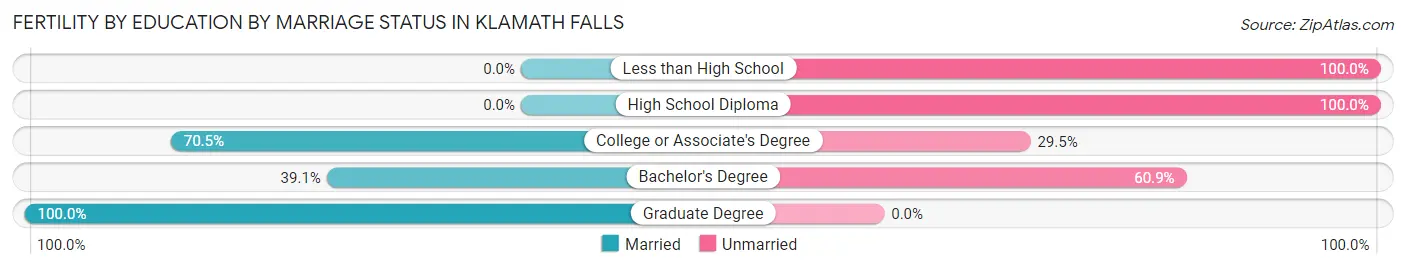
| Educational Attainment | Married | Unmarried |
| Less than High School | 0 (0.0%) | 7 (100.0%) |
| High School Diploma | 0 (0.0%) | 89 (100.0%) |
| College or Associate's Degree | 91 (70.5%) | 38 (29.5%) |
| Bachelor's Degree | 9 (39.1%) | 14 (60.9%) |
| Graduate Degree | 76 (100.0%) | 0 (0.0%) |
| Total | 176 (54.3%) | 148 (45.7%) |
Employment Characteristics in Klamath Falls
Employment by Class of Employer in Klamath Falls
Among the 8,883 employed individuals in Klamath Falls, private company employees (5,513 | 62.1%), local government employees (971 | 10.9%), and not-for-profit organizations (785 | 8.8%) make up the most common classes of employment.
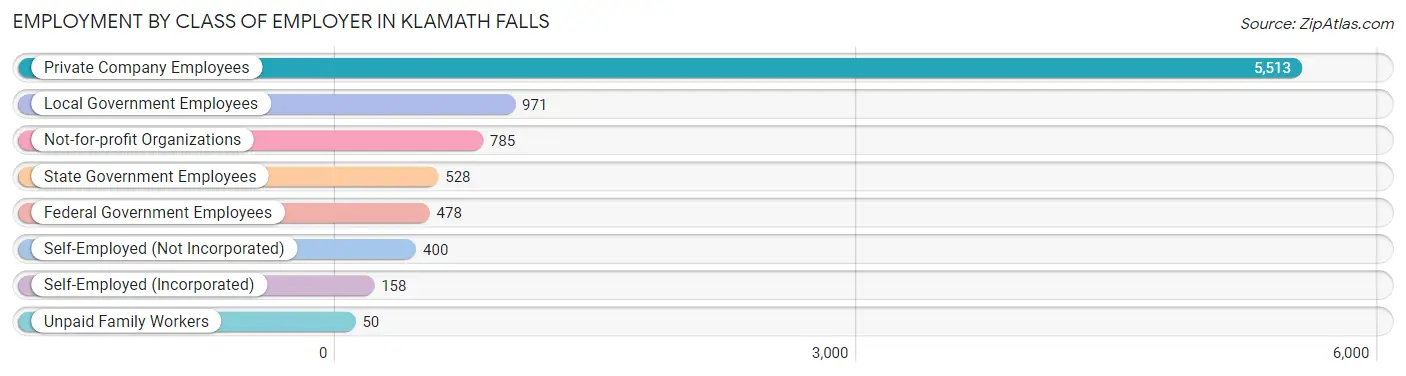
| Employer Class | # Employees | % Employees |
| Private Company Employees | 5,513 | 62.1% |
| Self-Employed (Incorporated) | 158 | 1.8% |
| Self-Employed (Not Incorporated) | 400 | 4.5% |
| Not-for-profit Organizations | 785 | 8.8% |
| Local Government Employees | 971 | 10.9% |
| State Government Employees | 528 | 5.9% |
| Federal Government Employees | 478 | 5.4% |
| Unpaid Family Workers | 50 | 0.6% |
| Total | 8,883 | 100.0% |
Employment Status by Age in Klamath Falls
According to the labor force statistics for Klamath Falls, out of the total population over 16 years of age (17,759), 55.4% or 9,838 individuals are in the labor force, with 8.1% or 797 of them unemployed. The age group with the highest labor force participation rate is 30 to 34 years, with 78.0% or 1,310 individuals in the labor force. Within the labor force, the 25 to 29 years age range has the highest percentage of unemployed individuals, with 14.7% or 190 of them being unemployed.
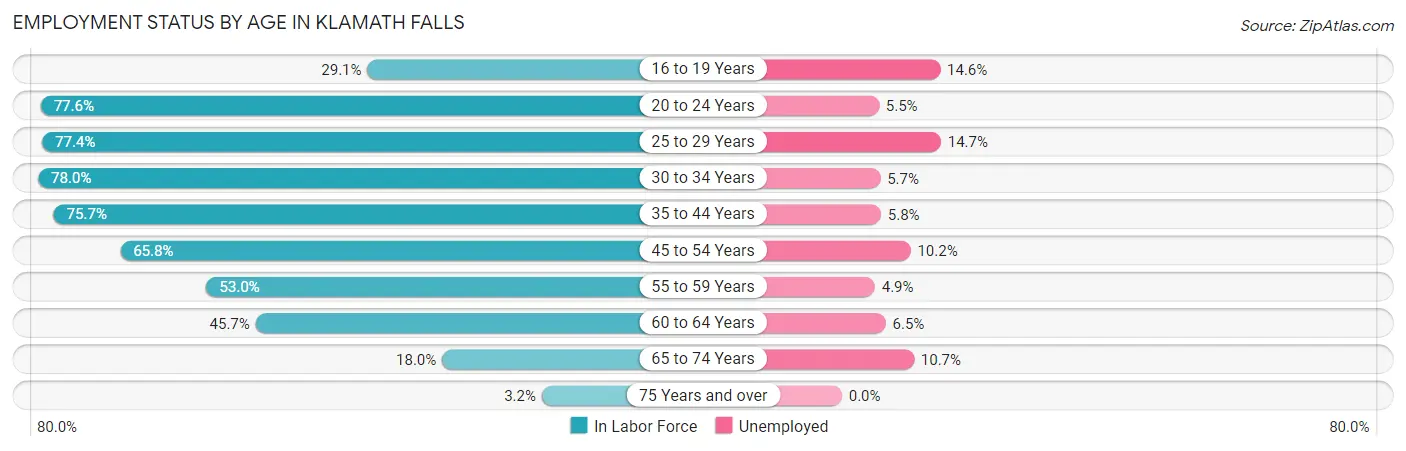
| Age Bracket | In Labor Force | Unemployed |
| 16 to 19 Years | 416 (29.1%) | 61 (14.6%) |
| 20 to 24 Years | 1,588 (77.6%) | 87 (5.5%) |
| 25 to 29 Years | 1,293 (77.4%) | 190 (14.7%) |
| 30 to 34 Years | 1,310 (78.0%) | 75 (5.7%) |
| 35 to 44 Years | 2,085 (75.7%) | 121 (5.8%) |
| 45 to 54 Years | 1,541 (65.8%) | 157 (10.2%) |
| 55 to 59 Years | 588 (53.0%) | 29 (4.9%) |
| 60 to 64 Years | 597 (45.7%) | 39 (6.5%) |
| 65 to 74 Years | 384 (18.0%) | 41 (10.7%) |
| 75 Years and over | 41 (3.2%) | 0 (0.0%) |
| Total | 9,838 (55.4%) | 797 (8.1%) |
Employment Status by Educational Attainment in Klamath Falls
According to labor force statistics for Klamath Falls, 68.3% of individuals (7,418) out of the total population between 25 and 64 years of age (10,861) are in the labor force, with 8.2% or 608 of them being unemployed. The group with the highest labor force participation rate are those with the educational attainment of bachelor's degree or higher, with 77.9% or 1,944 individuals in the labor force. Within the labor force, individuals with less than high school education have the highest percentage of unemployment, with 20.5% or 135 of them being unemployed.
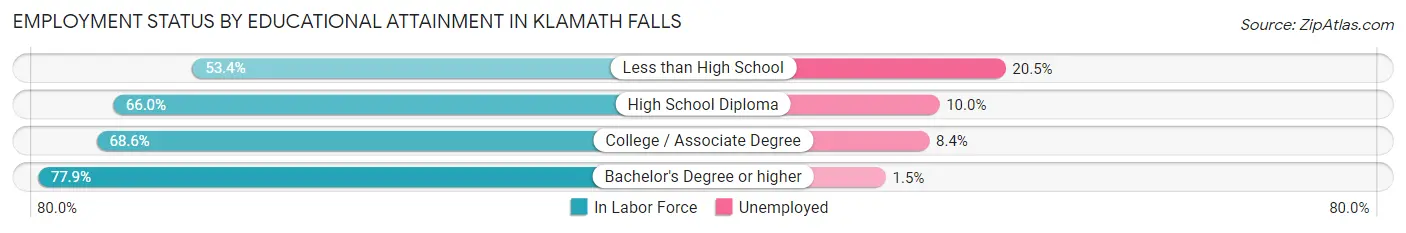
| Educational Attainment | In Labor Force | Unemployed |
| Less than High School | 658 (53.4%) | 253 (20.5%) |
| High School Diploma | 2,077 (66.0%) | 315 (10.0%) |
| College / Associate Degree | 2,734 (68.6%) | 335 (8.4%) |
| Bachelor's Degree or higher | 1,944 (77.9%) | 37 (1.5%) |
| Total | 7,418 (68.3%) | 891 (8.2%) |
Employment Occupations by Sex in Klamath Falls
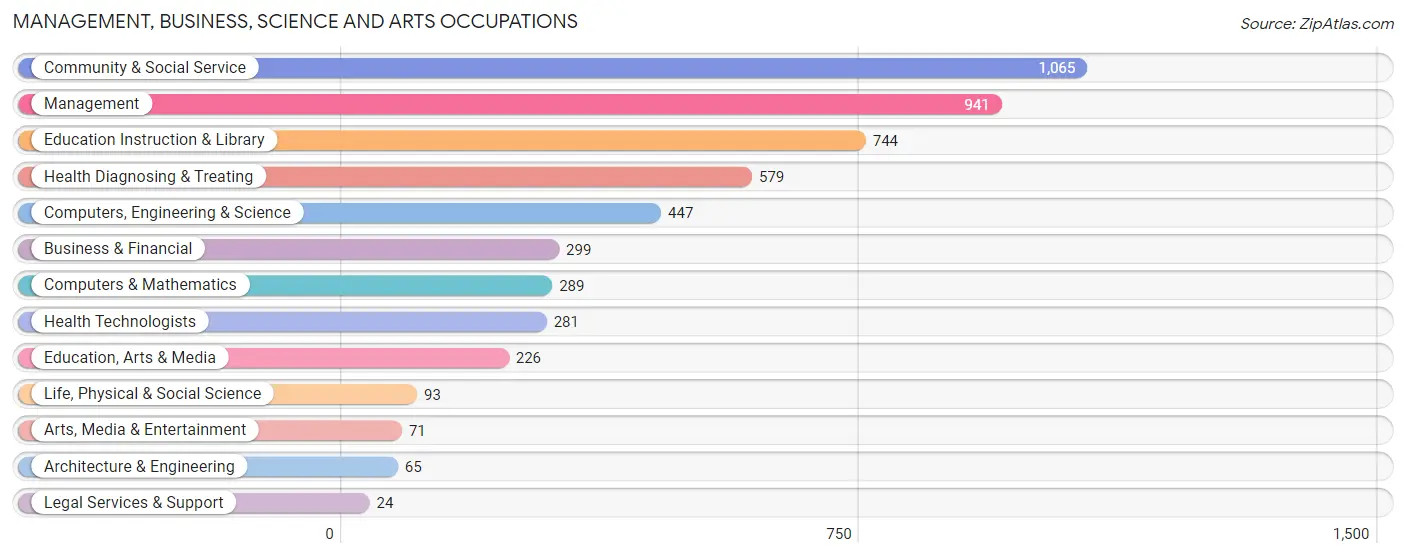
Management, Business, Science and Arts Occupations
The most common Management, Business, Science and Arts occupations in Klamath Falls are Community & Social Service (1,065 | 12.2%), Management (941 | 10.7%), Education Instruction & Library (744 | 8.5%), Health Diagnosing & Treating (579 | 6.6%), and Computers, Engineering & Science (447 | 5.1%).
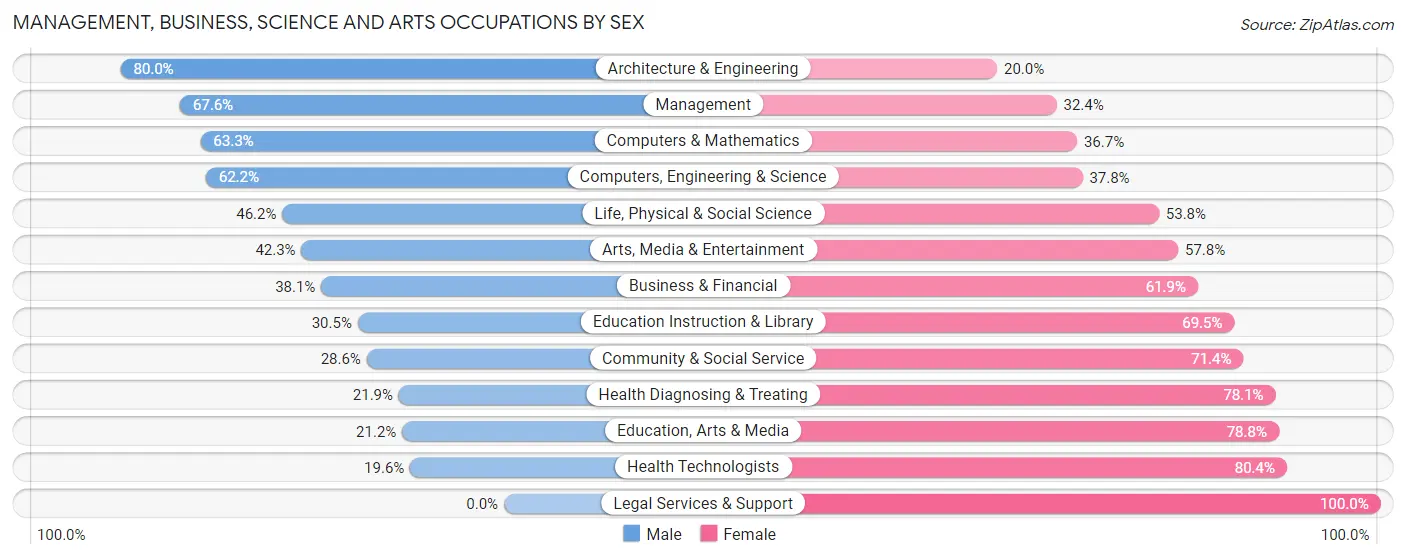
Management, Business, Science and Arts Occupations by Sex
Within the Management, Business, Science and Arts occupations in Klamath Falls, the most male-oriented occupations are Architecture & Engineering (80.0%), Management (67.6%), and Computers & Mathematics (63.3%), while the most female-oriented occupations are Legal Services & Support (100.0%), Health Technologists (80.4%), and Education, Arts & Media (78.8%).
| Occupation | Male | Female |
| Management | 636 (67.6%) | 305 (32.4%) |
| Business & Financial | 114 (38.1%) | 185 (61.9%) |
| Computers, Engineering & Science | 278 (62.2%) | 169 (37.8%) |
| Computers & Mathematics | 183 (63.3%) | 106 (36.7%) |
| Architecture & Engineering | 52 (80.0%) | 13 (20.0%) |
| Life, Physical & Social Science | 43 (46.2%) | 50 (53.8%) |
| Community & Social Service | 305 (28.6%) | 760 (71.4%) |
| Education, Arts & Media | 48 (21.2%) | 178 (78.8%) |
| Legal Services & Support | 0 (0.0%) | 24 (100.0%) |
| Education Instruction & Library | 227 (30.5%) | 517 (69.5%) |
| Arts, Media & Entertainment | 30 (42.2%) | 41 (57.8%) |
| Health Diagnosing & Treating | 127 (21.9%) | 452 (78.1%) |
| Health Technologists | 55 (19.6%) | 226 (80.4%) |
| Total (Category) | 1,460 (43.8%) | 1,871 (56.2%) |
| Total (Overall) | 4,105 (46.9%) | 4,646 (53.1%) |
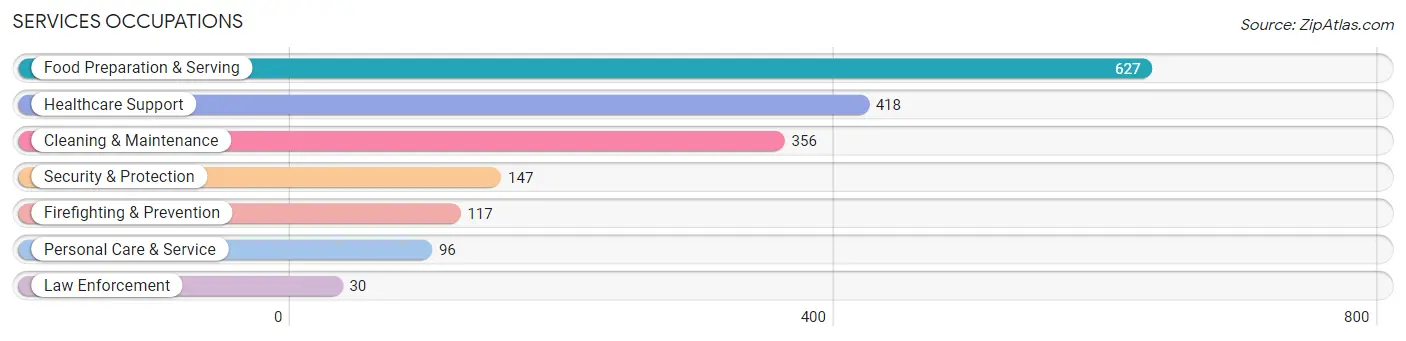
Services Occupations
The most common Services occupations in Klamath Falls are Food Preparation & Serving (627 | 7.2%), Healthcare Support (418 | 4.8%), Cleaning & Maintenance (356 | 4.1%), Security & Protection (147 | 1.7%), and Firefighting & Prevention (117 | 1.3%).
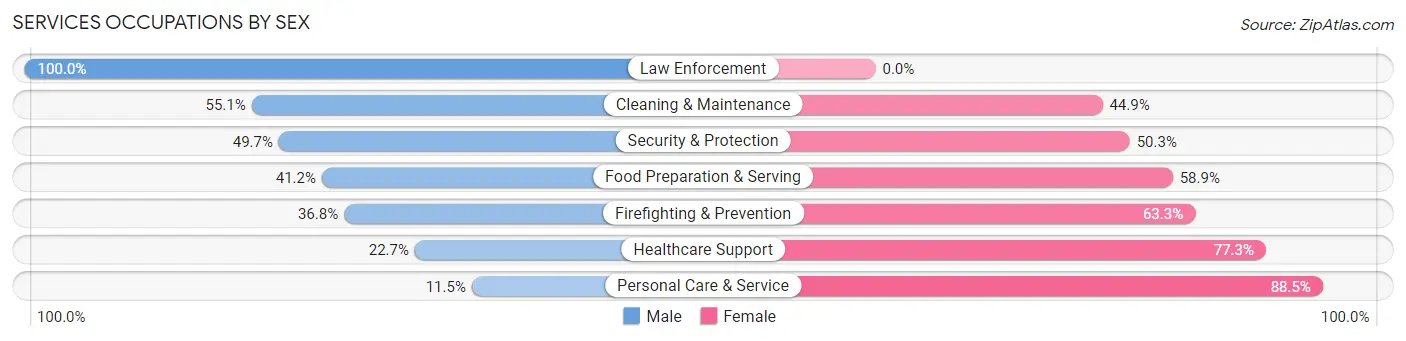
Services Occupations by Sex
Within the Services occupations in Klamath Falls, the most male-oriented occupations are Law Enforcement (100.0%), Cleaning & Maintenance (55.1%), and Security & Protection (49.7%), while the most female-oriented occupations are Personal Care & Service (88.5%), Healthcare Support (77.3%), and Firefighting & Prevention (63.2%).
| Occupation | Male | Female |
| Healthcare Support | 95 (22.7%) | 323 (77.3%) |
| Security & Protection | 73 (49.7%) | 74 (50.3%) |
| Firefighting & Prevention | 43 (36.7%) | 74 (63.2%) |
| Law Enforcement | 30 (100.0%) | 0 (0.0%) |
| Food Preparation & Serving | 258 (41.1%) | 369 (58.9%) |
| Cleaning & Maintenance | 196 (55.1%) | 160 (44.9%) |
| Personal Care & Service | 11 (11.5%) | 85 (88.5%) |
| Total (Category) | 633 (38.5%) | 1,011 (61.5%) |
| Total (Overall) | 4,105 (46.9%) | 4,646 (53.1%) |
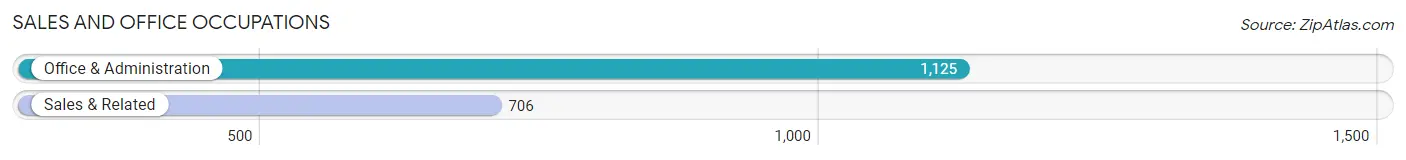
Sales and Office Occupations
The most common Sales and Office occupations in Klamath Falls are Office & Administration (1,125 | 12.9%), and Sales & Related (706 | 8.1%).
Sales and Office Occupations by Sex
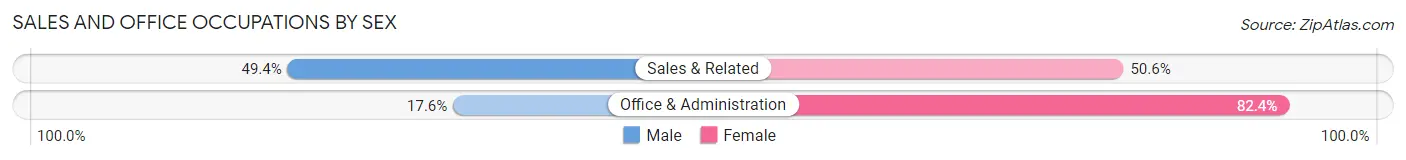
| Occupation | Male | Female |
| Sales & Related | 349 (49.4%) | 357 (50.6%) |
| Office & Administration | 198 (17.6%) | 927 (82.4%) |
| Total (Category) | 547 (29.9%) | 1,284 (70.1%) |
| Total (Overall) | 4,105 (46.9%) | 4,646 (53.1%) |
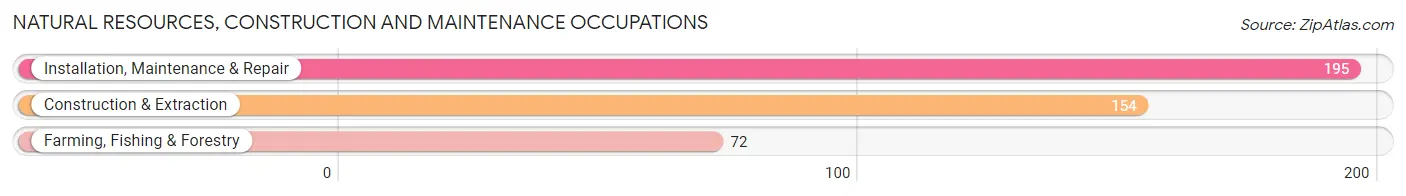
Natural Resources, Construction and Maintenance Occupations
The most common Natural Resources, Construction and Maintenance occupations in Klamath Falls are Installation, Maintenance & Repair (195 | 2.2%), Construction & Extraction (154 | 1.8%), and Farming, Fishing & Forestry (72 | 0.8%).
Natural Resources, Construction and Maintenance Occupations by Sex
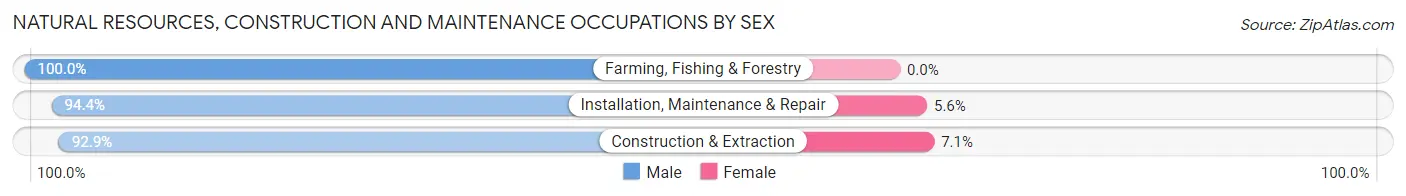
| Occupation | Male | Female |
| Farming, Fishing & Forestry | 72 (100.0%) | 0 (0.0%) |
| Construction & Extraction | 143 (92.9%) | 11 (7.1%) |
| Installation, Maintenance & Repair | 184 (94.4%) | 11 (5.6%) |
| Total (Category) | 399 (94.8%) | 22 (5.2%) |
| Total (Overall) | 4,105 (46.9%) | 4,646 (53.1%) |
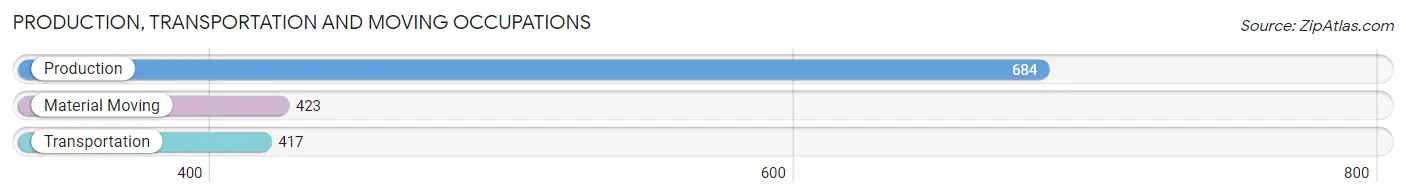
Production, Transportation and Moving Occupations
The most common Production, Transportation and Moving occupations in Klamath Falls are Production (684 | 7.8%), Material Moving (423 | 4.8%), and Transportation (417 | 4.8%).
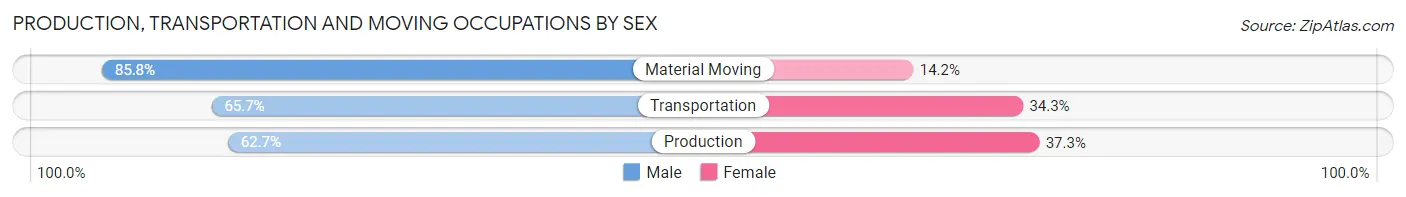
Production, Transportation and Moving Occupations by Sex
| Occupation | Male | Female |
| Production | 429 (62.7%) | 255 (37.3%) |
| Transportation | 274 (65.7%) | 143 (34.3%) |
| Material Moving | 363 (85.8%) | 60 (14.2%) |
| Total (Category) | 1,066 (70.0%) | 458 (30.0%) |
| Total (Overall) | 4,105 (46.9%) | 4,646 (53.1%) |
Employment Industries by Sex in Klamath Falls
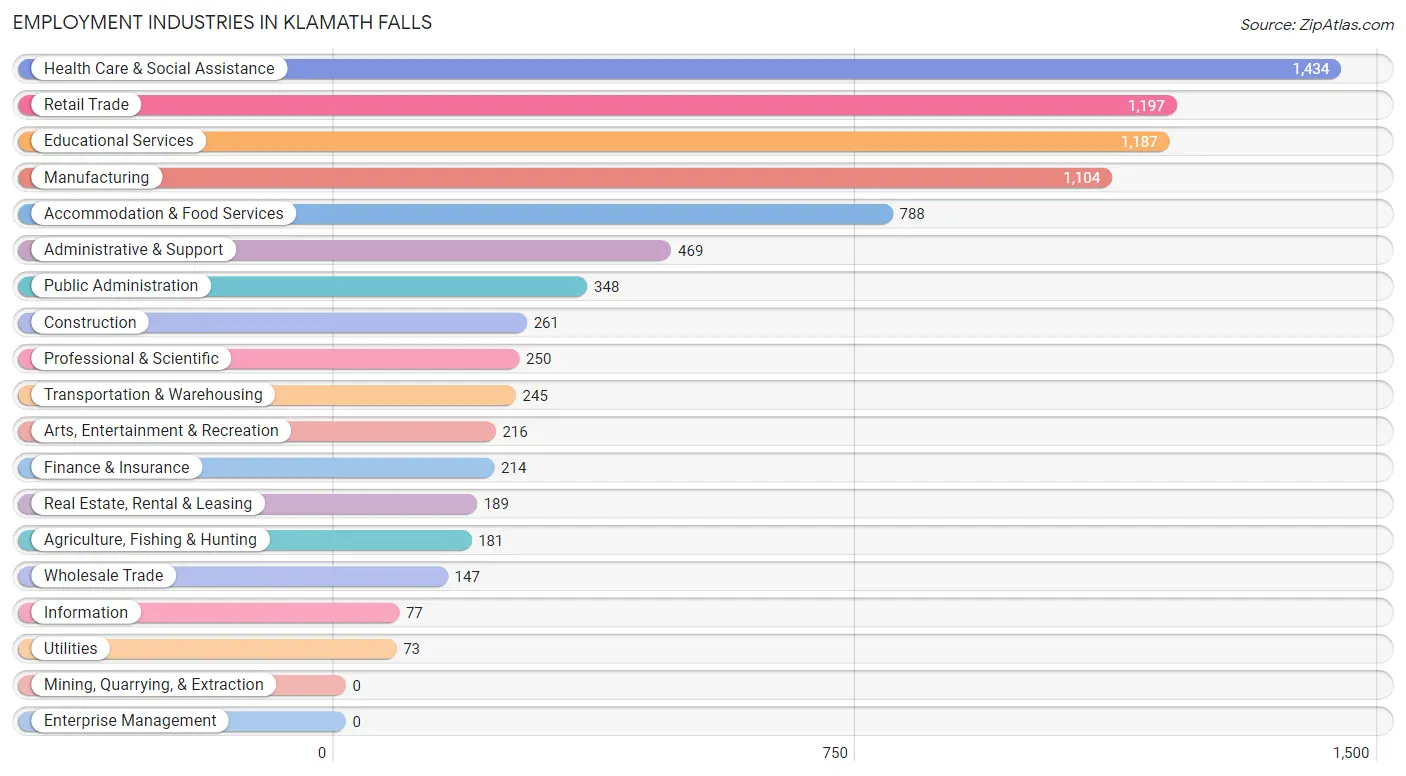
Employment Industries in Klamath Falls
The major employment industries in Klamath Falls include Health Care & Social Assistance (1,434 | 16.4%), Retail Trade (1,197 | 13.7%), Educational Services (1,187 | 13.6%), Manufacturing (1,104 | 12.6%), and Accommodation & Food Services (788 | 9.0%).
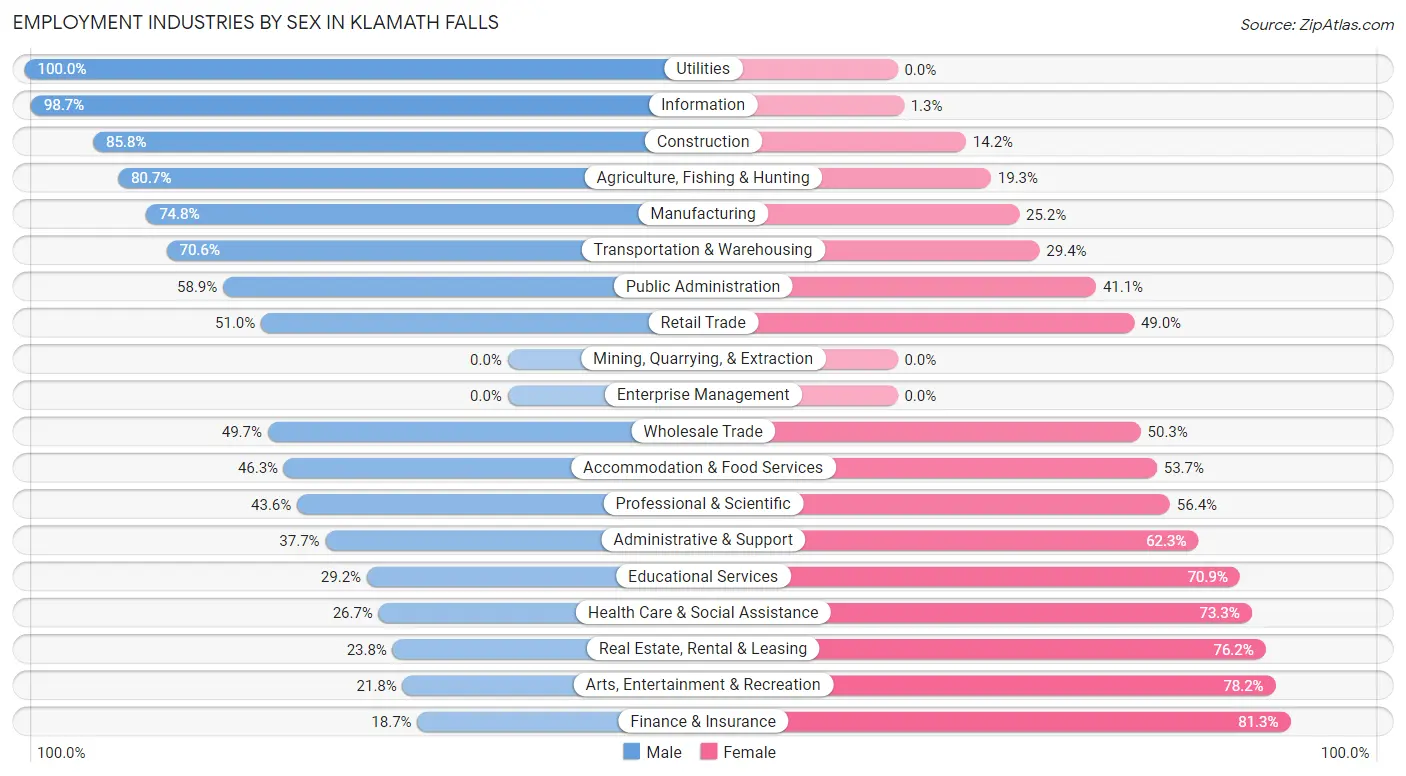
Employment Industries by Sex in Klamath Falls
The Klamath Falls industries that see more men than women are Utilities (100.0%), Information (98.7%), and Construction (85.8%), whereas the industries that tend to have a higher number of women are Finance & Insurance (81.3%), Arts, Entertainment & Recreation (78.2%), and Real Estate, Rental & Leasing (76.2%).
| Industry | Male | Female |
| Agriculture, Fishing & Hunting | 146 (80.7%) | 35 (19.3%) |
| Mining, Quarrying, & Extraction | 0 (0.0%) | 0 (0.0%) |
| Construction | 224 (85.8%) | 37 (14.2%) |
| Manufacturing | 826 (74.8%) | 278 (25.2%) |
| Wholesale Trade | 73 (49.7%) | 74 (50.3%) |
| Retail Trade | 611 (51.0%) | 586 (49.0%) |
| Transportation & Warehousing | 173 (70.6%) | 72 (29.4%) |
| Utilities | 73 (100.0%) | 0 (0.0%) |
| Information | 76 (98.7%) | 1 (1.3%) |
| Finance & Insurance | 40 (18.7%) | 174 (81.3%) |
| Real Estate, Rental & Leasing | 45 (23.8%) | 144 (76.2%) |
| Professional & Scientific | 109 (43.6%) | 141 (56.4%) |
| Enterprise Management | 0 (0.0%) | 0 (0.0%) |
| Administrative & Support | 177 (37.7%) | 292 (62.3%) |
| Educational Services | 346 (29.1%) | 841 (70.9%) |
| Health Care & Social Assistance | 383 (26.7%) | 1,051 (73.3%) |
| Arts, Entertainment & Recreation | 47 (21.8%) | 169 (78.2%) |
| Accommodation & Food Services | 365 (46.3%) | 423 (53.7%) |
| Public Administration | 205 (58.9%) | 143 (41.1%) |
| Total | 4,105 (46.9%) | 4,646 (53.1%) |
Education in Klamath Falls
School Enrollment in Klamath Falls
The most common levels of schooling among the 5,950 students in Klamath Falls are college / undergraduate (1,984 | 33.3%), high school (1,354 | 22.8%), and middle school (1,033 | 17.4%).
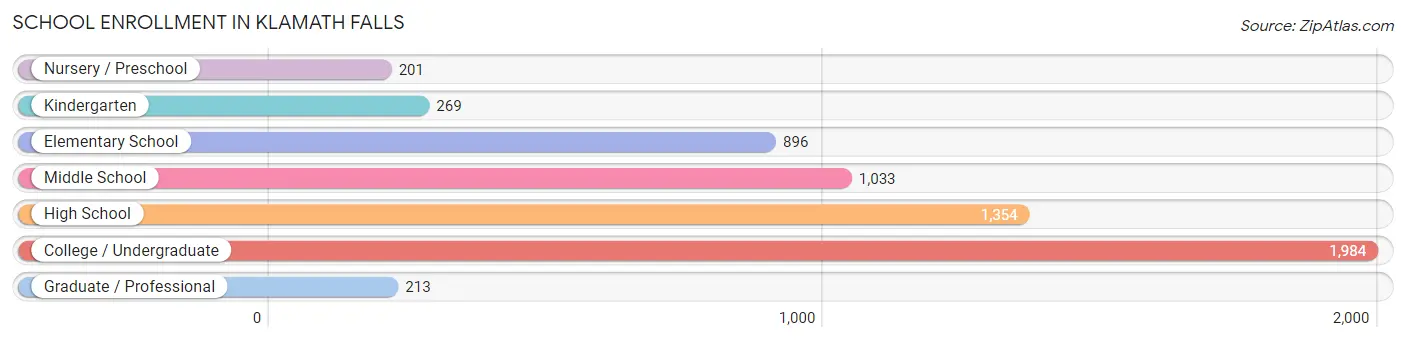
| School Level | # Students | % Students |
| Nursery / Preschool | 201 | 3.4% |
| Kindergarten | 269 | 4.5% |
| Elementary School | 896 | 15.1% |
| Middle School | 1,033 | 17.4% |
| High School | 1,354 | 22.8% |
| College / Undergraduate | 1,984 | 33.3% |
| Graduate / Professional | 213 | 3.6% |
| Total | 5,950 | 100.0% |
School Enrollment by Age by Funding Source in Klamath Falls
Out of a total of 5,950 students who are enrolled in schools in Klamath Falls, 643 (10.8%) attend a private institution, while the remaining 5,307 (89.2%) are enrolled in public schools. The age group of 25 to 34 year olds has the highest likelihood of being enrolled in private schools, with 114 (22.3% in the age bracket) enrolled. Conversely, the age group of 35 years and over has the lowest likelihood of being enrolled in a private school, with 386 (97.5% in the age bracket) attending a public institution.
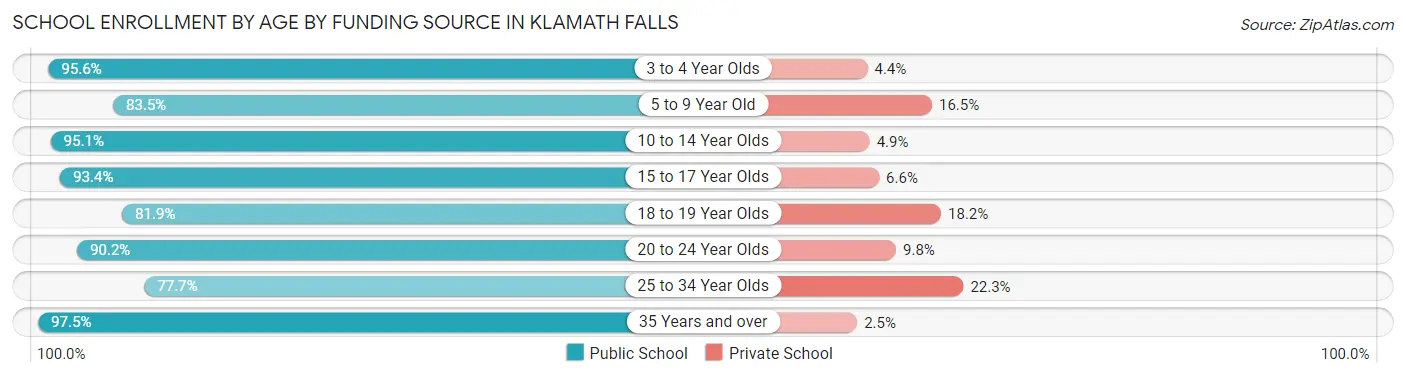
| Age Bracket | Public School | Private School |
| 3 to 4 Year Olds | 86 (95.6%) | 4 (4.4%) |
| 5 to 9 Year Old | 990 (83.5%) | 195 (16.5%) |
| 10 to 14 Year Olds | 1,232 (95.1%) | 63 (4.9%) |
| 15 to 17 Year Olds | 961 (93.4%) | 68 (6.6%) |
| 18 to 19 Year Olds | 469 (81.9%) | 104 (18.1%) |
| 20 to 24 Year Olds | 786 (90.2%) | 85 (9.8%) |
| 25 to 34 Year Olds | 397 (77.7%) | 114 (22.3%) |
| 35 Years and over | 386 (97.5%) | 10 (2.5%) |
| Total | 5,307 (89.2%) | 643 (10.8%) |
Educational Attainment by Field of Study in Klamath Falls
Business (614 | 18.0%), education (593 | 17.4%), science & technology (337 | 9.9%), psychology (323 | 9.5%), and bio, nature & agricultural (272 | 8.0%) are the most common fields of study among 3,411 individuals in Klamath Falls who have obtained a bachelor's degree or higher.
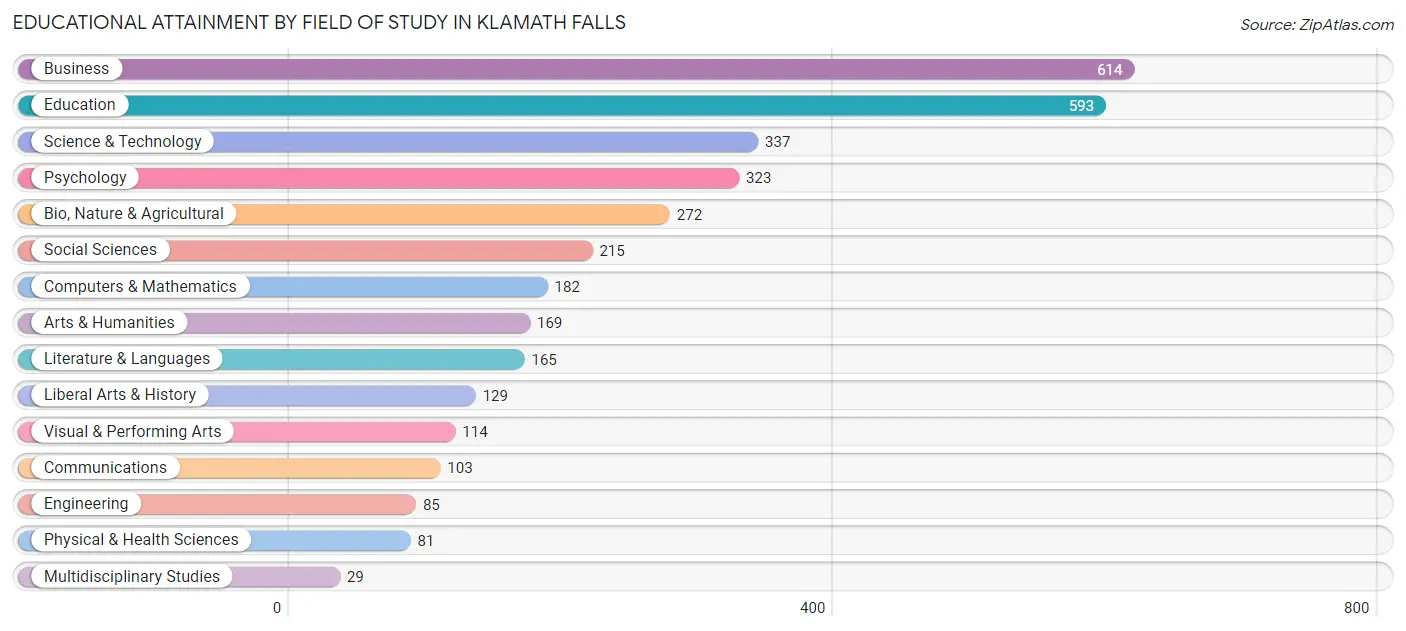
| Field of Study | # Graduates | % Graduates |
| Computers & Mathematics | 182 | 5.3% |
| Bio, Nature & Agricultural | 272 | 8.0% |
| Physical & Health Sciences | 81 | 2.4% |
| Psychology | 323 | 9.5% |
| Social Sciences | 215 | 6.3% |
| Engineering | 85 | 2.5% |
| Multidisciplinary Studies | 29 | 0.9% |
| Science & Technology | 337 | 9.9% |
| Business | 614 | 18.0% |
| Education | 593 | 17.4% |
| Literature & Languages | 165 | 4.8% |
| Liberal Arts & History | 129 | 3.8% |
| Visual & Performing Arts | 114 | 3.3% |
| Communications | 103 | 3.0% |
| Arts & Humanities | 169 | 5.0% |
| Total | 3,411 | 100.0% |
Transportation & Commute in Klamath Falls
Vehicle Availability by Sex in Klamath Falls
The most prevalent vehicle ownership categories in Klamath Falls are males with 2 vehicles (1,570, accounting for 36.3%) and females with 2 vehicles (1,807, making up 35.7%).
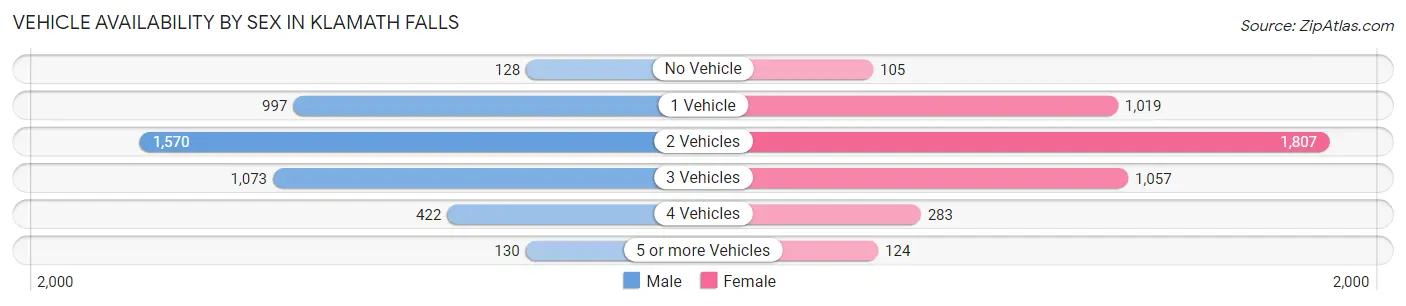
| Vehicles Available | Male | Female |
| No Vehicle | 128 (3.0%) | 105 (2.4%) |
| 1 Vehicle | 997 (23.1%) | 1,019 (23.2%) |
| 2 Vehicles | 1,570 (36.3%) | 1,807 (41.1%) |
| 3 Vehicles | 1,073 (24.8%) | 1,057 (24.0%) |
| 4 Vehicles | 422 (9.8%) | 283 (6.4%) |
| 5 or more Vehicles | 130 (3.0%) | 124 (2.8%) |
| Total | 4,320 (100.0%) | 4,395 (100.0%) |
Commute Time in Klamath Falls
The most frequently occuring commute durations in Klamath Falls are 10 to 14 minutes (2,678 commuters, 31.9%), 5 to 9 minutes (2,086 commuters, 24.9%), and 15 to 19 minutes (1,557 commuters, 18.6%).
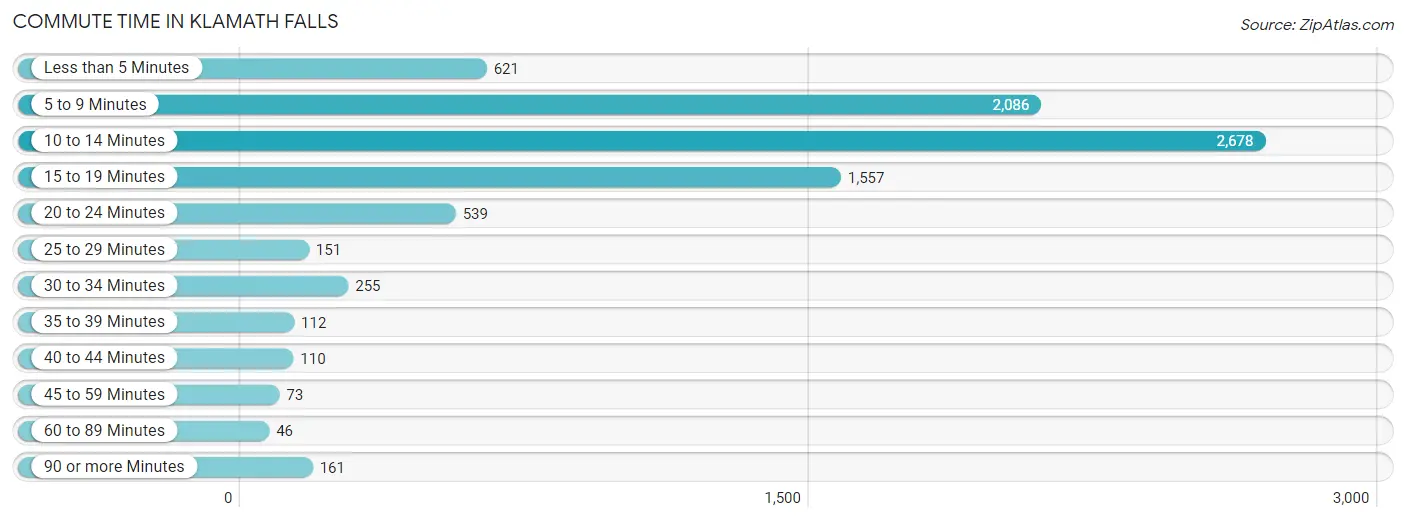
| Commute Time | # Commuters | % Commuters |
| Less than 5 Minutes | 621 | 7.4% |
| 5 to 9 Minutes | 2,086 | 24.9% |
| 10 to 14 Minutes | 2,678 | 31.9% |
| 15 to 19 Minutes | 1,557 | 18.6% |
| 20 to 24 Minutes | 539 | 6.4% |
| 25 to 29 Minutes | 151 | 1.8% |
| 30 to 34 Minutes | 255 | 3.0% |
| 35 to 39 Minutes | 112 | 1.3% |
| 40 to 44 Minutes | 110 | 1.3% |
| 45 to 59 Minutes | 73 | 0.9% |
| 60 to 89 Minutes | 46 | 0.5% |
| 90 or more Minutes | 161 | 1.9% |
Commute Time by Sex in Klamath Falls
The most common commute times in Klamath Falls are 10 to 14 minutes (1,218 commuters, 29.7%) for males and 10 to 14 minutes (1,460 commuters, 34.0%) for females.
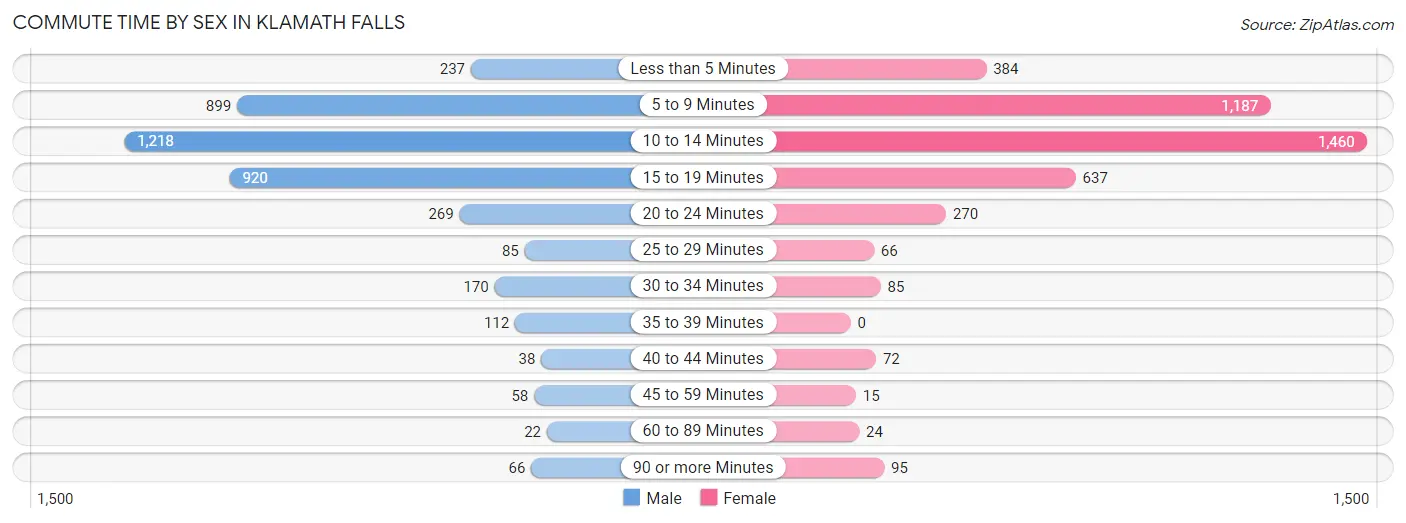
| Commute Time | Male | Female |
| Less than 5 Minutes | 237 (5.8%) | 384 (8.9%) |
| 5 to 9 Minutes | 899 (22.0%) | 1,187 (27.6%) |
| 10 to 14 Minutes | 1,218 (29.7%) | 1,460 (34.0%) |
| 15 to 19 Minutes | 920 (22.5%) | 637 (14.8%) |
| 20 to 24 Minutes | 269 (6.6%) | 270 (6.3%) |
| 25 to 29 Minutes | 85 (2.1%) | 66 (1.5%) |
| 30 to 34 Minutes | 170 (4.2%) | 85 (2.0%) |
| 35 to 39 Minutes | 112 (2.7%) | 0 (0.0%) |
| 40 to 44 Minutes | 38 (0.9%) | 72 (1.7%) |
| 45 to 59 Minutes | 58 (1.4%) | 15 (0.4%) |
| 60 to 89 Minutes | 22 (0.5%) | 24 (0.6%) |
| 90 or more Minutes | 66 (1.6%) | 95 (2.2%) |
Time of Departure to Work by Sex in Klamath Falls
The most frequent times of departure to work in Klamath Falls are 7:30 AM to 7:59 AM (644, 15.7%) for males and 7:30 AM to 7:59 AM (1,253, 29.2%) for females.
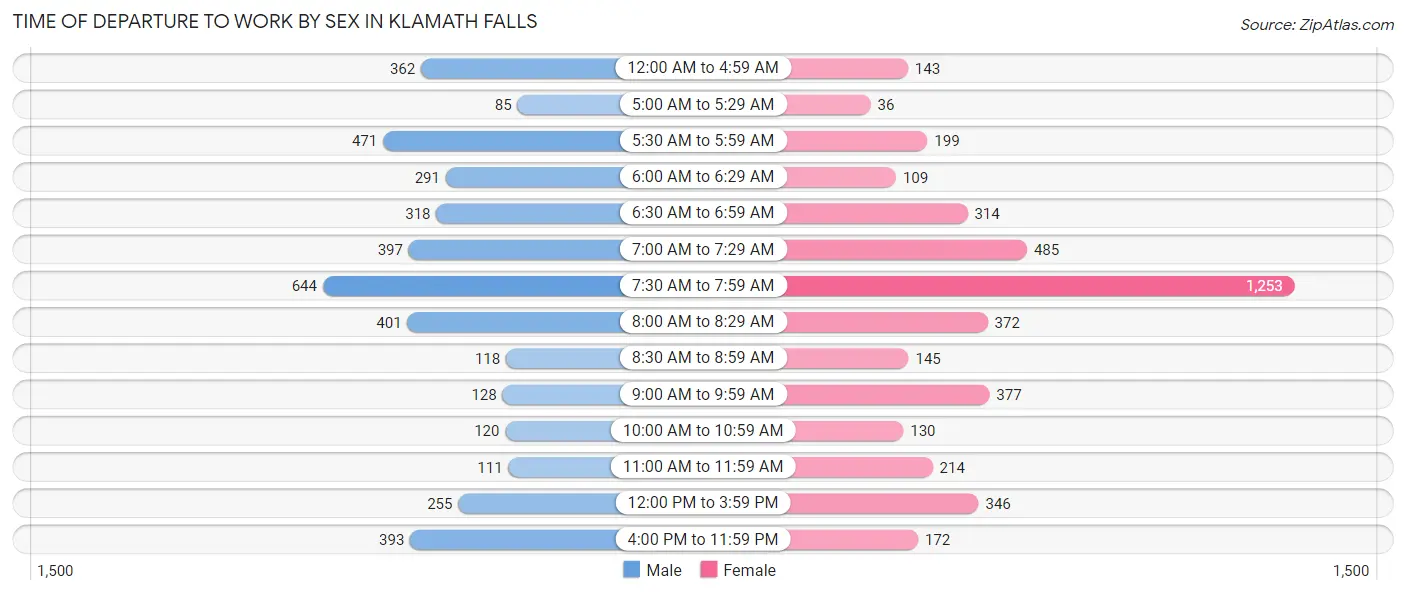
| Time of Departure | Male | Female |
| 12:00 AM to 4:59 AM | 362 (8.8%) | 143 (3.3%) |
| 5:00 AM to 5:29 AM | 85 (2.1%) | 36 (0.8%) |
| 5:30 AM to 5:59 AM | 471 (11.5%) | 199 (4.6%) |
| 6:00 AM to 6:29 AM | 291 (7.1%) | 109 (2.5%) |
| 6:30 AM to 6:59 AM | 318 (7.8%) | 314 (7.3%) |
| 7:00 AM to 7:29 AM | 397 (9.7%) | 485 (11.3%) |
| 7:30 AM to 7:59 AM | 644 (15.7%) | 1,253 (29.2%) |
| 8:00 AM to 8:29 AM | 401 (9.8%) | 372 (8.7%) |
| 8:30 AM to 8:59 AM | 118 (2.9%) | 145 (3.4%) |
| 9:00 AM to 9:59 AM | 128 (3.1%) | 377 (8.8%) |
| 10:00 AM to 10:59 AM | 120 (2.9%) | 130 (3.0%) |
| 11:00 AM to 11:59 AM | 111 (2.7%) | 214 (5.0%) |
| 12:00 PM to 3:59 PM | 255 (6.2%) | 346 (8.1%) |
| 4:00 PM to 11:59 PM | 393 (9.6%) | 172 (4.0%) |
| Total | 4,094 (100.0%) | 4,295 (100.0%) |
Housing Occupancy in Klamath Falls
Occupancy by Ownership in Klamath Falls
Of the total 8,885 dwellings in Klamath Falls, owner-occupied units account for 4,136 (46.6%), while renter-occupied units make up 4,749 (53.4%).
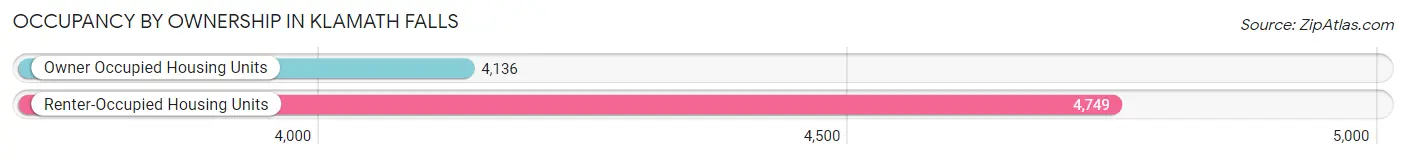
| Occupancy | # Housing Units | % Housing Units |
| Owner Occupied Housing Units | 4,136 | 46.6% |
| Renter-Occupied Housing Units | 4,749 | 53.4% |
| Total Occupied Housing Units | 8,885 | 100.0% |
Occupancy by Household Size in Klamath Falls
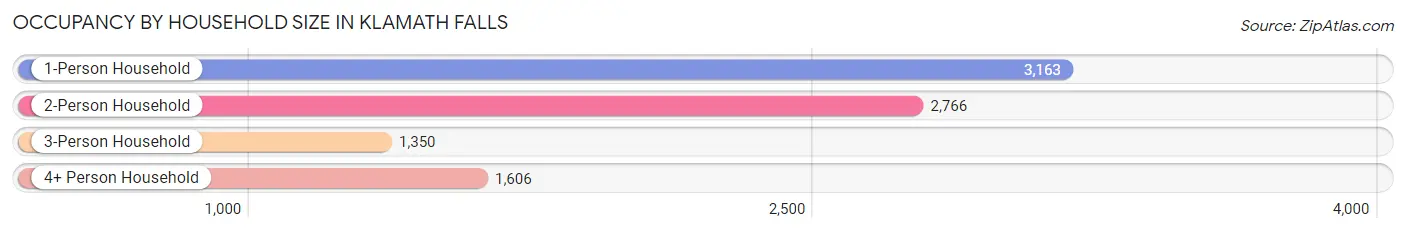
| Household Size | # Housing Units | % Housing Units |
| 1-Person Household | 3,163 | 35.6% |
| 2-Person Household | 2,766 | 31.1% |
| 3-Person Household | 1,350 | 15.2% |
| 4+ Person Household | 1,606 | 18.1% |
| Total Housing Units | 8,885 | 100.0% |
Occupancy by Ownership by Household Size in Klamath Falls
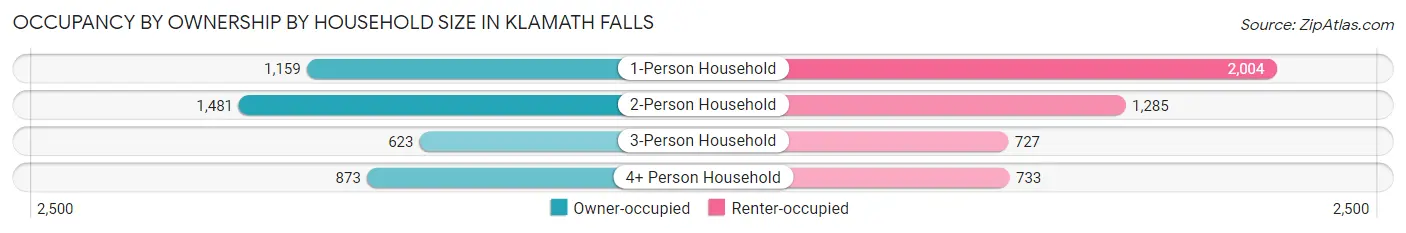
| Household Size | Owner-occupied | Renter-occupied |
| 1-Person Household | 1,159 (36.6%) | 2,004 (63.4%) |
| 2-Person Household | 1,481 (53.5%) | 1,285 (46.5%) |
| 3-Person Household | 623 (46.2%) | 727 (53.8%) |
| 4+ Person Household | 873 (54.4%) | 733 (45.6%) |
| Total Housing Units | 4,136 (46.6%) | 4,749 (53.4%) |
Occupancy by Educational Attainment in Klamath Falls
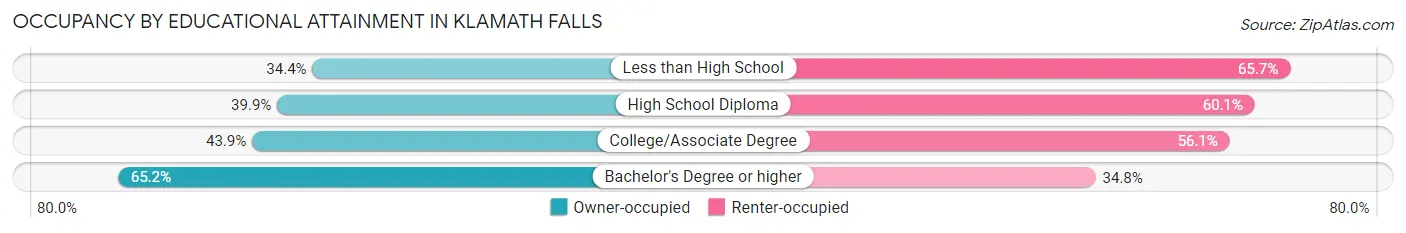
| Household Size | Owner-occupied | Renter-occupied |
| Less than High School | 294 (34.4%) | 562 (65.6%) |
| High School Diploma | 979 (39.9%) | 1,472 (60.1%) |
| College/Associate Degree | 1,598 (43.9%) | 2,040 (56.1%) |
| Bachelor's Degree or higher | 1,265 (65.2%) | 675 (34.8%) |
Occupancy by Age of Householder in Klamath Falls
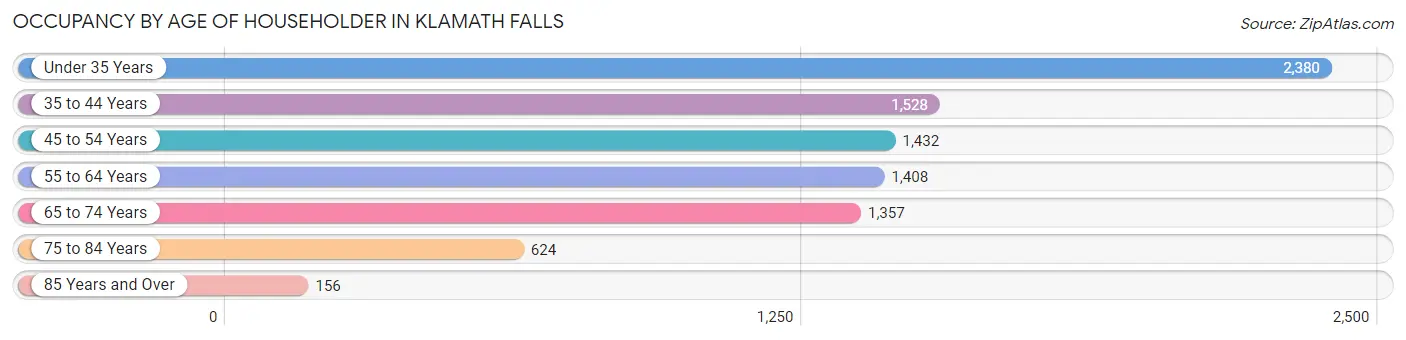
| Age Bracket | # Households | % Households |
| Under 35 Years | 2,380 | 26.8% |
| 35 to 44 Years | 1,528 | 17.2% |
| 45 to 54 Years | 1,432 | 16.1% |
| 55 to 64 Years | 1,408 | 15.9% |
| 65 to 74 Years | 1,357 | 15.3% |
| 75 to 84 Years | 624 | 7.0% |
| 85 Years and Over | 156 | 1.8% |
| Total | 8,885 | 100.0% |
Housing Finances in Klamath Falls
Median Income by Occupancy in Klamath Falls
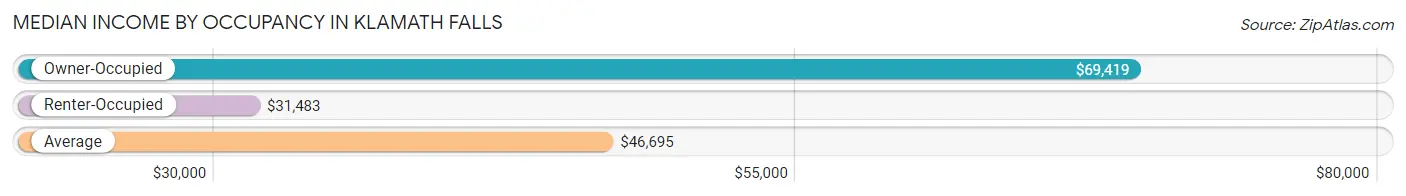
| Occupancy Type | # Households | Median Income |
| Owner-Occupied | 4,136 (46.6%) | $69,419 |
| Renter-Occupied | 4,749 (53.4%) | $31,483 |
| Average | 8,885 (100.0%) | $46,695 |
Occupancy by Householder Income Bracket in Klamath Falls
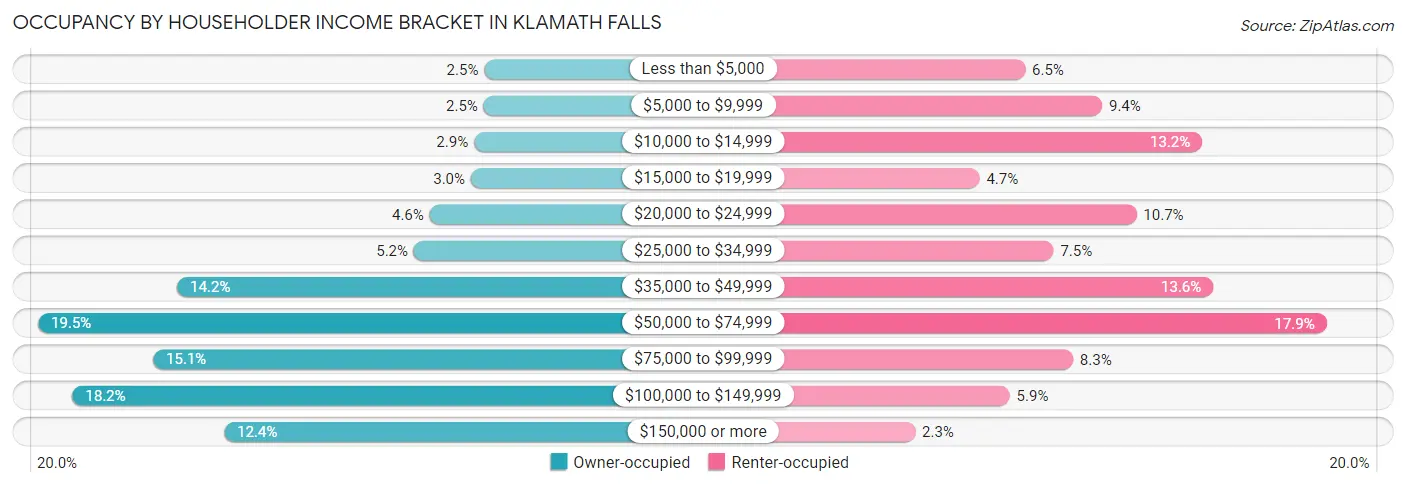
| Income Bracket | Owner-occupied | Renter-occupied |
| Less than $5,000 | 103 (2.5%) | 307 (6.5%) |
| $5,000 to $9,999 | 104 (2.5%) | 446 (9.4%) |
| $10,000 to $14,999 | 119 (2.9%) | 627 (13.2%) |
| $15,000 to $19,999 | 124 (3.0%) | 224 (4.7%) |
| $20,000 to $24,999 | 189 (4.6%) | 508 (10.7%) |
| $25,000 to $34,999 | 214 (5.2%) | 358 (7.5%) |
| $35,000 to $49,999 | 587 (14.2%) | 647 (13.6%) |
| $50,000 to $74,999 | 806 (19.5%) | 852 (17.9%) |
| $75,000 to $99,999 | 625 (15.1%) | 393 (8.3%) |
| $100,000 to $149,999 | 752 (18.2%) | 279 (5.9%) |
| $150,000 or more | 513 (12.4%) | 108 (2.3%) |
| Total | 4,136 (100.0%) | 4,749 (100.0%) |
Monthly Housing Cost Tiers in Klamath Falls
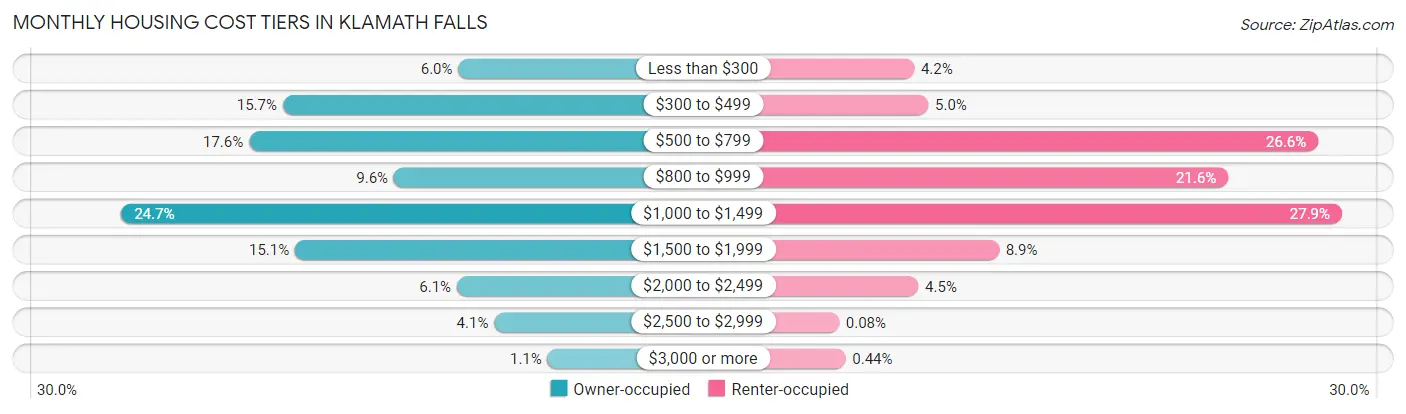
| Monthly Cost | Owner-occupied | Renter-occupied |
| Less than $300 | 250 (6.0%) | 201 (4.2%) |
| $300 to $499 | 651 (15.7%) | 238 (5.0%) |
| $500 to $799 | 728 (17.6%) | 1,261 (26.6%) |
| $800 to $999 | 397 (9.6%) | 1,025 (21.6%) |
| $1,000 to $1,499 | 1,020 (24.7%) | 1,323 (27.9%) |
| $1,500 to $1,999 | 623 (15.1%) | 423 (8.9%) |
| $2,000 to $2,499 | 253 (6.1%) | 212 (4.5%) |
| $2,500 to $2,999 | 168 (4.1%) | 4 (0.1%) |
| $3,000 or more | 46 (1.1%) | 21 (0.4%) |
| Total | 4,136 (100.0%) | 4,749 (100.0%) |
Physical Housing Characteristics in Klamath Falls
Housing Structures in Klamath Falls
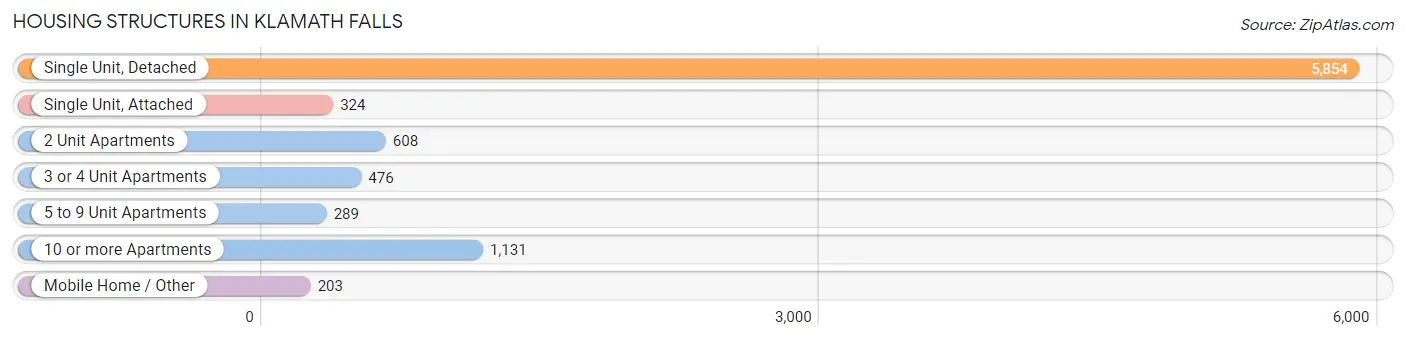
| Structure Type | # Housing Units | % Housing Units |
| Single Unit, Detached | 5,854 | 65.9% |
| Single Unit, Attached | 324 | 3.6% |
| 2 Unit Apartments | 608 | 6.8% |
| 3 or 4 Unit Apartments | 476 | 5.4% |
| 5 to 9 Unit Apartments | 289 | 3.3% |
| 10 or more Apartments | 1,131 | 12.7% |
| Mobile Home / Other | 203 | 2.3% |
| Total | 8,885 | 100.0% |
Housing Structures by Occupancy in Klamath Falls
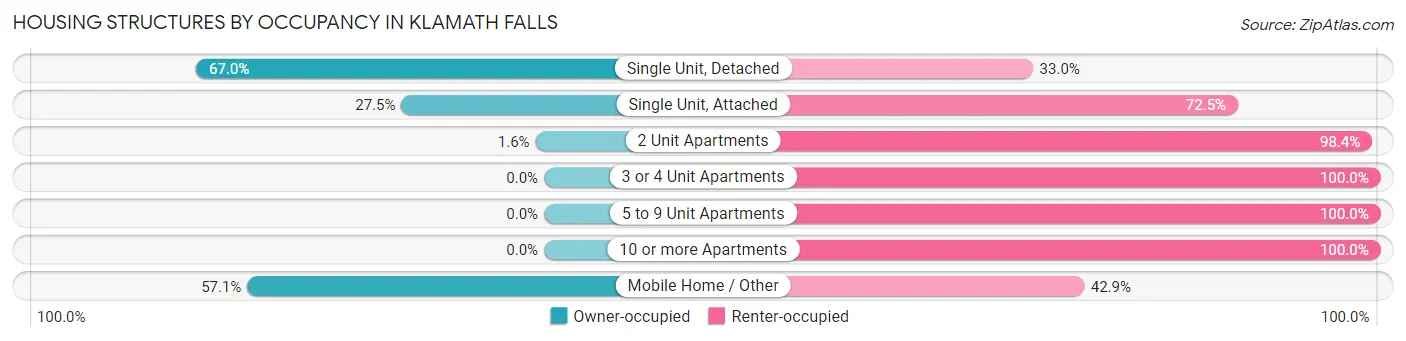
| Structure Type | Owner-occupied | Renter-occupied |
| Single Unit, Detached | 3,921 (67.0%) | 1,933 (33.0%) |
| Single Unit, Attached | 89 (27.5%) | 235 (72.5%) |
| 2 Unit Apartments | 10 (1.6%) | 598 (98.4%) |
| 3 or 4 Unit Apartments | 0 (0.0%) | 476 (100.0%) |
| 5 to 9 Unit Apartments | 0 (0.0%) | 289 (100.0%) |
| 10 or more Apartments | 0 (0.0%) | 1,131 (100.0%) |
| Mobile Home / Other | 116 (57.1%) | 87 (42.9%) |
| Total | 4,136 (46.6%) | 4,749 (53.4%) |
Housing Structures by Number of Rooms in Klamath Falls
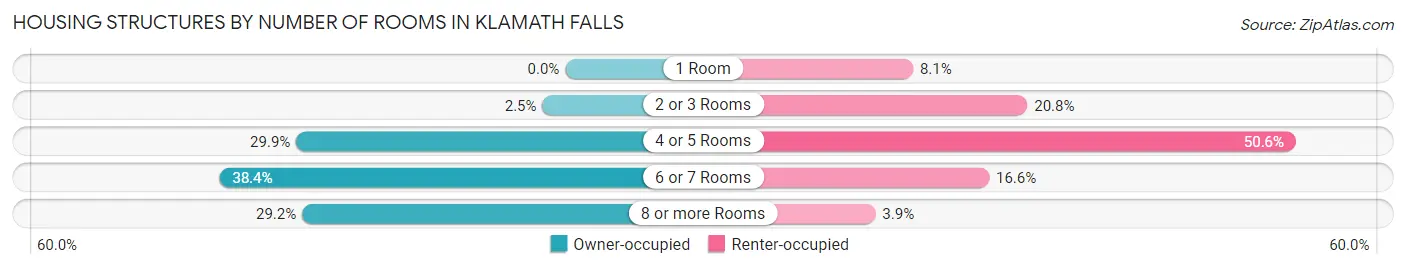
| Number of Rooms | Owner-occupied | Renter-occupied |
| 1 Room | 0 (0.0%) | 385 (8.1%) |
| 2 or 3 Rooms | 105 (2.5%) | 988 (20.8%) |
| 4 or 5 Rooms | 1,235 (29.9%) | 2,403 (50.6%) |
| 6 or 7 Rooms | 1,588 (38.4%) | 786 (16.6%) |
| 8 or more Rooms | 1,208 (29.2%) | 187 (3.9%) |
| Total | 4,136 (100.0%) | 4,749 (100.0%) |
Housing Structure by Heating Type in Klamath Falls
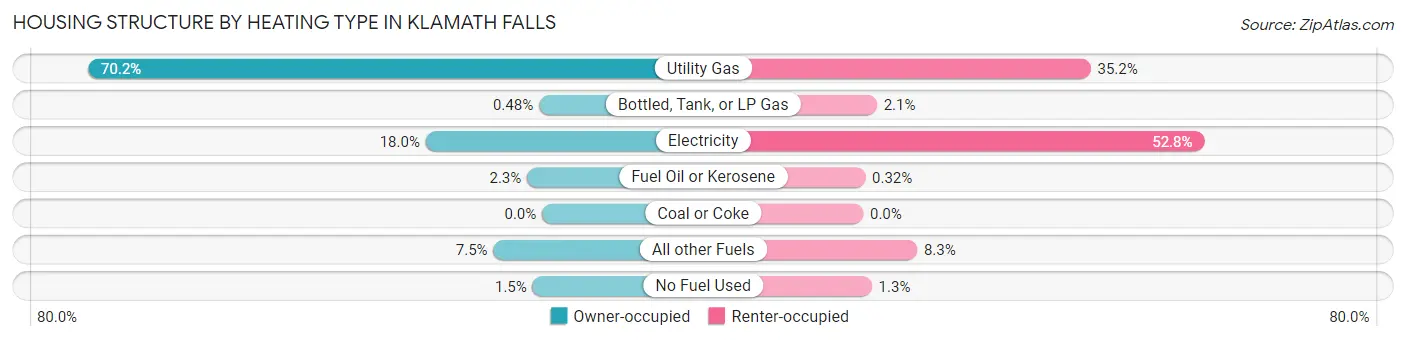
| Heating Type | Owner-occupied | Renter-occupied |
| Utility Gas | 2,904 (70.2%) | 1,670 (35.2%) |
| Bottled, Tank, or LP Gas | 20 (0.5%) | 100 (2.1%) |
| Electricity | 744 (18.0%) | 2,505 (52.7%) |
| Fuel Oil or Kerosene | 96 (2.3%) | 15 (0.3%) |
| Coal or Coke | 0 (0.0%) | 0 (0.0%) |
| All other Fuels | 311 (7.5%) | 396 (8.3%) |
| No Fuel Used | 61 (1.5%) | 63 (1.3%) |
| Total | 4,136 (100.0%) | 4,749 (100.0%) |
Household Vehicle Usage in Klamath Falls
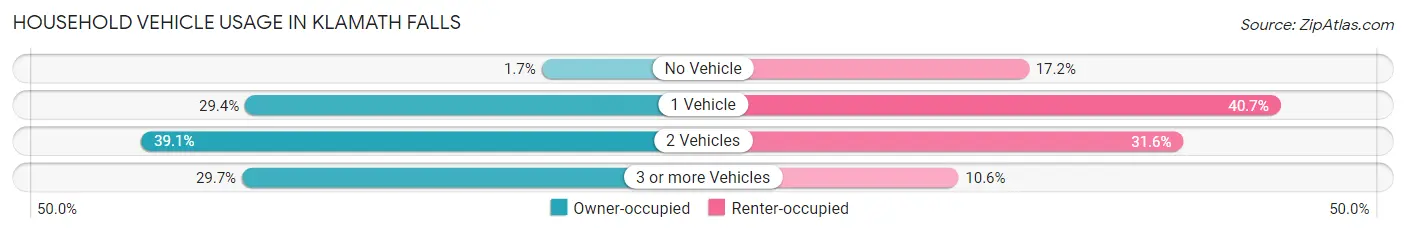
| Vehicles per Household | Owner-occupied | Renter-occupied |
| No Vehicle | 72 (1.7%) | 815 (17.2%) |
| 1 Vehicle | 1,217 (29.4%) | 1,931 (40.7%) |
| 2 Vehicles | 1,618 (39.1%) | 1,500 (31.6%) |
| 3 or more Vehicles | 1,229 (29.7%) | 503 (10.6%) |
| Total | 4,136 (100.0%) | 4,749 (100.0%) |
Real Estate & Mortgages in Klamath Falls
Real Estate and Mortgage Overview in Klamath Falls
| Characteristic | Without Mortgage | With Mortgage |
| Housing Units | 1,411 | 2,725 |
| Median Property Value | $212,300 | $246,100 |
| Median Household Income | $57,321 | $321 |
| Monthly Housing Costs | $425 | $46 |
| Real Estate Taxes | $1,661 | $68 |
Property Value by Mortgage Status in Klamath Falls
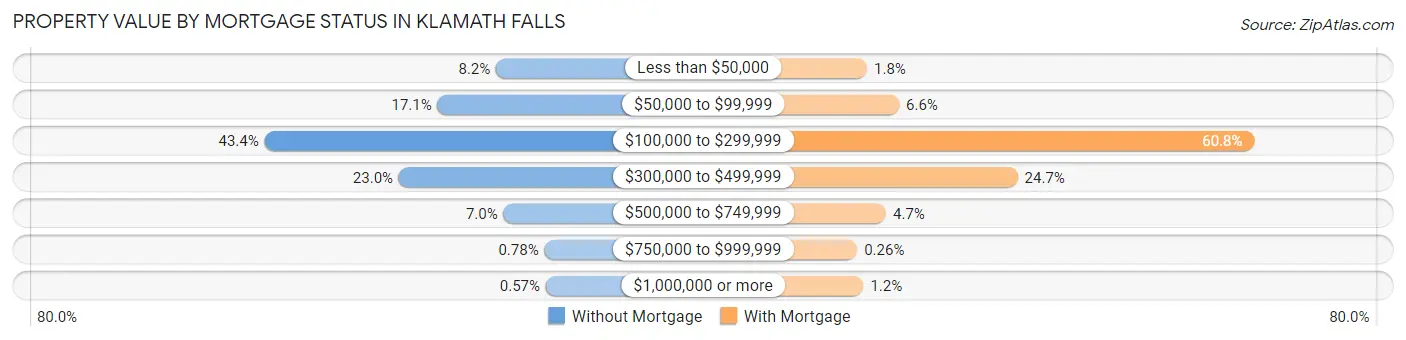
| Property Value | Without Mortgage | With Mortgage |
| Less than $50,000 | 115 (8.2%) | 48 (1.8%) |
| $50,000 to $99,999 | 241 (17.1%) | 181 (6.6%) |
| $100,000 to $299,999 | 613 (43.4%) | 1,656 (60.8%) |
| $300,000 to $499,999 | 324 (23.0%) | 673 (24.7%) |
| $500,000 to $749,999 | 99 (7.0%) | 127 (4.7%) |
| $750,000 to $999,999 | 11 (0.8%) | 7 (0.3%) |
| $1,000,000 or more | 8 (0.6%) | 33 (1.2%) |
| Total | 1,411 (100.0%) | 2,725 (100.0%) |
Household Income by Mortgage Status in Klamath Falls
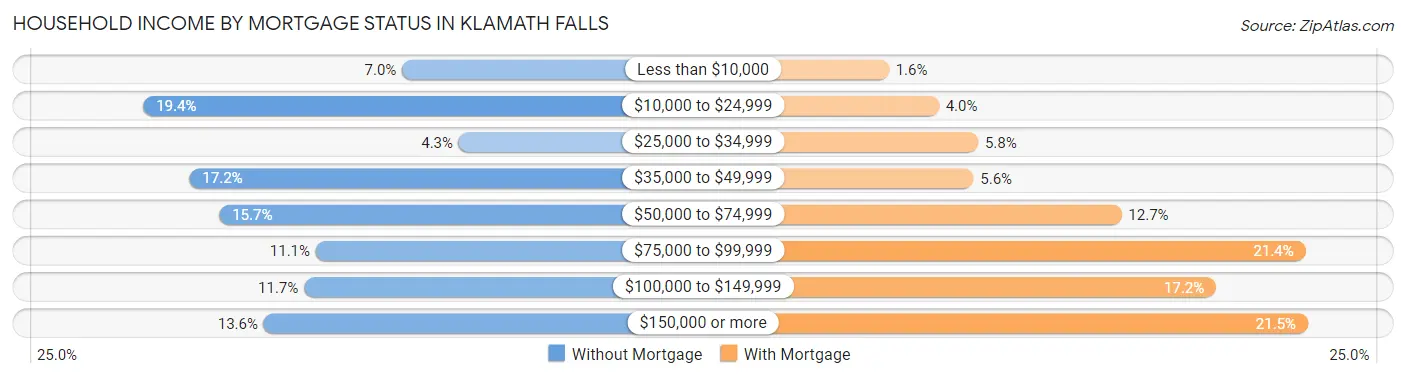
| Household Income | Without Mortgage | With Mortgage |
| Less than $10,000 | 99 (7.0%) | 43 (1.6%) |
| $10,000 to $24,999 | 273 (19.4%) | 108 (4.0%) |
| $25,000 to $34,999 | 61 (4.3%) | 159 (5.8%) |
| $35,000 to $49,999 | 242 (17.2%) | 153 (5.6%) |
| $50,000 to $74,999 | 222 (15.7%) | 345 (12.7%) |
| $75,000 to $99,999 | 157 (11.1%) | 584 (21.4%) |
| $100,000 to $149,999 | 165 (11.7%) | 468 (17.2%) |
| $150,000 or more | 192 (13.6%) | 587 (21.5%) |
| Total | 1,411 (100.0%) | 2,725 (100.0%) |
Property Value to Household Income Ratio in Klamath Falls
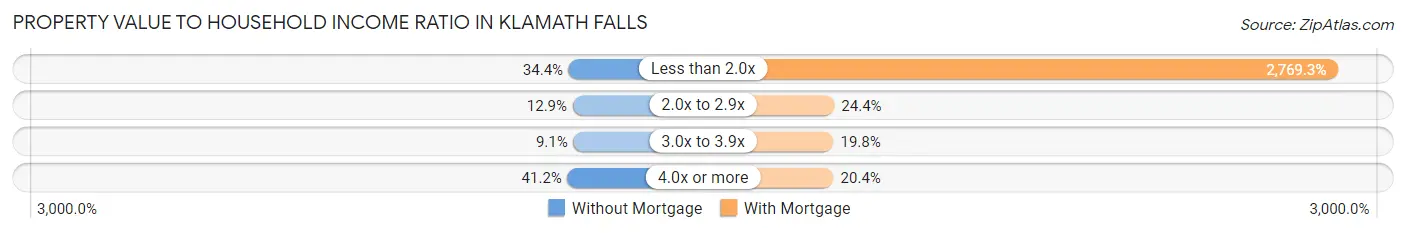
| Value-to-Income Ratio | Without Mortgage | With Mortgage |
| Less than 2.0x | 486 (34.4%) | 75,462 (2,769.2%) |
| 2.0x to 2.9x | 182 (12.9%) | 666 (24.4%) |
| 3.0x to 3.9x | 128 (9.1%) | 539 (19.8%) |
| 4.0x or more | 581 (41.2%) | 556 (20.4%) |
| Total | 1,411 (100.0%) | 2,725 (100.0%) |
Real Estate Taxes by Mortgage Status in Klamath Falls
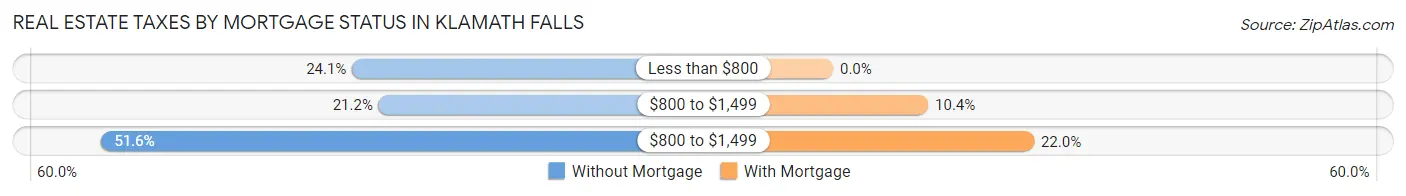
| Property Taxes | Without Mortgage | With Mortgage |
| Less than $800 | 340 (24.1%) | 0 (0.0%) |
| $800 to $1,499 | 299 (21.2%) | 284 (10.4%) |
| $800 to $1,499 | 728 (51.6%) | 600 (22.0%) |
| Total | 1,411 (100.0%) | 2,725 (100.0%) |
Health & Disability in Klamath Falls
Health Insurance Coverage by Age in Klamath Falls
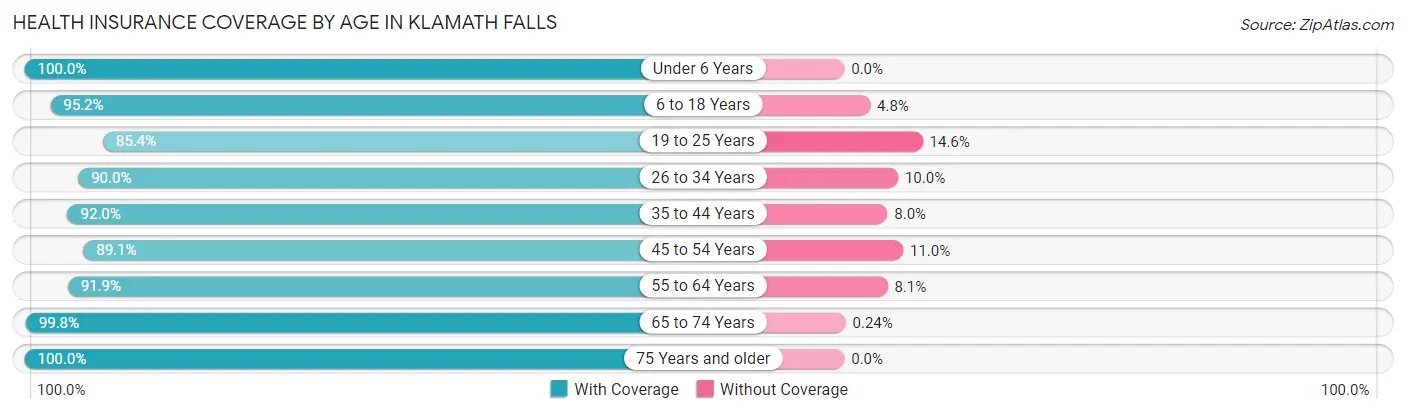
| Age Bracket | With Coverage | Without Coverage |
| Under 6 Years | 1,336 (100.0%) | 0 (0.0%) |
| 6 to 18 Years | 3,640 (95.2%) | 184 (4.8%) |
| 19 to 25 Years | 2,158 (85.4%) | 369 (14.6%) |
| 26 to 34 Years | 2,588 (90.0%) | 288 (10.0%) |
| 35 to 44 Years | 2,451 (92.0%) | 214 (8.0%) |
| 45 to 54 Years | 2,073 (89.0%) | 255 (11.0%) |
| 55 to 64 Years | 2,180 (91.9%) | 191 (8.1%) |
| 65 to 74 Years | 2,108 (99.8%) | 5 (0.2%) |
| 75 Years and older | 1,239 (100.0%) | 0 (0.0%) |
| Total | 19,773 (92.9%) | 1,506 (7.1%) |
Health Insurance Coverage by Citizenship Status in Klamath Falls
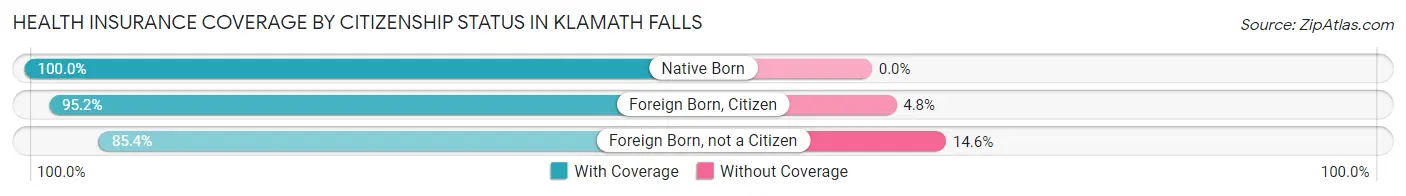
| Citizenship Status | With Coverage | Without Coverage |
| Native Born | 1,336 (100.0%) | 0 (0.0%) |
| Foreign Born, Citizen | 3,640 (95.2%) | 184 (4.8%) |
| Foreign Born, not a Citizen | 2,158 (85.4%) | 369 (14.6%) |
Health Insurance Coverage by Household Income in Klamath Falls
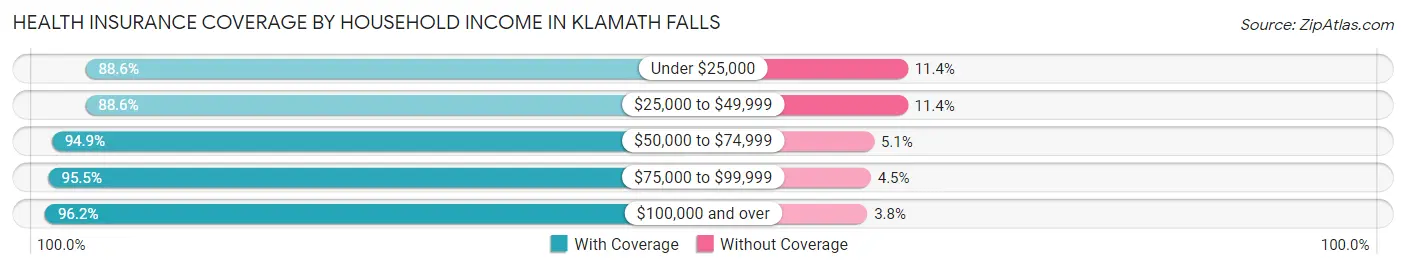
| Household Income | With Coverage | Without Coverage |
| Under $25,000 | 4,152 (88.6%) | 535 (11.4%) |
| $25,000 to $49,999 | 3,270 (88.6%) | 420 (11.4%) |
| $50,000 to $74,999 | 4,251 (94.9%) | 228 (5.1%) |
| $75,000 to $99,999 | 2,482 (95.5%) | 117 (4.5%) |
| $100,000 and over | 5,050 (96.2%) | 201 (3.8%) |
Public vs Private Health Insurance Coverage by Age in Klamath Falls
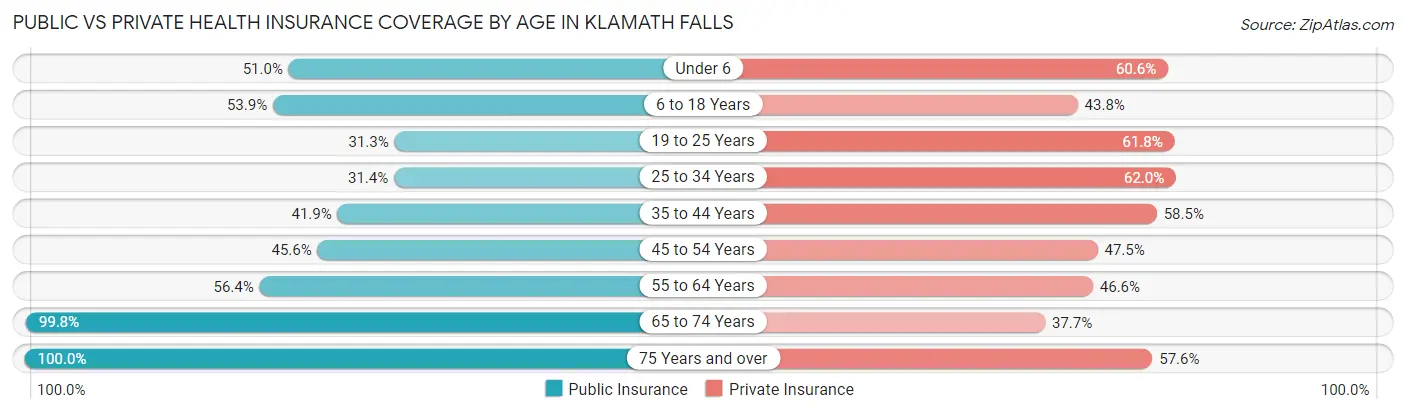
| Age Bracket | Public Insurance | Private Insurance |
| Under 6 | 681 (51.0%) | 809 (60.6%) |
| 6 to 18 Years | 2,061 (53.9%) | 1,674 (43.8%) |
| 19 to 25 Years | 792 (31.3%) | 1,561 (61.8%) |
| 25 to 34 Years | 904 (31.4%) | 1,784 (62.0%) |
| 35 to 44 Years | 1,117 (41.9%) | 1,558 (58.5%) |
| 45 to 54 Years | 1,062 (45.6%) | 1,105 (47.5%) |
| 55 to 64 Years | 1,337 (56.4%) | 1,105 (46.6%) |
| 65 to 74 Years | 2,108 (99.8%) | 797 (37.7%) |
| 75 Years and over | 1,239 (100.0%) | 714 (57.6%) |
| Total | 11,301 (53.1%) | 11,107 (52.2%) |
Disability Status by Sex by Age in Klamath Falls
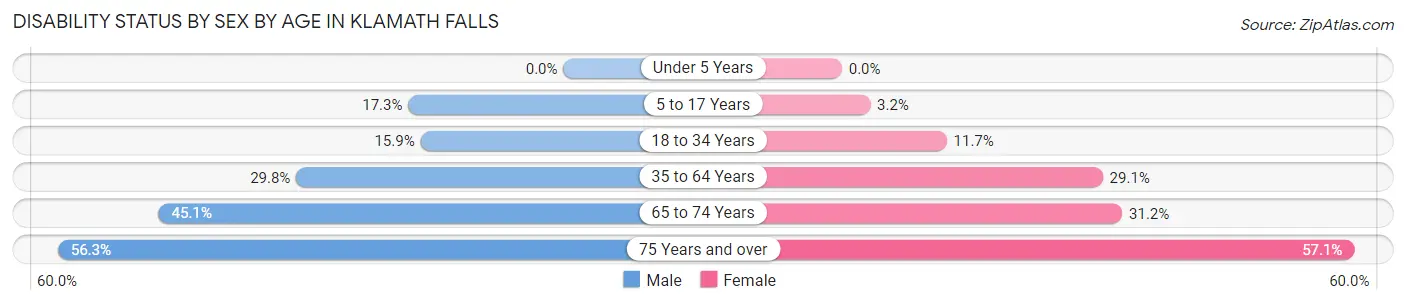
| Age Bracket | Male | Female |
| Under 5 Years | 0 (0.0%) | 0 (0.0%) |
| 5 to 17 Years | 327 (17.3%) | 58 (3.2%) |
| 18 to 34 Years | 469 (15.9%) | 327 (11.7%) |
| 35 to 64 Years | 1,044 (29.7%) | 1,120 (29.0%) |
| 65 to 74 Years | 476 (45.1%) | 330 (31.2%) |
| 75 Years and over | 295 (56.3%) | 408 (57.1%) |
Disability Class by Sex by Age in Klamath Falls
Disability Class: Hearing Difficulty
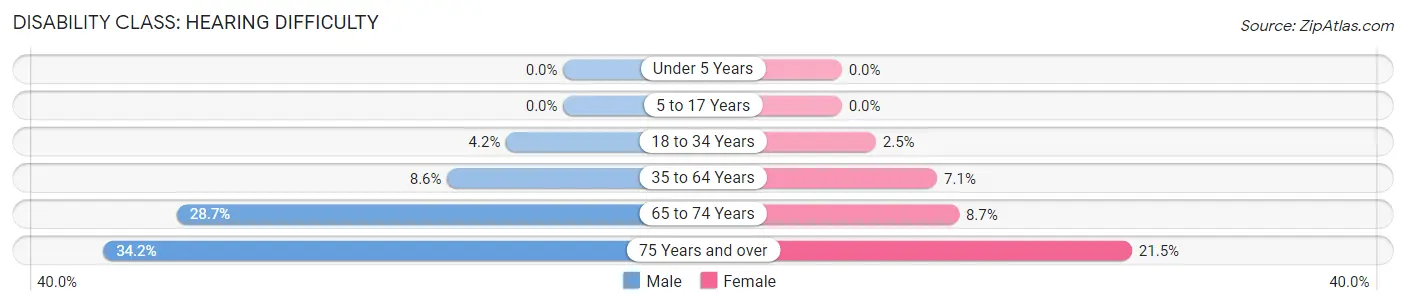
| Age Bracket | Male | Female |
| Under 5 Years | 0 (0.0%) | 0 (0.0%) |
| 5 to 17 Years | 0 (0.0%) | 0 (0.0%) |
| 18 to 34 Years | 125 (4.2%) | 71 (2.5%) |
| 35 to 64 Years | 302 (8.6%) | 273 (7.1%) |
| 65 to 74 Years | 303 (28.7%) | 92 (8.7%) |
| 75 Years and over | 179 (34.2%) | 154 (21.5%) |
Disability Class: Vision Difficulty
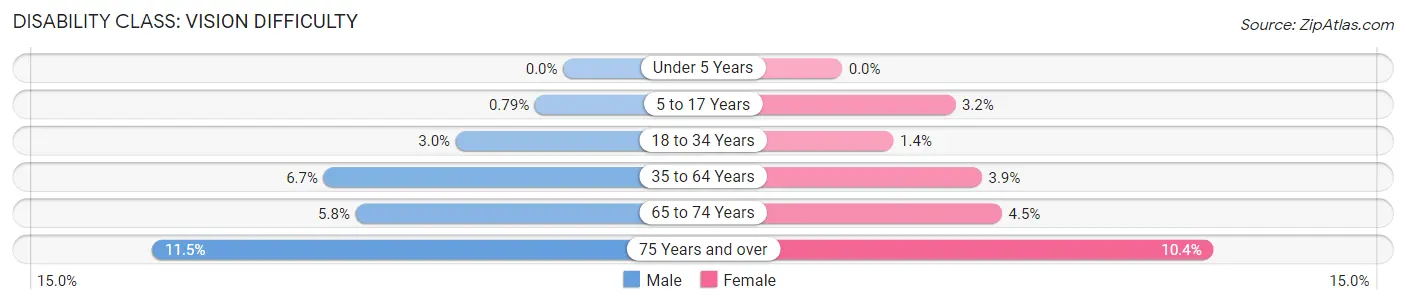
| Age Bracket | Male | Female |
| Under 5 Years | 0 (0.0%) | 0 (0.0%) |
| 5 to 17 Years | 15 (0.8%) | 58 (3.2%) |
| 18 to 34 Years | 88 (3.0%) | 40 (1.4%) |
| 35 to 64 Years | 234 (6.7%) | 150 (3.9%) |
| 65 to 74 Years | 61 (5.8%) | 47 (4.4%) |
| 75 Years and over | 60 (11.5%) | 74 (10.3%) |
Disability Class: Cognitive Difficulty
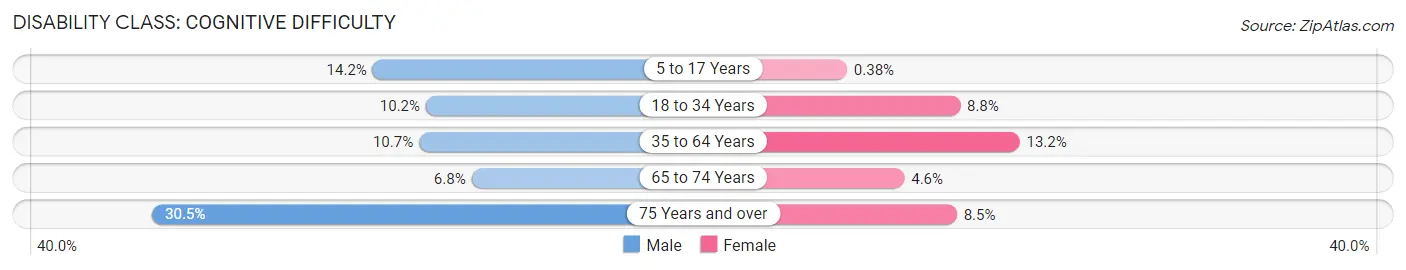
| Age Bracket | Male | Female |
| 5 to 17 Years | 268 (14.2%) | 7 (0.4%) |
| 18 to 34 Years | 301 (10.2%) | 246 (8.8%) |
| 35 to 64 Years | 376 (10.7%) | 509 (13.2%) |
| 65 to 74 Years | 72 (6.8%) | 49 (4.6%) |
| 75 Years and over | 160 (30.5%) | 61 (8.5%) |
Disability Class: Ambulatory Difficulty
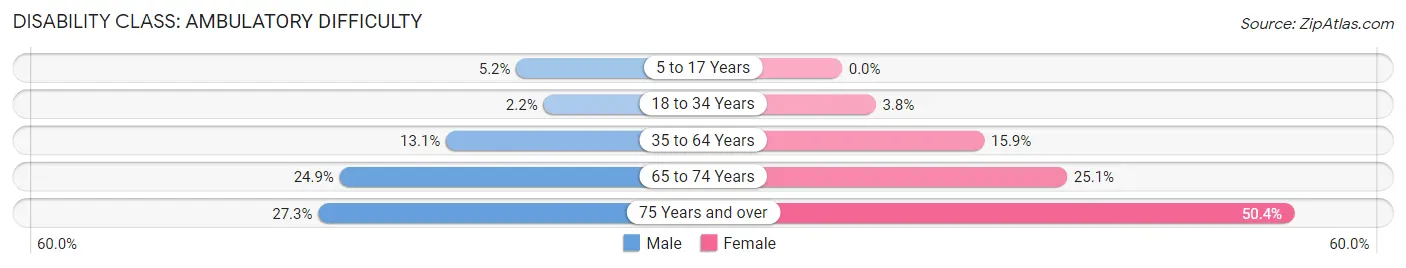
| Age Bracket | Male | Female |
| 5 to 17 Years | 99 (5.2%) | 0 (0.0%) |
| 18 to 34 Years | 65 (2.2%) | 105 (3.7%) |
| 35 to 64 Years | 458 (13.1%) | 611 (15.9%) |
| 65 to 74 Years | 263 (24.9%) | 265 (25.1%) |
| 75 Years and over | 143 (27.3%) | 360 (50.3%) |
Disability Class: Self-Care Difficulty
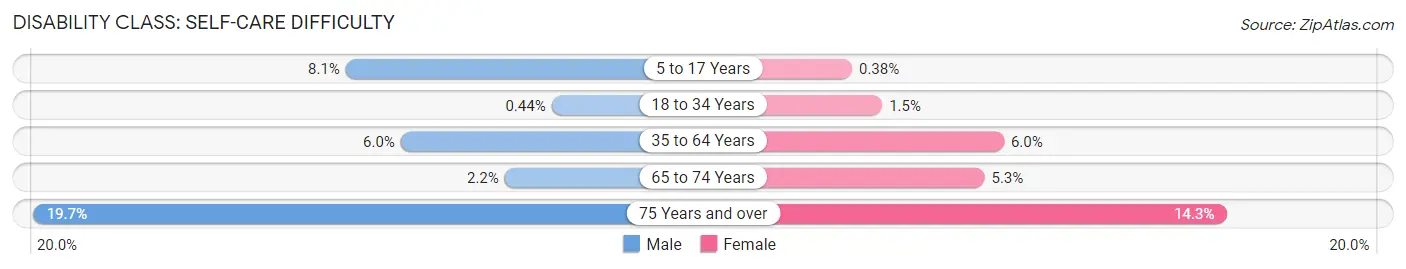
| Age Bracket | Male | Female |
| 5 to 17 Years | 153 (8.1%) | 7 (0.4%) |
| 18 to 34 Years | 13 (0.4%) | 42 (1.5%) |
| 35 to 64 Years | 212 (6.0%) | 232 (6.0%) |
| 65 to 74 Years | 23 (2.2%) | 56 (5.3%) |
| 75 Years and over | 103 (19.7%) | 102 (14.3%) |
Technology Access in Klamath Falls
Computing Device Access in Klamath Falls
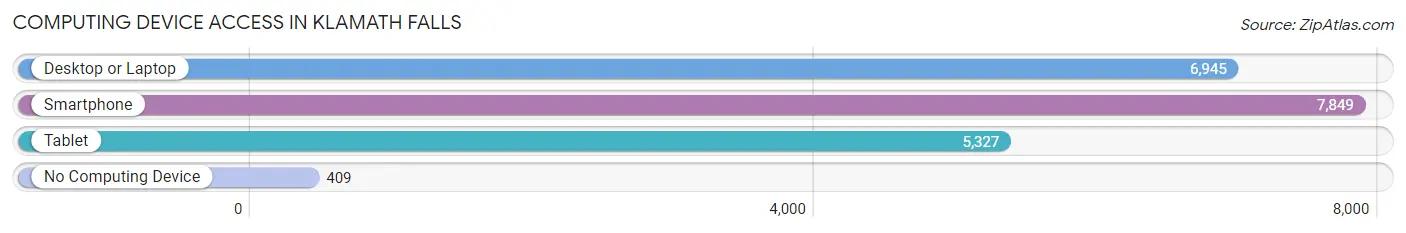
| Device Type | # Households | % Households |
| Desktop or Laptop | 6,945 | 78.2% |
| Smartphone | 7,849 | 88.3% |
| Tablet | 5,327 | 60.0% |
| No Computing Device | 409 | 4.6% |
| Total | 8,885 | 100.0% |
Internet Access in Klamath Falls
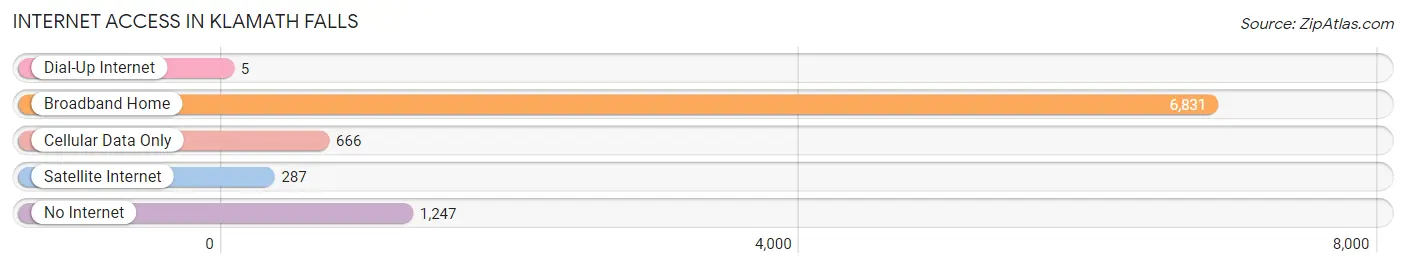
| Internet Type | # Households | % Households |
| Dial-Up Internet | 5 | 0.1% |
| Broadband Home | 6,831 | 76.9% |
| Cellular Data Only | 666 | 7.5% |
| Satellite Internet | 287 | 3.2% |
| No Internet | 1,247 | 14.0% |
| Total | 8,885 | 100.0% |
Klamath Falls Summary
Klamath Falls, Oregon is a city located in Klamath County in the south-central region of the state. It is the county seat and the largest city in the county, with a population of approximately 20,000 people. The city is situated in the Klamath Basin, a large, semi-arid region of the Great Basin that covers parts of Oregon, California, and Nevada. Klamath Falls is located at the northern end of Upper Klamath Lake, the largest natural lake in Oregon.
History
The area around Klamath Falls has been inhabited by Native Americans for thousands of years. The Klamath, Modoc, and Yahooskin tribes were the primary inhabitants of the area prior to the arrival of European settlers. The first non-native settlers arrived in the area in the late 1800s, and the city of Klamath Falls was officially incorporated in 1893.
The city was named after the nearby Klamath River, which was named by explorer Peter Skene Ogden in 1826. The river was named after the Klamath people, who were the original inhabitants of the area.
The city grew rapidly in the early 1900s, due to the abundance of natural resources in the area. The timber industry was particularly important to the city’s growth, and the city was home to several large lumber mills. The city also became a major center for agriculture, with the surrounding area producing a variety of crops, including potatoes, onions, and alfalfa.
Geography
Klamath Falls is located in the Klamath Basin, a large, semi-arid region of the Great Basin that covers parts of Oregon, California, and Nevada. The city is situated at the northern end of Upper Klamath Lake, the largest natural lake in Oregon. The lake is fed by the Klamath River, which flows through the city.
The city is surrounded by mountains, including the Cascade Range to the west and the High Cascades to the east. The city is located in a high desert climate, with hot summers and cold winters. The average annual temperature is around 50°F (10°C).
Economy
Klamath Falls is the economic center of the Klamath Basin. The city’s economy is largely based on agriculture, timber, and tourism. The city is home to several large lumber mills, and the surrounding area produces a variety of crops, including potatoes, onions, and alfalfa.
The city is also a major tourist destination, with several popular attractions, including the Klamath County Museum, the Klamath County Historical Society, and the Klamath Falls Wildlife Refuge. The city is also home to several festivals and events, including the Klamath County Fair and the Klamath Falls Jazz Festival.
Demographics
As of the 2010 census, the population of Klamath Falls was 20,840. The city has a population density of 1,845 people per square mile (715 per square kilometer). The racial makeup of the city is 87.3% White, 1.2% African American, 1.2% Native American, 0.7% Asian, 0.2% Pacific Islander, 6.2% from other races, and 3.4% from two or more races.
The median household income in Klamath Falls is $37,845, and the median family income is $45,845. The per capita income in the city is $20,845. The unemployment rate in Klamath Falls is 8.2%.
Conclusion
Klamath Falls, Oregon is a city located in Klamath County in the south-central region of the state. It is the county seat and the largest city in the county, with a population of approximately 20,000 people. The city is situated in the Klamath Basin, a large, semi-arid region of the Great Basin that covers parts of Oregon, California, and Nevada. Klamath Falls is located at the northern end of Upper Klamath Lake, the largest natural lake in Oregon. The city’s economy is largely based on agriculture, timber, and tourism, and the city is a major tourist destination, with several popular attractions. The population of Klamath Falls is 87.3% White, 1.2% African American, 1.2% Native American, 0.7% Asian, 0.2% Pacific Islander, 6.2% from other races, and 3.4% from two or more races. The median household income in Klamath Falls is $37,845, and the median family income is $45,845. The per capita income in the city is $20,845. The unemployment rate in Klamath Falls is 8.2%.
Common Questions
What is Per Capita Income in Klamath Falls?
Per Capita income in Klamath Falls is $29,201.
What is the Median Family Income in Klamath Falls?
Median Family Income in Klamath Falls is $60,558.
What is the Median Household income in Klamath Falls?
Median Household Income in Klamath Falls is $46,695.
What is Income or Wage Gap in Klamath Falls?
Income or Wage Gap in Klamath Falls is 19.5%.
Women in Klamath Falls earn 80.5 cents for every dollar earned by a man.
What is Family Income Deficit in Klamath Falls?
Family Income Deficit in Klamath Falls is $9,873.
Families that are below poverty line in Klamath Falls earn $9,873 less on average than the poverty threshold level.
What is Inequality or Gini Index in Klamath Falls?
Inequality or Gini Index in Klamath Falls is 0.52.
What is the Total Population of Klamath Falls?
Total Population of Klamath Falls is 21,806.
What is the Total Male Population of Klamath Falls?
Total Male Population of Klamath Falls is 10,879.
What is the Total Female Population of Klamath Falls?
Total Female Population of Klamath Falls is 10,927.
What is the Ratio of Males per 100 Females in Klamath Falls?
There are 99.56 Males per 100 Females in Klamath Falls.
What is the Ratio of Females per 100 Males in Klamath Falls?
There are 100.44 Females per 100 Males in Klamath Falls.
What is the Median Population Age in Klamath Falls?
Median Population Age in Klamath Falls is 35.1 Years.
What is the Average Family Size in Klamath Falls
Average Family Size in Klamath Falls is 3.1 People.
What is the Average Household Size in Klamath Falls
Average Household Size in Klamath Falls is 2.4 People.
How Large is the Labor Force in Klamath Falls?
There are 9,838 People in the Labor Forcein in Klamath Falls.
What is the Percentage of People in the Labor Force in Klamath Falls?
55.4% of People are in the Labor Force in Klamath Falls.
What is the Unemployment Rate in Klamath Falls?
Unemployment Rate in Klamath Falls is 8.1%.