Wilsonville, OR Map & Demographics
Wilsonville Map
Wilsonville Overview
$45,417
PER CAPITA INCOME
$112,848
AVG FAMILY INCOME
$83,210
AVG HOUSEHOLD INCOME
36.9%
WAGE / INCOME GAP [ % ]
63.1¢/ $1
WAGE / INCOME GAP [ $ ]
0.42
INEQUALITY / GINI INDEX
25,992
TOTAL POPULATION
12,469
MALE POPULATION
13,523
FEMALE POPULATION
92.21
MALES / 100 FEMALES
108.45
FEMALES / 100 MALES
38.3
MEDIAN AGE
2.8
AVG FAMILY SIZE
2.3
AVG HOUSEHOLD SIZE
13,694
LABOR FORCE [ PEOPLE ]
63.0%
PERCENT IN LABOR FORCE
5.8%
UNEMPLOYMENT RATE
Wilsonville Zip Codes
Income in Wilsonville
Income Overview in Wilsonville
Per Capita Income in Wilsonville is $45,417, while median incomes of families and households are $112,848 and $83,210 respectively.
| Characteristic | Number | Measure |
| Per Capita Income | 25,992 | $45,417 |
| Median Family Income | 6,765 | $112,848 |
| Mean Family Income | 6,765 | $126,942 |
| Median Household Income | 10,614 | $83,210 |
| Mean Household Income | 10,614 | $107,761 |
| Income Deficit | 6,765 | $0 |
| Wage / Income Gap (%) | 25,992 | 36.86% |
| Wage / Income Gap ($) | 25,992 | 63.14¢ per $1 |
| Gini / Inequality Index | 25,992 | 0.42 |
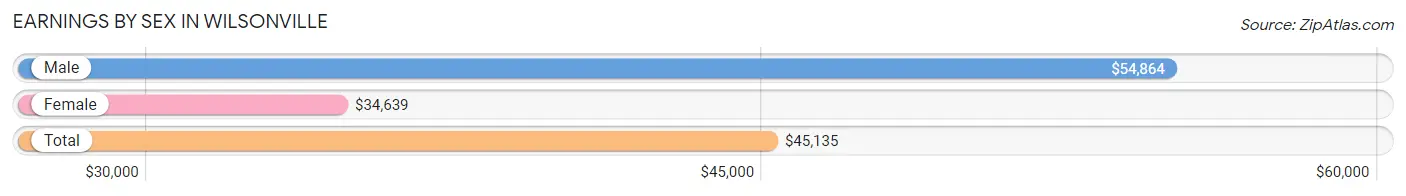
Earnings by Sex in Wilsonville
Average Earnings in Wilsonville are $45,135, $54,864 for men and $34,639 for women, a difference of 36.9%.
| Sex | Number | Average Earnings |
| Male | 7,569 (52.4%) | $54,864 |
| Female | 6,881 (47.6%) | $34,639 |
| Total | 14,450 (100.0%) | $45,135 |
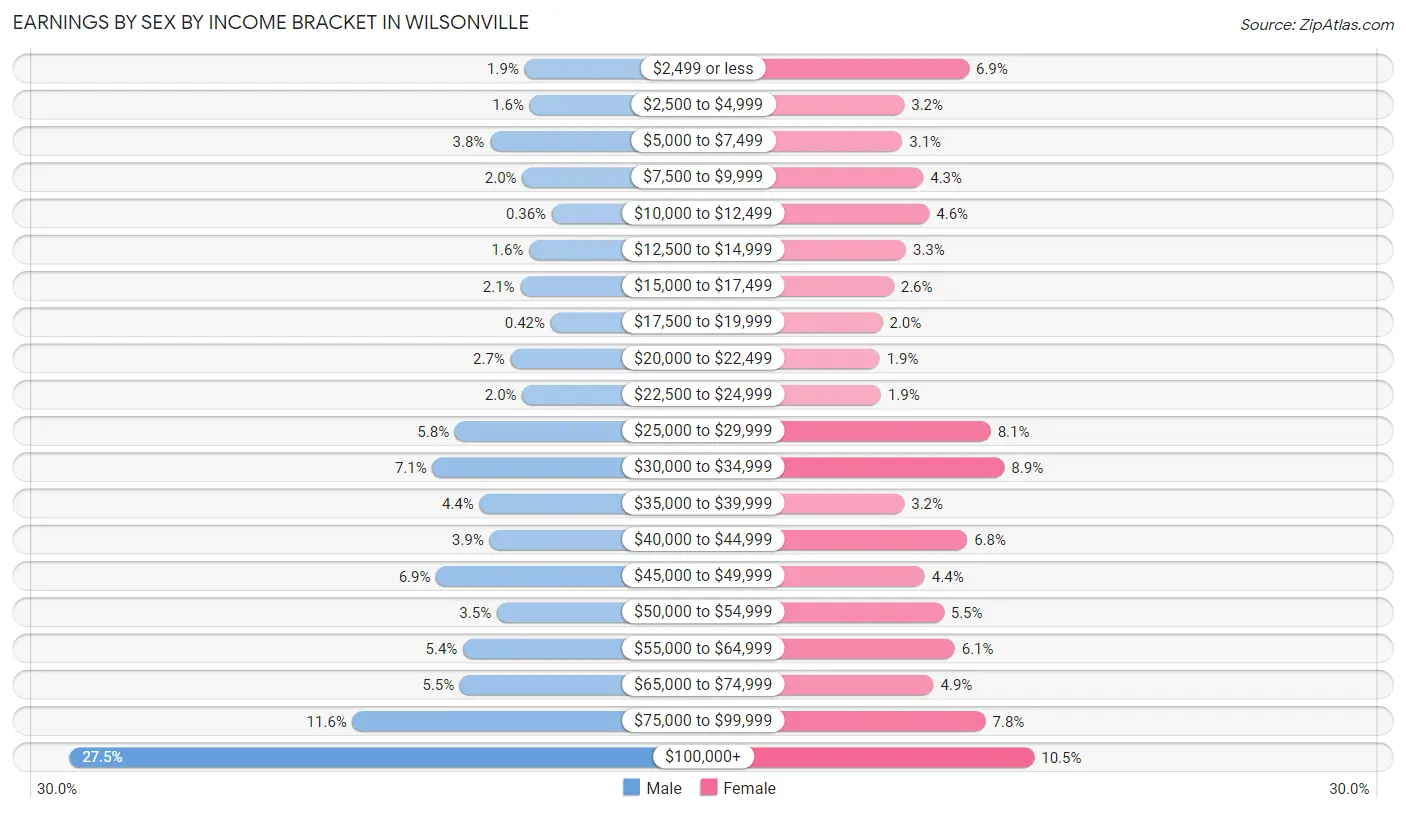
Earnings by Sex by Income Bracket in Wilsonville
The most common earnings brackets in Wilsonville are $100,000+ for men (2,081 | 27.5%) and $100,000+ for women (725 | 10.5%).
| Income | Male | Female |
| $2,499 or less | 143 (1.9%) | 473 (6.9%) |
| $2,500 to $4,999 | 121 (1.6%) | 222 (3.2%) |
| $5,000 to $7,499 | 290 (3.8%) | 215 (3.1%) |
| $7,500 to $9,999 | 153 (2.0%) | 296 (4.3%) |
| $10,000 to $12,499 | 27 (0.4%) | 319 (4.6%) |
| $12,500 to $14,999 | 124 (1.6%) | 229 (3.3%) |
| $15,000 to $17,499 | 161 (2.1%) | 182 (2.6%) |
| $17,500 to $19,999 | 32 (0.4%) | 138 (2.0%) |
| $20,000 to $22,499 | 203 (2.7%) | 127 (1.8%) |
| $22,500 to $24,999 | 153 (2.0%) | 132 (1.9%) |
| $25,000 to $29,999 | 440 (5.8%) | 557 (8.1%) |
| $30,000 to $34,999 | 535 (7.1%) | 610 (8.9%) |
| $35,000 to $39,999 | 335 (4.4%) | 222 (3.2%) |
| $40,000 to $44,999 | 293 (3.9%) | 466 (6.8%) |
| $45,000 to $49,999 | 519 (6.9%) | 302 (4.4%) |
| $50,000 to $54,999 | 261 (3.5%) | 375 (5.4%) |
| $55,000 to $64,999 | 405 (5.3%) | 418 (6.1%) |
| $65,000 to $74,999 | 418 (5.5%) | 336 (4.9%) |
| $75,000 to $99,999 | 875 (11.6%) | 537 (7.8%) |
| $100,000+ | 2,081 (27.5%) | 725 (10.5%) |
| Total | 7,569 (100.0%) | 6,881 (100.0%) |
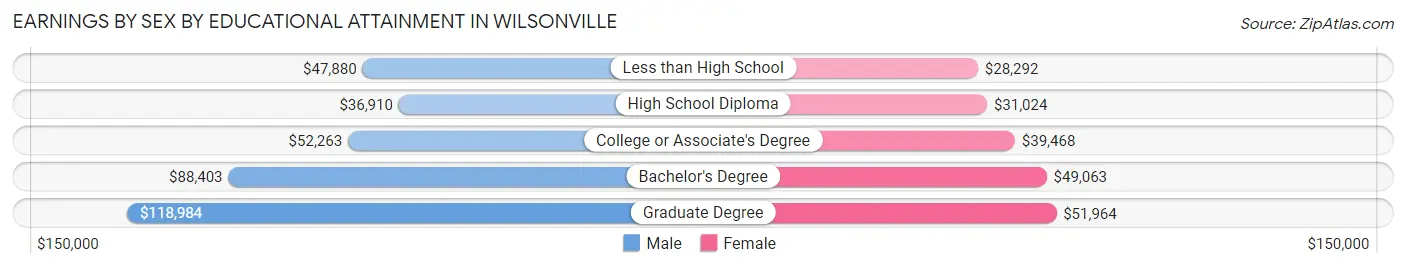
Earnings by Sex by Educational Attainment in Wilsonville
Average earnings in Wilsonville are $68,443 for men and $42,697 for women, a difference of 37.6%. Men with an educational attainment of graduate degree enjoy the highest average annual earnings of $118,984, while those with high school diploma education earn the least with $36,910. Women with an educational attainment of graduate degree earn the most with the average annual earnings of $51,964, while those with less than high school education have the smallest earnings of $28,292.
| Educational Attainment | Male Income | Female Income |
| Less than High School | $47,880 | $28,292 |
| High School Diploma | $36,910 | $31,024 |
| College or Associate's Degree | $52,263 | $39,468 |
| Bachelor's Degree | $88,403 | $49,063 |
| Graduate Degree | $118,984 | $51,964 |
| Total | $68,443 | $42,697 |
Family Income in Wilsonville
Family Income Brackets in Wilsonville
According to the Wilsonville family income data, there are 1,928 families falling into the $100,000 to $149,999 income range, which is the most common income bracket and makes up 28.5% of all families. Conversely, the less than $10,000 income bracket is the least frequent group with only 88 families (1.3%) belonging to this category.
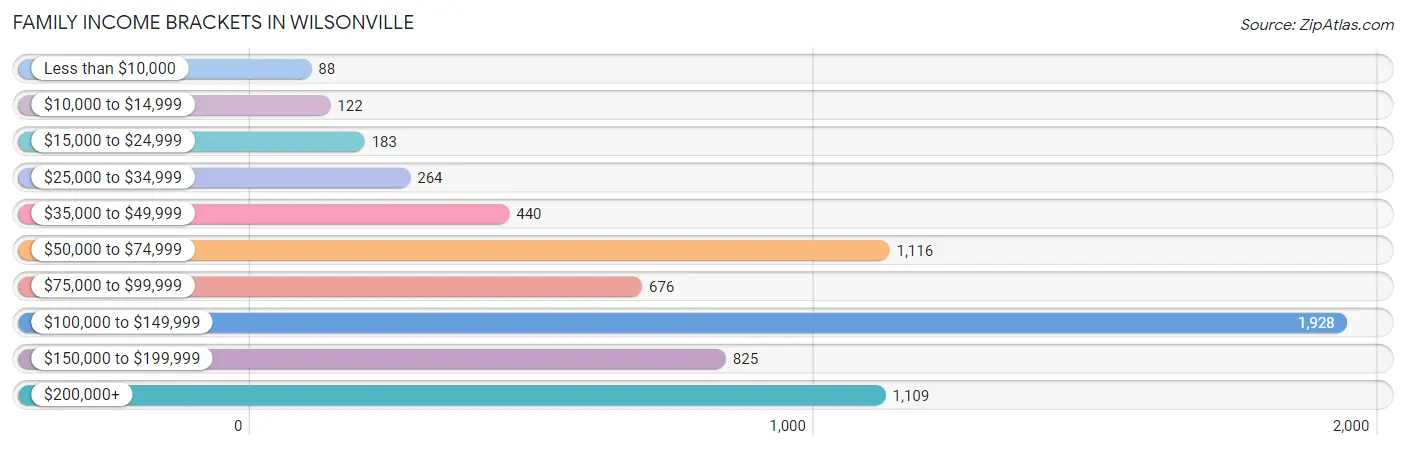
| Income Bracket | # Families | % Families |
| Less than $10,000 | 88 | 1.3% |
| $10,000 to $14,999 | 122 | 1.8% |
| $15,000 to $24,999 | 183 | 2.7% |
| $25,000 to $34,999 | 264 | 3.9% |
| $35,000 to $49,999 | 440 | 6.5% |
| $50,000 to $74,999 | 1,116 | 16.5% |
| $75,000 to $99,999 | 676 | 10.0% |
| $100,000 to $149,999 | 1,928 | 28.5% |
| $150,000 to $199,999 | 825 | 12.2% |
| $200,000+ | 1,109 | 16.4% |
Family Income by Famaliy Size in Wilsonville
6-person families (53 | 0.8%) account for the highest median family income in Wilsonville with $164,821 per family, while 2-person families (3,603 | 53.3%) have the highest median income of $47,910 per family member.
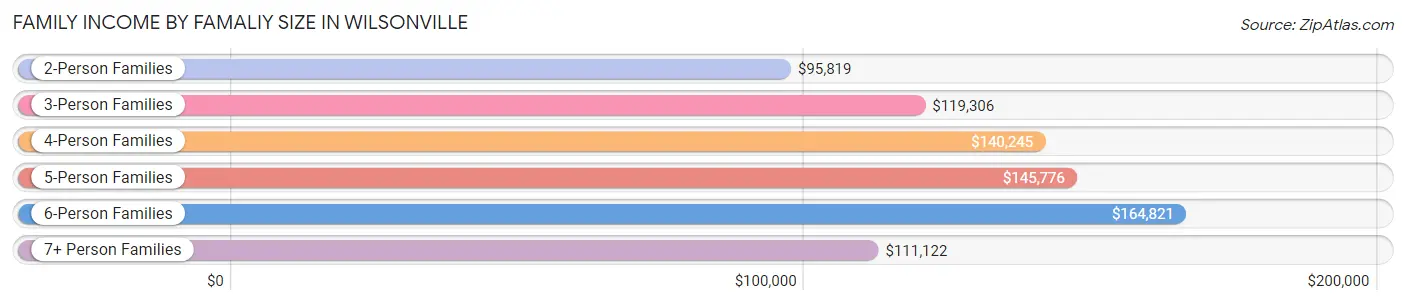
| Income Bracket | # Families | Median Income |
| 2-Person Families | 3,603 (53.3%) | $95,819 |
| 3-Person Families | 1,507 (22.3%) | $119,306 |
| 4-Person Families | 1,293 (19.1%) | $140,245 |
| 5-Person Families | 264 (3.9%) | $145,776 |
| 6-Person Families | 53 (0.8%) | $164,821 |
| 7+ Person Families | 45 (0.7%) | $111,122 |
| Total | 6,765 (100.0%) | $112,848 |
Family Income by Number of Earners in Wilsonville
The median family income in Wilsonville is $112,848, with families comprising 3+ earners (642) having the highest median family income of $175,455, while families with 1 earner (2,287) have the lowest median family income of $79,432, accounting for 9.5% and 33.8% of families, respectively.
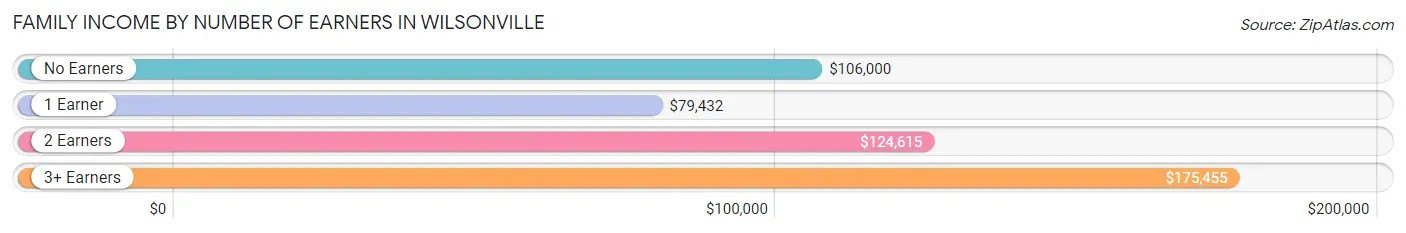
| Number of Earners | # Families | Median Income |
| No Earners | 1,038 (15.3%) | $106,000 |
| 1 Earner | 2,287 (33.8%) | $79,432 |
| 2 Earners | 2,798 (41.4%) | $124,615 |
| 3+ Earners | 642 (9.5%) | $175,455 |
| Total | 6,765 (100.0%) | $112,848 |
Household Income in Wilsonville
Household Income Brackets in Wilsonville
With 2,452 households falling in the category, the $100,000 to $149,999 income range is the most frequent in Wilsonville, accounting for 23.1% of all households. In contrast, only 191 households (1.8%) fall into the $10,000 to $14,999 income bracket, making it the least populous group.
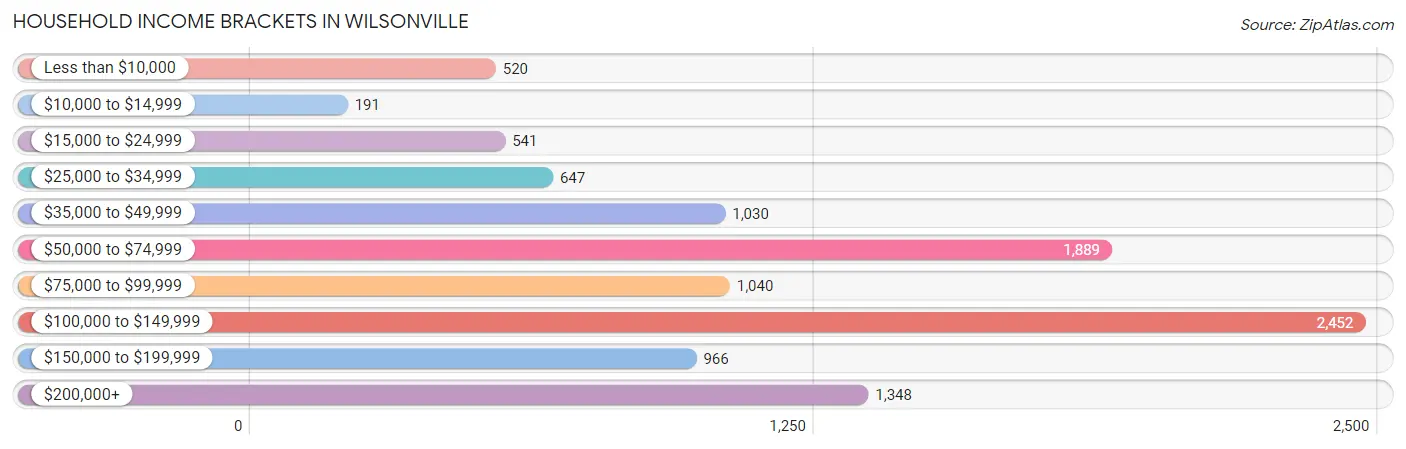
| Income Bracket | # Households | % Households |
| Less than $10,000 | 520 | 4.9% |
| $10,000 to $14,999 | 191 | 1.8% |
| $15,000 to $24,999 | 541 | 5.1% |
| $25,000 to $34,999 | 647 | 6.1% |
| $35,000 to $49,999 | 1,030 | 9.7% |
| $50,000 to $74,999 | 1,889 | 17.8% |
| $75,000 to $99,999 | 1,040 | 9.8% |
| $100,000 to $149,999 | 2,452 | 23.1% |
| $150,000 to $199,999 | 966 | 9.1% |
| $200,000+ | 1,348 | 12.7% |
Household Income by Householder Age in Wilsonville
The median household income in Wilsonville is $83,210, with the highest median household income of $112,592 found in the 45 to 64 years age bracket for the primary householder. A total of 3,539 households (33.3%) fall into this category. Meanwhile, the 15 to 24 years age bracket for the primary householder has the lowest median household income of $54,882, with 555 households (5.2%) in this group.
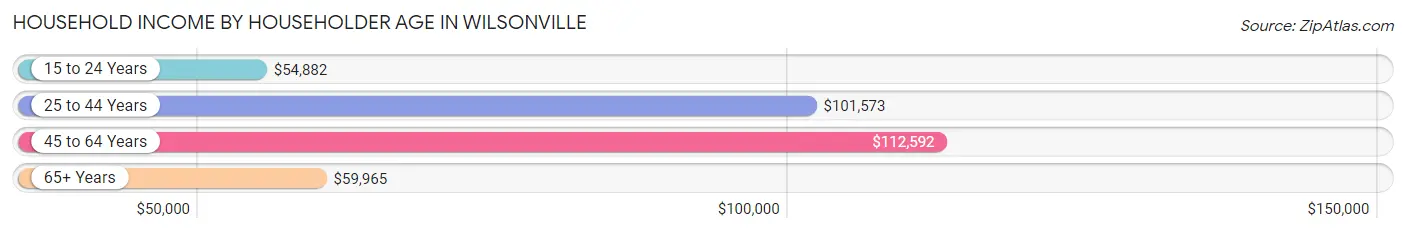
| Income Bracket | # Households | Median Income |
| 15 to 24 Years | 555 (5.2%) | $54,882 |
| 25 to 44 Years | 3,655 (34.4%) | $101,573 |
| 45 to 64 Years | 3,539 (33.3%) | $112,592 |
| 65+ Years | 2,865 (27.0%) | $59,965 |
| Total | 10,614 (100.0%) | $83,210 |
Poverty in Wilsonville
Income Below Poverty by Sex and Age in Wilsonville
With 7.5% poverty level for males and 10.0% for females among the residents of Wilsonville, under 5 year old males and 15 year old females are the most vulnerable to poverty, with 146 males (21.5%) and 31 females (30.1%) in their respective age groups living below the poverty level.
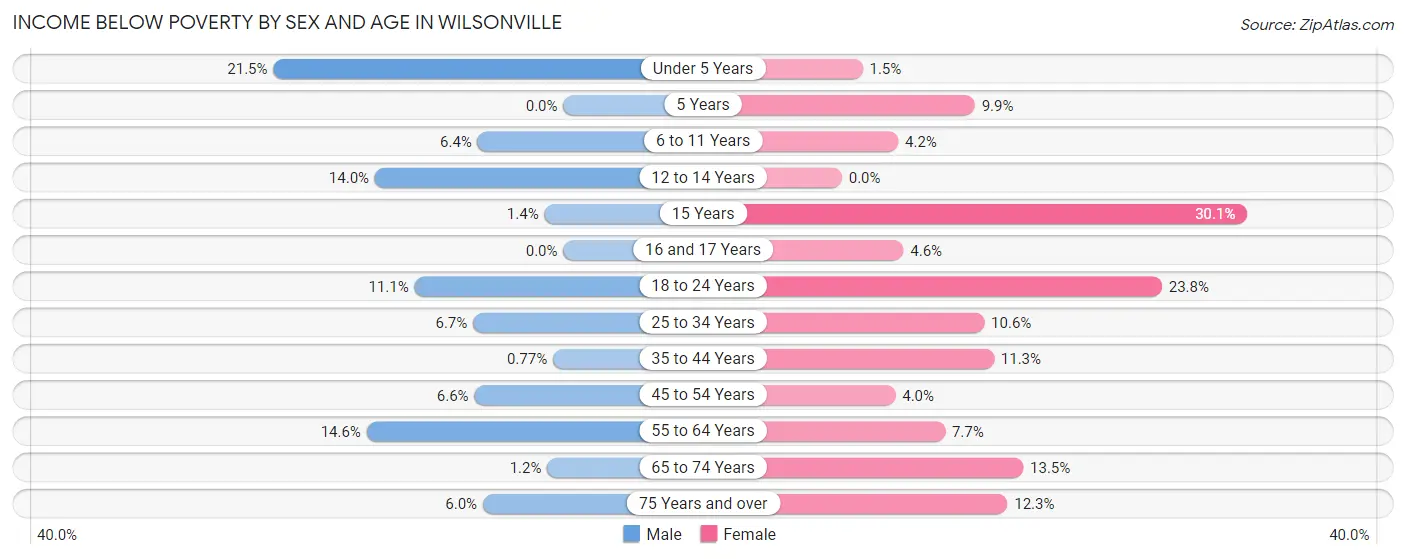
| Age Bracket | Male | Female |
| Under 5 Years | 146 (21.5%) | 7 (1.5%) |
| 5 Years | 0 (0.0%) | 23 (9.9%) |
| 6 to 11 Years | 55 (6.4%) | 34 (4.2%) |
| 12 to 14 Years | 67 (14.0%) | 0 (0.0%) |
| 15 Years | 2 (1.4%) | 31 (30.1%) |
| 16 and 17 Years | 0 (0.0%) | 18 (4.6%) |
| 18 to 24 Years | 150 (11.1%) | 225 (23.8%) |
| 25 to 34 Years | 139 (6.7%) | 196 (10.6%) |
| 35 to 44 Years | 14 (0.8%) | 194 (11.3%) |
| 45 to 54 Years | 109 (6.6%) | 59 (4.0%) |
| 55 to 64 Years | 187 (14.6%) | 121 (7.7%) |
| 65 to 74 Years | 11 (1.2%) | 163 (13.5%) |
| 75 Years and over | 45 (6.0%) | 162 (12.3%) |
| Total | 925 (7.5%) | 1,233 (10.0%) |
Income Above Poverty by Sex and Age in Wilsonville
According to the poverty statistics in Wilsonville, males aged 5 years and females aged 12 to 14 years are the age groups that are most secure financially, with 100.0% of males and 100.0% of females in these age groups living above the poverty line.
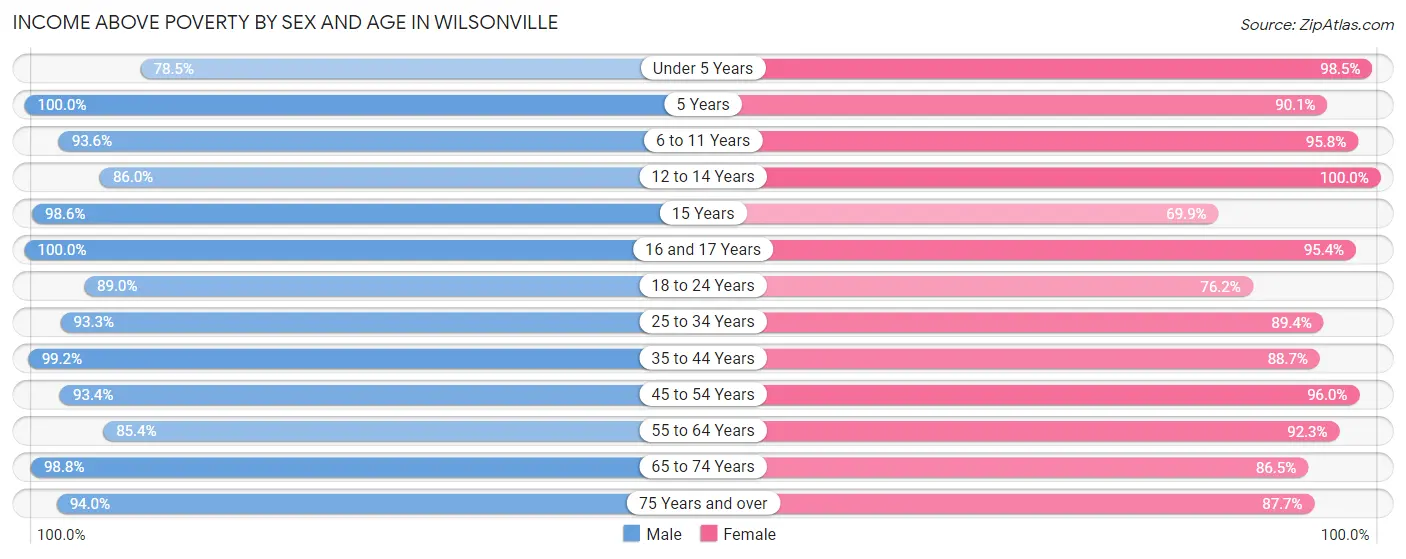
| Age Bracket | Male | Female |
| Under 5 Years | 532 (78.5%) | 449 (98.5%) |
| 5 Years | 191 (100.0%) | 210 (90.1%) |
| 6 to 11 Years | 810 (93.6%) | 780 (95.8%) |
| 12 to 14 Years | 412 (86.0%) | 229 (100.0%) |
| 15 Years | 141 (98.6%) | 72 (69.9%) |
| 16 and 17 Years | 124 (100.0%) | 376 (95.4%) |
| 18 to 24 Years | 1,207 (88.9%) | 722 (76.2%) |
| 25 to 34 Years | 1,936 (93.3%) | 1,658 (89.4%) |
| 35 to 44 Years | 1,802 (99.2%) | 1,524 (88.7%) |
| 45 to 54 Years | 1,542 (93.4%) | 1,428 (96.0%) |
| 55 to 64 Years | 1,094 (85.4%) | 1,458 (92.3%) |
| 65 to 74 Years | 916 (98.8%) | 1,048 (86.5%) |
| 75 Years and over | 709 (94.0%) | 1,156 (87.7%) |
| Total | 11,416 (92.5%) | 11,110 (90.0%) |
Income Below Poverty Among Married-Couple Families in Wilsonville
The poverty statistics for married-couple families in Wilsonville show that 3.1% or 159 of the total 5,156 families live below the poverty line. Families with 1 or 2 children have the highest poverty rate of 4.4%, comprising of 82 families. On the other hand, families with 3 or 4 children have the lowest poverty rate of 0.0%, which includes 0 families.
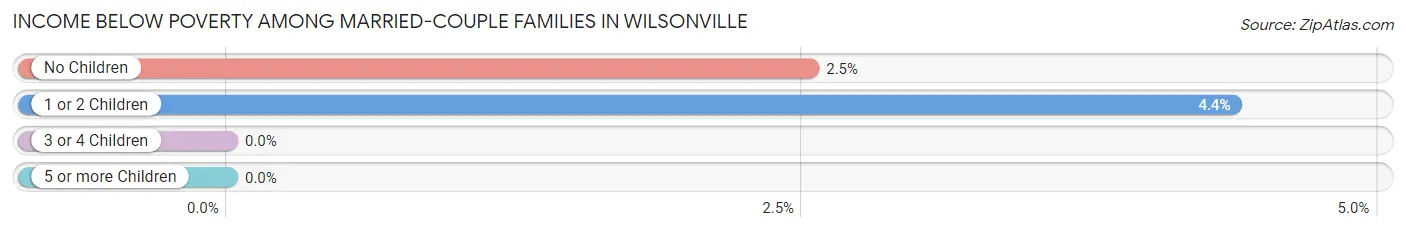
| Children | Above Poverty | Below Poverty |
| No Children | 2,965 (97.5%) | 77 (2.5%) |
| 1 or 2 Children | 1,794 (95.6%) | 82 (4.4%) |
| 3 or 4 Children | 233 (100.0%) | 0 (0.0%) |
| 5 or more Children | 5 (100.0%) | 0 (0.0%) |
| Total | 4,997 (96.9%) | 159 (3.1%) |
Income Below Poverty Among Single-Parent Households in Wilsonville
According to the poverty data in Wilsonville, 3.9% or 25 single-father households and 19.1% or 186 single-mother households are living below the poverty line. Among single-father households, those with 1 or 2 children have the highest poverty rate, with 23 households (7.7%) experiencing poverty. Likewise, among single-mother households, those with 1 or 2 children have the highest poverty rate, with 159 households (25.9%) falling below the poverty line.
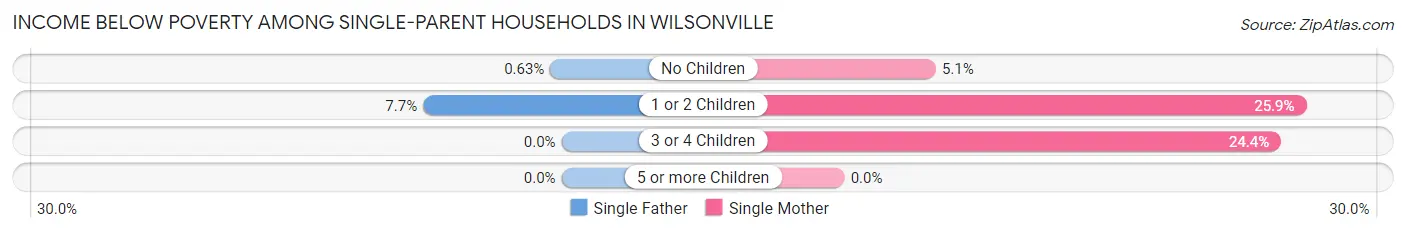
| Children | Single Father | Single Mother |
| No Children | 2 (0.6%) | 16 (5.1%) |
| 1 or 2 Children | 23 (7.7%) | 159 (25.9%) |
| 3 or 4 Children | 0 (0.0%) | 11 (24.4%) |
| 5 or more Children | 0 (0.0%) | 0 (0.0%) |
| Total | 25 (3.9%) | 186 (19.1%) |
Income Below Poverty Among Married-Couple vs Single-Parent Households in Wilsonville
The poverty data for Wilsonville shows that 159 of the married-couple family households (3.1%) and 211 of the single-parent households (13.1%) are living below the poverty level. Within the married-couple family households, those with 1 or 2 children have the highest poverty rate, with 82 households (4.4%) falling below the poverty line. Among the single-parent households, those with 1 or 2 children have the highest poverty rate, with 182 household (20.0%) living below poverty.
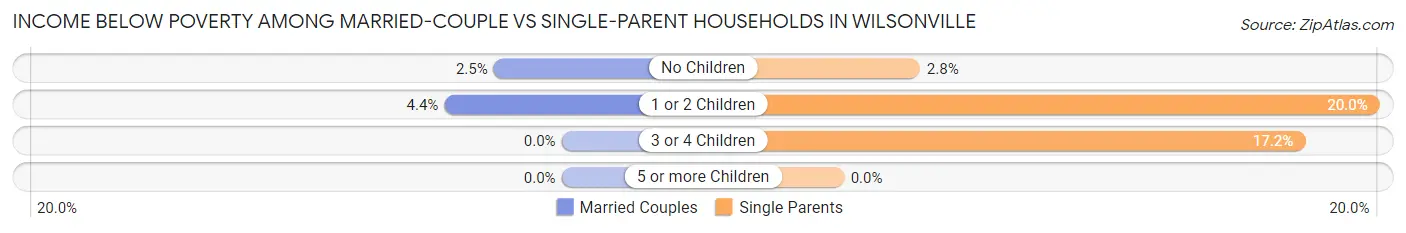
| Children | Married-Couple Families | Single-Parent Households |
| No Children | 77 (2.5%) | 18 (2.8%) |
| 1 or 2 Children | 82 (4.4%) | 182 (20.0%) |
| 3 or 4 Children | 0 (0.0%) | 11 (17.2%) |
| 5 or more Children | 0 (0.0%) | 0 (0.0%) |
| Total | 159 (3.1%) | 211 (13.1%) |
Race in Wilsonville
The most populous races in Wilsonville are White / Caucasian (20,087 | 77.3%), Hispanic or Latino (3,678 | 14.1%), and Two or more Races (3,374 | 13.0%).
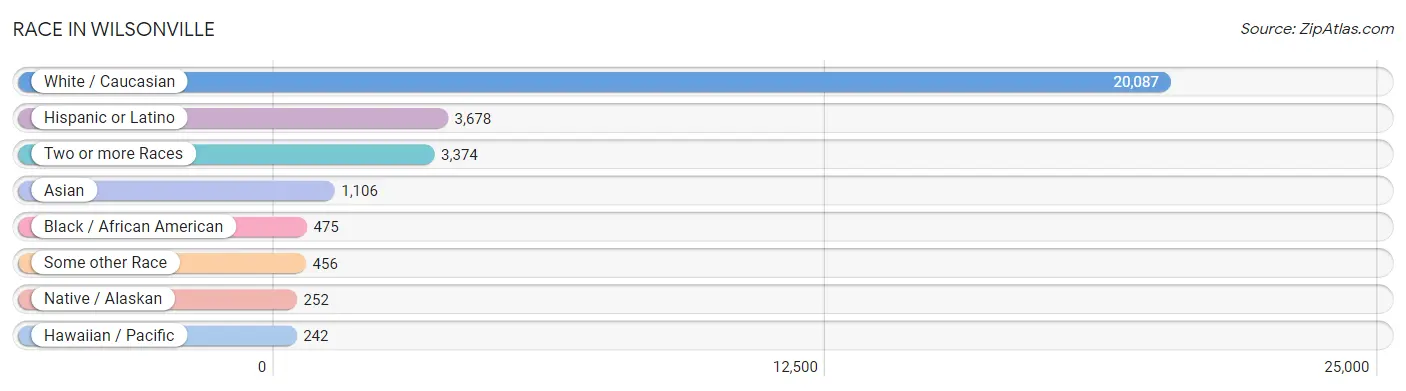
| Race | # Population | % Population |
| Asian | 1,106 | 4.3% |
| Black / African American | 475 | 1.8% |
| Hawaiian / Pacific | 242 | 0.9% |
| Hispanic or Latino | 3,678 | 14.1% |
| Native / Alaskan | 252 | 1.0% |
| White / Caucasian | 20,087 | 77.3% |
| Two or more Races | 3,374 | 13.0% |
| Some other Race | 456 | 1.8% |
| Total | 25,992 | 100.0% |
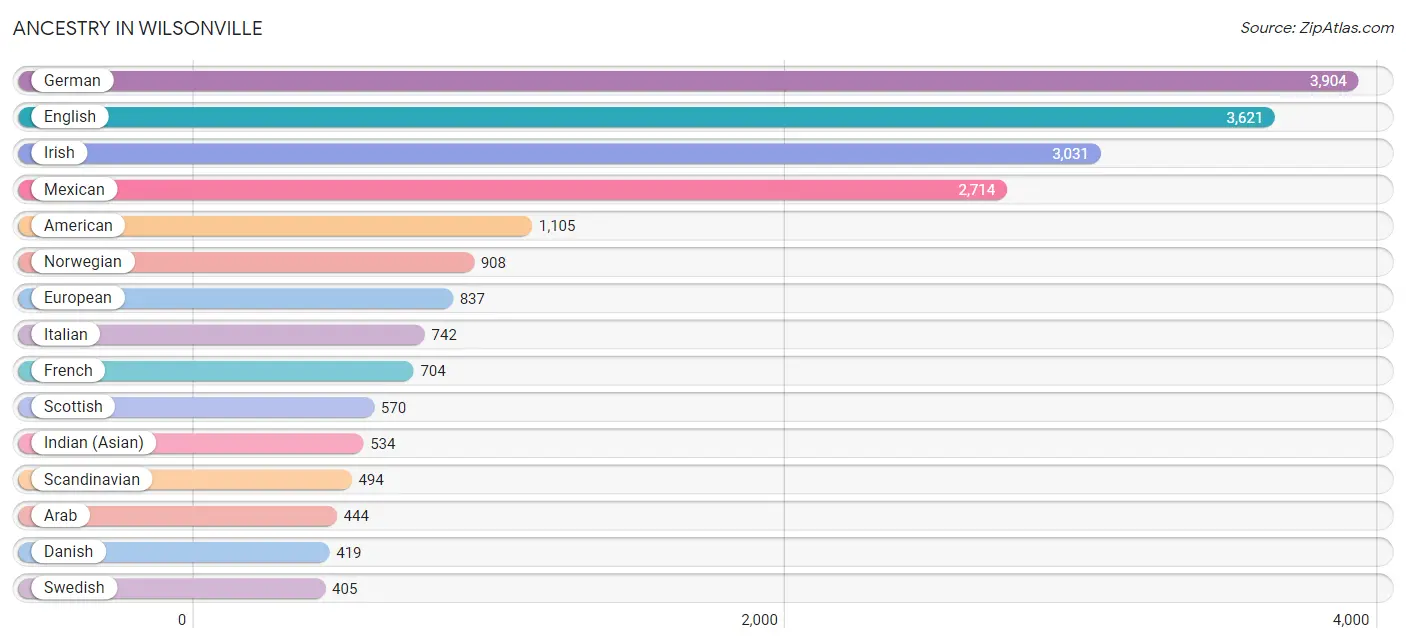
Ancestry in Wilsonville
The most populous ancestries reported in Wilsonville are German (3,904 | 15.0%), English (3,621 | 13.9%), Irish (3,031 | 11.7%), Mexican (2,714 | 10.4%), and American (1,105 | 4.3%), together accounting for 55.3% of all Wilsonville residents.
| Ancestry | # Population | % Population |
| African | 8 | 0.0% |
| Alaskan Athabascan | 22 | 0.1% |
| Aleut | 22 | 0.1% |
| American | 1,105 | 4.3% |
| Apache | 10 | 0.0% |
| Arab | 444 | 1.7% |
| Argentinean | 37 | 0.1% |
| Armenian | 48 | 0.2% |
| Austrian | 42 | 0.2% |
| Basque | 1 | 0.0% |
| Bhutanese | 286 | 1.1% |
| British | 244 | 0.9% |
| Burmese | 351 | 1.3% |
| Cajun | 16 | 0.1% |
| Canadian | 92 | 0.4% |
| Central American | 299 | 1.1% |
| Cherokee | 177 | 0.7% |
| Cheyenne | 10 | 0.0% |
| Choctaw | 13 | 0.1% |
| Colombian | 14 | 0.1% |
| Croatian | 58 | 0.2% |
| Cuban | 46 | 0.2% |
| Czech | 183 | 0.7% |
| Czechoslovakian | 9 | 0.0% |
| Danish | 419 | 1.6% |
| Dutch | 257 | 1.0% |
| Eastern European | 36 | 0.1% |
| English | 3,621 | 13.9% |
| Ethiopian | 67 | 0.3% |
| European | 837 | 3.2% |
| Filipino | 29 | 0.1% |
| Finnish | 37 | 0.1% |
| French | 704 | 2.7% |
| French Canadian | 176 | 0.7% |
| German | 3,904 | 15.0% |
| Greek | 73 | 0.3% |
| Guatemalan | 18 | 0.1% |
| Hungarian | 77 | 0.3% |
| Indian (Asian) | 534 | 2.1% |
| Inupiat | 9 | 0.0% |
| Iranian | 90 | 0.4% |
| Irish | 3,031 | 11.7% |
| Iroquois | 18 | 0.1% |
| Italian | 742 | 2.9% |
| Jamaican | 16 | 0.1% |
| Japanese | 13 | 0.1% |
| Korean | 273 | 1.1% |
| Laotian | 5 | 0.0% |
| Lebanese | 47 | 0.2% |
| Lithuanian | 28 | 0.1% |
| Marshallese | 96 | 0.4% |
| Mexican | 2,714 | 10.4% |
| Moroccan | 11 | 0.0% |
| Native Hawaiian | 82 | 0.3% |
| Navajo | 115 | 0.4% |
| New Zealander | 22 | 0.1% |
| Nicaraguan | 69 | 0.3% |
| Northern European | 20 | 0.1% |
| Norwegian | 908 | 3.5% |
| Pakistani | 66 | 0.3% |
| Panamanian | 115 | 0.4% |
| Peruvian | 166 | 0.6% |
| Polish | 396 | 1.5% |
| Portuguese | 39 | 0.2% |
| Romanian | 15 | 0.1% |
| Russian | 243 | 0.9% |
| Salvadoran | 97 | 0.4% |
| Samoan | 9 | 0.0% |
| Scandinavian | 494 | 1.9% |
| Scotch-Irish | 102 | 0.4% |
| Scottish | 570 | 2.2% |
| Sioux | 38 | 0.2% |
| Slavic | 14 | 0.1% |
| Slovak | 45 | 0.2% |
| South African | 11 | 0.0% |
| South American | 217 | 0.8% |
| Spaniard | 21 | 0.1% |
| Spanish | 192 | 0.7% |
| Sri Lankan | 245 | 0.9% |
| Subsaharan African | 102 | 0.4% |
| Swedish | 405 | 1.6% |
| Swiss | 229 | 0.9% |
| Thai | 115 | 0.4% |
| Tlingit-Haida | 11 | 0.0% |
| Ukrainian | 297 | 1.1% |
| Welsh | 284 | 1.1% | View All 86 Rows |
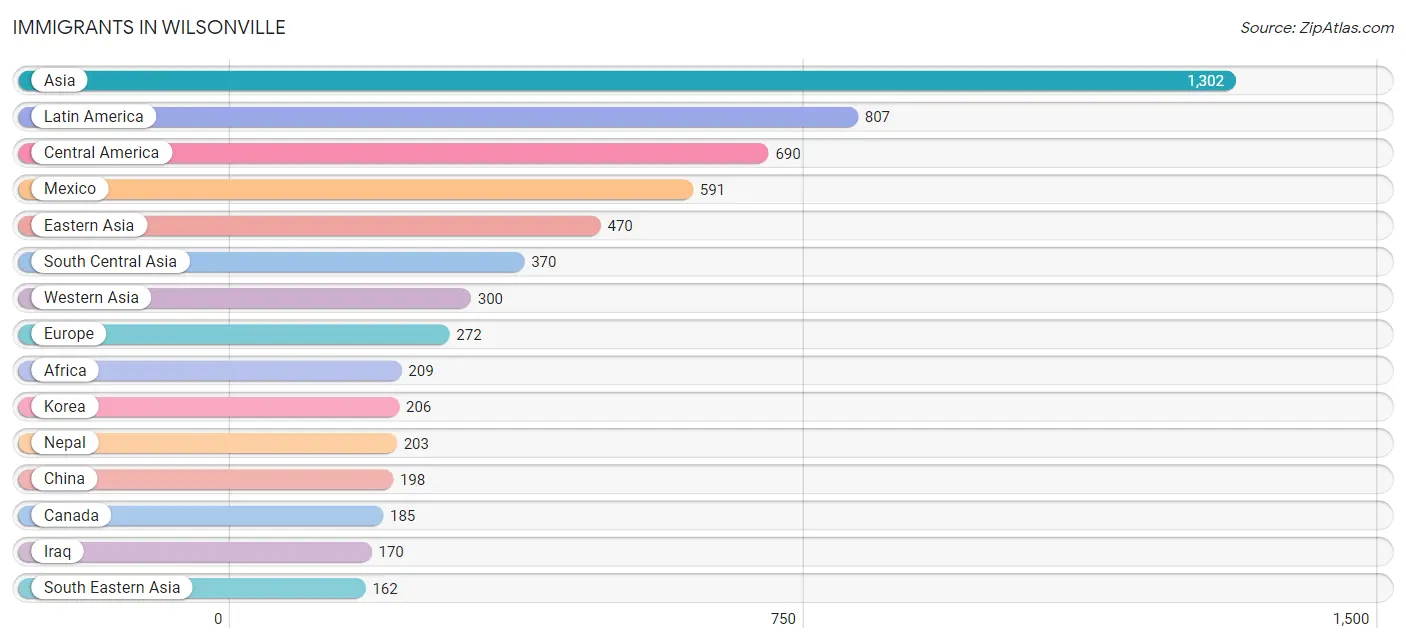
Immigrants in Wilsonville
The most numerous immigrant groups reported in Wilsonville came from Asia (1,302 | 5.0%), Latin America (807 | 3.1%), Central America (690 | 2.6%), Mexico (591 | 2.3%), and Eastern Asia (470 | 1.8%), together accounting for 14.8% of all Wilsonville residents.
| Immigration Origin | # Population | % Population |
| Africa | 209 | 0.8% |
| Asia | 1,302 | 5.0% |
| Brazil | 6 | 0.0% |
| Canada | 185 | 0.7% |
| Central America | 690 | 2.6% |
| China | 198 | 0.8% |
| Eastern Africa | 67 | 0.3% |
| Eastern Asia | 470 | 1.8% |
| Eastern Europe | 119 | 0.5% |
| El Salvador | 31 | 0.1% |
| England | 22 | 0.1% |
| Ethiopia | 67 | 0.3% |
| Europe | 272 | 1.1% |
| Germany | 50 | 0.2% |
| Guatemala | 12 | 0.1% |
| Honduras | 18 | 0.1% |
| Hungary | 13 | 0.1% |
| India | 31 | 0.1% |
| Iran | 90 | 0.4% |
| Iraq | 170 | 0.6% |
| Japan | 66 | 0.3% |
| Jordan | 82 | 0.3% |
| Korea | 206 | 0.8% |
| Kuwait | 13 | 0.1% |
| Latin America | 807 | 3.1% |
| Mexico | 591 | 2.3% |
| Micronesia | 71 | 0.3% |
| Nepal | 203 | 0.8% |
| Nicaragua | 38 | 0.2% |
| Northern Europe | 103 | 0.4% |
| Oceania | 93 | 0.4% |
| Peru | 111 | 0.4% |
| Philippines | 34 | 0.1% |
| Romania | 5 | 0.0% |
| Russia | 22 | 0.1% |
| Saudi Arabia | 35 | 0.1% |
| Scotland | 24 | 0.1% |
| South Africa | 142 | 0.5% |
| South America | 117 | 0.4% |
| South Central Asia | 370 | 1.4% |
| South Eastern Asia | 162 | 0.6% |
| Taiwan | 29 | 0.1% |
| Thailand | 30 | 0.1% |
| Ukraine | 66 | 0.3% |
| Vietnam | 98 | 0.4% |
| Western Asia | 300 | 1.1% |
| Western Europe | 50 | 0.2% | View All 47 Rows |
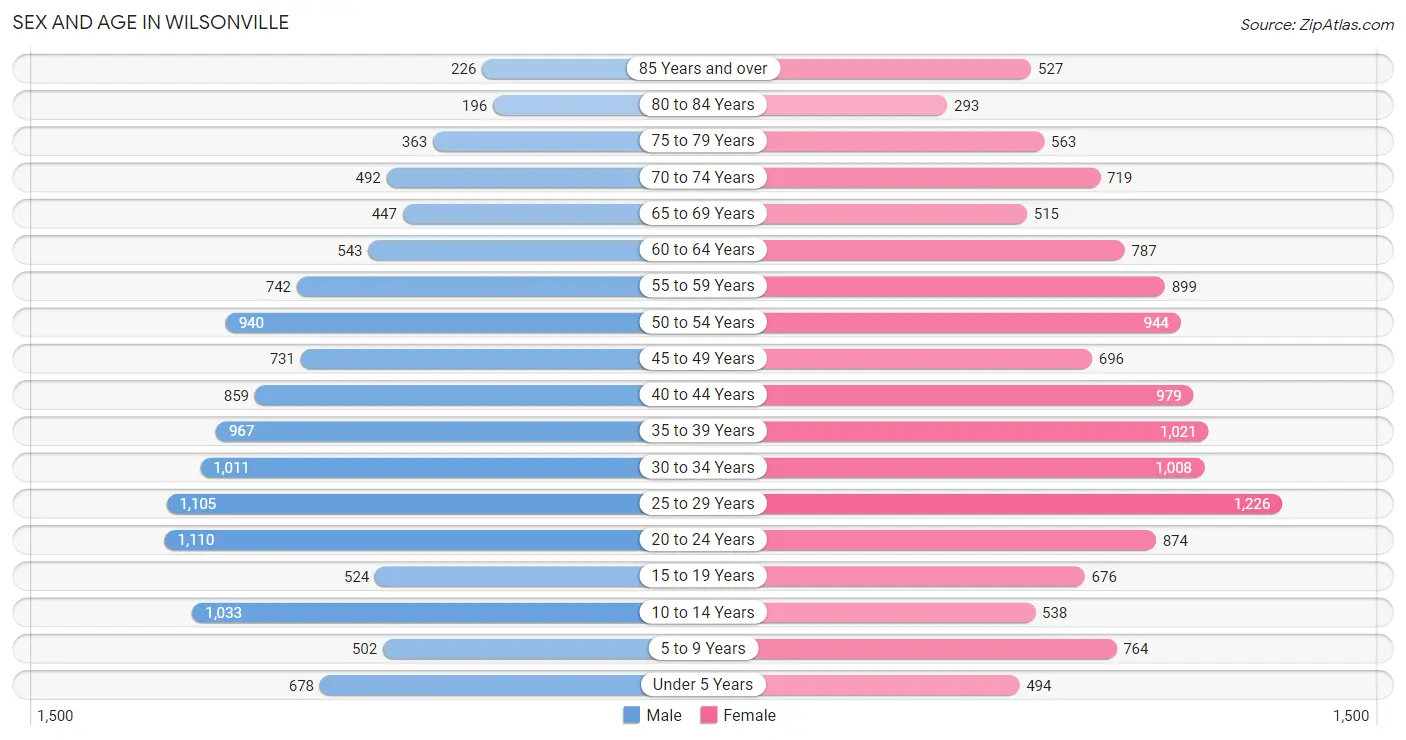
Sex and Age in Wilsonville
Sex and Age in Wilsonville
The most populous age groups in Wilsonville are 20 to 24 Years (1,110 | 8.9%) for men and 25 to 29 Years (1,226 | 9.1%) for women.
| Age Bracket | Male | Female |
| Under 5 Years | 678 (5.4%) | 494 (3.6%) |
| 5 to 9 Years | 502 (4.0%) | 764 (5.7%) |
| 10 to 14 Years | 1,033 (8.3%) | 538 (4.0%) |
| 15 to 19 Years | 524 (4.2%) | 676 (5.0%) |
| 20 to 24 Years | 1,110 (8.9%) | 874 (6.5%) |
| 25 to 29 Years | 1,105 (8.9%) | 1,226 (9.1%) |
| 30 to 34 Years | 1,011 (8.1%) | 1,008 (7.4%) |
| 35 to 39 Years | 967 (7.8%) | 1,021 (7.5%) |
| 40 to 44 Years | 859 (6.9%) | 979 (7.2%) |
| 45 to 49 Years | 731 (5.9%) | 696 (5.1%) |
| 50 to 54 Years | 940 (7.5%) | 944 (7.0%) |
| 55 to 59 Years | 742 (5.9%) | 899 (6.7%) |
| 60 to 64 Years | 543 (4.3%) | 787 (5.8%) |
| 65 to 69 Years | 447 (3.6%) | 515 (3.8%) |
| 70 to 74 Years | 492 (4.0%) | 719 (5.3%) |
| 75 to 79 Years | 363 (2.9%) | 563 (4.2%) |
| 80 to 84 Years | 196 (1.6%) | 293 (2.2%) |
| 85 Years and over | 226 (1.8%) | 527 (3.9%) |
| Total | 12,469 (100.0%) | 13,523 (100.0%) |
Families and Households in Wilsonville
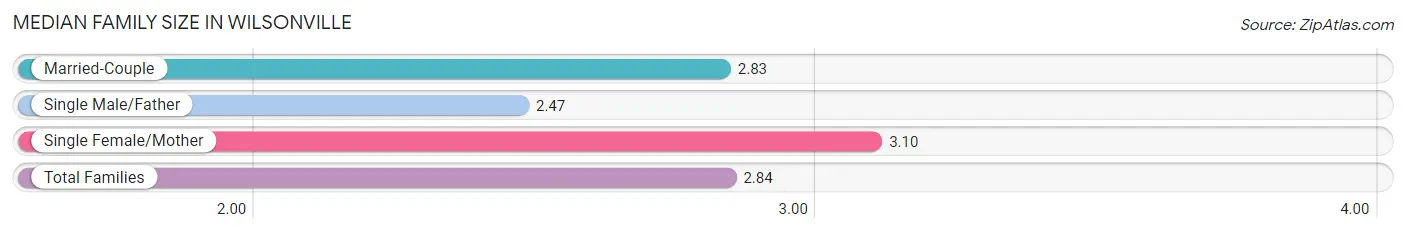
Median Family Size in Wilsonville
The median family size in Wilsonville is 2.84 persons per family, with single female/mother families (974 | 14.4%) accounting for the largest median family size of 3.1 persons per family. On the other hand, single male/father families (635 | 9.4%) represent the smallest median family size with 2.47 persons per family.
| Family Type | # Families | Family Size |
| Married-Couple | 5,156 (76.2%) | 2.83 |
| Single Male/Father | 635 (9.4%) | 2.47 |
| Single Female/Mother | 974 (14.4%) | 3.10 |
| Total Families | 6,765 (100.0%) | 2.84 |
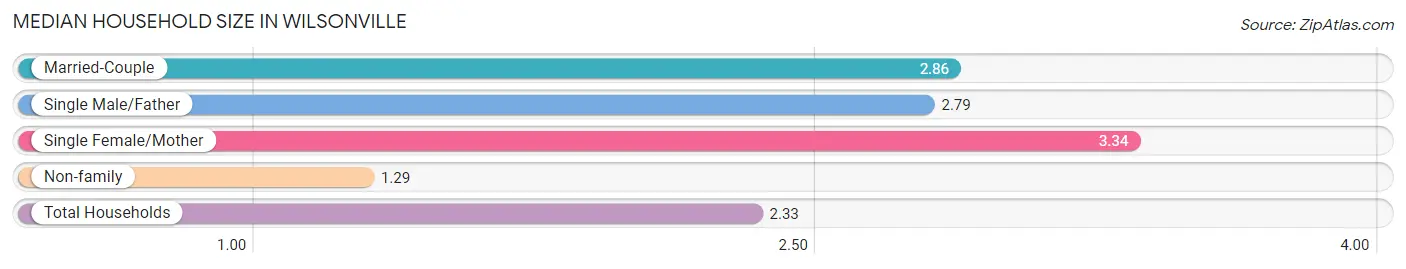
Median Household Size in Wilsonville
The median household size in Wilsonville is 2.33 persons per household, with single female/mother households (974 | 9.2%) accounting for the largest median household size of 3.34 persons per household. non-family households (3,849 | 36.3%) represent the smallest median household size with 1.29 persons per household.
| Household Type | # Households | Household Size |
| Married-Couple | 5,156 (48.6%) | 2.86 |
| Single Male/Father | 635 (6.0%) | 2.79 |
| Single Female/Mother | 974 (9.2%) | 3.34 |
| Non-family | 3,849 (36.3%) | 1.29 |
| Total Households | 10,614 (100.0%) | 2.33 |
Household Size by Marriage Status in Wilsonville
Out of a total of 10,614 households in Wilsonville, 6,765 (63.7%) are family households, while 3,849 (36.3%) are nonfamily households. The most numerous type of family households are 2-person households, comprising 3,312, and the most common type of nonfamily households are 1-person households, comprising 2,972.
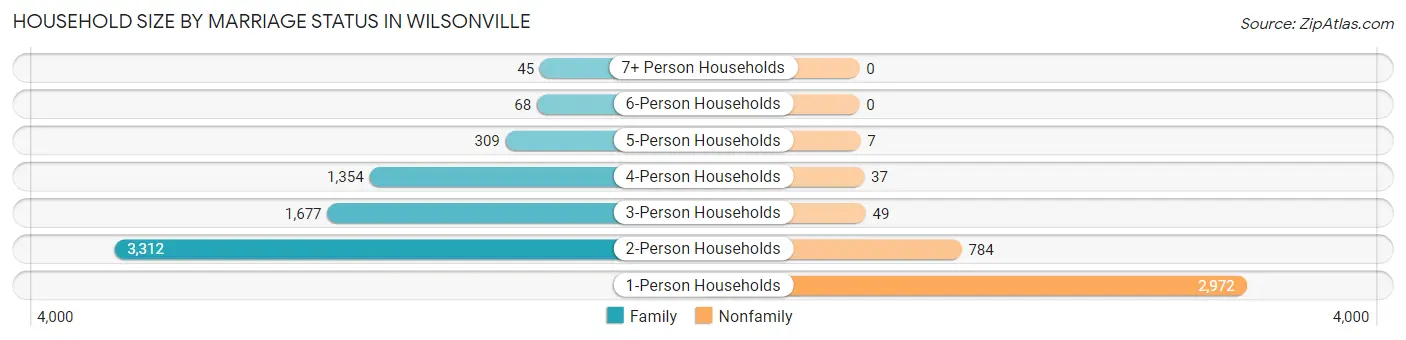
| Household Size | Family Households | Nonfamily Households |
| 1-Person Households | - | 2,972 (28.0%) |
| 2-Person Households | 3,312 (31.2%) | 784 (7.4%) |
| 3-Person Households | 1,677 (15.8%) | 49 (0.5%) |
| 4-Person Households | 1,354 (12.8%) | 37 (0.4%) |
| 5-Person Households | 309 (2.9%) | 7 (0.1%) |
| 6-Person Households | 68 (0.6%) | 0 (0.0%) |
| 7+ Person Households | 45 (0.4%) | 0 (0.0%) |
| Total | 6,765 (63.7%) | 3,849 (36.3%) |
Female Fertility in Wilsonville
Fertility by Age in Wilsonville
Average fertility rate in Wilsonville is 40.0 births per 1,000 women. Women in the age bracket of 20 to 34 years have the highest fertility rate with 70.0 births per 1,000 women. Women in the age bracket of 20 to 34 years acount for 81.0% of all women with births.
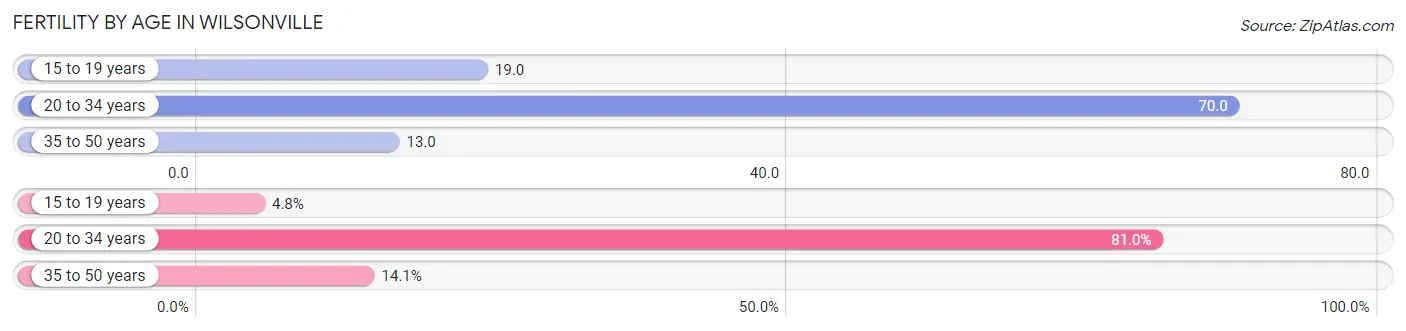
| Age Bracket | Women with Births | Births / 1,000 Women |
| 15 to 19 years | 13 (4.8%) | 19.0 |
| 20 to 34 years | 218 (81.0%) | 70.0 |
| 35 to 50 years | 38 (14.1%) | 13.0 |
| Total | 269 (100.0%) | 40.0 |
Fertility by Age by Marriage Status in Wilsonville
58.7% of women with births (269) in Wilsonville are married. The highest percentage of unmarried women with births falls into 15 to 19 years age bracket with 100.0% of them unmarried at the time of birth, while the lowest percentage of unmarried women with births belong to 35 to 50 years age bracket with 15.8% of them unmarried.
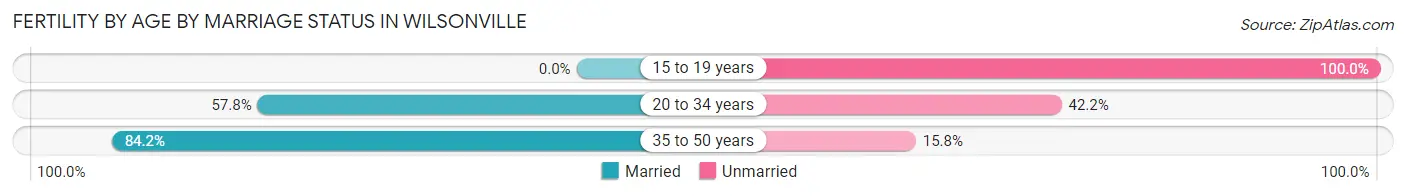
| Age Bracket | Married | Unmarried |
| 15 to 19 years | 0 (0.0%) | 13 (100.0%) |
| 20 to 34 years | 126 (57.8%) | 92 (42.2%) |
| 35 to 50 years | 32 (84.2%) | 6 (15.8%) |
| Total | 158 (58.7%) | 111 (41.3%) |
Fertility by Education in Wilsonville
Average fertility rate in Wilsonville is 40.0 births per 1,000 women. Women with the education attainment of bachelor's degree have the highest fertility rate of 63.0 births per 1,000 women, while women with the education attainment of less than high school have the lowest fertility at 23.0 births per 1,000 women. Women with the education attainment of bachelor's degree represent 34.9% of all women with births.
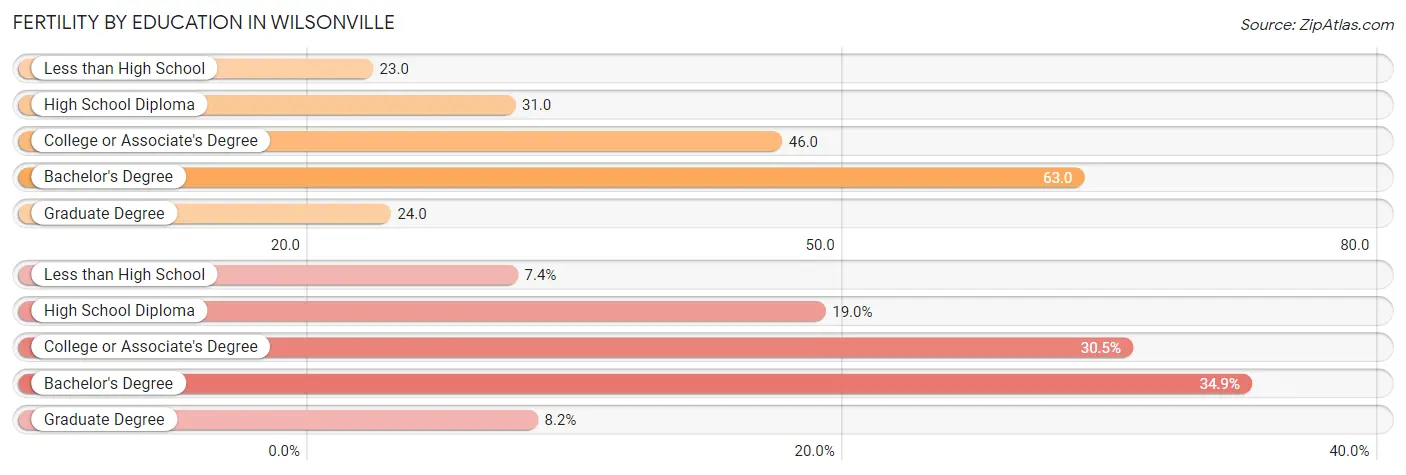
| Educational Attainment | Women with Births | Births / 1,000 Women |
| Less than High School | 20 (7.4%) | 23.0 |
| High School Diploma | 51 (19.0%) | 31.0 |
| College or Associate's Degree | 82 (30.5%) | 46.0 |
| Bachelor's Degree | 94 (34.9%) | 63.0 |
| Graduate Degree | 22 (8.2%) | 24.0 |
| Total | 269 (100.0%) | 40.0 |
Fertility by Education by Marriage Status in Wilsonville
41.3% of women with births in Wilsonville are unmarried. Women with the educational attainment of graduate degree are most likely to be married with 100.0% of them married at childbirth, while women with the educational attainment of high school diploma are least likely to be married with 80.4% of them unmarried at childbirth.
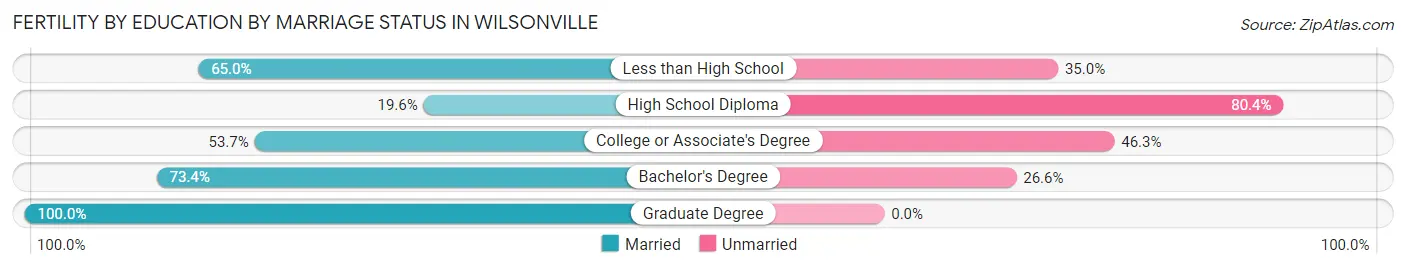
| Educational Attainment | Married | Unmarried |
| Less than High School | 13 (65.0%) | 7 (35.0%) |
| High School Diploma | 10 (19.6%) | 41 (80.4%) |
| College or Associate's Degree | 44 (53.7%) | 38 (46.3%) |
| Bachelor's Degree | 69 (73.4%) | 25 (26.6%) |
| Graduate Degree | 22 (100.0%) | 0 (0.0%) |
| Total | 158 (58.7%) | 111 (41.3%) |
Employment Characteristics in Wilsonville
Employment by Class of Employer in Wilsonville
Among the 12,723 employed individuals in Wilsonville, private company employees (9,505 | 74.7%), not-for-profit organizations (926 | 7.3%), and self-employed (not incorporated) (598 | 4.7%) make up the most common classes of employment.
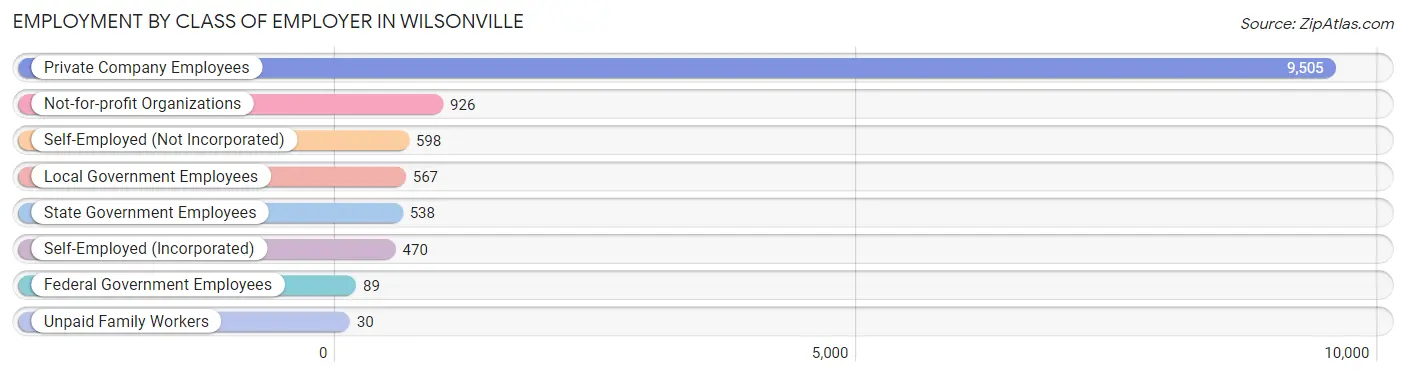
| Employer Class | # Employees | % Employees |
| Private Company Employees | 9,505 | 74.7% |
| Self-Employed (Incorporated) | 470 | 3.7% |
| Self-Employed (Not Incorporated) | 598 | 4.7% |
| Not-for-profit Organizations | 926 | 7.3% |
| Local Government Employees | 567 | 4.5% |
| State Government Employees | 538 | 4.2% |
| Federal Government Employees | 89 | 0.7% |
| Unpaid Family Workers | 30 | 0.2% |
| Total | 12,723 | 100.0% |
Employment Status by Age in Wilsonville
According to the labor force statistics for Wilsonville, out of the total population over 16 years of age (21,737), 63.0% or 13,694 individuals are in the labor force, with 5.8% or 794 of them unemployed. The age group with the highest labor force participation rate is 45 to 54 years, with 82.9% or 2,745 individuals in the labor force. Within the labor force, the 20 to 24 years age range has the highest percentage of unemployed individuals, with 19.0% or 312 of them being unemployed.
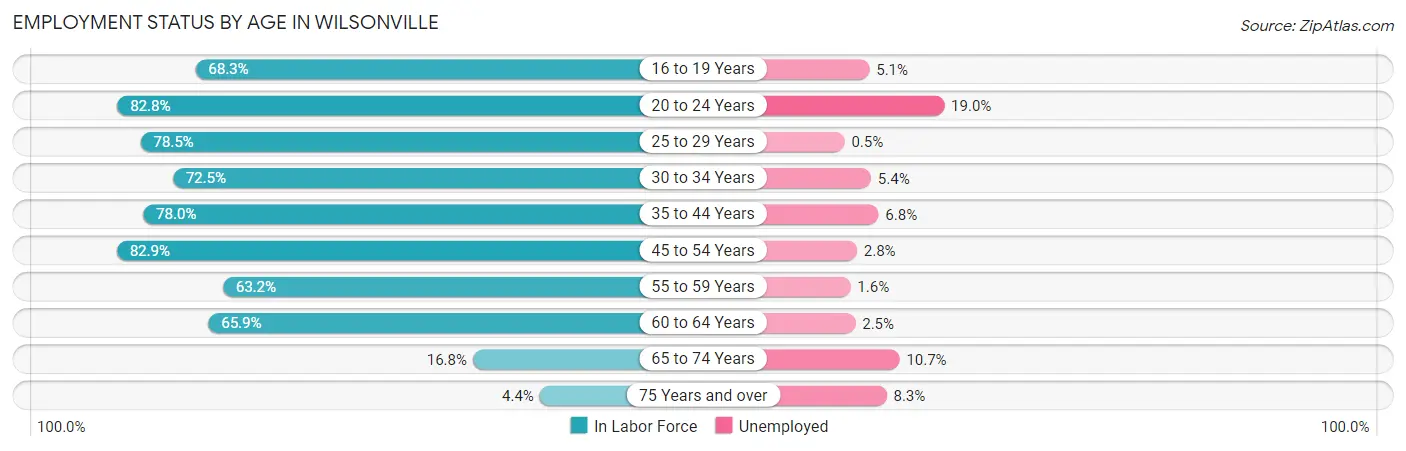
| Age Bracket | In Labor Force | Unemployed |
| 16 to 19 Years | 652 (68.3%) | 33 (5.1%) |
| 20 to 24 Years | 1,643 (82.8%) | 312 (19.0%) |
| 25 to 29 Years | 1,830 (78.5%) | 9 (0.5%) |
| 30 to 34 Years | 1,464 (72.5%) | 79 (5.4%) |
| 35 to 44 Years | 2,984 (78.0%) | 203 (6.8%) |
| 45 to 54 Years | 2,745 (82.9%) | 77 (2.8%) |
| 55 to 59 Years | 1,037 (63.2%) | 17 (1.6%) |
| 60 to 64 Years | 876 (65.9%) | 22 (2.5%) |
| 65 to 74 Years | 365 (16.8%) | 39 (10.7%) |
| 75 Years and over | 95 (4.4%) | 8 (8.3%) |
| Total | 13,694 (63.0%) | 794 (5.8%) |
Employment Status by Educational Attainment in Wilsonville
According to labor force statistics for Wilsonville, 75.6% of individuals (10,930) out of the total population between 25 and 64 years of age (14,458) are in the labor force, with 3.7% or 404 of them being unemployed. The group with the highest labor force participation rate are those with the educational attainment of bachelor's degree or higher, with 87.0% or 5,657 individuals in the labor force. Within the labor force, individuals with college / associate degree education have the highest percentage of unemployment, with 5.8% or 171 of them being unemployed.
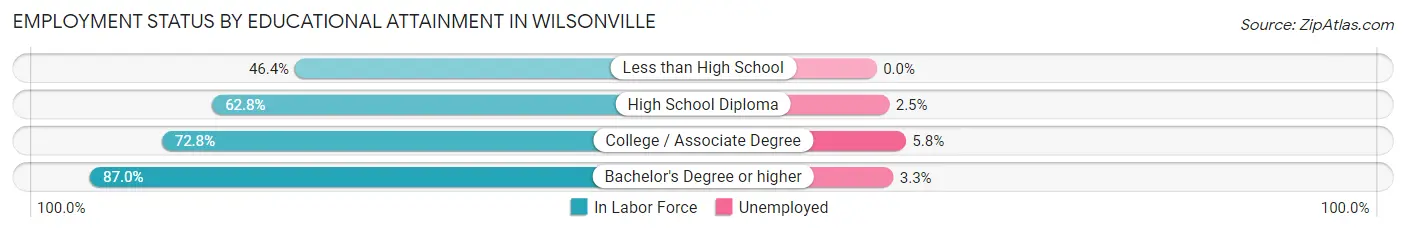
| Educational Attainment | In Labor Force | Unemployed |
| Less than High School | 352 (46.4%) | 0 (0.0%) |
| High School Diploma | 1,983 (62.8%) | 79 (2.5%) |
| College / Associate Degree | 2,941 (72.8%) | 234 (5.8%) |
| Bachelor's Degree or higher | 5,657 (87.0%) | 215 (3.3%) |
| Total | 10,930 (75.6%) | 535 (3.7%) |
Employment Occupations by Sex in Wilsonville
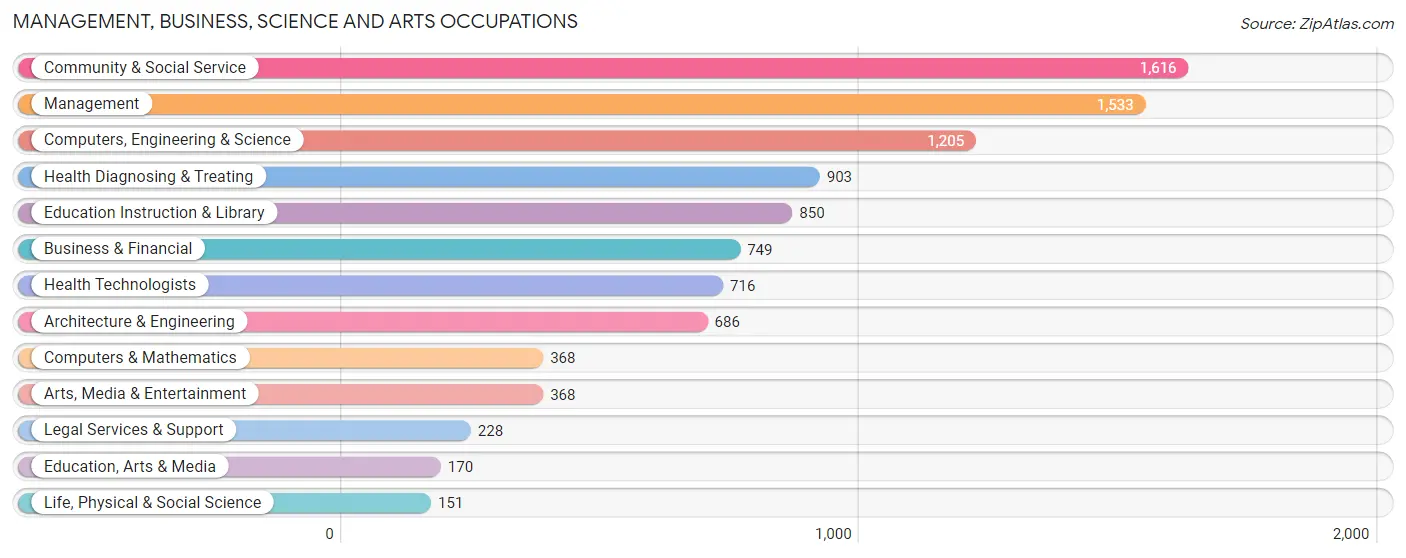
Management, Business, Science and Arts Occupations
The most common Management, Business, Science and Arts occupations in Wilsonville are Community & Social Service (1,616 | 12.6%), Management (1,533 | 11.9%), Computers, Engineering & Science (1,205 | 9.3%), Health Diagnosing & Treating (903 | 7.0%), and Education Instruction & Library (850 | 6.6%).
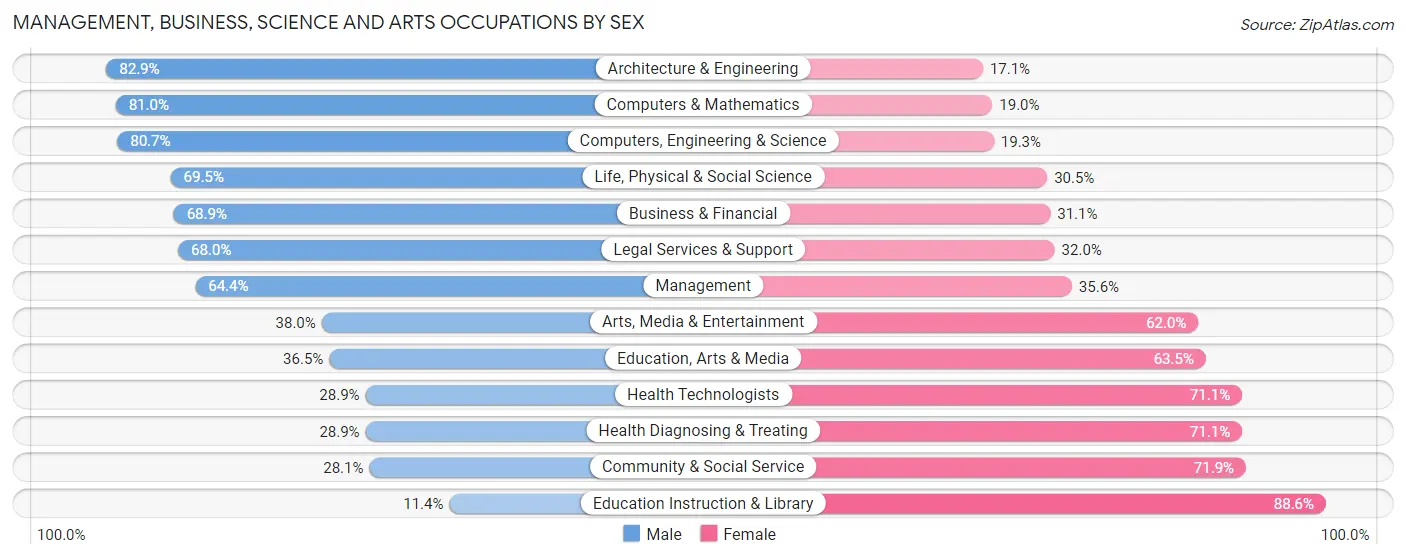
Management, Business, Science and Arts Occupations by Sex
Within the Management, Business, Science and Arts occupations in Wilsonville, the most male-oriented occupations are Architecture & Engineering (82.9%), Computers & Mathematics (81.0%), and Computers, Engineering & Science (80.7%), while the most female-oriented occupations are Education Instruction & Library (88.6%), Community & Social Service (71.9%), and Health Diagnosing & Treating (71.1%).
| Occupation | Male | Female |
| Management | 987 (64.4%) | 546 (35.6%) |
| Business & Financial | 516 (68.9%) | 233 (31.1%) |
| Computers, Engineering & Science | 972 (80.7%) | 233 (19.3%) |
| Computers & Mathematics | 298 (81.0%) | 70 (19.0%) |
| Architecture & Engineering | 569 (82.9%) | 117 (17.1%) |
| Life, Physical & Social Science | 105 (69.5%) | 46 (30.5%) |
| Community & Social Service | 454 (28.1%) | 1,162 (71.9%) |
| Education, Arts & Media | 62 (36.5%) | 108 (63.5%) |
| Legal Services & Support | 155 (68.0%) | 73 (32.0%) |
| Education Instruction & Library | 97 (11.4%) | 753 (88.6%) |
| Arts, Media & Entertainment | 140 (38.0%) | 228 (62.0%) |
| Health Diagnosing & Treating | 261 (28.9%) | 642 (71.1%) |
| Health Technologists | 207 (28.9%) | 509 (71.1%) |
| Total (Category) | 3,190 (53.1%) | 2,816 (46.9%) |
| Total (Overall) | 6,984 (54.2%) | 5,897 (45.8%) |
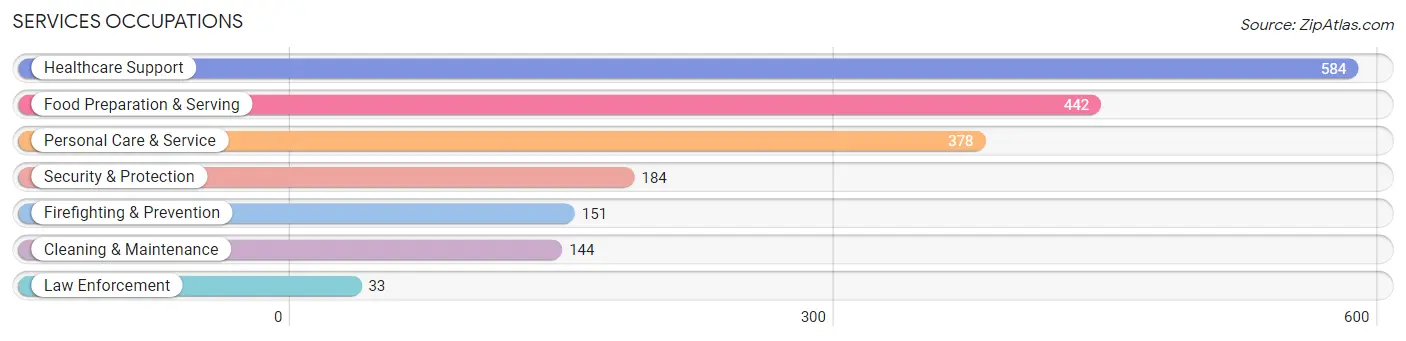
Services Occupations
The most common Services occupations in Wilsonville are Healthcare Support (584 | 4.5%), Food Preparation & Serving (442 | 3.4%), Personal Care & Service (378 | 2.9%), Security & Protection (184 | 1.4%), and Firefighting & Prevention (151 | 1.2%).
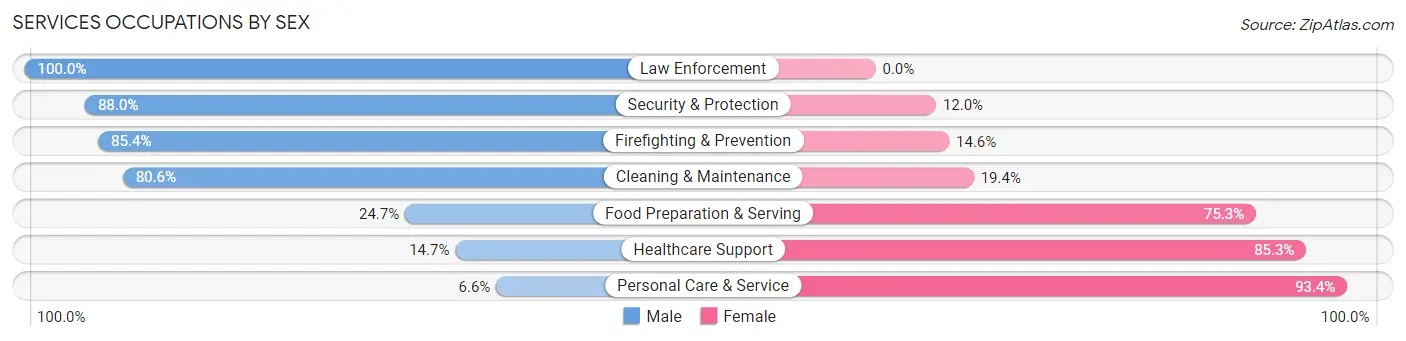
Services Occupations by Sex
Within the Services occupations in Wilsonville, the most male-oriented occupations are Law Enforcement (100.0%), Security & Protection (88.0%), and Firefighting & Prevention (85.4%), while the most female-oriented occupations are Personal Care & Service (93.4%), Healthcare Support (85.3%), and Food Preparation & Serving (75.3%).
| Occupation | Male | Female |
| Healthcare Support | 86 (14.7%) | 498 (85.3%) |
| Security & Protection | 162 (88.0%) | 22 (12.0%) |
| Firefighting & Prevention | 129 (85.4%) | 22 (14.6%) |
| Law Enforcement | 33 (100.0%) | 0 (0.0%) |
| Food Preparation & Serving | 109 (24.7%) | 333 (75.3%) |
| Cleaning & Maintenance | 116 (80.6%) | 28 (19.4%) |
| Personal Care & Service | 25 (6.6%) | 353 (93.4%) |
| Total (Category) | 498 (28.7%) | 1,234 (71.3%) |
| Total (Overall) | 6,984 (54.2%) | 5,897 (45.8%) |
Sales and Office Occupations
The most common Sales and Office occupations in Wilsonville are Sales & Related (1,465 | 11.4%), and Office & Administration (1,389 | 10.8%).
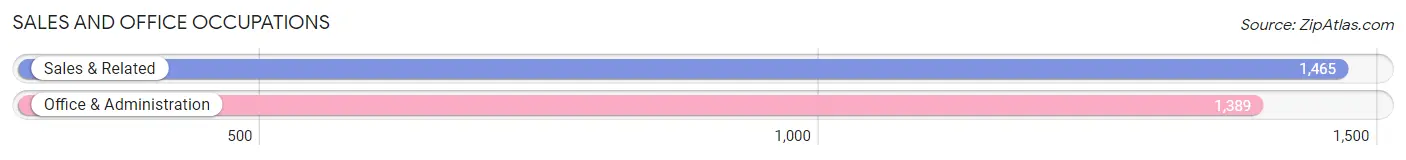
Sales and Office Occupations by Sex

| Occupation | Male | Female |
| Sales & Related | 1,078 (73.6%) | 387 (26.4%) |
| Office & Administration | 374 (26.9%) | 1,015 (73.1%) |
| Total (Category) | 1,452 (50.9%) | 1,402 (49.1%) |
| Total (Overall) | 6,984 (54.2%) | 5,897 (45.8%) |
Natural Resources, Construction and Maintenance Occupations
The most common Natural Resources, Construction and Maintenance occupations in Wilsonville are Construction & Extraction (443 | 3.4%), Installation, Maintenance & Repair (413 | 3.2%), and Farming, Fishing & Forestry (22 | 0.2%).
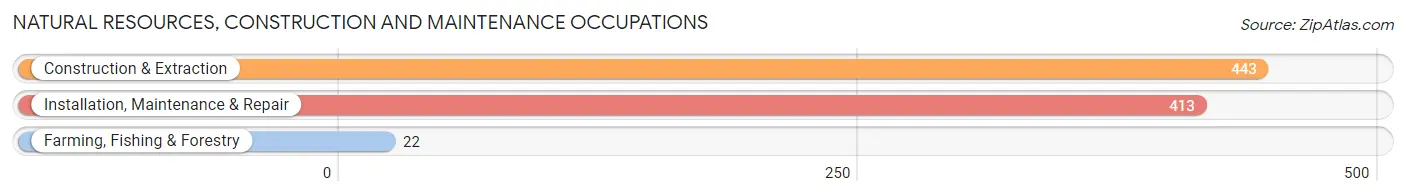
Natural Resources, Construction and Maintenance Occupations by Sex

| Occupation | Male | Female |
| Farming, Fishing & Forestry | 22 (100.0%) | 0 (0.0%) |
| Construction & Extraction | 421 (95.0%) | 22 (5.0%) |
| Installation, Maintenance & Repair | 413 (100.0%) | 0 (0.0%) |
| Total (Category) | 856 (97.5%) | 22 (2.5%) |
| Total (Overall) | 6,984 (54.2%) | 5,897 (45.8%) |
Production, Transportation and Moving Occupations
The most common Production, Transportation and Moving occupations in Wilsonville are Material Moving (553 | 4.3%), Production (517 | 4.0%), and Transportation (341 | 2.6%).
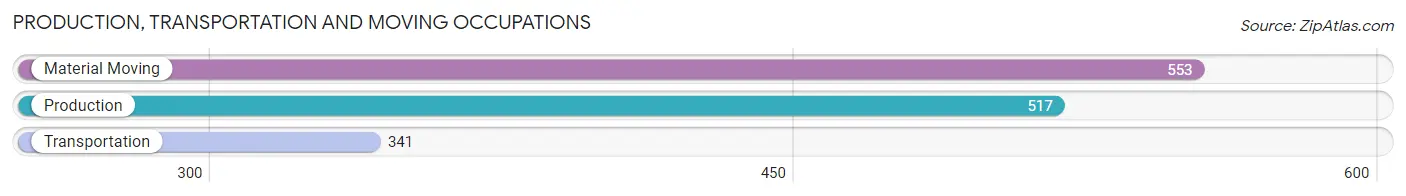
Production, Transportation and Moving Occupations by Sex
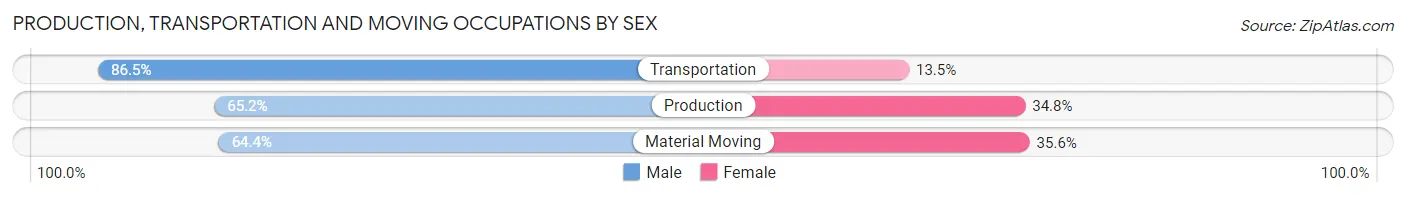
| Occupation | Male | Female |
| Production | 337 (65.2%) | 180 (34.8%) |
| Transportation | 295 (86.5%) | 46 (13.5%) |
| Material Moving | 356 (64.4%) | 197 (35.6%) |
| Total (Category) | 988 (70.0%) | 423 (30.0%) |
| Total (Overall) | 6,984 (54.2%) | 5,897 (45.8%) |
Employment Industries by Sex in Wilsonville
Employment Industries in Wilsonville
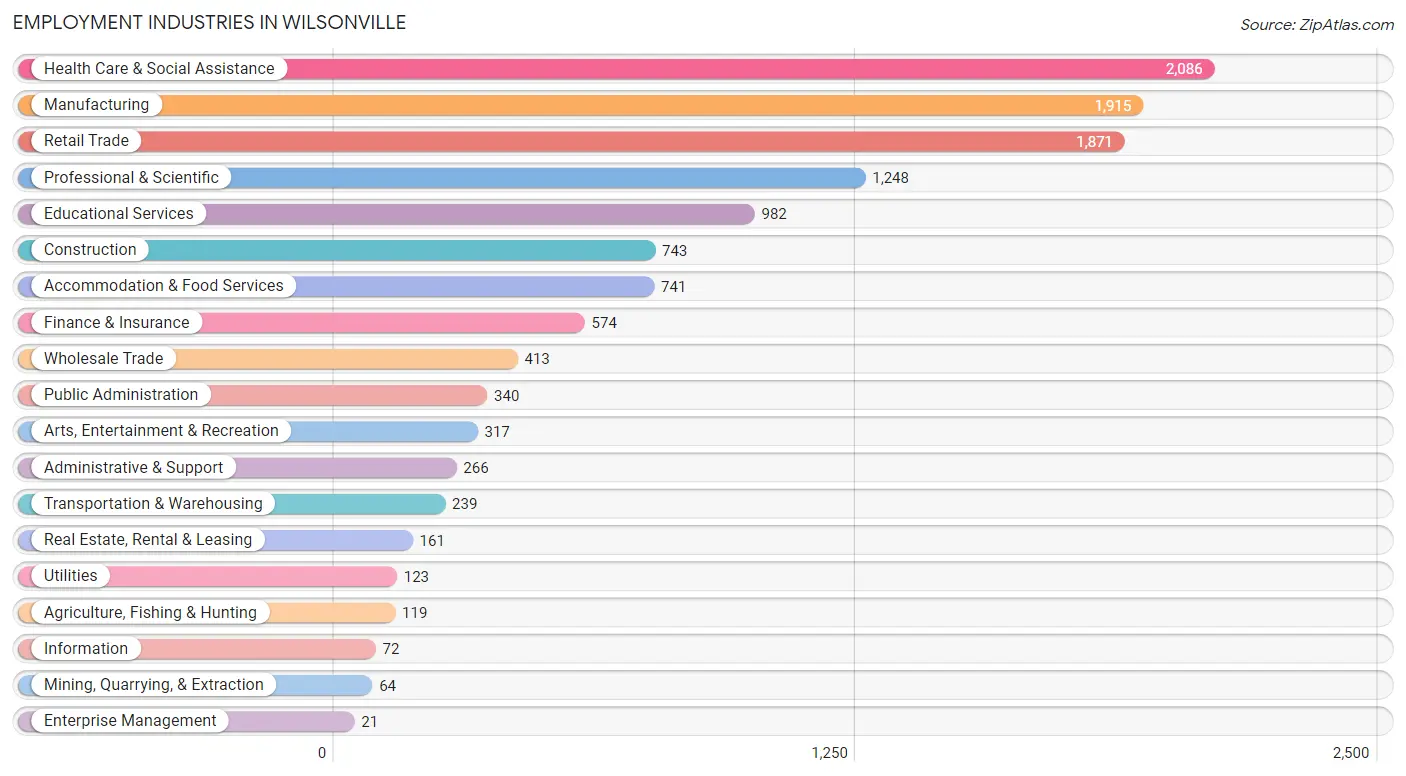
The major employment industries in Wilsonville include Health Care & Social Assistance (2,086 | 16.2%), Manufacturing (1,915 | 14.9%), Retail Trade (1,871 | 14.5%), Professional & Scientific (1,248 | 9.7%), and Educational Services (982 | 7.6%).
Employment Industries by Sex in Wilsonville
The Wilsonville industries that see more men than women are Agriculture, Fishing & Hunting (100.0%), Mining, Quarrying, & Extraction (100.0%), and Utilities (100.0%), whereas the industries that tend to have a higher number of women are Educational Services (83.3%), Health Care & Social Assistance (76.8%), and Information (69.4%).
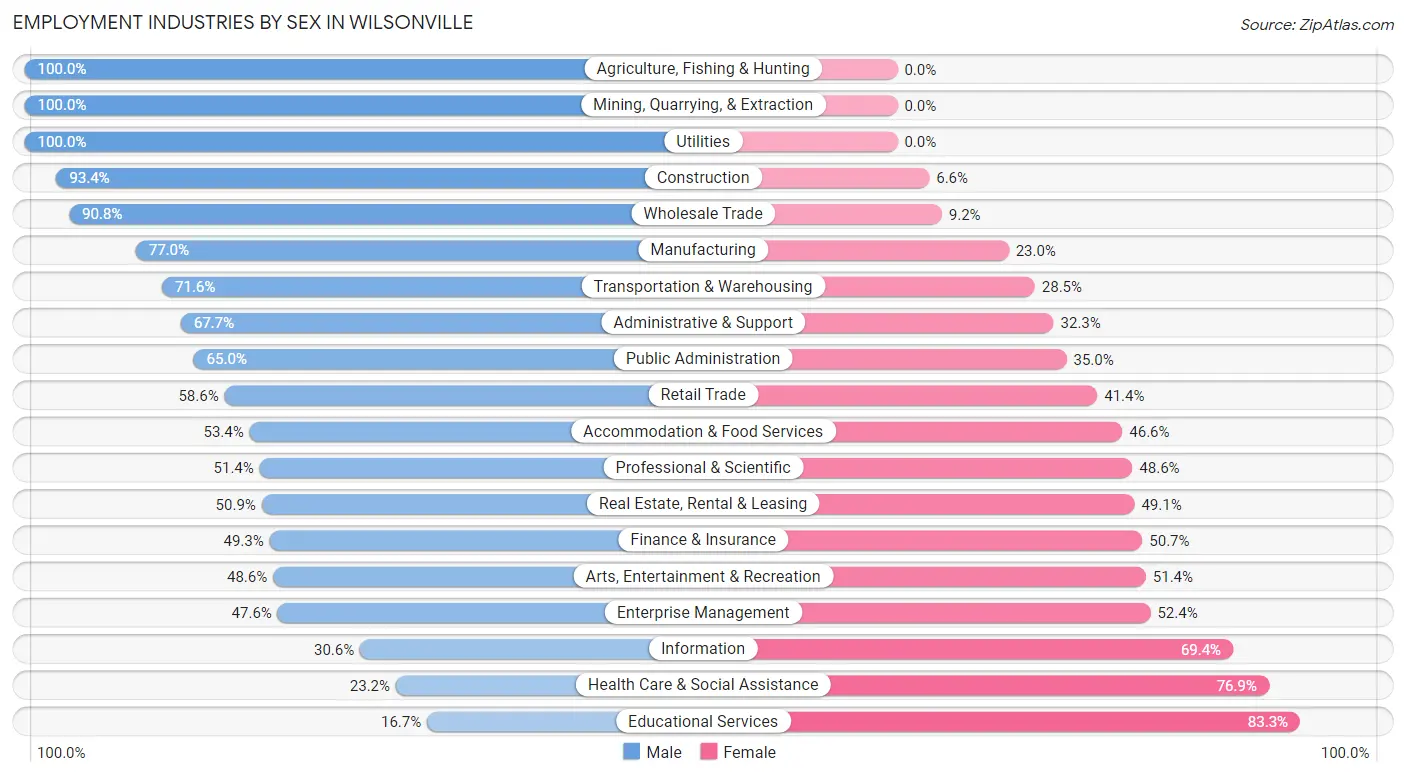
| Industry | Male | Female |
| Agriculture, Fishing & Hunting | 119 (100.0%) | 0 (0.0%) |
| Mining, Quarrying, & Extraction | 64 (100.0%) | 0 (0.0%) |
| Construction | 694 (93.4%) | 49 (6.6%) |
| Manufacturing | 1,474 (77.0%) | 441 (23.0%) |
| Wholesale Trade | 375 (90.8%) | 38 (9.2%) |
| Retail Trade | 1,097 (58.6%) | 774 (41.4%) |
| Transportation & Warehousing | 171 (71.6%) | 68 (28.4%) |
| Utilities | 123 (100.0%) | 0 (0.0%) |
| Information | 22 (30.6%) | 50 (69.4%) |
| Finance & Insurance | 283 (49.3%) | 291 (50.7%) |
| Real Estate, Rental & Leasing | 82 (50.9%) | 79 (49.1%) |
| Professional & Scientific | 641 (51.4%) | 607 (48.6%) |
| Enterprise Management | 10 (47.6%) | 11 (52.4%) |
| Administrative & Support | 180 (67.7%) | 86 (32.3%) |
| Educational Services | 164 (16.7%) | 818 (83.3%) |
| Health Care & Social Assistance | 483 (23.2%) | 1,603 (76.8%) |
| Arts, Entertainment & Recreation | 154 (48.6%) | 163 (51.4%) |
| Accommodation & Food Services | 396 (53.4%) | 345 (46.6%) |
| Public Administration | 221 (65.0%) | 119 (35.0%) |
| Total | 6,984 (54.2%) | 5,897 (45.8%) |
Education in Wilsonville
School Enrollment in Wilsonville
The most common levels of schooling among the 5,332 students in Wilsonville are high school (1,200 | 22.5%), elementary school (1,073 | 20.1%), and middle school (1,068 | 20.0%).
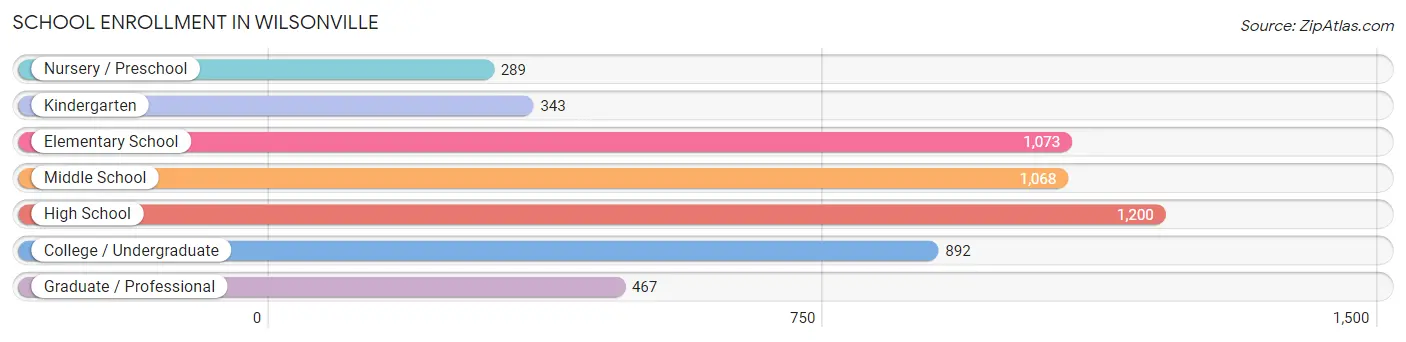
| School Level | # Students | % Students |
| Nursery / Preschool | 289 | 5.4% |
| Kindergarten | 343 | 6.4% |
| Elementary School | 1,073 | 20.1% |
| Middle School | 1,068 | 20.0% |
| High School | 1,200 | 22.5% |
| College / Undergraduate | 892 | 16.7% |
| Graduate / Professional | 467 | 8.8% |
| Total | 5,332 | 100.0% |
School Enrollment by Age by Funding Source in Wilsonville
Out of a total of 5,332 students who are enrolled in schools in Wilsonville, 1,050 (19.7%) attend a private institution, while the remaining 4,282 (80.3%) are enrolled in public schools. The age group of 3 to 4 year olds has the highest likelihood of being enrolled in private schools, with 115 (57.8% in the age bracket) enrolled. Conversely, the age group of 18 to 19 year olds has the lowest likelihood of being enrolled in a private school, with 320 (100.0% in the age bracket) attending a public institution.
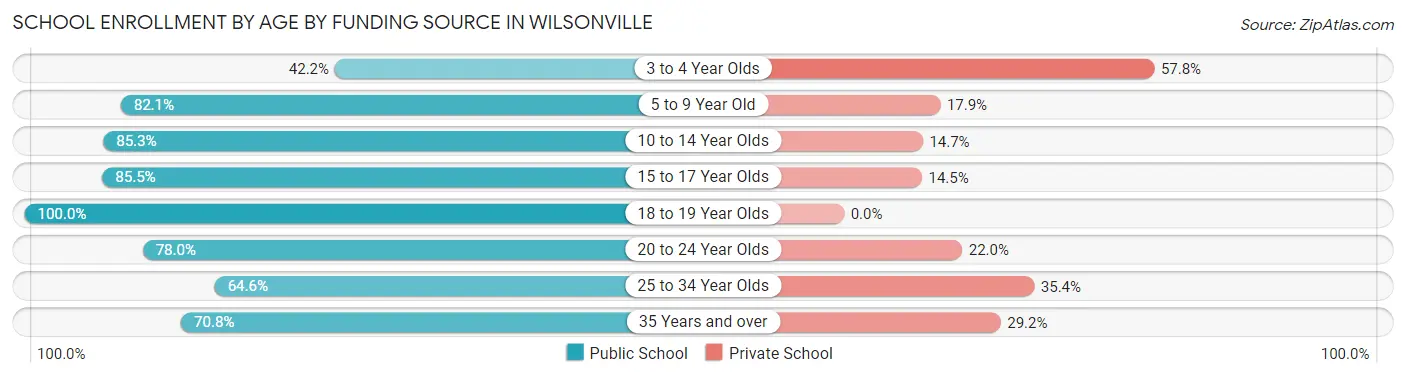
| Age Bracket | Public School | Private School |
| 3 to 4 Year Olds | 84 (42.2%) | 115 (57.8%) |
| 5 to 9 Year Old | 952 (82.1%) | 208 (17.9%) |
| 10 to 14 Year Olds | 1,326 (85.3%) | 228 (14.7%) |
| 15 to 17 Year Olds | 637 (85.5%) | 108 (14.5%) |
| 18 to 19 Year Olds | 320 (100.0%) | 0 (0.0%) |
| 20 to 24 Year Olds | 358 (78.0%) | 101 (22.0%) |
| 25 to 34 Year Olds | 330 (64.6%) | 181 (35.4%) |
| 35 Years and over | 272 (70.8%) | 112 (29.2%) |
| Total | 4,282 (80.3%) | 1,050 (19.7%) |
Educational Attainment by Field of Study in Wilsonville
Business (2,192 | 23.1%), social sciences (966 | 10.2%), science & technology (955 | 10.1%), engineering (863 | 9.1%), and education (800 | 8.4%) are the most common fields of study among 9,490 individuals in Wilsonville who have obtained a bachelor's degree or higher.
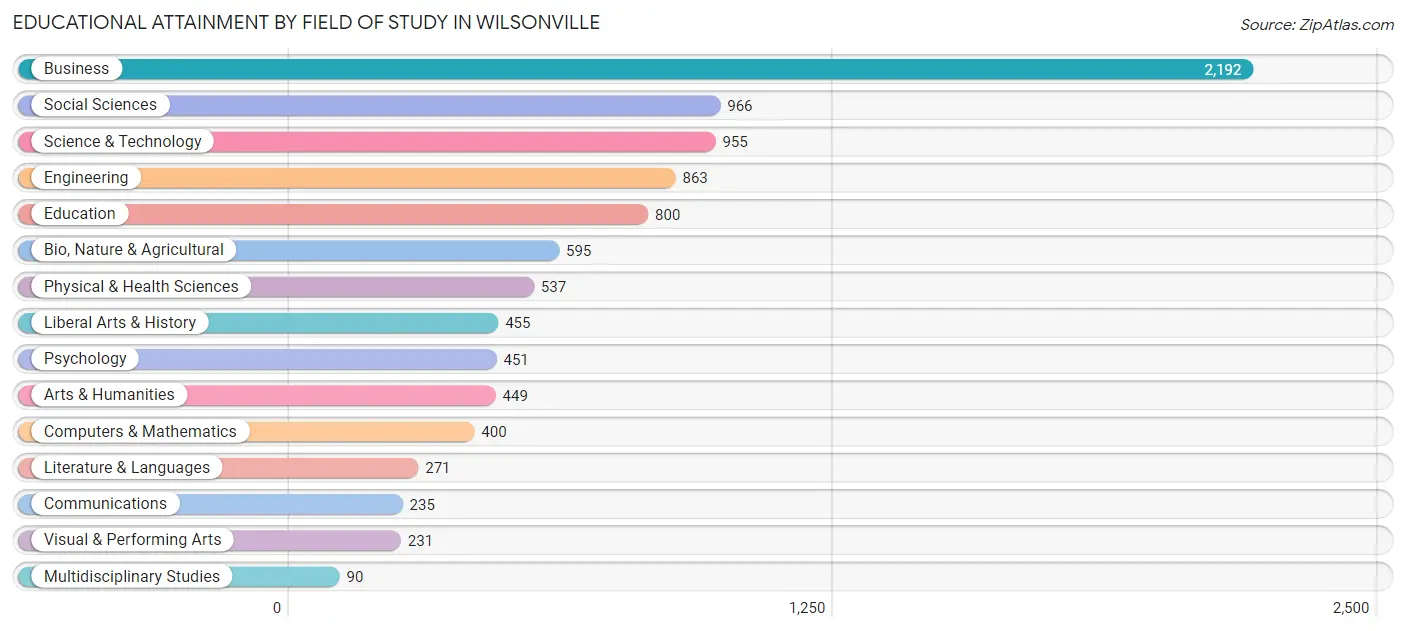
| Field of Study | # Graduates | % Graduates |
| Computers & Mathematics | 400 | 4.2% |
| Bio, Nature & Agricultural | 595 | 6.3% |
| Physical & Health Sciences | 537 | 5.7% |
| Psychology | 451 | 4.8% |
| Social Sciences | 966 | 10.2% |
| Engineering | 863 | 9.1% |
| Multidisciplinary Studies | 90 | 0.9% |
| Science & Technology | 955 | 10.1% |
| Business | 2,192 | 23.1% |
| Education | 800 | 8.4% |
| Literature & Languages | 271 | 2.9% |
| Liberal Arts & History | 455 | 4.8% |
| Visual & Performing Arts | 231 | 2.4% |
| Communications | 235 | 2.5% |
| Arts & Humanities | 449 | 4.7% |
| Total | 9,490 | 100.0% |
Transportation & Commute in Wilsonville
Vehicle Availability by Sex in Wilsonville
The most prevalent vehicle ownership categories in Wilsonville are males with 2 vehicles (3,422, accounting for 49.1%) and females with 2 vehicles (2,465, making up 59.5%).
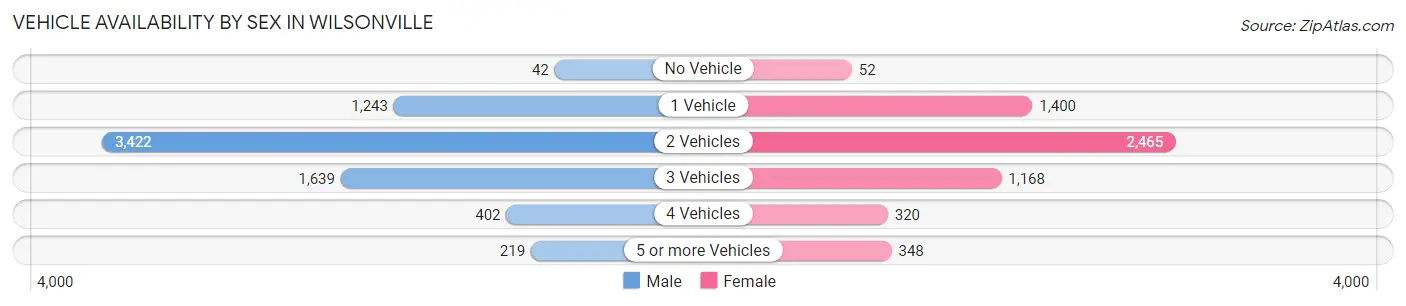
| Vehicles Available | Male | Female |
| No Vehicle | 42 (0.6%) | 52 (0.9%) |
| 1 Vehicle | 1,243 (17.8%) | 1,400 (24.3%) |
| 2 Vehicles | 3,422 (49.1%) | 2,465 (42.8%) |
| 3 Vehicles | 1,639 (23.5%) | 1,168 (20.3%) |
| 4 Vehicles | 402 (5.8%) | 320 (5.6%) |
| 5 or more Vehicles | 219 (3.1%) | 348 (6.0%) |
| Total | 6,967 (100.0%) | 5,753 (100.0%) |
Commute Time in Wilsonville
The most frequently occuring commute durations in Wilsonville are 20 to 24 minutes (1,767 commuters, 15.7%), 30 to 34 minutes (1,576 commuters, 14.0%), and 5 to 9 minutes (1,436 commuters, 12.8%).
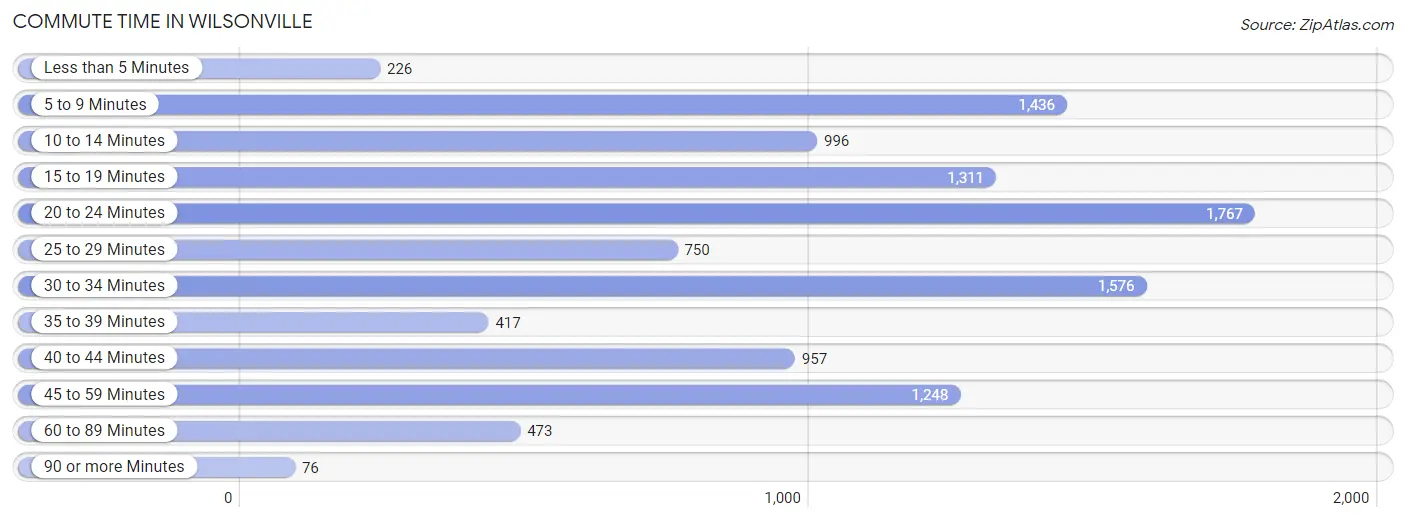
| Commute Time | # Commuters | % Commuters |
| Less than 5 Minutes | 226 | 2.0% |
| 5 to 9 Minutes | 1,436 | 12.8% |
| 10 to 14 Minutes | 996 | 8.9% |
| 15 to 19 Minutes | 1,311 | 11.7% |
| 20 to 24 Minutes | 1,767 | 15.7% |
| 25 to 29 Minutes | 750 | 6.7% |
| 30 to 34 Minutes | 1,576 | 14.0% |
| 35 to 39 Minutes | 417 | 3.7% |
| 40 to 44 Minutes | 957 | 8.5% |
| 45 to 59 Minutes | 1,248 | 11.1% |
| 60 to 89 Minutes | 473 | 4.2% |
| 90 or more Minutes | 76 | 0.7% |
Commute Time by Sex in Wilsonville
The most common commute times in Wilsonville are 30 to 34 minutes (1,045 commuters, 17.0%) for males and 20 to 24 minutes (887 commuters, 17.5%) for females.
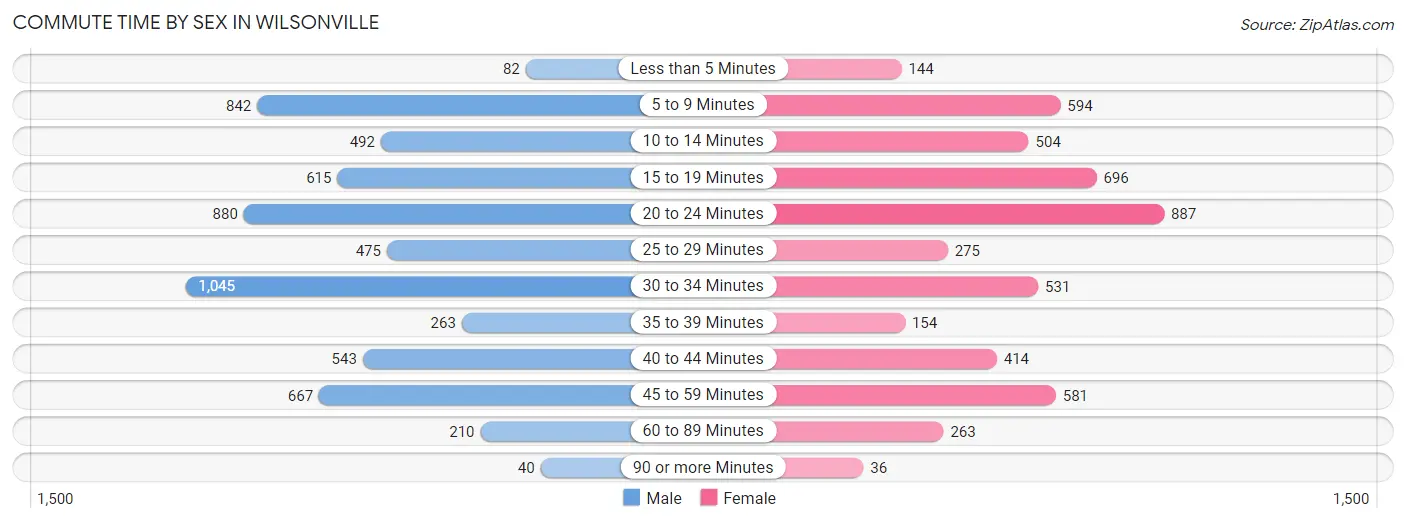
| Commute Time | Male | Female |
| Less than 5 Minutes | 82 (1.3%) | 144 (2.8%) |
| 5 to 9 Minutes | 842 (13.7%) | 594 (11.7%) |
| 10 to 14 Minutes | 492 (8.0%) | 504 (9.9%) |
| 15 to 19 Minutes | 615 (10.0%) | 696 (13.7%) |
| 20 to 24 Minutes | 880 (14.3%) | 887 (17.5%) |
| 25 to 29 Minutes | 475 (7.7%) | 275 (5.4%) |
| 30 to 34 Minutes | 1,045 (17.0%) | 531 (10.4%) |
| 35 to 39 Minutes | 263 (4.3%) | 154 (3.0%) |
| 40 to 44 Minutes | 543 (8.8%) | 414 (8.2%) |
| 45 to 59 Minutes | 667 (10.8%) | 581 (11.4%) |
| 60 to 89 Minutes | 210 (3.4%) | 263 (5.2%) |
| 90 or more Minutes | 40 (0.6%) | 36 (0.7%) |
Time of Departure to Work by Sex in Wilsonville
The most frequent times of departure to work in Wilsonville are 7:00 AM to 7:29 AM (885, 14.4%) for males and 7:00 AM to 7:29 AM (830, 16.3%) for females.
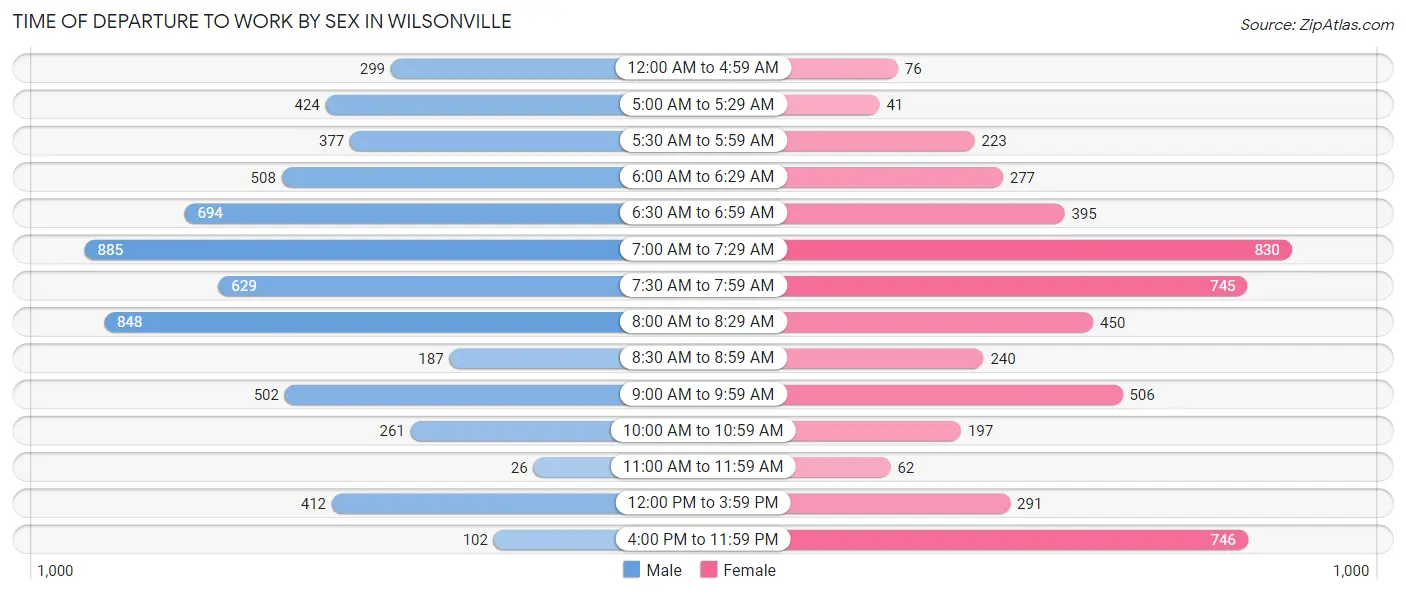
| Time of Departure | Male | Female |
| 12:00 AM to 4:59 AM | 299 (4.9%) | 76 (1.5%) |
| 5:00 AM to 5:29 AM | 424 (6.9%) | 41 (0.8%) |
| 5:30 AM to 5:59 AM | 377 (6.1%) | 223 (4.4%) |
| 6:00 AM to 6:29 AM | 508 (8.3%) | 277 (5.4%) |
| 6:30 AM to 6:59 AM | 694 (11.3%) | 395 (7.8%) |
| 7:00 AM to 7:29 AM | 885 (14.4%) | 830 (16.3%) |
| 7:30 AM to 7:59 AM | 629 (10.2%) | 745 (14.7%) |
| 8:00 AM to 8:29 AM | 848 (13.8%) | 450 (8.9%) |
| 8:30 AM to 8:59 AM | 187 (3.0%) | 240 (4.7%) |
| 9:00 AM to 9:59 AM | 502 (8.2%) | 506 (10.0%) |
| 10:00 AM to 10:59 AM | 261 (4.2%) | 197 (3.9%) |
| 11:00 AM to 11:59 AM | 26 (0.4%) | 62 (1.2%) |
| 12:00 PM to 3:59 PM | 412 (6.7%) | 291 (5.7%) |
| 4:00 PM to 11:59 PM | 102 (1.7%) | 746 (14.7%) |
| Total | 6,154 (100.0%) | 5,079 (100.0%) |
Housing Occupancy in Wilsonville
Occupancy by Ownership in Wilsonville
Of the total 10,614 dwellings in Wilsonville, owner-occupied units account for 5,374 (50.6%), while renter-occupied units make up 5,240 (49.4%).
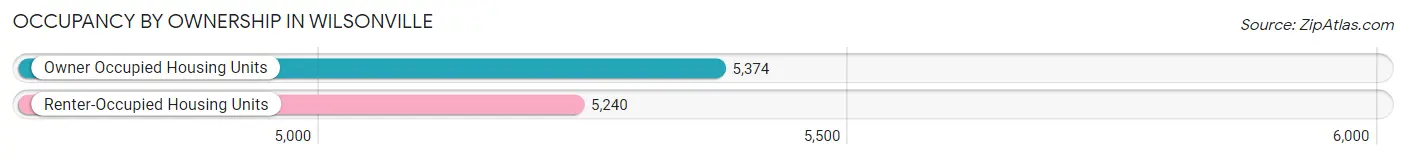
| Occupancy | # Housing Units | % Housing Units |
| Owner Occupied Housing Units | 5,374 | 50.6% |
| Renter-Occupied Housing Units | 5,240 | 49.4% |
| Total Occupied Housing Units | 10,614 | 100.0% |
Occupancy by Household Size in Wilsonville
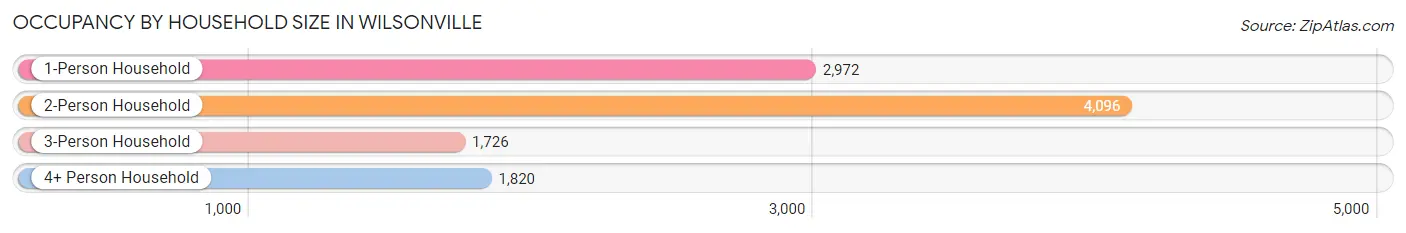
| Household Size | # Housing Units | % Housing Units |
| 1-Person Household | 2,972 | 28.0% |
| 2-Person Household | 4,096 | 38.6% |
| 3-Person Household | 1,726 | 16.3% |
| 4+ Person Household | 1,820 | 17.2% |
| Total Housing Units | 10,614 | 100.0% |
Occupancy by Ownership by Household Size in Wilsonville
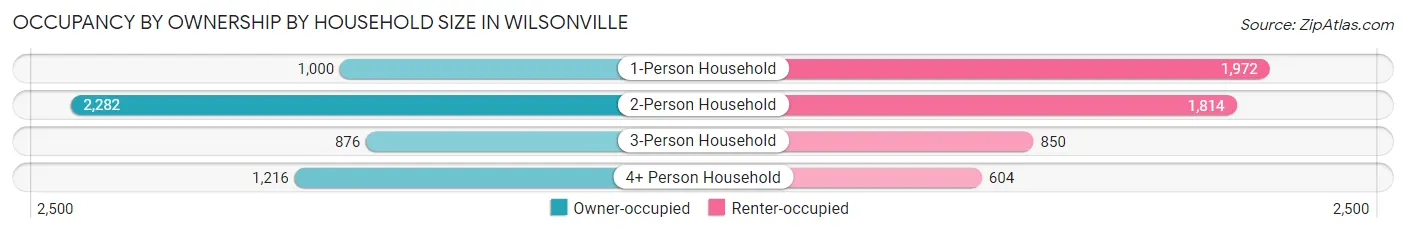
| Household Size | Owner-occupied | Renter-occupied |
| 1-Person Household | 1,000 (33.7%) | 1,972 (66.3%) |
| 2-Person Household | 2,282 (55.7%) | 1,814 (44.3%) |
| 3-Person Household | 876 (50.7%) | 850 (49.2%) |
| 4+ Person Household | 1,216 (66.8%) | 604 (33.2%) |
| Total Housing Units | 5,374 (50.6%) | 5,240 (49.4%) |
Occupancy by Educational Attainment in Wilsonville
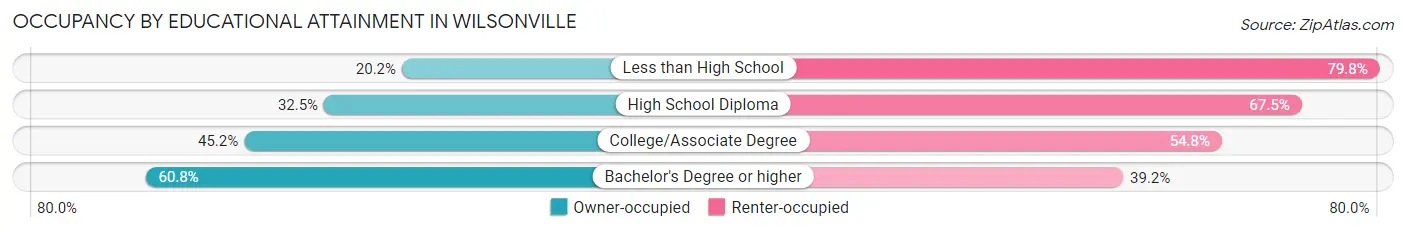
| Household Size | Owner-occupied | Renter-occupied |
| Less than High School | 74 (20.2%) | 293 (79.8%) |
| High School Diploma | 508 (32.5%) | 1,054 (67.5%) |
| College/Associate Degree | 1,419 (45.2%) | 1,721 (54.8%) |
| Bachelor's Degree or higher | 3,373 (60.8%) | 2,172 (39.2%) |
Occupancy by Age of Householder in Wilsonville
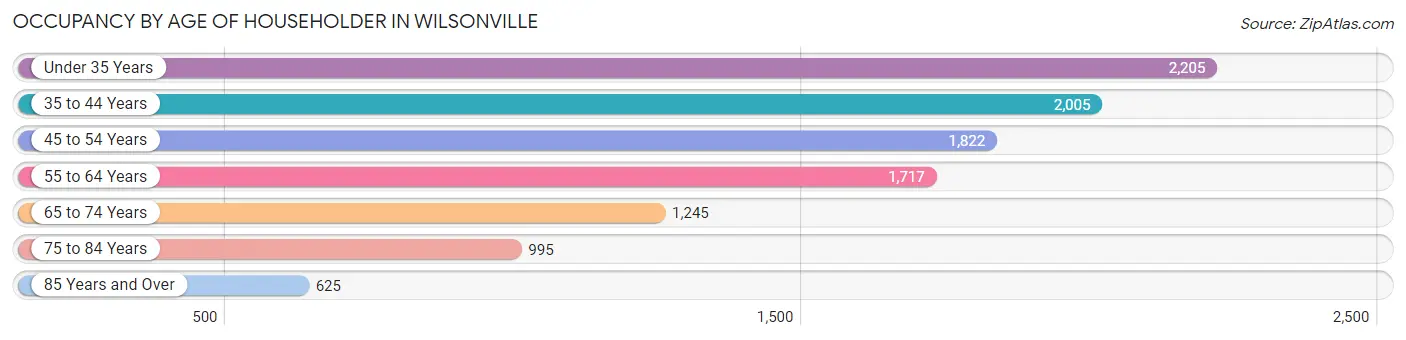
| Age Bracket | # Households | % Households |
| Under 35 Years | 2,205 | 20.8% |
| 35 to 44 Years | 2,005 | 18.9% |
| 45 to 54 Years | 1,822 | 17.2% |
| 55 to 64 Years | 1,717 | 16.2% |
| 65 to 74 Years | 1,245 | 11.7% |
| 75 to 84 Years | 995 | 9.4% |
| 85 Years and Over | 625 | 5.9% |
| Total | 10,614 | 100.0% |
Housing Finances in Wilsonville
Median Income by Occupancy in Wilsonville
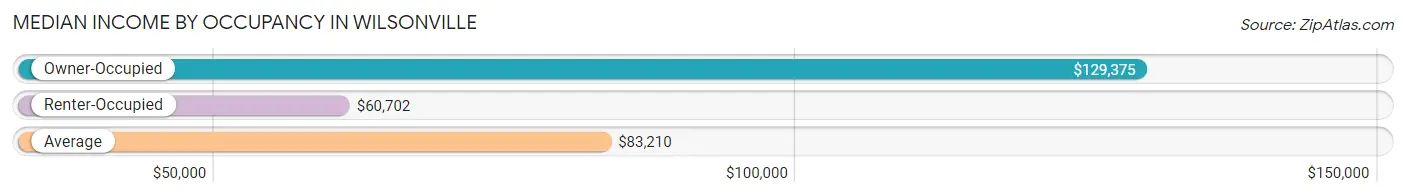
| Occupancy Type | # Households | Median Income |
| Owner-Occupied | 5,374 (50.6%) | $129,375 |
| Renter-Occupied | 5,240 (49.4%) | $60,702 |
| Average | 10,614 (100.0%) | $83,210 |
Occupancy by Householder Income Bracket in Wilsonville
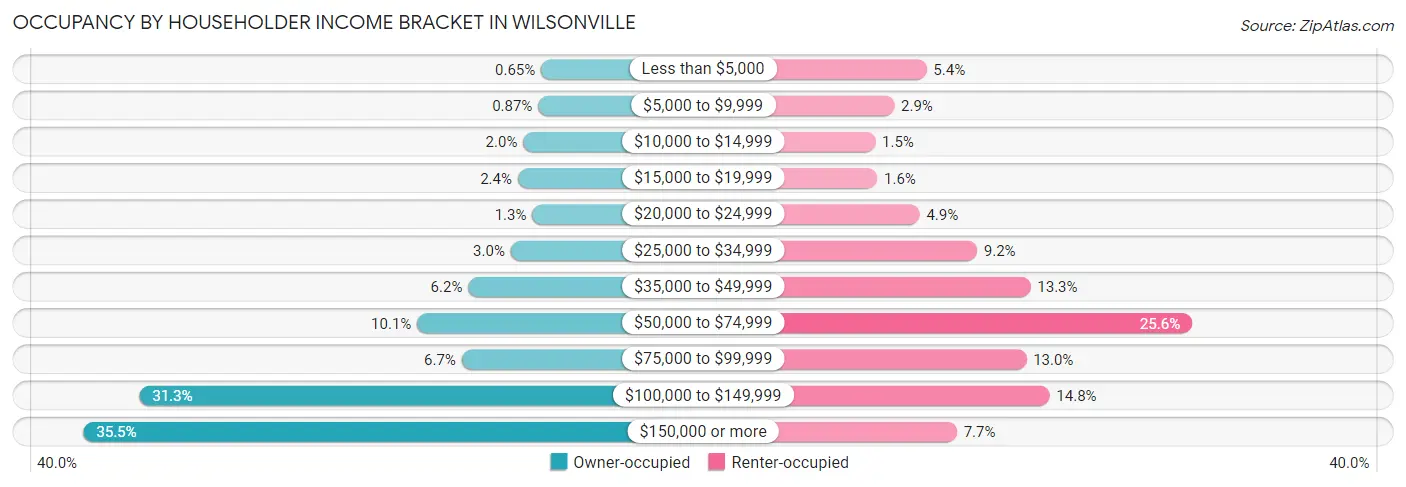
| Income Bracket | Owner-occupied | Renter-occupied |
| Less than $5,000 | 35 (0.6%) | 283 (5.4%) |
| $5,000 to $9,999 | 47 (0.9%) | 154 (2.9%) |
| $10,000 to $14,999 | 108 (2.0%) | 78 (1.5%) |
| $15,000 to $19,999 | 130 (2.4%) | 86 (1.6%) |
| $20,000 to $24,999 | 71 (1.3%) | 255 (4.9%) |
| $25,000 to $34,999 | 159 (3.0%) | 484 (9.2%) |
| $35,000 to $49,999 | 333 (6.2%) | 698 (13.3%) |
| $50,000 to $74,999 | 542 (10.1%) | 1,343 (25.6%) |
| $75,000 to $99,999 | 360 (6.7%) | 681 (13.0%) |
| $100,000 to $149,999 | 1,680 (31.3%) | 774 (14.8%) |
| $150,000 or more | 1,909 (35.5%) | 404 (7.7%) |
| Total | 5,374 (100.0%) | 5,240 (100.0%) |
Monthly Housing Cost Tiers in Wilsonville
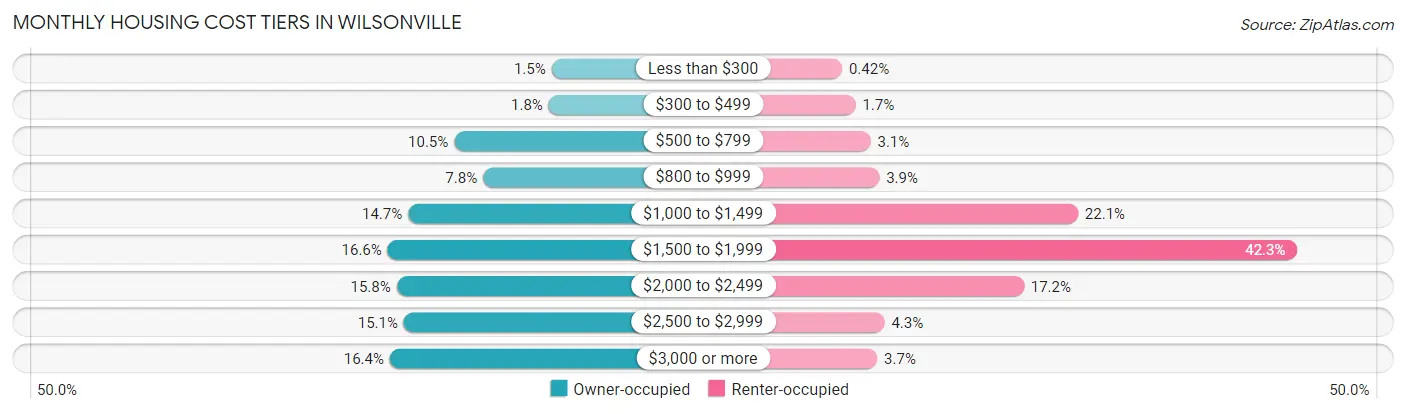
| Monthly Cost | Owner-occupied | Renter-occupied |
| Less than $300 | 80 (1.5%) | 22 (0.4%) |
| $300 to $499 | 94 (1.8%) | 87 (1.7%) |
| $500 to $799 | 562 (10.5%) | 160 (3.0%) |
| $800 to $999 | 419 (7.8%) | 202 (3.8%) |
| $1,000 to $1,499 | 790 (14.7%) | 1,160 (22.1%) |
| $1,500 to $1,999 | 891 (16.6%) | 2,218 (42.3%) |
| $2,000 to $2,499 | 847 (15.8%) | 899 (17.2%) |
| $2,500 to $2,999 | 811 (15.1%) | 227 (4.3%) |
| $3,000 or more | 880 (16.4%) | 192 (3.7%) |
| Total | 5,374 (100.0%) | 5,240 (100.0%) |
Physical Housing Characteristics in Wilsonville
Housing Structures in Wilsonville
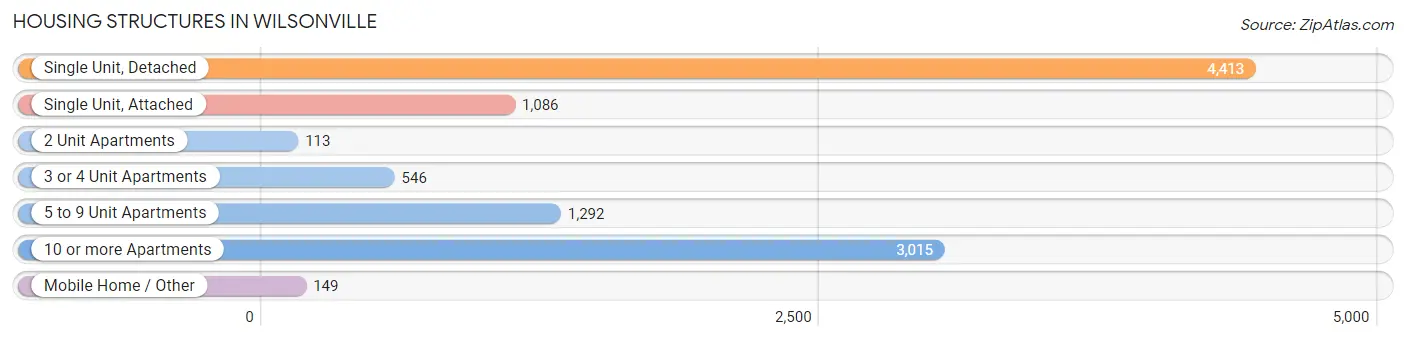
| Structure Type | # Housing Units | % Housing Units |
| Single Unit, Detached | 4,413 | 41.6% |
| Single Unit, Attached | 1,086 | 10.2% |
| 2 Unit Apartments | 113 | 1.1% |
| 3 or 4 Unit Apartments | 546 | 5.1% |
| 5 to 9 Unit Apartments | 1,292 | 12.2% |
| 10 or more Apartments | 3,015 | 28.4% |
| Mobile Home / Other | 149 | 1.4% |
| Total | 10,614 | 100.0% |
Housing Structures by Occupancy in Wilsonville
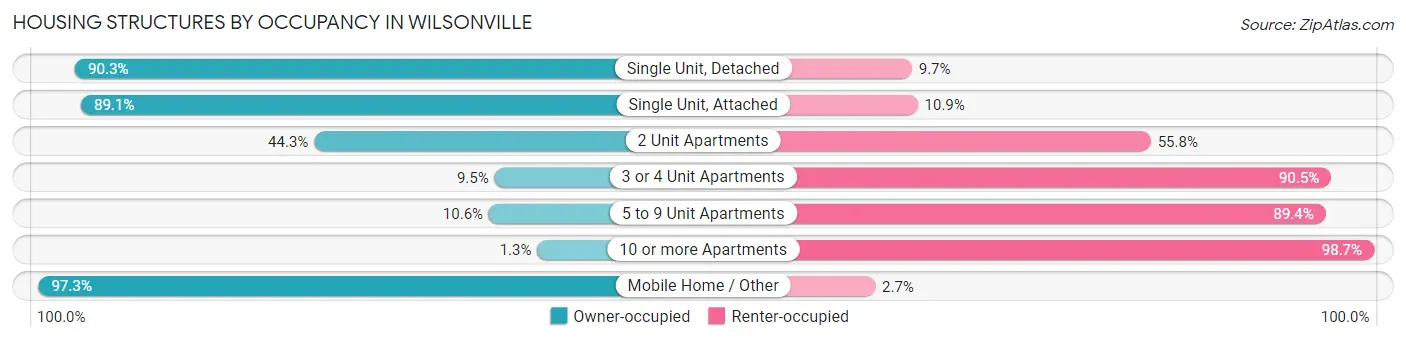
| Structure Type | Owner-occupied | Renter-occupied |
| Single Unit, Detached | 3,983 (90.3%) | 430 (9.7%) |
| Single Unit, Attached | 968 (89.1%) | 118 (10.9%) |
| 2 Unit Apartments | 50 (44.3%) | 63 (55.7%) |
| 3 or 4 Unit Apartments | 52 (9.5%) | 494 (90.5%) |
| 5 to 9 Unit Apartments | 137 (10.6%) | 1,155 (89.4%) |
| 10 or more Apartments | 39 (1.3%) | 2,976 (98.7%) |
| Mobile Home / Other | 145 (97.3%) | 4 (2.7%) |
| Total | 5,374 (50.6%) | 5,240 (49.4%) |
Housing Structures by Number of Rooms in Wilsonville
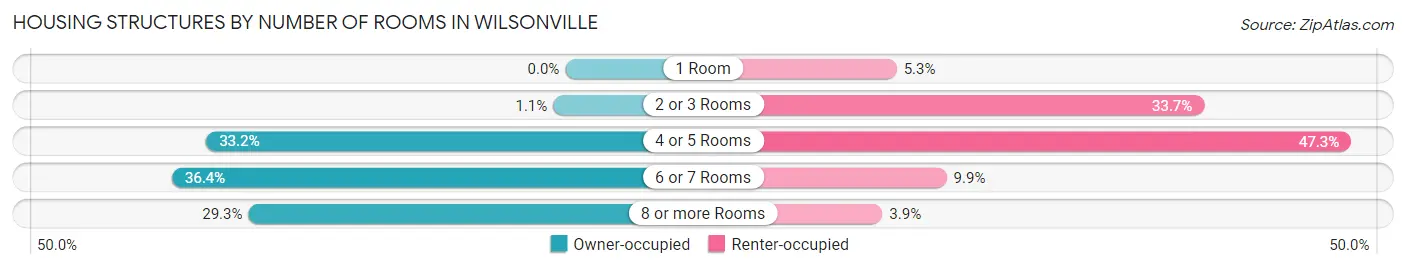
| Number of Rooms | Owner-occupied | Renter-occupied |
| 1 Room | 0 (0.0%) | 275 (5.2%) |
| 2 or 3 Rooms | 60 (1.1%) | 1,765 (33.7%) |
| 4 or 5 Rooms | 1,784 (33.2%) | 2,477 (47.3%) |
| 6 or 7 Rooms | 1,955 (36.4%) | 517 (9.9%) |
| 8 or more Rooms | 1,575 (29.3%) | 206 (3.9%) |
| Total | 5,374 (100.0%) | 5,240 (100.0%) |
Housing Structure by Heating Type in Wilsonville
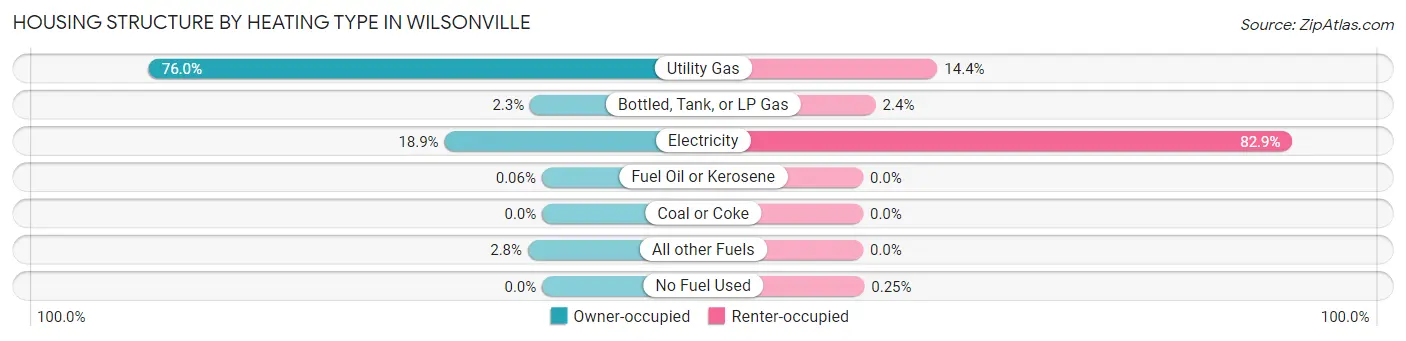
| Heating Type | Owner-occupied | Renter-occupied |
| Utility Gas | 4,084 (76.0%) | 753 (14.4%) |
| Bottled, Tank, or LP Gas | 125 (2.3%) | 128 (2.4%) |
| Electricity | 1,014 (18.9%) | 4,346 (82.9%) |
| Fuel Oil or Kerosene | 3 (0.1%) | 0 (0.0%) |
| Coal or Coke | 0 (0.0%) | 0 (0.0%) |
| All other Fuels | 148 (2.8%) | 0 (0.0%) |
| No Fuel Used | 0 (0.0%) | 13 (0.3%) |
| Total | 5,374 (100.0%) | 5,240 (100.0%) |
Household Vehicle Usage in Wilsonville
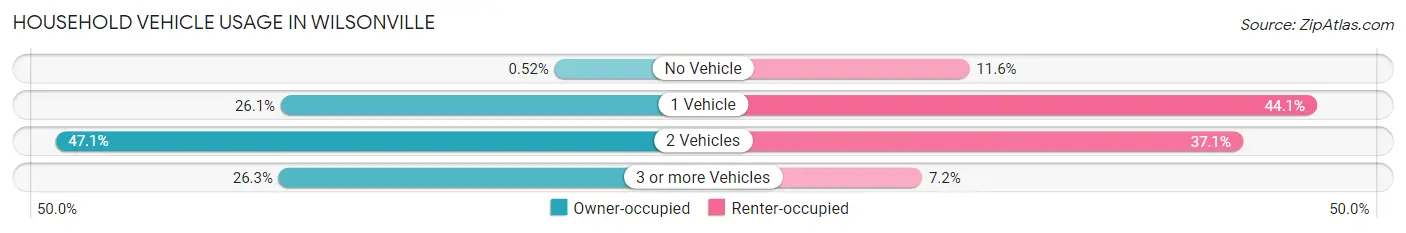
| Vehicles per Household | Owner-occupied | Renter-occupied |
| No Vehicle | 28 (0.5%) | 609 (11.6%) |
| 1 Vehicle | 1,401 (26.1%) | 2,308 (44.1%) |
| 2 Vehicles | 2,533 (47.1%) | 1,946 (37.1%) |
| 3 or more Vehicles | 1,412 (26.3%) | 377 (7.2%) |
| Total | 5,374 (100.0%) | 5,240 (100.0%) |
Real Estate & Mortgages in Wilsonville
Real Estate and Mortgage Overview in Wilsonville
| Characteristic | Without Mortgage | With Mortgage |
| Housing Units | 1,584 | 3,790 |
| Median Property Value | $553,200 | $547,800 |
| Median Household Income | $110,519 | $1,529 |
| Monthly Housing Costs | $838 | $880 |
| Real Estate Taxes | $5,849 | $42 |
Property Value by Mortgage Status in Wilsonville
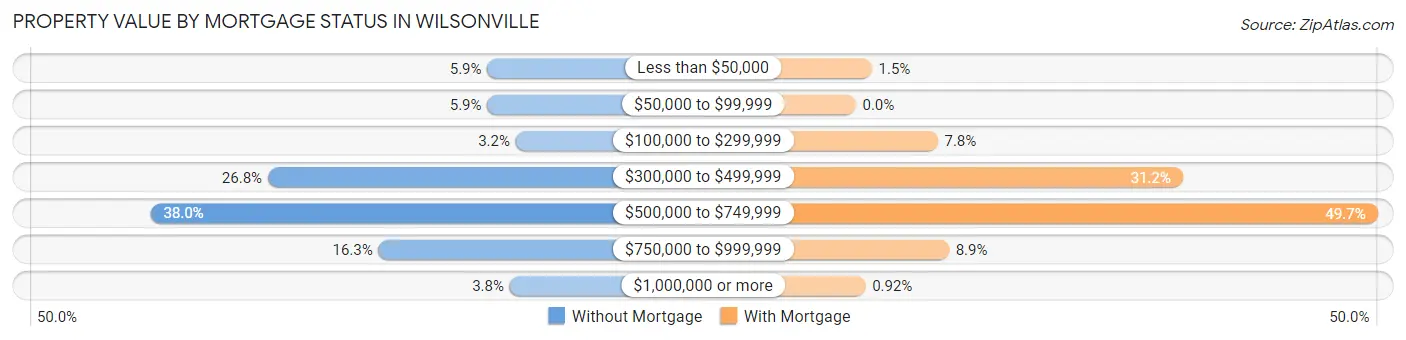
| Property Value | Without Mortgage | With Mortgage |
| Less than $50,000 | 94 (5.9%) | 58 (1.5%) |
| $50,000 to $99,999 | 94 (5.9%) | 0 (0.0%) |
| $100,000 to $299,999 | 51 (3.2%) | 296 (7.8%) |
| $300,000 to $499,999 | 425 (26.8%) | 1,181 (31.2%) |
| $500,000 to $749,999 | 602 (38.0%) | 1,884 (49.7%) |
| $750,000 to $999,999 | 258 (16.3%) | 336 (8.9%) |
| $1,000,000 or more | 60 (3.8%) | 35 (0.9%) |
| Total | 1,584 (100.0%) | 3,790 (100.0%) |
Household Income by Mortgage Status in Wilsonville
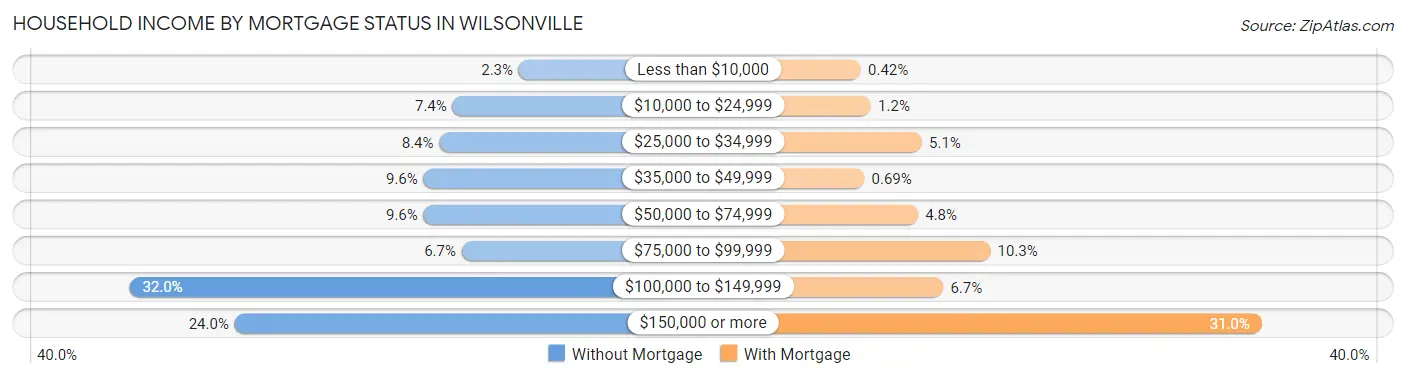
| Household Income | Without Mortgage | With Mortgage |
| Less than $10,000 | 37 (2.3%) | 16 (0.4%) |
| $10,000 to $24,999 | 117 (7.4%) | 45 (1.2%) |
| $25,000 to $34,999 | 133 (8.4%) | 192 (5.1%) |
| $35,000 to $49,999 | 152 (9.6%) | 26 (0.7%) |
| $50,000 to $74,999 | 152 (9.6%) | 181 (4.8%) |
| $75,000 to $99,999 | 106 (6.7%) | 390 (10.3%) |
| $100,000 to $149,999 | 507 (32.0%) | 254 (6.7%) |
| $150,000 or more | 380 (24.0%) | 1,173 (30.9%) |
| Total | 1,584 (100.0%) | 3,790 (100.0%) |
Property Value to Household Income Ratio in Wilsonville
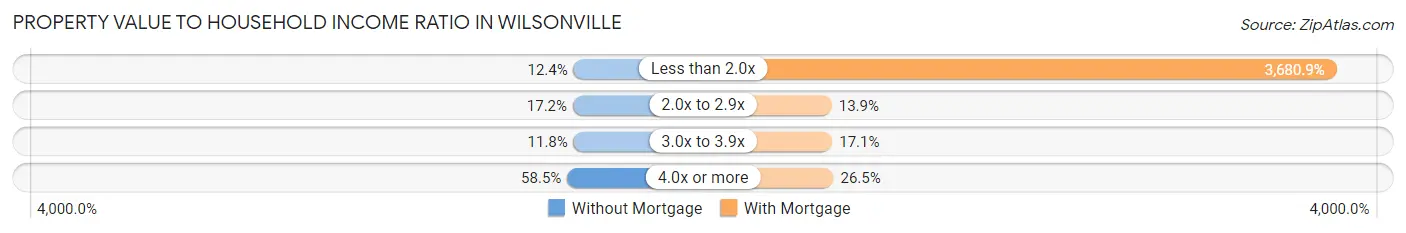
| Value-to-Income Ratio | Without Mortgage | With Mortgage |
| Less than 2.0x | 197 (12.4%) | 139,506 (3,680.9%) |
| 2.0x to 2.9x | 273 (17.2%) | 526 (13.9%) |
| 3.0x to 3.9x | 187 (11.8%) | 648 (17.1%) |
| 4.0x or more | 927 (58.5%) | 1,004 (26.5%) |
| Total | 1,584 (100.0%) | 3,790 (100.0%) |
Real Estate Taxes by Mortgage Status in Wilsonville

| Property Taxes | Without Mortgage | With Mortgage |
| Less than $800 | 164 (10.3%) | 27 (0.7%) |
| $800 to $1,499 | 33 (2.1%) | 26 (0.7%) |
| $800 to $1,499 | 1,375 (86.8%) | 84 (2.2%) |
| Total | 1,584 (100.0%) | 3,790 (100.0%) |
Health & Disability in Wilsonville
Health Insurance Coverage by Age in Wilsonville
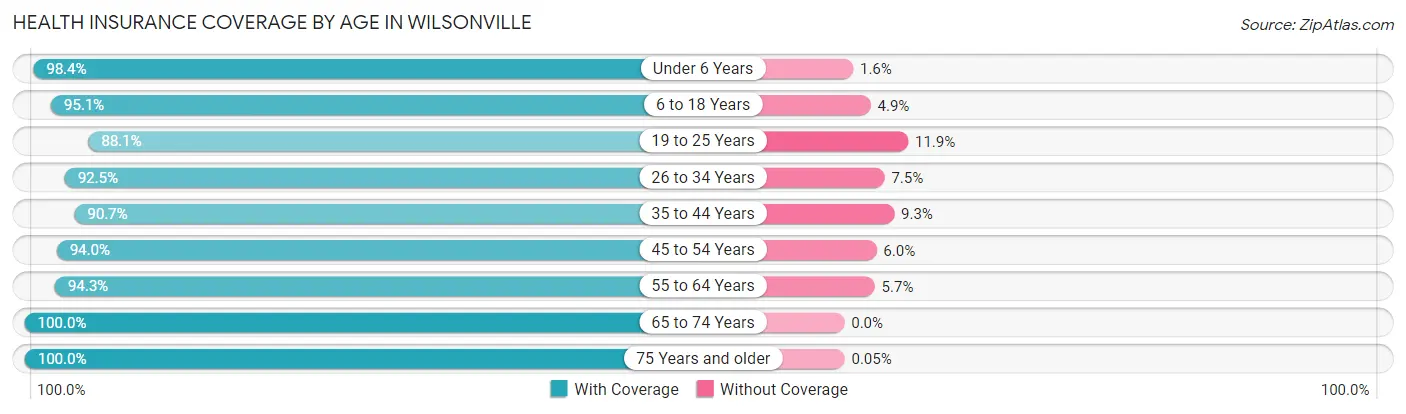
| Age Bracket | With Coverage | Without Coverage |
| Under 6 Years | 1,570 (98.4%) | 26 (1.6%) |
| 6 to 18 Years | 3,312 (95.1%) | 171 (4.9%) |
| 19 to 25 Years | 2,209 (88.1%) | 298 (11.9%) |
| 26 to 34 Years | 3,164 (92.5%) | 256 (7.5%) |
| 35 to 44 Years | 3,194 (90.7%) | 327 (9.3%) |
| 45 to 54 Years | 2,950 (94.0%) | 188 (6.0%) |
| 55 to 64 Years | 2,698 (94.3%) | 162 (5.7%) |
| 65 to 74 Years | 2,138 (100.0%) | 0 (0.0%) |
| 75 Years and older | 2,071 (100.0%) | 1 (0.1%) |
| Total | 23,306 (94.2%) | 1,429 (5.8%) |
Health Insurance Coverage by Citizenship Status in Wilsonville
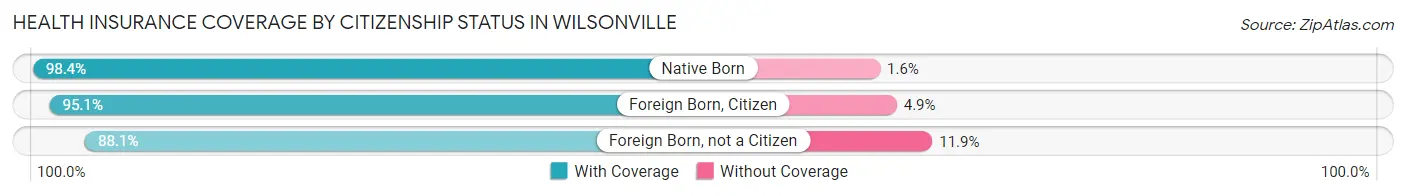
| Citizenship Status | With Coverage | Without Coverage |
| Native Born | 1,570 (98.4%) | 26 (1.6%) |
| Foreign Born, Citizen | 3,312 (95.1%) | 171 (4.9%) |
| Foreign Born, not a Citizen | 2,209 (88.1%) | 298 (11.9%) |
Health Insurance Coverage by Household Income in Wilsonville
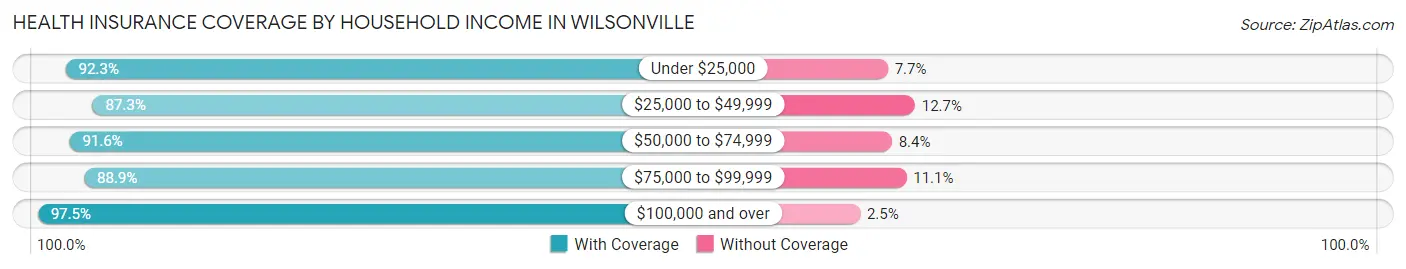
| Household Income | With Coverage | Without Coverage |
| Under $25,000 | 1,817 (92.3%) | 151 (7.7%) |
| $25,000 to $49,999 | 2,383 (87.3%) | 348 (12.7%) |
| $50,000 to $74,999 | 3,497 (91.6%) | 321 (8.4%) |
| $75,000 to $99,999 | 2,146 (88.9%) | 269 (11.1%) |
| $100,000 and over | 13,440 (97.5%) | 339 (2.5%) |
Public vs Private Health Insurance Coverage by Age in Wilsonville
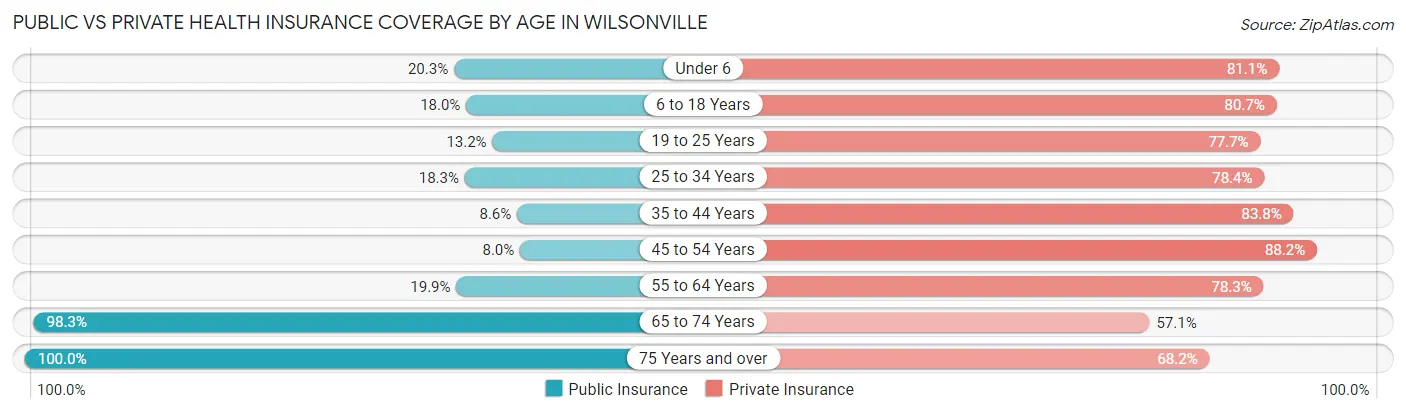
| Age Bracket | Public Insurance | Private Insurance |
| Under 6 | 324 (20.3%) | 1,295 (81.1%) |
| 6 to 18 Years | 628 (18.0%) | 2,811 (80.7%) |
| 19 to 25 Years | 330 (13.2%) | 1,948 (77.7%) |
| 25 to 34 Years | 626 (18.3%) | 2,682 (78.4%) |
| 35 to 44 Years | 302 (8.6%) | 2,952 (83.8%) |
| 45 to 54 Years | 252 (8.0%) | 2,768 (88.2%) |
| 55 to 64 Years | 568 (19.9%) | 2,239 (78.3%) |
| 65 to 74 Years | 2,102 (98.3%) | 1,221 (57.1%) |
| 75 Years and over | 2,071 (100.0%) | 1,414 (68.2%) |
| Total | 7,203 (29.1%) | 19,330 (78.1%) |
Disability Status by Sex by Age in Wilsonville
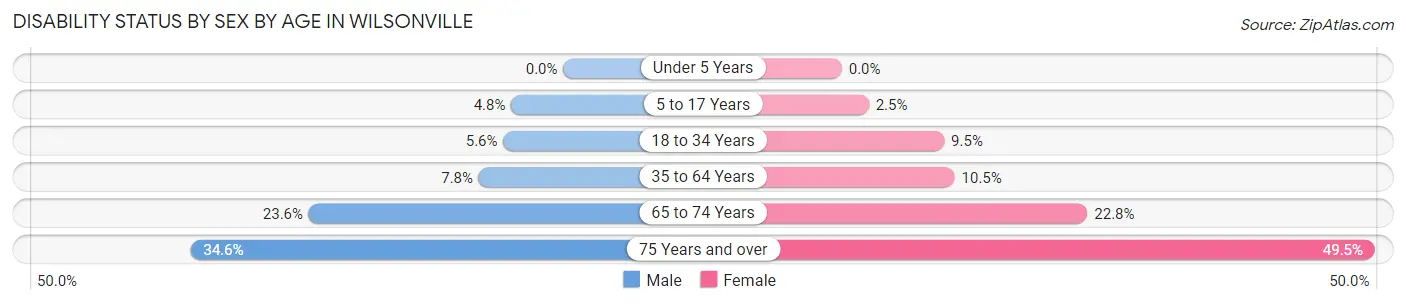
| Age Bracket | Male | Female |
| Under 5 Years | 0 (0.0%) | 0 (0.0%) |
| 5 to 17 Years | 87 (4.8%) | 45 (2.5%) |
| 18 to 34 Years | 191 (5.6%) | 266 (9.5%) |
| 35 to 64 Years | 371 (7.8%) | 501 (10.5%) |
| 65 to 74 Years | 219 (23.6%) | 276 (22.8%) |
| 75 Years and over | 261 (34.6%) | 652 (49.5%) |
Disability Class by Sex by Age in Wilsonville
Disability Class: Hearing Difficulty

| Age Bracket | Male | Female |
| Under 5 Years | 0 (0.0%) | 0 (0.0%) |
| 5 to 17 Years | 0 (0.0%) | 0 (0.0%) |
| 18 to 34 Years | 79 (2.3%) | 0 (0.0%) |
| 35 to 64 Years | 146 (3.1%) | 180 (3.8%) |
| 65 to 74 Years | 136 (14.7%) | 57 (4.7%) |
| 75 Years and over | 224 (29.7%) | 179 (13.6%) |
Disability Class: Vision Difficulty
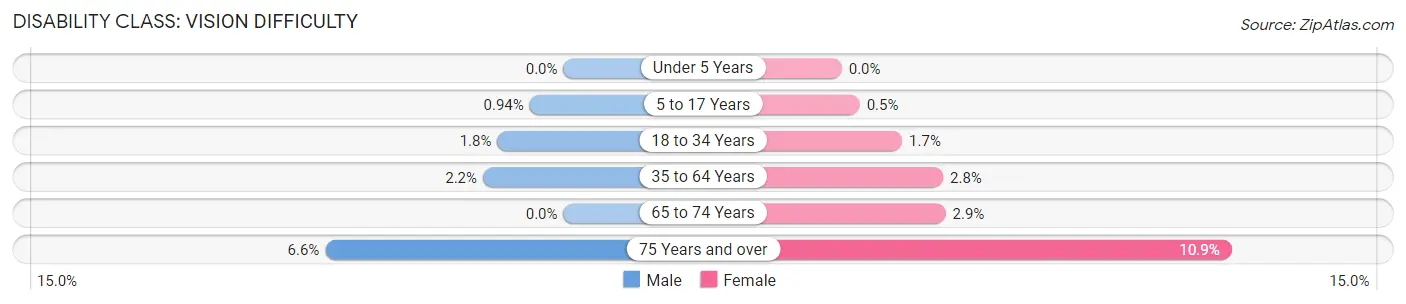
| Age Bracket | Male | Female |
| Under 5 Years | 0 (0.0%) | 0 (0.0%) |
| 5 to 17 Years | 17 (0.9%) | 9 (0.5%) |
| 18 to 34 Years | 63 (1.8%) | 47 (1.7%) |
| 35 to 64 Years | 106 (2.2%) | 135 (2.8%) |
| 65 to 74 Years | 0 (0.0%) | 35 (2.9%) |
| 75 Years and over | 50 (6.6%) | 143 (10.8%) |
Disability Class: Cognitive Difficulty
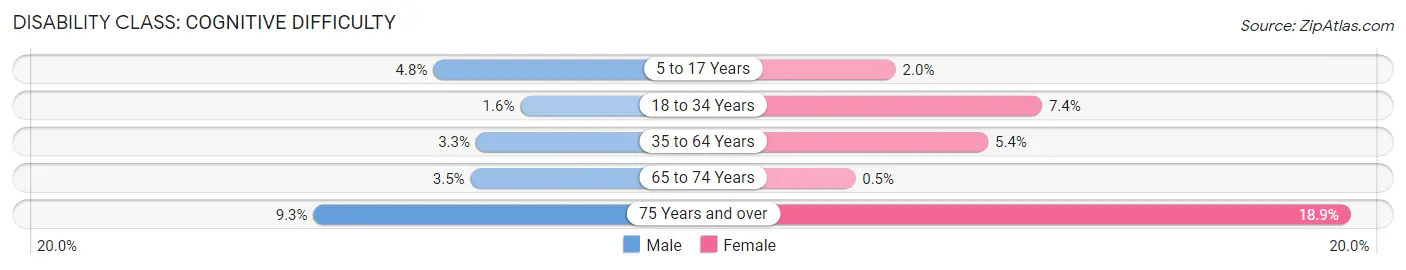
| Age Bracket | Male | Female |
| 5 to 17 Years | 87 (4.8%) | 36 (2.0%) |
| 18 to 34 Years | 55 (1.6%) | 208 (7.4%) |
| 35 to 64 Years | 154 (3.3%) | 260 (5.4%) |
| 65 to 74 Years | 32 (3.5%) | 6 (0.5%) |
| 75 Years and over | 70 (9.3%) | 249 (18.9%) |
Disability Class: Ambulatory Difficulty
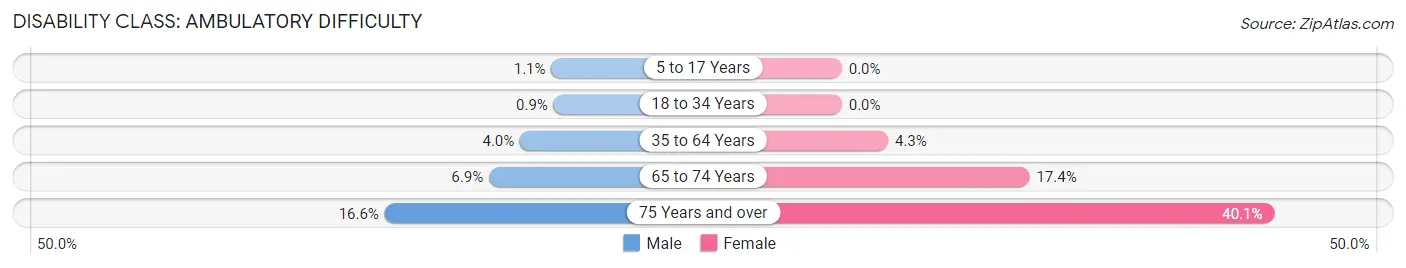
| Age Bracket | Male | Female |
| 5 to 17 Years | 20 (1.1%) | 0 (0.0%) |
| 18 to 34 Years | 31 (0.9%) | 0 (0.0%) |
| 35 to 64 Years | 190 (4.0%) | 205 (4.3%) |
| 65 to 74 Years | 64 (6.9%) | 211 (17.4%) |
| 75 Years and over | 125 (16.6%) | 529 (40.1%) |
Disability Class: Self-Care Difficulty
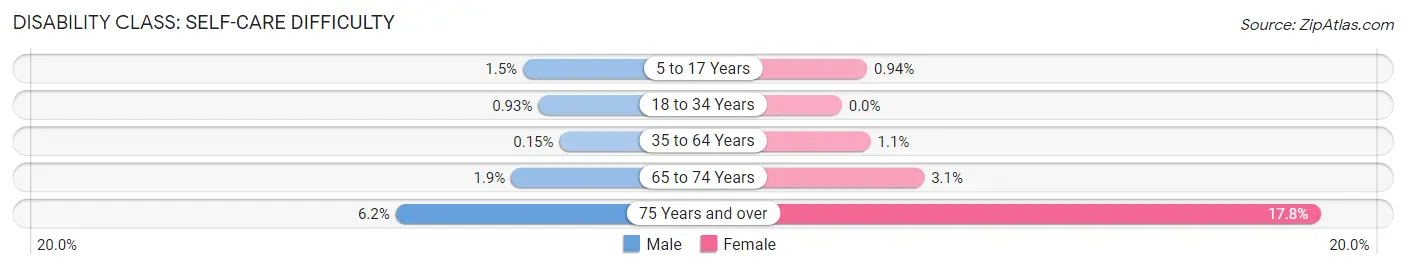
| Age Bracket | Male | Female |
| 5 to 17 Years | 27 (1.5%) | 17 (0.9%) |
| 18 to 34 Years | 32 (0.9%) | 0 (0.0%) |
| 35 to 64 Years | 7 (0.2%) | 51 (1.1%) |
| 65 to 74 Years | 18 (1.9%) | 37 (3.1%) |
| 75 Years and over | 47 (6.2%) | 234 (17.7%) |
Technology Access in Wilsonville
Computing Device Access in Wilsonville
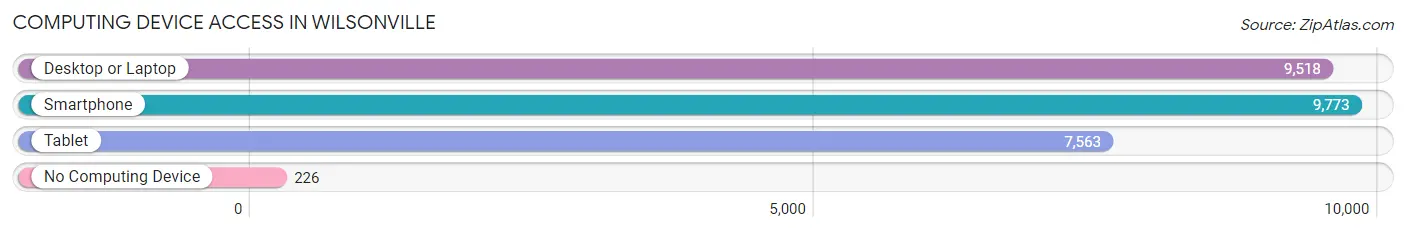
| Device Type | # Households | % Households |
| Desktop or Laptop | 9,518 | 89.7% |
| Smartphone | 9,773 | 92.1% |
| Tablet | 7,563 | 71.3% |
| No Computing Device | 226 | 2.1% |
| Total | 10,614 | 100.0% |
Internet Access in Wilsonville
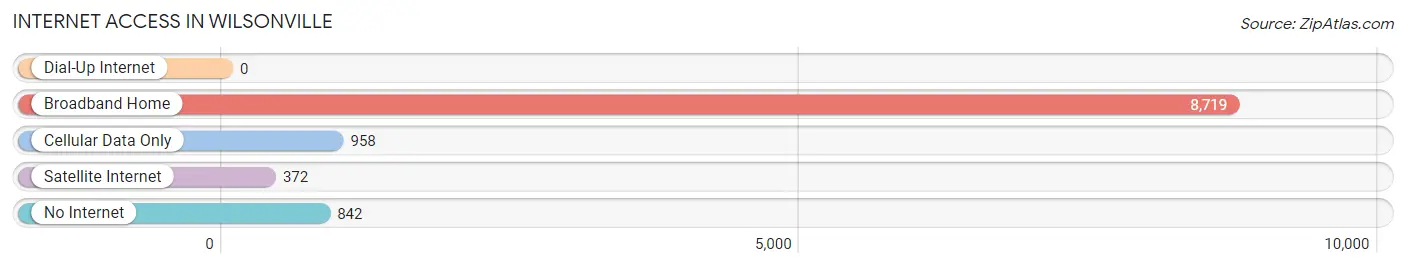
| Internet Type | # Households | % Households |
| Dial-Up Internet | 0 | 0.0% |
| Broadband Home | 8,719 | 82.2% |
| Cellular Data Only | 958 | 9.0% |
| Satellite Internet | 372 | 3.5% |
| No Internet | 842 | 7.9% |
| Total | 10,614 | 100.0% |
Wilsonville Summary
Wilsonville, Oregon is a city located in Clackamas County, Oregon, United States. It is located in the Portland metropolitan area, and is a suburb of Portland. The population was estimated to be 24,811 in 2019.
History
The area that is now Wilsonville was originally inhabited by the Atfalati tribe of the Kalapuya Native American people. The first European settlers arrived in the area in the early 1840s, and the city was officially incorporated in 1969.
The city was named after the first postmaster, Charles Wilson, who established the post office in 1880. The city was originally a farming community, and the first industry to be established was a sawmill in 1882.
Geography
Wilsonville is located in the Willamette Valley, at the confluence of the Willamette and Tualatin Rivers. It is situated about 25 miles south of Portland, and is bordered by the cities of Tualatin, Tigard, and Sherwood.
The city has a total area of 8.3 square miles, of which 8.2 square miles is land and 0.1 square miles is water. The city is located at an elevation of about 200 feet above sea level.
Economy
Wilsonville is a major economic center in the Portland metropolitan area. The city is home to several major employers, including Intel, Mentor Graphics, and FLIR Systems. The city also has a thriving retail sector, with several shopping centers and outlets.
The city is also home to several major industrial parks, including the Wilsonville Industrial Park, the Wilsonville Business Park, and the Wilsonville Technology Park.
Demographics
As of the 2010 census, the population of Wilsonville was 19,509. The racial makeup of the city was 79.2% White, 5.2% Asian, 3.7% African American, 0.7% Native American, 0.2% Pacific Islander, and 10.7% from other races. Hispanic or Latino of any race were 8.3% of the population.
The median income for a household in the city was $63,945, and the median income for a family was $76,845. The per capita income for the city was $30,945. About 5.2% of families and 7.2% of the population were below the poverty line.
Conclusion
Wilsonville, Oregon is a city located in Clackamas County, Oregon, United States. It is located in the Portland metropolitan area, and is a suburb of Portland. The city was originally a farming community, and has since become a major economic center in the Portland metropolitan area. The population was estimated to be 24,811 in 2019. The city is home to several major employers, including Intel, Mentor Graphics, and FLIR Systems. The racial makeup of the city was 79.2% White, 5.2% Asian, 3.7% African American, 0.7% Native American, 0.2% Pacific Islander, and 10.7% from other races. The median income for a household in the city was $63,945, and the median income for a family was $76,845. Wilsonville is a thriving city with a diverse population and a strong economy.
Common Questions
What is Per Capita Income in Wilsonville?
Per Capita income in Wilsonville is $45,417.
What is the Median Family Income in Wilsonville?
Median Family Income in Wilsonville is $112,848.
What is the Median Household income in Wilsonville?
Median Household Income in Wilsonville is $83,210.
What is Income or Wage Gap in Wilsonville?
Income or Wage Gap in Wilsonville is 36.9%.
Women in Wilsonville earn 63.1 cents for every dollar earned by a man.
What is Inequality or Gini Index in Wilsonville?
Inequality or Gini Index in Wilsonville is 0.42.
What is the Total Population of Wilsonville?
Total Population of Wilsonville is 25,992.
What is the Total Male Population of Wilsonville?
Total Male Population of Wilsonville is 12,469.
What is the Total Female Population of Wilsonville?
Total Female Population of Wilsonville is 13,523.
What is the Ratio of Males per 100 Females in Wilsonville?
There are 92.21 Males per 100 Females in Wilsonville.
What is the Ratio of Females per 100 Males in Wilsonville?
There are 108.45 Females per 100 Males in Wilsonville.
What is the Median Population Age in Wilsonville?
Median Population Age in Wilsonville is 38.3 Years.
What is the Average Family Size in Wilsonville
Average Family Size in Wilsonville is 2.8 People.
What is the Average Household Size in Wilsonville
Average Household Size in Wilsonville is 2.3 People.
How Large is the Labor Force in Wilsonville?
There are 13,694 People in the Labor Forcein in Wilsonville.
What is the Percentage of People in the Labor Force in Wilsonville?
63.0% of People are in the Labor Force in Wilsonville.
What is the Unemployment Rate in Wilsonville?
Unemployment Rate in Wilsonville is 5.8%.