Cities with the Highest Percentage of Immigrants from Canada in Oregon
RELATED REPORTS & OPTIONS
Canada
Oregon
Compare Cities
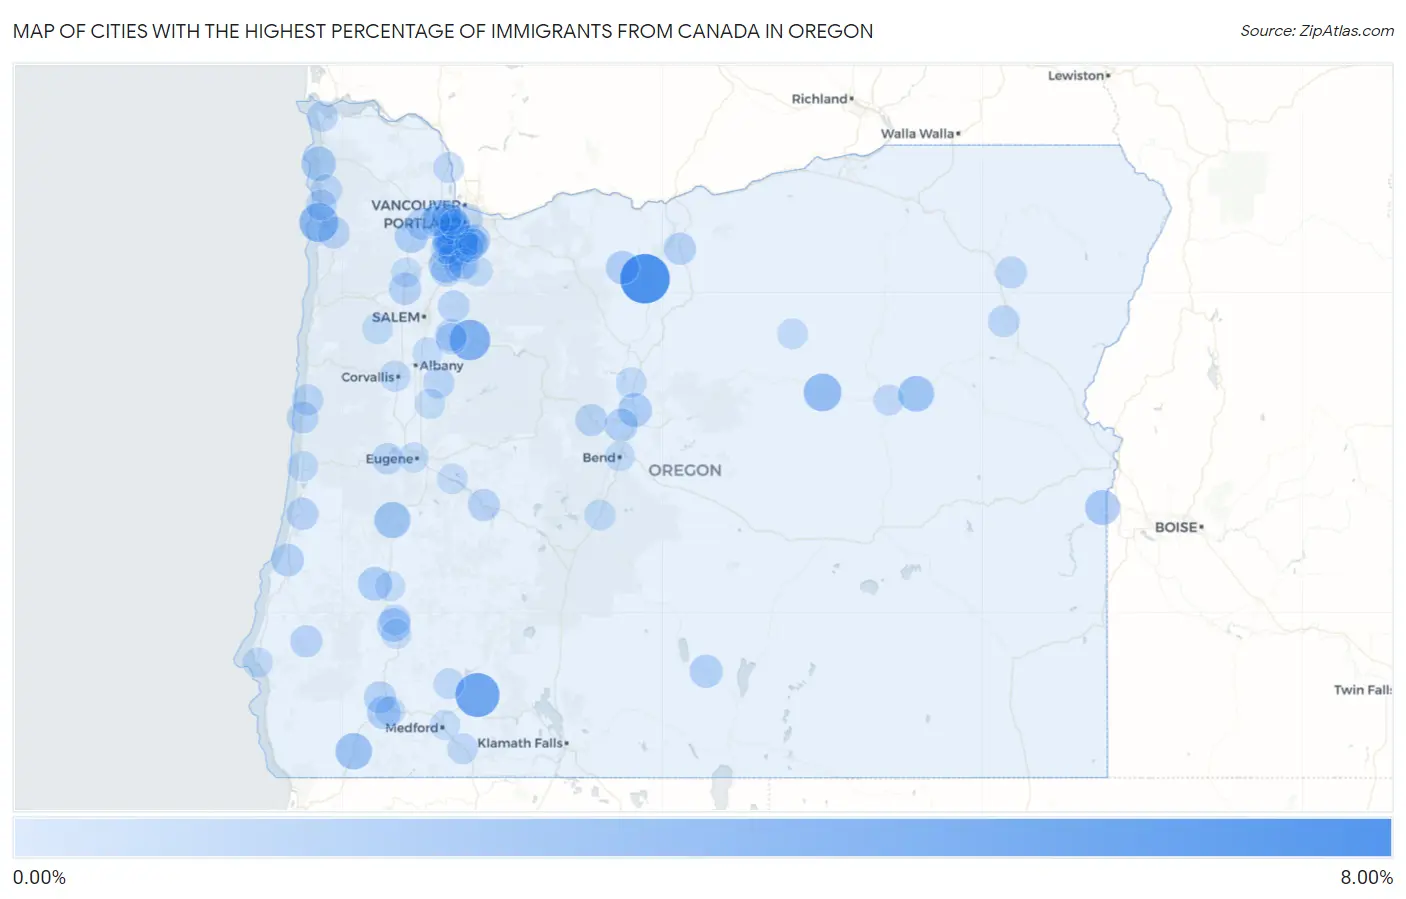
Map of Cities with the Highest Percentage of Immigrants from Canada in Oregon
0.00%
8.00%
Cities with the Highest Percentage of Immigrants from Canada in Oregon
| City | Canada | vs State | vs National | |
| 1. | Maupin | 7.58% | 0.36%(+7.22)#-1 | 0.25%(+7.34)#0 |
| 2. | Butte Falls | 5.49% | 0.36%(+5.13)#0 | 0.25%(+5.24)#1 |
| 3. | Rivergrove | 4.12% | 0.36%(+3.76)#1 | 0.25%(+3.87)#2 |
| 4. | Mehama | 4.12% | 0.36%(+3.76)#2 | 0.25%(+3.87)#3 |
| 5. | Cape Meares | 3.52% | 0.36%(+3.16)#3 | 0.25%(+3.27)#4 |
| 6. | Dayville | 3.11% | 0.36%(+2.75)#4 | 0.25%(+2.86)#5 |
| 7. | Cheshire | 3.01% | 0.36%(+2.65)#5 | 0.25%(+2.76)#6 |
| 8. | Cave Junction | 2.62% | 0.36%(+2.26)#6 | 0.25%(+2.37)#7 |
| 9. | Drain | 2.46% | 0.36%(+2.10)#7 | 0.25%(+2.22)#8 |
| 10. | Prairie City | 2.37% | 0.36%(+2.01)#8 | 0.25%(+2.12)#9 |
| 11. | Rockcreek | 2.12% | 0.36%(+1.76)#9 | 0.25%(+1.87)#10 |
| 12. | Butteville | 2.11% | 0.36%(+1.75)#10 | 0.25%(+1.86)#11 |
| 13. | King City | 2.03% | 0.36%(+1.67)#18 | 0.25%(+1.79)#1,710 |
| 14. | Adrian | 2.02% | 0.36%(+1.66)#19 | 0.25%(+1.77)#1,711 |
| 15. | Cannon Beach | 1.89% | 0.36%(+1.53)#20 | 0.25%(+1.64)#1,712 |
| 16. | San Marine | 1.70% | 0.36%(+1.34)#21 | 0.25%(+1.46)#1,713 |
| 17. | Terrebonne | 1.69% | 0.36%(+1.33)#22 | 0.25%(+1.45)#1,714 |
| 18. | Melrose | 1.63% | 0.36%(+1.27)#23 | 0.25%(+1.38)#1,715 |
| 19. | Tri City | 1.57% | 0.36%(+1.21)#24 | 0.25%(+1.33)#1,716 |
| 20. | Redwood | 1.50% | 0.36%(+1.14)#25 | 0.25%(+1.25)#1,717 |
| 21. | Gaston | 1.46% | 0.36%(+1.10)#26 | 0.25%(+1.21)#1,718 |
| 22. | Pine Hollow | 1.46% | 0.36%(+1.10)#27 | 0.25%(+1.21)#1,719 |
| 23. | Dunthorpe | 1.41% | 0.36%(+1.05)#28 | 0.25%(+1.17)#1,720 |
| 24. | Paisley | 1.41% | 0.36%(+1.05)#29 | 0.25%(+1.17)#1,721 |
| 25. | Dexter | 1.40% | 0.36%(+1.04)#30 | 0.25%(+1.16)#1,722 |
| 26. | River Road | 1.37% | 0.36%(+1.01)#31 | 0.25%(+1.12)#1,723 |
| 27. | Eagle Crest | 1.33% | 0.36%(+0.974)#32 | 0.25%(+1.09)#1,724 |
| 28. | North Bend | 1.29% | 0.36%(+0.928)#33 | 0.25%(+1.04)#1,725 |
| 29. | Ochoco West | 1.28% | 0.36%(+0.922)#34 | 0.25%(+1.03)#1,726 |
| 30. | Oatfield | 1.25% | 0.36%(+0.887)#35 | 0.25%(+0.999)#1,727 |
| 31. | Cornelius | 1.20% | 0.36%(+0.840)#36 | 0.25%(+0.952)#1,728 |
| 32. | Amity | 1.13% | 0.36%(+0.774)#37 | 0.25%(+0.886)#1,729 |
| 33. | Merlin | 1.10% | 0.36%(+0.742)#38 | 0.25%(+0.854)#1,730 |
| 34. | Grass Valley | 1.08% | 0.36%(+0.719)#39 | 0.25%(+0.831)#1,731 |
| 35. | Reedsport | 1.07% | 0.36%(+0.708)#40 | 0.25%(+0.820)#1,732 |
| 36. | Powers | 1.06% | 0.36%(+0.698)#41 | 0.25%(+0.810)#1,733 |
| 37. | Sublimity | 1.02% | 0.36%(+0.659)#42 | 0.25%(+0.770)#1,734 |
| 38. | Tillamook | 1.02% | 0.36%(+0.656)#43 | 0.25%(+0.768)#1,735 |
| 39. | Westfir | 1.02% | 0.36%(+0.655)#44 | 0.25%(+0.767)#1,736 |
| 40. | West Slope | 1.01% | 0.36%(+0.645)#45 | 0.25%(+0.757)#1,737 |
| 41. | Sisters | 1.00% | 0.36%(+0.643)#46 | 0.25%(+0.754)#1,738 |
| 42. | Raleigh Hills | 0.95% | 0.36%(+0.590)#47 | 0.25%(+0.702)#1,739 |
| 43. | Haines | 0.91% | 0.36%(+0.549)#48 | 0.25%(+0.661)#1,740 |
| 44. | Yachats | 0.91% | 0.36%(+0.547)#49 | 0.25%(+0.659)#1,741 |
| 45. | Union | 0.91% | 0.36%(+0.545)#50 | 0.25%(+0.657)#1,742 |
| 46. | Silverton | 0.87% | 0.36%(+0.512)#51 | 0.25%(+0.624)#1,743 |
| 47. | Lebanon | 0.84% | 0.36%(+0.479)#52 | 0.25%(+0.591)#1,744 |
| 48. | Jennings Lodge | 0.84% | 0.36%(+0.475)#53 | 0.25%(+0.587)#1,745 |
| 49. | Waldport | 0.82% | 0.36%(+0.460)#54 | 0.25%(+0.572)#1,746 |
| 50. | Stayton | 0.78% | 0.36%(+0.419)#55 | 0.25%(+0.531)#1,747 |
| 51. | Veneta | 0.77% | 0.36%(+0.413)#56 | 0.25%(+0.524)#1,748 |
| 52. | Nehalem | 0.74% | 0.36%(+0.383)#57 | 0.25%(+0.495)#1,749 |
| 53. | Lake Oswego | 0.74% | 0.36%(+0.379)#58 | 0.25%(+0.491)#1,750 |
| 54. | Tigard | 0.74% | 0.36%(+0.376)#59 | 0.25%(+0.488)#2,986 |
| 55. | Wilsonville | 0.71% | 0.36%(+0.352)#60 | 0.25%(+0.464)#3,302 |
| 56. | Rockaway Beach | 0.65% | 0.36%(+0.286)#61 | 0.25%(+0.398)#3,303 |
| 57. | Corvallis | 0.64% | 0.36%(+0.284)#62 | 0.25%(+0.396)#3,304 |
| 58. | Barlow | 0.64% | 0.36%(+0.277)#63 | 0.25%(+0.389)#3,305 |
| 59. | Myrtle Creek | 0.63% | 0.36%(+0.271)#64 | 0.25%(+0.383)#3,306 |
| 60. | Shady Cove | 0.62% | 0.36%(+0.256)#65 | 0.25%(+0.368)#3,307 |
| 61. | St Helens | 0.61% | 0.36%(+0.254)#66 | 0.25%(+0.365)#3,308 |
| 62. | Donald | 0.61% | 0.36%(+0.248)#67 | 0.25%(+0.360)#3,309 |
| 63. | Juniper Canyon | 0.60% | 0.36%(+0.237)#68 | 0.25%(+0.348)#3,310 |
| 64. | Beaverton | 0.59% | 0.36%(+0.234)#69 | 0.25%(+0.346)#3,311 |
| 65. | Sherwood | 0.58% | 0.36%(+0.217)#70 | 0.25%(+0.329)#3,312 |
| 66. | John Day | 0.58% | 0.36%(+0.216)#71 | 0.25%(+0.328)#3,313 |
| 67. | Warrenton | 0.58% | 0.36%(+0.216)#72 | 0.25%(+0.327)#3,314 |
| 68. | Ashland | 0.57% | 0.36%(+0.210)#73 | 0.25%(+0.322)#3,315 |
| 69. | Heceta Beach | 0.57% | 0.36%(+0.205)#74 | 0.25%(+0.317)#3,316 |
| 70. | La Pine | 0.56% | 0.36%(+0.204)#75 | 0.25%(+0.316)#3,317 |
| 71. | Oak Hills | 0.55% | 0.36%(+0.192)#76 | 0.25%(+0.304)#3,318 |
| 72. | Bull Mountain | 0.55% | 0.36%(+0.187)#77 | 0.25%(+0.299)#3,319 |
| 73. | Falls City | 0.53% | 0.36%(+0.170)#78 | 0.25%(+0.282)#3,320 |
| 74. | Florence | 0.52% | 0.36%(+0.162)#79 | 0.25%(+0.274)#3,321 |
| 75. | Culver | 0.51% | 0.36%(+0.146)#80 | 0.25%(+0.258)#3,322 |
| 76. | Spray | 0.50% | 0.36%(+0.142)#81 | 0.25%(+0.254)#3,323 |
| 77. | Santa Clara | 0.49% | 0.36%(+0.132)#82 | 0.25%(+0.244)#3,324 |
| 78. | Portland | 0.47% | 0.36%(+0.114)#83 | 0.25%(+0.226)#3,325 |
| 79. | Canby | 0.47% | 0.36%(+0.109)#84 | 0.25%(+0.221)#3,326 |
| 80. | Marlene | 0.45% | 0.36%(+0.094)#85 | 0.25%(+0.206)#3,327 |
| 81. | Port Orford | 0.45% | 0.36%(+0.086)#86 | 0.25%(+0.198)#3,328 |
| 82. | Oak Grove | 0.44% | 0.36%(+0.085)#87 | 0.25%(+0.197)#3,329 |
| 83. | Cedar Mill | 0.43% | 0.36%(+0.068)#88 | 0.25%(+0.180)#3,330 |
| 84. | Lowell | 0.41% | 0.36%(+0.053)#89 | 0.25%(+0.165)#3,331 |
| 85. | Canyonville | 0.41% | 0.36%(+0.050)#90 | 0.25%(+0.162)#3,332 |
| 86. | Bethany | 0.41% | 0.36%(+0.050)#91 | 0.25%(+0.162)#3,333 |
| 87. | Mulino | 0.41% | 0.36%(+0.048)#92 | 0.25%(+0.160)#3,334 |
| 88. | Roseburg | 0.39% | 0.36%(+0.033)#93 | 0.25%(+0.145)#3,335 |
| 89. | Eugene | 0.39% | 0.36%(+0.028)#94 | 0.25%(+0.140)#3,336 |
| 90. | Brownsville | 0.38% | 0.36%(+0.022)#95 | 0.25%(+0.134)#3,337 |
| 91. | West Haven Sylvan | 0.37% | 0.36%(+0.010)#96 | 0.25%(+0.122)#3,338 |
| 92. | Hillsboro | 0.37% | 0.36%(+0.008)#97 | 0.25%(+0.119)#3,339 |
| 93. | Gladstone | 0.37% | 0.36%(+0.007)#98 | 0.25%(+0.119)#3,340 |
| 94. | Medford | 0.36% | 0.36%(+0.001)#99 | 0.25%(+0.113)#3,341 |
| 95. | Jefferson | 0.36% | 0.36%(+0.001)#100 | 0.25%(+0.113)#3,342 |
| 96. | West Linn | 0.36% | 0.36%(+0.001)#101 | 0.25%(+0.113)#3,343 |
| 97. | Grants Pass | 0.36% | 0.36%(-0.002)#102 | 0.25%(+0.110)#3,344 |
| 98. | Bend | 0.36% | 0.36%(-0.004)#103 | 0.25%(+0.108)#3,345 |
| 99. | Boring | 0.35% | 0.36%(-0.008)#104 | 0.25%(+0.104)#3,346 |
| 100. | Mcminnville | 0.35% | 0.36%(-0.009)#105 | 0.25%(+0.103)#3,347 |
Common Questions
What are the Top 10 Cities with the Highest Percentage of Immigrants from Canada in Oregon?
Top 10 Cities with the Highest Percentage of Immigrants from Canada in Oregon are:
#1
7.58%
#2
5.49%
#3
4.12%
#4
4.12%
#5
3.52%
#6
3.11%
#7
2.62%
#8
2.46%
#9
2.37%
#10
2.12%
What city has the Highest Percentage of Immigrants from Canada in Oregon?
Maupin has the Highest Percentage of Immigrants from Canada in Oregon with 7.58%.
What is the Percentage of Immigrants from Canada in the State of Oregon?
Percentage of Immigrants from Canada in Oregon is 0.36%.
What is the Percentage of Immigrants from Canada in the United States?
Percentage of Immigrants from Canada in the United States is 0.25%.