Windham, OH Map & Demographics
Windham Map
Windham Overview
$19,089
PER CAPITA INCOME
$39,583
AVG FAMILY INCOME
$39,000
AVG HOUSEHOLD INCOME
36.1%
WAGE / INCOME GAP [ % ]
63.9¢/ $1
WAGE / INCOME GAP [ $ ]
$17,051
FAMILY INCOME DEFICIT
0.45
INEQUALITY / GINI INDEX
1,777
TOTAL POPULATION
877
MALE POPULATION
900
FEMALE POPULATION
97.44
MALES / 100 FEMALES
102.62
FEMALES / 100 MALES
29.0
MEDIAN AGE
3.4
AVG FAMILY SIZE
2.8
AVG HOUSEHOLD SIZE
685
LABOR FORCE [ PEOPLE ]
55.1%
PERCENT IN LABOR FORCE
13.9%
UNEMPLOYMENT RATE
Windham Zip Codes
Windham Area Codes
Income in Windham
Income Overview in Windham
Per Capita Income in Windham is $19,089, while median incomes of families and households are $39,583 and $39,000 respectively.
| Characteristic | Number | Measure |
| Per Capita Income | 1,777 | $19,089 |
| Median Family Income | 444 | $39,583 |
| Mean Family Income | 444 | $54,417 |
| Median Household Income | 624 | $39,000 |
| Mean Household Income | 624 | $51,440 |
| Income Deficit | 444 | $17,051 |
| Wage / Income Gap (%) | 1,777 | 36.12% |
| Wage / Income Gap ($) | 1,777 | 63.88¢ per $1 |
| Gini / Inequality Index | 1,777 | 0.45 |
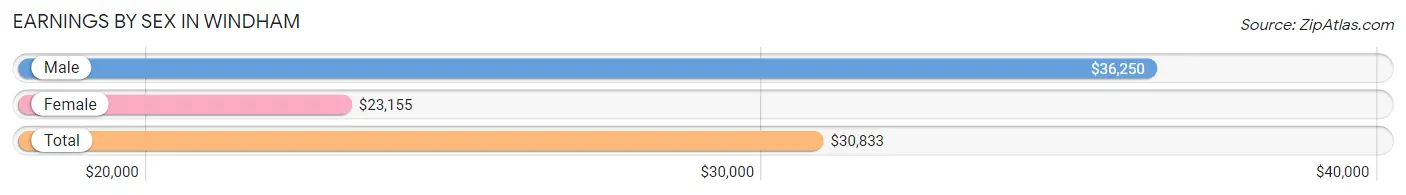
Earnings by Sex in Windham
Average Earnings in Windham are $30,833, $36,250 for men and $23,155 for women, a difference of 36.1%.
| Sex | Number | Average Earnings |
| Male | 373 (54.5%) | $36,250 |
| Female | 311 (45.5%) | $23,155 |
| Total | 684 (100.0%) | $30,833 |
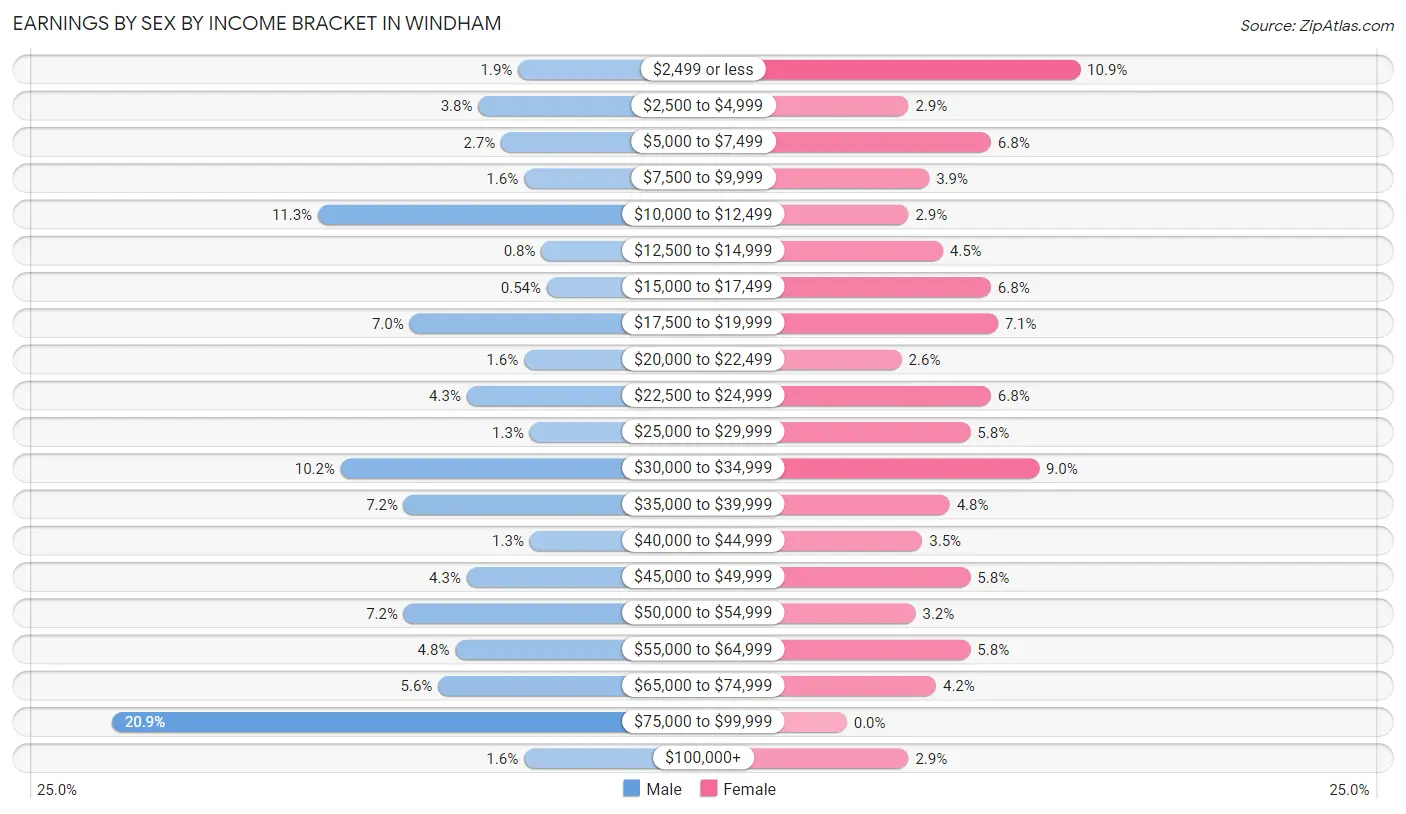
Earnings by Sex by Income Bracket in Windham
The most common earnings brackets in Windham are $75,000 to $99,999 for men (78 | 20.9%) and $2,499 or less for women (34 | 10.9%).
| Income | Male | Female |
| $2,499 or less | 7 (1.9%) | 34 (10.9%) |
| $2,500 to $4,999 | 14 (3.7%) | 9 (2.9%) |
| $5,000 to $7,499 | 10 (2.7%) | 21 (6.8%) |
| $7,500 to $9,999 | 6 (1.6%) | 12 (3.9%) |
| $10,000 to $12,499 | 42 (11.3%) | 9 (2.9%) |
| $12,500 to $14,999 | 3 (0.8%) | 14 (4.5%) |
| $15,000 to $17,499 | 2 (0.5%) | 21 (6.8%) |
| $17,500 to $19,999 | 26 (7.0%) | 22 (7.1%) |
| $20,000 to $22,499 | 6 (1.6%) | 8 (2.6%) |
| $22,500 to $24,999 | 16 (4.3%) | 21 (6.8%) |
| $25,000 to $29,999 | 5 (1.3%) | 18 (5.8%) |
| $30,000 to $34,999 | 38 (10.2%) | 28 (9.0%) |
| $35,000 to $39,999 | 27 (7.2%) | 15 (4.8%) |
| $40,000 to $44,999 | 5 (1.3%) | 11 (3.5%) |
| $45,000 to $49,999 | 16 (4.3%) | 18 (5.8%) |
| $50,000 to $54,999 | 27 (7.2%) | 10 (3.2%) |
| $55,000 to $64,999 | 18 (4.8%) | 18 (5.8%) |
| $65,000 to $74,999 | 21 (5.6%) | 13 (4.2%) |
| $75,000 to $99,999 | 78 (20.9%) | 0 (0.0%) |
| $100,000+ | 6 (1.6%) | 9 (2.9%) |
| Total | 373 (100.0%) | 311 (100.0%) |
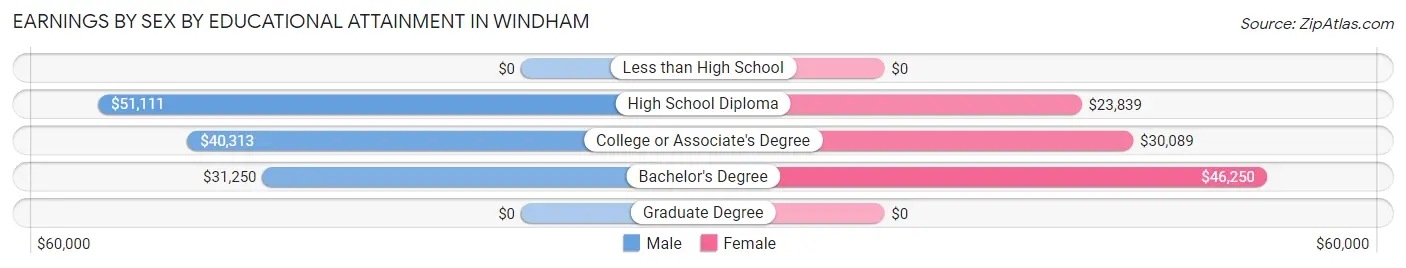
Earnings by Sex by Educational Attainment in Windham
Average earnings in Windham are $42,188 for men and $27,500 for women, a difference of 34.8%. Men with an educational attainment of high school diploma enjoy the highest average annual earnings of $51,111, while those with bachelor's degree education earn the least with $31,250. Women with an educational attainment of bachelor's degree earn the most with the average annual earnings of $46,250, while those with high school diploma education have the smallest earnings of $23,839.
| Educational Attainment | Male Income | Female Income |
| Less than High School | - | - |
| High School Diploma | $51,111 | $23,839 |
| College or Associate's Degree | $40,313 | $30,089 |
| Bachelor's Degree | $31,250 | $46,250 |
| Graduate Degree | - | - |
| Total | $42,188 | $27,500 |
Family Income in Windham
Family Income Brackets in Windham
According to the Windham family income data, there are 97 families falling into the $10,000 to $14,999 income range, which is the most common income bracket and makes up 21.8% of all families. Conversely, the $200,000+ income bracket is the least frequent group with only 6 families (1.3%) belonging to this category.
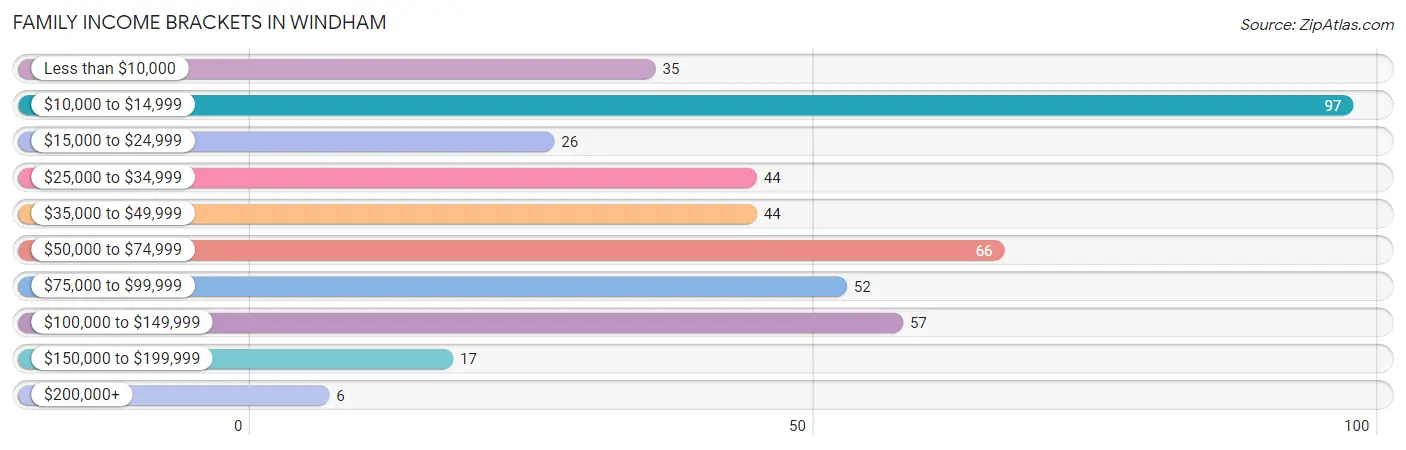
| Income Bracket | # Families | % Families |
| Less than $10,000 | 35 | 7.9% |
| $10,000 to $14,999 | 97 | 21.8% |
| $15,000 to $24,999 | 26 | 5.9% |
| $25,000 to $34,999 | 44 | 9.9% |
| $35,000 to $49,999 | 44 | 9.9% |
| $50,000 to $74,999 | 66 | 14.9% |
| $75,000 to $99,999 | 52 | 11.7% |
| $100,000 to $149,999 | 57 | 12.8% |
| $150,000 to $199,999 | 17 | 3.8% |
| $200,000+ | 6 | 1.4% |
Family Income by Famaliy Size in Windham
2-person families (199 | 44.8%) account for the highest median family income in Windham with $56,607 per family, while 2-person families (199 | 44.8%) have the highest median income of $28,304 per family member.
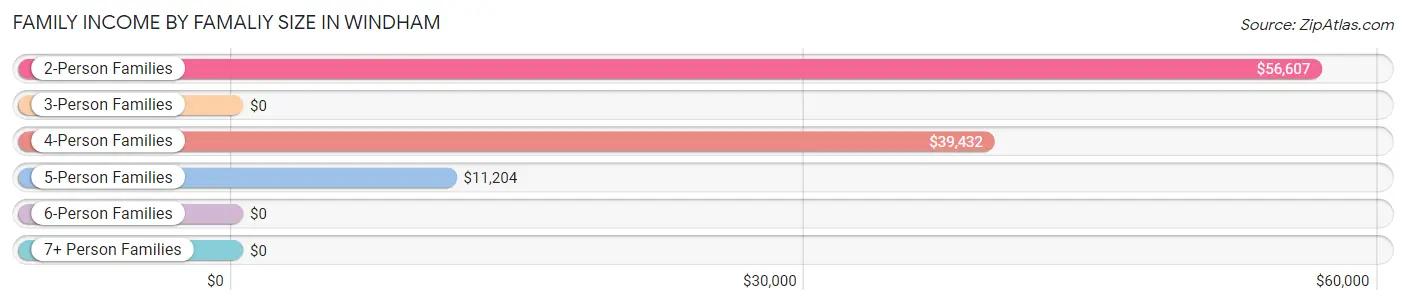
| Income Bracket | # Families | Median Income |
| 2-Person Families | 199 (44.8%) | $56,607 |
| 3-Person Families | 77 (17.3%) | $0 |
| 4-Person Families | 79 (17.8%) | $39,432 |
| 5-Person Families | 76 (17.1%) | $11,204 |
| 6-Person Families | 13 (2.9%) | $0 |
| 7+ Person Families | 0 (0.0%) | $0 |
| Total | 444 (100.0%) | $39,583 |
Family Income by Number of Earners in Windham
The median family income in Windham is $39,583, with families comprising 3+ earners (17) having the highest median family income of $159,583, while families with no earners (170) have the lowest median family income of $11,404, accounting for 3.8% and 38.3% of families, respectively.
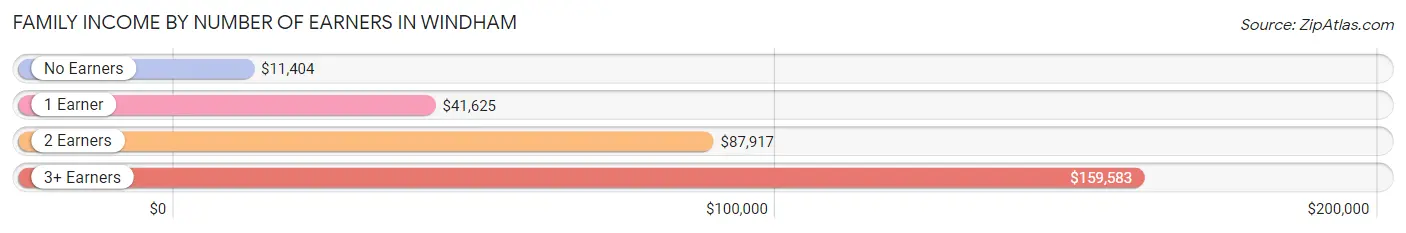
| Number of Earners | # Families | Median Income |
| No Earners | 170 (38.3%) | $11,404 |
| 1 Earner | 113 (25.5%) | $41,625 |
| 2 Earners | 144 (32.4%) | $87,917 |
| 3+ Earners | 17 (3.8%) | $159,583 |
| Total | 444 (100.0%) | $39,583 |
Household Income in Windham
Household Income Brackets in Windham
With 105 households falling in the category, the $50,000 to $74,999 income range is the most frequent in Windham, accounting for 16.8% of all households. In contrast, only 6 households (1.0%) fall into the $200,000+ income bracket, making it the least populous group.
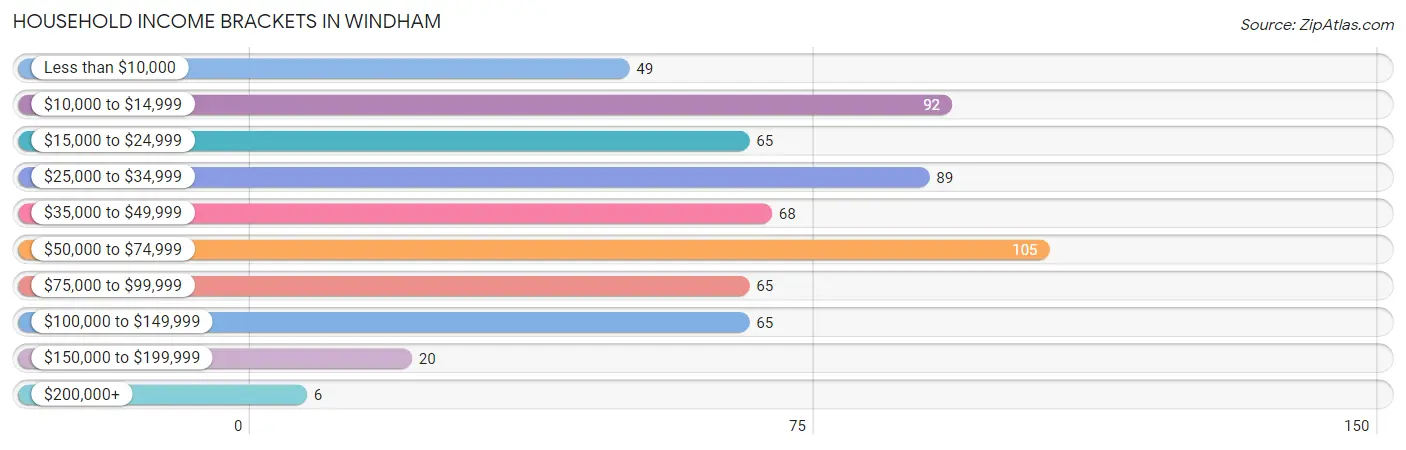
| Income Bracket | # Households | % Households |
| Less than $10,000 | 49 | 7.9% |
| $10,000 to $14,999 | 92 | 14.7% |
| $15,000 to $24,999 | 65 | 10.4% |
| $25,000 to $34,999 | 89 | 14.3% |
| $35,000 to $49,999 | 68 | 10.9% |
| $50,000 to $74,999 | 105 | 16.8% |
| $75,000 to $99,999 | 65 | 10.4% |
| $100,000 to $149,999 | 65 | 10.4% |
| $150,000 to $199,999 | 20 | 3.2% |
| $200,000+ | 6 | 1.0% |
Household Income by Householder Age in Windham
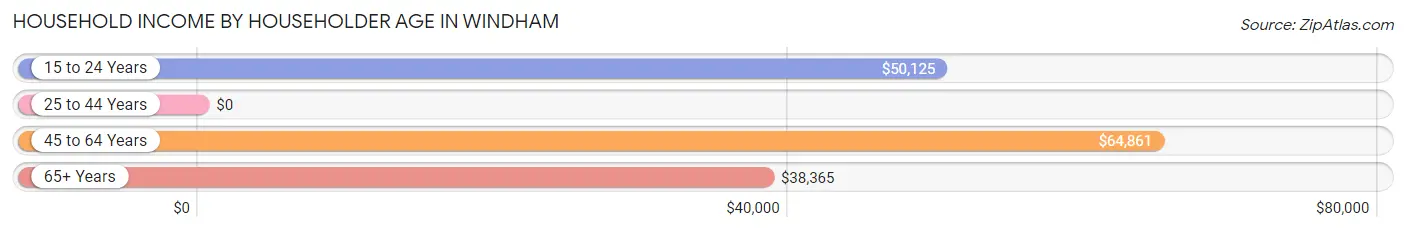
The median household income in Windham is $39,000, with the highest median household income of $64,861 found in the 45 to 64 years age bracket for the primary householder. A total of 237 households (38.0%) fall into this category. Meanwhile, the 25 to 44 years age bracket for the primary householder has the lowest median household income of $0, with 235 households (37.7%) in this group.
| Income Bracket | # Households | Median Income |
| 15 to 24 Years | 25 (4.0%) | $50,125 |
| 25 to 44 Years | 235 (37.7%) | $0 |
| 45 to 64 Years | 237 (38.0%) | $64,861 |
| 65+ Years | 127 (20.3%) | $38,365 |
| Total | 624 (100.0%) | $39,000 |
Poverty in Windham
Income Below Poverty by Sex and Age in Windham
With 32.7% poverty level for males and 40.7% for females among the residents of Windham, under 5 year old males and 15 year old females are the most vulnerable to poverty, with 102 males (82.3%) and 3 females (100.0%) in their respective age groups living below the poverty level.
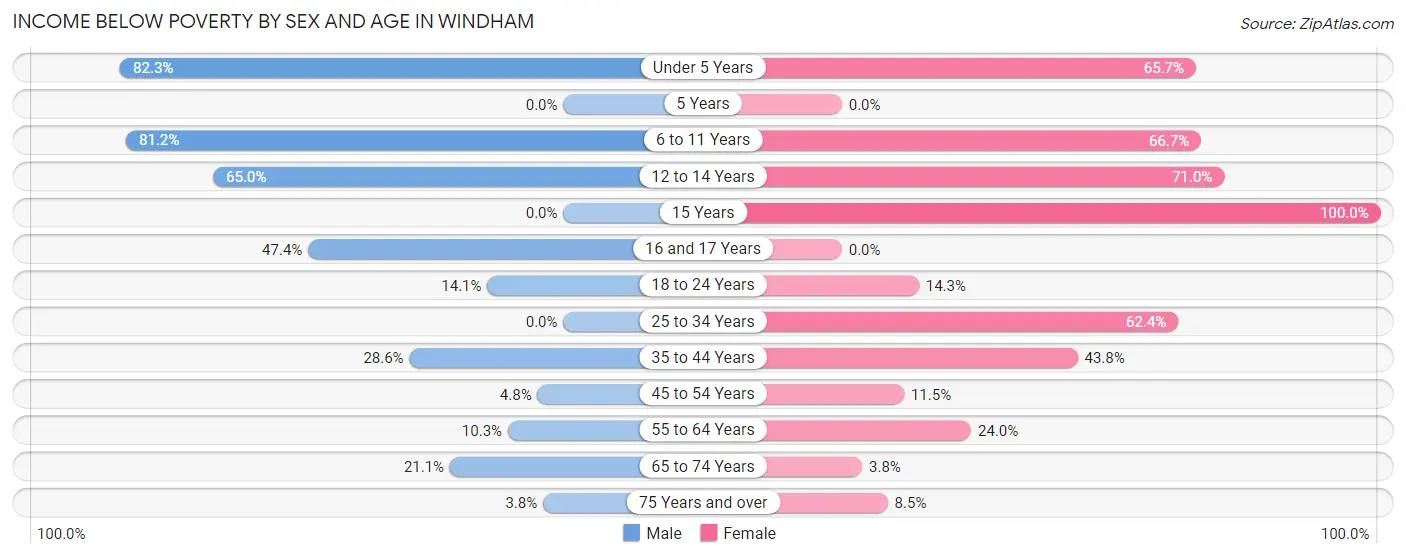
| Age Bracket | Male | Female |
| Under 5 Years | 102 (82.3%) | 92 (65.7%) |
| 5 Years | 0 (0.0%) | 0 (0.0%) |
| 6 to 11 Years | 99 (81.1%) | 58 (66.7%) |
| 12 to 14 Years | 13 (65.0%) | 22 (71.0%) |
| 15 Years | 0 (0.0%) | 3 (100.0%) |
| 16 and 17 Years | 9 (47.4%) | 0 (0.0%) |
| 18 to 24 Years | 11 (14.1%) | 10 (14.3%) |
| 25 to 34 Years | 0 (0.0%) | 108 (62.4%) |
| 35 to 44 Years | 26 (28.6%) | 28 (43.8%) |
| 45 to 54 Years | 6 (4.8%) | 15 (11.5%) |
| 55 to 64 Years | 7 (10.3%) | 24 (24.0%) |
| 65 to 74 Years | 12 (21.0%) | 2 (3.8%) |
| 75 Years and over | 2 (3.8%) | 4 (8.5%) |
| Total | 287 (32.7%) | 366 (40.7%) |
Income Above Poverty by Sex and Age in Windham
According to the poverty statistics in Windham, males aged 15 years and females aged 16 and 17 years are the age groups that are most secure financially, with 100.0% of males and 100.0% of females in these age groups living above the poverty line.
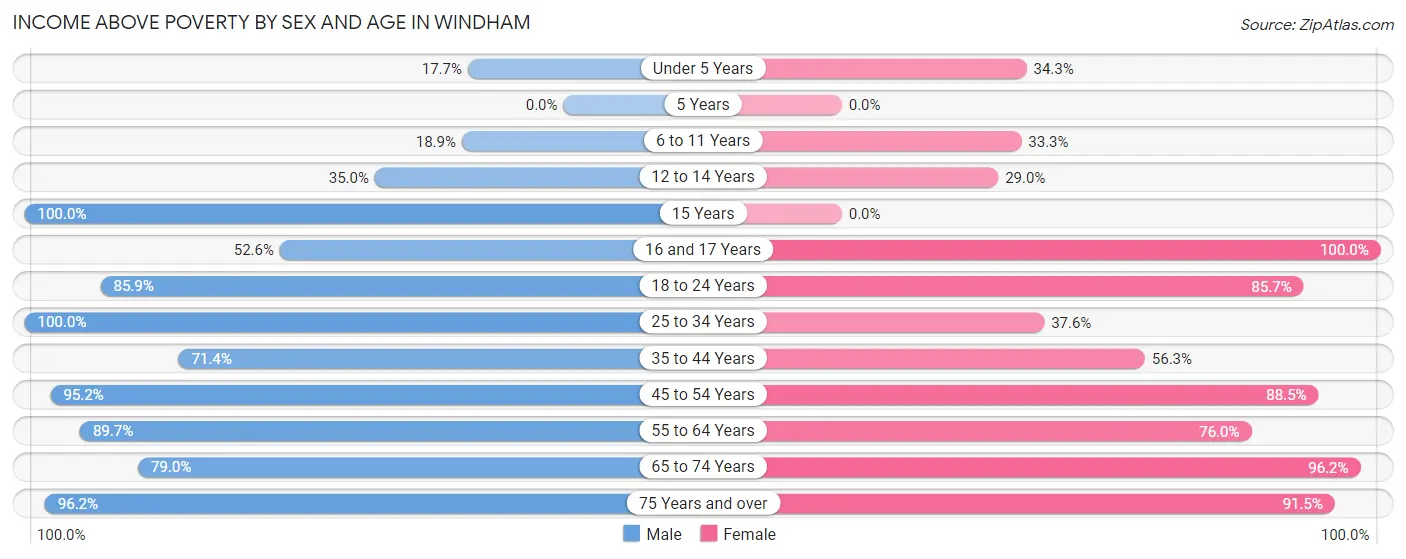
| Age Bracket | Male | Female |
| Under 5 Years | 22 (17.7%) | 48 (34.3%) |
| 5 Years | 0 (0.0%) | 0 (0.0%) |
| 6 to 11 Years | 23 (18.9%) | 29 (33.3%) |
| 12 to 14 Years | 7 (35.0%) | 9 (29.0%) |
| 15 Years | 6 (100.0%) | 0 (0.0%) |
| 16 and 17 Years | 10 (52.6%) | 2 (100.0%) |
| 18 to 24 Years | 67 (85.9%) | 60 (85.7%) |
| 25 to 34 Years | 114 (100.0%) | 65 (37.6%) |
| 35 to 44 Years | 65 (71.4%) | 36 (56.2%) |
| 45 to 54 Years | 119 (95.2%) | 115 (88.5%) |
| 55 to 64 Years | 61 (89.7%) | 76 (76.0%) |
| 65 to 74 Years | 45 (78.9%) | 51 (96.2%) |
| 75 Years and over | 51 (96.2%) | 43 (91.5%) |
| Total | 590 (67.3%) | 534 (59.3%) |
Income Below Poverty Among Married-Couple Families in Windham
The poverty statistics for married-couple families in Windham show that 9.4% or 21 of the total 224 families live below the poverty line. Families with 3 or 4 children have the highest poverty rate of 50.0%, comprising of 7 families. On the other hand, families with 1 or 2 children have the lowest poverty rate of 0.0%, which includes 0 families.
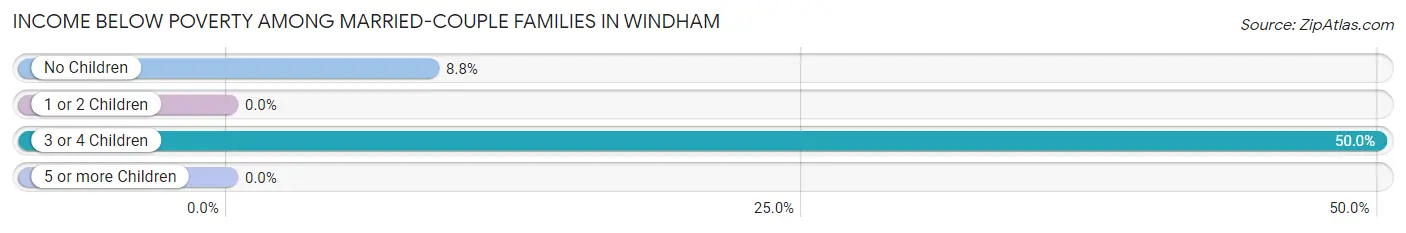
| Children | Above Poverty | Below Poverty |
| No Children | 146 (91.2%) | 14 (8.7%) |
| 1 or 2 Children | 50 (100.0%) | 0 (0.0%) |
| 3 or 4 Children | 7 (50.0%) | 7 (50.0%) |
| 5 or more Children | 0 (0.0%) | 0 (0.0%) |
| Total | 203 (90.6%) | 21 (9.4%) |
Income Below Poverty Among Single-Parent Households in Windham
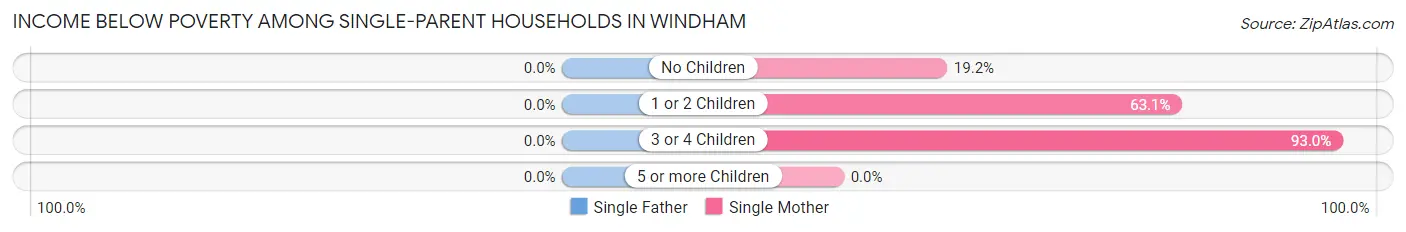
| Children | Single Father | Single Mother |
| No Children | 0 (0.0%) | 5 (19.2%) |
| 1 or 2 Children | 0 (0.0%) | 41 (63.1%) |
| 3 or 4 Children | 0 (0.0%) | 80 (93.0%) |
| 5 or more Children | 0 (0.0%) | 0 (0.0%) |
| Total | 0 (0.0%) | 126 (71.2%) |
Income Below Poverty Among Married-Couple vs Single-Parent Households in Windham
The poverty data for Windham shows that 21 of the married-couple family households (9.4%) and 126 of the single-parent households (57.3%) are living below the poverty level. Within the married-couple family households, those with 3 or 4 children have the highest poverty rate, with 7 households (50.0%) falling below the poverty line. Among the single-parent households, those with 3 or 4 children have the highest poverty rate, with 80 household (93.0%) living below poverty.
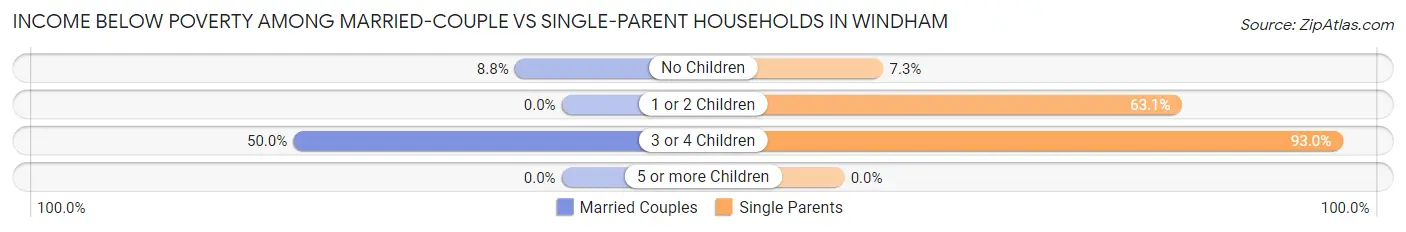
| Children | Married-Couple Families | Single-Parent Households |
| No Children | 14 (8.7%) | 5 (7.2%) |
| 1 or 2 Children | 0 (0.0%) | 41 (63.1%) |
| 3 or 4 Children | 7 (50.0%) | 80 (93.0%) |
| 5 or more Children | 0 (0.0%) | 0 (0.0%) |
| Total | 21 (9.4%) | 126 (57.3%) |
Race in Windham
The most populous races in Windham are White / Caucasian (1,512 | 85.1%), Two or more Races (137 | 7.7%), and Black / African American (128 | 7.2%).
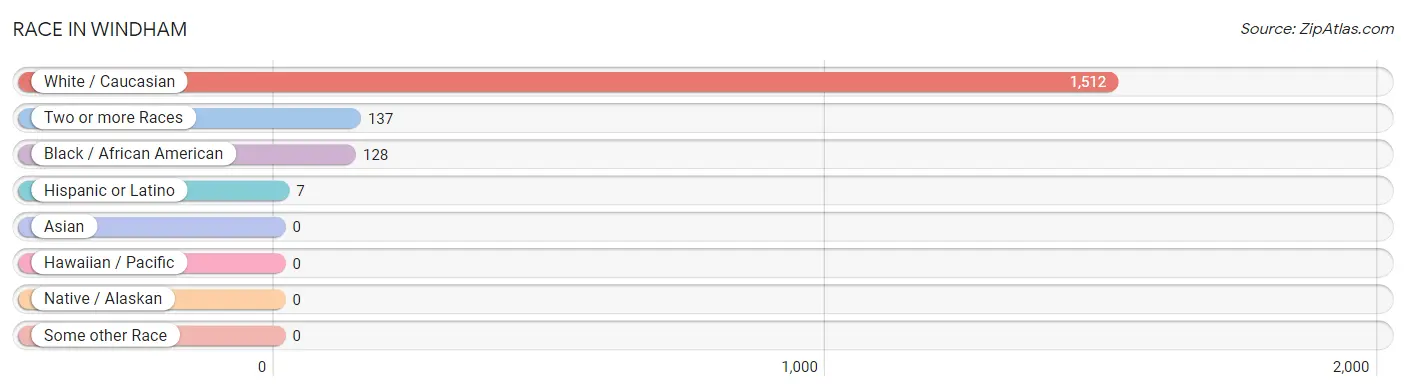
| Race | # Population | % Population |
| Asian | 0 | 0.0% |
| Black / African American | 128 | 7.2% |
| Hawaiian / Pacific | 0 | 0.0% |
| Hispanic or Latino | 7 | 0.4% |
| Native / Alaskan | 0 | 0.0% |
| White / Caucasian | 1,512 | 85.1% |
| Two or more Races | 137 | 7.7% |
| Some other Race | 0 | 0.0% |
| Total | 1,777 | 100.0% |
Ancestry in Windham
The most populous ancestries reported in Windham are German (314 | 17.7%), Irish (243 | 13.7%), Italian (192 | 10.8%), American (171 | 9.6%), and English (87 | 4.9%), together accounting for 56.7% of all Windham residents.
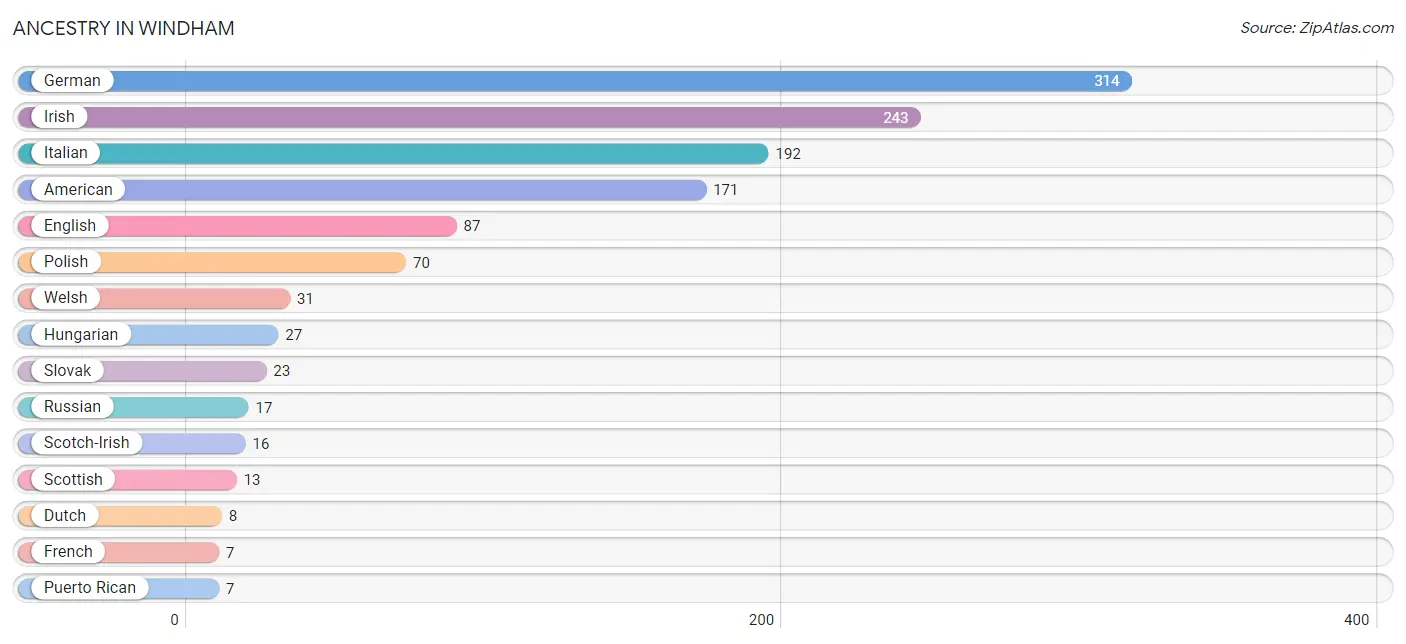
| Ancestry | # Population | % Population |
| American | 171 | 9.6% |
| Belgian | 2 | 0.1% |
| Blackfeet | 3 | 0.2% |
| Choctaw | 1 | 0.1% |
| Croatian | 4 | 0.2% |
| Dutch | 8 | 0.4% |
| English | 87 | 4.9% |
| European | 2 | 0.1% |
| French | 7 | 0.4% |
| German | 314 | 17.7% |
| Greek | 4 | 0.2% |
| Hungarian | 27 | 1.5% |
| Irish | 243 | 13.7% |
| Italian | 192 | 10.8% |
| Norwegian | 3 | 0.2% |
| Polish | 70 | 3.9% |
| Puerto Rican | 7 | 0.4% |
| Romanian | 3 | 0.2% |
| Russian | 17 | 1.0% |
| Scandinavian | 5 | 0.3% |
| Scotch-Irish | 16 | 0.9% |
| Scottish | 13 | 0.7% |
| Slovak | 23 | 1.3% |
| Swedish | 5 | 0.3% |
| Welsh | 31 | 1.7% | View All 25 Rows |
Immigrants in Windham
The most numerous immigrant groups reported in Windham came from Europe (4 | 0.2%), Germany (4 | 0.2%), and Western Europe (4 | 0.2%), together accounting for 0.7% of all Windham residents.
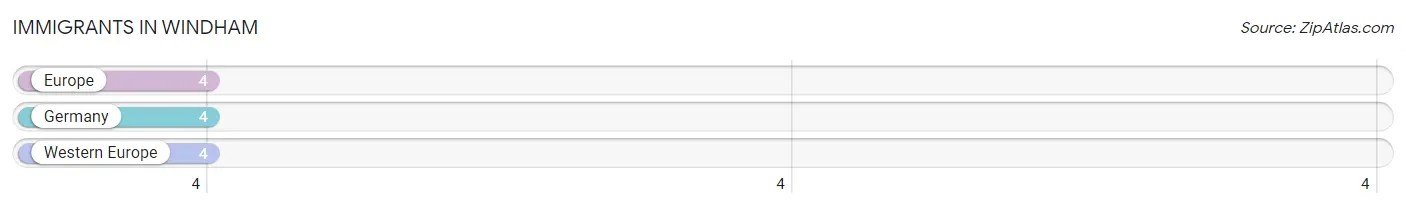
| Immigration Origin | # Population | % Population |
| Europe | 4 | 0.2% |
| Germany | 4 | 0.2% |
| Western Europe | 4 | 0.2% | View All 3 Rows |
Sex and Age in Windham
Sex and Age in Windham
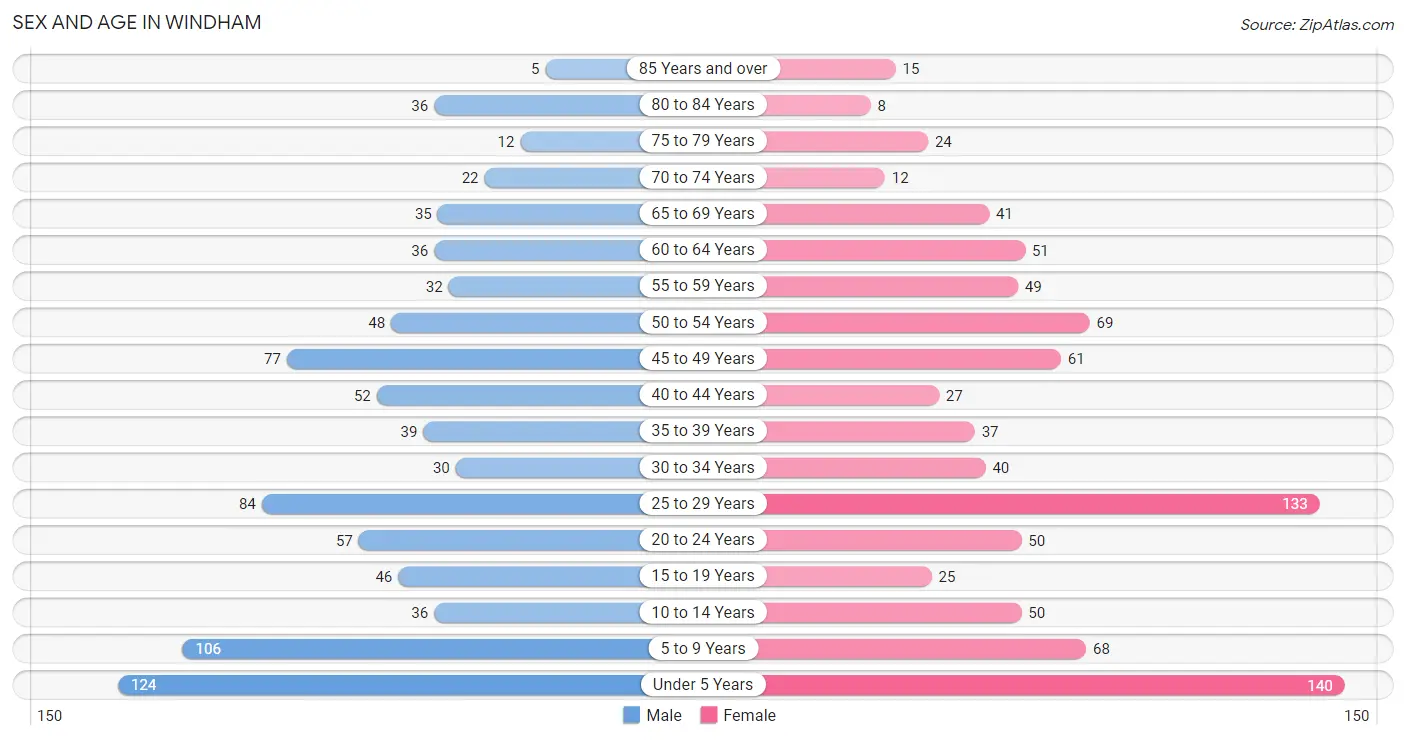
The most populous age groups in Windham are Under 5 Years (124 | 14.1%) for men and Under 5 Years (140 | 15.6%) for women.
| Age Bracket | Male | Female |
| Under 5 Years | 124 (14.1%) | 140 (15.6%) |
| 5 to 9 Years | 106 (12.1%) | 68 (7.6%) |
| 10 to 14 Years | 36 (4.1%) | 50 (5.6%) |
| 15 to 19 Years | 46 (5.2%) | 25 (2.8%) |
| 20 to 24 Years | 57 (6.5%) | 50 (5.6%) |
| 25 to 29 Years | 84 (9.6%) | 133 (14.8%) |
| 30 to 34 Years | 30 (3.4%) | 40 (4.4%) |
| 35 to 39 Years | 39 (4.4%) | 37 (4.1%) |
| 40 to 44 Years | 52 (5.9%) | 27 (3.0%) |
| 45 to 49 Years | 77 (8.8%) | 61 (6.8%) |
| 50 to 54 Years | 48 (5.5%) | 69 (7.7%) |
| 55 to 59 Years | 32 (3.6%) | 49 (5.4%) |
| 60 to 64 Years | 36 (4.1%) | 51 (5.7%) |
| 65 to 69 Years | 35 (4.0%) | 41 (4.6%) |
| 70 to 74 Years | 22 (2.5%) | 12 (1.3%) |
| 75 to 79 Years | 12 (1.4%) | 24 (2.7%) |
| 80 to 84 Years | 36 (4.1%) | 8 (0.9%) |
| 85 Years and over | 5 (0.6%) | 15 (1.7%) |
| Total | 877 (100.0%) | 900 (100.0%) |
Families and Households in Windham
Median Family Size in Windham
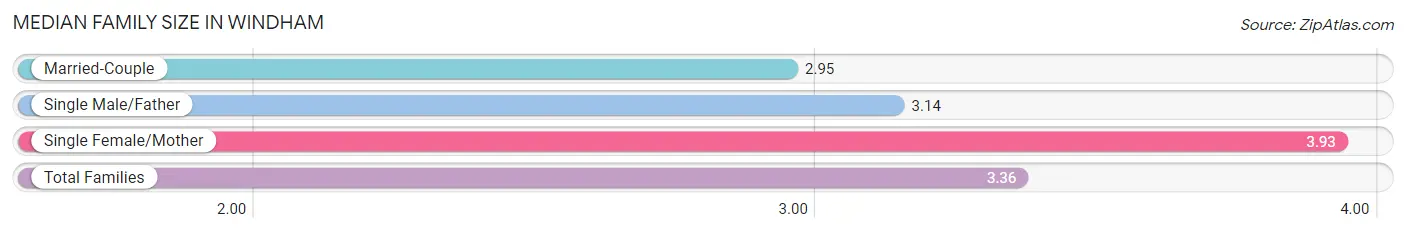
The median family size in Windham is 3.36 persons per family, with single female/mother families (177 | 39.9%) accounting for the largest median family size of 3.93 persons per family. On the other hand, married-couple families (224 | 50.4%) represent the smallest median family size with 2.95 persons per family.
| Family Type | # Families | Family Size |
| Married-Couple | 224 (50.4%) | 2.95 |
| Single Male/Father | 43 (9.7%) | 3.14 |
| Single Female/Mother | 177 (39.9%) | 3.93 |
| Total Families | 444 (100.0%) | 3.36 |
Median Household Size in Windham
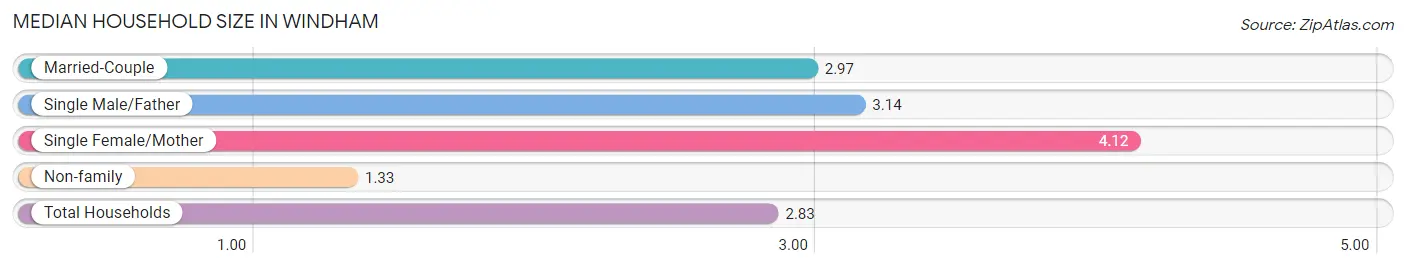
The median household size in Windham is 2.83 persons per household, with single female/mother households (177 | 28.4%) accounting for the largest median household size of 4.12 persons per household. non-family households (180 | 28.8%) represent the smallest median household size with 1.33 persons per household.
| Household Type | # Households | Household Size |
| Married-Couple | 224 (35.9%) | 2.97 |
| Single Male/Father | 43 (6.9%) | 3.14 |
| Single Female/Mother | 177 (28.4%) | 4.12 |
| Non-family | 180 (28.8%) | 1.33 |
| Total Households | 624 (100.0%) | 2.83 |
Household Size by Marriage Status in Windham
Out of a total of 624 households in Windham, 444 (71.2%) are family households, while 180 (28.8%) are nonfamily households. The most numerous type of family households are 2-person households, comprising 182, and the most common type of nonfamily households are 1-person households, comprising 134.
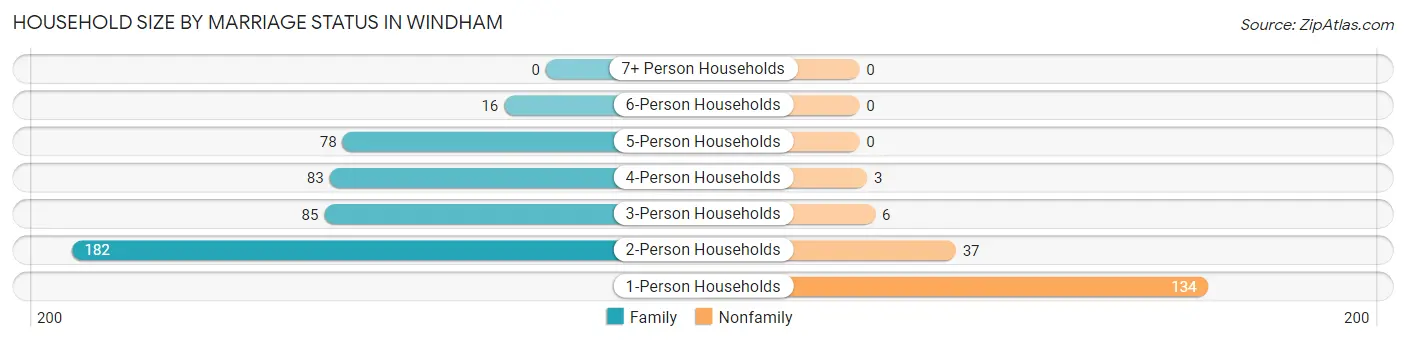
| Household Size | Family Households | Nonfamily Households |
| 1-Person Households | - | 134 (21.5%) |
| 2-Person Households | 182 (29.2%) | 37 (5.9%) |
| 3-Person Households | 85 (13.6%) | 6 (1.0%) |
| 4-Person Households | 83 (13.3%) | 3 (0.5%) |
| 5-Person Households | 78 (12.5%) | 0 (0.0%) |
| 6-Person Households | 16 (2.6%) | 0 (0.0%) |
| 7+ Person Households | 0 (0.0%) | 0 (0.0%) |
| Total | 444 (71.2%) | 180 (28.8%) |
Female Fertility in Windham
Fertility by Age in Windham
Average fertility rate in Windham is 73.0 births per 1,000 women. Women in the age bracket of 20 to 34 years have the highest fertility rate with 94.0 births per 1,000 women. Women in the age bracket of 20 to 34 years acount for 75.0% of all women with births.
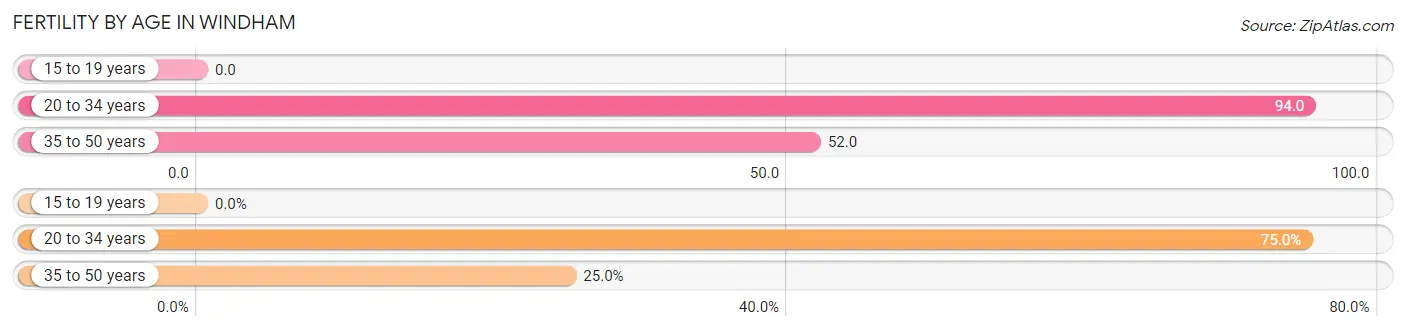
| Age Bracket | Women with Births | Births / 1,000 Women |
| 15 to 19 years | 0 (0.0%) | 0.0 |
| 20 to 34 years | 21 (75.0%) | 94.0 |
| 35 to 50 years | 7 (25.0%) | 52.0 |
| Total | 28 (100.0%) | 73.0 |
Fertility by Age by Marriage Status in Windham
78.6% of women with births (28) in Windham are married. The highest percentage of unmarried women with births falls into 20 to 34 years age bracket with 28.6% of them unmarried at the time of birth, while the lowest percentage of unmarried women with births belong to 35 to 50 years age bracket with 0.0% of them unmarried.
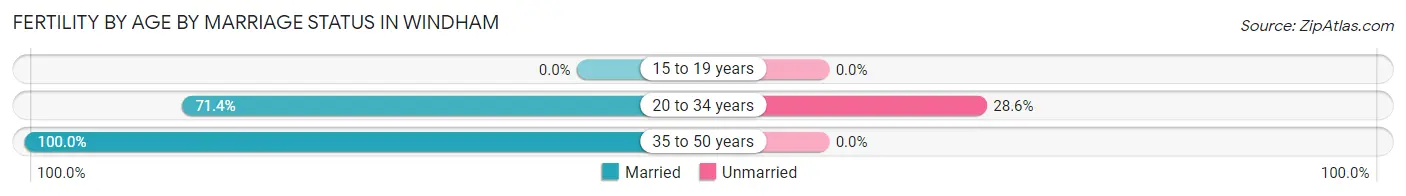
| Age Bracket | Married | Unmarried |
| 15 to 19 years | 0 (0.0%) | 0 (0.0%) |
| 20 to 34 years | 15 (71.4%) | 6 (28.6%) |
| 35 to 50 years | 7 (100.0%) | 0 (0.0%) |
| Total | 22 (78.6%) | 6 (21.4%) |
Fertility by Education in Windham
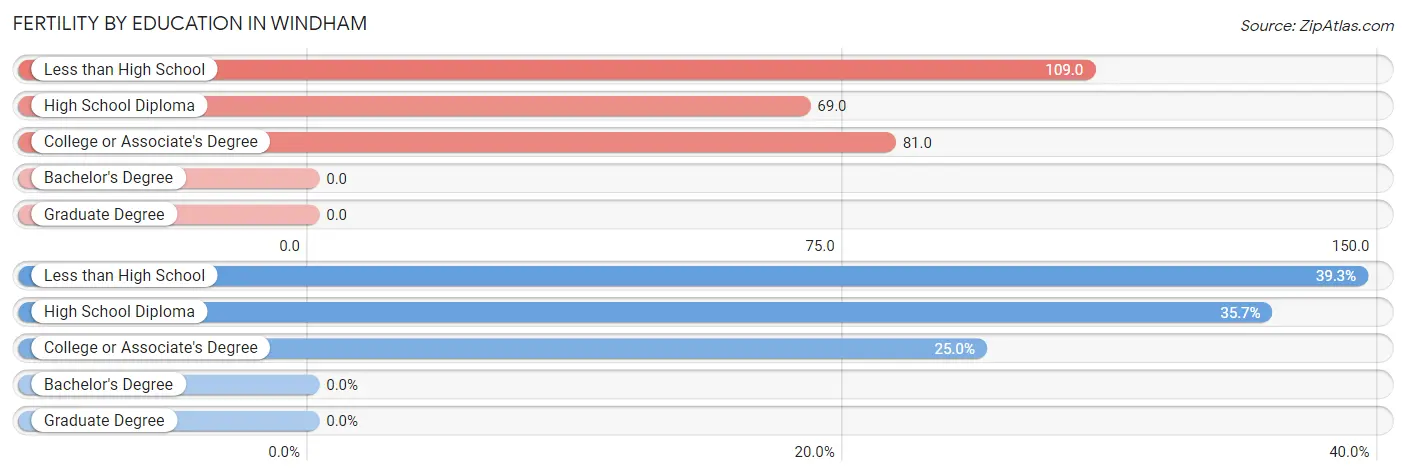
| Educational Attainment | Women with Births | Births / 1,000 Women |
| Less than High School | 11 (39.3%) | 109.0 |
| High School Diploma | 10 (35.7%) | 69.0 |
| College or Associate's Degree | 7 (25.0%) | 81.0 |
| Bachelor's Degree | 0 (0.0%) | 0.0 |
| Graduate Degree | 0 (0.0%) | 0.0 |
| Total | 28 (100.0%) | 73.0 |
Fertility by Education by Marriage Status in Windham
21.4% of women with births in Windham are unmarried. Women with the educational attainment of less than high school are most likely to be married with 100.0% of them married at childbirth, while women with the educational attainment of high school diploma are least likely to be married with 60.0% of them unmarried at childbirth.
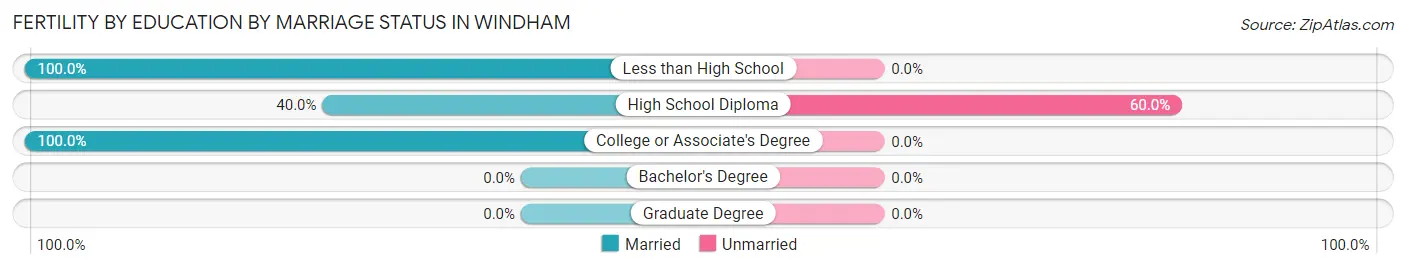
| Educational Attainment | Married | Unmarried |
| Less than High School | 11 (100.0%) | 0 (0.0%) |
| High School Diploma | 4 (40.0%) | 6 (60.0%) |
| College or Associate's Degree | 7 (100.0%) | 0 (0.0%) |
| Bachelor's Degree | 0 (0.0%) | 0 (0.0%) |
| Graduate Degree | 0 (0.0%) | 0 (0.0%) |
| Total | 22 (78.6%) | 6 (21.4%) |
Employment Characteristics in Windham
Employment by Class of Employer in Windham
Among the 587 employed individuals in Windham, private company employees (434 | 73.9%), not-for-profit organizations (50 | 8.5%), and local government employees (47 | 8.0%) make up the most common classes of employment.
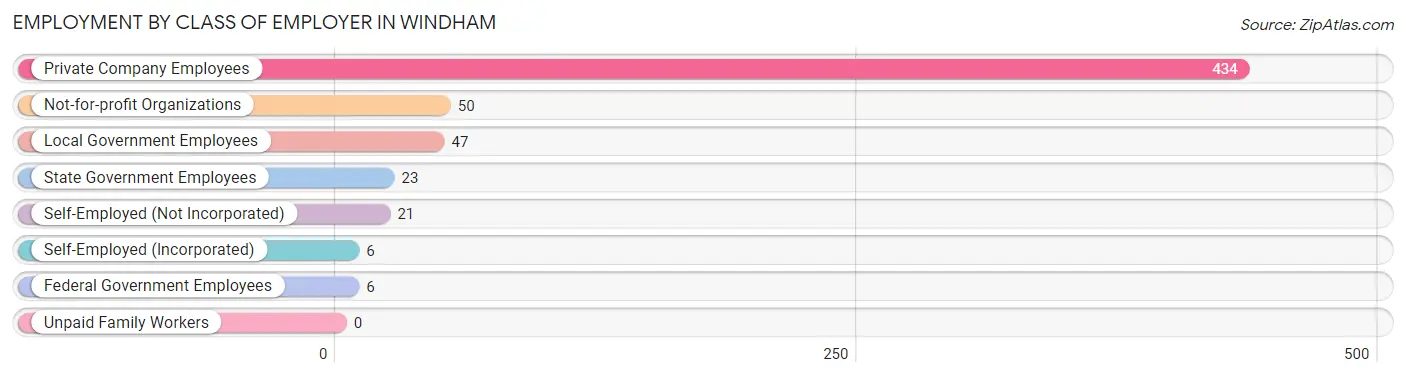
| Employer Class | # Employees | % Employees |
| Private Company Employees | 434 | 73.9% |
| Self-Employed (Incorporated) | 6 | 1.0% |
| Self-Employed (Not Incorporated) | 21 | 3.6% |
| Not-for-profit Organizations | 50 | 8.5% |
| Local Government Employees | 47 | 8.0% |
| State Government Employees | 23 | 3.9% |
| Federal Government Employees | 6 | 1.0% |
| Unpaid Family Workers | 0 | 0.0% |
| Total | 587 | 100.0% |
Employment Status by Age in Windham
According to the labor force statistics for Windham, out of the total population over 16 years of age (1,244), 55.1% or 685 individuals are in the labor force, with 13.9% or 95 of them unemployed. The age group with the highest labor force participation rate is 20 to 24 years, with 81.3% or 87 individuals in the labor force. Within the labor force, the 16 to 19 years age range has the highest percentage of unemployed individuals, with 35.0% or 7 of them being unemployed.
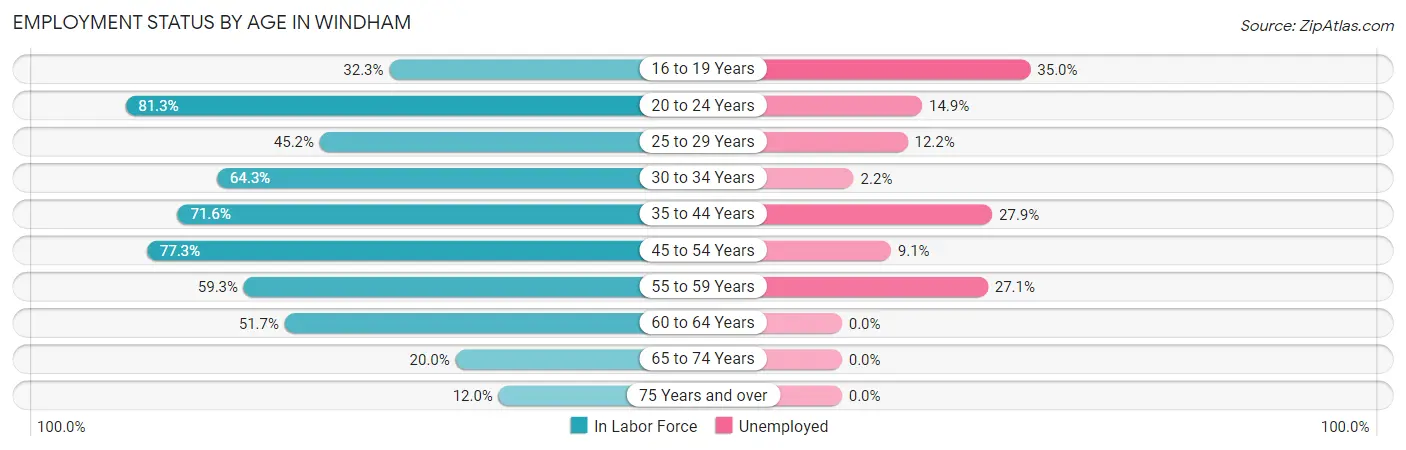
| Age Bracket | In Labor Force | Unemployed |
| 16 to 19 Years | 20 (32.3%) | 7 (35.0%) |
| 20 to 24 Years | 87 (81.3%) | 13 (14.9%) |
| 25 to 29 Years | 98 (45.2%) | 12 (12.2%) |
| 30 to 34 Years | 45 (64.3%) | 1 (2.2%) |
| 35 to 44 Years | 111 (71.6%) | 31 (27.9%) |
| 45 to 54 Years | 197 (77.3%) | 18 (9.1%) |
| 55 to 59 Years | 48 (59.3%) | 13 (27.1%) |
| 60 to 64 Years | 45 (51.7%) | 0 (0.0%) |
| 65 to 74 Years | 22 (20.0%) | 0 (0.0%) |
| 75 Years and over | 12 (12.0%) | 0 (0.0%) |
| Total | 685 (55.1%) | 95 (13.9%) |
Employment Status by Educational Attainment in Windham
According to labor force statistics for Windham, 62.9% of individuals (544) out of the total population between 25 and 64 years of age (865) are in the labor force, with 13.8% or 75 of them being unemployed. The group with the highest labor force participation rate are those with the educational attainment of bachelor's degree or higher, with 87.7% or 50 individuals in the labor force. Within the labor force, individuals with less than high school education have the highest percentage of unemployment, with 22.2% or 2 of them being unemployed.
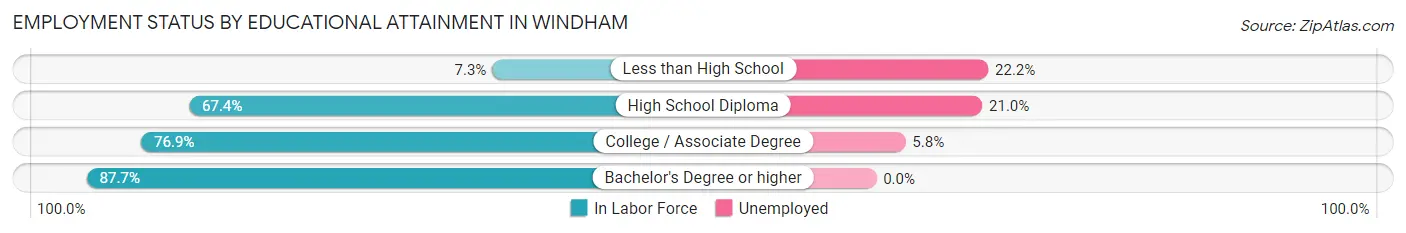
| Educational Attainment | In Labor Force | Unemployed |
| Less than High School | 9 (7.3%) | 27 (22.2%) |
| High School Diploma | 295 (67.4%) | 92 (21.0%) |
| College / Associate Degree | 190 (76.9%) | 14 (5.8%) |
| Bachelor's Degree or higher | 50 (87.7%) | 0 (0.0%) |
| Total | 544 (62.9%) | 119 (13.8%) |
Employment Occupations by Sex in Windham
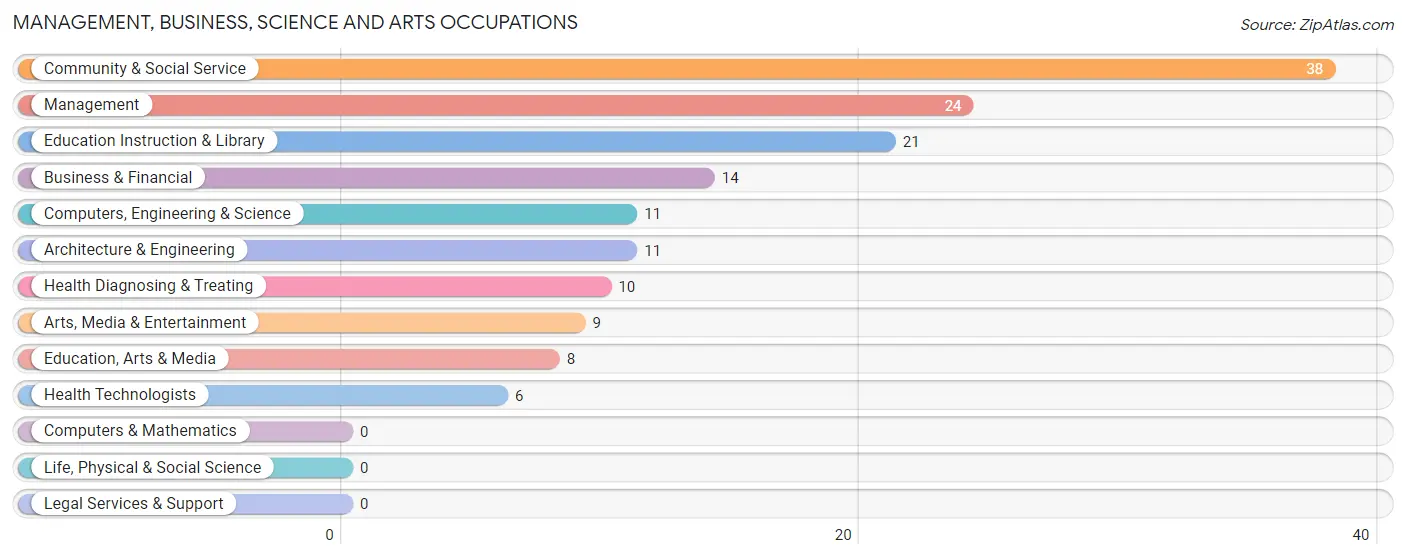
Management, Business, Science and Arts Occupations
The most common Management, Business, Science and Arts occupations in Windham are Community & Social Service (38 | 6.4%), Management (24 | 4.1%), Education Instruction & Library (21 | 3.6%), Business & Financial (14 | 2.4%), and Computers, Engineering & Science (11 | 1.9%).
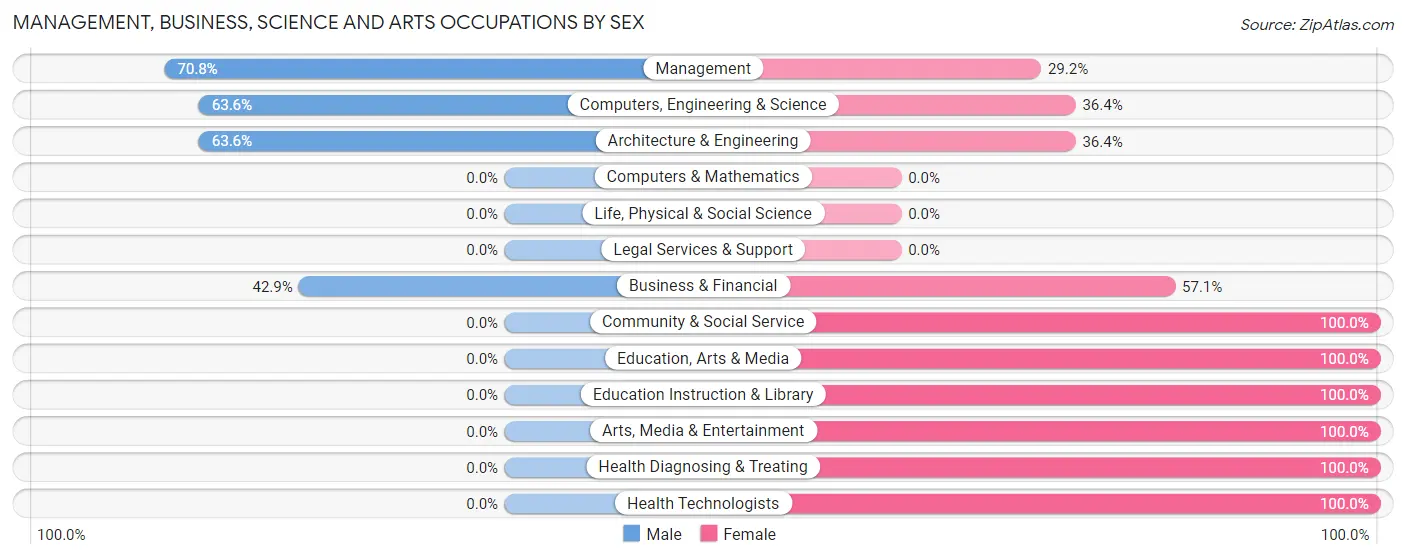
Management, Business, Science and Arts Occupations by Sex
Within the Management, Business, Science and Arts occupations in Windham, the most male-oriented occupations are Management (70.8%), Computers, Engineering & Science (63.6%), and Architecture & Engineering (63.6%), while the most female-oriented occupations are Community & Social Service (100.0%), Education, Arts & Media (100.0%), and Education Instruction & Library (100.0%).
| Occupation | Male | Female |
| Management | 17 (70.8%) | 7 (29.2%) |
| Business & Financial | 6 (42.9%) | 8 (57.1%) |
| Computers, Engineering & Science | 7 (63.6%) | 4 (36.4%) |
| Computers & Mathematics | 0 (0.0%) | 0 (0.0%) |
| Architecture & Engineering | 7 (63.6%) | 4 (36.4%) |
| Life, Physical & Social Science | 0 (0.0%) | 0 (0.0%) |
| Community & Social Service | 0 (0.0%) | 38 (100.0%) |
| Education, Arts & Media | 0 (0.0%) | 8 (100.0%) |
| Legal Services & Support | 0 (0.0%) | 0 (0.0%) |
| Education Instruction & Library | 0 (0.0%) | 21 (100.0%) |
| Arts, Media & Entertainment | 0 (0.0%) | 9 (100.0%) |
| Health Diagnosing & Treating | 0 (0.0%) | 10 (100.0%) |
| Health Technologists | 0 (0.0%) | 6 (100.0%) |
| Total (Category) | 30 (30.9%) | 67 (69.1%) |
| Total (Overall) | 324 (54.9%) | 266 (45.1%) |
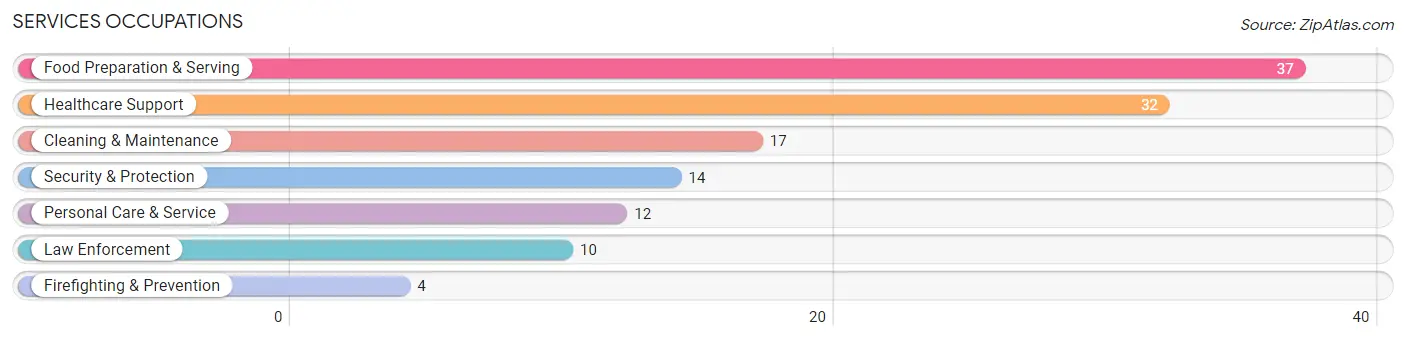
Services Occupations
The most common Services occupations in Windham are Food Preparation & Serving (37 | 6.3%), Healthcare Support (32 | 5.4%), Cleaning & Maintenance (17 | 2.9%), Security & Protection (14 | 2.4%), and Personal Care & Service (12 | 2.0%).
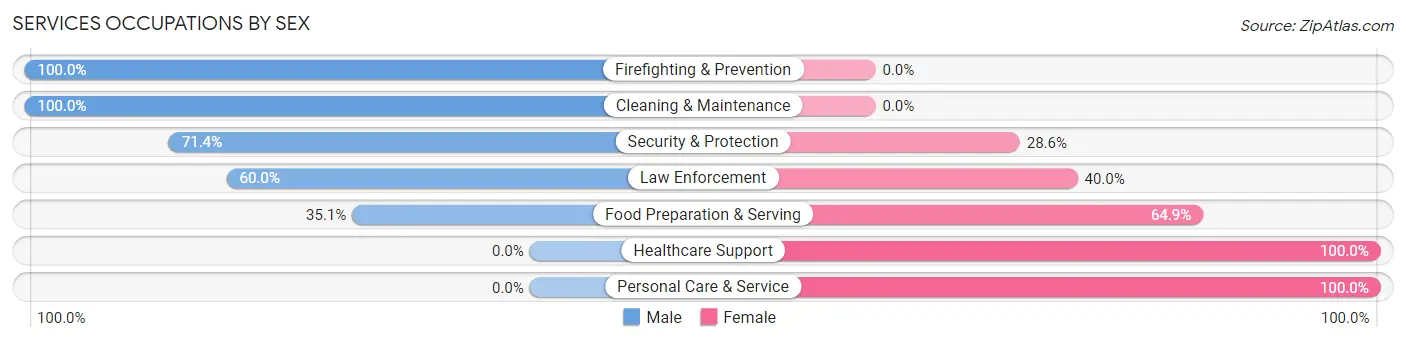
Services Occupations by Sex
Within the Services occupations in Windham, the most male-oriented occupations are Firefighting & Prevention (100.0%), Cleaning & Maintenance (100.0%), and Security & Protection (71.4%), while the most female-oriented occupations are Healthcare Support (100.0%), Personal Care & Service (100.0%), and Food Preparation & Serving (64.9%).
| Occupation | Male | Female |
| Healthcare Support | 0 (0.0%) | 32 (100.0%) |
| Security & Protection | 10 (71.4%) | 4 (28.6%) |
| Firefighting & Prevention | 4 (100.0%) | 0 (0.0%) |
| Law Enforcement | 6 (60.0%) | 4 (40.0%) |
| Food Preparation & Serving | 13 (35.1%) | 24 (64.9%) |
| Cleaning & Maintenance | 17 (100.0%) | 0 (0.0%) |
| Personal Care & Service | 0 (0.0%) | 12 (100.0%) |
| Total (Category) | 40 (35.7%) | 72 (64.3%) |
| Total (Overall) | 324 (54.9%) | 266 (45.1%) |
Sales and Office Occupations
The most common Sales and Office occupations in Windham are Office & Administration (77 | 13.1%), and Sales & Related (28 | 4.8%).
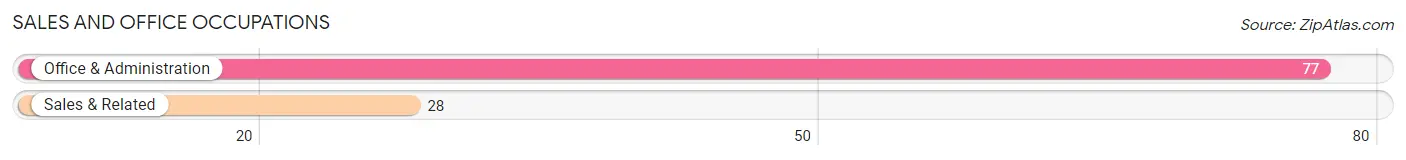
Sales and Office Occupations by Sex
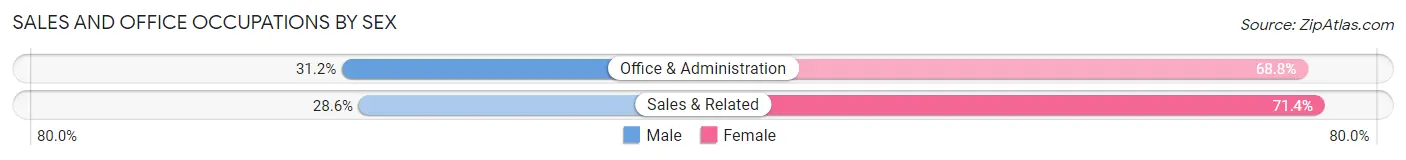
| Occupation | Male | Female |
| Sales & Related | 8 (28.6%) | 20 (71.4%) |
| Office & Administration | 24 (31.2%) | 53 (68.8%) |
| Total (Category) | 32 (30.5%) | 73 (69.5%) |
| Total (Overall) | 324 (54.9%) | 266 (45.1%) |
Natural Resources, Construction and Maintenance Occupations
The most common Natural Resources, Construction and Maintenance occupations in Windham are Construction & Extraction (23 | 3.9%), and Installation, Maintenance & Repair (15 | 2.5%).
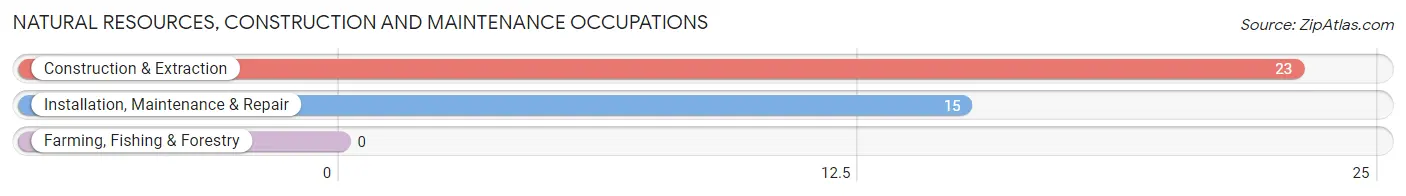
Natural Resources, Construction and Maintenance Occupations by Sex
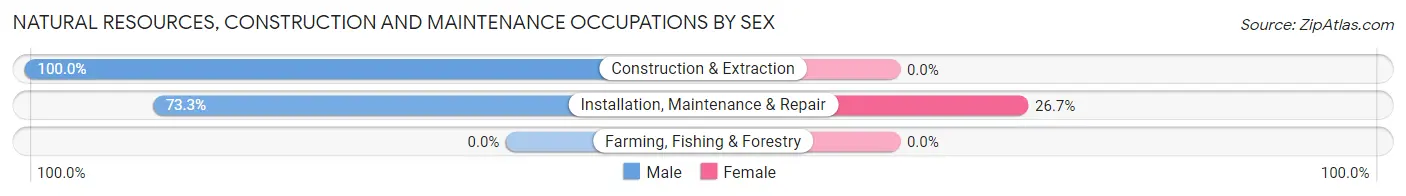
| Occupation | Male | Female |
| Farming, Fishing & Forestry | 0 (0.0%) | 0 (0.0%) |
| Construction & Extraction | 23 (100.0%) | 0 (0.0%) |
| Installation, Maintenance & Repair | 11 (73.3%) | 4 (26.7%) |
| Total (Category) | 34 (89.5%) | 4 (10.5%) |
| Total (Overall) | 324 (54.9%) | 266 (45.1%) |
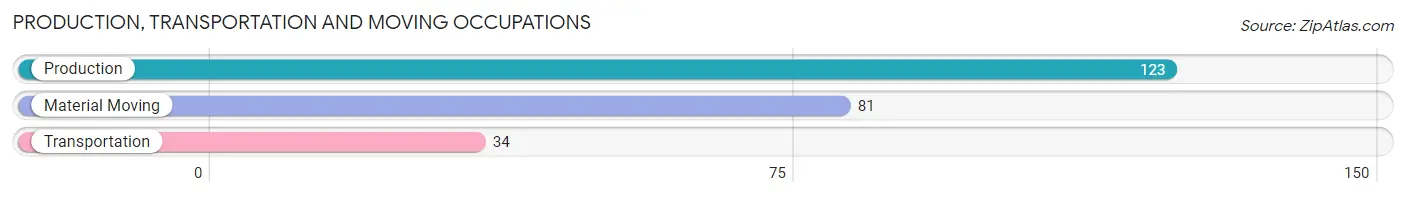
Production, Transportation and Moving Occupations
The most common Production, Transportation and Moving occupations in Windham are Production (123 | 20.8%), Material Moving (81 | 13.7%), and Transportation (34 | 5.8%).
Production, Transportation and Moving Occupations by Sex
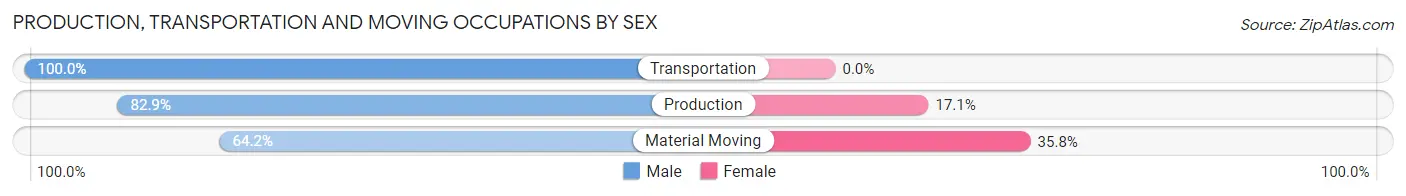
| Occupation | Male | Female |
| Production | 102 (82.9%) | 21 (17.1%) |
| Transportation | 34 (100.0%) | 0 (0.0%) |
| Material Moving | 52 (64.2%) | 29 (35.8%) |
| Total (Category) | 188 (79.0%) | 50 (21.0%) |
| Total (Overall) | 324 (54.9%) | 266 (45.1%) |
Employment Industries by Sex in Windham
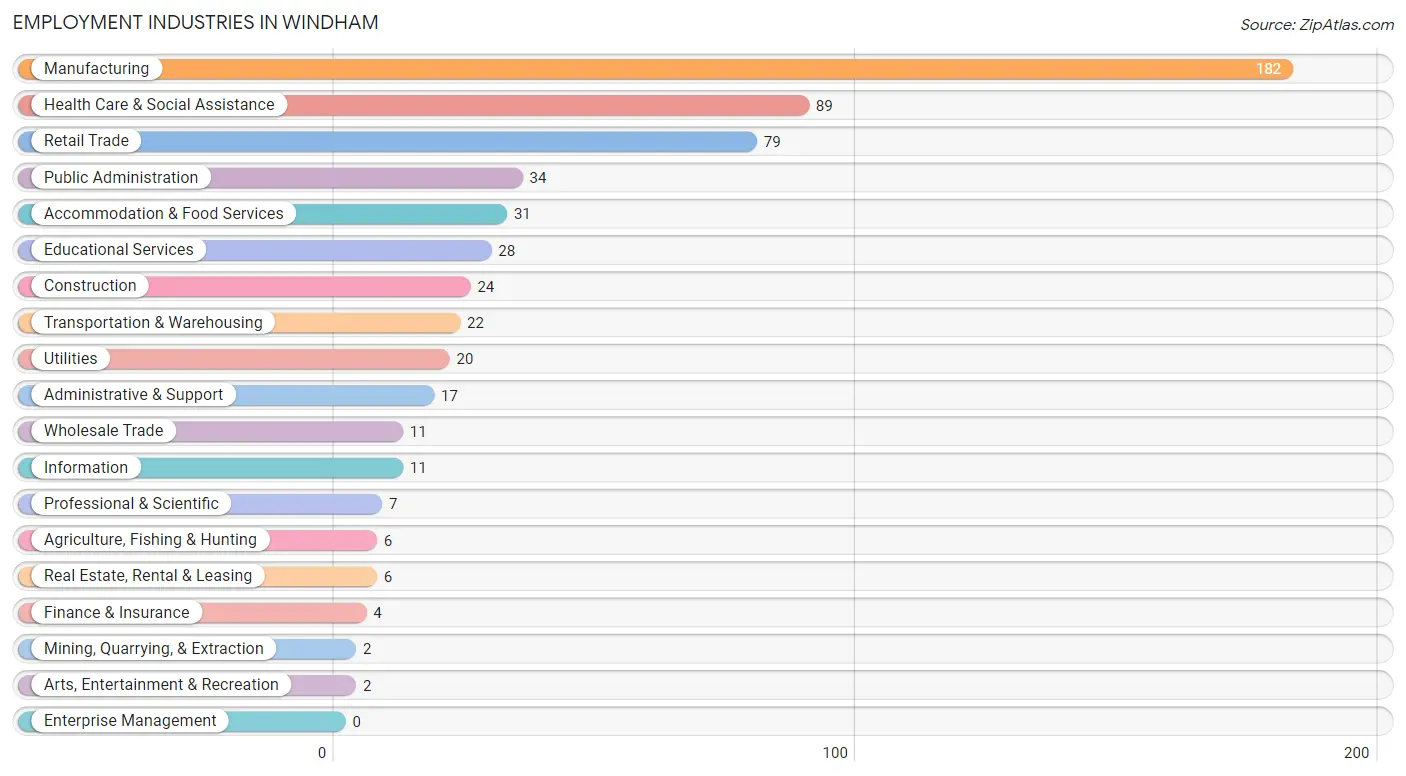
Employment Industries in Windham
The major employment industries in Windham include Manufacturing (182 | 30.8%), Health Care & Social Assistance (89 | 15.1%), Retail Trade (79 | 13.4%), Public Administration (34 | 5.8%), and Accommodation & Food Services (31 | 5.2%).
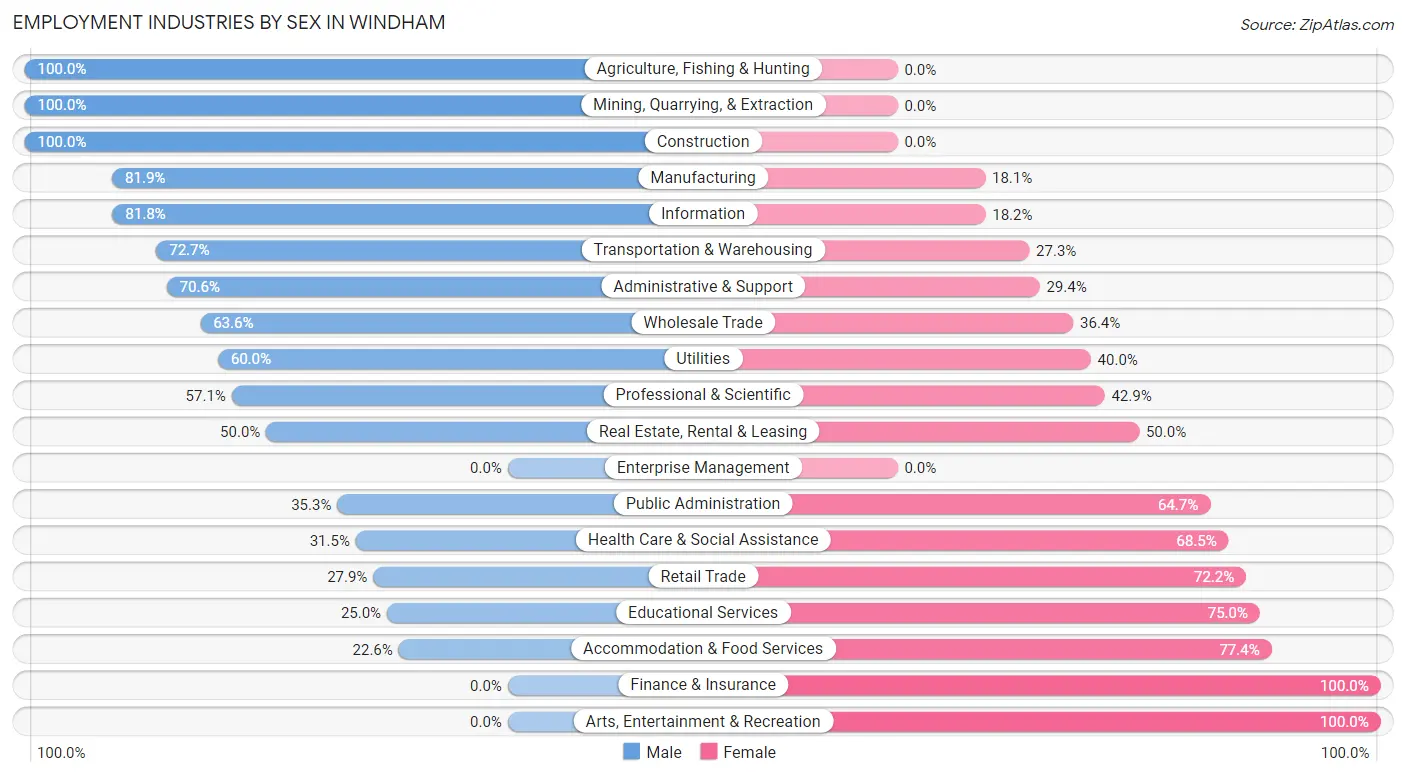
Employment Industries by Sex in Windham
The Windham industries that see more men than women are Agriculture, Fishing & Hunting (100.0%), Mining, Quarrying, & Extraction (100.0%), and Construction (100.0%), whereas the industries that tend to have a higher number of women are Finance & Insurance (100.0%), Arts, Entertainment & Recreation (100.0%), and Accommodation & Food Services (77.4%).
| Industry | Male | Female |
| Agriculture, Fishing & Hunting | 6 (100.0%) | 0 (0.0%) |
| Mining, Quarrying, & Extraction | 2 (100.0%) | 0 (0.0%) |
| Construction | 24 (100.0%) | 0 (0.0%) |
| Manufacturing | 149 (81.9%) | 33 (18.1%) |
| Wholesale Trade | 7 (63.6%) | 4 (36.4%) |
| Retail Trade | 22 (27.9%) | 57 (72.2%) |
| Transportation & Warehousing | 16 (72.7%) | 6 (27.3%) |
| Utilities | 12 (60.0%) | 8 (40.0%) |
| Information | 9 (81.8%) | 2 (18.2%) |
| Finance & Insurance | 0 (0.0%) | 4 (100.0%) |
| Real Estate, Rental & Leasing | 3 (50.0%) | 3 (50.0%) |
| Professional & Scientific | 4 (57.1%) | 3 (42.9%) |
| Enterprise Management | 0 (0.0%) | 0 (0.0%) |
| Administrative & Support | 12 (70.6%) | 5 (29.4%) |
| Educational Services | 7 (25.0%) | 21 (75.0%) |
| Health Care & Social Assistance | 28 (31.5%) | 61 (68.5%) |
| Arts, Entertainment & Recreation | 0 (0.0%) | 2 (100.0%) |
| Accommodation & Food Services | 7 (22.6%) | 24 (77.4%) |
| Public Administration | 12 (35.3%) | 22 (64.7%) |
| Total | 324 (54.9%) | 266 (45.1%) |
Education in Windham
School Enrollment in Windham
The most common levels of schooling among the 370 students in Windham are elementary school (187 | 50.5%), high school (75 | 20.3%), and middle school (41 | 11.1%).
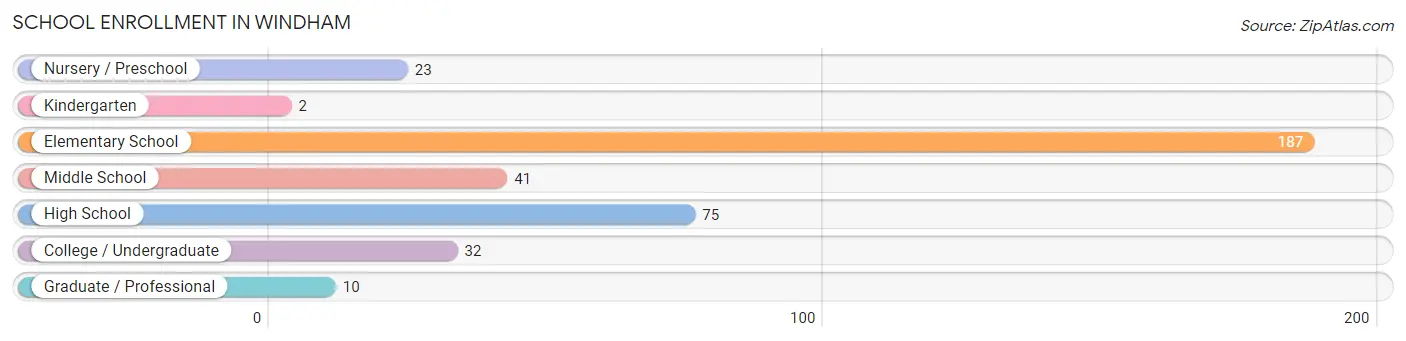
| School Level | # Students | % Students |
| Nursery / Preschool | 23 | 6.2% |
| Kindergarten | 2 | 0.5% |
| Elementary School | 187 | 50.5% |
| Middle School | 41 | 11.1% |
| High School | 75 | 20.3% |
| College / Undergraduate | 32 | 8.6% |
| Graduate / Professional | 10 | 2.7% |
| Total | 370 | 100.0% |
School Enrollment by Age by Funding Source in Windham
Out of a total of 370 students who are enrolled in schools in Windham, 31 (8.4%) attend a private institution, while the remaining 339 (91.6%) are enrolled in public schools. The age group of 20 to 24 year olds has the highest likelihood of being enrolled in private schools, with 14 (66.7% in the age bracket) enrolled. Conversely, the age group of 3 to 4 year olds has the lowest likelihood of being enrolled in a private school, with 25 (100.0% in the age bracket) attending a public institution.
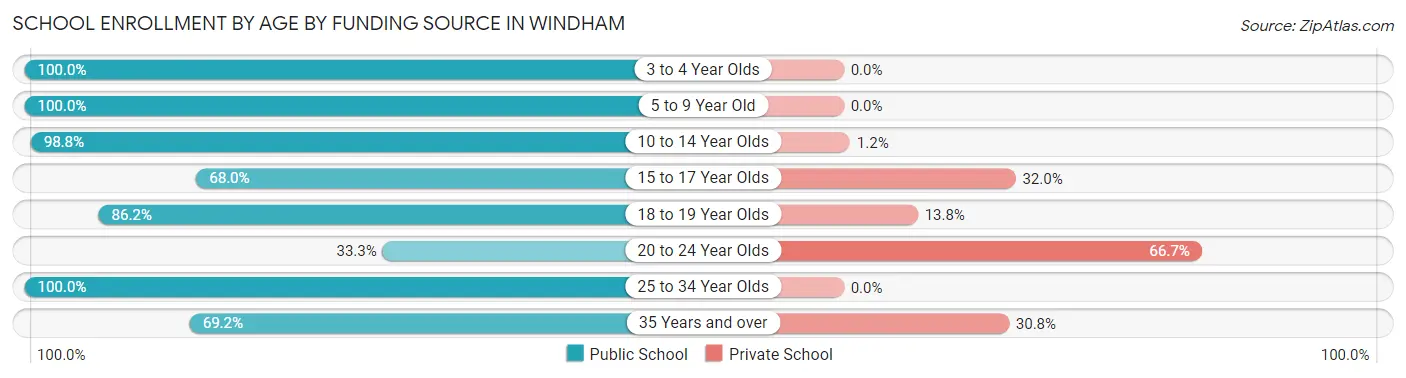
| Age Bracket | Public School | Private School |
| 3 to 4 Year Olds | 25 (100.0%) | 0 (0.0%) |
| 5 to 9 Year Old | 169 (100.0%) | 0 (0.0%) |
| 10 to 14 Year Olds | 85 (98.8%) | 1 (1.2%) |
| 15 to 17 Year Olds | 17 (68.0%) | 8 (32.0%) |
| 18 to 19 Year Olds | 25 (86.2%) | 4 (13.8%) |
| 20 to 24 Year Olds | 7 (33.3%) | 14 (66.7%) |
| 25 to 34 Year Olds | 2 (100.0%) | 0 (0.0%) |
| 35 Years and over | 9 (69.2%) | 4 (30.8%) |
| Total | 339 (91.6%) | 31 (8.4%) |
Educational Attainment by Field of Study in Windham
Business (20 | 22.7%), education (10 | 11.4%), physical & health sciences (9 | 10.2%), science & technology (9 | 10.2%), and communications (9 | 10.2%) are the most common fields of study among 88 individuals in Windham who have obtained a bachelor's degree or higher.
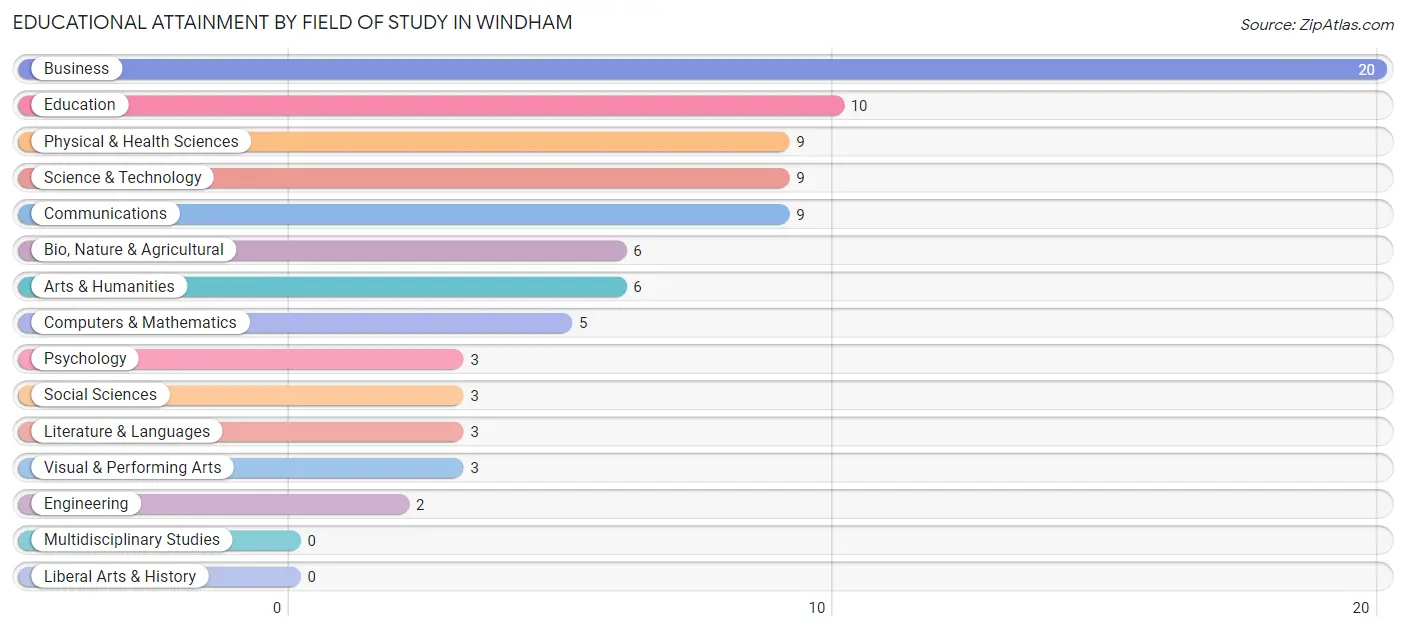
| Field of Study | # Graduates | % Graduates |
| Computers & Mathematics | 5 | 5.7% |
| Bio, Nature & Agricultural | 6 | 6.8% |
| Physical & Health Sciences | 9 | 10.2% |
| Psychology | 3 | 3.4% |
| Social Sciences | 3 | 3.4% |
| Engineering | 2 | 2.3% |
| Multidisciplinary Studies | 0 | 0.0% |
| Science & Technology | 9 | 10.2% |
| Business | 20 | 22.7% |
| Education | 10 | 11.4% |
| Literature & Languages | 3 | 3.4% |
| Liberal Arts & History | 0 | 0.0% |
| Visual & Performing Arts | 3 | 3.4% |
| Communications | 9 | 10.2% |
| Arts & Humanities | 6 | 6.8% |
| Total | 88 | 100.0% |
Transportation & Commute in Windham
Vehicle Availability by Sex in Windham
The most prevalent vehicle ownership categories in Windham are males with 2 vehicles (143, accounting for 44.6%) and females with 2 vehicles (125, making up 53.8%).
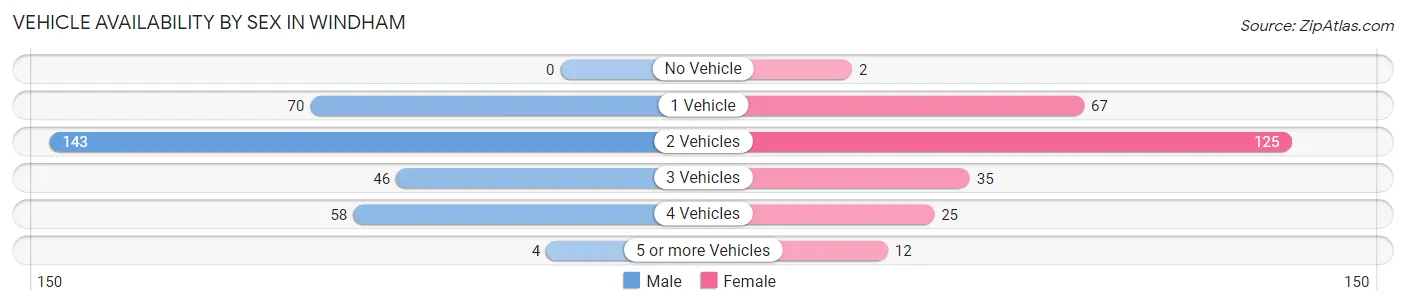
| Vehicles Available | Male | Female |
| No Vehicle | 0 (0.0%) | 2 (0.7%) |
| 1 Vehicle | 70 (21.8%) | 67 (25.2%) |
| 2 Vehicles | 143 (44.6%) | 125 (47.0%) |
| 3 Vehicles | 46 (14.3%) | 35 (13.2%) |
| 4 Vehicles | 58 (18.1%) | 25 (9.4%) |
| 5 or more Vehicles | 4 (1.3%) | 12 (4.5%) |
| Total | 321 (100.0%) | 266 (100.0%) |
Commute Time in Windham
The most frequently occuring commute durations in Windham are 45 to 59 minutes (103 commuters, 17.9%), 5 to 9 minutes (76 commuters, 13.2%), and 20 to 24 minutes (75 commuters, 13.0%).
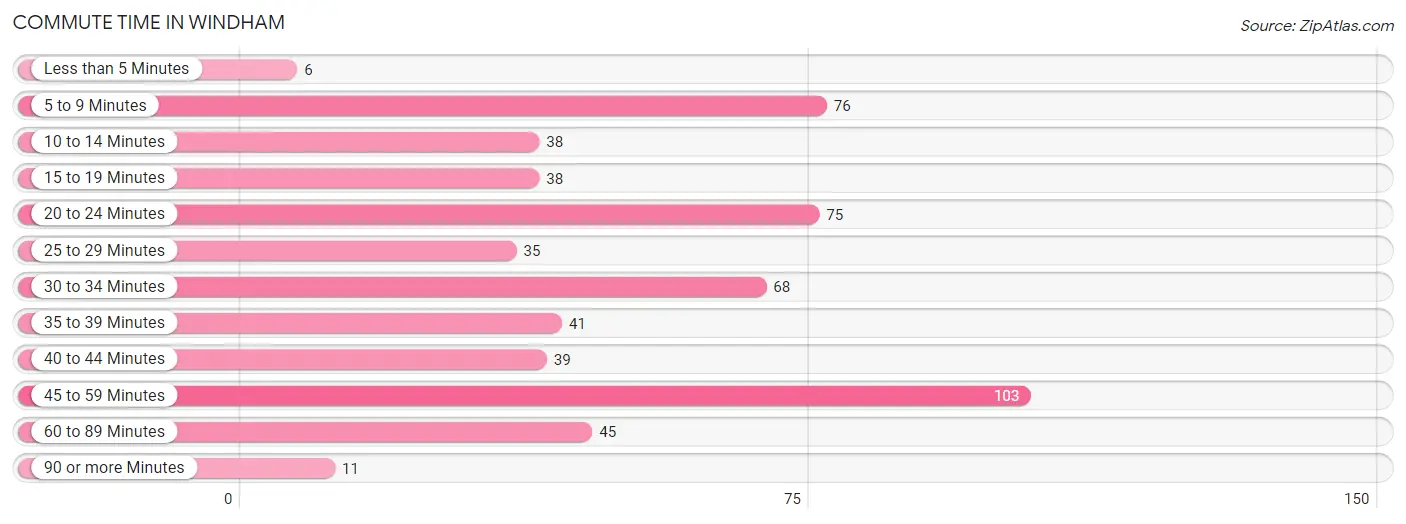
| Commute Time | # Commuters | % Commuters |
| Less than 5 Minutes | 6 | 1.0% |
| 5 to 9 Minutes | 76 | 13.2% |
| 10 to 14 Minutes | 38 | 6.6% |
| 15 to 19 Minutes | 38 | 6.6% |
| 20 to 24 Minutes | 75 | 13.0% |
| 25 to 29 Minutes | 35 | 6.1% |
| 30 to 34 Minutes | 68 | 11.8% |
| 35 to 39 Minutes | 41 | 7.1% |
| 40 to 44 Minutes | 39 | 6.8% |
| 45 to 59 Minutes | 103 | 17.9% |
| 60 to 89 Minutes | 45 | 7.8% |
| 90 or more Minutes | 11 | 1.9% |
Commute Time by Sex in Windham
The most common commute times in Windham are 45 to 59 minutes (65 commuters, 20.4%) for males and 30 to 34 minutes (52 commuters, 20.2%) for females.
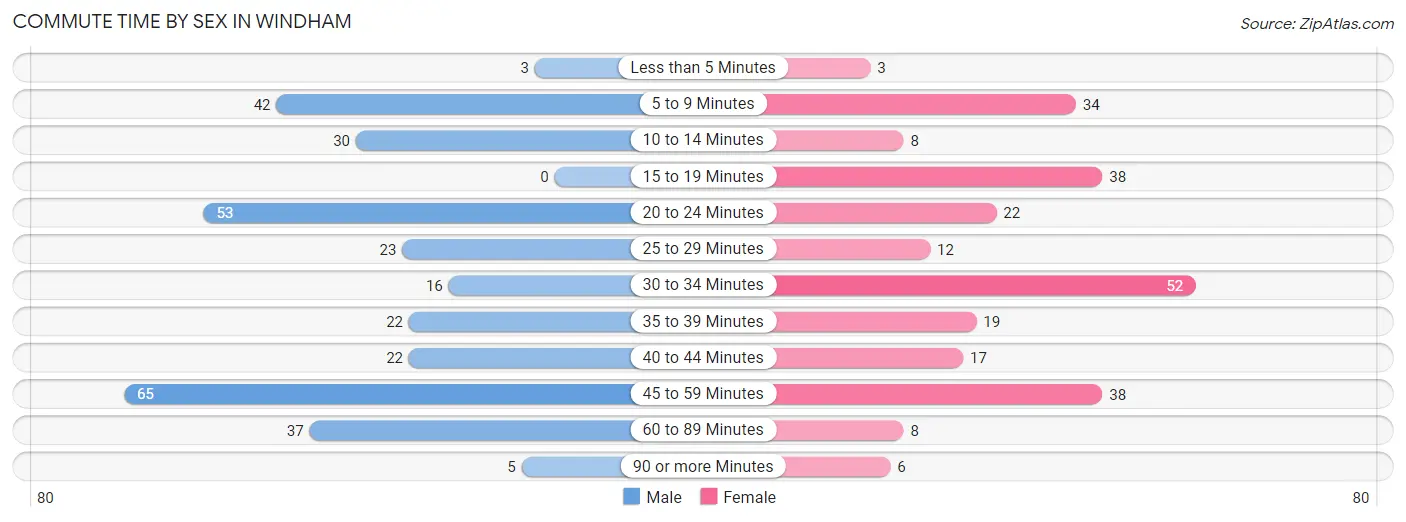
| Commute Time | Male | Female |
| Less than 5 Minutes | 3 (0.9%) | 3 (1.2%) |
| 5 to 9 Minutes | 42 (13.2%) | 34 (13.2%) |
| 10 to 14 Minutes | 30 (9.4%) | 8 (3.1%) |
| 15 to 19 Minutes | 0 (0.0%) | 38 (14.8%) |
| 20 to 24 Minutes | 53 (16.7%) | 22 (8.6%) |
| 25 to 29 Minutes | 23 (7.2%) | 12 (4.7%) |
| 30 to 34 Minutes | 16 (5.0%) | 52 (20.2%) |
| 35 to 39 Minutes | 22 (6.9%) | 19 (7.4%) |
| 40 to 44 Minutes | 22 (6.9%) | 17 (6.6%) |
| 45 to 59 Minutes | 65 (20.4%) | 38 (14.8%) |
| 60 to 89 Minutes | 37 (11.6%) | 8 (3.1%) |
| 90 or more Minutes | 5 (1.6%) | 6 (2.3%) |
Time of Departure to Work by Sex in Windham
The most frequent times of departure to work in Windham are 4:00 PM to 11:59 PM (95, 29.9%) for males and 6:00 AM to 6:29 AM (40, 15.6%) for females.
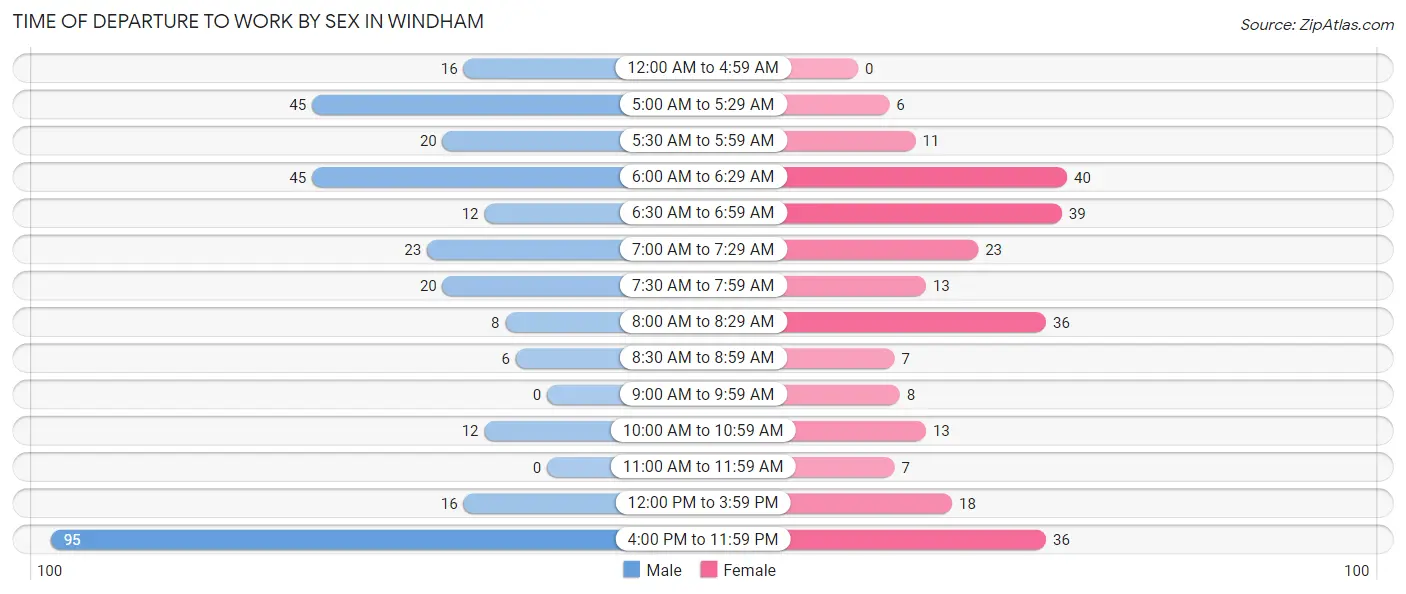
| Time of Departure | Male | Female |
| 12:00 AM to 4:59 AM | 16 (5.0%) | 0 (0.0%) |
| 5:00 AM to 5:29 AM | 45 (14.1%) | 6 (2.3%) |
| 5:30 AM to 5:59 AM | 20 (6.3%) | 11 (4.3%) |
| 6:00 AM to 6:29 AM | 45 (14.1%) | 40 (15.6%) |
| 6:30 AM to 6:59 AM | 12 (3.8%) | 39 (15.2%) |
| 7:00 AM to 7:29 AM | 23 (7.2%) | 23 (8.9%) |
| 7:30 AM to 7:59 AM | 20 (6.3%) | 13 (5.1%) |
| 8:00 AM to 8:29 AM | 8 (2.5%) | 36 (14.0%) |
| 8:30 AM to 8:59 AM | 6 (1.9%) | 7 (2.7%) |
| 9:00 AM to 9:59 AM | 0 (0.0%) | 8 (3.1%) |
| 10:00 AM to 10:59 AM | 12 (3.8%) | 13 (5.1%) |
| 11:00 AM to 11:59 AM | 0 (0.0%) | 7 (2.7%) |
| 12:00 PM to 3:59 PM | 16 (5.0%) | 18 (7.0%) |
| 4:00 PM to 11:59 PM | 95 (29.9%) | 36 (14.0%) |
| Total | 318 (100.0%) | 257 (100.0%) |
Housing Occupancy in Windham
Occupancy by Ownership in Windham
Of the total 624 dwellings in Windham, owner-occupied units account for 349 (55.9%), while renter-occupied units make up 275 (44.1%).
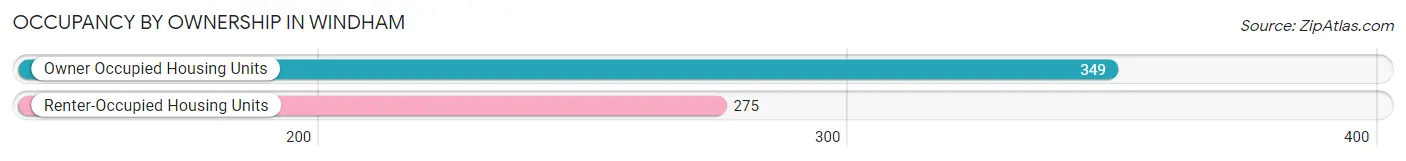
| Occupancy | # Housing Units | % Housing Units |
| Owner Occupied Housing Units | 349 | 55.9% |
| Renter-Occupied Housing Units | 275 | 44.1% |
| Total Occupied Housing Units | 624 | 100.0% |
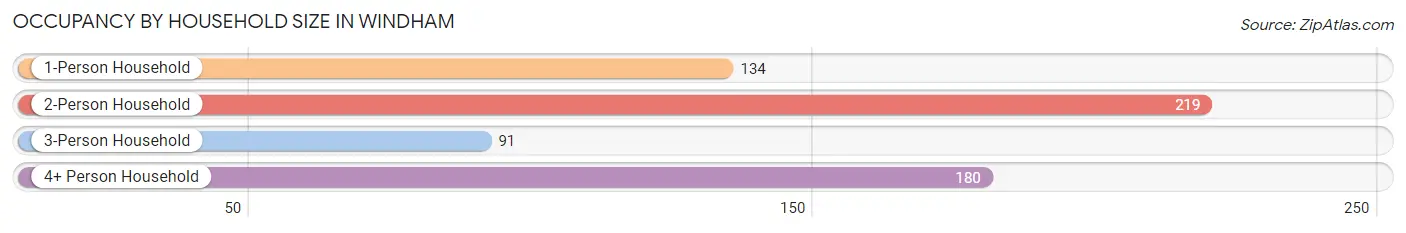
Occupancy by Household Size in Windham
| Household Size | # Housing Units | % Housing Units |
| 1-Person Household | 134 | 21.5% |
| 2-Person Household | 219 | 35.1% |
| 3-Person Household | 91 | 14.6% |
| 4+ Person Household | 180 | 28.8% |
| Total Housing Units | 624 | 100.0% |
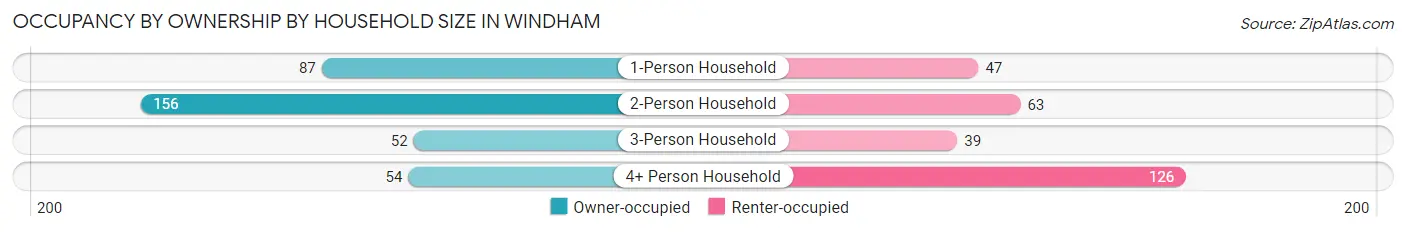
Occupancy by Ownership by Household Size in Windham
| Household Size | Owner-occupied | Renter-occupied |
| 1-Person Household | 87 (64.9%) | 47 (35.1%) |
| 2-Person Household | 156 (71.2%) | 63 (28.8%) |
| 3-Person Household | 52 (57.1%) | 39 (42.9%) |
| 4+ Person Household | 54 (30.0%) | 126 (70.0%) |
| Total Housing Units | 349 (55.9%) | 275 (44.1%) |
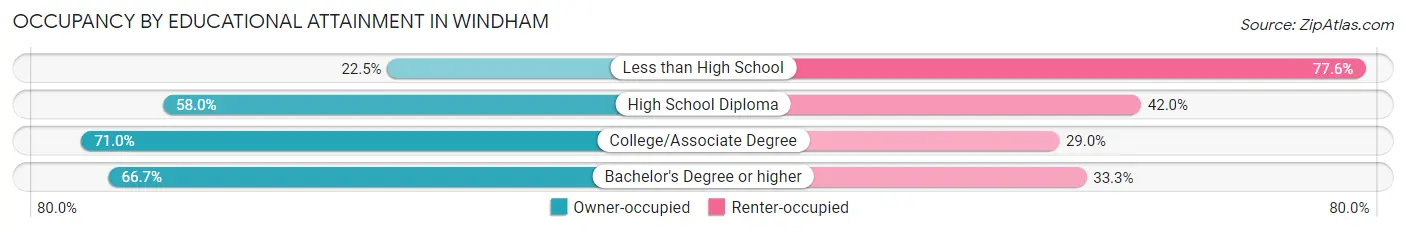
Occupancy by Educational Attainment in Windham
| Household Size | Owner-occupied | Renter-occupied |
| Less than High School | 22 (22.5%) | 76 (77.5%) |
| High School Diploma | 199 (58.0%) | 144 (42.0%) |
| College/Associate Degree | 98 (71.0%) | 40 (29.0%) |
| Bachelor's Degree or higher | 30 (66.7%) | 15 (33.3%) |
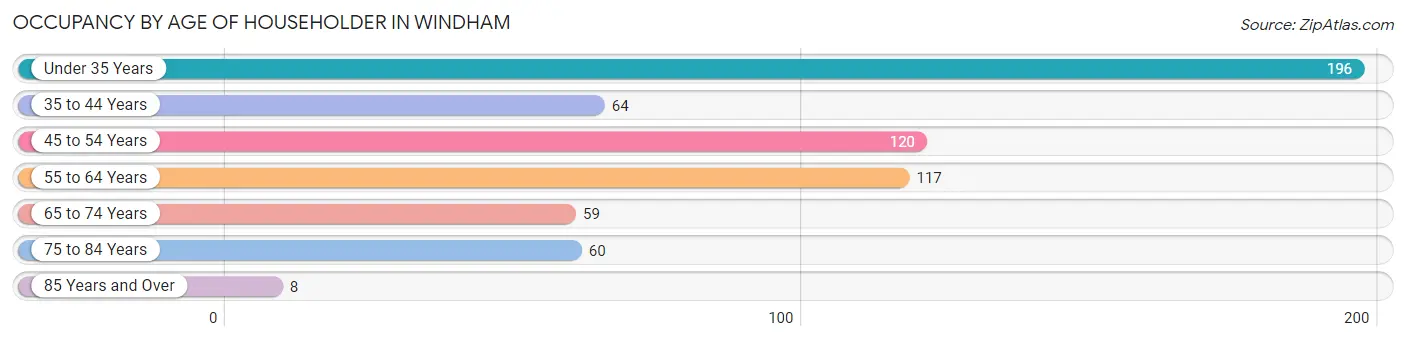
Occupancy by Age of Householder in Windham
| Age Bracket | # Households | % Households |
| Under 35 Years | 196 | 31.4% |
| 35 to 44 Years | 64 | 10.3% |
| 45 to 54 Years | 120 | 19.2% |
| 55 to 64 Years | 117 | 18.8% |
| 65 to 74 Years | 59 | 9.5% |
| 75 to 84 Years | 60 | 9.6% |
| 85 Years and Over | 8 | 1.3% |
| Total | 624 | 100.0% |
Housing Finances in Windham
Median Income by Occupancy in Windham
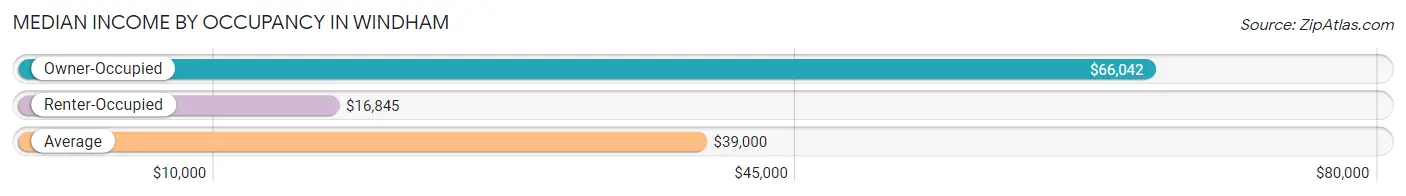
| Occupancy Type | # Households | Median Income |
| Owner-Occupied | 349 (55.9%) | $66,042 |
| Renter-Occupied | 275 (44.1%) | $16,845 |
| Average | 624 (100.0%) | $39,000 |
Occupancy by Householder Income Bracket in Windham
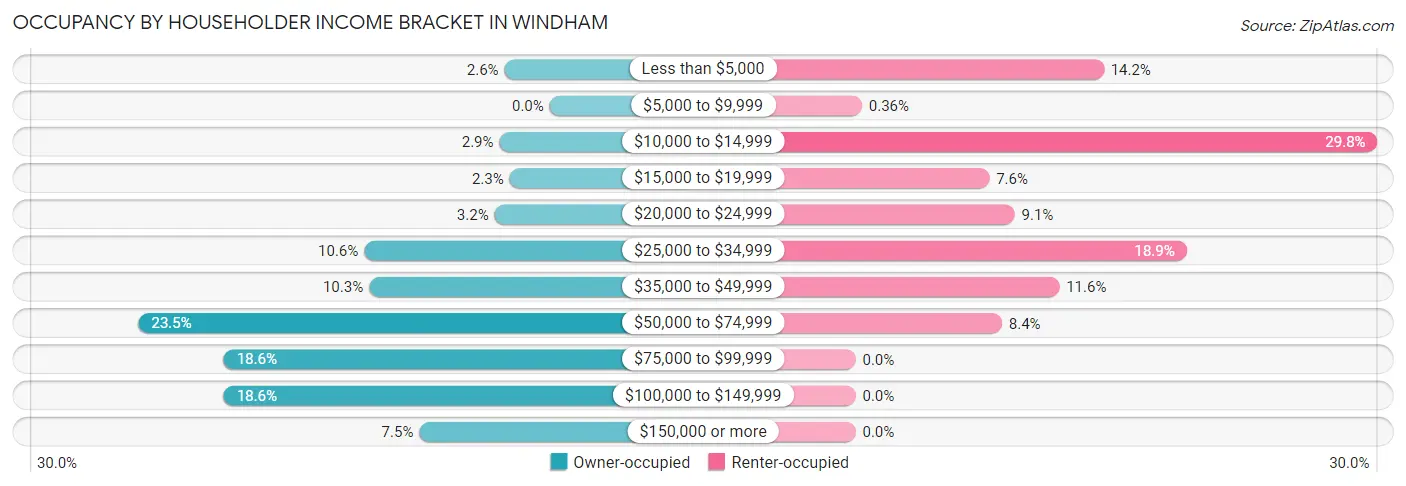
| Income Bracket | Owner-occupied | Renter-occupied |
| Less than $5,000 | 9 (2.6%) | 39 (14.2%) |
| $5,000 to $9,999 | 0 (0.0%) | 1 (0.4%) |
| $10,000 to $14,999 | 10 (2.9%) | 82 (29.8%) |
| $15,000 to $19,999 | 8 (2.3%) | 21 (7.6%) |
| $20,000 to $24,999 | 11 (3.2%) | 25 (9.1%) |
| $25,000 to $34,999 | 37 (10.6%) | 52 (18.9%) |
| $35,000 to $49,999 | 36 (10.3%) | 32 (11.6%) |
| $50,000 to $74,999 | 82 (23.5%) | 23 (8.4%) |
| $75,000 to $99,999 | 65 (18.6%) | 0 (0.0%) |
| $100,000 to $149,999 | 65 (18.6%) | 0 (0.0%) |
| $150,000 or more | 26 (7.4%) | 0 (0.0%) |
| Total | 349 (100.0%) | 275 (100.0%) |
Monthly Housing Cost Tiers in Windham
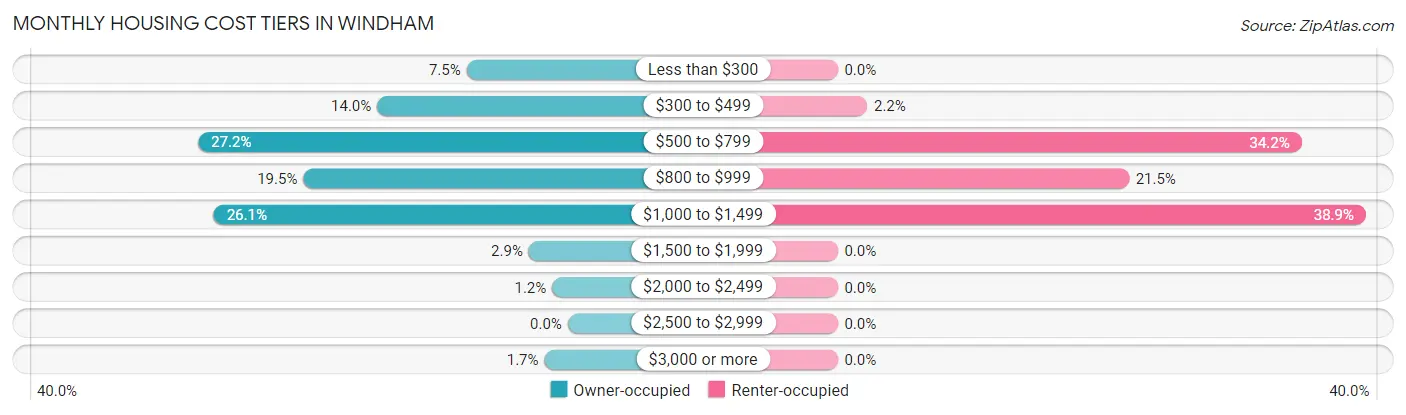
| Monthly Cost | Owner-occupied | Renter-occupied |
| Less than $300 | 26 (7.4%) | 0 (0.0%) |
| $300 to $499 | 49 (14.0%) | 6 (2.2%) |
| $500 to $799 | 95 (27.2%) | 94 (34.2%) |
| $800 to $999 | 68 (19.5%) | 59 (21.4%) |
| $1,000 to $1,499 | 91 (26.1%) | 107 (38.9%) |
| $1,500 to $1,999 | 10 (2.9%) | 0 (0.0%) |
| $2,000 to $2,499 | 4 (1.1%) | 0 (0.0%) |
| $2,500 to $2,999 | 0 (0.0%) | 0 (0.0%) |
| $3,000 or more | 6 (1.7%) | 0 (0.0%) |
| Total | 349 (100.0%) | 275 (100.0%) |
Physical Housing Characteristics in Windham
Housing Structures in Windham
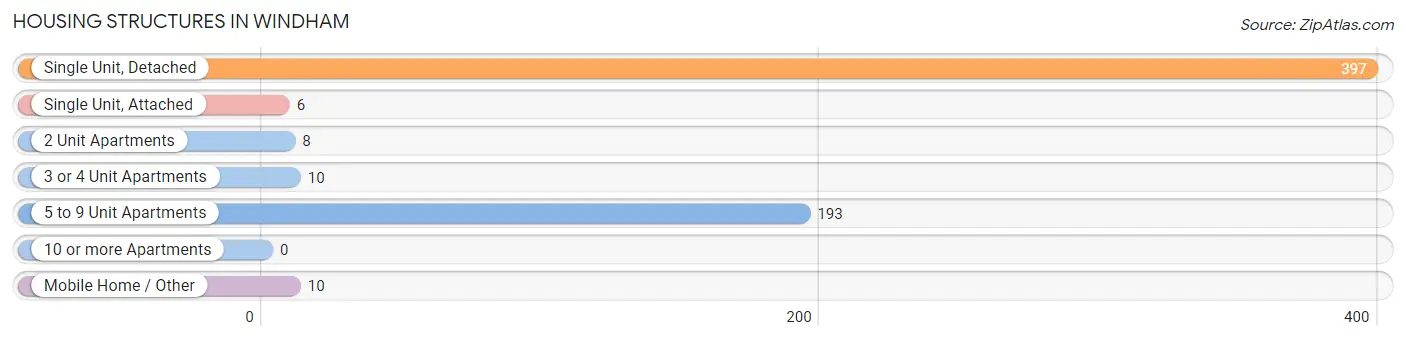
| Structure Type | # Housing Units | % Housing Units |
| Single Unit, Detached | 397 | 63.6% |
| Single Unit, Attached | 6 | 1.0% |
| 2 Unit Apartments | 8 | 1.3% |
| 3 or 4 Unit Apartments | 10 | 1.6% |
| 5 to 9 Unit Apartments | 193 | 30.9% |
| 10 or more Apartments | 0 | 0.0% |
| Mobile Home / Other | 10 | 1.6% |
| Total | 624 | 100.0% |
Housing Structures by Occupancy in Windham
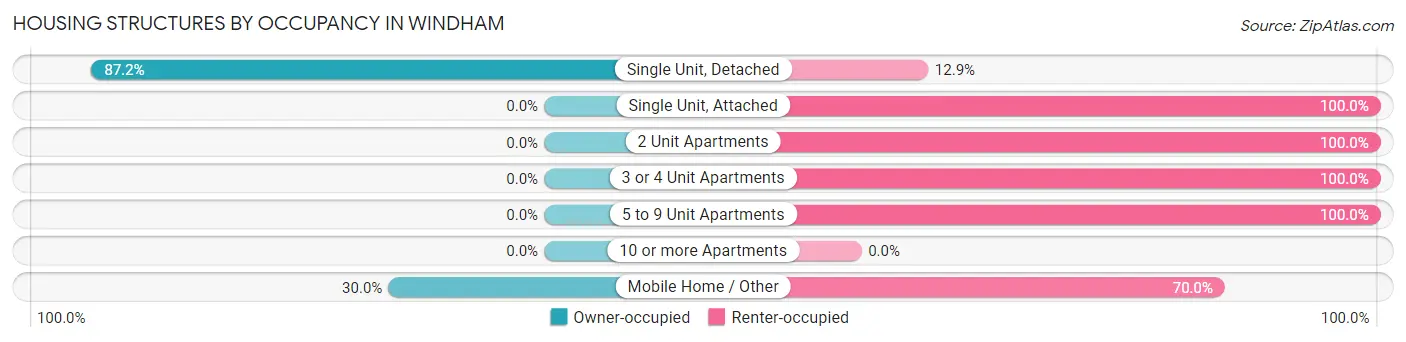
| Structure Type | Owner-occupied | Renter-occupied |
| Single Unit, Detached | 346 (87.2%) | 51 (12.9%) |
| Single Unit, Attached | 0 (0.0%) | 6 (100.0%) |
| 2 Unit Apartments | 0 (0.0%) | 8 (100.0%) |
| 3 or 4 Unit Apartments | 0 (0.0%) | 10 (100.0%) |
| 5 to 9 Unit Apartments | 0 (0.0%) | 193 (100.0%) |
| 10 or more Apartments | 0 (0.0%) | 0 (0.0%) |
| Mobile Home / Other | 3 (30.0%) | 7 (70.0%) |
| Total | 349 (55.9%) | 275 (44.1%) |
Housing Structures by Number of Rooms in Windham
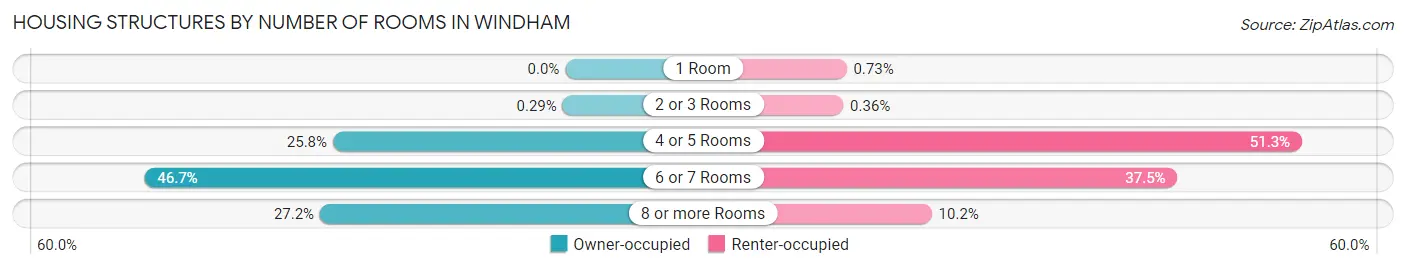
| Number of Rooms | Owner-occupied | Renter-occupied |
| 1 Room | 0 (0.0%) | 2 (0.7%) |
| 2 or 3 Rooms | 1 (0.3%) | 1 (0.4%) |
| 4 or 5 Rooms | 90 (25.8%) | 141 (51.3%) |
| 6 or 7 Rooms | 163 (46.7%) | 103 (37.4%) |
| 8 or more Rooms | 95 (27.2%) | 28 (10.2%) |
| Total | 349 (100.0%) | 275 (100.0%) |
Housing Structure by Heating Type in Windham
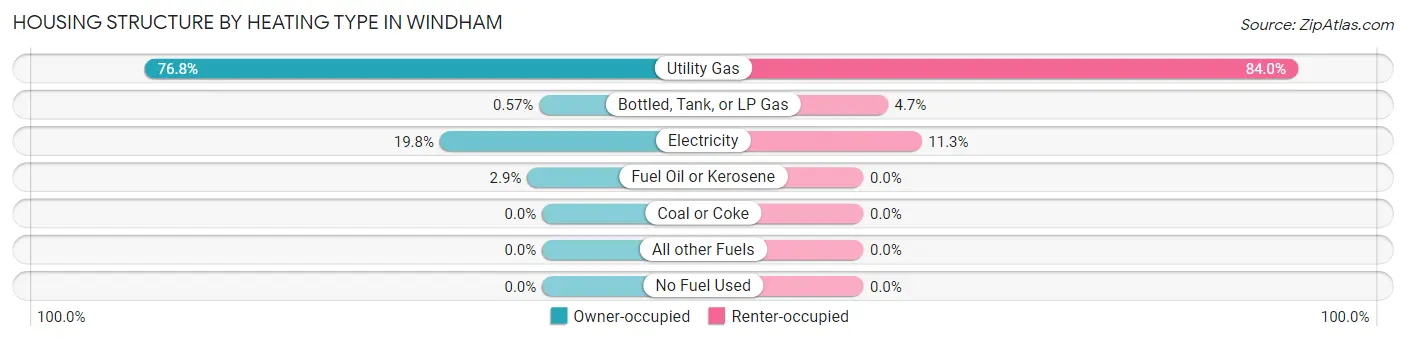
| Heating Type | Owner-occupied | Renter-occupied |
| Utility Gas | 268 (76.8%) | 231 (84.0%) |
| Bottled, Tank, or LP Gas | 2 (0.6%) | 13 (4.7%) |
| Electricity | 69 (19.8%) | 31 (11.3%) |
| Fuel Oil or Kerosene | 10 (2.9%) | 0 (0.0%) |
| Coal or Coke | 0 (0.0%) | 0 (0.0%) |
| All other Fuels | 0 (0.0%) | 0 (0.0%) |
| No Fuel Used | 0 (0.0%) | 0 (0.0%) |
| Total | 349 (100.0%) | 275 (100.0%) |
Household Vehicle Usage in Windham
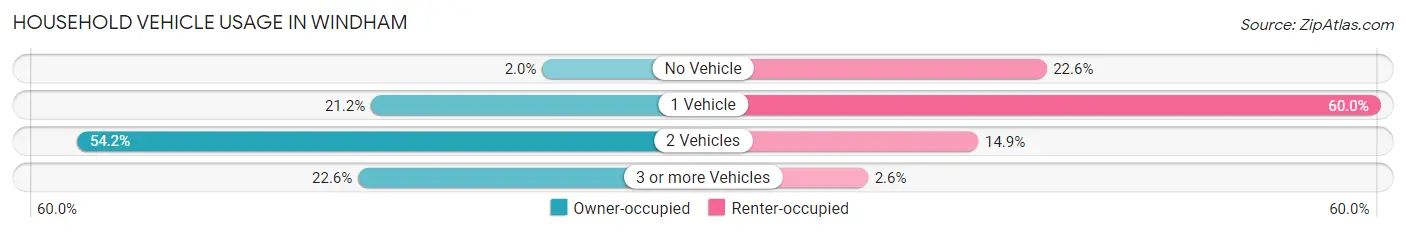
| Vehicles per Household | Owner-occupied | Renter-occupied |
| No Vehicle | 7 (2.0%) | 62 (22.6%) |
| 1 Vehicle | 74 (21.2%) | 165 (60.0%) |
| 2 Vehicles | 189 (54.1%) | 41 (14.9%) |
| 3 or more Vehicles | 79 (22.6%) | 7 (2.5%) |
| Total | 349 (100.0%) | 275 (100.0%) |
Real Estate & Mortgages in Windham
Real Estate and Mortgage Overview in Windham
| Characteristic | Without Mortgage | With Mortgage |
| Housing Units | 114 | 235 |
| Median Property Value | $102,400 | $128,100 |
| Median Household Income | $55,625 | $19 |
| Monthly Housing Costs | $465 | $6 |
| Real Estate Taxes | $1,230 | $6 |
Property Value by Mortgage Status in Windham
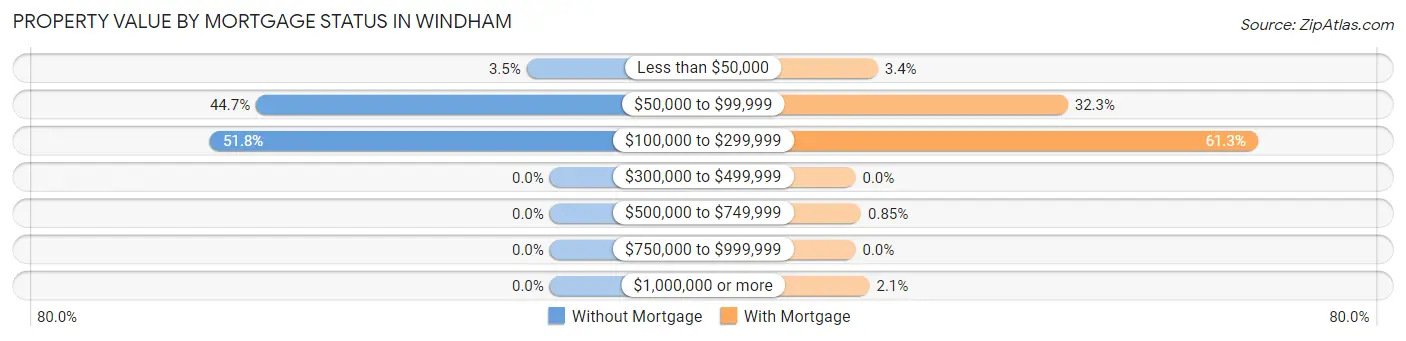
| Property Value | Without Mortgage | With Mortgage |
| Less than $50,000 | 4 (3.5%) | 8 (3.4%) |
| $50,000 to $99,999 | 51 (44.7%) | 76 (32.3%) |
| $100,000 to $299,999 | 59 (51.7%) | 144 (61.3%) |
| $300,000 to $499,999 | 0 (0.0%) | 0 (0.0%) |
| $500,000 to $749,999 | 0 (0.0%) | 2 (0.9%) |
| $750,000 to $999,999 | 0 (0.0%) | 0 (0.0%) |
| $1,000,000 or more | 0 (0.0%) | 5 (2.1%) |
| Total | 114 (100.0%) | 235 (100.0%) |
Household Income by Mortgage Status in Windham
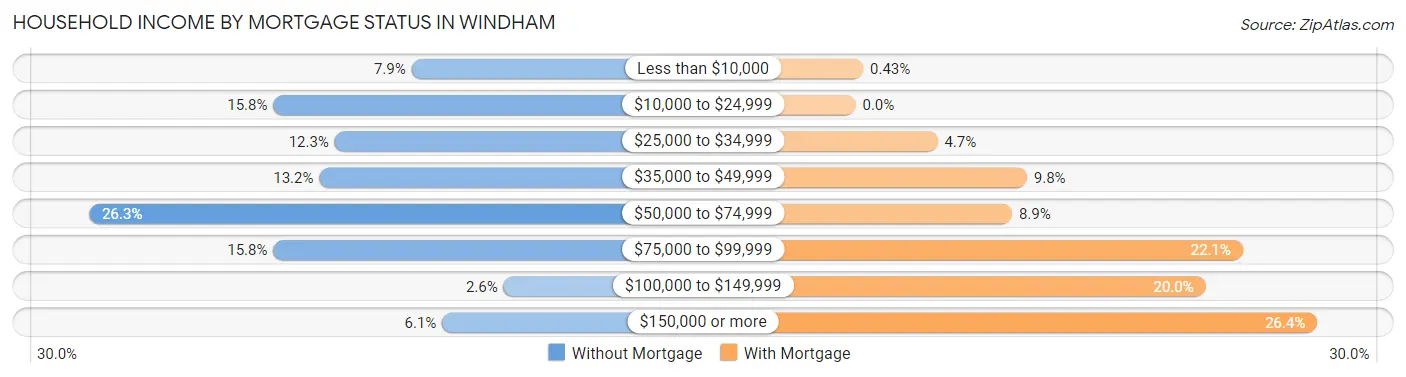
| Household Income | Without Mortgage | With Mortgage |
| Less than $10,000 | 9 (7.9%) | 1 (0.4%) |
| $10,000 to $24,999 | 18 (15.8%) | 0 (0.0%) |
| $25,000 to $34,999 | 14 (12.3%) | 11 (4.7%) |
| $35,000 to $49,999 | 15 (13.2%) | 23 (9.8%) |
| $50,000 to $74,999 | 30 (26.3%) | 21 (8.9%) |
| $75,000 to $99,999 | 18 (15.8%) | 52 (22.1%) |
| $100,000 to $149,999 | 3 (2.6%) | 47 (20.0%) |
| $150,000 or more | 7 (6.1%) | 62 (26.4%) |
| Total | 114 (100.0%) | 235 (100.0%) |
Property Value to Household Income Ratio in Windham
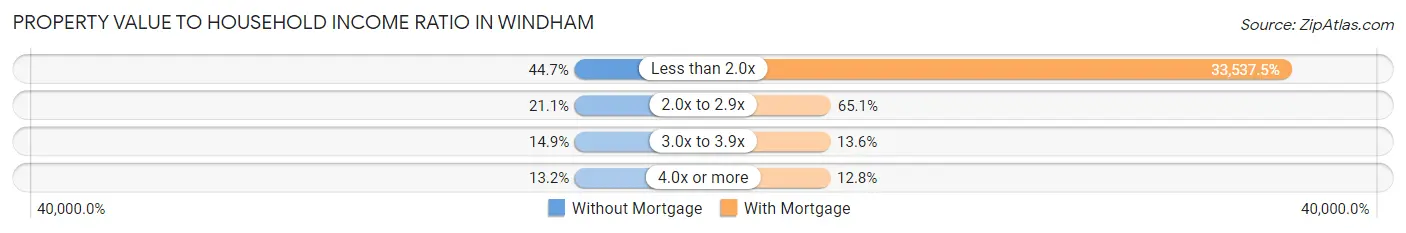
| Value-to-Income Ratio | Without Mortgage | With Mortgage |
| Less than 2.0x | 51 (44.7%) | 78,813 (33,537.5%) |
| 2.0x to 2.9x | 24 (21.0%) | 153 (65.1%) |
| 3.0x to 3.9x | 17 (14.9%) | 32 (13.6%) |
| 4.0x or more | 15 (13.2%) | 30 (12.8%) |
| Total | 114 (100.0%) | 235 (100.0%) |
Real Estate Taxes by Mortgage Status in Windham
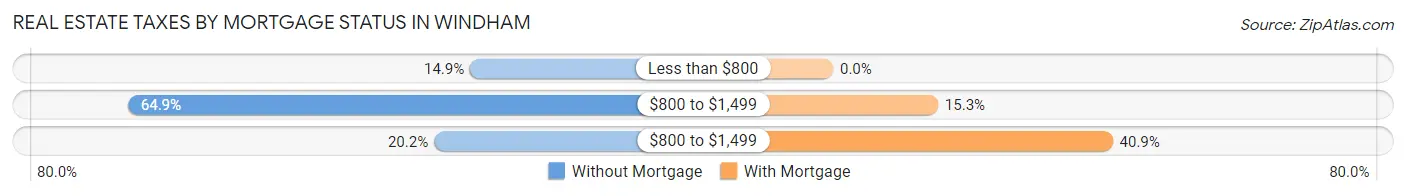
| Property Taxes | Without Mortgage | With Mortgage |
| Less than $800 | 17 (14.9%) | 0 (0.0%) |
| $800 to $1,499 | 74 (64.9%) | 36 (15.3%) |
| $800 to $1,499 | 23 (20.2%) | 96 (40.8%) |
| Total | 114 (100.0%) | 235 (100.0%) |
Health & Disability in Windham
Health Insurance Coverage by Age in Windham
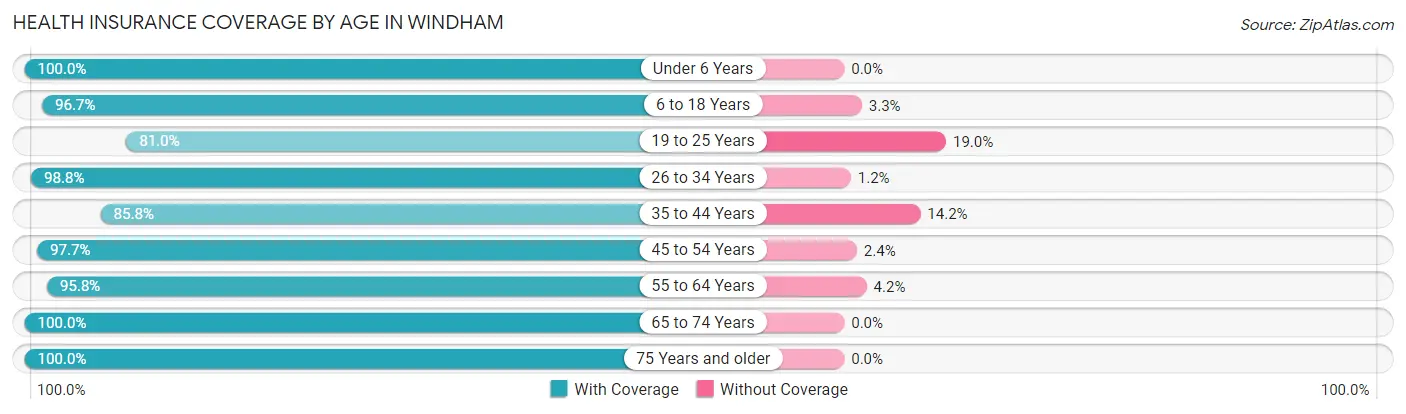
| Age Bracket | With Coverage | Without Coverage |
| Under 6 Years | 264 (100.0%) | 0 (0.0%) |
| 6 to 18 Years | 296 (96.7%) | 10 (3.3%) |
| 19 to 25 Years | 141 (81.0%) | 33 (19.0%) |
| 26 to 34 Years | 242 (98.8%) | 3 (1.2%) |
| 35 to 44 Years | 133 (85.8%) | 22 (14.2%) |
| 45 to 54 Years | 249 (97.7%) | 6 (2.4%) |
| 55 to 64 Years | 161 (95.8%) | 7 (4.2%) |
| 65 to 74 Years | 110 (100.0%) | 0 (0.0%) |
| 75 Years and older | 100 (100.0%) | 0 (0.0%) |
| Total | 1,696 (95.4%) | 81 (4.6%) |
Health Insurance Coverage by Citizenship Status in Windham
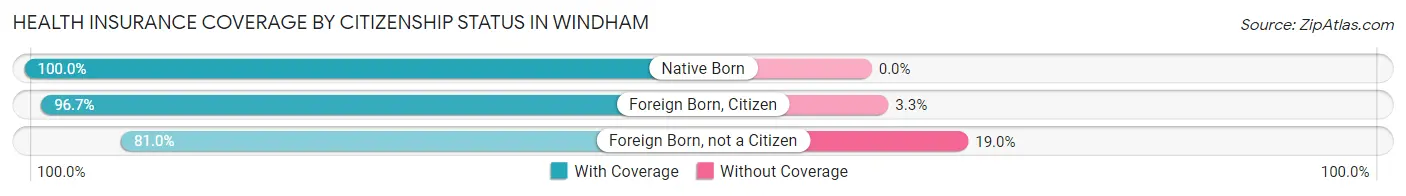
| Citizenship Status | With Coverage | Without Coverage |
| Native Born | 264 (100.0%) | 0 (0.0%) |
| Foreign Born, Citizen | 296 (96.7%) | 10 (3.3%) |
| Foreign Born, not a Citizen | 141 (81.0%) | 33 (19.0%) |
Health Insurance Coverage by Household Income in Windham
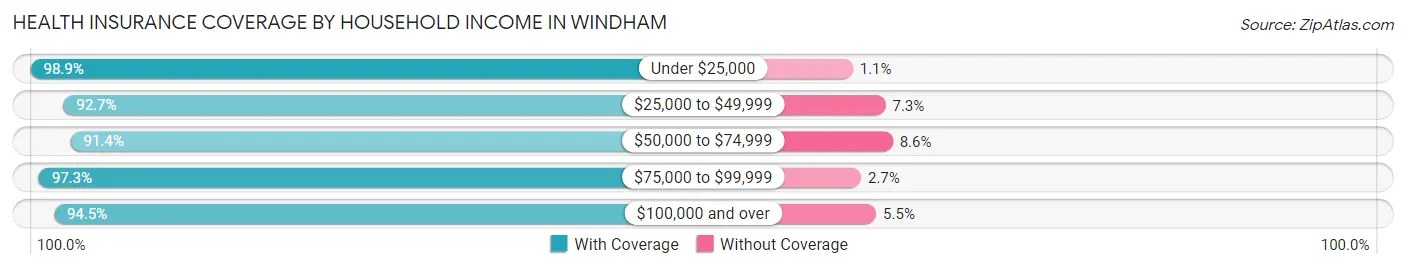
| Household Income | With Coverage | Without Coverage |
| Under $25,000 | 617 (98.9%) | 7 (1.1%) |
| $25,000 to $49,999 | 409 (92.7%) | 32 (7.3%) |
| $50,000 to $74,999 | 223 (91.4%) | 21 (8.6%) |
| $75,000 to $99,999 | 146 (97.3%) | 4 (2.7%) |
| $100,000 and over | 292 (94.5%) | 17 (5.5%) |
Public vs Private Health Insurance Coverage by Age in Windham
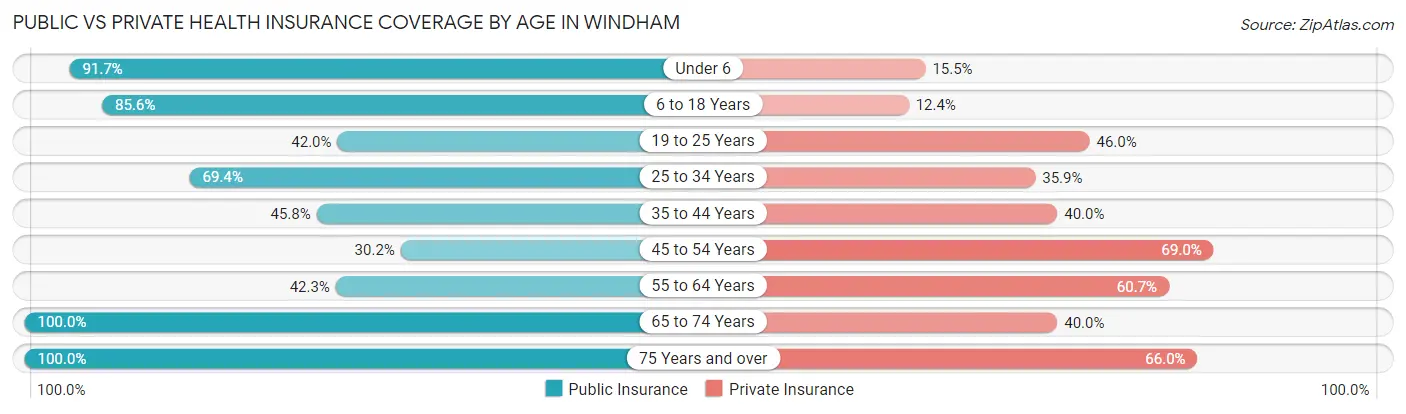
| Age Bracket | Public Insurance | Private Insurance |
| Under 6 | 242 (91.7%) | 41 (15.5%) |
| 6 to 18 Years | 262 (85.6%) | 38 (12.4%) |
| 19 to 25 Years | 73 (41.9%) | 80 (46.0%) |
| 25 to 34 Years | 170 (69.4%) | 88 (35.9%) |
| 35 to 44 Years | 71 (45.8%) | 62 (40.0%) |
| 45 to 54 Years | 77 (30.2%) | 176 (69.0%) |
| 55 to 64 Years | 71 (42.3%) | 102 (60.7%) |
| 65 to 74 Years | 110 (100.0%) | 44 (40.0%) |
| 75 Years and over | 100 (100.0%) | 66 (66.0%) |
| Total | 1,176 (66.2%) | 697 (39.2%) |
Disability Status by Sex by Age in Windham
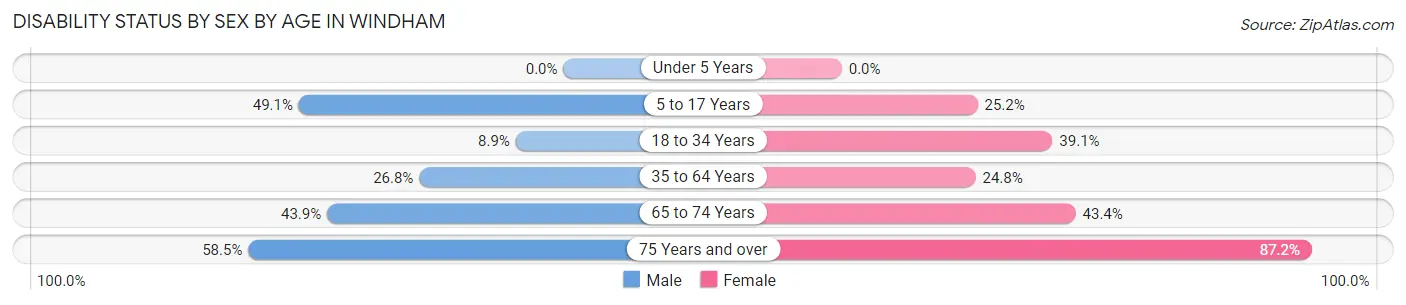
| Age Bracket | Male | Female |
| Under 5 Years | 0 (0.0%) | 0 (0.0%) |
| 5 to 17 Years | 82 (49.1%) | 31 (25.2%) |
| 18 to 34 Years | 17 (8.8%) | 95 (39.1%) |
| 35 to 64 Years | 76 (26.8%) | 73 (24.8%) |
| 65 to 74 Years | 25 (43.9%) | 23 (43.4%) |
| 75 Years and over | 31 (58.5%) | 41 (87.2%) |
Disability Class by Sex by Age in Windham
Disability Class: Hearing Difficulty
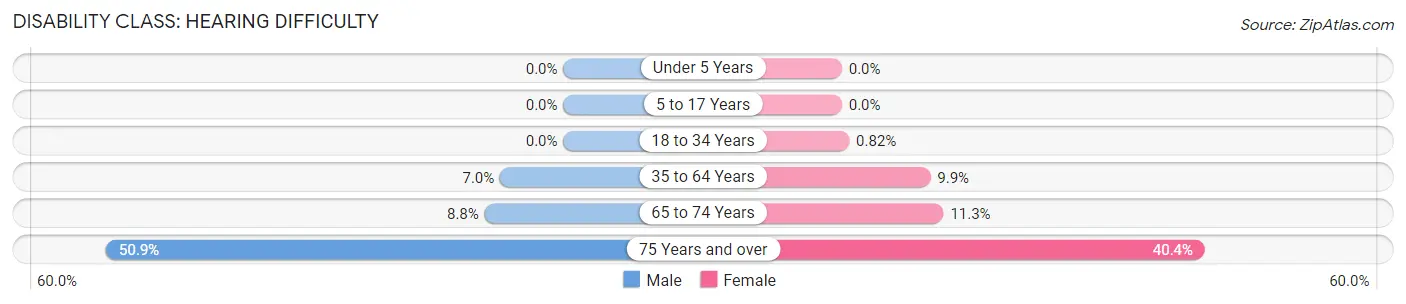
| Age Bracket | Male | Female |
| Under 5 Years | 0 (0.0%) | 0 (0.0%) |
| 5 to 17 Years | 0 (0.0%) | 0 (0.0%) |
| 18 to 34 Years | 0 (0.0%) | 2 (0.8%) |
| 35 to 64 Years | 20 (7.0%) | 29 (9.9%) |
| 65 to 74 Years | 5 (8.8%) | 6 (11.3%) |
| 75 Years and over | 27 (50.9%) | 19 (40.4%) |
Disability Class: Vision Difficulty
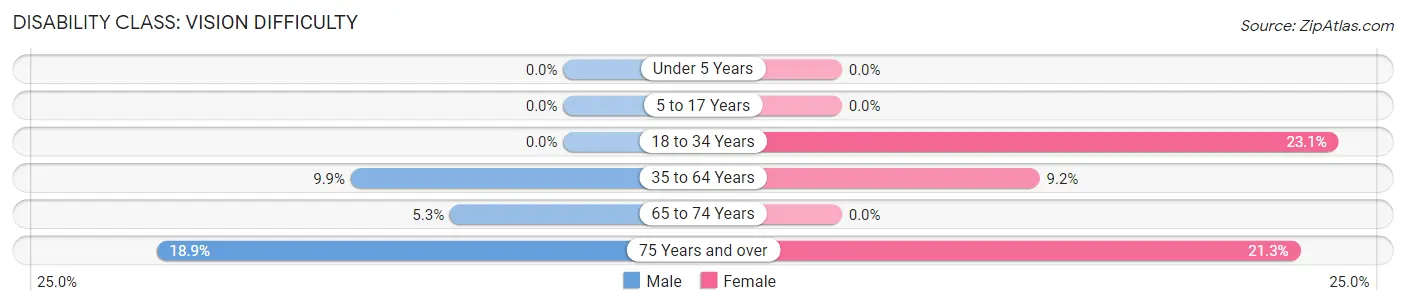
| Age Bracket | Male | Female |
| Under 5 Years | 0 (0.0%) | 0 (0.0%) |
| 5 to 17 Years | 0 (0.0%) | 0 (0.0%) |
| 18 to 34 Years | 0 (0.0%) | 56 (23.1%) |
| 35 to 64 Years | 28 (9.9%) | 27 (9.2%) |
| 65 to 74 Years | 3 (5.3%) | 0 (0.0%) |
| 75 Years and over | 10 (18.9%) | 10 (21.3%) |
Disability Class: Cognitive Difficulty
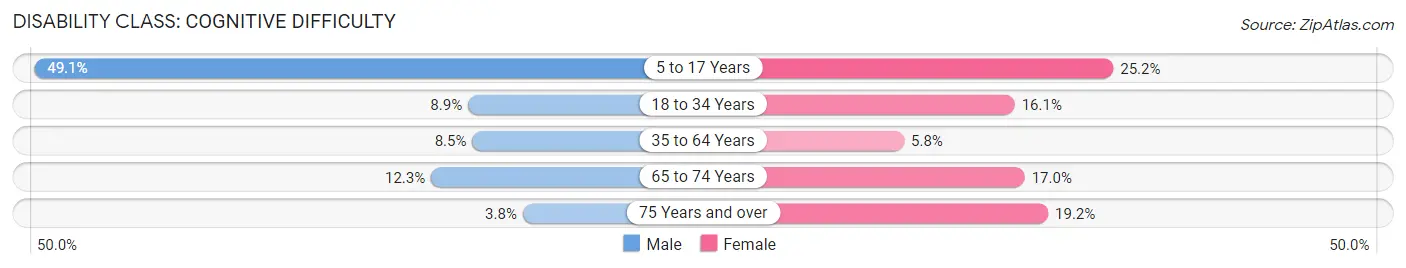
| Age Bracket | Male | Female |
| 5 to 17 Years | 82 (49.1%) | 31 (25.2%) |
| 18 to 34 Years | 17 (8.8%) | 39 (16.1%) |
| 35 to 64 Years | 24 (8.5%) | 17 (5.8%) |
| 65 to 74 Years | 7 (12.3%) | 9 (17.0%) |
| 75 Years and over | 2 (3.8%) | 9 (19.2%) |
Disability Class: Ambulatory Difficulty
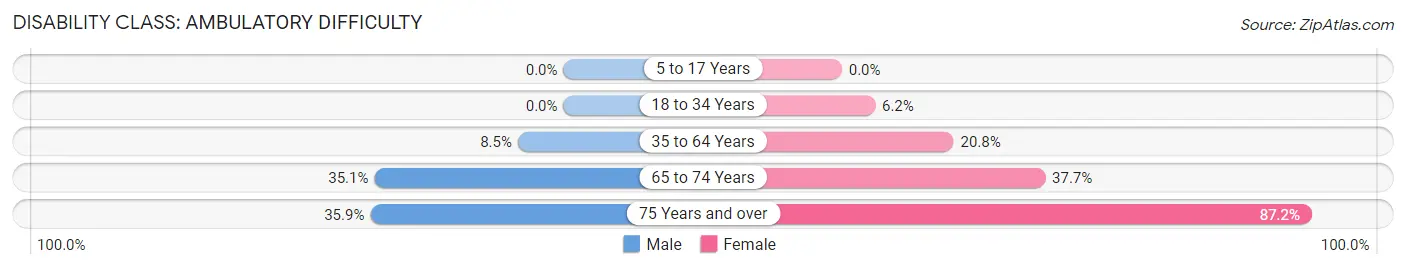
| Age Bracket | Male | Female |
| 5 to 17 Years | 0 (0.0%) | 0 (0.0%) |
| 18 to 34 Years | 0 (0.0%) | 15 (6.2%) |
| 35 to 64 Years | 24 (8.5%) | 61 (20.7%) |
| 65 to 74 Years | 20 (35.1%) | 20 (37.7%) |
| 75 Years and over | 19 (35.8%) | 41 (87.2%) |
Disability Class: Self-Care Difficulty
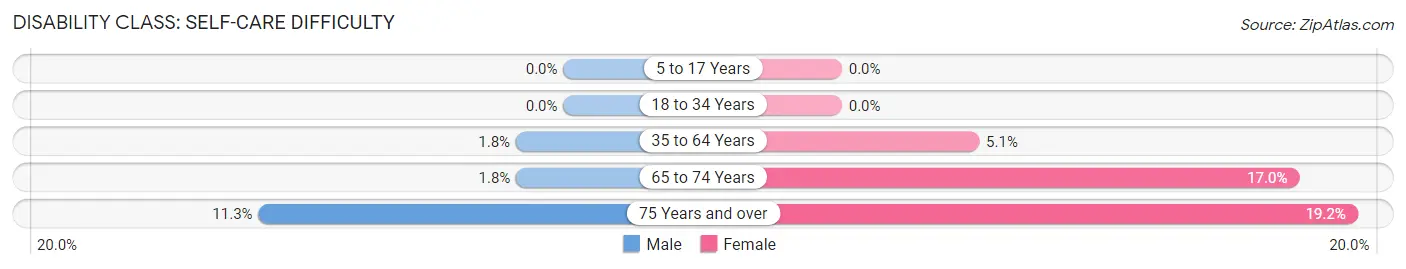
| Age Bracket | Male | Female |
| 5 to 17 Years | 0 (0.0%) | 0 (0.0%) |
| 18 to 34 Years | 0 (0.0%) | 0 (0.0%) |
| 35 to 64 Years | 5 (1.8%) | 15 (5.1%) |
| 65 to 74 Years | 1 (1.8%) | 9 (17.0%) |
| 75 Years and over | 6 (11.3%) | 9 (19.2%) |
Technology Access in Windham
Computing Device Access in Windham
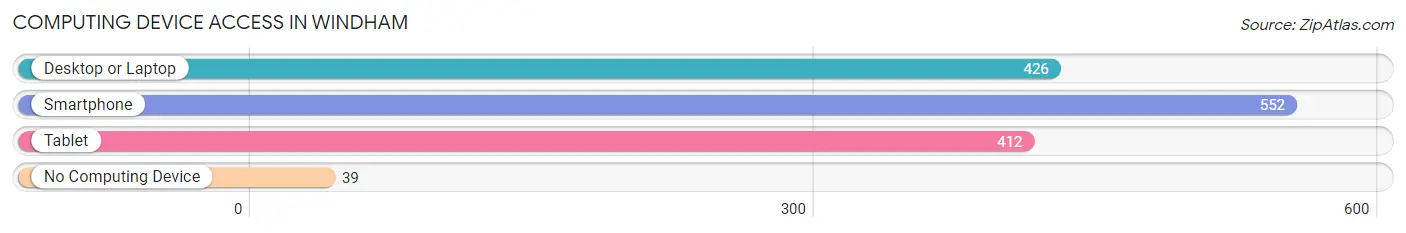
| Device Type | # Households | % Households |
| Desktop or Laptop | 426 | 68.3% |
| Smartphone | 552 | 88.5% |
| Tablet | 412 | 66.0% |
| No Computing Device | 39 | 6.2% |
| Total | 624 | 100.0% |
Internet Access in Windham
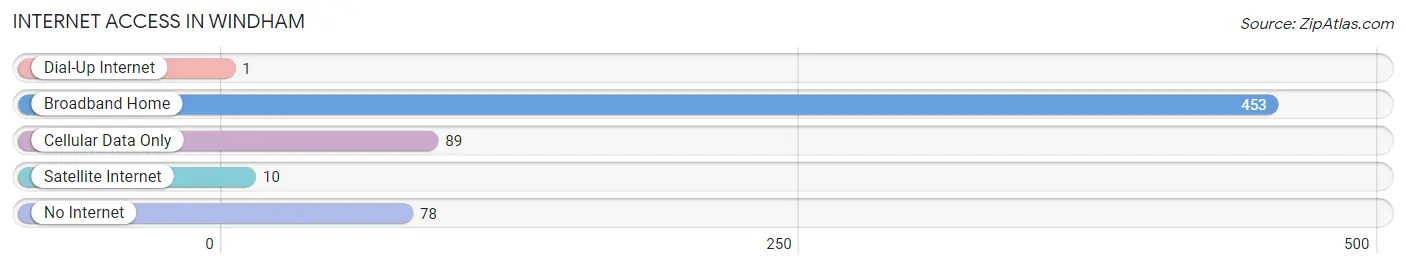
| Internet Type | # Households | % Households |
| Dial-Up Internet | 1 | 0.2% |
| Broadband Home | 453 | 72.6% |
| Cellular Data Only | 89 | 14.3% |
| Satellite Internet | 10 | 1.6% |
| No Internet | 78 | 12.5% |
| Total | 624 | 100.0% |
Windham Summary
History
The small village of Windham, Ohio is located in the northeast corner of Portage County. It was founded in 1815 by a group of settlers from Connecticut, led by Captain John Windham. The settlers were attracted to the area by the abundance of natural resources, including timber, water, and fertile soil. The village was originally known as Windham Centre, but the name was changed to Windham in 1825.
The early settlers of Windham were primarily farmers, and the village quickly became a center of agricultural production. The village was also home to a number of small businesses, including a sawmill, a gristmill, a tannery, and a blacksmith shop. In 1845, the first schoolhouse was built in Windham, and the village soon became a center of education.
In the late 19th century, Windham began to experience a period of growth and prosperity. The village was connected to the outside world by the Cleveland and Mahoning Valley Railroad, which opened in 1871. This allowed for the transportation of goods and people to and from the village. In addition, the village was home to a number of factories, including a brickyard, a furniture factory, and a canning factory.
The 20th century saw Windham continue to grow and prosper. The village was home to a number of businesses, including a bank, a hotel, a movie theater, and a variety of stores. In addition, the village was home to a number of churches, including the First Congregational Church, which was founded in 1815.
Geography
Windham is located in the northeast corner of Portage County, Ohio. The village is situated on the banks of the Cuyahoga River, which flows through the village. The village is surrounded by rolling hills and farmland, and is located approximately 30 miles south of Cleveland.
The village of Windham covers an area of 1.2 square miles, and has a population of approximately 1,500 people. The village is served by the Windham Local School District, which includes two elementary schools, a middle school, and a high school.
Economy
The economy of Windham is largely based on agriculture and tourism. The village is home to a number of farms, which produce a variety of crops, including corn, soybeans, and wheat. In addition, the village is home to a number of small businesses, including restaurants, shops, and a variety of services.
The village is also home to a number of tourist attractions, including the Windham Historical Museum, the Windham Covered Bridge, and the Windham Country Club. The village is also home to a number of festivals and events, including the Windham Harvest Festival and the Windham Music Festival.
Demographics
As of the 2010 census, the population of Windham was 1,521. The racial makeup of the village was 97.3% White, 0.7% African American, 0.2% Native American, 0.3% Asian, 0.2% from other races, and 1.5% from two or more races. Hispanic or Latino of any race were 1.2% of the population.
The median household income in Windham was $45,938, and the median family income was $51,250. The per capita income for the village was $20,945. About 8.3% of families and 10.2% of the population were below the poverty line, including 14.2% of those under age 18 and 6.2% of those age 65 or over.
Common Questions
What is Per Capita Income in Windham?
Per Capita income in Windham is $19,089.
What is the Median Family Income in Windham?
Median Family Income in Windham is $39,583.
What is the Median Household income in Windham?
Median Household Income in Windham is $39,000.
What is Income or Wage Gap in Windham?
Income or Wage Gap in Windham is 36.1%.
Women in Windham earn 63.9 cents for every dollar earned by a man.
What is Family Income Deficit in Windham?
Family Income Deficit in Windham is $17,051.
Families that are below poverty line in Windham earn $17,051 less on average than the poverty threshold level.
What is Inequality or Gini Index in Windham?
Inequality or Gini Index in Windham is 0.45.
What is the Total Population of Windham?
Total Population of Windham is 1,777.
What is the Total Male Population of Windham?
Total Male Population of Windham is 877.
What is the Total Female Population of Windham?
Total Female Population of Windham is 900.
What is the Ratio of Males per 100 Females in Windham?
There are 97.44 Males per 100 Females in Windham.
What is the Ratio of Females per 100 Males in Windham?
There are 102.62 Females per 100 Males in Windham.
What is the Median Population Age in Windham?
Median Population Age in Windham is 29.0 Years.
What is the Average Family Size in Windham
Average Family Size in Windham is 3.4 People.
What is the Average Household Size in Windham
Average Household Size in Windham is 2.8 People.
How Large is the Labor Force in Windham?
There are 685 People in the Labor Forcein in Windham.
What is the Percentage of People in the Labor Force in Windham?
55.1% of People are in the Labor Force in Windham.
What is the Unemployment Rate in Windham?
Unemployment Rate in Windham is 13.9%.