Bainbridge, OH Map & Demographics
Bainbridge Map
Bainbridge Overview
$25,137
PER CAPITA INCOME
$53,182
AVG FAMILY INCOME
$40,625
AVG HOUSEHOLD INCOME
20.1%
WAGE / INCOME GAP [ % ]
79.9¢/ $1
WAGE / INCOME GAP [ $ ]
0.44
INEQUALITY / GINI INDEX
615
TOTAL POPULATION
260
MALE POPULATION
355
FEMALE POPULATION
73.24
MALES / 100 FEMALES
136.54
FEMALES / 100 MALES
39.7
MEDIAN AGE
3.0
AVG FAMILY SIZE
2.4
AVG HOUSEHOLD SIZE
274
LABOR FORCE [ PEOPLE ]
54.2%
PERCENT IN LABOR FORCE
14.2%
UNEMPLOYMENT RATE
Bainbridge Zip Codes
Income in Bainbridge
Income Overview in Bainbridge
Per Capita Income in Bainbridge is $25,137, while median incomes of families and households are $53,182 and $40,625 respectively.
| Characteristic | Number | Measure |
| Per Capita Income | 615 | $25,137 |
| Median Family Income | 152 | $53,182 |
| Mean Family Income | 152 | $69,613 |
| Median Household Income | 249 | $40,625 |
| Mean Household Income | 249 | $59,846 |
| Income Deficit | 152 | $0 |
| Wage / Income Gap (%) | 615 | 20.07% |
| Wage / Income Gap ($) | 615 | 79.93¢ per $1 |
| Gini / Inequality Index | 615 | 0.44 |
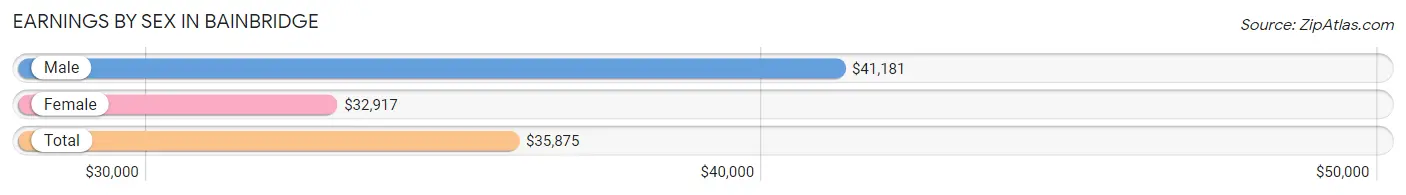
Earnings by Sex in Bainbridge
Average Earnings in Bainbridge are $35,875, $41,181 for men and $32,917 for women, a difference of 20.1%.
| Sex | Number | Average Earnings |
| Male | 123 (45.7%) | $41,181 |
| Female | 146 (54.3%) | $32,917 |
| Total | 269 (100.0%) | $35,875 |
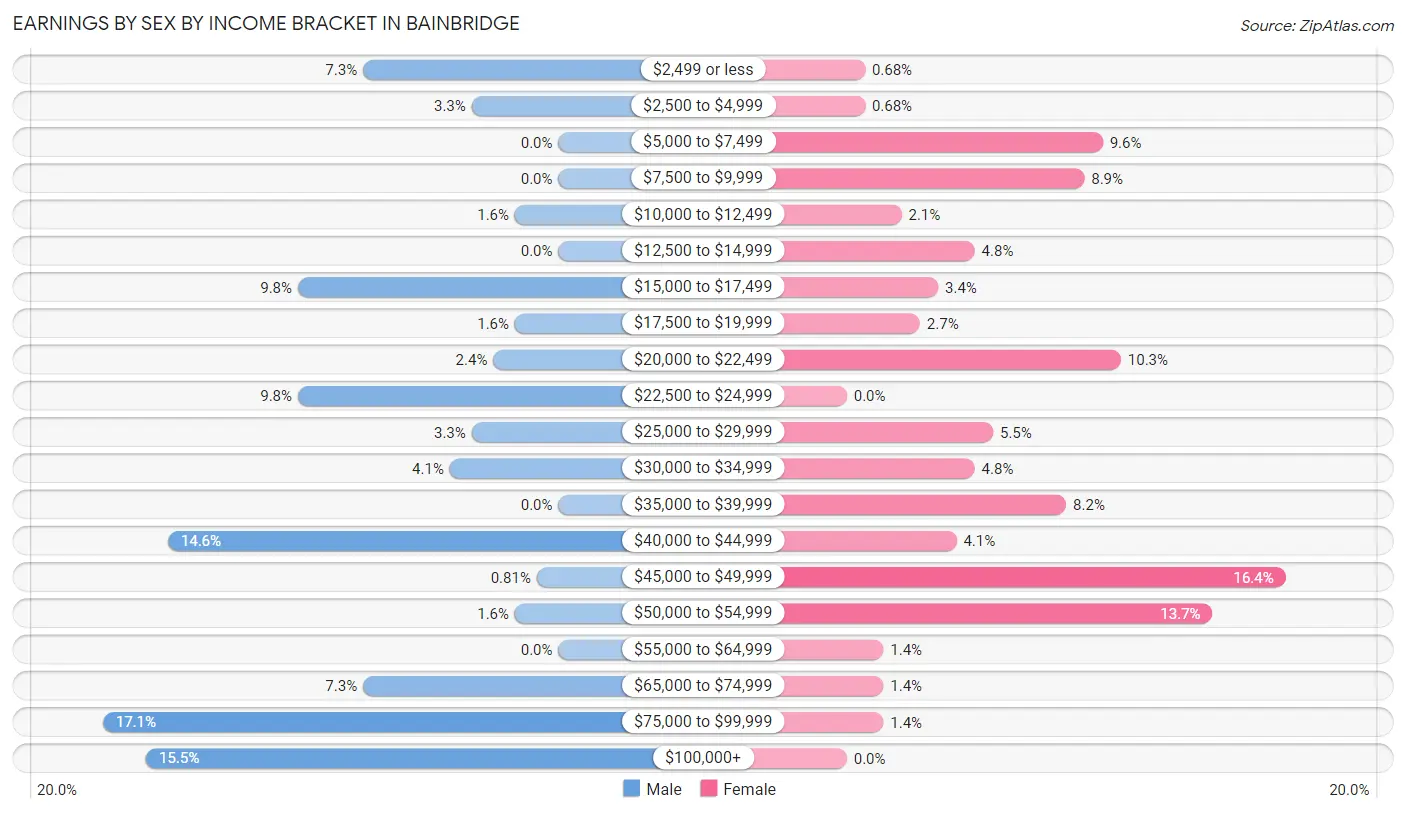
Earnings by Sex by Income Bracket in Bainbridge
The most common earnings brackets in Bainbridge are $75,000 to $99,999 for men (21 | 17.1%) and $45,000 to $49,999 for women (24 | 16.4%).
| Income | Male | Female |
| $2,499 or less | 9 (7.3%) | 1 (0.7%) |
| $2,500 to $4,999 | 4 (3.3%) | 1 (0.7%) |
| $5,000 to $7,499 | 0 (0.0%) | 14 (9.6%) |
| $7,500 to $9,999 | 0 (0.0%) | 13 (8.9%) |
| $10,000 to $12,499 | 2 (1.6%) | 3 (2.1%) |
| $12,500 to $14,999 | 0 (0.0%) | 7 (4.8%) |
| $15,000 to $17,499 | 12 (9.8%) | 5 (3.4%) |
| $17,500 to $19,999 | 2 (1.6%) | 4 (2.7%) |
| $20,000 to $22,499 | 3 (2.4%) | 15 (10.3%) |
| $22,500 to $24,999 | 12 (9.8%) | 0 (0.0%) |
| $25,000 to $29,999 | 4 (3.3%) | 8 (5.5%) |
| $30,000 to $34,999 | 5 (4.1%) | 7 (4.8%) |
| $35,000 to $39,999 | 0 (0.0%) | 12 (8.2%) |
| $40,000 to $44,999 | 18 (14.6%) | 6 (4.1%) |
| $45,000 to $49,999 | 1 (0.8%) | 24 (16.4%) |
| $50,000 to $54,999 | 2 (1.6%) | 20 (13.7%) |
| $55,000 to $64,999 | 0 (0.0%) | 2 (1.4%) |
| $65,000 to $74,999 | 9 (7.3%) | 2 (1.4%) |
| $75,000 to $99,999 | 21 (17.1%) | 2 (1.4%) |
| $100,000+ | 19 (15.4%) | 0 (0.0%) |
| Total | 123 (100.0%) | 146 (100.0%) |
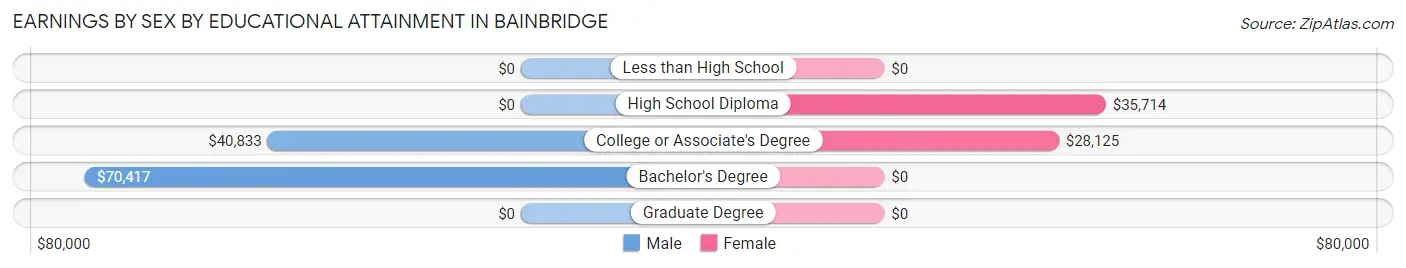
Earnings by Sex by Educational Attainment in Bainbridge
| Educational Attainment | Male Income | Female Income |
| Less than High School | - | - |
| High School Diploma | - | - |
| College or Associate's Degree | $40,833 | $28,125 |
| Bachelor's Degree | $70,417 | $0 |
| Graduate Degree | - | - |
| Total | - | - |
Family Income in Bainbridge
Family Income Brackets in Bainbridge
According to the Bainbridge family income data, there are 27 families falling into the $35,000 to $49,999 income range, which is the most common income bracket and makes up 17.8% of all families.
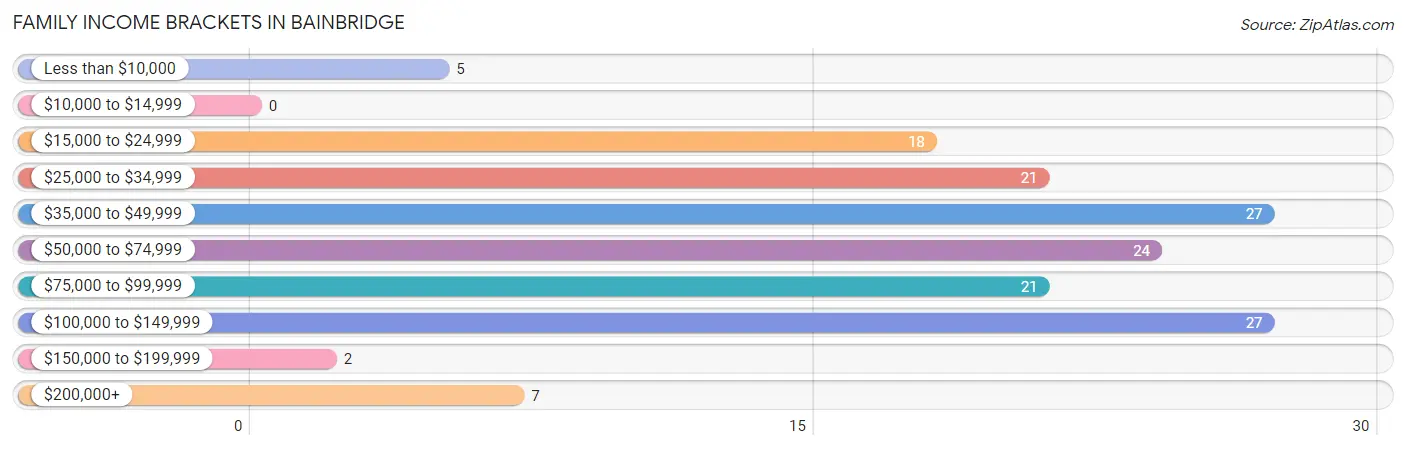
| Income Bracket | # Families | % Families |
| Less than $10,000 | 5 | 3.3% |
| $10,000 to $14,999 | 0 | 0.0% |
| $15,000 to $24,999 | 18 | 11.8% |
| $25,000 to $34,999 | 21 | 13.8% |
| $35,000 to $49,999 | 27 | 17.8% |
| $50,000 to $74,999 | 24 | 15.8% |
| $75,000 to $99,999 | 21 | 13.8% |
| $100,000 to $149,999 | 27 | 17.8% |
| $150,000 to $199,999 | 2 | 1.3% |
| $200,000+ | 7 | 4.6% |
Family Income by Famaliy Size in Bainbridge
5-person families (17 | 11.2%) account for the highest median family income in Bainbridge with $115,313 per family, while 2-person families (74 | 48.7%) have the highest median income of $27,500 per family member.
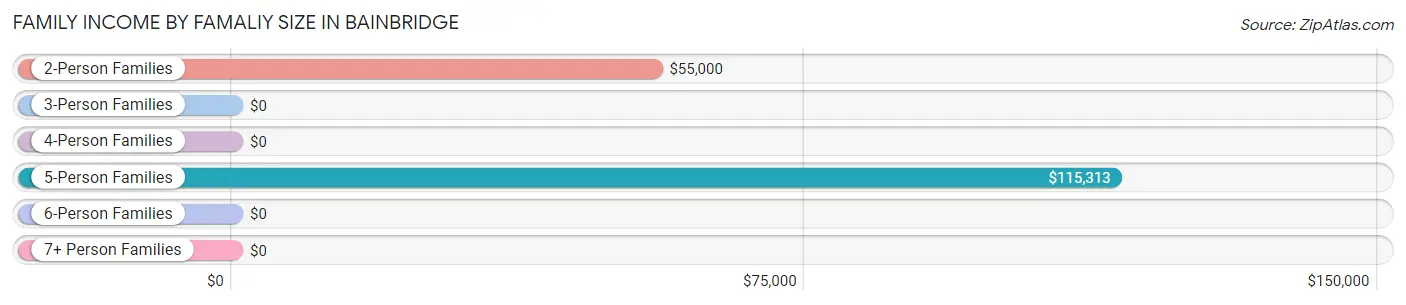
| Income Bracket | # Families | Median Income |
| 2-Person Families | 74 (48.7%) | $55,000 |
| 3-Person Families | 35 (23.0%) | $0 |
| 4-Person Families | 21 (13.8%) | $0 |
| 5-Person Families | 17 (11.2%) | $115,313 |
| 6-Person Families | 0 (0.0%) | $0 |
| 7+ Person Families | 5 (3.3%) | $0 |
| Total | 152 (100.0%) | $53,182 |
Family Income by Number of Earners in Bainbridge
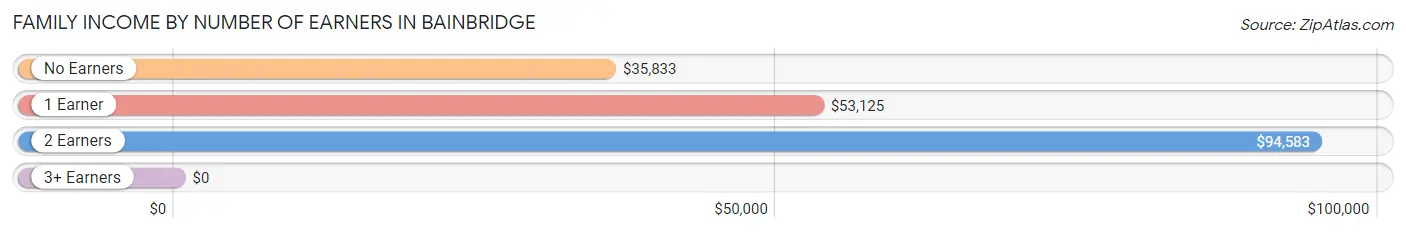
| Number of Earners | # Families | Median Income |
| No Earners | 42 (27.6%) | $35,833 |
| 1 Earner | 35 (23.0%) | $53,125 |
| 2 Earners | 68 (44.7%) | $94,583 |
| 3+ Earners | 7 (4.6%) | $0 |
| Total | 152 (100.0%) | $53,182 |
Household Income in Bainbridge
Household Income Brackets in Bainbridge
With 50 households falling in the category, the $100,000 to $149,999 income range is the most frequent in Bainbridge, accounting for 20.1% of all households. In contrast, only 4 households (1.6%) fall into the $150,000 to $199,999 income bracket, making it the least populous group.
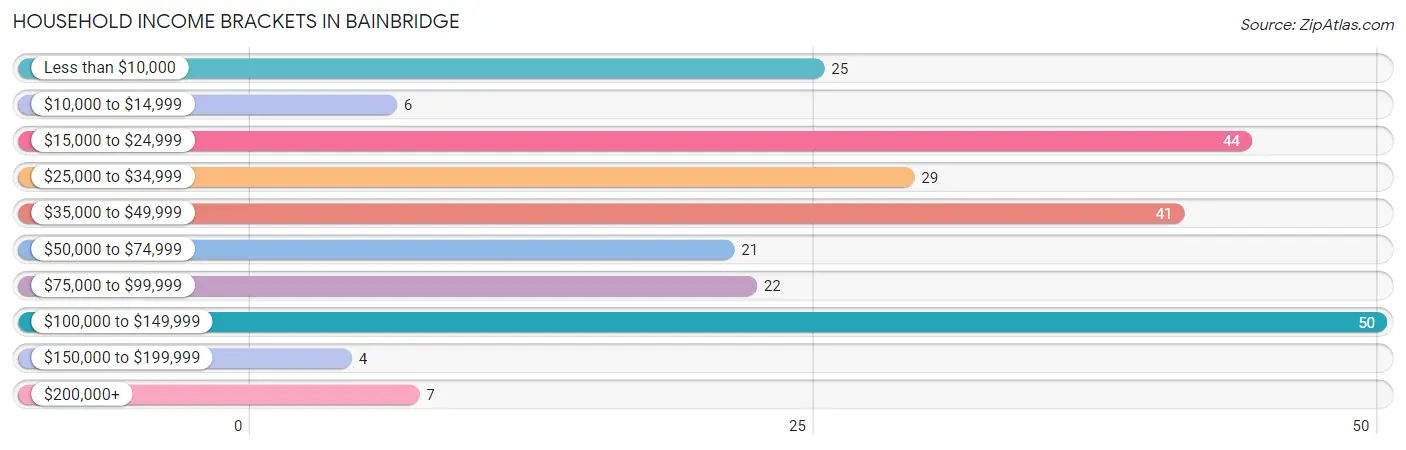
| Income Bracket | # Households | % Households |
| Less than $10,000 | 25 | 10.0% |
| $10,000 to $14,999 | 6 | 2.4% |
| $15,000 to $24,999 | 44 | 17.7% |
| $25,000 to $34,999 | 29 | 11.6% |
| $35,000 to $49,999 | 41 | 16.5% |
| $50,000 to $74,999 | 21 | 8.4% |
| $75,000 to $99,999 | 22 | 8.8% |
| $100,000 to $149,999 | 50 | 20.1% |
| $150,000 to $199,999 | 4 | 1.6% |
| $200,000+ | 7 | 2.8% |
Household Income by Householder Age in Bainbridge
The median household income in Bainbridge is $40,625, with the highest median household income of $105,875 found in the 15 to 24 years age bracket for the primary householder. A total of 17 households (6.8%) fall into this category. Meanwhile, the 65+ years age bracket for the primary householder has the lowest median household income of $32,292, with 87 households (34.9%) in this group.
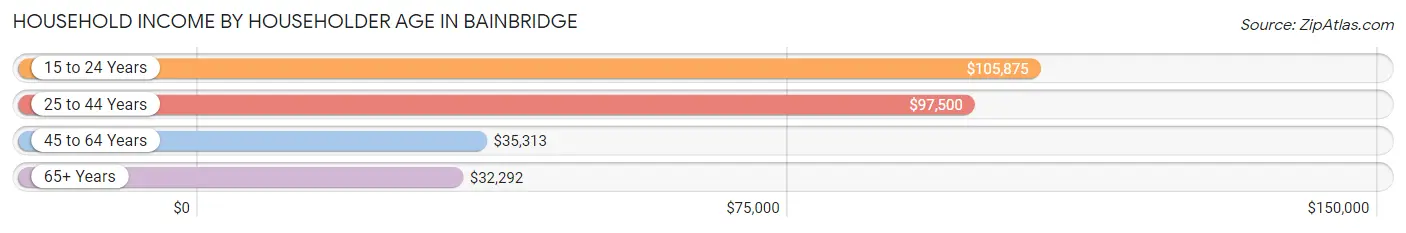
| Income Bracket | # Households | Median Income |
| 15 to 24 Years | 17 (6.8%) | $105,875 |
| 25 to 44 Years | 72 (28.9%) | $97,500 |
| 45 to 64 Years | 73 (29.3%) | $35,313 |
| 65+ Years | 87 (34.9%) | $32,292 |
| Total | 249 (100.0%) | $40,625 |
Poverty in Bainbridge
Income Below Poverty by Sex and Age in Bainbridge
With 29.8% poverty level for males and 27.4% for females among the residents of Bainbridge, 5 year old males and 55 to 64 year old females are the most vulnerable to poverty, with 2 males (100.0%) and 32 females (60.4%) in their respective age groups living below the poverty level.
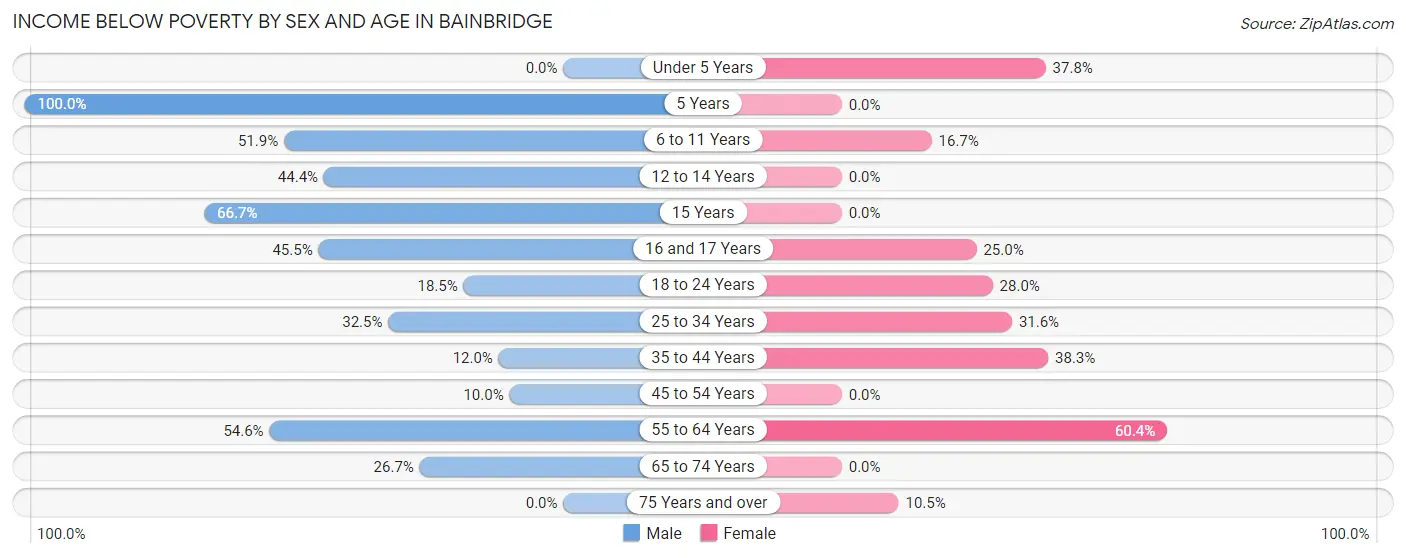
| Age Bracket | Male | Female |
| Under 5 Years | 0 (0.0%) | 14 (37.8%) |
| 5 Years | 2 (100.0%) | 0 (0.0%) |
| 6 to 11 Years | 14 (51.8%) | 2 (16.7%) |
| 12 to 14 Years | 4 (44.4%) | 0 (0.0%) |
| 15 Years | 2 (66.7%) | 0 (0.0%) |
| 16 and 17 Years | 5 (45.5%) | 3 (25.0%) |
| 18 to 24 Years | 5 (18.5%) | 14 (28.0%) |
| 25 to 34 Years | 13 (32.5%) | 6 (31.6%) |
| 35 to 44 Years | 3 (12.0%) | 18 (38.3%) |
| 45 to 54 Years | 2 (10.0%) | 0 (0.0%) |
| 55 to 64 Years | 18 (54.5%) | 32 (60.4%) |
| 65 to 74 Years | 8 (26.7%) | 0 (0.0%) |
| 75 Years and over | 0 (0.0%) | 4 (10.5%) |
| Total | 76 (29.8%) | 93 (27.4%) |
Income Above Poverty by Sex and Age in Bainbridge
According to the poverty statistics in Bainbridge, males aged under 5 years and females aged 12 to 14 years are the age groups that are most secure financially, with 100.0% of males and 100.0% of females in these age groups living above the poverty line.
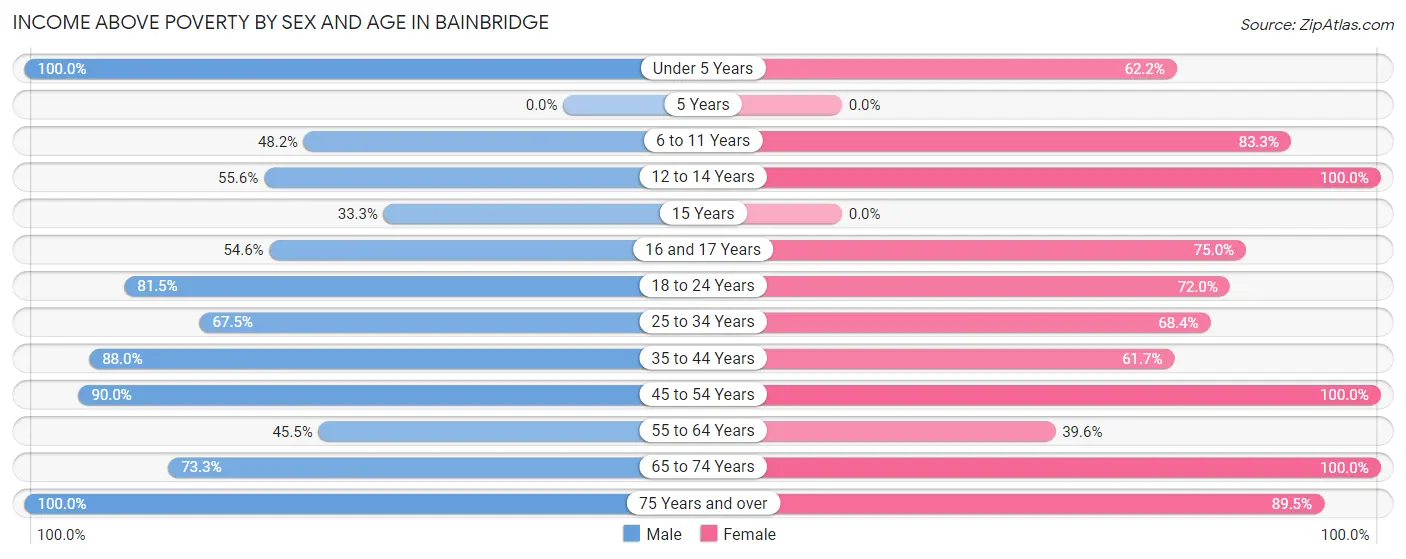
| Age Bracket | Male | Female |
| Under 5 Years | 5 (100.0%) | 23 (62.2%) |
| 5 Years | 0 (0.0%) | 0 (0.0%) |
| 6 to 11 Years | 13 (48.1%) | 10 (83.3%) |
| 12 to 14 Years | 5 (55.6%) | 14 (100.0%) |
| 15 Years | 1 (33.3%) | 0 (0.0%) |
| 16 and 17 Years | 6 (54.5%) | 9 (75.0%) |
| 18 to 24 Years | 22 (81.5%) | 36 (72.0%) |
| 25 to 34 Years | 27 (67.5%) | 13 (68.4%) |
| 35 to 44 Years | 22 (88.0%) | 29 (61.7%) |
| 45 to 54 Years | 18 (90.0%) | 19 (100.0%) |
| 55 to 64 Years | 15 (45.5%) | 21 (39.6%) |
| 65 to 74 Years | 22 (73.3%) | 39 (100.0%) |
| 75 Years and over | 23 (100.0%) | 34 (89.5%) |
| Total | 179 (70.2%) | 247 (72.7%) |
Income Below Poverty Among Married-Couple Families in Bainbridge
The poverty statistics for married-couple families in Bainbridge show that 22.6% or 24 of the total 106 families live below the poverty line. Families with 1 or 2 children have the highest poverty rate of 57.1%, comprising of 20 families. On the other hand, families with no children have the lowest poverty rate of 1.8%, which includes 1 families.
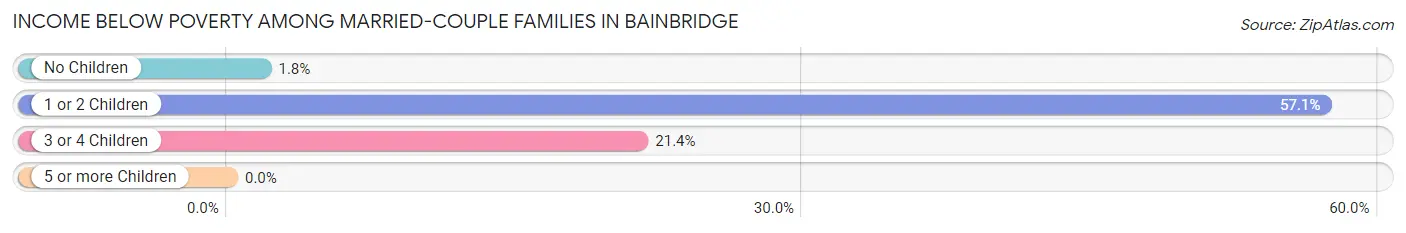
| Children | Above Poverty | Below Poverty |
| No Children | 56 (98.3%) | 1 (1.8%) |
| 1 or 2 Children | 15 (42.9%) | 20 (57.1%) |
| 3 or 4 Children | 11 (78.6%) | 3 (21.4%) |
| 5 or more Children | 0 (0.0%) | 0 (0.0%) |
| Total | 82 (77.4%) | 24 (22.6%) |
Income Below Poverty Among Single-Parent Households in Bainbridge
According to the poverty data in Bainbridge, 80.0% or 4 single-father households and 4.9% or 2 single-mother households are living below the poverty line. Among single-father households, those with no children have the highest poverty rate, with 2 households (100.0%) experiencing poverty. Likewise, among single-mother households, those with 3 or 4 children have the highest poverty rate, with 2 households (100.0%) falling below the poverty line.
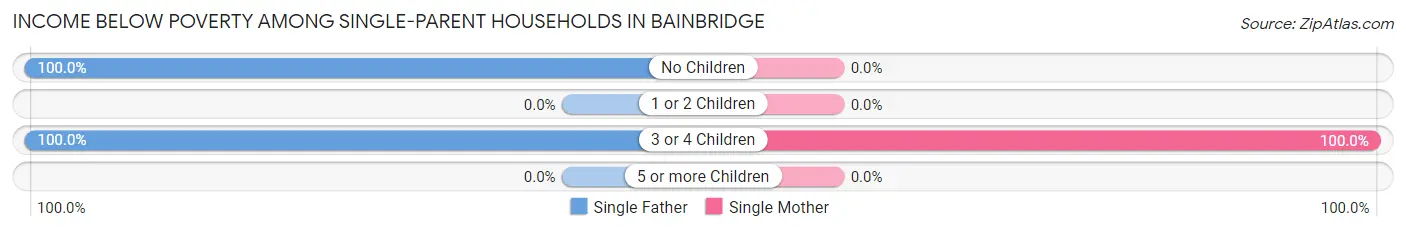
| Children | Single Father | Single Mother |
| No Children | 2 (100.0%) | 0 (0.0%) |
| 1 or 2 Children | 0 (0.0%) | 0 (0.0%) |
| 3 or 4 Children | 2 (100.0%) | 2 (100.0%) |
| 5 or more Children | 0 (0.0%) | 0 (0.0%) |
| Total | 4 (80.0%) | 2 (4.9%) |
Income Below Poverty Among Married-Couple vs Single-Parent Households in Bainbridge
The poverty data for Bainbridge shows that 24 of the married-couple family households (22.6%) and 6 of the single-parent households (13.0%) are living below the poverty level. Within the married-couple family households, those with 1 or 2 children have the highest poverty rate, with 20 households (57.1%) falling below the poverty line. Among the single-parent households, those with 3 or 4 children have the highest poverty rate, with 4 household (100.0%) living below poverty.
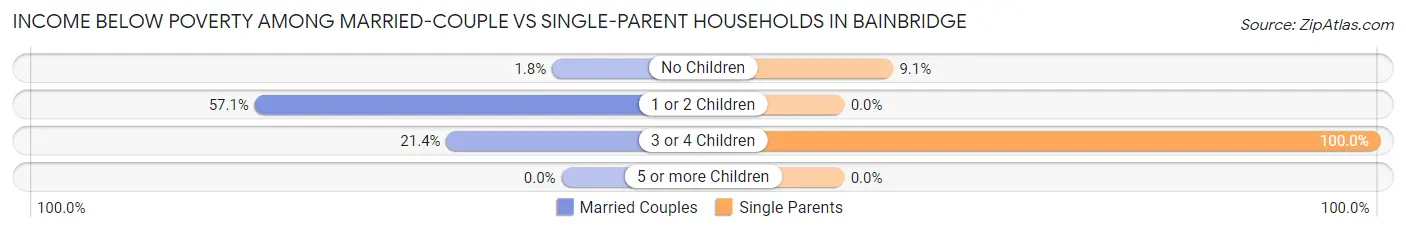
| Children | Married-Couple Families | Single-Parent Households |
| No Children | 1 (1.8%) | 2 (9.1%) |
| 1 or 2 Children | 20 (57.1%) | 0 (0.0%) |
| 3 or 4 Children | 3 (21.4%) | 4 (100.0%) |
| 5 or more Children | 0 (0.0%) | 0 (0.0%) |
| Total | 24 (22.6%) | 6 (13.0%) |
Race in Bainbridge
The most populous races in Bainbridge are White / Caucasian (581 | 94.5%), Two or more Races (22 | 3.6%), and Black / African American (12 | 1.9%).
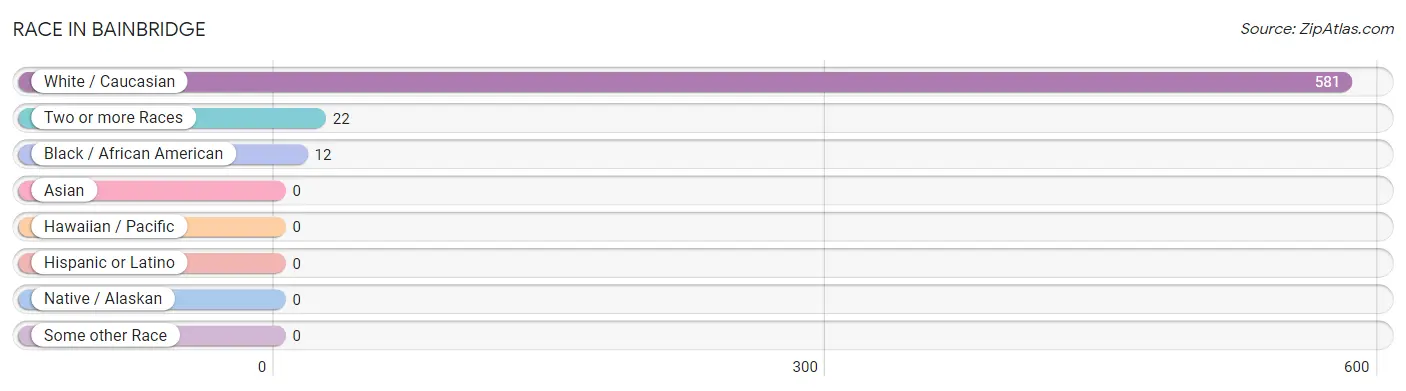
| Race | # Population | % Population |
| Asian | 0 | 0.0% |
| Black / African American | 12 | 1.9% |
| Hawaiian / Pacific | 0 | 0.0% |
| Hispanic or Latino | 0 | 0.0% |
| Native / Alaskan | 0 | 0.0% |
| White / Caucasian | 581 | 94.5% |
| Two or more Races | 22 | 3.6% |
| Some other Race | 0 | 0.0% |
| Total | 615 | 100.0% |
Ancestry in Bainbridge
The most populous ancestries reported in Bainbridge are German (114 | 18.5%), English (61 | 9.9%), American (47 | 7.6%), Italian (38 | 6.2%), and Irish (37 | 6.0%), together accounting for 48.3% of all Bainbridge residents.
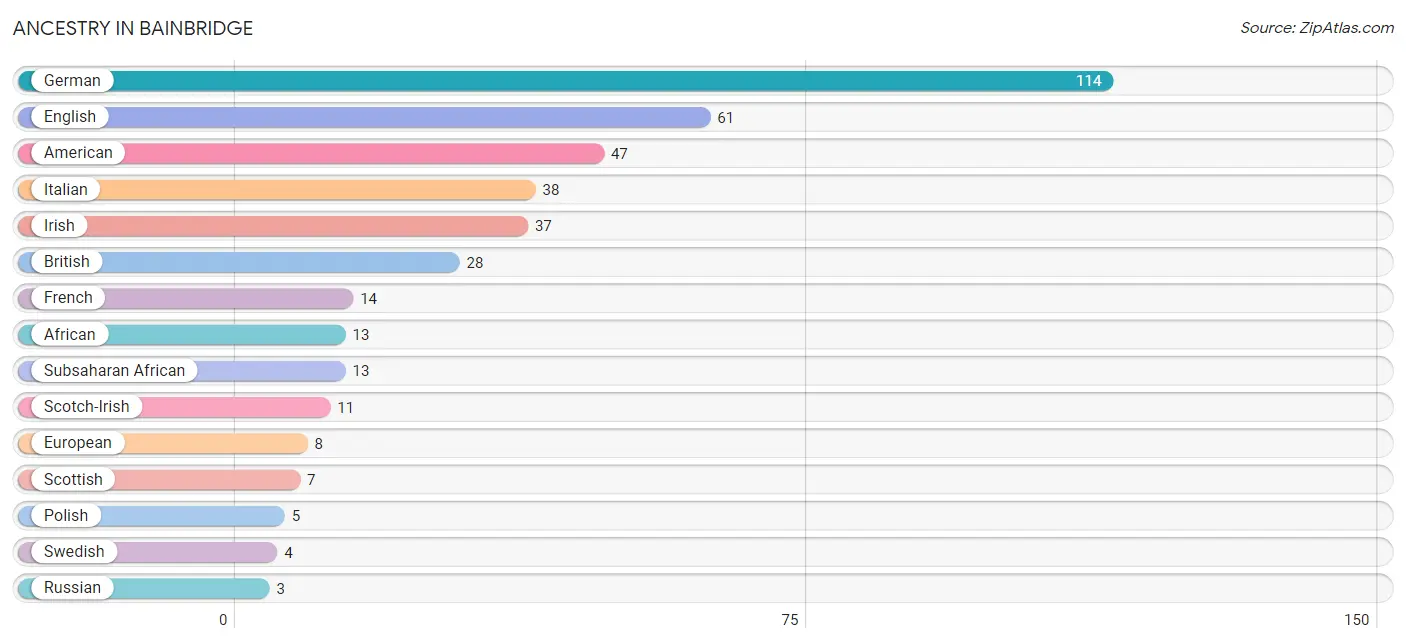
| Ancestry | # Population | % Population |
| African | 13 | 2.1% |
| American | 47 | 7.6% |
| British | 28 | 4.5% |
| Dutch | 2 | 0.3% |
| English | 61 | 9.9% |
| European | 8 | 1.3% |
| French | 14 | 2.3% |
| German | 114 | 18.5% |
| Irish | 37 | 6.0% |
| Italian | 38 | 6.2% |
| Polish | 5 | 0.8% |
| Russian | 3 | 0.5% |
| Scotch-Irish | 11 | 1.8% |
| Scottish | 7 | 1.1% |
| Subsaharan African | 13 | 2.1% |
| Swedish | 4 | 0.6% |
| Swiss | 2 | 0.3% | View All 17 Rows |
Immigrants in Bainbridge
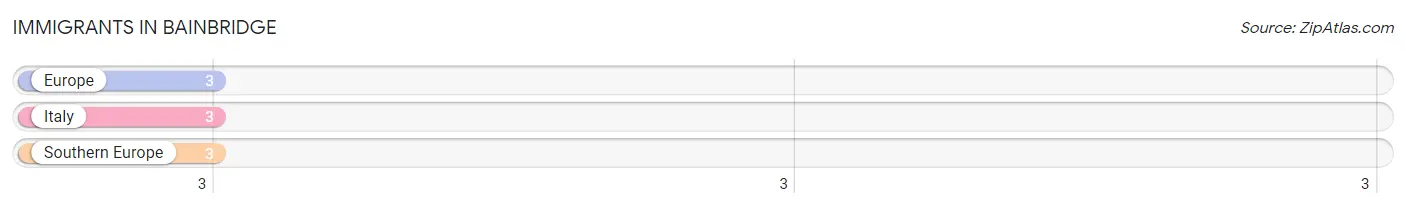
The most numerous immigrant groups reported in Bainbridge came from Europe (3 | 0.5%), Italy (3 | 0.5%), and Southern Europe (3 | 0.5%), together accounting for 1.5% of all Bainbridge residents.
| Immigration Origin | # Population | % Population |
| Europe | 3 | 0.5% |
| Italy | 3 | 0.5% |
| Southern Europe | 3 | 0.5% | View All 3 Rows |
Sex and Age in Bainbridge
Sex and Age in Bainbridge
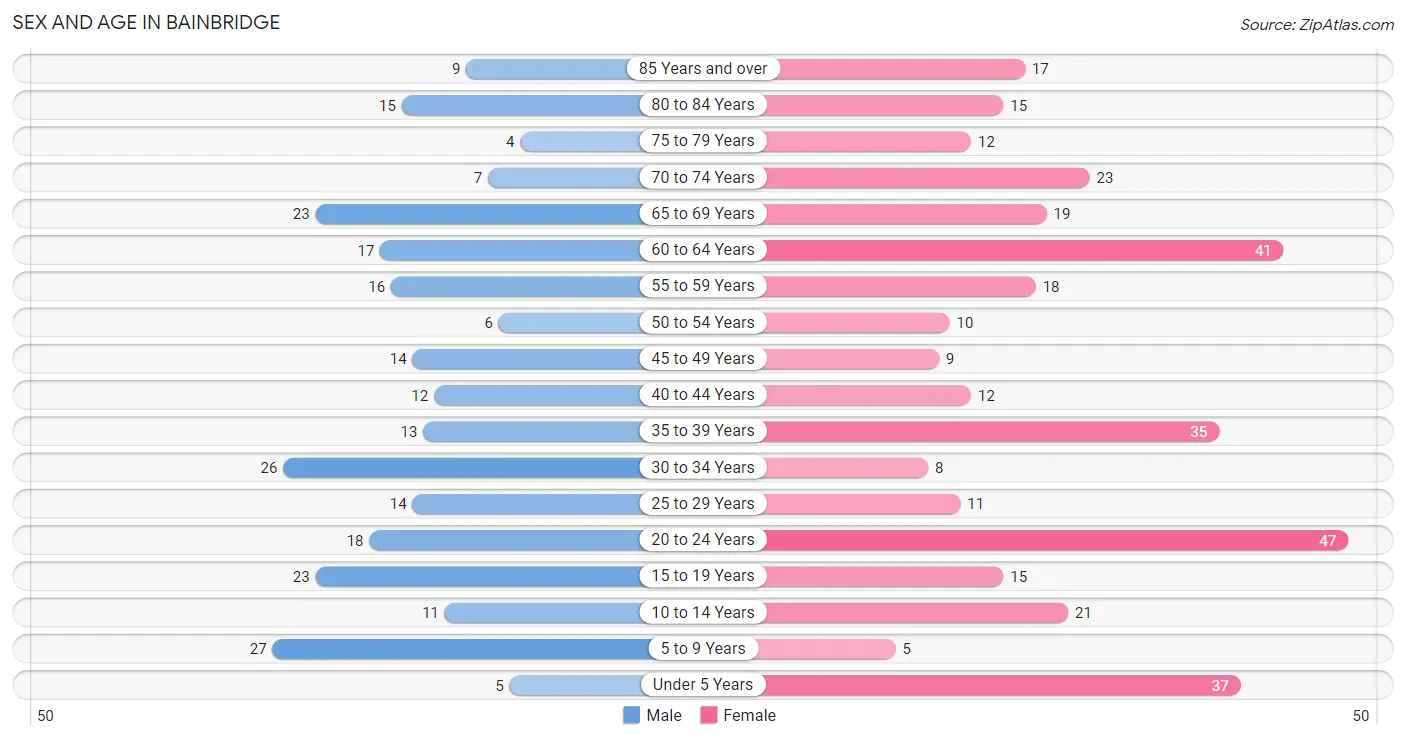
The most populous age groups in Bainbridge are 5 to 9 Years (27 | 10.4%) for men and 20 to 24 Years (47 | 13.2%) for women.
| Age Bracket | Male | Female |
| Under 5 Years | 5 (1.9%) | 37 (10.4%) |
| 5 to 9 Years | 27 (10.4%) | 5 (1.4%) |
| 10 to 14 Years | 11 (4.2%) | 21 (5.9%) |
| 15 to 19 Years | 23 (8.8%) | 15 (4.2%) |
| 20 to 24 Years | 18 (6.9%) | 47 (13.2%) |
| 25 to 29 Years | 14 (5.4%) | 11 (3.1%) |
| 30 to 34 Years | 26 (10.0%) | 8 (2.2%) |
| 35 to 39 Years | 13 (5.0%) | 35 (9.9%) |
| 40 to 44 Years | 12 (4.6%) | 12 (3.4%) |
| 45 to 49 Years | 14 (5.4%) | 9 (2.5%) |
| 50 to 54 Years | 6 (2.3%) | 10 (2.8%) |
| 55 to 59 Years | 16 (6.1%) | 18 (5.1%) |
| 60 to 64 Years | 17 (6.5%) | 41 (11.6%) |
| 65 to 69 Years | 23 (8.8%) | 19 (5.3%) |
| 70 to 74 Years | 7 (2.7%) | 23 (6.5%) |
| 75 to 79 Years | 4 (1.5%) | 12 (3.4%) |
| 80 to 84 Years | 15 (5.8%) | 15 (4.2%) |
| 85 Years and over | 9 (3.5%) | 17 (4.8%) |
| Total | 260 (100.0%) | 355 (100.0%) |
Families and Households in Bainbridge
Median Family Size in Bainbridge
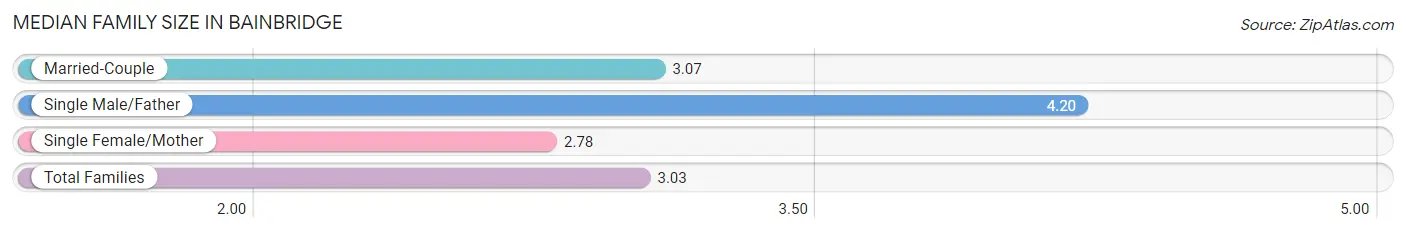
The median family size in Bainbridge is 3.03 persons per family, with single male/father families (5 | 3.3%) accounting for the largest median family size of 4.2 persons per family. On the other hand, single female/mother families (41 | 27.0%) represent the smallest median family size with 2.78 persons per family.
| Family Type | # Families | Family Size |
| Married-Couple | 106 (69.7%) | 3.07 |
| Single Male/Father | 5 (3.3%) | 4.20 |
| Single Female/Mother | 41 (27.0%) | 2.78 |
| Total Families | 152 (100.0%) | 3.03 |
Median Household Size in Bainbridge
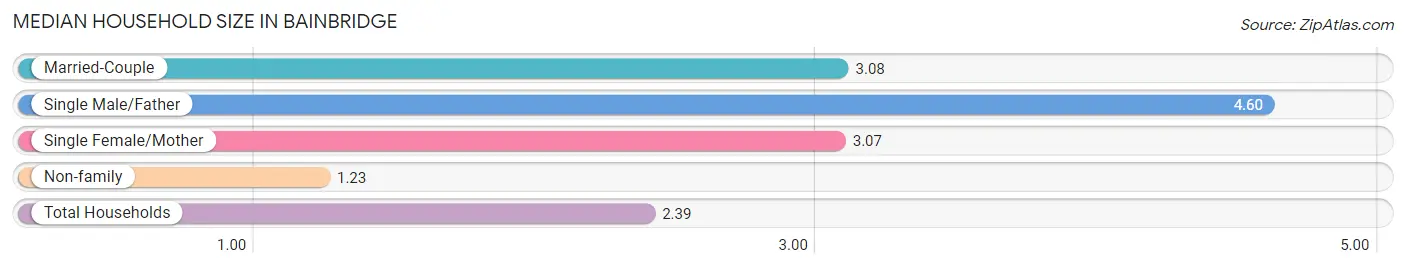
The median household size in Bainbridge is 2.39 persons per household, with single male/father households (5 | 2.0%) accounting for the largest median household size of 4.6 persons per household. non-family households (97 | 39.0%) represent the smallest median household size with 1.23 persons per household.
| Household Type | # Households | Household Size |
| Married-Couple | 106 (42.6%) | 3.08 |
| Single Male/Father | 5 (2.0%) | 4.60 |
| Single Female/Mother | 41 (16.5%) | 3.07 |
| Non-family | 97 (39.0%) | 1.23 |
| Total Households | 249 (100.0%) | 2.39 |
Household Size by Marriage Status in Bainbridge
Out of a total of 249 households in Bainbridge, 152 (61.0%) are family households, while 97 (39.0%) are nonfamily households. The most numerous type of family households are 2-person households, comprising 63, and the most common type of nonfamily households are 1-person households, comprising 76.
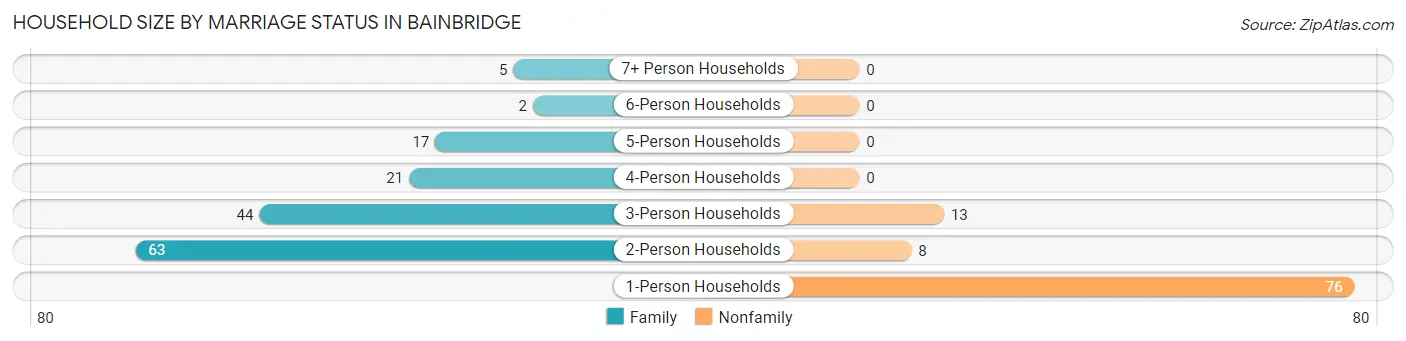
| Household Size | Family Households | Nonfamily Households |
| 1-Person Households | - | 76 (30.5%) |
| 2-Person Households | 63 (25.3%) | 8 (3.2%) |
| 3-Person Households | 44 (17.7%) | 13 (5.2%) |
| 4-Person Households | 21 (8.4%) | 0 (0.0%) |
| 5-Person Households | 17 (6.8%) | 0 (0.0%) |
| 6-Person Households | 2 (0.8%) | 0 (0.0%) |
| 7+ Person Households | 5 (2.0%) | 0 (0.0%) |
| Total | 152 (61.0%) | 97 (39.0%) |
Female Fertility in Bainbridge
Fertility by Age in Bainbridge
Average fertility rate in Bainbridge is 99.0 births per 1,000 women. Women in the age bracket of 20 to 34 years have the highest fertility rate with 212.0 births per 1,000 women. Women in the age bracket of 20 to 34 years acount for 100.0% of all women with births.
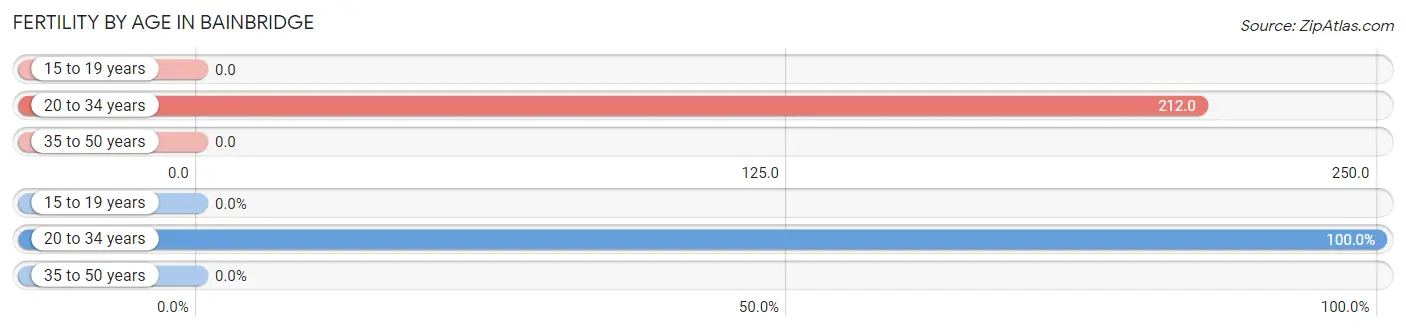
| Age Bracket | Women with Births | Births / 1,000 Women |
| 15 to 19 years | 0 (0.0%) | 0.0 |
| 20 to 34 years | 14 (100.0%) | 212.0 |
| 35 to 50 years | 0 (0.0%) | 0.0 |
| Total | 14 (100.0%) | 99.0 |
Fertility by Age by Marriage Status in Bainbridge
14.3% of women with births (14) in Bainbridge are married. The highest percentage of unmarried women with births falls into 20 to 34 years age bracket with 85.7% of them unmarried at the time of birth, while the lowest percentage of unmarried women with births belong to 20 to 34 years age bracket with 85.7% of them unmarried.
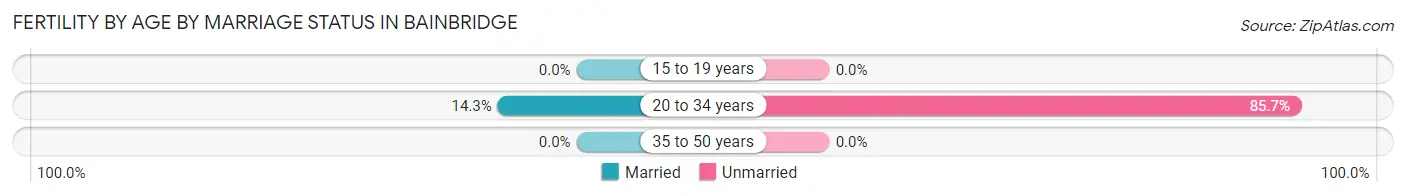
| Age Bracket | Married | Unmarried |
| 15 to 19 years | 0 (0.0%) | 0 (0.0%) |
| 20 to 34 years | 2 (14.3%) | 12 (85.7%) |
| 35 to 50 years | 0 (0.0%) | 0 (0.0%) |
| Total | 2 (14.3%) | 12 (85.7%) |
Fertility by Education in Bainbridge
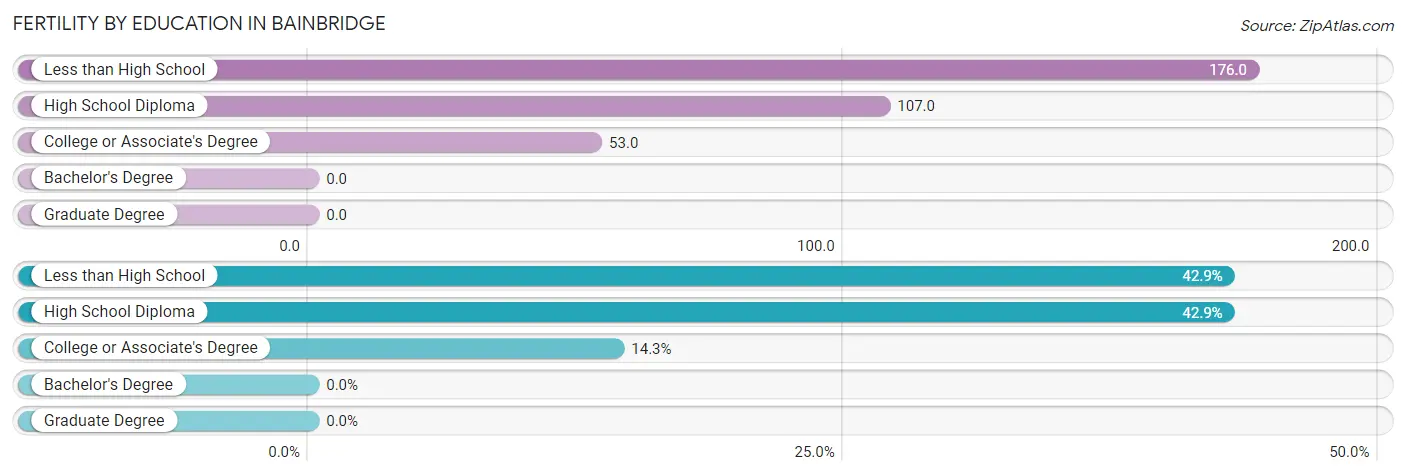
| Educational Attainment | Women with Births | Births / 1,000 Women |
| Less than High School | 6 (42.9%) | 176.0 |
| High School Diploma | 6 (42.9%) | 107.0 |
| College or Associate's Degree | 2 (14.3%) | 53.0 |
| Bachelor's Degree | 0 (0.0%) | 0.0 |
| Graduate Degree | 0 (0.0%) | 0.0 |
| Total | 14 (100.0%) | 99.0 |
Fertility by Education by Marriage Status in Bainbridge
85.7% of women with births in Bainbridge are unmarried. Women with the educational attainment of college or associate's degree are most likely to be married with 100.0% of them married at childbirth, while women with the educational attainment of less than high school are least likely to be married with 100.0% of them unmarried at childbirth.
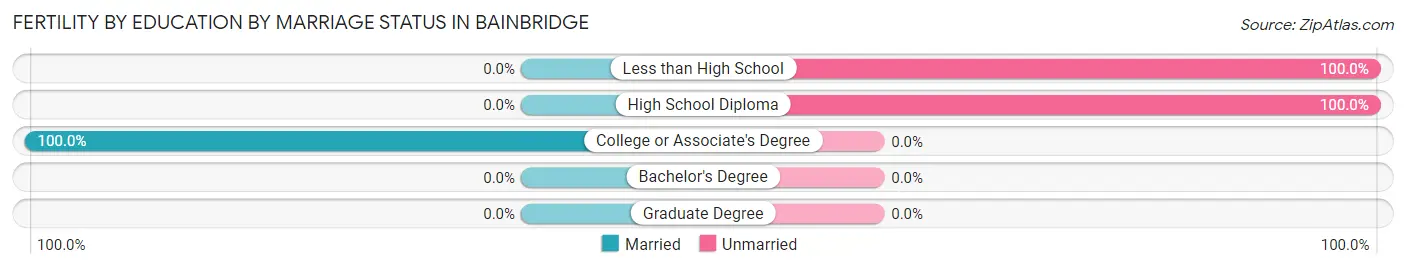
| Educational Attainment | Married | Unmarried |
| Less than High School | 0 (0.0%) | 6 (100.0%) |
| High School Diploma | 0 (0.0%) | 6 (100.0%) |
| College or Associate's Degree | 2 (100.0%) | 0 (0.0%) |
| Bachelor's Degree | 0 (0.0%) | 0 (0.0%) |
| Graduate Degree | 0 (0.0%) | 0 (0.0%) |
| Total | 2 (14.3%) | 12 (85.7%) |
Employment Characteristics in Bainbridge
Employment by Class of Employer in Bainbridge
Among the 219 employed individuals in Bainbridge, private company employees (145 | 66.2%), not-for-profit organizations (30 | 13.7%), and local government employees (19 | 8.7%) make up the most common classes of employment.
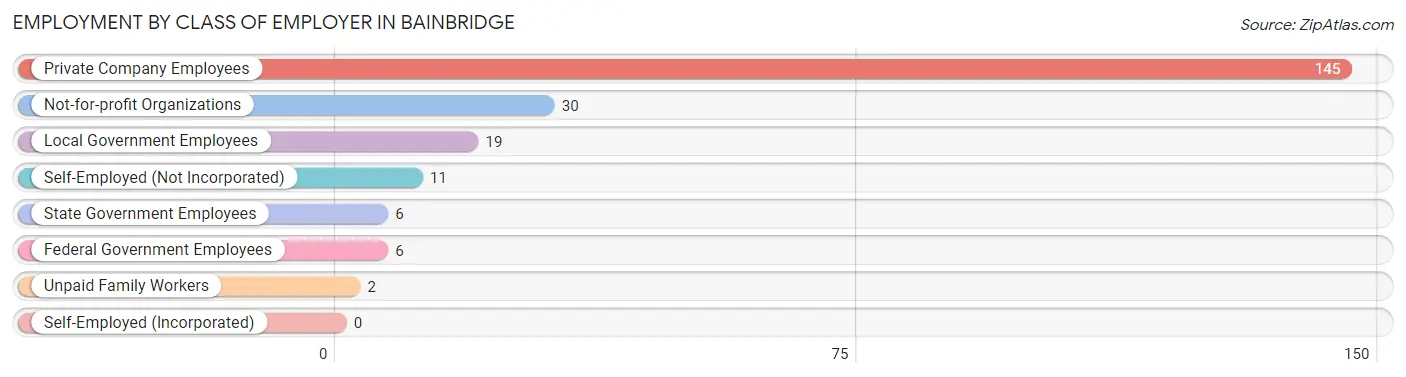
| Employer Class | # Employees | % Employees |
| Private Company Employees | 145 | 66.2% |
| Self-Employed (Incorporated) | 0 | 0.0% |
| Self-Employed (Not Incorporated) | 11 | 5.0% |
| Not-for-profit Organizations | 30 | 13.7% |
| Local Government Employees | 19 | 8.7% |
| State Government Employees | 6 | 2.7% |
| Federal Government Employees | 6 | 2.7% |
| Unpaid Family Workers | 2 | 0.9% |
| Total | 219 | 100.0% |
Employment Status by Age in Bainbridge
According to the labor force statistics for Bainbridge, out of the total population over 16 years of age (506), 54.2% or 274 individuals are in the labor force, with 14.2% or 39 of them unemployed. The age group with the highest labor force participation rate is 20 to 24 years, with 100.0% or 65 individuals in the labor force. Within the labor force, the 30 to 34 years age range has the highest percentage of unemployed individuals, with 53.6% or 15 of them being unemployed.
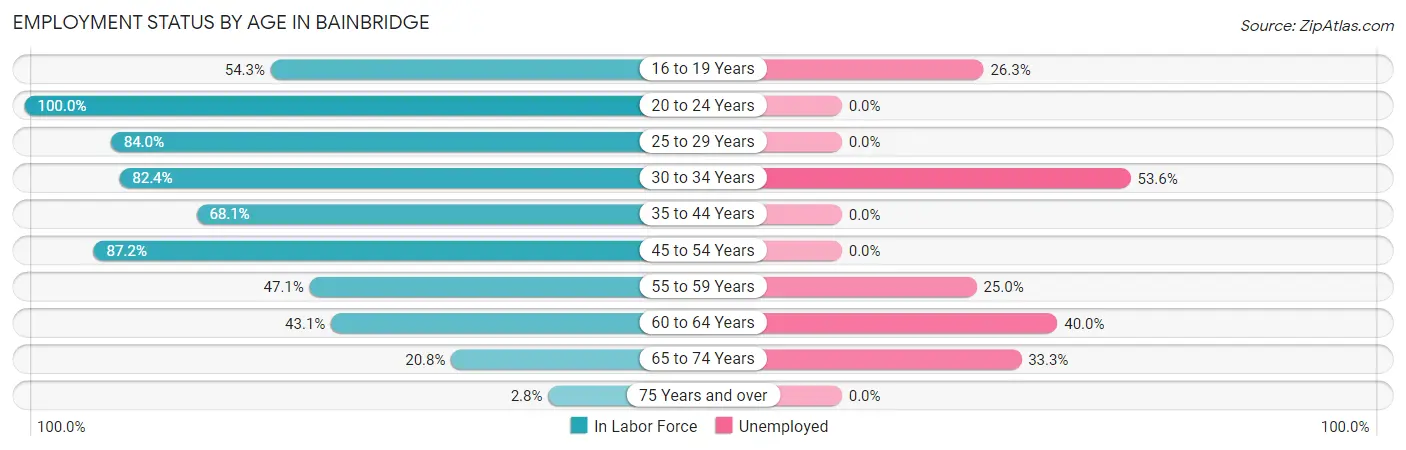
| Age Bracket | In Labor Force | Unemployed |
| 16 to 19 Years | 19 (54.3%) | 5 (26.3%) |
| 20 to 24 Years | 65 (100.0%) | 0 (0.0%) |
| 25 to 29 Years | 21 (84.0%) | 0 (0.0%) |
| 30 to 34 Years | 28 (82.4%) | 15 (53.6%) |
| 35 to 44 Years | 49 (68.1%) | 0 (0.0%) |
| 45 to 54 Years | 34 (87.2%) | 0 (0.0%) |
| 55 to 59 Years | 16 (47.1%) | 4 (25.0%) |
| 60 to 64 Years | 25 (43.1%) | 10 (40.0%) |
| 65 to 74 Years | 15 (20.8%) | 5 (33.3%) |
| 75 Years and over | 2 (2.8%) | 0 (0.0%) |
| Total | 274 (54.2%) | 39 (14.2%) |
Employment Status by Educational Attainment in Bainbridge
According to labor force statistics for Bainbridge, 66.0% of individuals (173) out of the total population between 25 and 64 years of age (262) are in the labor force, with 16.8% or 29 of them being unemployed. The group with the highest labor force participation rate are those with the educational attainment of bachelor's degree or higher, with 90.7% or 39 individuals in the labor force. Within the labor force, individuals with bachelor's degree or higher education have the highest percentage of unemployment, with 25.6% or 10 of them being unemployed.
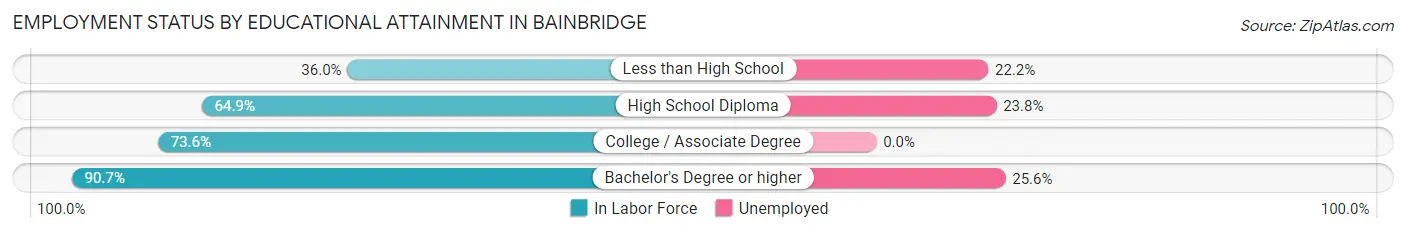
| Educational Attainment | In Labor Force | Unemployed |
| Less than High School | 18 (36.0%) | 11 (22.2%) |
| High School Diploma | 63 (64.9%) | 23 (23.8%) |
| College / Associate Degree | 53 (73.6%) | 0 (0.0%) |
| Bachelor's Degree or higher | 39 (90.7%) | 11 (25.6%) |
| Total | 173 (66.0%) | 44 (16.8%) |
Employment Occupations by Sex in Bainbridge
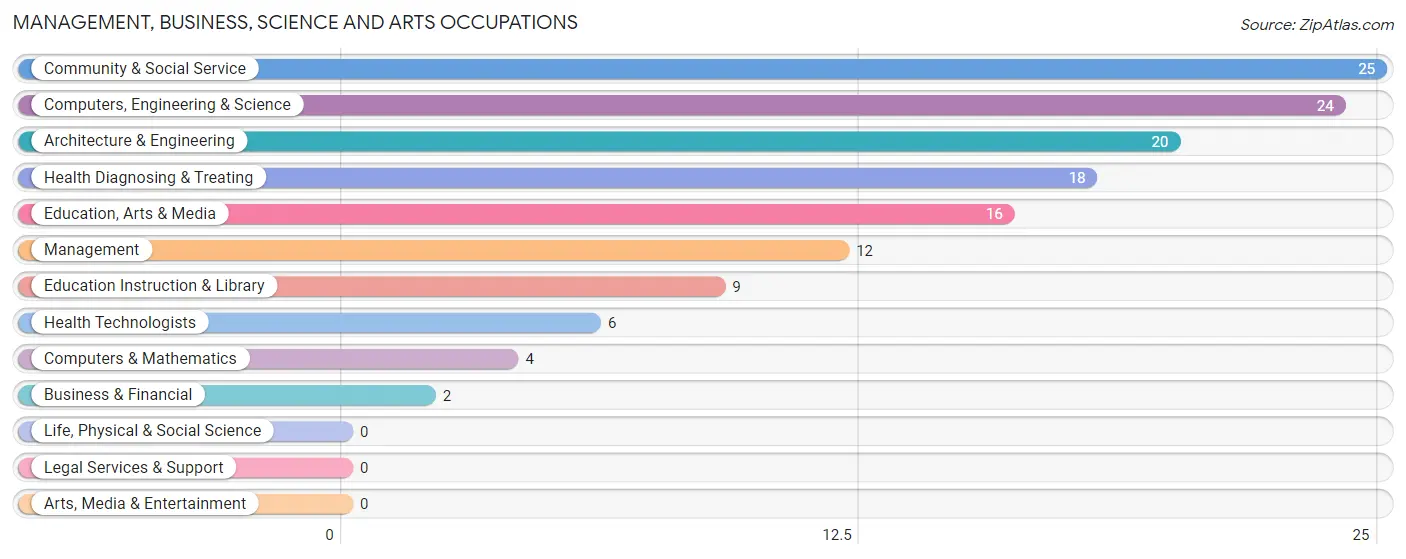
Management, Business, Science and Arts Occupations
The most common Management, Business, Science and Arts occupations in Bainbridge are Community & Social Service (25 | 10.6%), Computers, Engineering & Science (24 | 10.2%), Architecture & Engineering (20 | 8.5%), Health Diagnosing & Treating (18 | 7.7%), and Education, Arts & Media (16 | 6.8%).
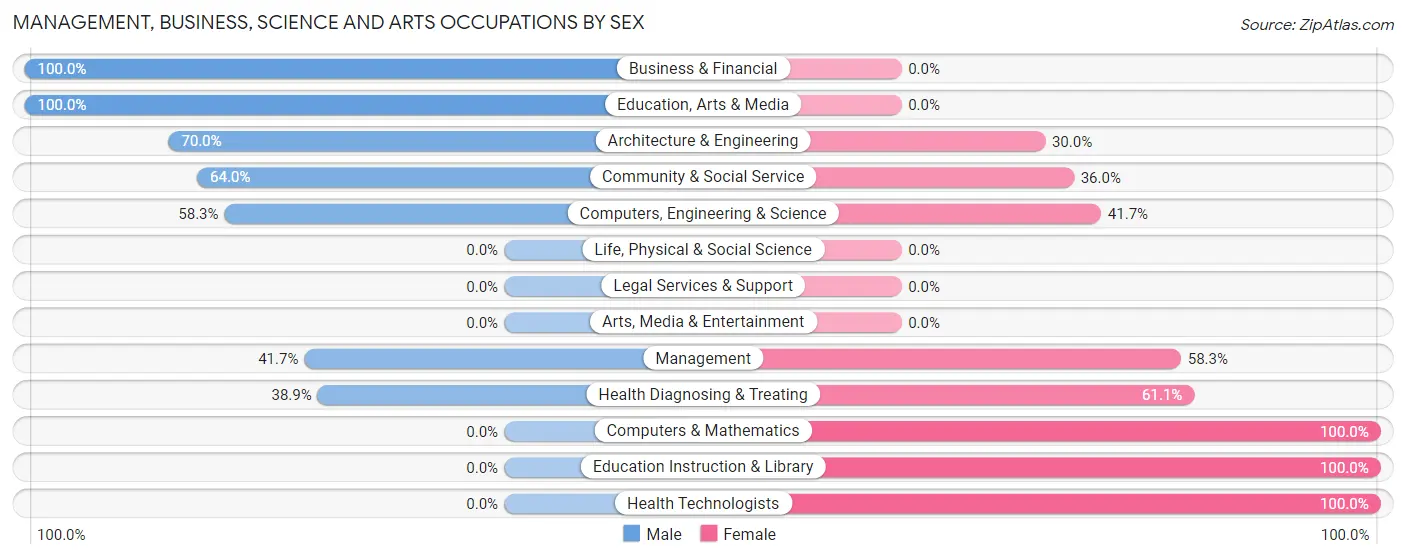
Management, Business, Science and Arts Occupations by Sex
Within the Management, Business, Science and Arts occupations in Bainbridge, the most male-oriented occupations are Business & Financial (100.0%), Education, Arts & Media (100.0%), and Architecture & Engineering (70.0%), while the most female-oriented occupations are Computers & Mathematics (100.0%), Education Instruction & Library (100.0%), and Health Technologists (100.0%).
| Occupation | Male | Female |
| Management | 5 (41.7%) | 7 (58.3%) |
| Business & Financial | 2 (100.0%) | 0 (0.0%) |
| Computers, Engineering & Science | 14 (58.3%) | 10 (41.7%) |
| Computers & Mathematics | 0 (0.0%) | 4 (100.0%) |
| Architecture & Engineering | 14 (70.0%) | 6 (30.0%) |
| Life, Physical & Social Science | 0 (0.0%) | 0 (0.0%) |
| Community & Social Service | 16 (64.0%) | 9 (36.0%) |
| Education, Arts & Media | 16 (100.0%) | 0 (0.0%) |
| Legal Services & Support | 0 (0.0%) | 0 (0.0%) |
| Education Instruction & Library | 0 (0.0%) | 9 (100.0%) |
| Arts, Media & Entertainment | 0 (0.0%) | 0 (0.0%) |
| Health Diagnosing & Treating | 7 (38.9%) | 11 (61.1%) |
| Health Technologists | 0 (0.0%) | 6 (100.0%) |
| Total (Category) | 44 (54.3%) | 37 (45.7%) |
| Total (Overall) | 106 (45.1%) | 129 (54.9%) |
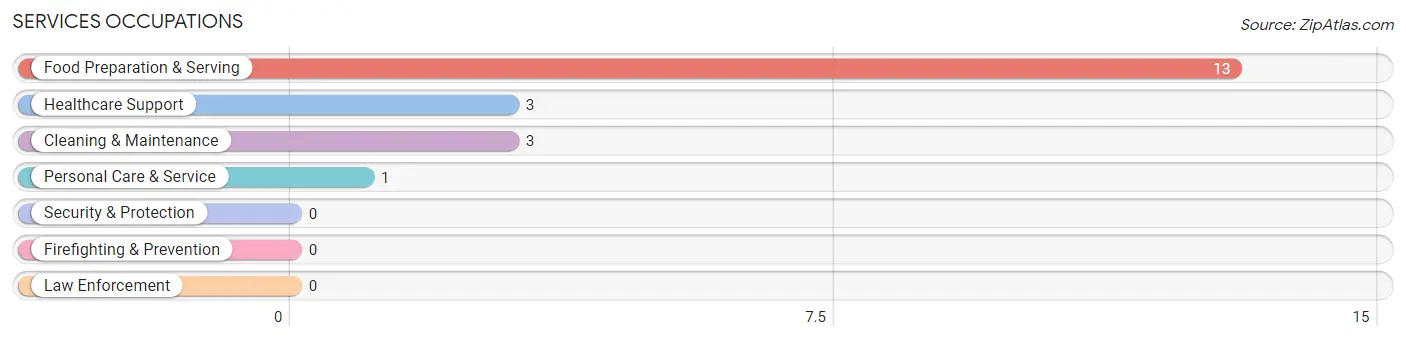
Services Occupations
The most common Services occupations in Bainbridge are Food Preparation & Serving (13 | 5.5%), Healthcare Support (3 | 1.3%), Cleaning & Maintenance (3 | 1.3%), and Personal Care & Service (1 | 0.4%).
Services Occupations by Sex
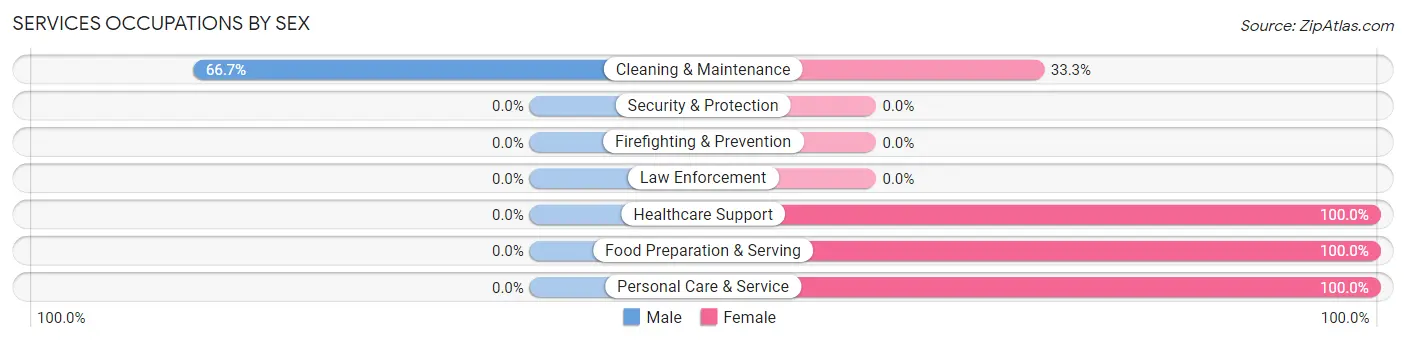
| Occupation | Male | Female |
| Healthcare Support | 0 (0.0%) | 3 (100.0%) |
| Security & Protection | 0 (0.0%) | 0 (0.0%) |
| Firefighting & Prevention | 0 (0.0%) | 0 (0.0%) |
| Law Enforcement | 0 (0.0%) | 0 (0.0%) |
| Food Preparation & Serving | 0 (0.0%) | 13 (100.0%) |
| Cleaning & Maintenance | 2 (66.7%) | 1 (33.3%) |
| Personal Care & Service | 0 (0.0%) | 1 (100.0%) |
| Total (Category) | 2 (10.0%) | 18 (90.0%) |
| Total (Overall) | 106 (45.1%) | 129 (54.9%) |
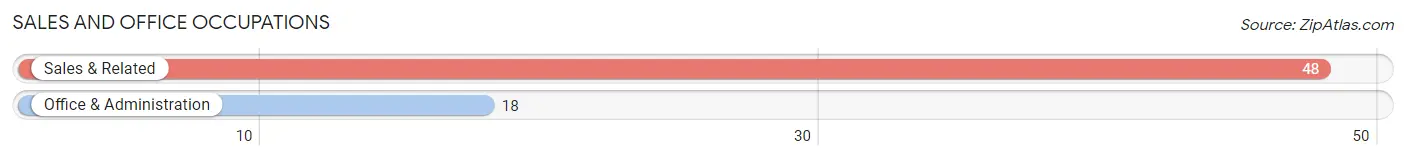
Sales and Office Occupations
The most common Sales and Office occupations in Bainbridge are Sales & Related (48 | 20.4%), and Office & Administration (18 | 7.7%).
Sales and Office Occupations by Sex
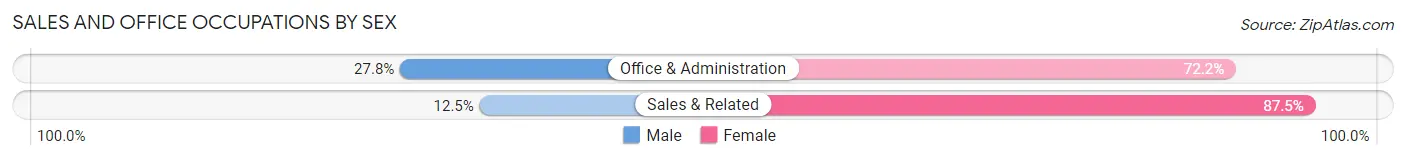
| Occupation | Male | Female |
| Sales & Related | 6 (12.5%) | 42 (87.5%) |
| Office & Administration | 5 (27.8%) | 13 (72.2%) |
| Total (Category) | 11 (16.7%) | 55 (83.3%) |
| Total (Overall) | 106 (45.1%) | 129 (54.9%) |
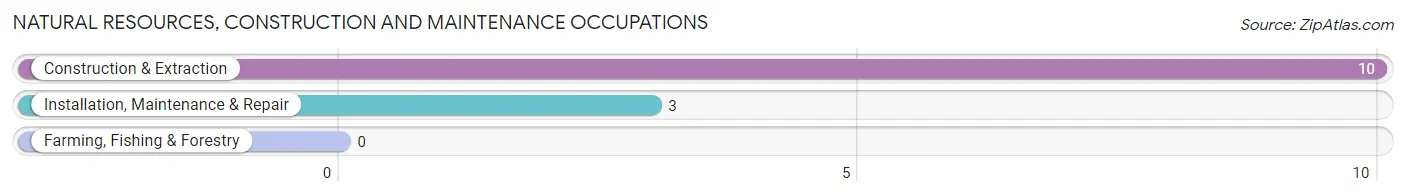
Natural Resources, Construction and Maintenance Occupations
The most common Natural Resources, Construction and Maintenance occupations in Bainbridge are Construction & Extraction (10 | 4.3%), and Installation, Maintenance & Repair (3 | 1.3%).
Natural Resources, Construction and Maintenance Occupations by Sex
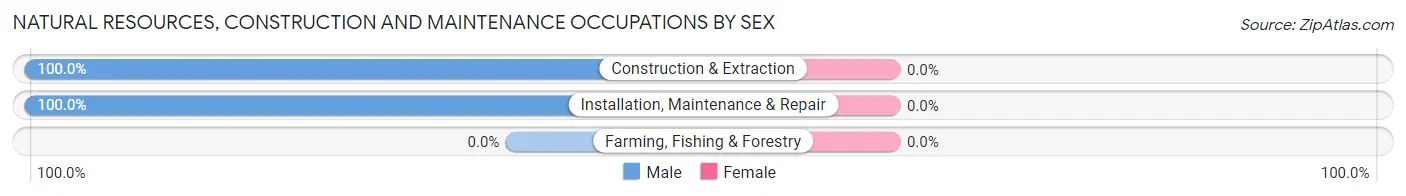
| Occupation | Male | Female |
| Farming, Fishing & Forestry | 0 (0.0%) | 0 (0.0%) |
| Construction & Extraction | 10 (100.0%) | 0 (0.0%) |
| Installation, Maintenance & Repair | 3 (100.0%) | 0 (0.0%) |
| Total (Category) | 13 (100.0%) | 0 (0.0%) |
| Total (Overall) | 106 (45.1%) | 129 (54.9%) |
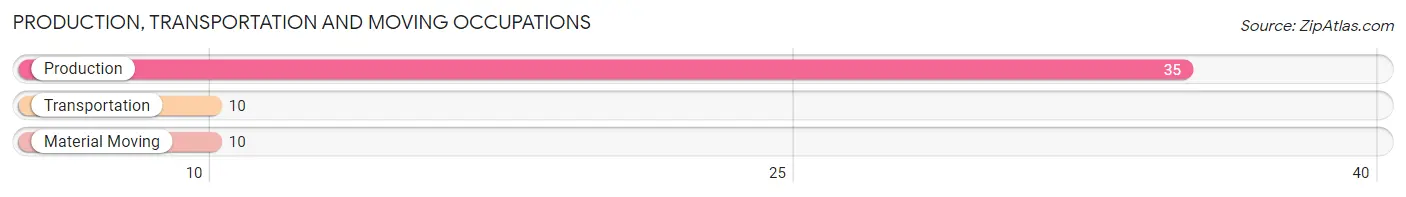
Production, Transportation and Moving Occupations
The most common Production, Transportation and Moving occupations in Bainbridge are Production (35 | 14.9%), Transportation (10 | 4.3%), and Material Moving (10 | 4.3%).
Production, Transportation and Moving Occupations by Sex
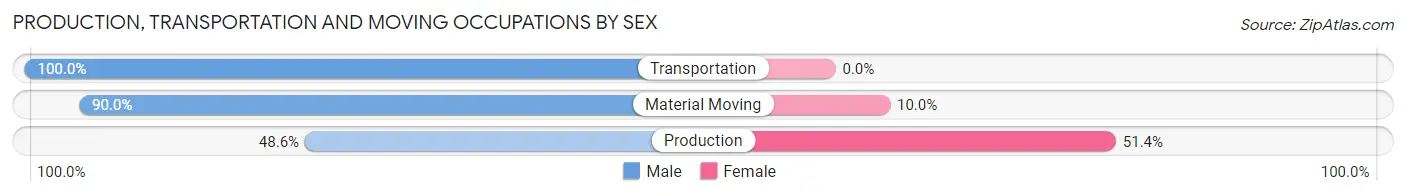
| Occupation | Male | Female |
| Production | 17 (48.6%) | 18 (51.4%) |
| Transportation | 10 (100.0%) | 0 (0.0%) |
| Material Moving | 9 (90.0%) | 1 (10.0%) |
| Total (Category) | 36 (65.4%) | 19 (34.5%) |
| Total (Overall) | 106 (45.1%) | 129 (54.9%) |
Employment Industries by Sex in Bainbridge
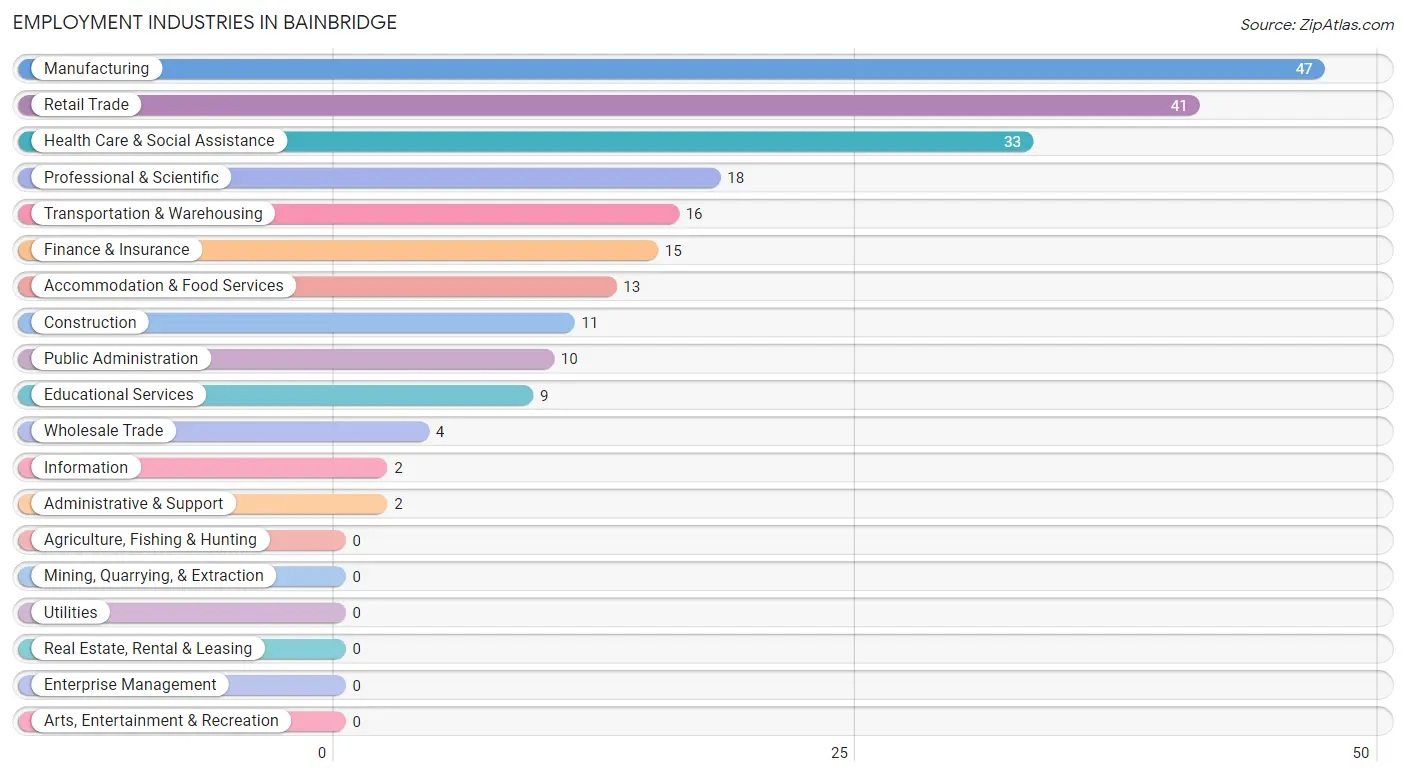
Employment Industries in Bainbridge
The major employment industries in Bainbridge include Manufacturing (47 | 20.0%), Retail Trade (41 | 17.4%), Health Care & Social Assistance (33 | 14.0%), Professional & Scientific (18 | 7.7%), and Transportation & Warehousing (16 | 6.8%).
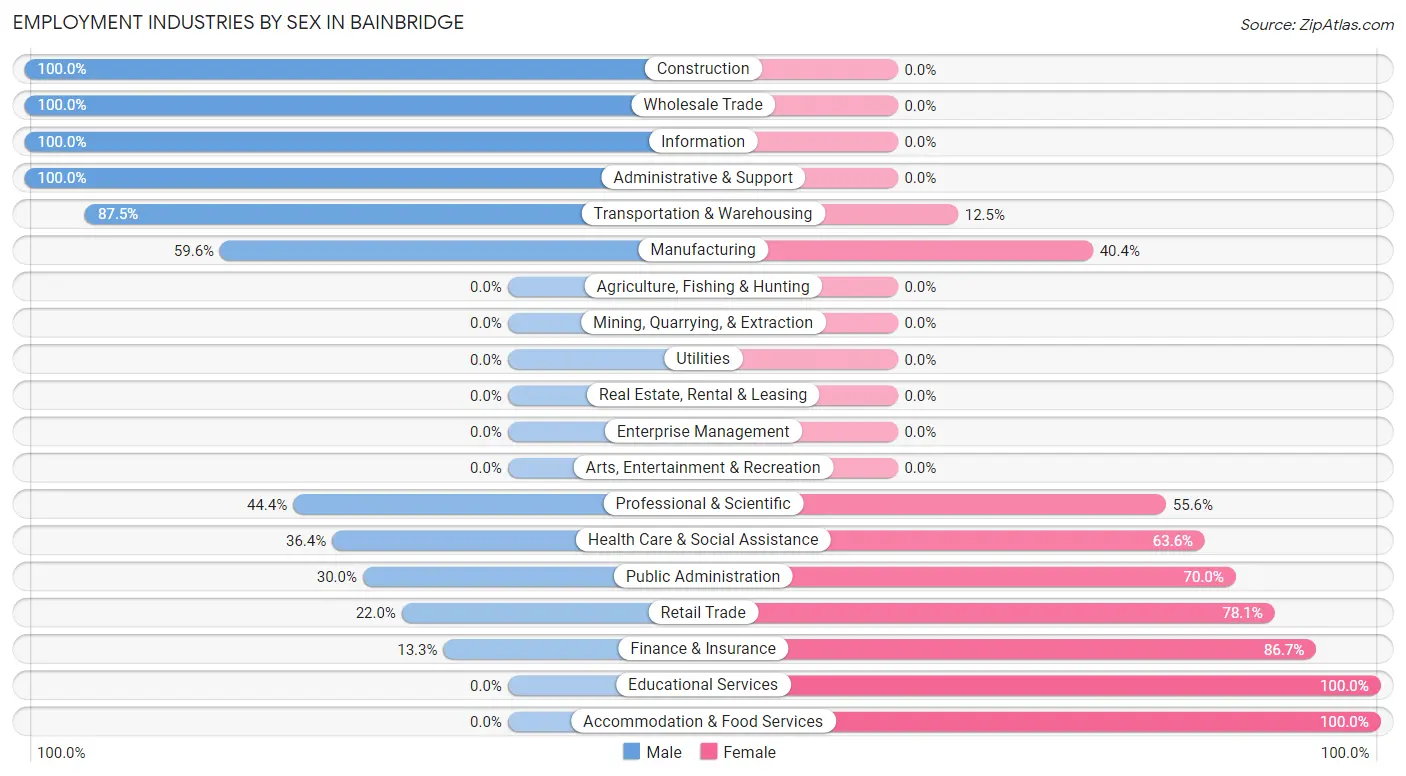
Employment Industries by Sex in Bainbridge
The Bainbridge industries that see more men than women are Construction (100.0%), Wholesale Trade (100.0%), and Information (100.0%), whereas the industries that tend to have a higher number of women are Educational Services (100.0%), Accommodation & Food Services (100.0%), and Finance & Insurance (86.7%).
| Industry | Male | Female |
| Agriculture, Fishing & Hunting | 0 (0.0%) | 0 (0.0%) |
| Mining, Quarrying, & Extraction | 0 (0.0%) | 0 (0.0%) |
| Construction | 11 (100.0%) | 0 (0.0%) |
| Manufacturing | 28 (59.6%) | 19 (40.4%) |
| Wholesale Trade | 4 (100.0%) | 0 (0.0%) |
| Retail Trade | 9 (22.0%) | 32 (78.0%) |
| Transportation & Warehousing | 14 (87.5%) | 2 (12.5%) |
| Utilities | 0 (0.0%) | 0 (0.0%) |
| Information | 2 (100.0%) | 0 (0.0%) |
| Finance & Insurance | 2 (13.3%) | 13 (86.7%) |
| Real Estate, Rental & Leasing | 0 (0.0%) | 0 (0.0%) |
| Professional & Scientific | 8 (44.4%) | 10 (55.6%) |
| Enterprise Management | 0 (0.0%) | 0 (0.0%) |
| Administrative & Support | 2 (100.0%) | 0 (0.0%) |
| Educational Services | 0 (0.0%) | 9 (100.0%) |
| Health Care & Social Assistance | 12 (36.4%) | 21 (63.6%) |
| Arts, Entertainment & Recreation | 0 (0.0%) | 0 (0.0%) |
| Accommodation & Food Services | 0 (0.0%) | 13 (100.0%) |
| Public Administration | 3 (30.0%) | 7 (70.0%) |
| Total | 106 (45.1%) | 129 (54.9%) |
Education in Bainbridge
School Enrollment in Bainbridge
The most common levels of schooling among the 115 students in Bainbridge are middle school (32 | 27.8%), high school (31 | 27.0%), and elementary school (25 | 21.7%).
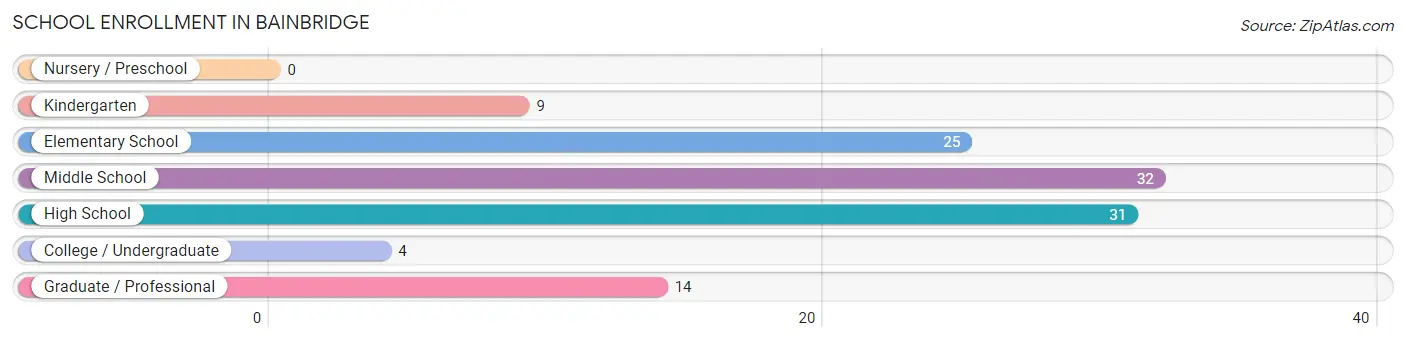
| School Level | # Students | % Students |
| Nursery / Preschool | 0 | 0.0% |
| Kindergarten | 9 | 7.8% |
| Elementary School | 25 | 21.7% |
| Middle School | 32 | 27.8% |
| High School | 31 | 27.0% |
| College / Undergraduate | 4 | 3.5% |
| Graduate / Professional | 14 | 12.2% |
| Total | 115 | 100.0% |
School Enrollment by Age by Funding Source in Bainbridge
Out of a total of 115 students who are enrolled in schools in Bainbridge, 4 (3.5%) attend a private institution, while the remaining 111 (96.5%) are enrolled in public schools. The age group of 25 to 34 year olds has the highest likelihood of being enrolled in private schools, with 4 (33.3% in the age bracket) enrolled. Conversely, the age group of 5 to 9 year old has the lowest likelihood of being enrolled in a private school, with 30 (100.0% in the age bracket) attending a public institution.
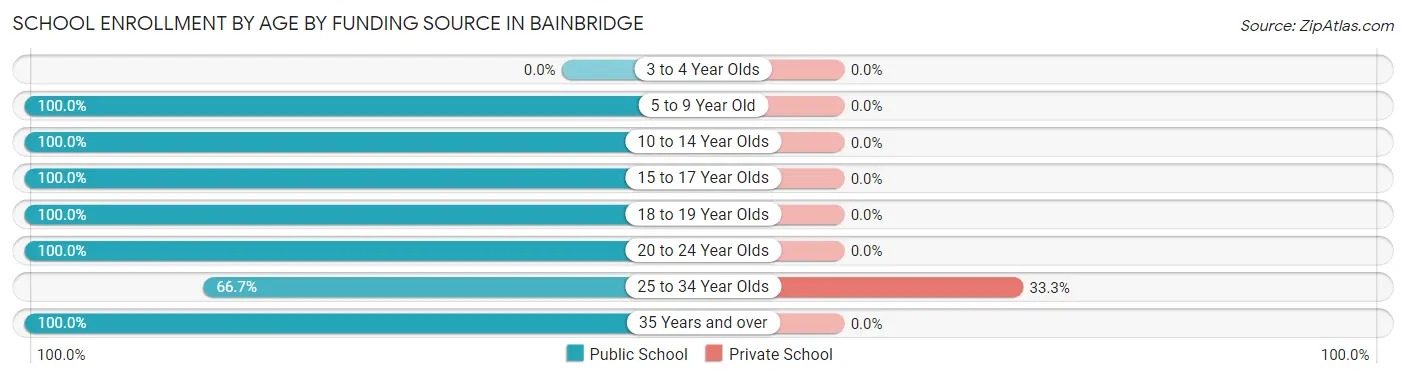
| Age Bracket | Public School | Private School |
| 3 to 4 Year Olds | 0 (0.0%) | 0 (0.0%) |
| 5 to 9 Year Old | 30 (100.0%) | 0 (0.0%) |
| 10 to 14 Year Olds | 32 (100.0%) | 0 (0.0%) |
| 15 to 17 Year Olds | 26 (100.0%) | 0 (0.0%) |
| 18 to 19 Year Olds | 1 (100.0%) | 0 (0.0%) |
| 20 to 24 Year Olds | 10 (100.0%) | 0 (0.0%) |
| 25 to 34 Year Olds | 8 (66.7%) | 4 (33.3%) |
| 35 Years and over | 4 (100.0%) | 0 (0.0%) |
| Total | 111 (96.5%) | 4 (3.5%) |
Educational Attainment by Field of Study in Bainbridge
Education (16 | 24.6%), arts & humanities (14 | 21.5%), computers & mathematics (10 | 15.4%), physical & health sciences (8 | 12.3%), and business (7 | 10.8%) are the most common fields of study among 65 individuals in Bainbridge who have obtained a bachelor's degree or higher.
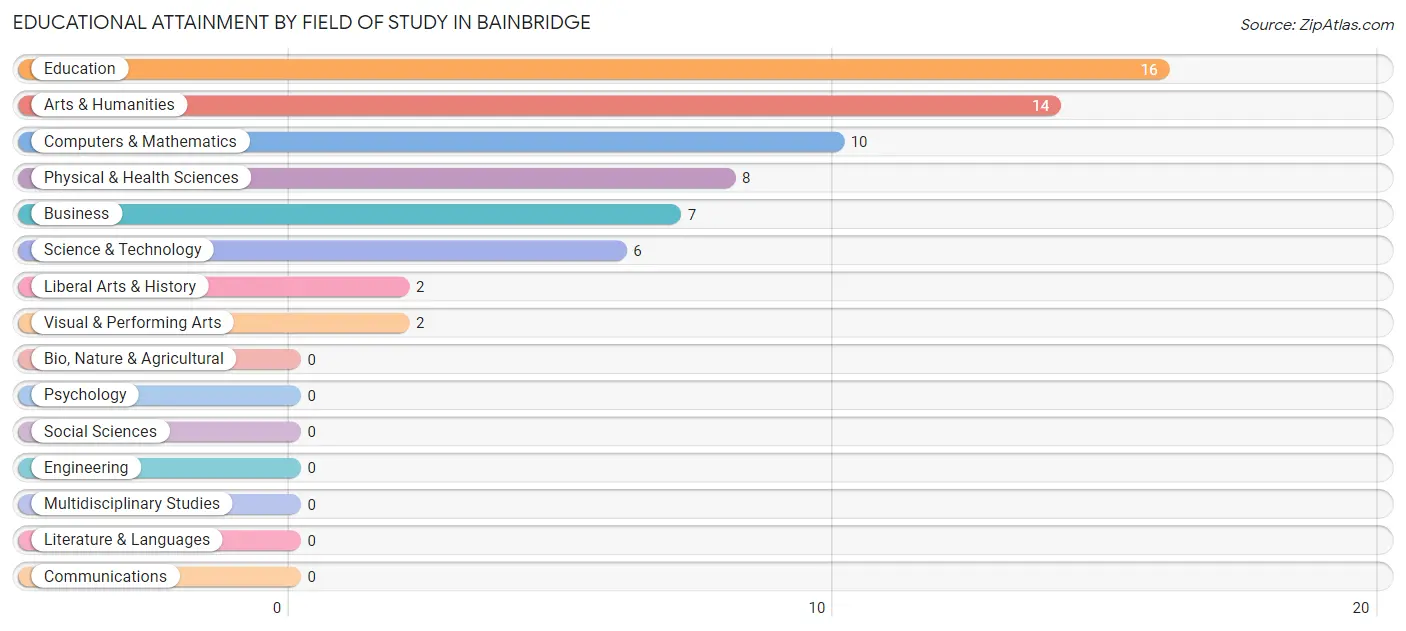
| Field of Study | # Graduates | % Graduates |
| Computers & Mathematics | 10 | 15.4% |
| Bio, Nature & Agricultural | 0 | 0.0% |
| Physical & Health Sciences | 8 | 12.3% |
| Psychology | 0 | 0.0% |
| Social Sciences | 0 | 0.0% |
| Engineering | 0 | 0.0% |
| Multidisciplinary Studies | 0 | 0.0% |
| Science & Technology | 6 | 9.2% |
| Business | 7 | 10.8% |
| Education | 16 | 24.6% |
| Literature & Languages | 0 | 0.0% |
| Liberal Arts & History | 2 | 3.1% |
| Visual & Performing Arts | 2 | 3.1% |
| Communications | 0 | 0.0% |
| Arts & Humanities | 14 | 21.5% |
| Total | 65 | 100.0% |
Transportation & Commute in Bainbridge
Vehicle Availability by Sex in Bainbridge
The most prevalent vehicle ownership categories in Bainbridge are males with 2 vehicles (52, accounting for 49.1%) and females with 2 vehicles (61, making up 46.0%).
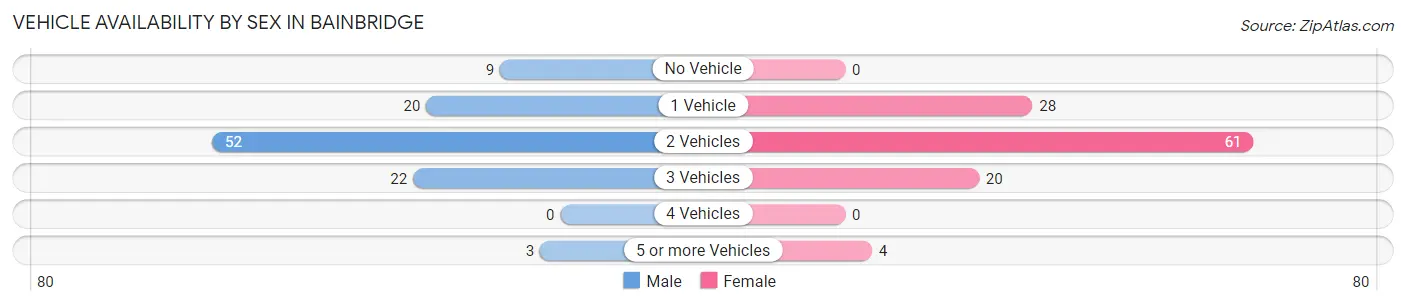
| Vehicles Available | Male | Female |
| No Vehicle | 9 (8.5%) | 0 (0.0%) |
| 1 Vehicle | 20 (18.9%) | 28 (24.8%) |
| 2 Vehicles | 52 (49.1%) | 61 (54.0%) |
| 3 Vehicles | 22 (20.7%) | 20 (17.7%) |
| 4 Vehicles | 0 (0.0%) | 0 (0.0%) |
| 5 or more Vehicles | 3 (2.8%) | 4 (3.5%) |
| Total | 106 (100.0%) | 113 (100.0%) |
Commute Time in Bainbridge
The most frequently occuring commute durations in Bainbridge are 30 to 34 minutes (60 commuters, 28.0%), 25 to 29 minutes (48 commuters, 22.4%), and 5 to 9 minutes (29 commuters, 13.6%).
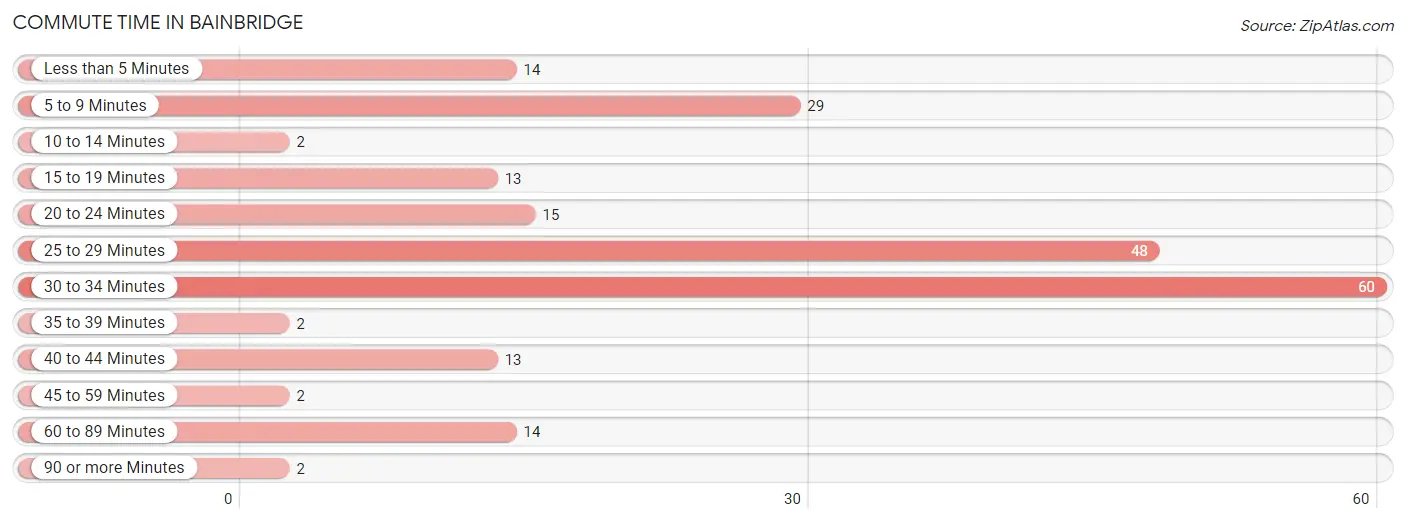
| Commute Time | # Commuters | % Commuters |
| Less than 5 Minutes | 14 | 6.5% |
| 5 to 9 Minutes | 29 | 13.6% |
| 10 to 14 Minutes | 2 | 0.9% |
| 15 to 19 Minutes | 13 | 6.1% |
| 20 to 24 Minutes | 15 | 7.0% |
| 25 to 29 Minutes | 48 | 22.4% |
| 30 to 34 Minutes | 60 | 28.0% |
| 35 to 39 Minutes | 2 | 0.9% |
| 40 to 44 Minutes | 13 | 6.1% |
| 45 to 59 Minutes | 2 | 0.9% |
| 60 to 89 Minutes | 14 | 6.5% |
| 90 or more Minutes | 2 | 0.9% |
Commute Time by Sex in Bainbridge
The most common commute times in Bainbridge are 30 to 34 minutes (28 commuters, 26.4%) for males and 30 to 34 minutes (32 commuters, 29.6%) for females.
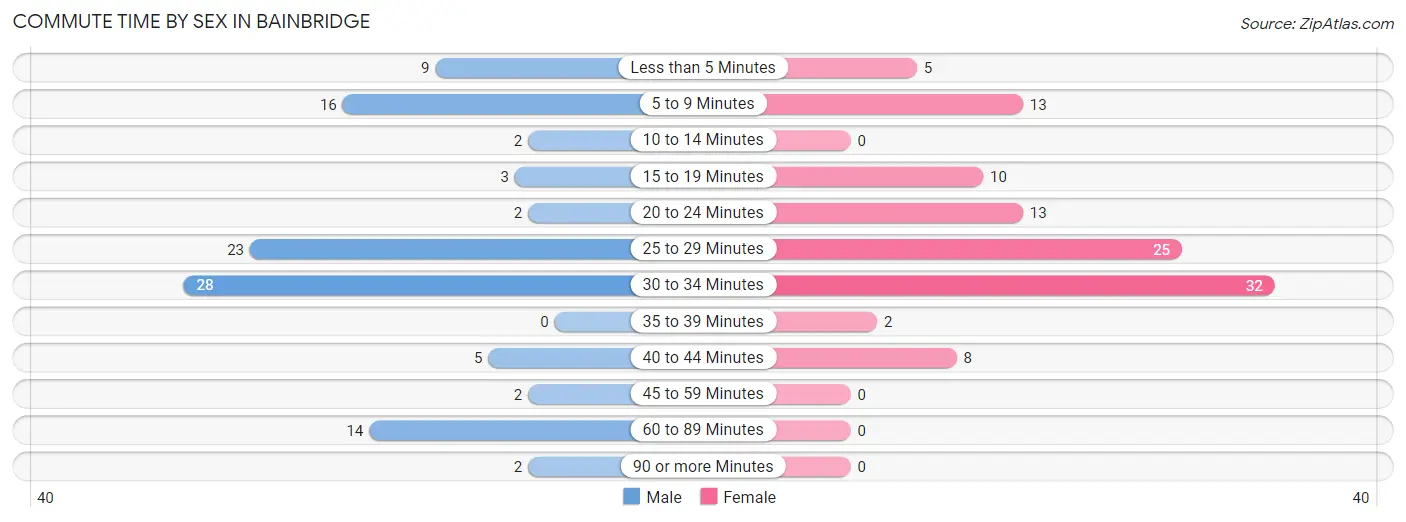
| Commute Time | Male | Female |
| Less than 5 Minutes | 9 (8.5%) | 5 (4.6%) |
| 5 to 9 Minutes | 16 (15.1%) | 13 (12.0%) |
| 10 to 14 Minutes | 2 (1.9%) | 0 (0.0%) |
| 15 to 19 Minutes | 3 (2.8%) | 10 (9.3%) |
| 20 to 24 Minutes | 2 (1.9%) | 13 (12.0%) |
| 25 to 29 Minutes | 23 (21.7%) | 25 (23.2%) |
| 30 to 34 Minutes | 28 (26.4%) | 32 (29.6%) |
| 35 to 39 Minutes | 0 (0.0%) | 2 (1.8%) |
| 40 to 44 Minutes | 5 (4.7%) | 8 (7.4%) |
| 45 to 59 Minutes | 2 (1.9%) | 0 (0.0%) |
| 60 to 89 Minutes | 14 (13.2%) | 0 (0.0%) |
| 90 or more Minutes | 2 (1.9%) | 0 (0.0%) |
Time of Departure to Work by Sex in Bainbridge
The most frequent times of departure to work in Bainbridge are 6:30 AM to 6:59 AM (22, 20.7%) for males and 7:00 AM to 7:29 AM (30, 27.8%) for females.
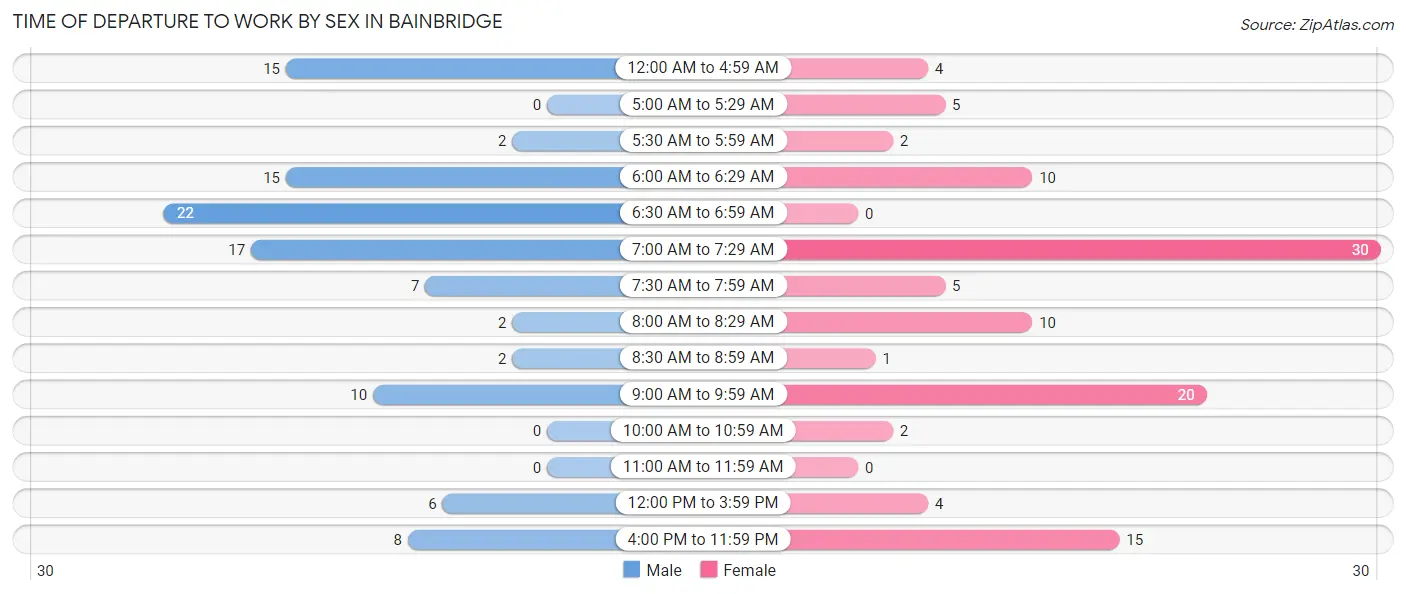
| Time of Departure | Male | Female |
| 12:00 AM to 4:59 AM | 15 (14.1%) | 4 (3.7%) |
| 5:00 AM to 5:29 AM | 0 (0.0%) | 5 (4.6%) |
| 5:30 AM to 5:59 AM | 2 (1.9%) | 2 (1.8%) |
| 6:00 AM to 6:29 AM | 15 (14.1%) | 10 (9.3%) |
| 6:30 AM to 6:59 AM | 22 (20.7%) | 0 (0.0%) |
| 7:00 AM to 7:29 AM | 17 (16.0%) | 30 (27.8%) |
| 7:30 AM to 7:59 AM | 7 (6.6%) | 5 (4.6%) |
| 8:00 AM to 8:29 AM | 2 (1.9%) | 10 (9.3%) |
| 8:30 AM to 8:59 AM | 2 (1.9%) | 1 (0.9%) |
| 9:00 AM to 9:59 AM | 10 (9.4%) | 20 (18.5%) |
| 10:00 AM to 10:59 AM | 0 (0.0%) | 2 (1.8%) |
| 11:00 AM to 11:59 AM | 0 (0.0%) | 0 (0.0%) |
| 12:00 PM to 3:59 PM | 6 (5.7%) | 4 (3.7%) |
| 4:00 PM to 11:59 PM | 8 (7.5%) | 15 (13.9%) |
| Total | 106 (100.0%) | 108 (100.0%) |
Housing Occupancy in Bainbridge
Occupancy by Ownership in Bainbridge
Of the total 249 dwellings in Bainbridge, owner-occupied units account for 167 (67.1%), while renter-occupied units make up 82 (32.9%).
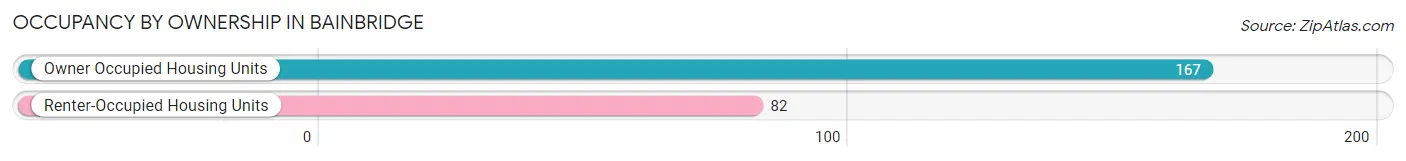
| Occupancy | # Housing Units | % Housing Units |
| Owner Occupied Housing Units | 167 | 67.1% |
| Renter-Occupied Housing Units | 82 | 32.9% |
| Total Occupied Housing Units | 249 | 100.0% |
Occupancy by Household Size in Bainbridge
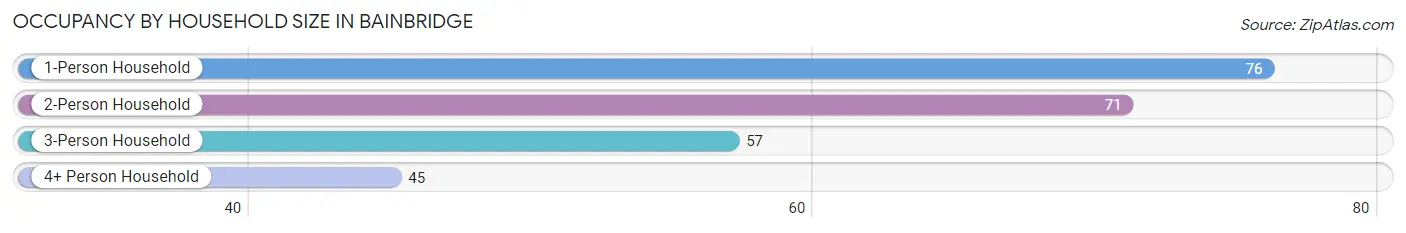
| Household Size | # Housing Units | % Housing Units |
| 1-Person Household | 76 | 30.5% |
| 2-Person Household | 71 | 28.5% |
| 3-Person Household | 57 | 22.9% |
| 4+ Person Household | 45 | 18.1% |
| Total Housing Units | 249 | 100.0% |
Occupancy by Ownership by Household Size in Bainbridge
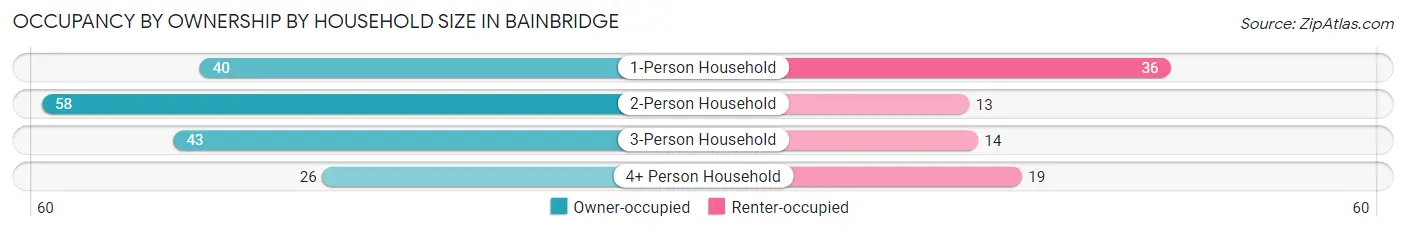
| Household Size | Owner-occupied | Renter-occupied |
| 1-Person Household | 40 (52.6%) | 36 (47.4%) |
| 2-Person Household | 58 (81.7%) | 13 (18.3%) |
| 3-Person Household | 43 (75.4%) | 14 (24.6%) |
| 4+ Person Household | 26 (57.8%) | 19 (42.2%) |
| Total Housing Units | 167 (67.1%) | 82 (32.9%) |
Occupancy by Educational Attainment in Bainbridge
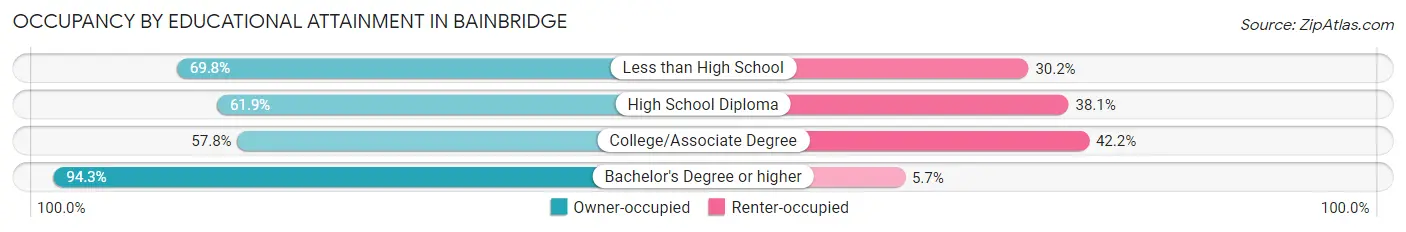
| Household Size | Owner-occupied | Renter-occupied |
| Less than High School | 37 (69.8%) | 16 (30.2%) |
| High School Diploma | 60 (61.9%) | 37 (38.1%) |
| College/Associate Degree | 37 (57.8%) | 27 (42.2%) |
| Bachelor's Degree or higher | 33 (94.3%) | 2 (5.7%) |
Occupancy by Age of Householder in Bainbridge
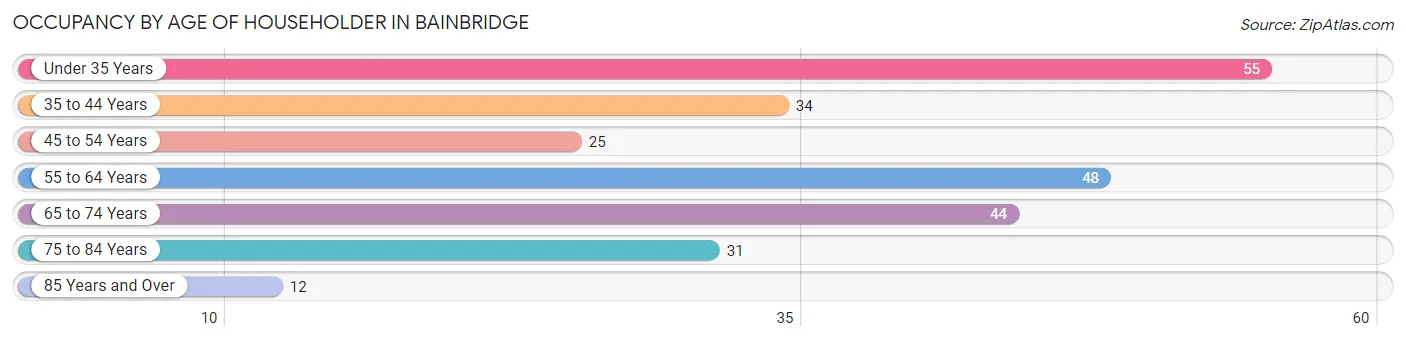
| Age Bracket | # Households | % Households |
| Under 35 Years | 55 | 22.1% |
| 35 to 44 Years | 34 | 13.7% |
| 45 to 54 Years | 25 | 10.0% |
| 55 to 64 Years | 48 | 19.3% |
| 65 to 74 Years | 44 | 17.7% |
| 75 to 84 Years | 31 | 12.4% |
| 85 Years and Over | 12 | 4.8% |
| Total | 249 | 100.0% |
Housing Finances in Bainbridge
Median Income by Occupancy in Bainbridge
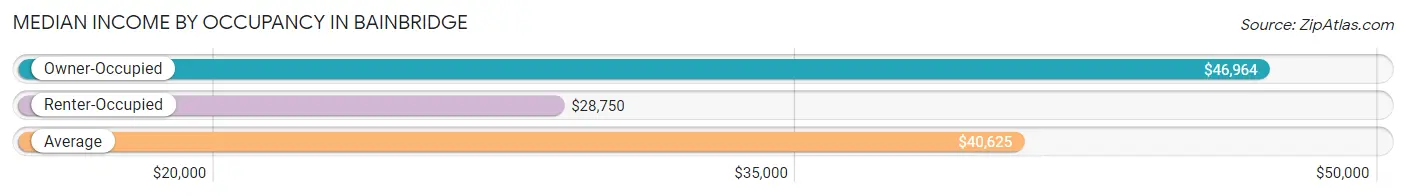
| Occupancy Type | # Households | Median Income |
| Owner-Occupied | 167 (67.1%) | $46,964 |
| Renter-Occupied | 82 (32.9%) | $28,750 |
| Average | 249 (100.0%) | $40,625 |
Occupancy by Householder Income Bracket in Bainbridge
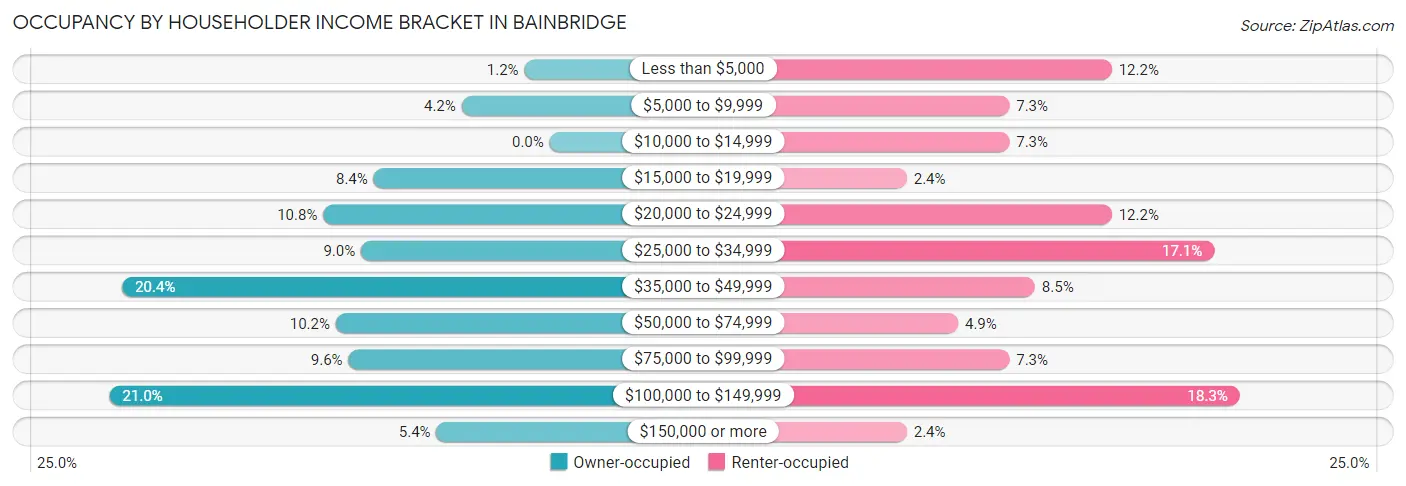
| Income Bracket | Owner-occupied | Renter-occupied |
| Less than $5,000 | 2 (1.2%) | 10 (12.2%) |
| $5,000 to $9,999 | 7 (4.2%) | 6 (7.3%) |
| $10,000 to $14,999 | 0 (0.0%) | 6 (7.3%) |
| $15,000 to $19,999 | 14 (8.4%) | 2 (2.4%) |
| $20,000 to $24,999 | 18 (10.8%) | 10 (12.2%) |
| $25,000 to $34,999 | 15 (9.0%) | 14 (17.1%) |
| $35,000 to $49,999 | 34 (20.4%) | 7 (8.5%) |
| $50,000 to $74,999 | 17 (10.2%) | 4 (4.9%) |
| $75,000 to $99,999 | 16 (9.6%) | 6 (7.3%) |
| $100,000 to $149,999 | 35 (21.0%) | 15 (18.3%) |
| $150,000 or more | 9 (5.4%) | 2 (2.4%) |
| Total | 167 (100.0%) | 82 (100.0%) |
Monthly Housing Cost Tiers in Bainbridge
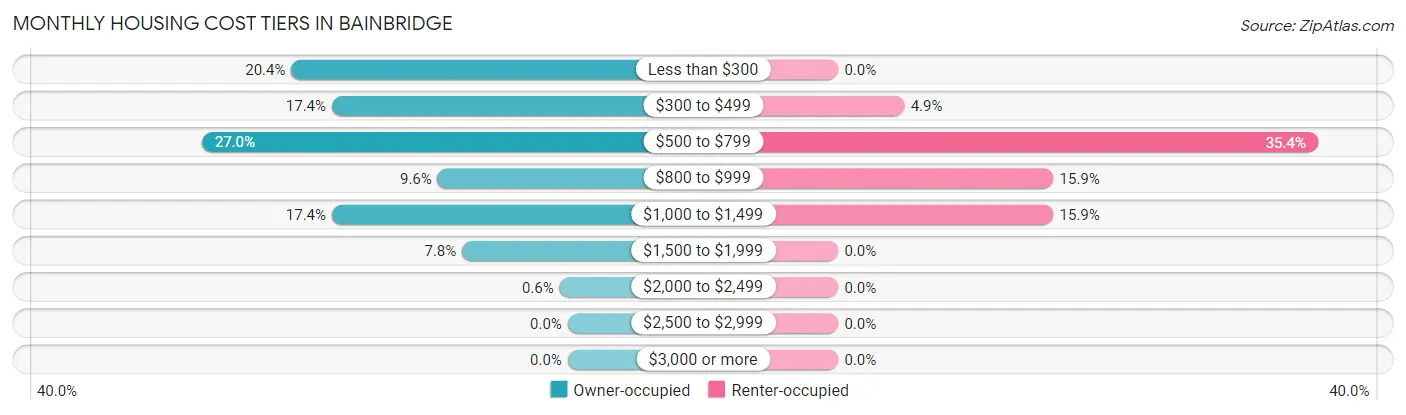
| Monthly Cost | Owner-occupied | Renter-occupied |
| Less than $300 | 34 (20.4%) | 0 (0.0%) |
| $300 to $499 | 29 (17.4%) | 4 (4.9%) |
| $500 to $799 | 45 (27.0%) | 29 (35.4%) |
| $800 to $999 | 16 (9.6%) | 13 (15.9%) |
| $1,000 to $1,499 | 29 (17.4%) | 13 (15.9%) |
| $1,500 to $1,999 | 13 (7.8%) | 0 (0.0%) |
| $2,000 to $2,499 | 1 (0.6%) | 0 (0.0%) |
| $2,500 to $2,999 | 0 (0.0%) | 0 (0.0%) |
| $3,000 or more | 0 (0.0%) | 0 (0.0%) |
| Total | 167 (100.0%) | 82 (100.0%) |
Physical Housing Characteristics in Bainbridge
Housing Structures in Bainbridge
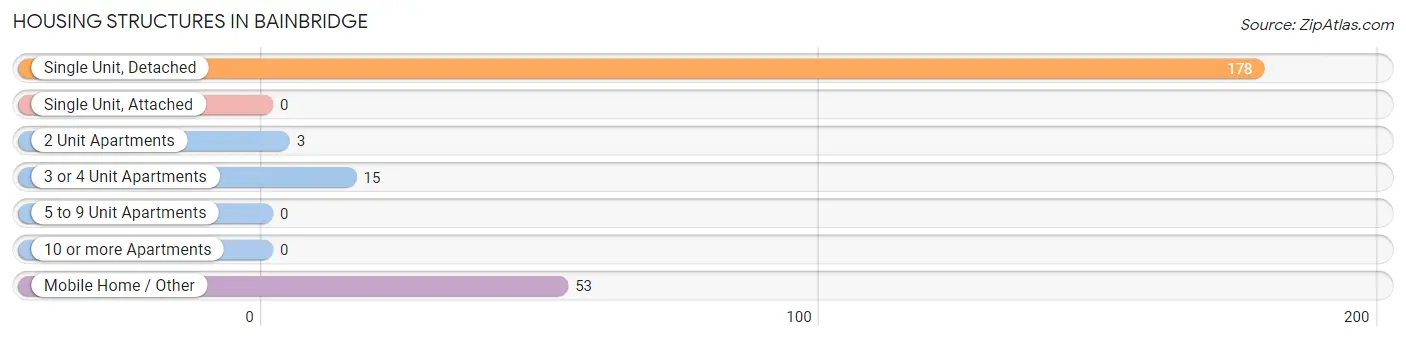
| Structure Type | # Housing Units | % Housing Units |
| Single Unit, Detached | 178 | 71.5% |
| Single Unit, Attached | 0 | 0.0% |
| 2 Unit Apartments | 3 | 1.2% |
| 3 or 4 Unit Apartments | 15 | 6.0% |
| 5 to 9 Unit Apartments | 0 | 0.0% |
| 10 or more Apartments | 0 | 0.0% |
| Mobile Home / Other | 53 | 21.3% |
| Total | 249 | 100.0% |
Housing Structures by Occupancy in Bainbridge
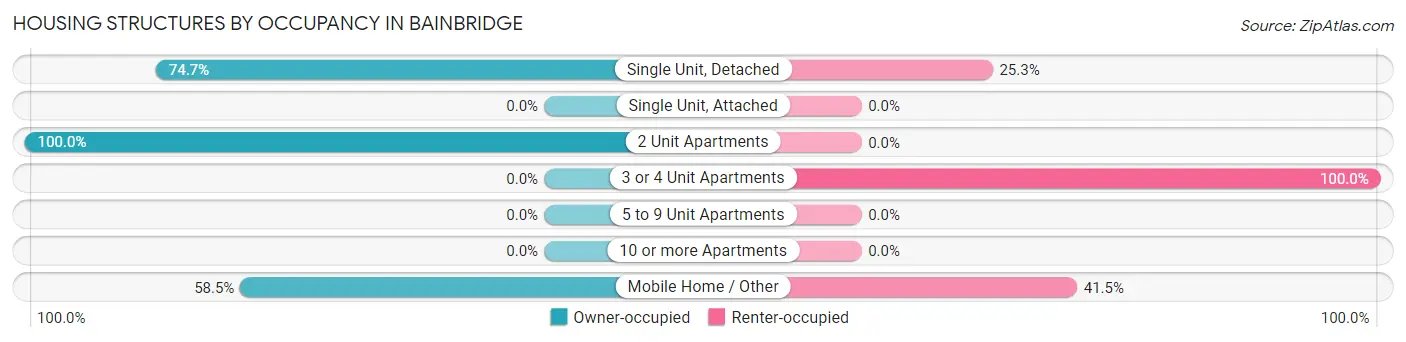
| Structure Type | Owner-occupied | Renter-occupied |
| Single Unit, Detached | 133 (74.7%) | 45 (25.3%) |
| Single Unit, Attached | 0 (0.0%) | 0 (0.0%) |
| 2 Unit Apartments | 3 (100.0%) | 0 (0.0%) |
| 3 or 4 Unit Apartments | 0 (0.0%) | 15 (100.0%) |
| 5 to 9 Unit Apartments | 0 (0.0%) | 0 (0.0%) |
| 10 or more Apartments | 0 (0.0%) | 0 (0.0%) |
| Mobile Home / Other | 31 (58.5%) | 22 (41.5%) |
| Total | 167 (67.1%) | 82 (32.9%) |
Housing Structures by Number of Rooms in Bainbridge
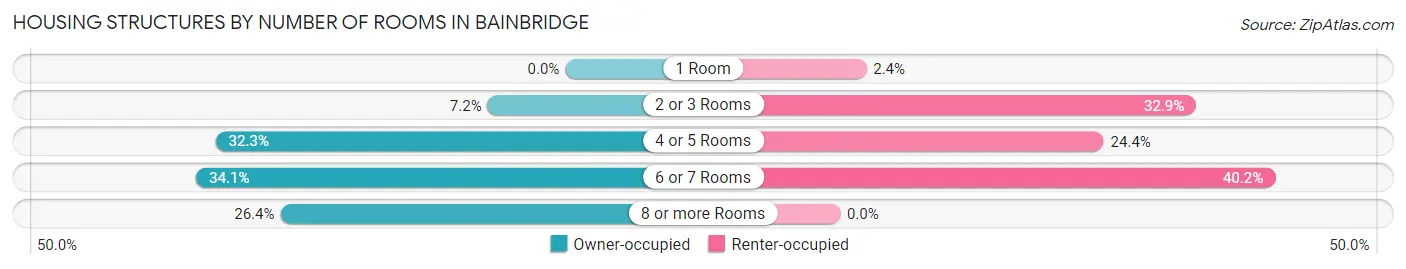
| Number of Rooms | Owner-occupied | Renter-occupied |
| 1 Room | 0 (0.0%) | 2 (2.4%) |
| 2 or 3 Rooms | 12 (7.2%) | 27 (32.9%) |
| 4 or 5 Rooms | 54 (32.3%) | 20 (24.4%) |
| 6 or 7 Rooms | 57 (34.1%) | 33 (40.2%) |
| 8 or more Rooms | 44 (26.4%) | 0 (0.0%) |
| Total | 167 (100.0%) | 82 (100.0%) |
Housing Structure by Heating Type in Bainbridge
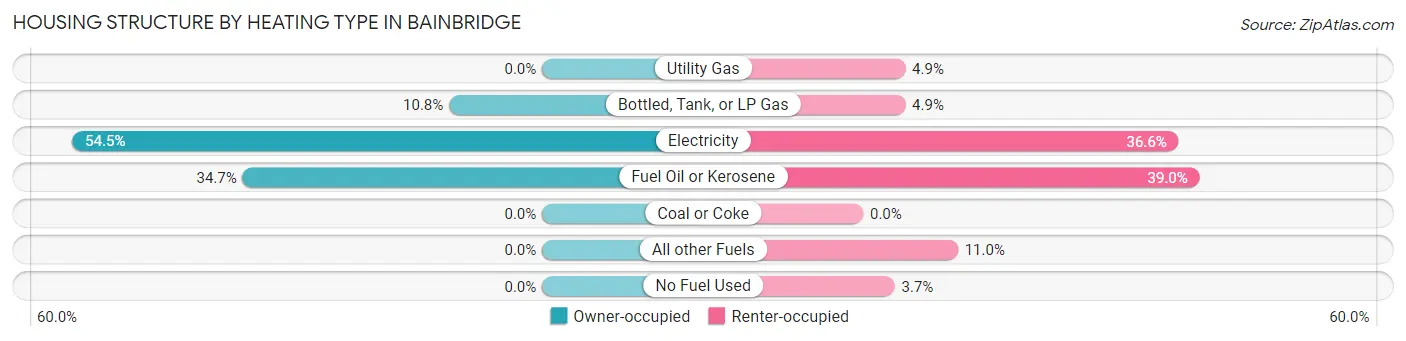
| Heating Type | Owner-occupied | Renter-occupied |
| Utility Gas | 0 (0.0%) | 4 (4.9%) |
| Bottled, Tank, or LP Gas | 18 (10.8%) | 4 (4.9%) |
| Electricity | 91 (54.5%) | 30 (36.6%) |
| Fuel Oil or Kerosene | 58 (34.7%) | 32 (39.0%) |
| Coal or Coke | 0 (0.0%) | 0 (0.0%) |
| All other Fuels | 0 (0.0%) | 9 (11.0%) |
| No Fuel Used | 0 (0.0%) | 3 (3.7%) |
| Total | 167 (100.0%) | 82 (100.0%) |
Household Vehicle Usage in Bainbridge
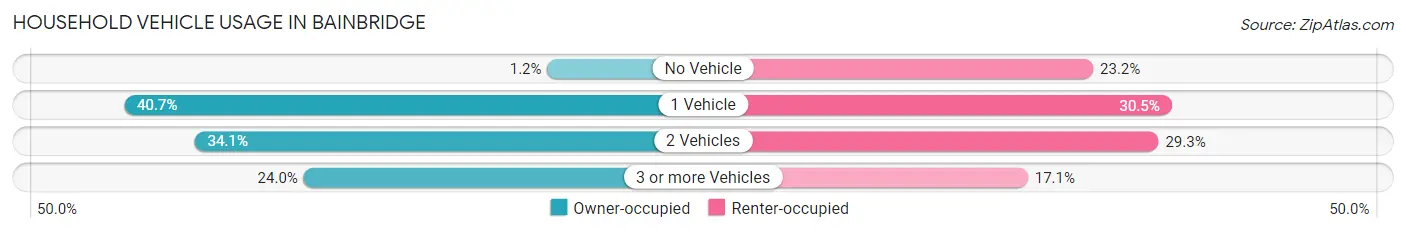
| Vehicles per Household | Owner-occupied | Renter-occupied |
| No Vehicle | 2 (1.2%) | 19 (23.2%) |
| 1 Vehicle | 68 (40.7%) | 25 (30.5%) |
| 2 Vehicles | 57 (34.1%) | 24 (29.3%) |
| 3 or more Vehicles | 40 (23.9%) | 14 (17.1%) |
| Total | 167 (100.0%) | 82 (100.0%) |
Real Estate & Mortgages in Bainbridge
Real Estate and Mortgage Overview in Bainbridge
| Characteristic | Without Mortgage | With Mortgage |
| Housing Units | 102 | 65 |
| Median Property Value | $84,700 | $131,700 |
| Median Household Income | $36,250 | $4 |
| Monthly Housing Costs | $361 | $0 |
| Real Estate Taxes | $1,121 | $0 |
Property Value by Mortgage Status in Bainbridge
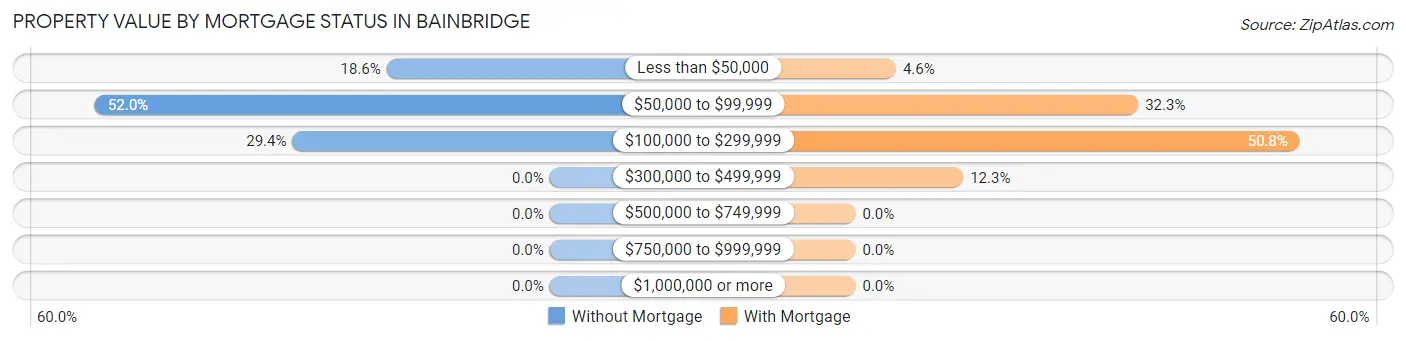
| Property Value | Without Mortgage | With Mortgage |
| Less than $50,000 | 19 (18.6%) | 3 (4.6%) |
| $50,000 to $99,999 | 53 (52.0%) | 21 (32.3%) |
| $100,000 to $299,999 | 30 (29.4%) | 33 (50.8%) |
| $300,000 to $499,999 | 0 (0.0%) | 8 (12.3%) |
| $500,000 to $749,999 | 0 (0.0%) | 0 (0.0%) |
| $750,000 to $999,999 | 0 (0.0%) | 0 (0.0%) |
| $1,000,000 or more | 0 (0.0%) | 0 (0.0%) |
| Total | 102 (100.0%) | 65 (100.0%) |
Household Income by Mortgage Status in Bainbridge
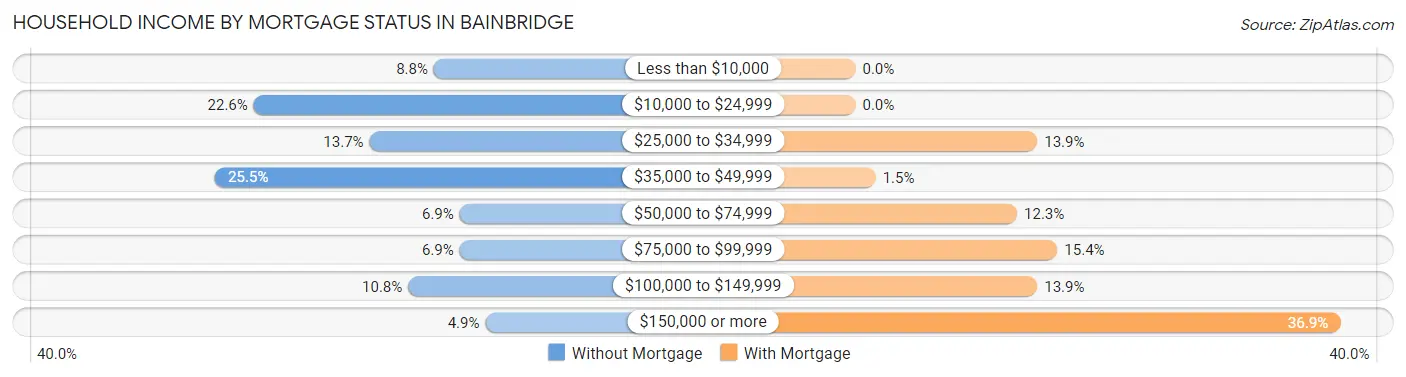
| Household Income | Without Mortgage | With Mortgage |
| Less than $10,000 | 9 (8.8%) | 0 (0.0%) |
| $10,000 to $24,999 | 23 (22.6%) | 0 (0.0%) |
| $25,000 to $34,999 | 14 (13.7%) | 9 (13.9%) |
| $35,000 to $49,999 | 26 (25.5%) | 1 (1.5%) |
| $50,000 to $74,999 | 7 (6.9%) | 8 (12.3%) |
| $75,000 to $99,999 | 7 (6.9%) | 10 (15.4%) |
| $100,000 to $149,999 | 11 (10.8%) | 9 (13.9%) |
| $150,000 or more | 5 (4.9%) | 24 (36.9%) |
| Total | 102 (100.0%) | 65 (100.0%) |
Property Value to Household Income Ratio in Bainbridge
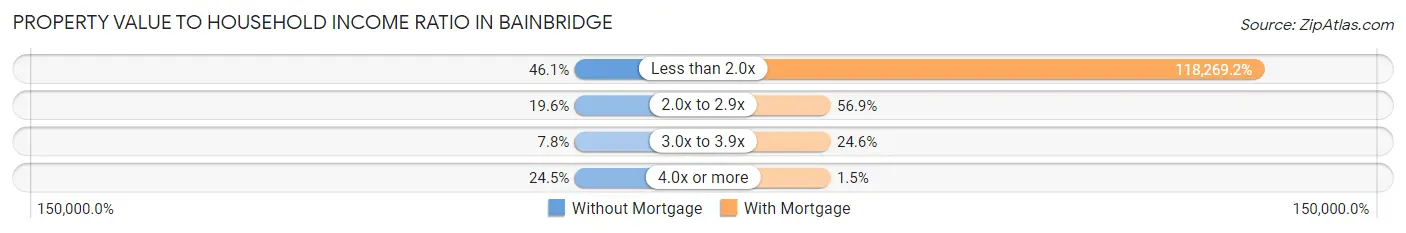
| Value-to-Income Ratio | Without Mortgage | With Mortgage |
| Less than 2.0x | 47 (46.1%) | 76,875 (118,269.2%) |
| 2.0x to 2.9x | 20 (19.6%) | 37 (56.9%) |
| 3.0x to 3.9x | 8 (7.8%) | 16 (24.6%) |
| 4.0x or more | 25 (24.5%) | 1 (1.5%) |
| Total | 102 (100.0%) | 65 (100.0%) |
Real Estate Taxes by Mortgage Status in Bainbridge
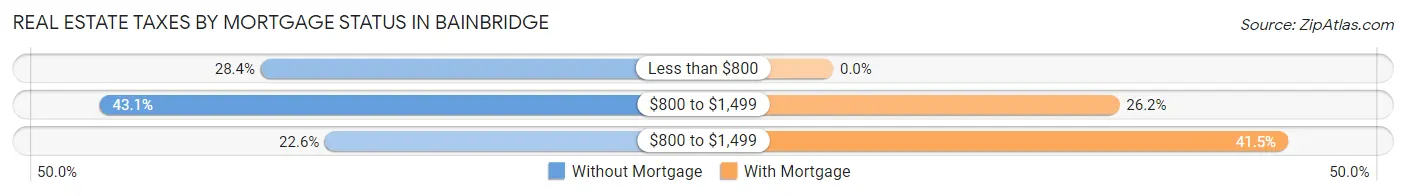
| Property Taxes | Without Mortgage | With Mortgage |
| Less than $800 | 29 (28.4%) | 0 (0.0%) |
| $800 to $1,499 | 44 (43.1%) | 17 (26.2%) |
| $800 to $1,499 | 23 (22.6%) | 27 (41.5%) |
| Total | 102 (100.0%) | 65 (100.0%) |
Health & Disability in Bainbridge
Health Insurance Coverage by Age in Bainbridge
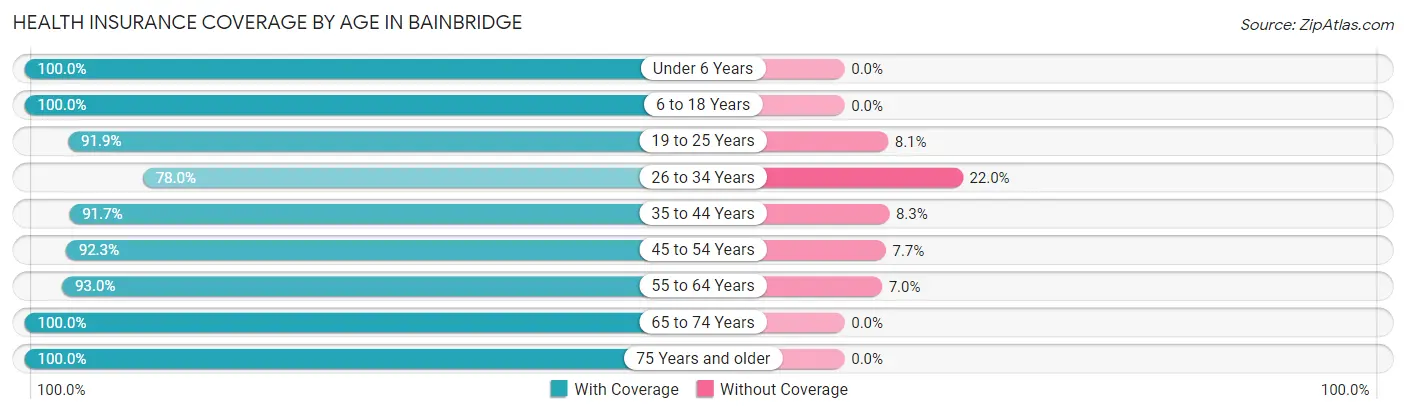
| Age Bracket | With Coverage | Without Coverage |
| Under 6 Years | 44 (100.0%) | 0 (0.0%) |
| 6 to 18 Years | 91 (100.0%) | 0 (0.0%) |
| 19 to 25 Years | 68 (91.9%) | 6 (8.1%) |
| 26 to 34 Years | 46 (78.0%) | 13 (22.0%) |
| 35 to 44 Years | 66 (91.7%) | 6 (8.3%) |
| 45 to 54 Years | 36 (92.3%) | 3 (7.7%) |
| 55 to 64 Years | 80 (93.0%) | 6 (7.0%) |
| 65 to 74 Years | 69 (100.0%) | 0 (0.0%) |
| 75 Years and older | 61 (100.0%) | 0 (0.0%) |
| Total | 561 (94.3%) | 34 (5.7%) |
Health Insurance Coverage by Citizenship Status in Bainbridge
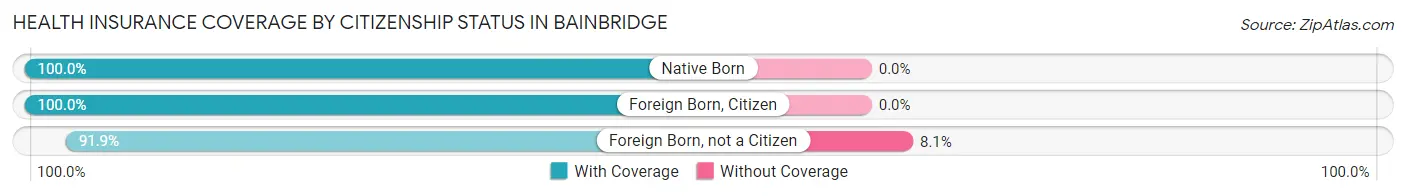
| Citizenship Status | With Coverage | Without Coverage |
| Native Born | 44 (100.0%) | 0 (0.0%) |
| Foreign Born, Citizen | 91 (100.0%) | 0 (0.0%) |
| Foreign Born, not a Citizen | 68 (91.9%) | 6 (8.1%) |
Health Insurance Coverage by Household Income in Bainbridge
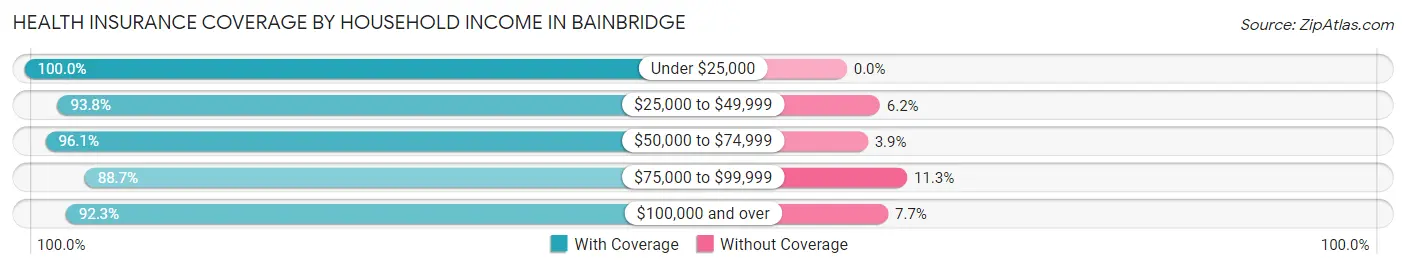
| Household Income | With Coverage | Without Coverage |
| Under $25,000 | 120 (100.0%) | 0 (0.0%) |
| $25,000 to $49,999 | 182 (93.8%) | 12 (6.2%) |
| $50,000 to $74,999 | 49 (96.1%) | 2 (3.9%) |
| $75,000 to $99,999 | 55 (88.7%) | 7 (11.3%) |
| $100,000 and over | 155 (92.3%) | 13 (7.7%) |
Public vs Private Health Insurance Coverage by Age in Bainbridge
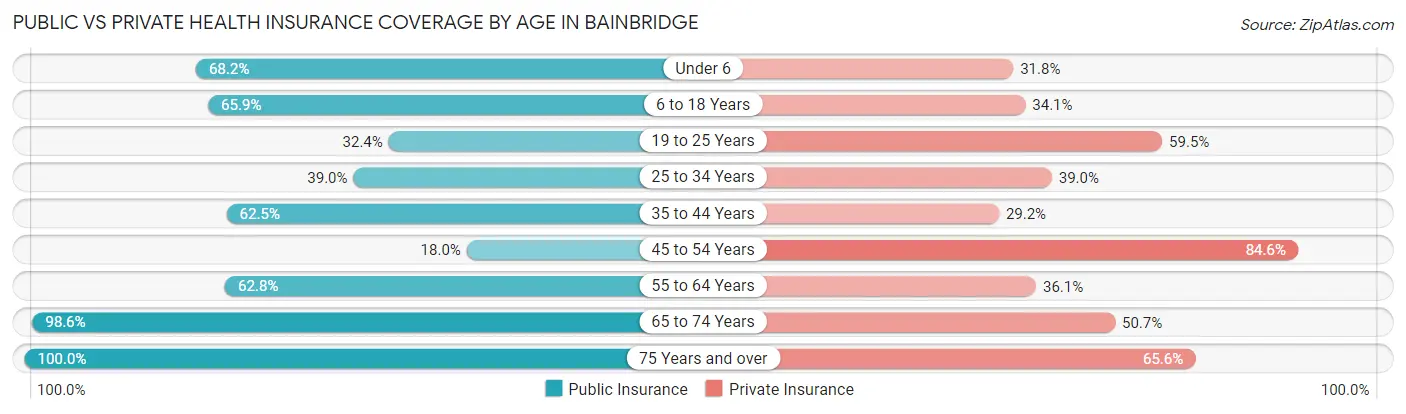
| Age Bracket | Public Insurance | Private Insurance |
| Under 6 | 30 (68.2%) | 14 (31.8%) |
| 6 to 18 Years | 60 (65.9%) | 31 (34.1%) |
| 19 to 25 Years | 24 (32.4%) | 44 (59.5%) |
| 25 to 34 Years | 23 (39.0%) | 23 (39.0%) |
| 35 to 44 Years | 45 (62.5%) | 21 (29.2%) |
| 45 to 54 Years | 7 (17.9%) | 33 (84.6%) |
| 55 to 64 Years | 54 (62.8%) | 31 (36.0%) |
| 65 to 74 Years | 68 (98.6%) | 35 (50.7%) |
| 75 Years and over | 61 (100.0%) | 40 (65.6%) |
| Total | 372 (62.5%) | 272 (45.7%) |
Disability Status by Sex by Age in Bainbridge
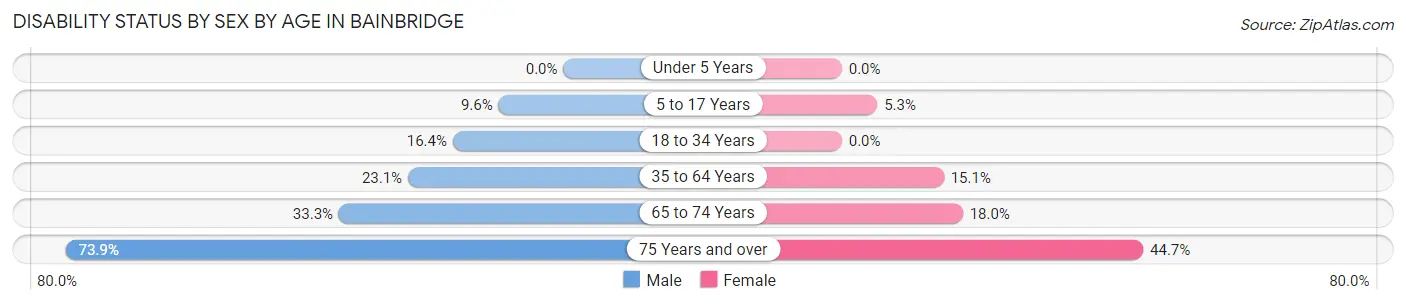
| Age Bracket | Male | Female |
| Under 5 Years | 0 (0.0%) | 0 (0.0%) |
| 5 to 17 Years | 5 (9.6%) | 2 (5.3%) |
| 18 to 34 Years | 11 (16.4%) | 0 (0.0%) |
| 35 to 64 Years | 18 (23.1%) | 18 (15.1%) |
| 65 to 74 Years | 10 (33.3%) | 7 (17.9%) |
| 75 Years and over | 17 (73.9%) | 17 (44.7%) |
Disability Class by Sex by Age in Bainbridge
Disability Class: Hearing Difficulty
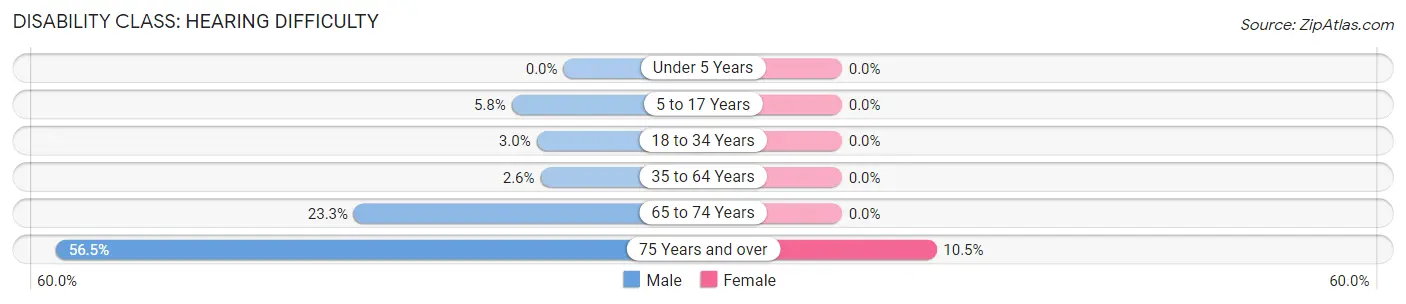
| Age Bracket | Male | Female |
| Under 5 Years | 0 (0.0%) | 0 (0.0%) |
| 5 to 17 Years | 3 (5.8%) | 0 (0.0%) |
| 18 to 34 Years | 2 (3.0%) | 0 (0.0%) |
| 35 to 64 Years | 2 (2.6%) | 0 (0.0%) |
| 65 to 74 Years | 7 (23.3%) | 0 (0.0%) |
| 75 Years and over | 13 (56.5%) | 4 (10.5%) |
Disability Class: Vision Difficulty
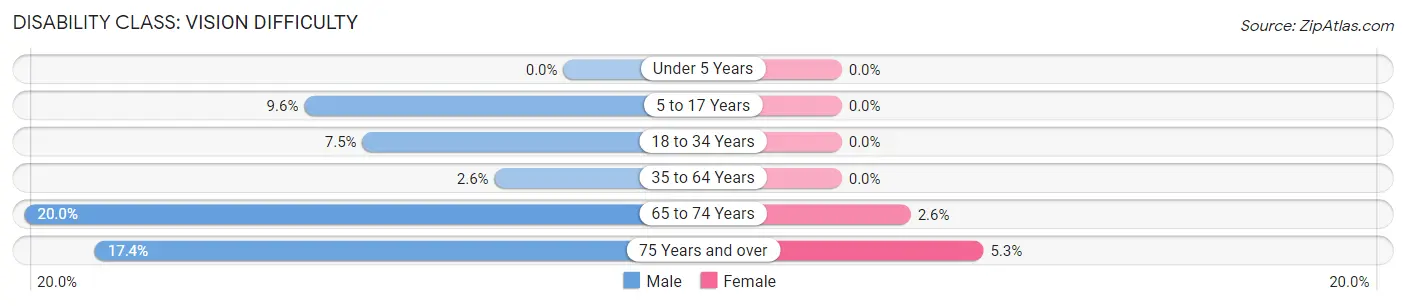
| Age Bracket | Male | Female |
| Under 5 Years | 0 (0.0%) | 0 (0.0%) |
| 5 to 17 Years | 5 (9.6%) | 0 (0.0%) |
| 18 to 34 Years | 5 (7.5%) | 0 (0.0%) |
| 35 to 64 Years | 2 (2.6%) | 0 (0.0%) |
| 65 to 74 Years | 6 (20.0%) | 1 (2.6%) |
| 75 Years and over | 4 (17.4%) | 2 (5.3%) |
Disability Class: Cognitive Difficulty
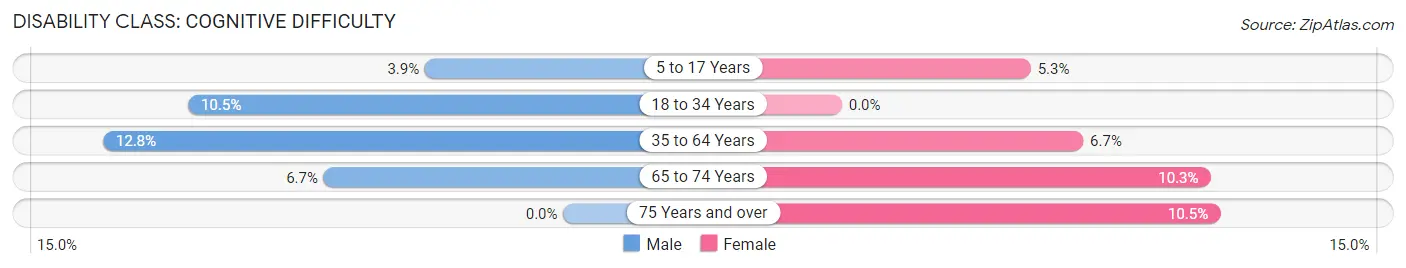
| Age Bracket | Male | Female |
| 5 to 17 Years | 2 (3.8%) | 2 (5.3%) |
| 18 to 34 Years | 7 (10.4%) | 0 (0.0%) |
| 35 to 64 Years | 10 (12.8%) | 8 (6.7%) |
| 65 to 74 Years | 2 (6.7%) | 4 (10.3%) |
| 75 Years and over | 0 (0.0%) | 4 (10.5%) |
Disability Class: Ambulatory Difficulty
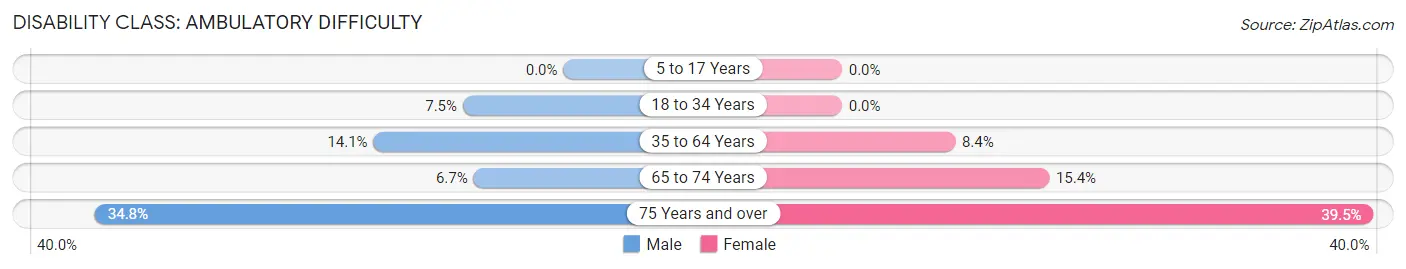
| Age Bracket | Male | Female |
| 5 to 17 Years | 0 (0.0%) | 0 (0.0%) |
| 18 to 34 Years | 5 (7.5%) | 0 (0.0%) |
| 35 to 64 Years | 11 (14.1%) | 10 (8.4%) |
| 65 to 74 Years | 2 (6.7%) | 6 (15.4%) |
| 75 Years and over | 8 (34.8%) | 15 (39.5%) |
Disability Class: Self-Care Difficulty
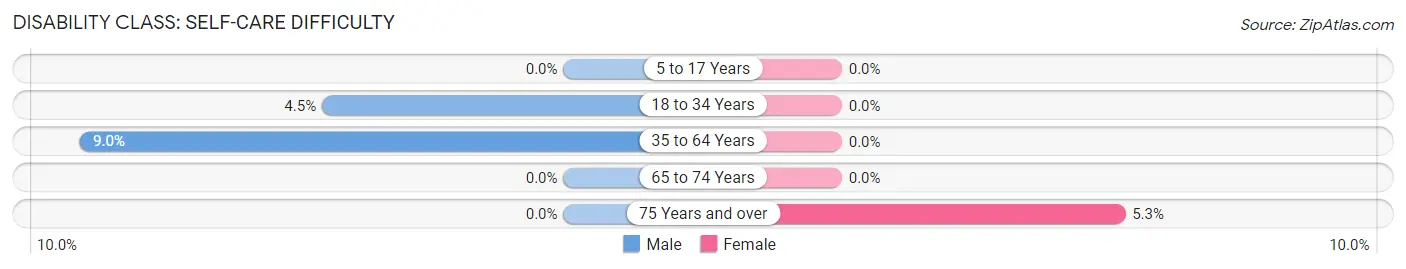
| Age Bracket | Male | Female |
| 5 to 17 Years | 0 (0.0%) | 0 (0.0%) |
| 18 to 34 Years | 3 (4.5%) | 0 (0.0%) |
| 35 to 64 Years | 7 (9.0%) | 0 (0.0%) |
| 65 to 74 Years | 0 (0.0%) | 0 (0.0%) |
| 75 Years and over | 0 (0.0%) | 2 (5.3%) |
Technology Access in Bainbridge
Computing Device Access in Bainbridge
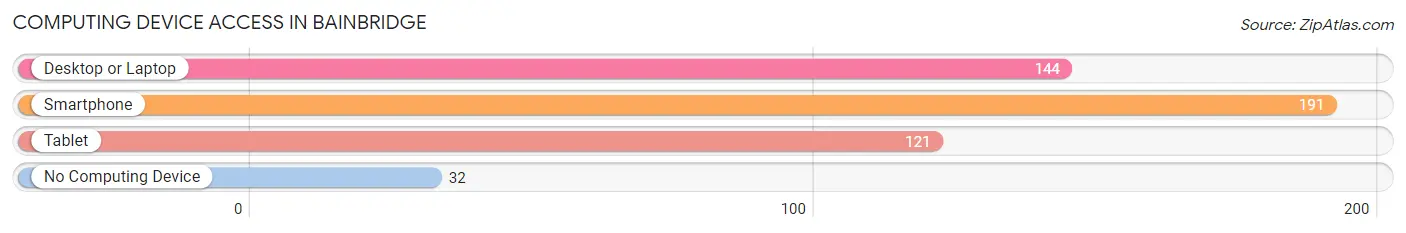
| Device Type | # Households | % Households |
| Desktop or Laptop | 144 | 57.8% |
| Smartphone | 191 | 76.7% |
| Tablet | 121 | 48.6% |
| No Computing Device | 32 | 12.9% |
| Total | 249 | 100.0% |
Internet Access in Bainbridge
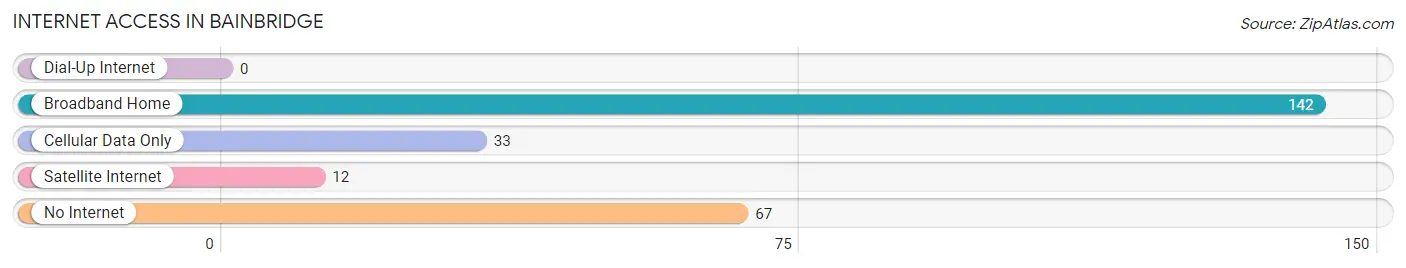
| Internet Type | # Households | % Households |
| Dial-Up Internet | 0 | 0.0% |
| Broadband Home | 142 | 57.0% |
| Cellular Data Only | 33 | 13.3% |
| Satellite Internet | 12 | 4.8% |
| No Internet | 67 | 26.9% |
| Total | 249 | 100.0% |
Bainbridge Summary
Bainbridge is a small village located in Geauga County, Ohio. It is situated on the western edge of the county, just south of Chardon. The village has a population of approximately 1,000 people and covers an area of 0.7 square miles.
History
The area that is now Bainbridge was first settled in 1818 by a group of settlers from Connecticut. The village was originally known as “Bainbridge Corners” and was named after William Bainbridge, a prominent local landowner. The village was officially incorporated in 1837.
In the late 19th century, Bainbridge was a thriving agricultural community. The village was home to several mills, a cheese factory, and a canning factory. The village also had a railroad station, which connected it to the larger cities of Cleveland and Akron.
In the early 20th century, the village began to decline as the local economy shifted away from agriculture. The railroad station closed in the 1920s and the mills and factories closed in the 1930s. The village was able to survive the Great Depression, but it never fully recovered.
Geography
Bainbridge is located in the western part of Geauga County, just south of Chardon. The village is situated on the western edge of the county, near the border with Lake County. The village is surrounded by rolling hills and farmland. The Chagrin River runs through the village, providing a source of water for the local residents.
The village is located approximately 30 miles east of Cleveland and 40 miles west of Akron. The nearest major highway is Interstate 90, which runs through the county.
Economy
The economy of Bainbridge is largely based on agriculture. The village is home to several farms, which produce a variety of crops, including corn, soybeans, and wheat. The village also has a few small businesses, including a grocery store, a hardware store, and a few restaurants.
Demographics
As of the 2010 census, the population of Bainbridge was 1,000 people. The racial makeup of the village was 97.2% White, 0.7% African American, 0.3% Native American, 0.3% Asian, and 1.5% from other races. The median household income was $45,000 and the median family income was $50,000.
The village is served by the Chardon Local School District. The village has one elementary school, one middle school, and one high school. The village also has a public library and a few churches.
Conclusion
Bainbridge is a small village located in Geauga County, Ohio. It has a population of approximately 1,000 people and covers an area of 0.7 square miles. The village was first settled in 1818 and was officially incorporated in 1837. The economy of Bainbridge is largely based on agriculture and the village is served by the Chardon Local School District. The village has a population that is 97.2% White and has a median household income of $45,000.
Common Questions
What is Per Capita Income in Bainbridge?
Per Capita income in Bainbridge is $25,137.
What is the Median Family Income in Bainbridge?
Median Family Income in Bainbridge is $53,182.
What is the Median Household income in Bainbridge?
Median Household Income in Bainbridge is $40,625.
What is Income or Wage Gap in Bainbridge?
Income or Wage Gap in Bainbridge is 20.1%.
Women in Bainbridge earn 79.9 cents for every dollar earned by a man.
What is Inequality or Gini Index in Bainbridge?
Inequality or Gini Index in Bainbridge is 0.44.
What is the Total Population of Bainbridge?
Total Population of Bainbridge is 615.
What is the Total Male Population of Bainbridge?
Total Male Population of Bainbridge is 260.
What is the Total Female Population of Bainbridge?
Total Female Population of Bainbridge is 355.
What is the Ratio of Males per 100 Females in Bainbridge?
There are 73.24 Males per 100 Females in Bainbridge.
What is the Ratio of Females per 100 Males in Bainbridge?
There are 136.54 Females per 100 Males in Bainbridge.
What is the Median Population Age in Bainbridge?
Median Population Age in Bainbridge is 39.7 Years.
What is the Average Family Size in Bainbridge
Average Family Size in Bainbridge is 3.0 People.
What is the Average Household Size in Bainbridge
Average Household Size in Bainbridge is 2.4 People.
How Large is the Labor Force in Bainbridge?
There are 274 People in the Labor Forcein in Bainbridge.
What is the Percentage of People in the Labor Force in Bainbridge?
54.2% of People are in the Labor Force in Bainbridge.
What is the Unemployment Rate in Bainbridge?
Unemployment Rate in Bainbridge is 14.2%.