Peebles, OH Map & Demographics
Peebles Map
Peebles Overview
$17,586
PER CAPITA INCOME
$51,250
AVG FAMILY INCOME
$44,200
AVG HOUSEHOLD INCOME
48.4%
WAGE / INCOME GAP [ % ]
51.6¢/ $1
WAGE / INCOME GAP [ $ ]
$9,778
FAMILY INCOME DEFICIT
0.41
INEQUALITY / GINI INDEX
2,031
TOTAL POPULATION
1,012
MALE POPULATION
1,019
FEMALE POPULATION
99.31
MALES / 100 FEMALES
100.69
FEMALES / 100 MALES
29.7
MEDIAN AGE
3.4
AVG FAMILY SIZE
2.8
AVG HOUSEHOLD SIZE
838
LABOR FORCE [ PEOPLE ]
53.5%
PERCENT IN LABOR FORCE
17.2%
UNEMPLOYMENT RATE
Peebles Zip Codes
Peebles Area Codes
Income in Peebles
Income Overview in Peebles
Per Capita Income in Peebles is $17,586, while median incomes of families and households are $51,250 and $44,200 respectively.
| Characteristic | Number | Measure |
| Per Capita Income | 2,031 | $17,586 |
| Median Family Income | 514 | $51,250 |
| Mean Family Income | 514 | $56,637 |
| Median Household Income | 716 | $44,200 |
| Mean Household Income | 716 | $50,422 |
| Income Deficit | 514 | $9,778 |
| Wage / Income Gap (%) | 2,031 | 48.41% |
| Wage / Income Gap ($) | 2,031 | 51.59¢ per $1 |
| Gini / Inequality Index | 2,031 | 0.41 |
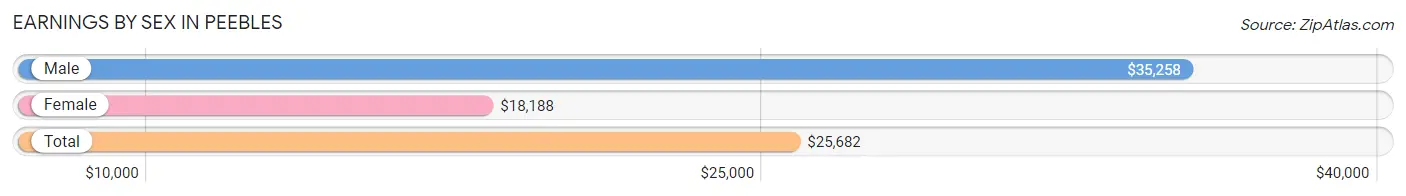
Earnings by Sex in Peebles
Average Earnings in Peebles are $25,682, $35,258 for men and $18,188 for women, a difference of 48.4%.
| Sex | Number | Average Earnings |
| Male | 467 (54.9%) | $35,258 |
| Female | 383 (45.1%) | $18,188 |
| Total | 850 (100.0%) | $25,682 |
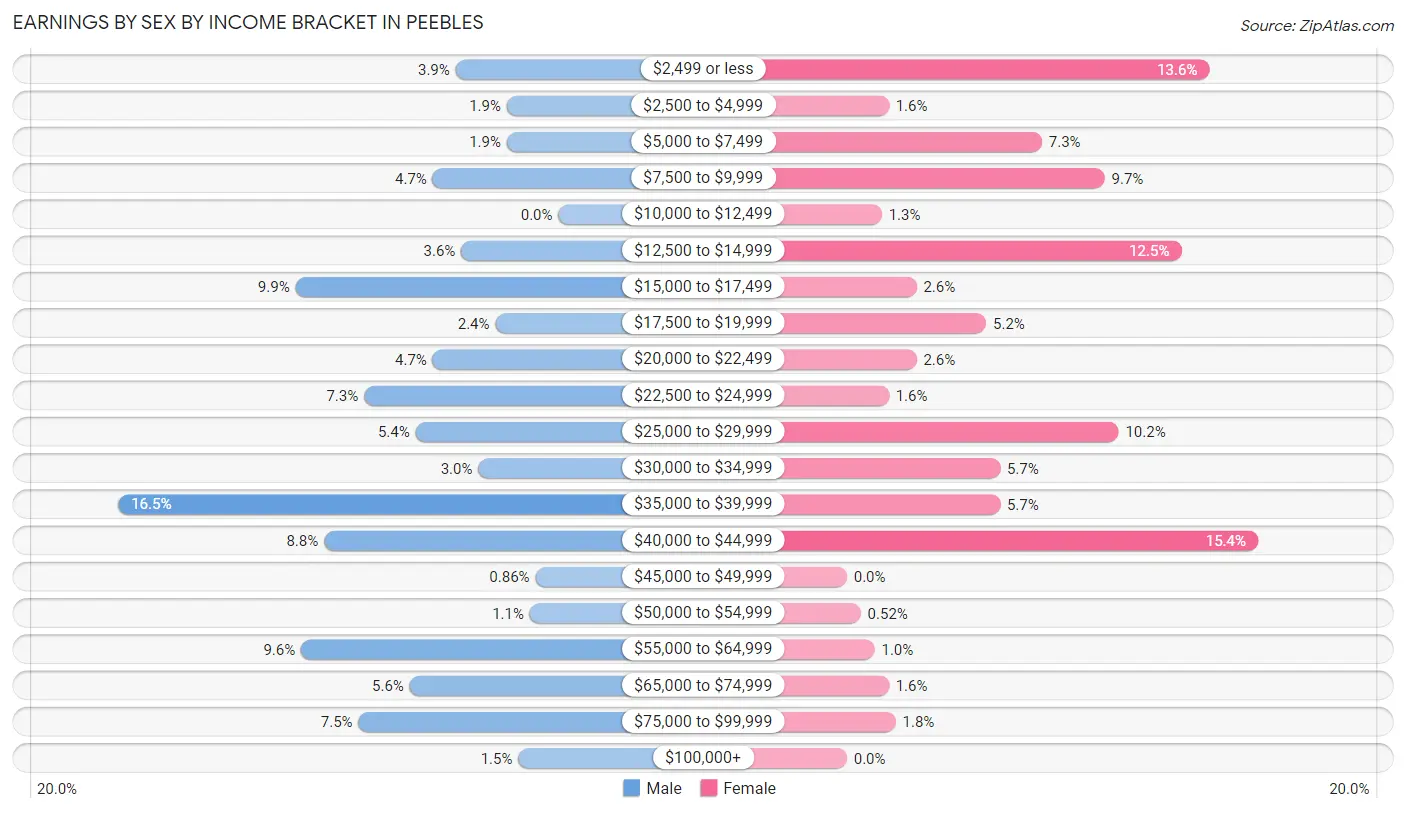
Earnings by Sex by Income Bracket in Peebles
The most common earnings brackets in Peebles are $35,000 to $39,999 for men (77 | 16.5%) and $40,000 to $44,999 for women (59 | 15.4%).
| Income | Male | Female |
| $2,499 or less | 18 (3.8%) | 52 (13.6%) |
| $2,500 to $4,999 | 9 (1.9%) | 6 (1.6%) |
| $5,000 to $7,499 | 9 (1.9%) | 28 (7.3%) |
| $7,500 to $9,999 | 22 (4.7%) | 37 (9.7%) |
| $10,000 to $12,499 | 0 (0.0%) | 5 (1.3%) |
| $12,500 to $14,999 | 17 (3.6%) | 48 (12.5%) |
| $15,000 to $17,499 | 46 (9.9%) | 10 (2.6%) |
| $17,500 to $19,999 | 11 (2.4%) | 20 (5.2%) |
| $20,000 to $22,499 | 22 (4.7%) | 10 (2.6%) |
| $22,500 to $24,999 | 34 (7.3%) | 6 (1.6%) |
| $25,000 to $29,999 | 25 (5.3%) | 39 (10.2%) |
| $30,000 to $34,999 | 14 (3.0%) | 22 (5.7%) |
| $35,000 to $39,999 | 77 (16.5%) | 22 (5.7%) |
| $40,000 to $44,999 | 41 (8.8%) | 59 (15.4%) |
| $45,000 to $49,999 | 4 (0.9%) | 0 (0.0%) |
| $50,000 to $54,999 | 5 (1.1%) | 2 (0.5%) |
| $55,000 to $64,999 | 45 (9.6%) | 4 (1.0%) |
| $65,000 to $74,999 | 26 (5.6%) | 6 (1.6%) |
| $75,000 to $99,999 | 35 (7.5%) | 7 (1.8%) |
| $100,000+ | 7 (1.5%) | 0 (0.0%) |
| Total | 467 (100.0%) | 383 (100.0%) |
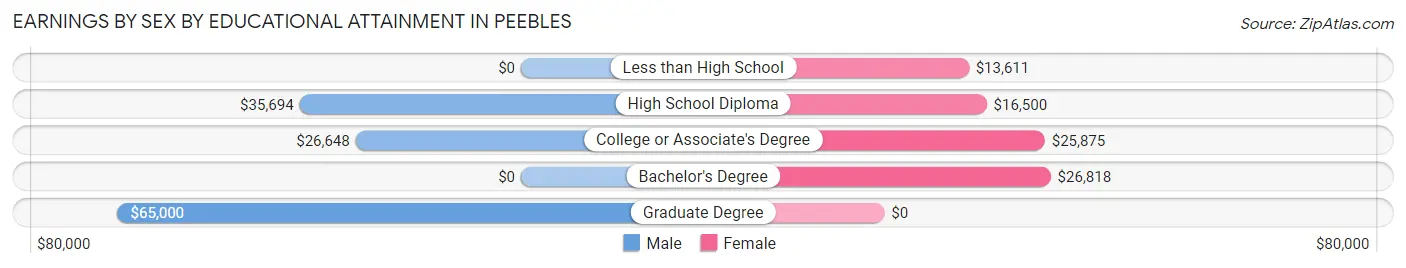
Earnings by Sex by Educational Attainment in Peebles
Average earnings in Peebles are $35,873 for men and $19,438 for women, a difference of 45.8%. Men with an educational attainment of graduate degree enjoy the highest average annual earnings of $65,000, while those with college or associate's degree education earn the least with $26,648. Women with an educational attainment of bachelor's degree earn the most with the average annual earnings of $26,818, while those with less than high school education have the smallest earnings of $13,611.
| Educational Attainment | Male Income | Female Income |
| Less than High School | - | - |
| High School Diploma | $35,694 | $16,500 |
| College or Associate's Degree | $26,648 | $25,875 |
| Bachelor's Degree | - | - |
| Graduate Degree | $65,000 | $0 |
| Total | $35,873 | $19,438 |
Family Income in Peebles
Family Income Brackets in Peebles
According to the Peebles family income data, there are 158 families falling into the $75,000 to $99,999 income range, which is the most common income bracket and makes up 30.7% of all families. Conversely, the $200,000+ income bracket is the least frequent group with only 7 families (1.4%) belonging to this category.
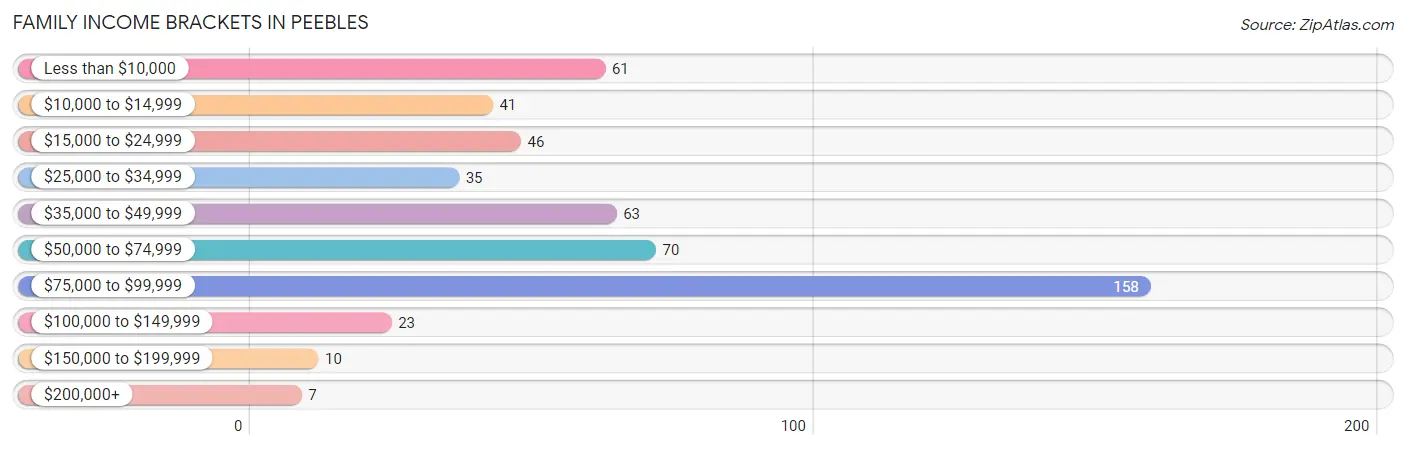
| Income Bracket | # Families | % Families |
| Less than $10,000 | 61 | 11.9% |
| $10,000 to $14,999 | 41 | 8.0% |
| $15,000 to $24,999 | 46 | 8.9% |
| $25,000 to $34,999 | 35 | 6.8% |
| $35,000 to $49,999 | 63 | 12.3% |
| $50,000 to $74,999 | 70 | 13.6% |
| $75,000 to $99,999 | 158 | 30.7% |
| $100,000 to $149,999 | 23 | 4.5% |
| $150,000 to $199,999 | 10 | 1.9% |
| $200,000+ | 7 | 1.4% |
Family Income by Famaliy Size in Peebles
4-person families (142 | 27.6%) account for the highest median family income in Peebles with $68,571 per family, while 2-person families (193 | 37.6%) have the highest median income of $32,708 per family member.
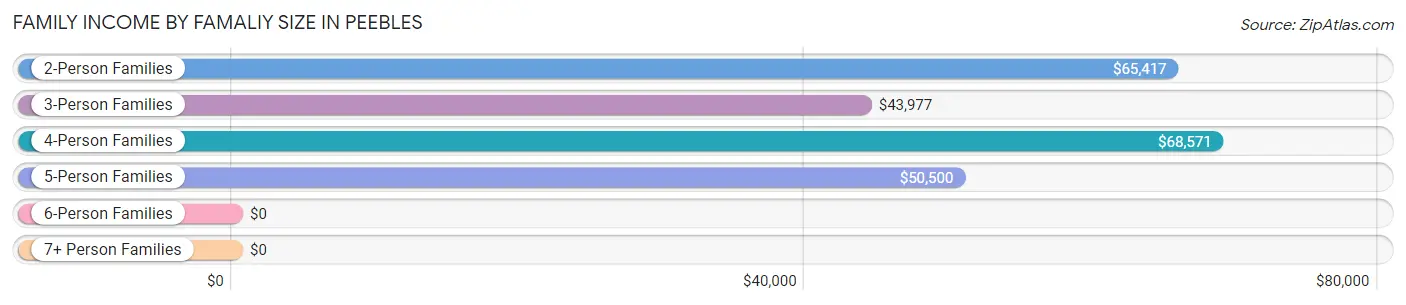
| Income Bracket | # Families | Median Income |
| 2-Person Families | 193 (37.6%) | $65,417 |
| 3-Person Families | 119 (23.2%) | $43,977 |
| 4-Person Families | 142 (27.6%) | $68,571 |
| 5-Person Families | 22 (4.3%) | $50,500 |
| 6-Person Families | 22 (4.3%) | $0 |
| 7+ Person Families | 16 (3.1%) | $0 |
| Total | 514 (100.0%) | $51,250 |
Family Income by Number of Earners in Peebles
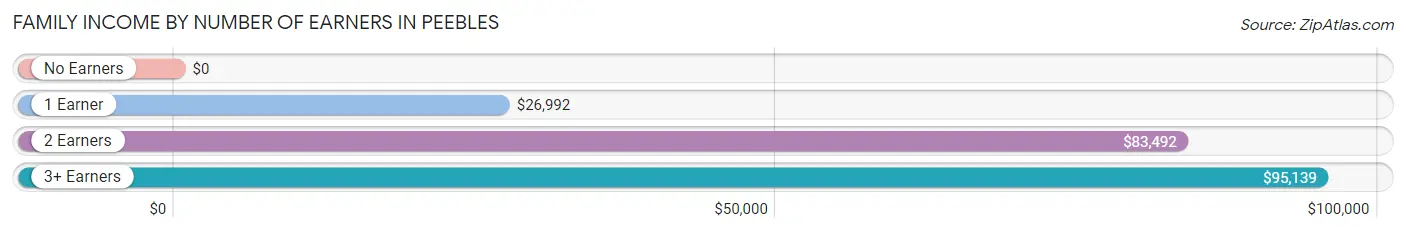
| Number of Earners | # Families | Median Income |
| No Earners | 82 (16.0%) | $0 |
| 1 Earner | 209 (40.7%) | $26,992 |
| 2 Earners | 180 (35.0%) | $83,492 |
| 3+ Earners | 43 (8.4%) | $95,139 |
| Total | 514 (100.0%) | $51,250 |
Household Income in Peebles
Household Income Brackets in Peebles
With 167 households falling in the category, the $75,000 to $99,999 income range is the most frequent in Peebles, accounting for 23.3% of all households. In contrast, only 7 households (1.0%) fall into the $200,000+ income bracket, making it the least populous group.
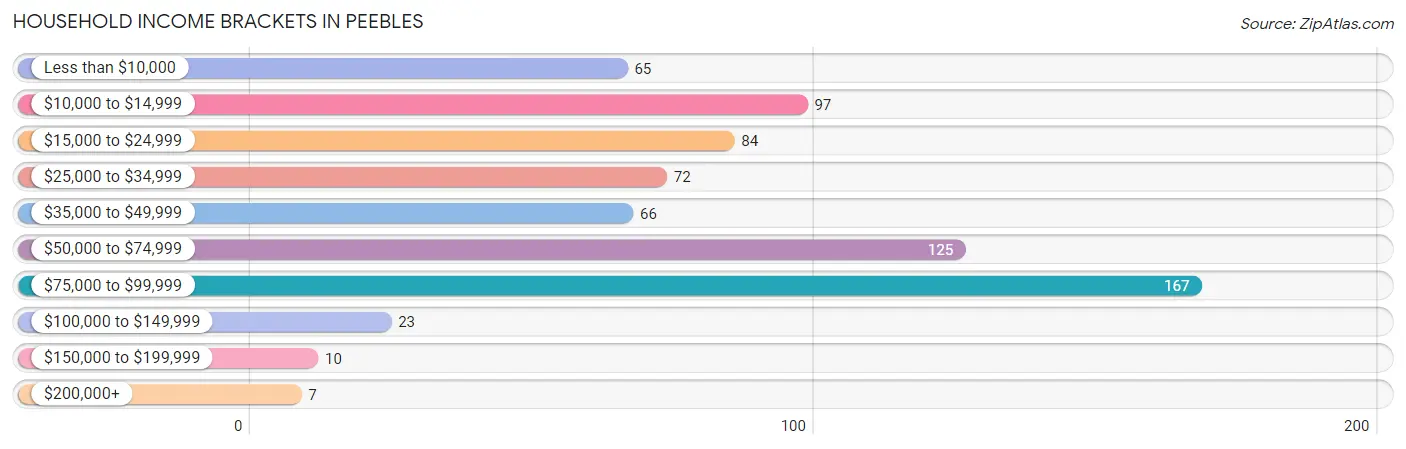
| Income Bracket | # Households | % Households |
| Less than $10,000 | 65 | 9.1% |
| $10,000 to $14,999 | 97 | 13.5% |
| $15,000 to $24,999 | 84 | 11.7% |
| $25,000 to $34,999 | 72 | 10.1% |
| $35,000 to $49,999 | 66 | 9.2% |
| $50,000 to $74,999 | 125 | 17.5% |
| $75,000 to $99,999 | 167 | 23.3% |
| $100,000 to $149,999 | 23 | 3.2% |
| $150,000 to $199,999 | 10 | 1.4% |
| $200,000+ | 7 | 1.0% |
Household Income by Householder Age in Peebles
The median household income in Peebles is $44,200, with the highest median household income of $53,750 found in the 45 to 64 years age bracket for the primary householder. A total of 207 households (28.9%) fall into this category. Meanwhile, the 15 to 24 years age bracket for the primary householder has the lowest median household income of $0, with 55 households (7.7%) in this group.
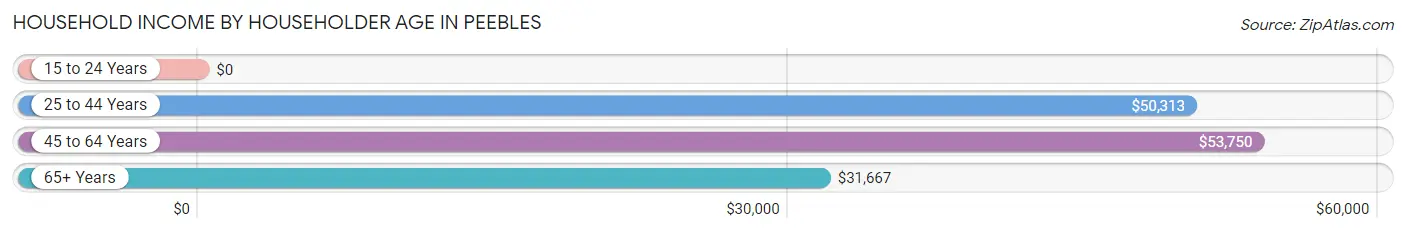
| Income Bracket | # Households | Median Income |
| 15 to 24 Years | 55 (7.7%) | $0 |
| 25 to 44 Years | 278 (38.8%) | $50,313 |
| 45 to 64 Years | 207 (28.9%) | $53,750 |
| 65+ Years | 176 (24.6%) | $31,667 |
| Total | 716 (100.0%) | $44,200 |
Poverty in Peebles
Income Below Poverty by Sex and Age in Peebles
With 41.5% poverty level for males and 41.6% for females among the residents of Peebles, 15 year old males and 15 year old females are the most vulnerable to poverty, with 3 males (100.0%) and 18 females (85.7%) in their respective age groups living below the poverty level.
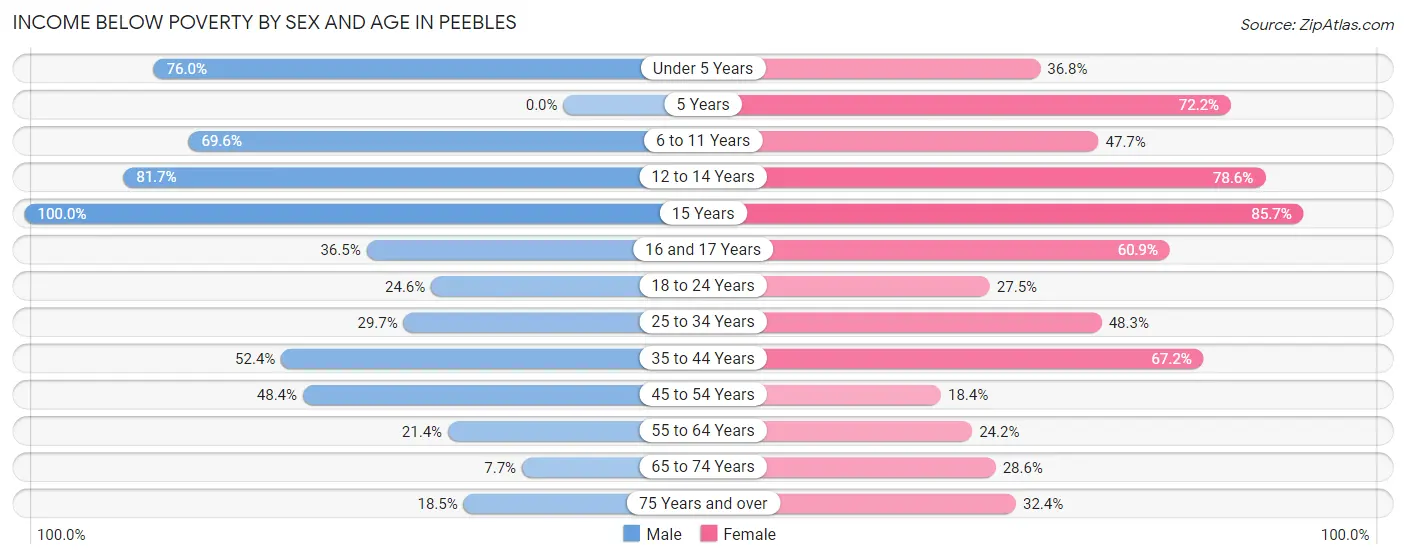
| Age Bracket | Male | Female |
| Under 5 Years | 73 (76.0%) | 21 (36.8%) |
| 5 Years | 0 (0.0%) | 13 (72.2%) |
| 6 to 11 Years | 64 (69.6%) | 41 (47.7%) |
| 12 to 14 Years | 49 (81.7%) | 22 (78.6%) |
| 15 Years | 3 (100.0%) | 18 (85.7%) |
| 16 and 17 Years | 19 (36.5%) | 28 (60.9%) |
| 18 to 24 Years | 27 (24.5%) | 47 (27.5%) |
| 25 to 34 Years | 70 (29.7%) | 55 (48.2%) |
| 35 to 44 Years | 33 (52.4%) | 90 (67.2%) |
| 45 to 54 Years | 44 (48.3%) | 14 (18.4%) |
| 55 to 64 Years | 30 (21.4%) | 23 (24.2%) |
| 65 to 74 Years | 3 (7.7%) | 30 (28.6%) |
| 75 Years and over | 5 (18.5%) | 22 (32.4%) |
| Total | 420 (41.5%) | 424 (41.6%) |
Income Above Poverty by Sex and Age in Peebles
According to the poverty statistics in Peebles, males aged 5 years and females aged 45 to 54 years are the age groups that are most secure financially, with 100.0% of males and 81.6% of females in these age groups living above the poverty line.
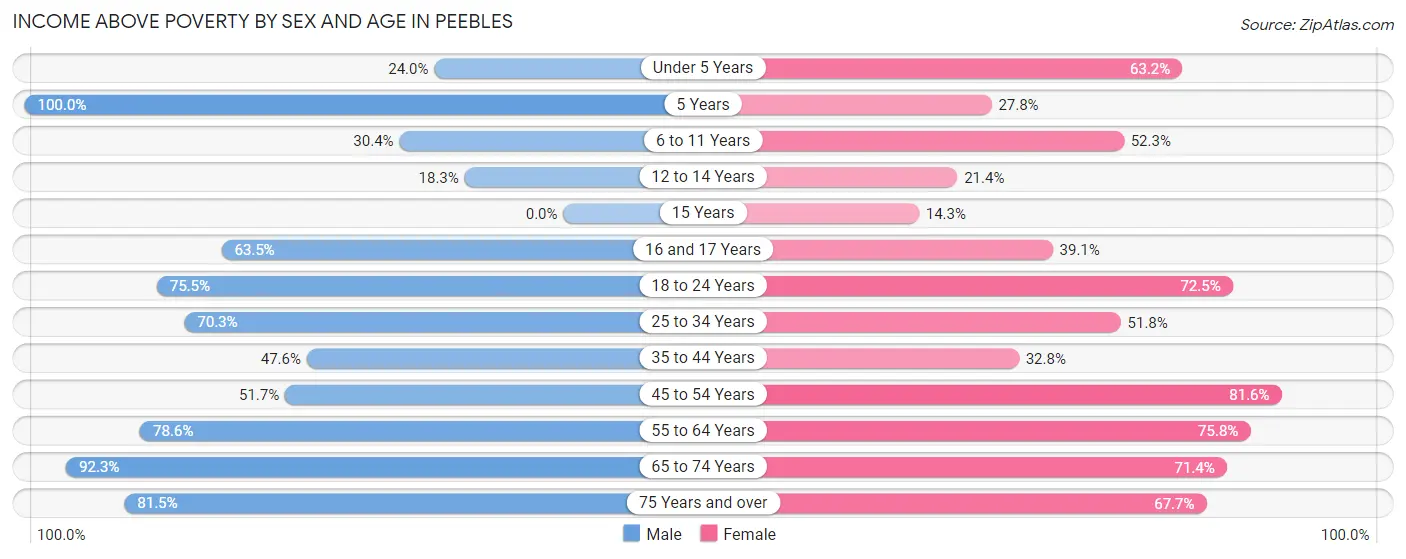
| Age Bracket | Male | Female |
| Under 5 Years | 23 (24.0%) | 36 (63.2%) |
| 5 Years | 3 (100.0%) | 5 (27.8%) |
| 6 to 11 Years | 28 (30.4%) | 45 (52.3%) |
| 12 to 14 Years | 11 (18.3%) | 6 (21.4%) |
| 15 Years | 0 (0.0%) | 3 (14.3%) |
| 16 and 17 Years | 33 (63.5%) | 18 (39.1%) |
| 18 to 24 Years | 83 (75.4%) | 124 (72.5%) |
| 25 to 34 Years | 166 (70.3%) | 59 (51.7%) |
| 35 to 44 Years | 30 (47.6%) | 44 (32.8%) |
| 45 to 54 Years | 47 (51.6%) | 62 (81.6%) |
| 55 to 64 Years | 110 (78.6%) | 72 (75.8%) |
| 65 to 74 Years | 36 (92.3%) | 75 (71.4%) |
| 75 Years and over | 22 (81.5%) | 46 (67.6%) |
| Total | 592 (58.5%) | 595 (58.4%) |
Income Below Poverty Among Married-Couple Families in Peebles
The poverty statistics for married-couple families in Peebles show that 22.7% or 83 of the total 365 families live below the poverty line. Families with 3 or 4 children have the highest poverty rate of 67.4%, comprising of 31 families. On the other hand, families with no children have the lowest poverty rate of 6.2%, which includes 12 families.
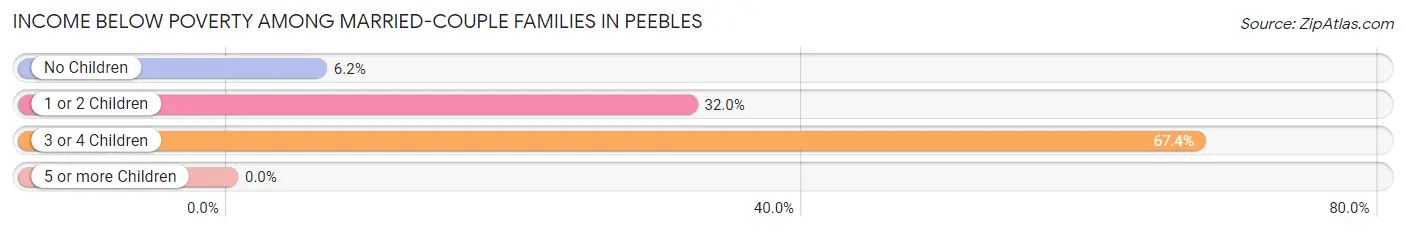
| Children | Above Poverty | Below Poverty |
| No Children | 182 (93.8%) | 12 (6.2%) |
| 1 or 2 Children | 85 (68.0%) | 40 (32.0%) |
| 3 or 4 Children | 15 (32.6%) | 31 (67.4%) |
| 5 or more Children | 0 (0.0%) | 0 (0.0%) |
| Total | 282 (77.3%) | 83 (22.7%) |
Income Below Poverty Among Single-Parent Households in Peebles
According to the poverty data in Peebles, 53.3% or 8 single-father households and 67.9% or 91 single-mother households are living below the poverty line. Among single-father households, those with 1 or 2 children have the highest poverty rate, with 8 households (72.7%) experiencing poverty. Likewise, among single-mother households, those with 5 or more children have the highest poverty rate, with 2 households (100.0%) falling below the poverty line.
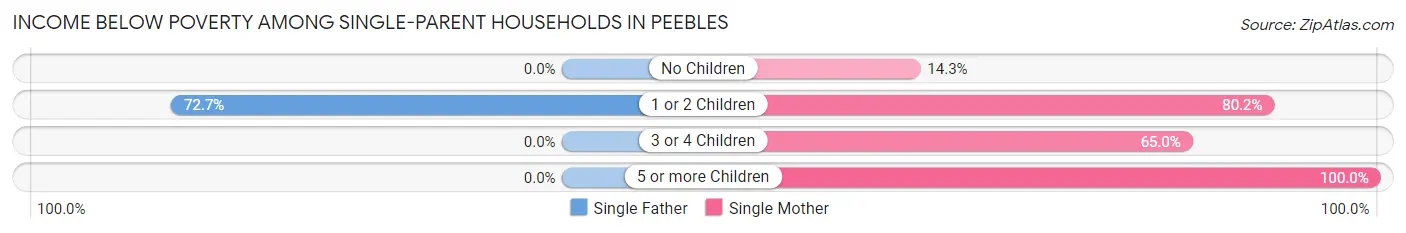
| Children | Single Father | Single Mother |
| No Children | 0 (0.0%) | 3 (14.3%) |
| 1 or 2 Children | 8 (72.7%) | 73 (80.2%) |
| 3 or 4 Children | 0 (0.0%) | 13 (65.0%) |
| 5 or more Children | 0 (0.0%) | 2 (100.0%) |
| Total | 8 (53.3%) | 91 (67.9%) |
Income Below Poverty Among Married-Couple vs Single-Parent Households in Peebles
The poverty data for Peebles shows that 83 of the married-couple family households (22.7%) and 99 of the single-parent households (66.4%) are living below the poverty level. Within the married-couple family households, those with 3 or 4 children have the highest poverty rate, with 31 households (67.4%) falling below the poverty line. Among the single-parent households, those with 5 or more children have the highest poverty rate, with 2 household (100.0%) living below poverty.
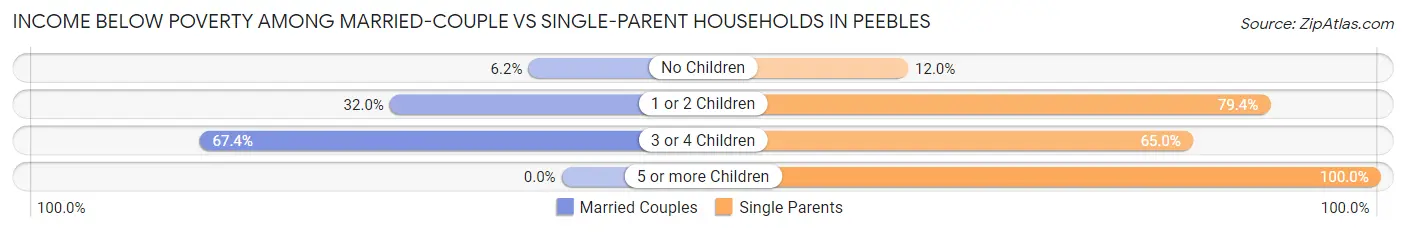
| Children | Married-Couple Families | Single-Parent Households |
| No Children | 12 (6.2%) | 3 (12.0%) |
| 1 or 2 Children | 40 (32.0%) | 81 (79.4%) |
| 3 or 4 Children | 31 (67.4%) | 13 (65.0%) |
| 5 or more Children | 0 (0.0%) | 2 (100.0%) |
| Total | 83 (22.7%) | 99 (66.4%) |
Race in Peebles
The most populous races in Peebles are White / Caucasian (1,964 | 96.7%), Asian (45 | 2.2%), and Hispanic or Latino (44 | 2.2%).
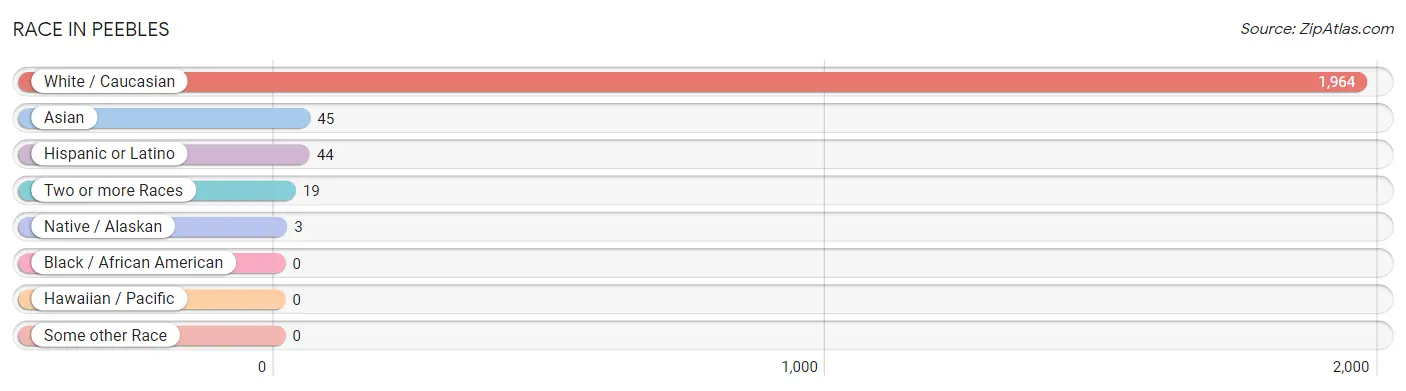
| Race | # Population | % Population |
| Asian | 45 | 2.2% |
| Black / African American | 0 | 0.0% |
| Hawaiian / Pacific | 0 | 0.0% |
| Hispanic or Latino | 44 | 2.2% |
| Native / Alaskan | 3 | 0.2% |
| White / Caucasian | 1,964 | 96.7% |
| Two or more Races | 19 | 0.9% |
| Some other Race | 0 | 0.0% |
| Total | 2,031 | 100.0% |
Ancestry in Peebles
The most populous ancestries reported in Peebles are German (267 | 13.2%), Irish (201 | 9.9%), American (200 | 9.9%), English (171 | 8.4%), and French (82 | 4.0%), together accounting for 45.4% of all Peebles residents.
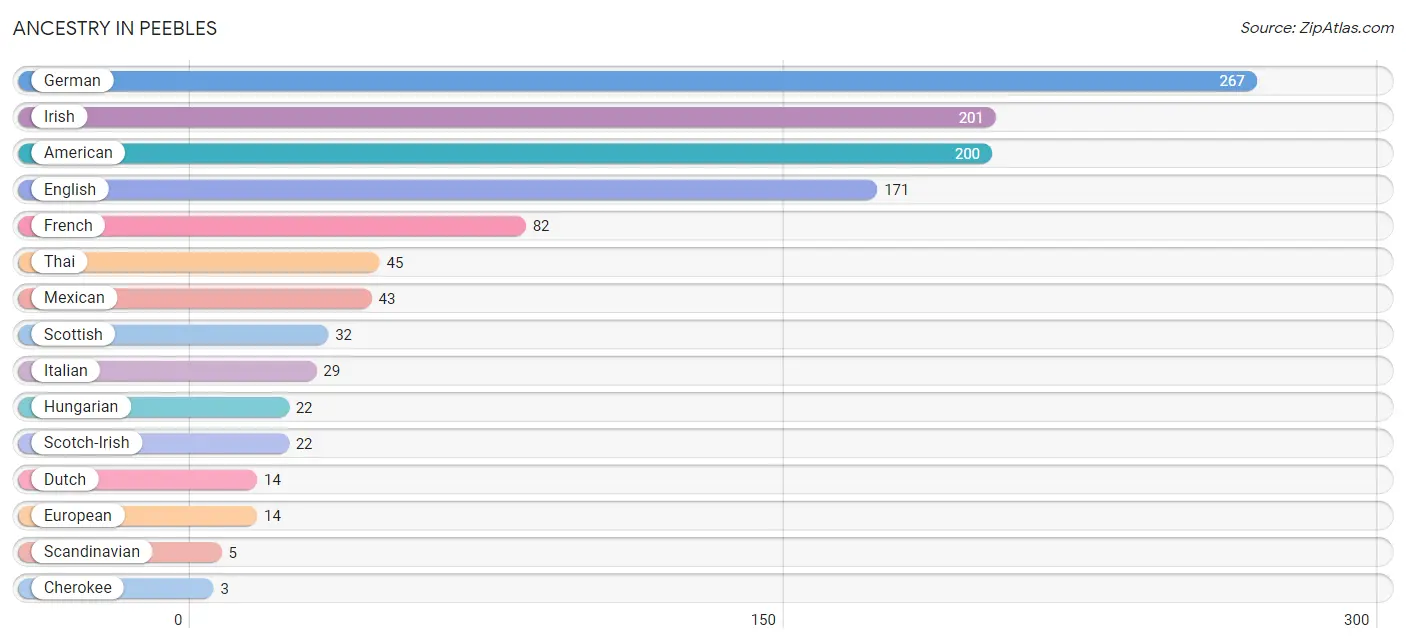
| Ancestry | # Population | % Population |
| American | 200 | 9.9% |
| Central American | 1 | 0.1% |
| Cherokee | 3 | 0.2% |
| Dutch | 14 | 0.7% |
| English | 171 | 8.4% |
| European | 14 | 0.7% |
| French | 82 | 4.0% |
| German | 267 | 13.2% |
| Honduran | 1 | 0.1% |
| Hungarian | 22 | 1.1% |
| Irish | 201 | 9.9% |
| Italian | 29 | 1.4% |
| Mexican | 43 | 2.1% |
| Norwegian | 2 | 0.1% |
| Polish | 2 | 0.1% |
| Scandinavian | 5 | 0.3% |
| Scotch-Irish | 22 | 1.1% |
| Scottish | 32 | 1.6% |
| Thai | 45 | 2.2% |
| Welsh | 2 | 0.1% | View All 20 Rows |
Immigrants in Peebles
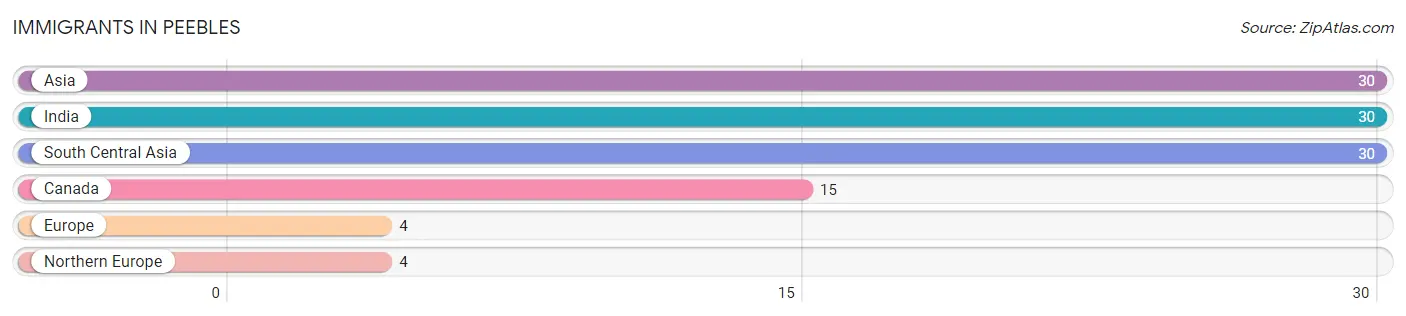
The most numerous immigrant groups reported in Peebles came from Asia (30 | 1.5%), India (30 | 1.5%), South Central Asia (30 | 1.5%), Canada (15 | 0.7%), and Europe (4 | 0.2%), together accounting for 5.4% of all Peebles residents.
| Immigration Origin | # Population | % Population |
| Asia | 30 | 1.5% |
| Canada | 15 | 0.7% |
| Europe | 4 | 0.2% |
| India | 30 | 1.5% |
| Northern Europe | 4 | 0.2% |
| South Central Asia | 30 | 1.5% | View All 6 Rows |
Sex and Age in Peebles
Sex and Age in Peebles
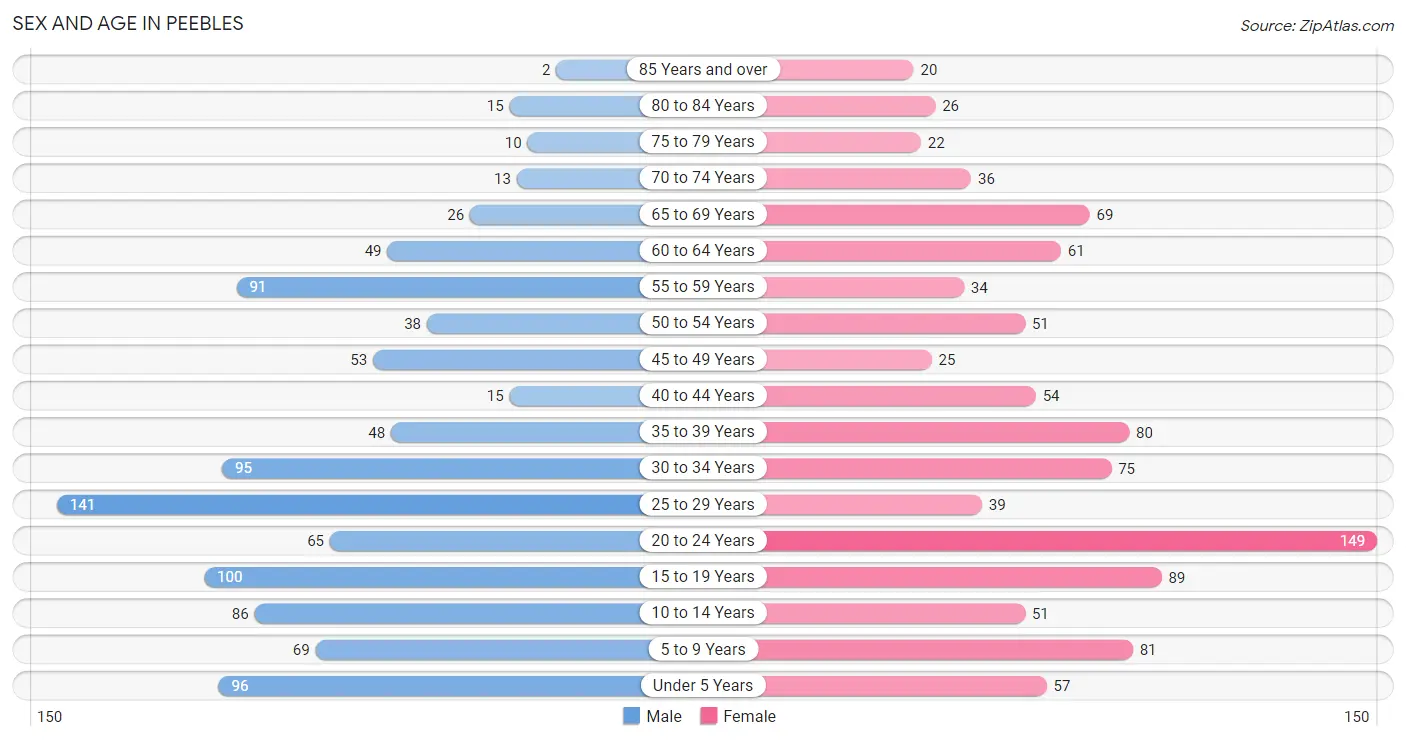
The most populous age groups in Peebles are 25 to 29 Years (141 | 13.9%) for men and 20 to 24 Years (149 | 14.6%) for women.
| Age Bracket | Male | Female |
| Under 5 Years | 96 (9.5%) | 57 (5.6%) |
| 5 to 9 Years | 69 (6.8%) | 81 (8.0%) |
| 10 to 14 Years | 86 (8.5%) | 51 (5.0%) |
| 15 to 19 Years | 100 (9.9%) | 89 (8.7%) |
| 20 to 24 Years | 65 (6.4%) | 149 (14.6%) |
| 25 to 29 Years | 141 (13.9%) | 39 (3.8%) |
| 30 to 34 Years | 95 (9.4%) | 75 (7.4%) |
| 35 to 39 Years | 48 (4.7%) | 80 (7.9%) |
| 40 to 44 Years | 15 (1.5%) | 54 (5.3%) |
| 45 to 49 Years | 53 (5.2%) | 25 (2.5%) |
| 50 to 54 Years | 38 (3.7%) | 51 (5.0%) |
| 55 to 59 Years | 91 (9.0%) | 34 (3.3%) |
| 60 to 64 Years | 49 (4.8%) | 61 (6.0%) |
| 65 to 69 Years | 26 (2.6%) | 69 (6.8%) |
| 70 to 74 Years | 13 (1.3%) | 36 (3.5%) |
| 75 to 79 Years | 10 (1.0%) | 22 (2.2%) |
| 80 to 84 Years | 15 (1.5%) | 26 (2.5%) |
| 85 Years and over | 2 (0.2%) | 20 (2.0%) |
| Total | 1,012 (100.0%) | 1,019 (100.0%) |
Families and Households in Peebles
Median Family Size in Peebles
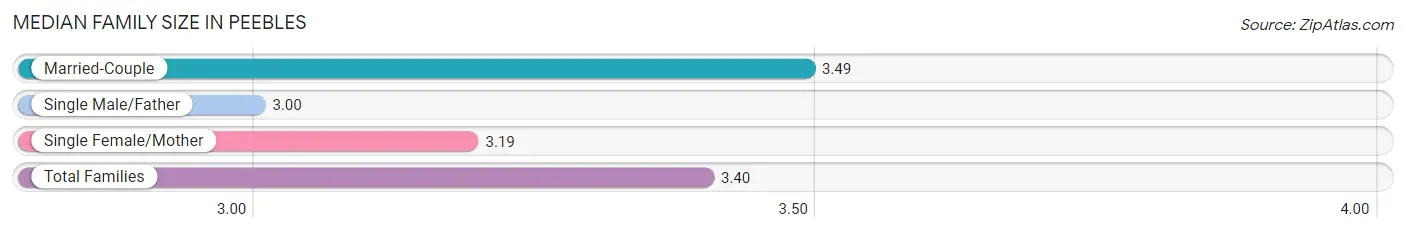
The median family size in Peebles is 3.40 persons per family, with married-couple families (365 | 71.0%) accounting for the largest median family size of 3.49 persons per family. On the other hand, single male/father families (15 | 2.9%) represent the smallest median family size with 3.00 persons per family.
| Family Type | # Families | Family Size |
| Married-Couple | 365 (71.0%) | 3.49 |
| Single Male/Father | 15 (2.9%) | 3.00 |
| Single Female/Mother | 134 (26.1%) | 3.19 |
| Total Families | 514 (100.0%) | 3.40 |
Median Household Size in Peebles
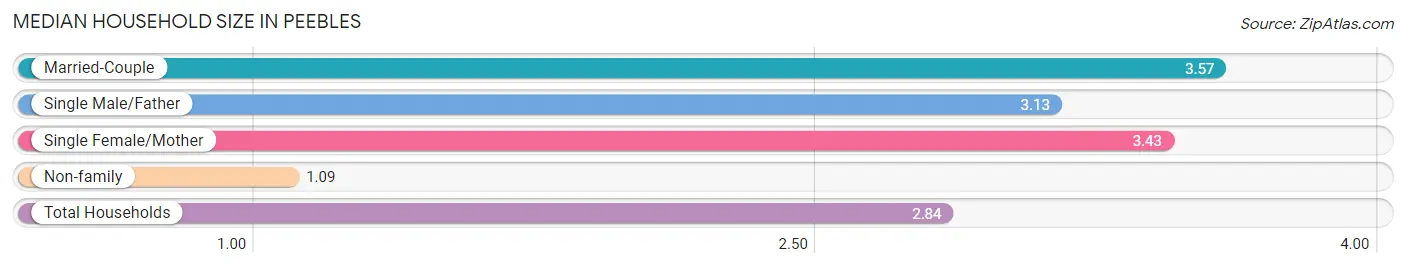
The median household size in Peebles is 2.84 persons per household, with married-couple households (365 | 51.0%) accounting for the largest median household size of 3.57 persons per household. non-family households (202 | 28.2%) represent the smallest median household size with 1.09 persons per household.
| Household Type | # Households | Household Size |
| Married-Couple | 365 (51.0%) | 3.57 |
| Single Male/Father | 15 (2.1%) | 3.13 |
| Single Female/Mother | 134 (18.7%) | 3.43 |
| Non-family | 202 (28.2%) | 1.09 |
| Total Households | 716 (100.0%) | 2.84 |
Household Size by Marriage Status in Peebles
Out of a total of 716 households in Peebles, 514 (71.8%) are family households, while 202 (28.2%) are nonfamily households. The most numerous type of family households are 2-person households, comprising 174, and the most common type of nonfamily households are 1-person households, comprising 187.
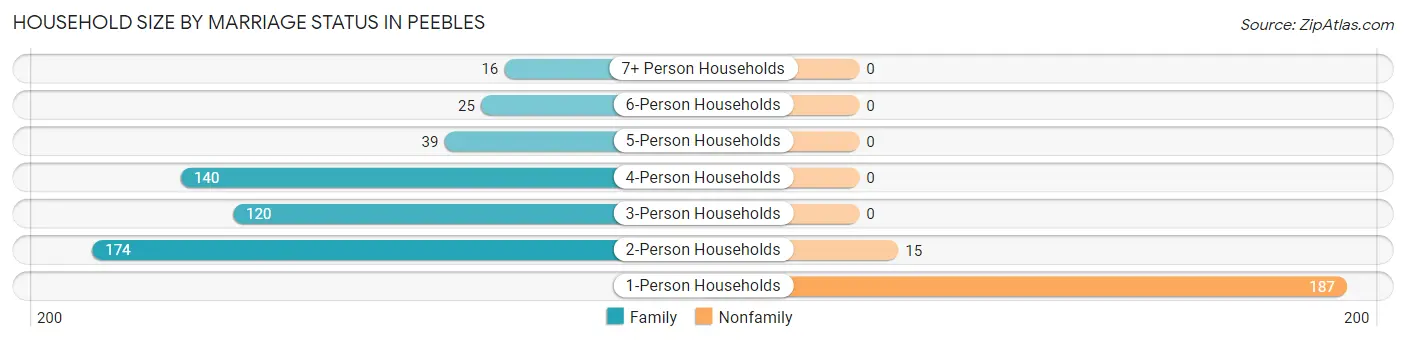
| Household Size | Family Households | Nonfamily Households |
| 1-Person Households | - | 187 (26.1%) |
| 2-Person Households | 174 (24.3%) | 15 (2.1%) |
| 3-Person Households | 120 (16.8%) | 0 (0.0%) |
| 4-Person Households | 140 (19.6%) | 0 (0.0%) |
| 5-Person Households | 39 (5.4%) | 0 (0.0%) |
| 6-Person Households | 25 (3.5%) | 0 (0.0%) |
| 7+ Person Households | 16 (2.2%) | 0 (0.0%) |
| Total | 514 (71.8%) | 202 (28.2%) |
Female Fertility in Peebles
Fertility by Age in Peebles
Average fertility rate in Peebles is 60.0 births per 1,000 women. Women in the age bracket of 20 to 34 years have the highest fertility rate with 122.0 births per 1,000 women. Women in the age bracket of 20 to 34 years acount for 100.0% of all women with births.
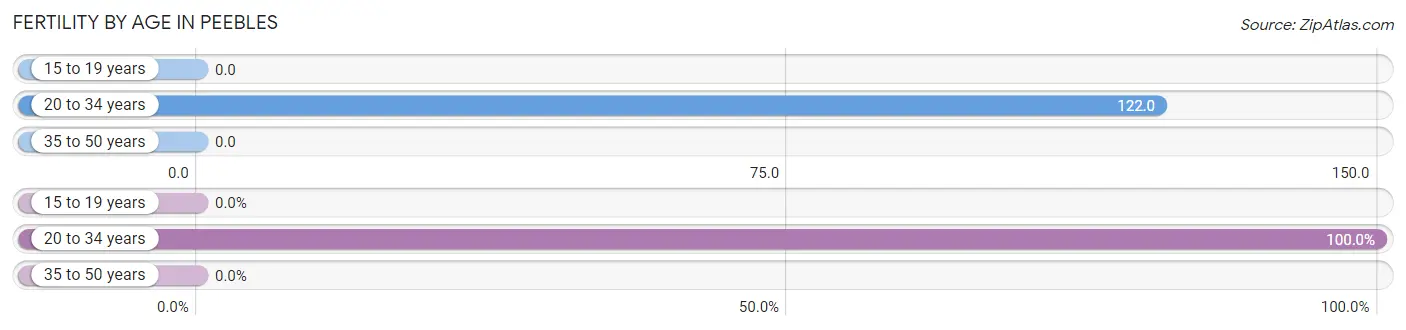
| Age Bracket | Women with Births | Births / 1,000 Women |
| 15 to 19 years | 0 (0.0%) | 0.0 |
| 20 to 34 years | 32 (100.0%) | 122.0 |
| 35 to 50 years | 0 (0.0%) | 0.0 |
| Total | 32 (100.0%) | 60.0 |
Fertility by Age by Marriage Status in Peebles
25.0% of women with births (32) in Peebles are married. The highest percentage of unmarried women with births falls into 20 to 34 years age bracket with 75.0% of them unmarried at the time of birth, while the lowest percentage of unmarried women with births belong to 20 to 34 years age bracket with 75.0% of them unmarried.
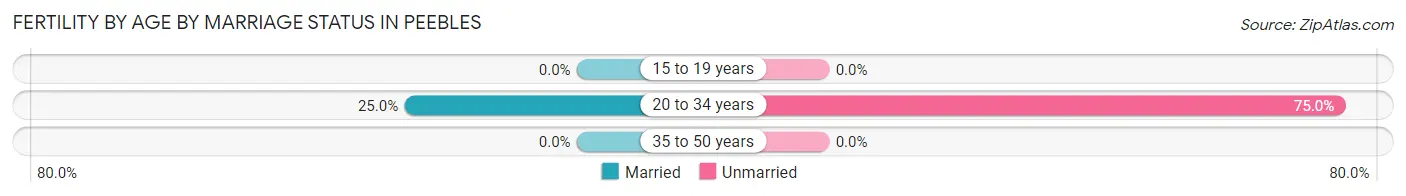
| Age Bracket | Married | Unmarried |
| 15 to 19 years | 0 (0.0%) | 0 (0.0%) |
| 20 to 34 years | 8 (25.0%) | 24 (75.0%) |
| 35 to 50 years | 0 (0.0%) | 0 (0.0%) |
| Total | 8 (25.0%) | 24 (75.0%) |
Fertility by Education in Peebles
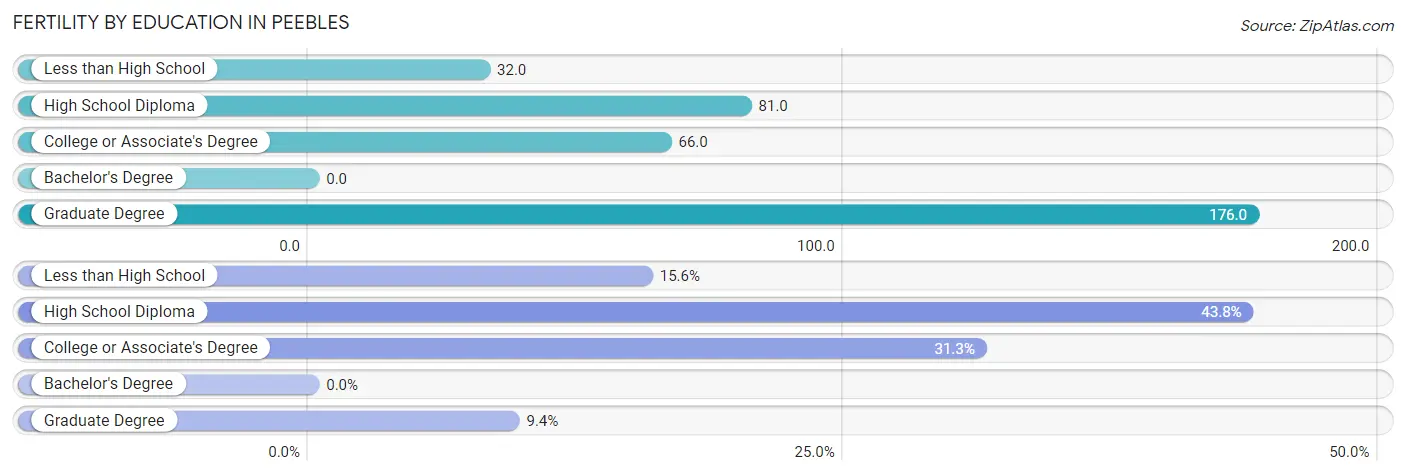
| Educational Attainment | Women with Births | Births / 1,000 Women |
| Less than High School | 5 (15.6%) | 32.0 |
| High School Diploma | 14 (43.8%) | 81.0 |
| College or Associate's Degree | 10 (31.2%) | 66.0 |
| Bachelor's Degree | 0 (0.0%) | 0.0 |
| Graduate Degree | 3 (9.4%) | 176.0 |
| Total | 32 (100.0%) | 60.0 |
Fertility by Education by Marriage Status in Peebles
75.0% of women with births in Peebles are unmarried. Women with the educational attainment of less than high school are most likely to be married with 100.0% of them married at childbirth, while women with the educational attainment of high school diploma are least likely to be married with 100.0% of them unmarried at childbirth.
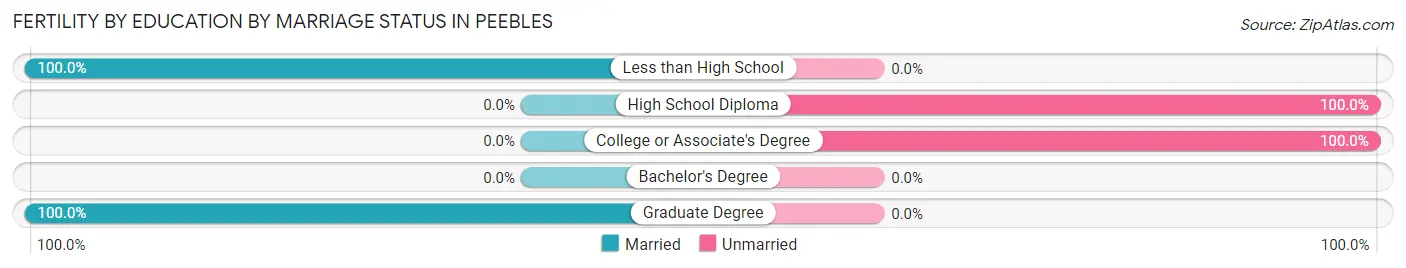
| Educational Attainment | Married | Unmarried |
| Less than High School | 5 (100.0%) | 0 (0.0%) |
| High School Diploma | 0 (0.0%) | 14 (100.0%) |
| College or Associate's Degree | 0 (0.0%) | 10 (100.0%) |
| Bachelor's Degree | 0 (0.0%) | 0 (0.0%) |
| Graduate Degree | 3 (100.0%) | 0 (0.0%) |
| Total | 8 (25.0%) | 24 (75.0%) |
Employment Characteristics in Peebles
Employment by Class of Employer in Peebles
Among the 685 employed individuals in Peebles, private company employees (509 | 74.3%), not-for-profit organizations (57 | 8.3%), and local government employees (39 | 5.7%) make up the most common classes of employment.
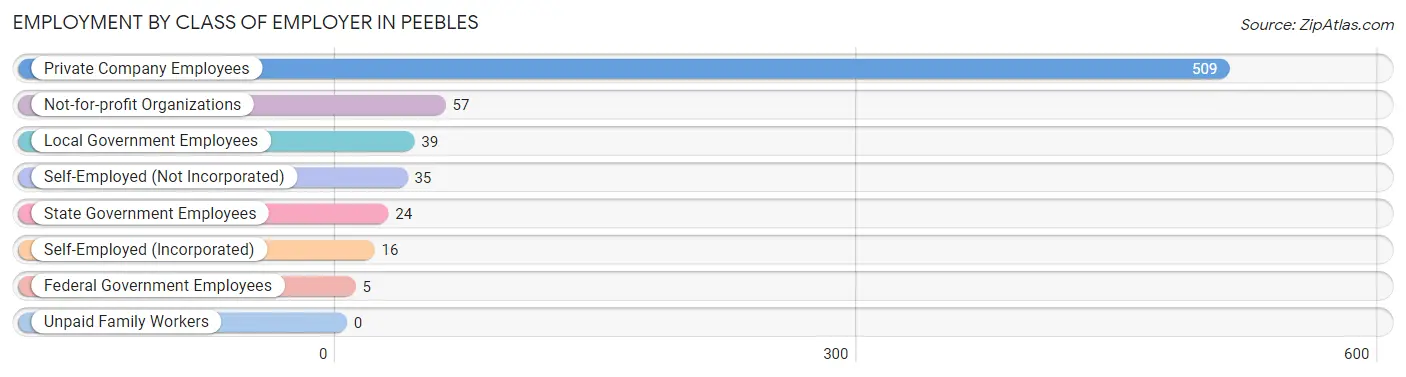
| Employer Class | # Employees | % Employees |
| Private Company Employees | 509 | 74.3% |
| Self-Employed (Incorporated) | 16 | 2.3% |
| Self-Employed (Not Incorporated) | 35 | 5.1% |
| Not-for-profit Organizations | 57 | 8.3% |
| Local Government Employees | 39 | 5.7% |
| State Government Employees | 24 | 3.5% |
| Federal Government Employees | 5 | 0.7% |
| Unpaid Family Workers | 0 | 0.0% |
| Total | 685 | 100.0% |
Employment Status by Age in Peebles
According to the labor force statistics for Peebles, out of the total population over 16 years of age (1,567), 53.5% or 838 individuals are in the labor force, with 17.2% or 144 of them unemployed. The age group with the highest labor force participation rate is 25 to 29 years, with 81.7% or 147 individuals in the labor force. Within the labor force, the 25 to 29 years age range has the highest percentage of unemployed individuals, with 50.3% or 74 of them being unemployed.
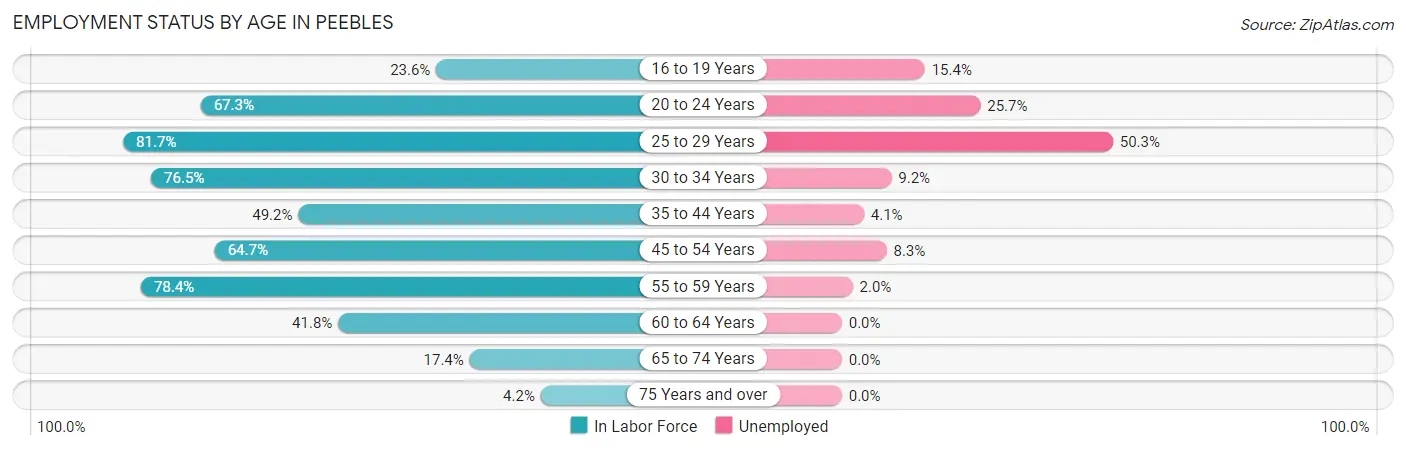
| Age Bracket | In Labor Force | Unemployed |
| 16 to 19 Years | 39 (23.6%) | 6 (15.4%) |
| 20 to 24 Years | 144 (67.3%) | 37 (25.7%) |
| 25 to 29 Years | 147 (81.7%) | 74 (50.3%) |
| 30 to 34 Years | 130 (76.5%) | 12 (9.2%) |
| 35 to 44 Years | 97 (49.2%) | 4 (4.1%) |
| 45 to 54 Years | 108 (64.7%) | 9 (8.3%) |
| 55 to 59 Years | 98 (78.4%) | 2 (2.0%) |
| 60 to 64 Years | 46 (41.8%) | 0 (0.0%) |
| 65 to 74 Years | 25 (17.4%) | 0 (0.0%) |
| 75 Years and over | 4 (4.2%) | 0 (0.0%) |
| Total | 838 (53.5%) | 144 (17.2%) |
Employment Status by Educational Attainment in Peebles
According to labor force statistics for Peebles, 66.0% of individuals (626) out of the total population between 25 and 64 years of age (949) are in the labor force, with 16.1% or 101 of them being unemployed. The group with the highest labor force participation rate are those with the educational attainment of bachelor's degree or higher, with 89.5% or 94 individuals in the labor force. Within the labor force, individuals with high school diploma education have the highest percentage of unemployment, with 22.6% or 74 of them being unemployed.
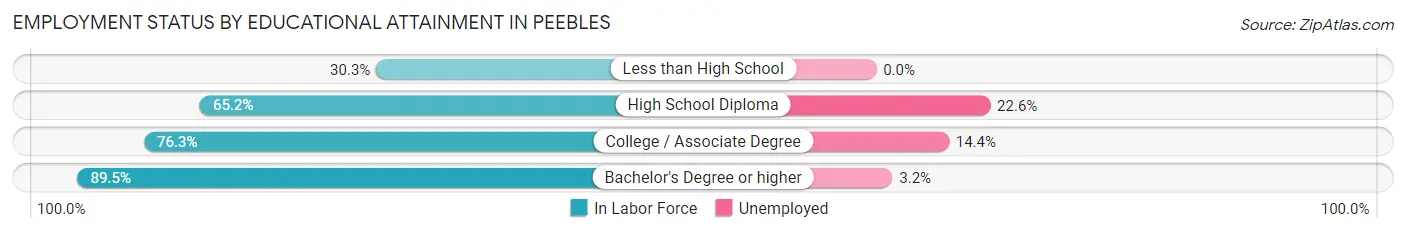
| Educational Attainment | In Labor Force | Unemployed |
| Less than High School | 37 (30.3%) | 0 (0.0%) |
| High School Diploma | 328 (65.2%) | 114 (22.6%) |
| College / Associate Degree | 167 (76.3%) | 32 (14.4%) |
| Bachelor's Degree or higher | 94 (89.5%) | 3 (3.2%) |
| Total | 626 (66.0%) | 153 (16.1%) |
Employment Occupations by Sex in Peebles
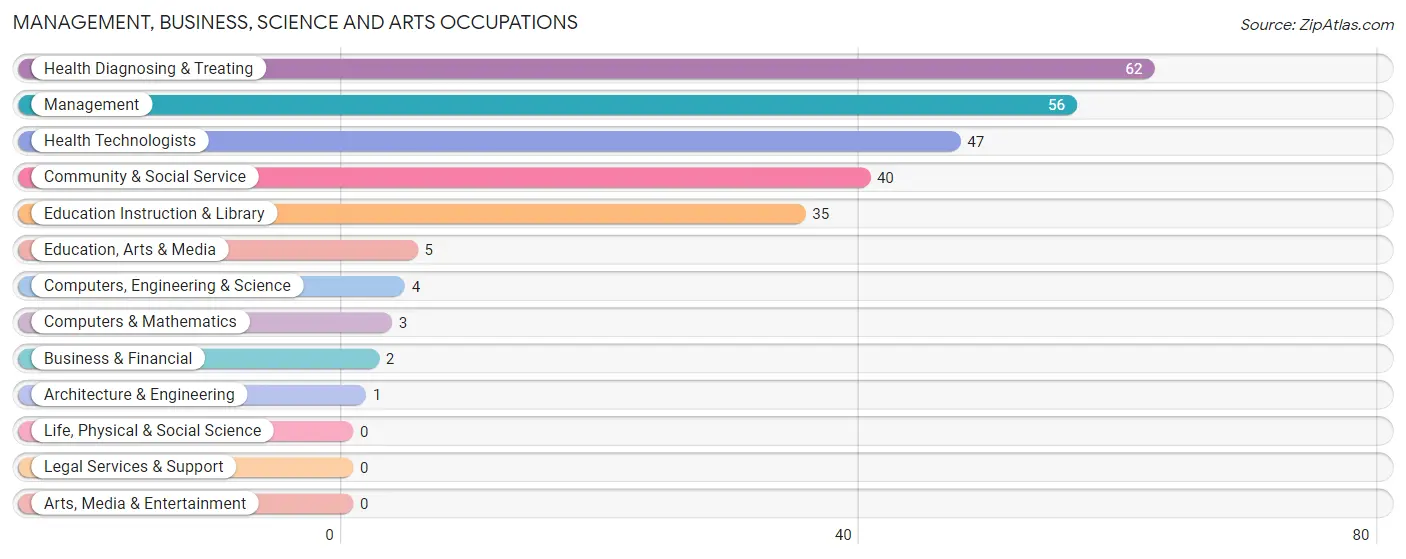
Management, Business, Science and Arts Occupations
The most common Management, Business, Science and Arts occupations in Peebles are Health Diagnosing & Treating (62 | 8.9%), Management (56 | 8.1%), Health Technologists (47 | 6.8%), Community & Social Service (40 | 5.8%), and Education Instruction & Library (35 | 5.0%).
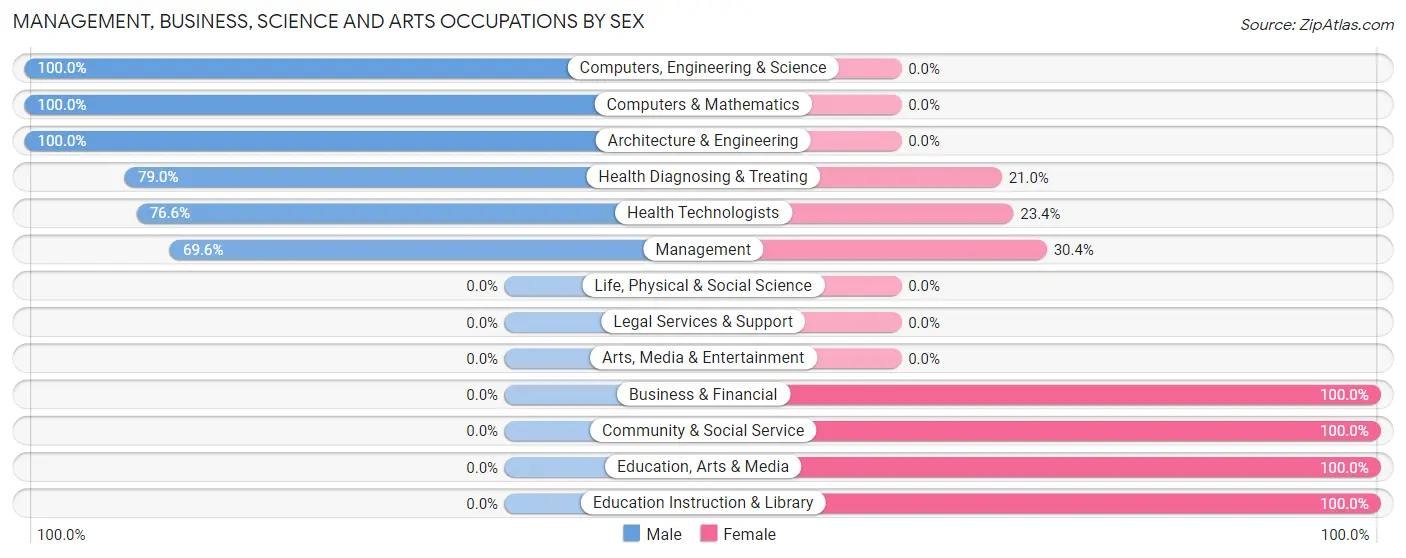
Management, Business, Science and Arts Occupations by Sex
Within the Management, Business, Science and Arts occupations in Peebles, the most male-oriented occupations are Computers, Engineering & Science (100.0%), Computers & Mathematics (100.0%), and Architecture & Engineering (100.0%), while the most female-oriented occupations are Business & Financial (100.0%), Community & Social Service (100.0%), and Education, Arts & Media (100.0%).
| Occupation | Male | Female |
| Management | 39 (69.6%) | 17 (30.4%) |
| Business & Financial | 0 (0.0%) | 2 (100.0%) |
| Computers, Engineering & Science | 4 (100.0%) | 0 (0.0%) |
| Computers & Mathematics | 3 (100.0%) | 0 (0.0%) |
| Architecture & Engineering | 1 (100.0%) | 0 (0.0%) |
| Life, Physical & Social Science | 0 (0.0%) | 0 (0.0%) |
| Community & Social Service | 0 (0.0%) | 40 (100.0%) |
| Education, Arts & Media | 0 (0.0%) | 5 (100.0%) |
| Legal Services & Support | 0 (0.0%) | 0 (0.0%) |
| Education Instruction & Library | 0 (0.0%) | 35 (100.0%) |
| Arts, Media & Entertainment | 0 (0.0%) | 0 (0.0%) |
| Health Diagnosing & Treating | 49 (79.0%) | 13 (21.0%) |
| Health Technologists | 36 (76.6%) | 11 (23.4%) |
| Total (Category) | 92 (56.1%) | 72 (43.9%) |
| Total (Overall) | 379 (54.6%) | 315 (45.4%) |
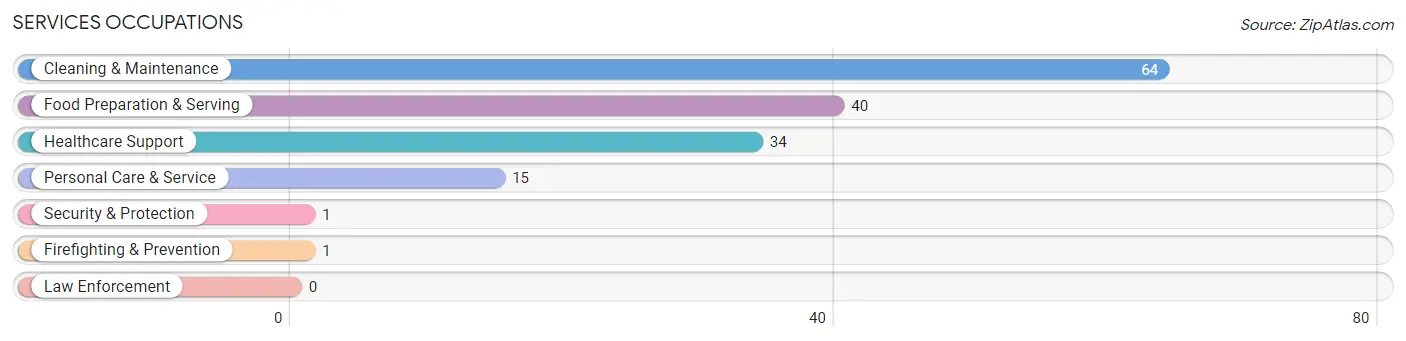
Services Occupations
The most common Services occupations in Peebles are Cleaning & Maintenance (64 | 9.2%), Food Preparation & Serving (40 | 5.8%), Healthcare Support (34 | 4.9%), Personal Care & Service (15 | 2.2%), and Security & Protection (1 | 0.1%).
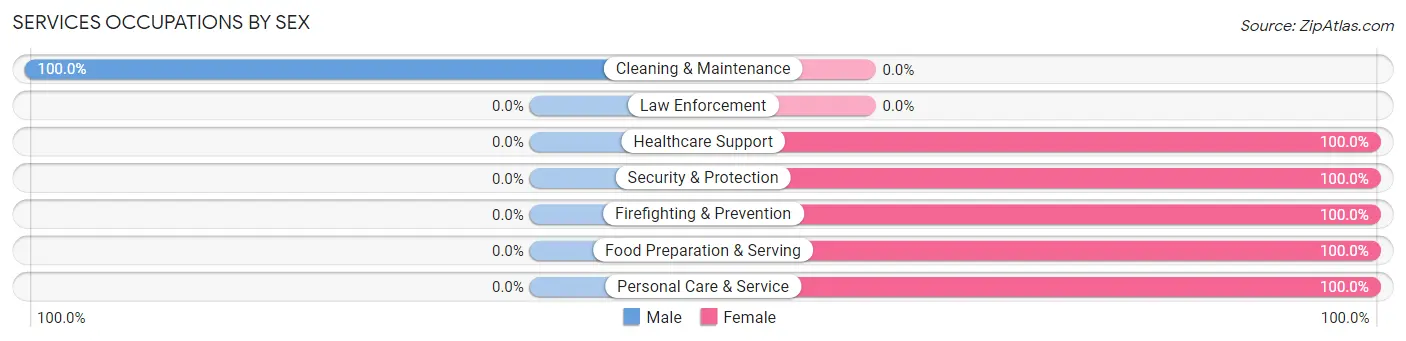
Services Occupations by Sex
| Occupation | Male | Female |
| Healthcare Support | 0 (0.0%) | 34 (100.0%) |
| Security & Protection | 0 (0.0%) | 1 (100.0%) |
| Firefighting & Prevention | 0 (0.0%) | 1 (100.0%) |
| Law Enforcement | 0 (0.0%) | 0 (0.0%) |
| Food Preparation & Serving | 0 (0.0%) | 40 (100.0%) |
| Cleaning & Maintenance | 64 (100.0%) | 0 (0.0%) |
| Personal Care & Service | 0 (0.0%) | 15 (100.0%) |
| Total (Category) | 64 (41.6%) | 90 (58.4%) |
| Total (Overall) | 379 (54.6%) | 315 (45.4%) |
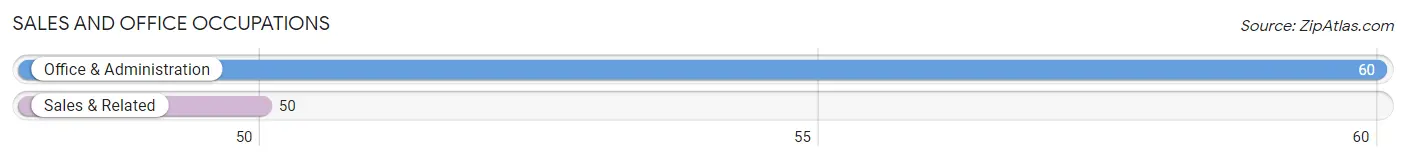
Sales and Office Occupations
The most common Sales and Office occupations in Peebles are Office & Administration (60 | 8.6%), and Sales & Related (50 | 7.2%).
Sales and Office Occupations by Sex
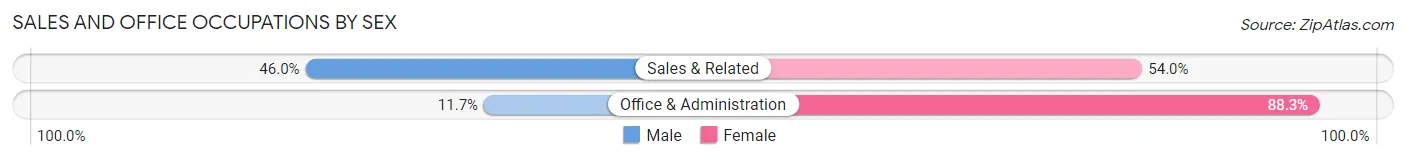
| Occupation | Male | Female |
| Sales & Related | 23 (46.0%) | 27 (54.0%) |
| Office & Administration | 7 (11.7%) | 53 (88.3%) |
| Total (Category) | 30 (27.3%) | 80 (72.7%) |
| Total (Overall) | 379 (54.6%) | 315 (45.4%) |
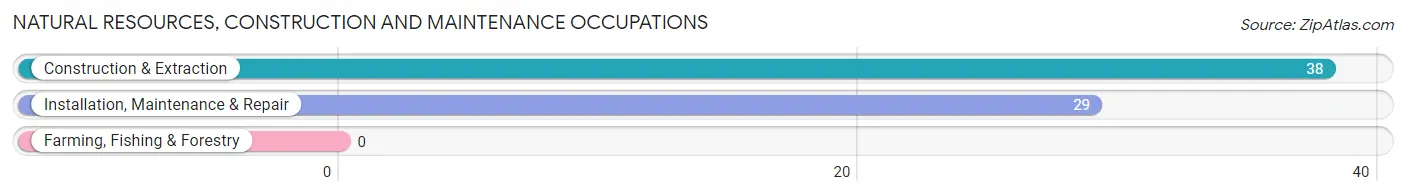
Natural Resources, Construction and Maintenance Occupations
The most common Natural Resources, Construction and Maintenance occupations in Peebles are Construction & Extraction (38 | 5.5%), and Installation, Maintenance & Repair (29 | 4.2%).
Natural Resources, Construction and Maintenance Occupations by Sex
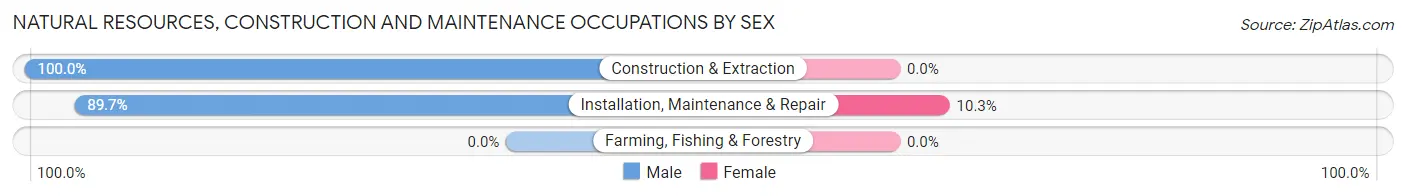
| Occupation | Male | Female |
| Farming, Fishing & Forestry | 0 (0.0%) | 0 (0.0%) |
| Construction & Extraction | 38 (100.0%) | 0 (0.0%) |
| Installation, Maintenance & Repair | 26 (89.7%) | 3 (10.3%) |
| Total (Category) | 64 (95.5%) | 3 (4.5%) |
| Total (Overall) | 379 (54.6%) | 315 (45.4%) |
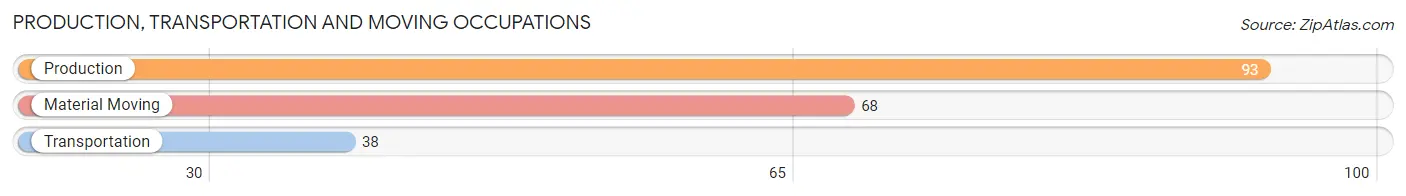
Production, Transportation and Moving Occupations
The most common Production, Transportation and Moving occupations in Peebles are Production (93 | 13.4%), Material Moving (68 | 9.8%), and Transportation (38 | 5.5%).
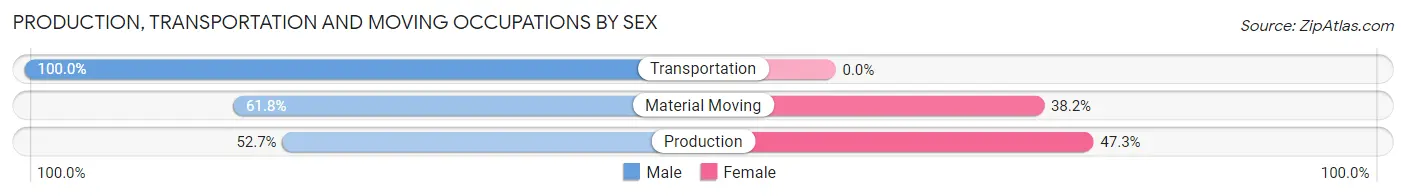
Production, Transportation and Moving Occupations by Sex
| Occupation | Male | Female |
| Production | 49 (52.7%) | 44 (47.3%) |
| Transportation | 38 (100.0%) | 0 (0.0%) |
| Material Moving | 42 (61.8%) | 26 (38.2%) |
| Total (Category) | 129 (64.8%) | 70 (35.2%) |
| Total (Overall) | 379 (54.6%) | 315 (45.4%) |
Employment Industries by Sex in Peebles
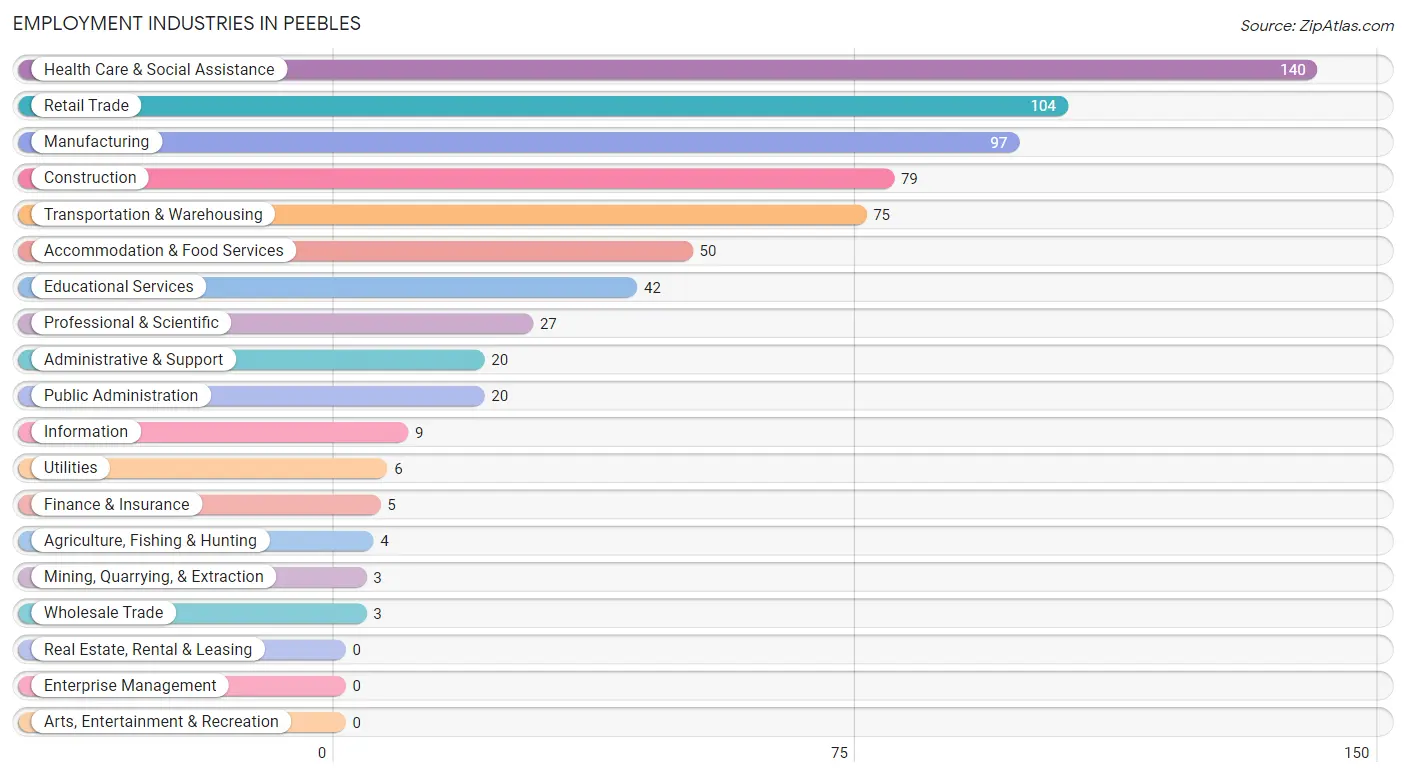
Employment Industries in Peebles
The major employment industries in Peebles include Health Care & Social Assistance (140 | 20.2%), Retail Trade (104 | 15.0%), Manufacturing (97 | 14.0%), Construction (79 | 11.4%), and Transportation & Warehousing (75 | 10.8%).
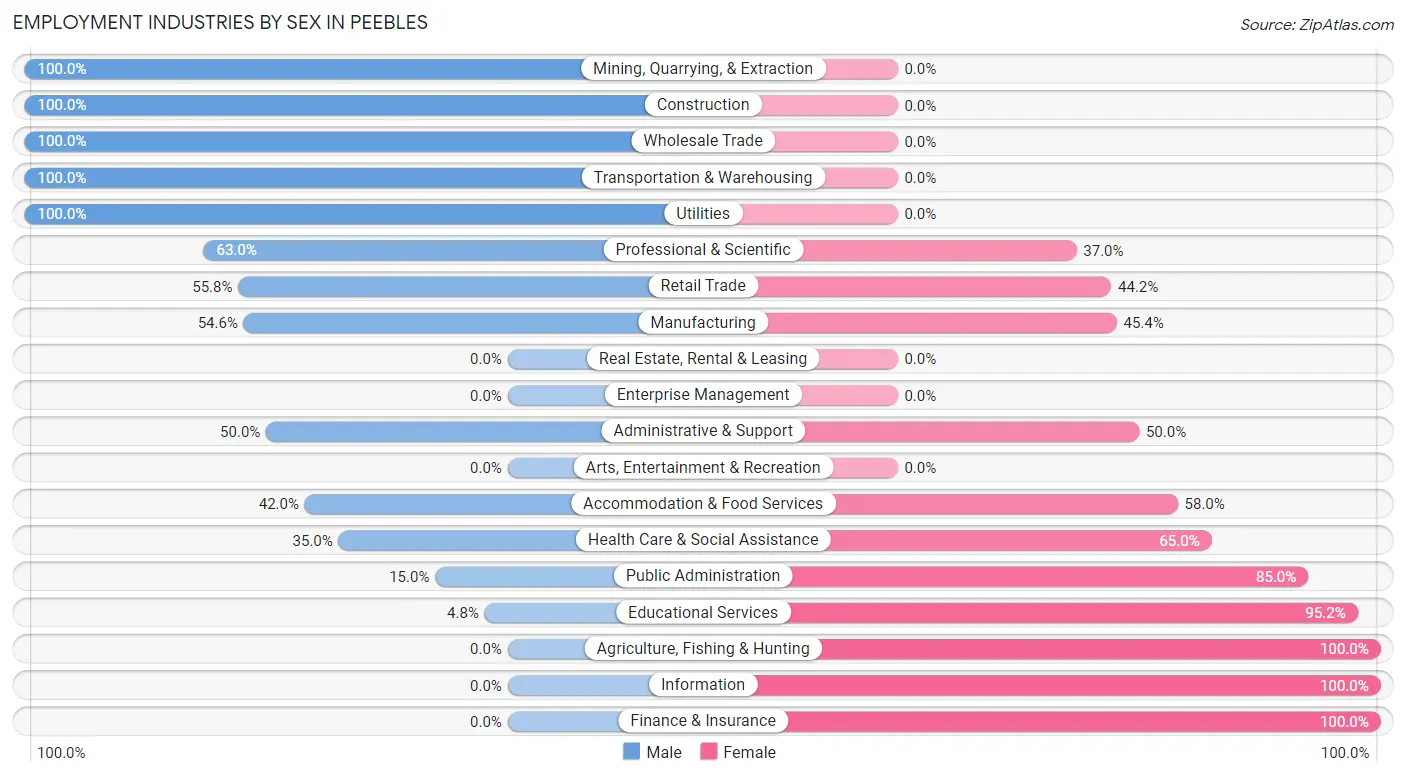
Employment Industries by Sex in Peebles
The Peebles industries that see more men than women are Mining, Quarrying, & Extraction (100.0%), Construction (100.0%), and Wholesale Trade (100.0%), whereas the industries that tend to have a higher number of women are Agriculture, Fishing & Hunting (100.0%), Information (100.0%), and Finance & Insurance (100.0%).
| Industry | Male | Female |
| Agriculture, Fishing & Hunting | 0 (0.0%) | 4 (100.0%) |
| Mining, Quarrying, & Extraction | 3 (100.0%) | 0 (0.0%) |
| Construction | 79 (100.0%) | 0 (0.0%) |
| Manufacturing | 53 (54.6%) | 44 (45.4%) |
| Wholesale Trade | 3 (100.0%) | 0 (0.0%) |
| Retail Trade | 58 (55.8%) | 46 (44.2%) |
| Transportation & Warehousing | 75 (100.0%) | 0 (0.0%) |
| Utilities | 6 (100.0%) | 0 (0.0%) |
| Information | 0 (0.0%) | 9 (100.0%) |
| Finance & Insurance | 0 (0.0%) | 5 (100.0%) |
| Real Estate, Rental & Leasing | 0 (0.0%) | 0 (0.0%) |
| Professional & Scientific | 17 (63.0%) | 10 (37.0%) |
| Enterprise Management | 0 (0.0%) | 0 (0.0%) |
| Administrative & Support | 10 (50.0%) | 10 (50.0%) |
| Educational Services | 2 (4.8%) | 40 (95.2%) |
| Health Care & Social Assistance | 49 (35.0%) | 91 (65.0%) |
| Arts, Entertainment & Recreation | 0 (0.0%) | 0 (0.0%) |
| Accommodation & Food Services | 21 (42.0%) | 29 (58.0%) |
| Public Administration | 3 (15.0%) | 17 (85.0%) |
| Total | 379 (54.6%) | 315 (45.4%) |
Education in Peebles
School Enrollment in Peebles
The most common levels of schooling among the 583 students in Peebles are high school (182 | 31.2%), elementary school (115 | 19.7%), and middle school (103 | 17.7%).
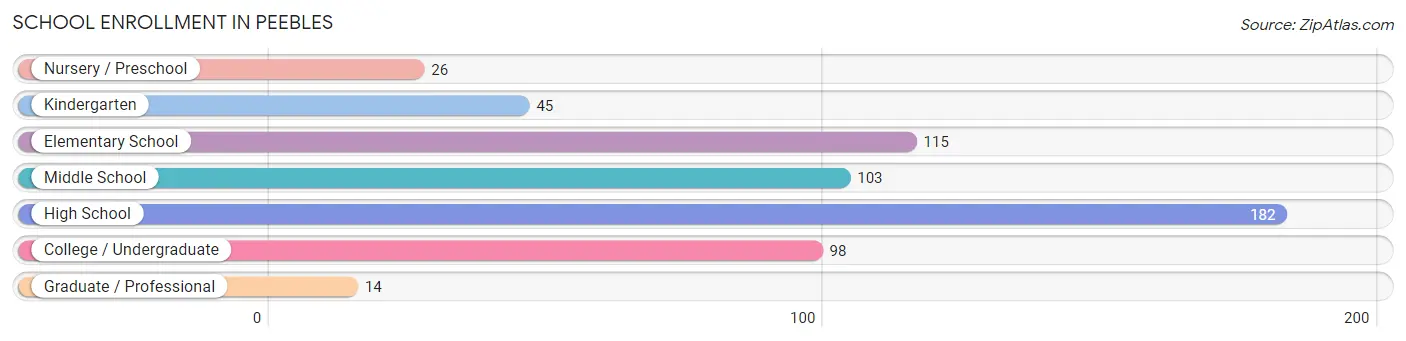
| School Level | # Students | % Students |
| Nursery / Preschool | 26 | 4.5% |
| Kindergarten | 45 | 7.7% |
| Elementary School | 115 | 19.7% |
| Middle School | 103 | 17.7% |
| High School | 182 | 31.2% |
| College / Undergraduate | 98 | 16.8% |
| Graduate / Professional | 14 | 2.4% |
| Total | 583 | 100.0% |
School Enrollment by Age by Funding Source in Peebles
Out of a total of 583 students who are enrolled in schools in Peebles, 65 (11.1%) attend a private institution, while the remaining 518 (88.9%) are enrolled in public schools. The age group of 18 to 19 year olds has the highest likelihood of being enrolled in private schools, with 12 (25.0% in the age bracket) enrolled. Conversely, the age group of 20 to 24 year olds has the lowest likelihood of being enrolled in a private school, with 69 (100.0% in the age bracket) attending a public institution.
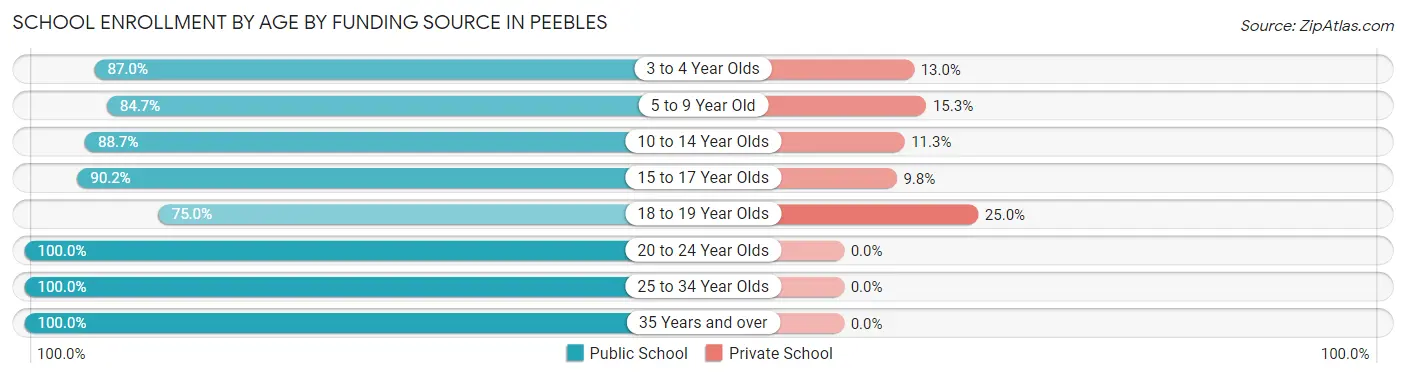
| Age Bracket | Public School | Private School |
| 3 to 4 Year Olds | 20 (87.0%) | 3 (13.0%) |
| 5 to 9 Year Old | 127 (84.7%) | 23 (15.3%) |
| 10 to 14 Year Olds | 118 (88.7%) | 15 (11.3%) |
| 15 to 17 Year Olds | 110 (90.2%) | 12 (9.8%) |
| 18 to 19 Year Olds | 36 (75.0%) | 12 (25.0%) |
| 20 to 24 Year Olds | 69 (100.0%) | 0 (0.0%) |
| 25 to 34 Year Olds | 7 (100.0%) | 0 (0.0%) |
| 35 Years and over | 31 (100.0%) | 0 (0.0%) |
| Total | 518 (88.9%) | 65 (11.1%) |
Educational Attainment by Field of Study in Peebles
Education (48 | 38.4%), science & technology (24 | 19.2%), bio, nature & agricultural (22 | 17.6%), liberal arts & history (14 | 11.2%), and business (10 | 8.0%) are the most common fields of study among 125 individuals in Peebles who have obtained a bachelor's degree or higher.
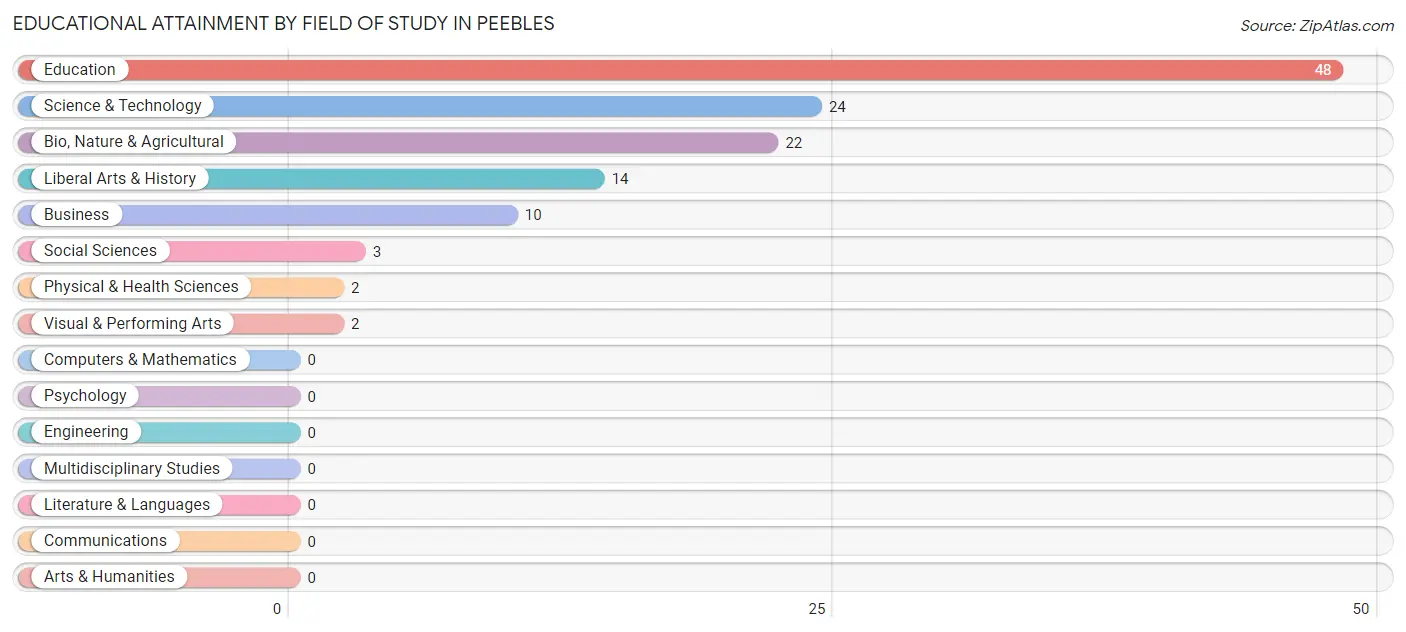
| Field of Study | # Graduates | % Graduates |
| Computers & Mathematics | 0 | 0.0% |
| Bio, Nature & Agricultural | 22 | 17.6% |
| Physical & Health Sciences | 2 | 1.6% |
| Psychology | 0 | 0.0% |
| Social Sciences | 3 | 2.4% |
| Engineering | 0 | 0.0% |
| Multidisciplinary Studies | 0 | 0.0% |
| Science & Technology | 24 | 19.2% |
| Business | 10 | 8.0% |
| Education | 48 | 38.4% |
| Literature & Languages | 0 | 0.0% |
| Liberal Arts & History | 14 | 11.2% |
| Visual & Performing Arts | 2 | 1.6% |
| Communications | 0 | 0.0% |
| Arts & Humanities | 0 | 0.0% |
| Total | 125 | 100.0% |
Transportation & Commute in Peebles
Vehicle Availability by Sex in Peebles
The most prevalent vehicle ownership categories in Peebles are males with 2 vehicles (131, accounting for 35.1%) and females with 2 vehicles (108, making up 42.0%).
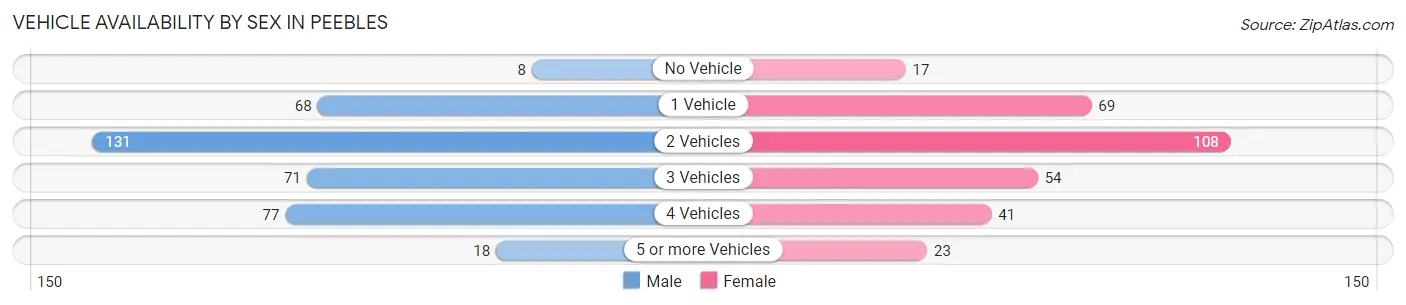
| Vehicles Available | Male | Female |
| No Vehicle | 8 (2.1%) | 17 (5.4%) |
| 1 Vehicle | 68 (18.2%) | 69 (22.1%) |
| 2 Vehicles | 131 (35.1%) | 108 (34.6%) |
| 3 Vehicles | 71 (19.0%) | 54 (17.3%) |
| 4 Vehicles | 77 (20.6%) | 41 (13.1%) |
| 5 or more Vehicles | 18 (4.8%) | 23 (7.4%) |
| Total | 373 (100.0%) | 312 (100.0%) |
Commute Time in Peebles
The most frequently occuring commute durations in Peebles are 45 to 59 minutes (122 commuters, 18.6%), 20 to 24 minutes (94 commuters, 14.3%), and 25 to 29 minutes (72 commuters, 11.0%).
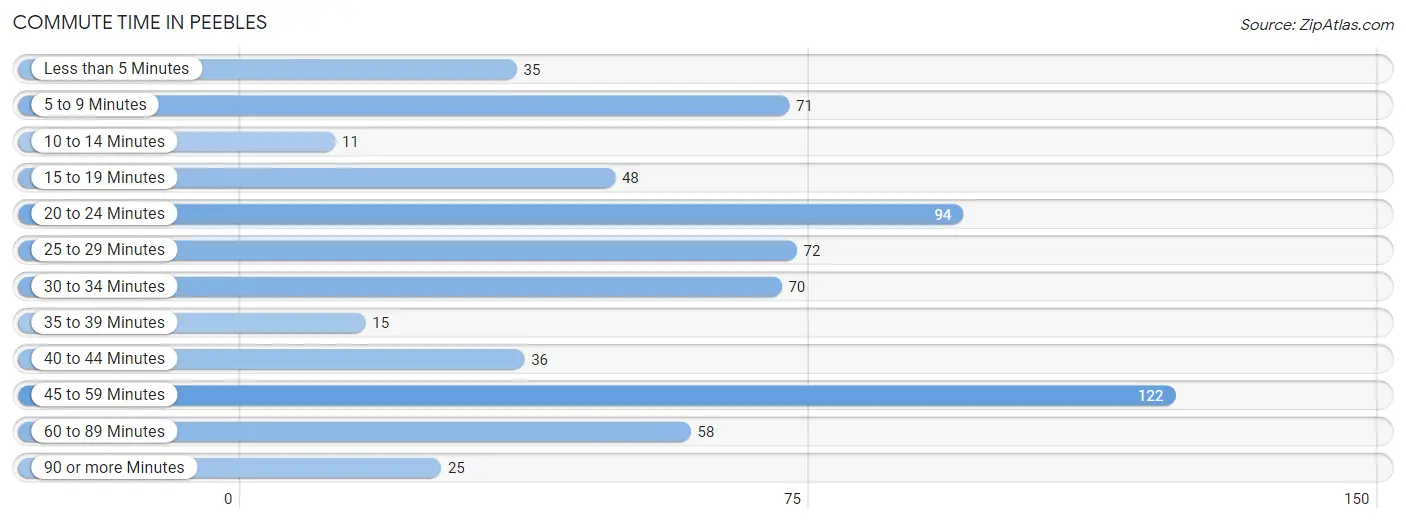
| Commute Time | # Commuters | % Commuters |
| Less than 5 Minutes | 35 | 5.3% |
| 5 to 9 Minutes | 71 | 10.8% |
| 10 to 14 Minutes | 11 | 1.7% |
| 15 to 19 Minutes | 48 | 7.3% |
| 20 to 24 Minutes | 94 | 14.3% |
| 25 to 29 Minutes | 72 | 11.0% |
| 30 to 34 Minutes | 70 | 10.6% |
| 35 to 39 Minutes | 15 | 2.3% |
| 40 to 44 Minutes | 36 | 5.5% |
| 45 to 59 Minutes | 122 | 18.6% |
| 60 to 89 Minutes | 58 | 8.8% |
| 90 or more Minutes | 25 | 3.8% |
Commute Time by Sex in Peebles
The most common commute times in Peebles are 45 to 59 minutes (68 commuters, 18.4%) for males and 45 to 59 minutes (54 commuters, 18.8%) for females.
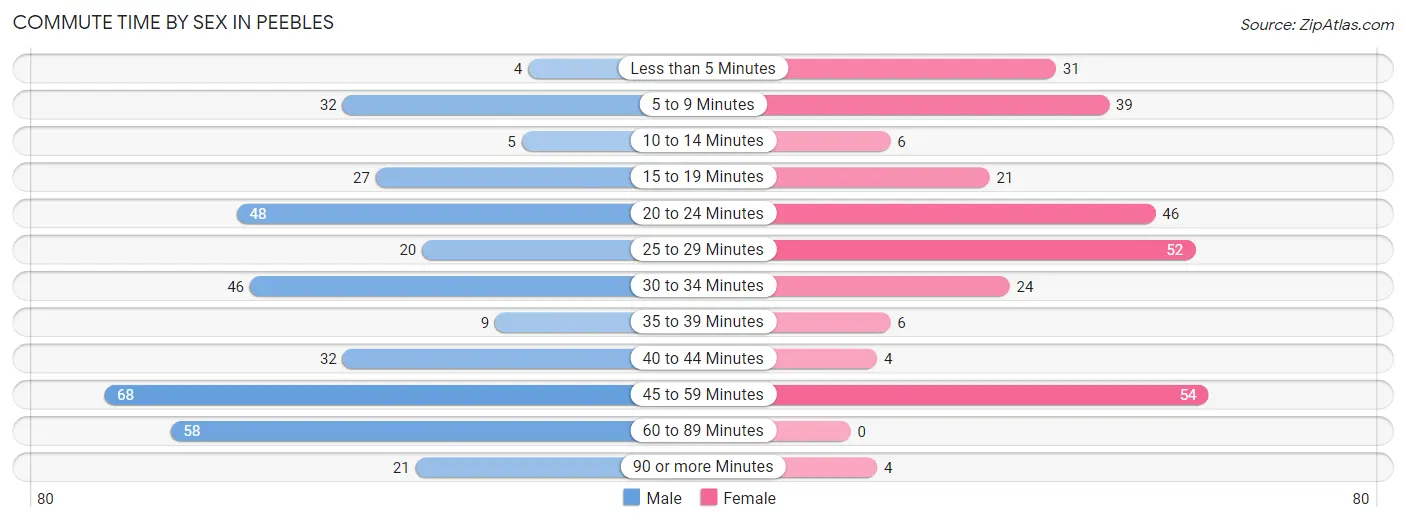
| Commute Time | Male | Female |
| Less than 5 Minutes | 4 (1.1%) | 31 (10.8%) |
| 5 to 9 Minutes | 32 (8.6%) | 39 (13.6%) |
| 10 to 14 Minutes | 5 (1.3%) | 6 (2.1%) |
| 15 to 19 Minutes | 27 (7.3%) | 21 (7.3%) |
| 20 to 24 Minutes | 48 (13.0%) | 46 (16.0%) |
| 25 to 29 Minutes | 20 (5.4%) | 52 (18.1%) |
| 30 to 34 Minutes | 46 (12.4%) | 24 (8.4%) |
| 35 to 39 Minutes | 9 (2.4%) | 6 (2.1%) |
| 40 to 44 Minutes | 32 (8.6%) | 4 (1.4%) |
| 45 to 59 Minutes | 68 (18.4%) | 54 (18.8%) |
| 60 to 89 Minutes | 58 (15.7%) | 0 (0.0%) |
| 90 or more Minutes | 21 (5.7%) | 4 (1.4%) |
Time of Departure to Work by Sex in Peebles
The most frequent times of departure to work in Peebles are 12:00 AM to 4:59 AM (100, 27.0%) for males and 6:30 AM to 6:59 AM (42, 14.6%) for females.
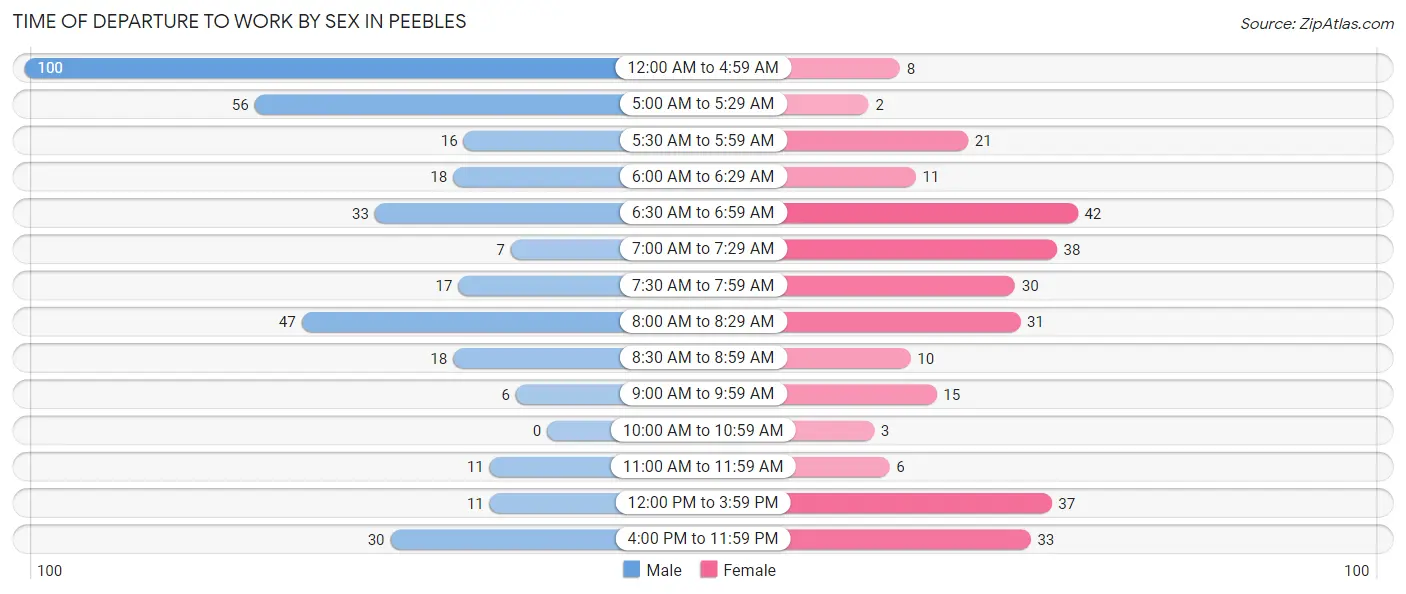
| Time of Departure | Male | Female |
| 12:00 AM to 4:59 AM | 100 (27.0%) | 8 (2.8%) |
| 5:00 AM to 5:29 AM | 56 (15.1%) | 2 (0.7%) |
| 5:30 AM to 5:59 AM | 16 (4.3%) | 21 (7.3%) |
| 6:00 AM to 6:29 AM | 18 (4.9%) | 11 (3.8%) |
| 6:30 AM to 6:59 AM | 33 (8.9%) | 42 (14.6%) |
| 7:00 AM to 7:29 AM | 7 (1.9%) | 38 (13.2%) |
| 7:30 AM to 7:59 AM | 17 (4.6%) | 30 (10.4%) |
| 8:00 AM to 8:29 AM | 47 (12.7%) | 31 (10.8%) |
| 8:30 AM to 8:59 AM | 18 (4.9%) | 10 (3.5%) |
| 9:00 AM to 9:59 AM | 6 (1.6%) | 15 (5.2%) |
| 10:00 AM to 10:59 AM | 0 (0.0%) | 3 (1.1%) |
| 11:00 AM to 11:59 AM | 11 (3.0%) | 6 (2.1%) |
| 12:00 PM to 3:59 PM | 11 (3.0%) | 37 (12.9%) |
| 4:00 PM to 11:59 PM | 30 (8.1%) | 33 (11.5%) |
| Total | 370 (100.0%) | 287 (100.0%) |
Housing Occupancy in Peebles
Occupancy by Ownership in Peebles
Of the total 716 dwellings in Peebles, owner-occupied units account for 283 (39.5%), while renter-occupied units make up 433 (60.5%).
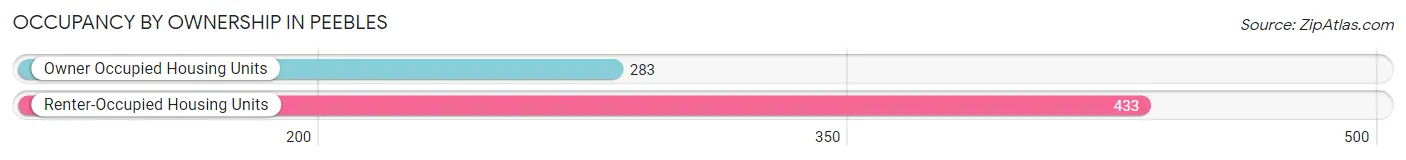
| Occupancy | # Housing Units | % Housing Units |
| Owner Occupied Housing Units | 283 | 39.5% |
| Renter-Occupied Housing Units | 433 | 60.5% |
| Total Occupied Housing Units | 716 | 100.0% |
Occupancy by Household Size in Peebles
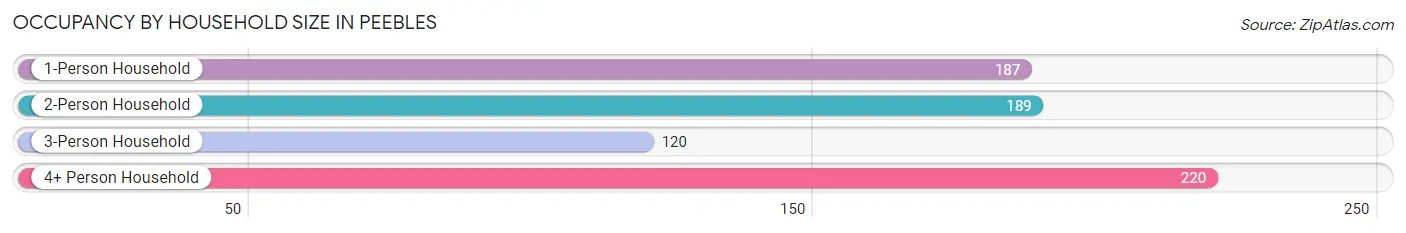
| Household Size | # Housing Units | % Housing Units |
| 1-Person Household | 187 | 26.1% |
| 2-Person Household | 189 | 26.4% |
| 3-Person Household | 120 | 16.8% |
| 4+ Person Household | 220 | 30.7% |
| Total Housing Units | 716 | 100.0% |
Occupancy by Ownership by Household Size in Peebles
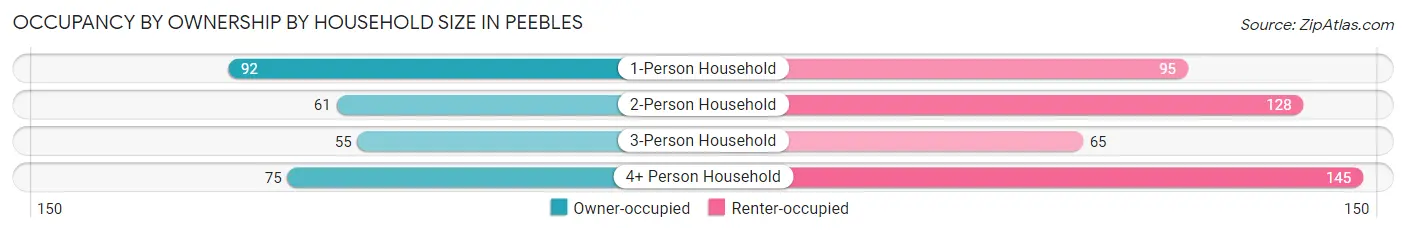
| Household Size | Owner-occupied | Renter-occupied |
| 1-Person Household | 92 (49.2%) | 95 (50.8%) |
| 2-Person Household | 61 (32.3%) | 128 (67.7%) |
| 3-Person Household | 55 (45.8%) | 65 (54.2%) |
| 4+ Person Household | 75 (34.1%) | 145 (65.9%) |
| Total Housing Units | 283 (39.5%) | 433 (60.5%) |
Occupancy by Educational Attainment in Peebles
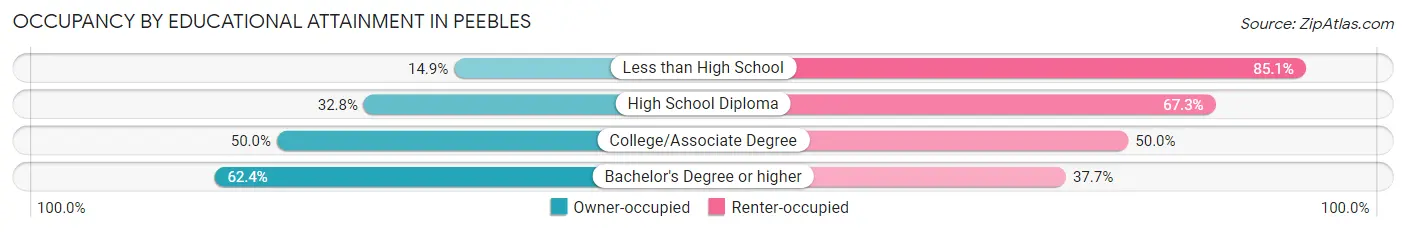
| Household Size | Owner-occupied | Renter-occupied |
| Less than High School | 11 (14.9%) | 63 (85.1%) |
| High School Diploma | 113 (32.8%) | 232 (67.2%) |
| College/Associate Degree | 106 (50.0%) | 106 (50.0%) |
| Bachelor's Degree or higher | 53 (62.4%) | 32 (37.7%) |
Occupancy by Age of Householder in Peebles
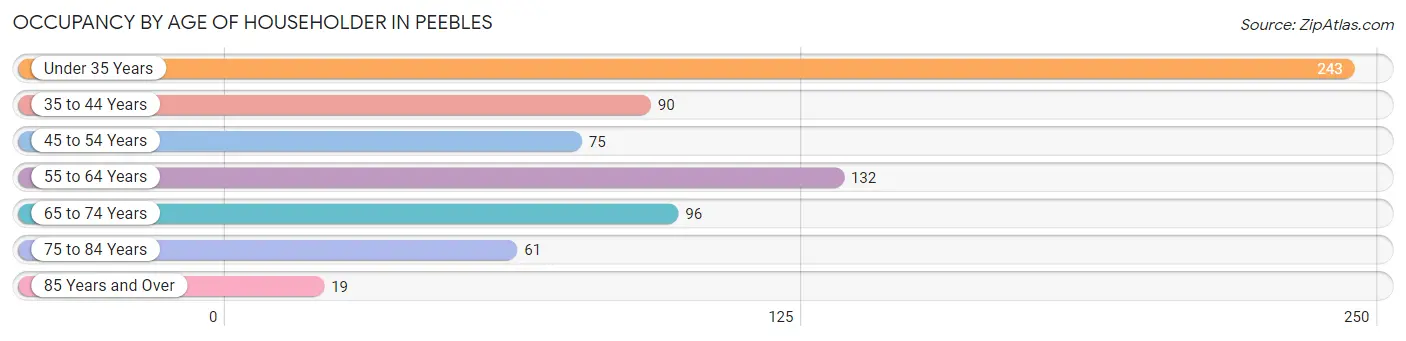
| Age Bracket | # Households | % Households |
| Under 35 Years | 243 | 33.9% |
| 35 to 44 Years | 90 | 12.6% |
| 45 to 54 Years | 75 | 10.5% |
| 55 to 64 Years | 132 | 18.4% |
| 65 to 74 Years | 96 | 13.4% |
| 75 to 84 Years | 61 | 8.5% |
| 85 Years and Over | 19 | 2.6% |
| Total | 716 | 100.0% |
Housing Finances in Peebles
Median Income by Occupancy in Peebles
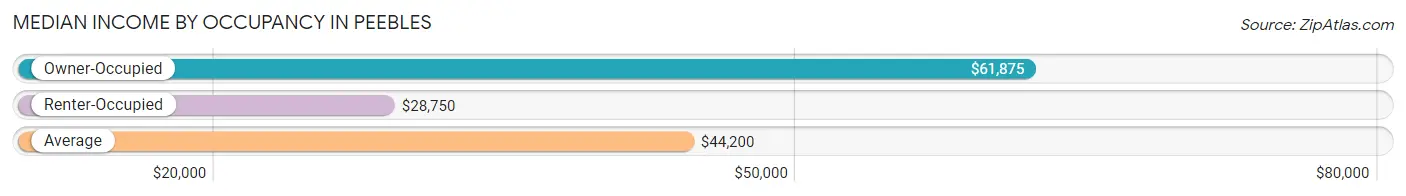
| Occupancy Type | # Households | Median Income |
| Owner-Occupied | 283 (39.5%) | $61,875 |
| Renter-Occupied | 433 (60.5%) | $28,750 |
| Average | 716 (100.0%) | $44,200 |
Occupancy by Householder Income Bracket in Peebles
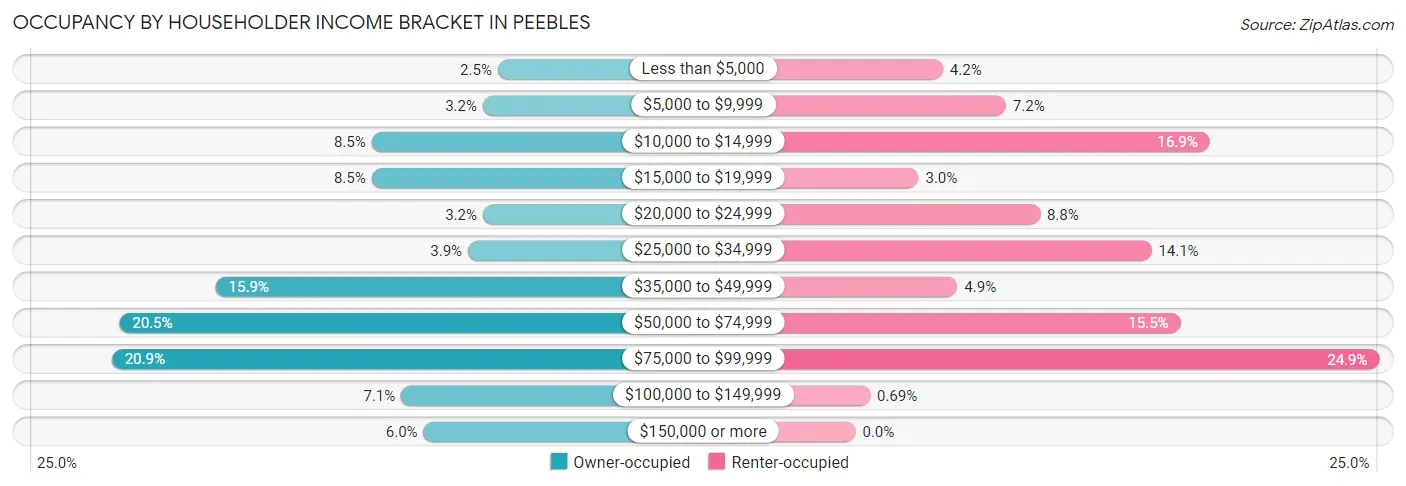
| Income Bracket | Owner-occupied | Renter-occupied |
| Less than $5,000 | 7 (2.5%) | 18 (4.2%) |
| $5,000 to $9,999 | 9 (3.2%) | 31 (7.2%) |
| $10,000 to $14,999 | 24 (8.5%) | 73 (16.9%) |
| $15,000 to $19,999 | 24 (8.5%) | 13 (3.0%) |
| $20,000 to $24,999 | 9 (3.2%) | 38 (8.8%) |
| $25,000 to $34,999 | 11 (3.9%) | 61 (14.1%) |
| $35,000 to $49,999 | 45 (15.9%) | 21 (4.9%) |
| $50,000 to $74,999 | 58 (20.5%) | 67 (15.5%) |
| $75,000 to $99,999 | 59 (20.8%) | 108 (24.9%) |
| $100,000 to $149,999 | 20 (7.1%) | 3 (0.7%) |
| $150,000 or more | 17 (6.0%) | 0 (0.0%) |
| Total | 283 (100.0%) | 433 (100.0%) |
Monthly Housing Cost Tiers in Peebles
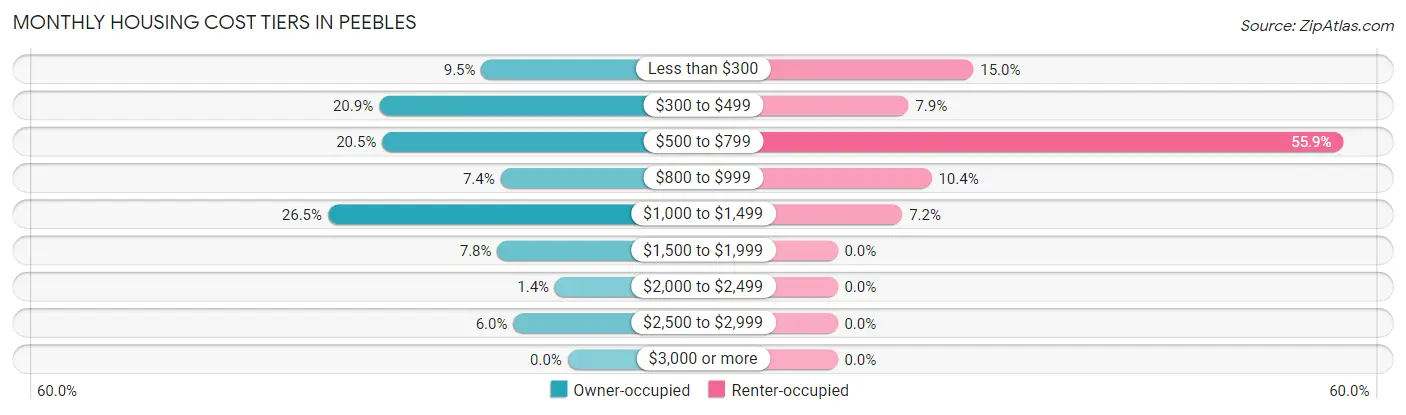
| Monthly Cost | Owner-occupied | Renter-occupied |
| Less than $300 | 27 (9.5%) | 65 (15.0%) |
| $300 to $499 | 59 (20.8%) | 34 (7.9%) |
| $500 to $799 | 58 (20.5%) | 242 (55.9%) |
| $800 to $999 | 21 (7.4%) | 45 (10.4%) |
| $1,000 to $1,499 | 75 (26.5%) | 31 (7.2%) |
| $1,500 to $1,999 | 22 (7.8%) | 0 (0.0%) |
| $2,000 to $2,499 | 4 (1.4%) | 0 (0.0%) |
| $2,500 to $2,999 | 17 (6.0%) | 0 (0.0%) |
| $3,000 or more | 0 (0.0%) | 0 (0.0%) |
| Total | 283 (100.0%) | 433 (100.0%) |
Physical Housing Characteristics in Peebles
Housing Structures in Peebles
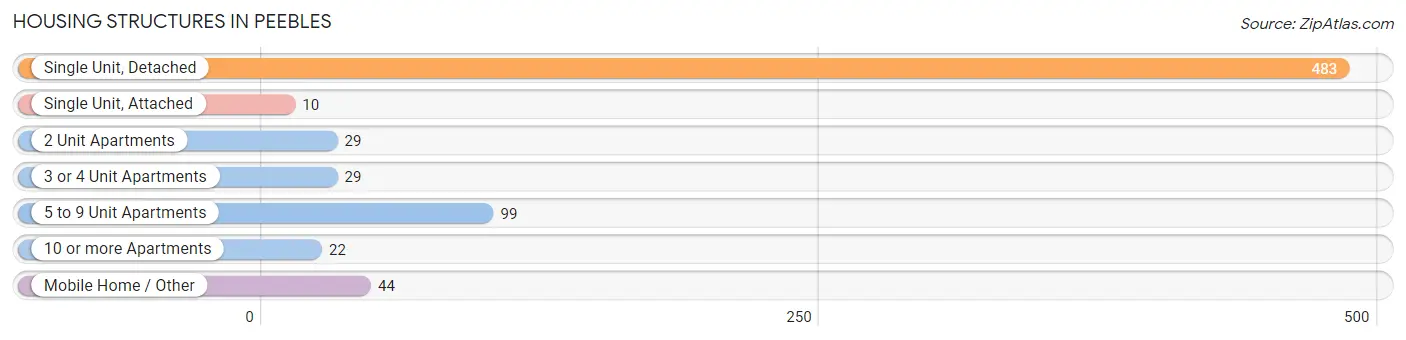
| Structure Type | # Housing Units | % Housing Units |
| Single Unit, Detached | 483 | 67.5% |
| Single Unit, Attached | 10 | 1.4% |
| 2 Unit Apartments | 29 | 4.1% |
| 3 or 4 Unit Apartments | 29 | 4.1% |
| 5 to 9 Unit Apartments | 99 | 13.8% |
| 10 or more Apartments | 22 | 3.1% |
| Mobile Home / Other | 44 | 6.1% |
| Total | 716 | 100.0% |
Housing Structures by Occupancy in Peebles
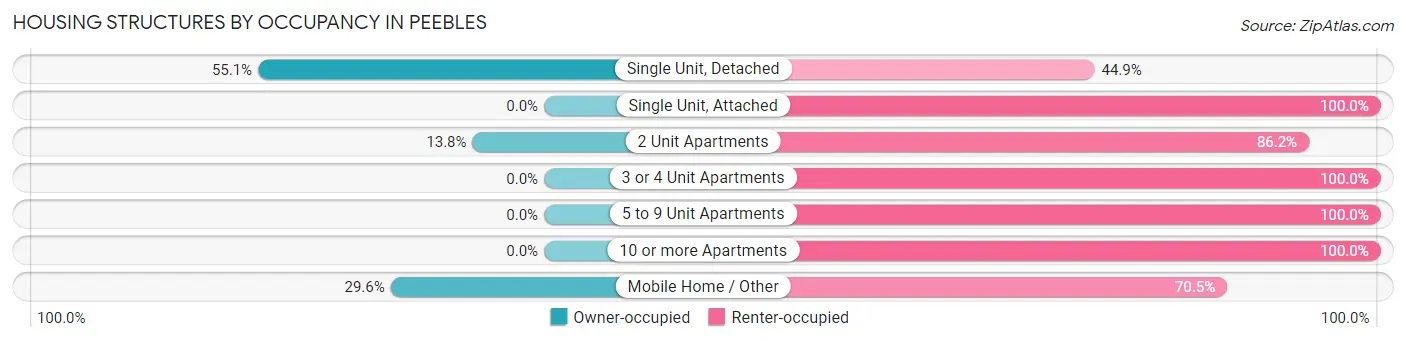
| Structure Type | Owner-occupied | Renter-occupied |
| Single Unit, Detached | 266 (55.1%) | 217 (44.9%) |
| Single Unit, Attached | 0 (0.0%) | 10 (100.0%) |
| 2 Unit Apartments | 4 (13.8%) | 25 (86.2%) |
| 3 or 4 Unit Apartments | 0 (0.0%) | 29 (100.0%) |
| 5 to 9 Unit Apartments | 0 (0.0%) | 99 (100.0%) |
| 10 or more Apartments | 0 (0.0%) | 22 (100.0%) |
| Mobile Home / Other | 13 (29.5%) | 31 (70.5%) |
| Total | 283 (39.5%) | 433 (60.5%) |
Housing Structures by Number of Rooms in Peebles
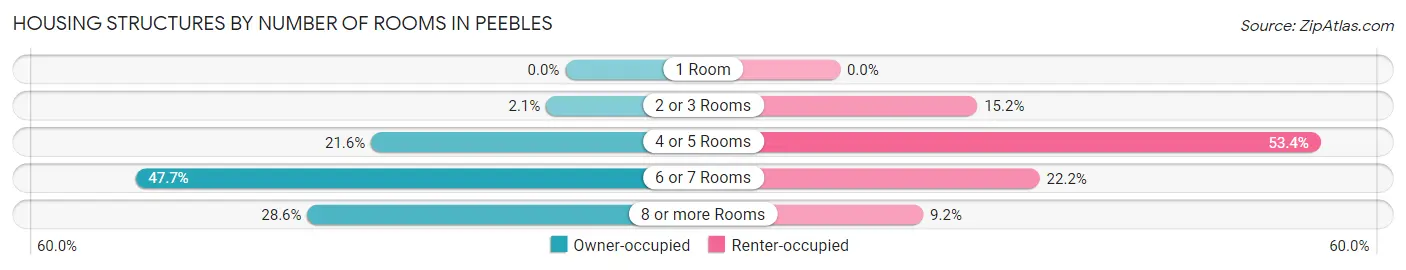
| Number of Rooms | Owner-occupied | Renter-occupied |
| 1 Room | 0 (0.0%) | 0 (0.0%) |
| 2 or 3 Rooms | 6 (2.1%) | 66 (15.2%) |
| 4 or 5 Rooms | 61 (21.5%) | 231 (53.3%) |
| 6 or 7 Rooms | 135 (47.7%) | 96 (22.2%) |
| 8 or more Rooms | 81 (28.6%) | 40 (9.2%) |
| Total | 283 (100.0%) | 433 (100.0%) |
Housing Structure by Heating Type in Peebles
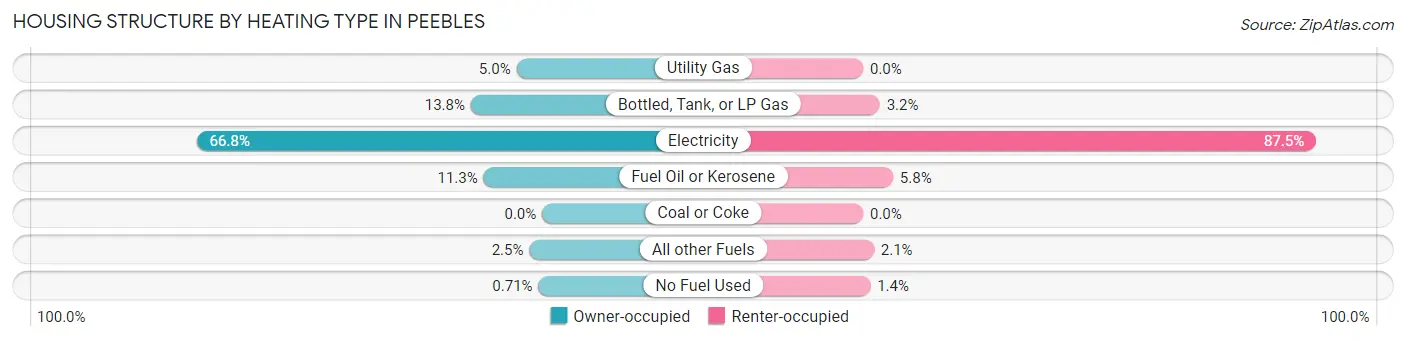
| Heating Type | Owner-occupied | Renter-occupied |
| Utility Gas | 14 (5.0%) | 0 (0.0%) |
| Bottled, Tank, or LP Gas | 39 (13.8%) | 14 (3.2%) |
| Electricity | 189 (66.8%) | 379 (87.5%) |
| Fuel Oil or Kerosene | 32 (11.3%) | 25 (5.8%) |
| Coal or Coke | 0 (0.0%) | 0 (0.0%) |
| All other Fuels | 7 (2.5%) | 9 (2.1%) |
| No Fuel Used | 2 (0.7%) | 6 (1.4%) |
| Total | 283 (100.0%) | 433 (100.0%) |
Household Vehicle Usage in Peebles
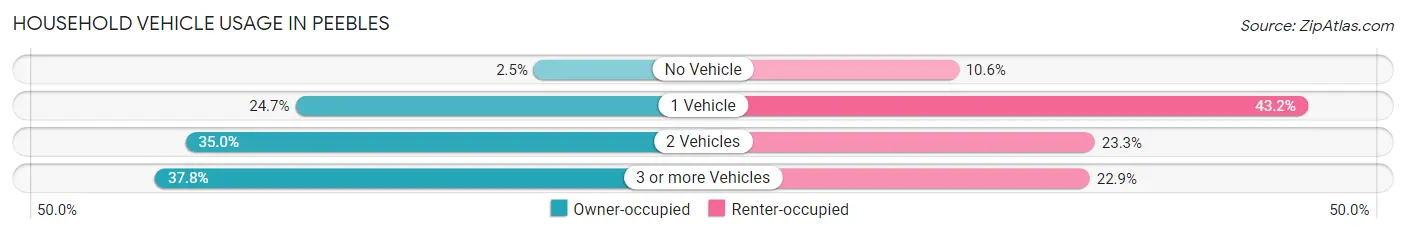
| Vehicles per Household | Owner-occupied | Renter-occupied |
| No Vehicle | 7 (2.5%) | 46 (10.6%) |
| 1 Vehicle | 70 (24.7%) | 187 (43.2%) |
| 2 Vehicles | 99 (35.0%) | 101 (23.3%) |
| 3 or more Vehicles | 107 (37.8%) | 99 (22.9%) |
| Total | 283 (100.0%) | 433 (100.0%) |
Real Estate & Mortgages in Peebles
Real Estate and Mortgage Overview in Peebles
| Characteristic | Without Mortgage | With Mortgage |
| Housing Units | 120 | 163 |
| Median Property Value | $82,100 | $138,600 |
| Median Household Income | $63,750 | $11 |
| Monthly Housing Costs | $435 | $0 |
| Real Estate Taxes | $914 | $0 |
Property Value by Mortgage Status in Peebles
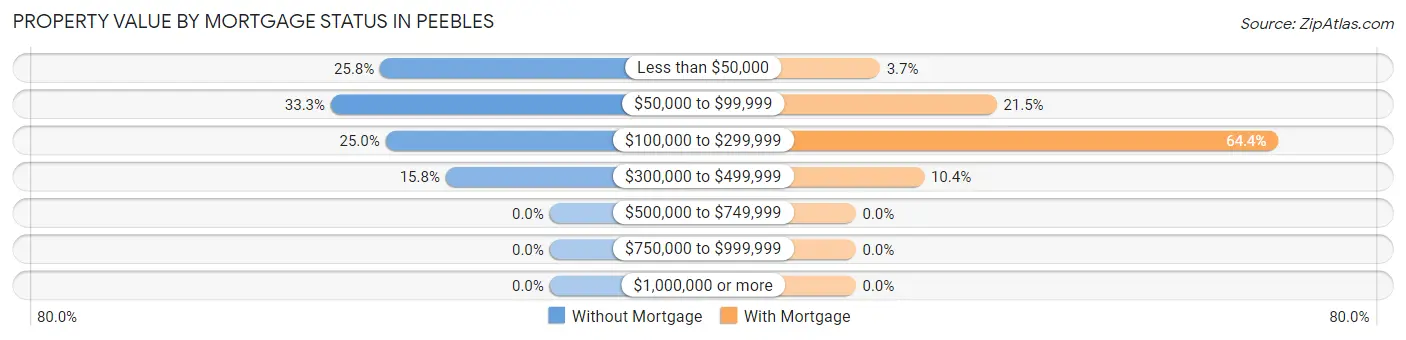
| Property Value | Without Mortgage | With Mortgage |
| Less than $50,000 | 31 (25.8%) | 6 (3.7%) |
| $50,000 to $99,999 | 40 (33.3%) | 35 (21.5%) |
| $100,000 to $299,999 | 30 (25.0%) | 105 (64.4%) |
| $300,000 to $499,999 | 19 (15.8%) | 17 (10.4%) |
| $500,000 to $749,999 | 0 (0.0%) | 0 (0.0%) |
| $750,000 to $999,999 | 0 (0.0%) | 0 (0.0%) |
| $1,000,000 or more | 0 (0.0%) | 0 (0.0%) |
| Total | 120 (100.0%) | 163 (100.0%) |
Household Income by Mortgage Status in Peebles
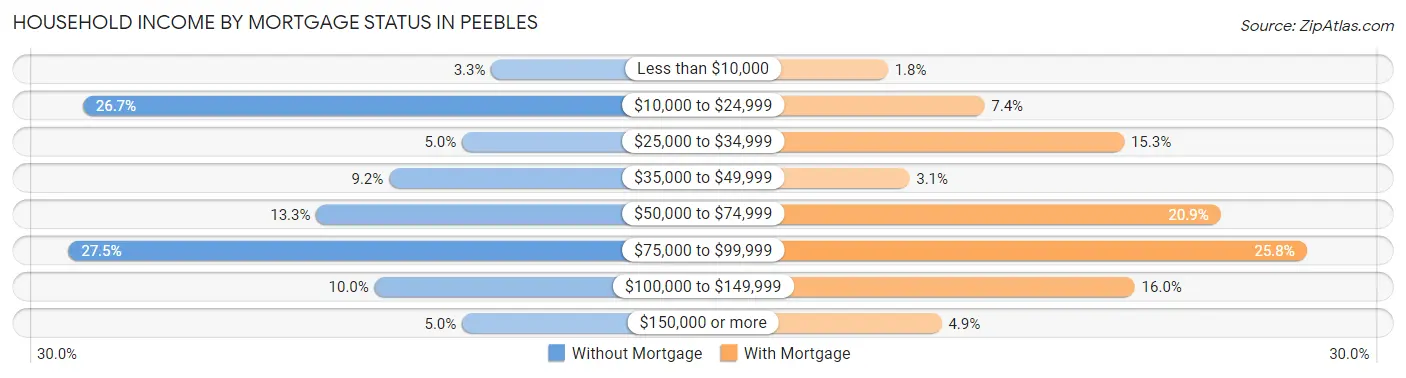
| Household Income | Without Mortgage | With Mortgage |
| Less than $10,000 | 4 (3.3%) | 3 (1.8%) |
| $10,000 to $24,999 | 32 (26.7%) | 12 (7.4%) |
| $25,000 to $34,999 | 6 (5.0%) | 25 (15.3%) |
| $35,000 to $49,999 | 11 (9.2%) | 5 (3.1%) |
| $50,000 to $74,999 | 16 (13.3%) | 34 (20.9%) |
| $75,000 to $99,999 | 33 (27.5%) | 42 (25.8%) |
| $100,000 to $149,999 | 12 (10.0%) | 26 (16.0%) |
| $150,000 or more | 6 (5.0%) | 8 (4.9%) |
| Total | 120 (100.0%) | 163 (100.0%) |
Property Value to Household Income Ratio in Peebles
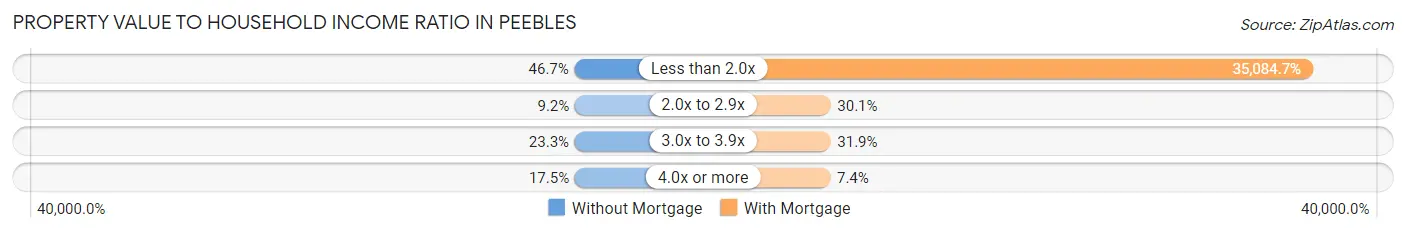
| Value-to-Income Ratio | Without Mortgage | With Mortgage |
| Less than 2.0x | 56 (46.7%) | 57,188 (35,084.7%) |
| 2.0x to 2.9x | 11 (9.2%) | 49 (30.1%) |
| 3.0x to 3.9x | 28 (23.3%) | 52 (31.9%) |
| 4.0x or more | 21 (17.5%) | 12 (7.4%) |
| Total | 120 (100.0%) | 163 (100.0%) |
Real Estate Taxes by Mortgage Status in Peebles
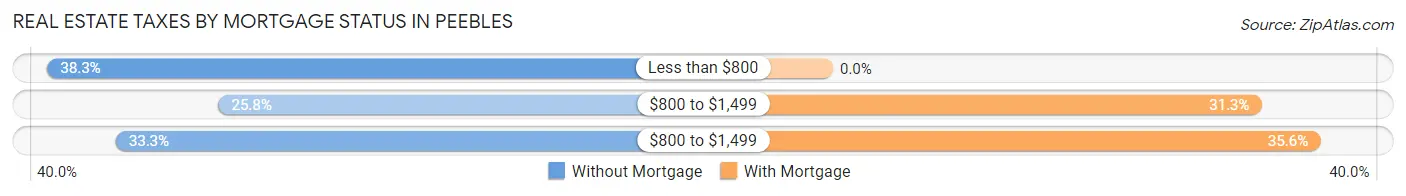
| Property Taxes | Without Mortgage | With Mortgage |
| Less than $800 | 46 (38.3%) | 0 (0.0%) |
| $800 to $1,499 | 31 (25.8%) | 51 (31.3%) |
| $800 to $1,499 | 40 (33.3%) | 58 (35.6%) |
| Total | 120 (100.0%) | 163 (100.0%) |
Health & Disability in Peebles
Health Insurance Coverage by Age in Peebles
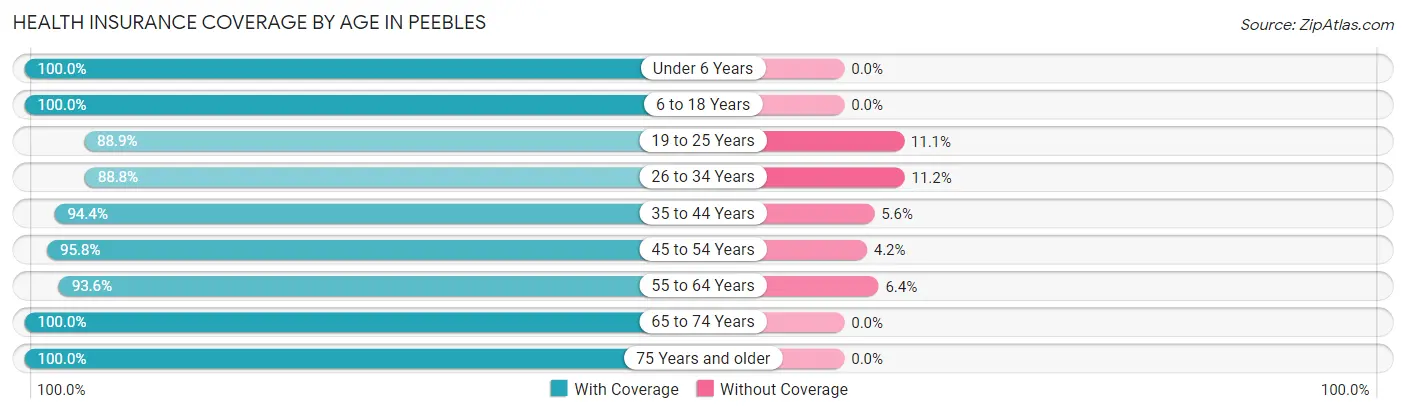
| Age Bracket | With Coverage | Without Coverage |
| Under 6 Years | 174 (100.0%) | 0 (0.0%) |
| 6 to 18 Years | 429 (100.0%) | 0 (0.0%) |
| 19 to 25 Years | 224 (88.9%) | 28 (11.1%) |
| 26 to 34 Years | 300 (88.8%) | 38 (11.2%) |
| 35 to 44 Years | 186 (94.4%) | 11 (5.6%) |
| 45 to 54 Years | 160 (95.8%) | 7 (4.2%) |
| 55 to 64 Years | 220 (93.6%) | 15 (6.4%) |
| 65 to 74 Years | 144 (100.0%) | 0 (0.0%) |
| 75 Years and older | 95 (100.0%) | 0 (0.0%) |
| Total | 1,932 (95.1%) | 99 (4.9%) |
Health Insurance Coverage by Citizenship Status in Peebles
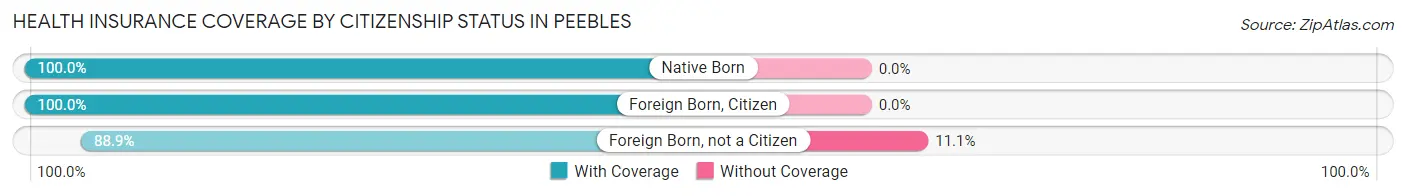
| Citizenship Status | With Coverage | Without Coverage |
| Native Born | 174 (100.0%) | 0 (0.0%) |
| Foreign Born, Citizen | 429 (100.0%) | 0 (0.0%) |
| Foreign Born, not a Citizen | 224 (88.9%) | 28 (11.1%) |
Health Insurance Coverage by Household Income in Peebles
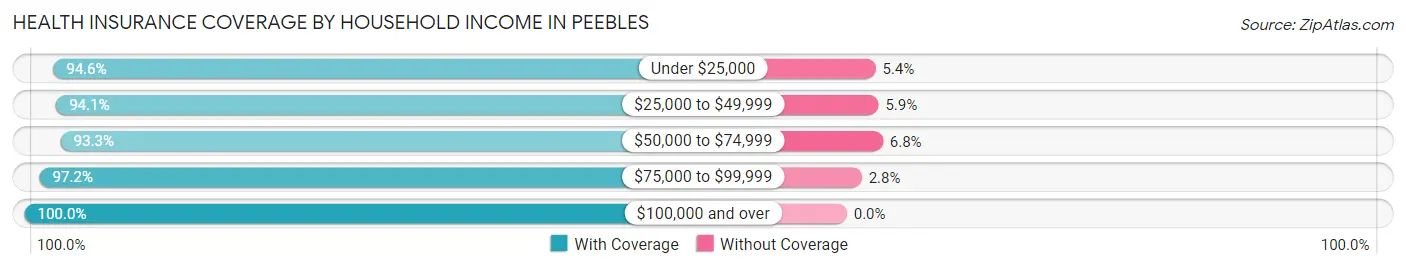
| Household Income | With Coverage | Without Coverage |
| Under $25,000 | 527 (94.6%) | 30 (5.4%) |
| $25,000 to $49,999 | 349 (94.1%) | 22 (5.9%) |
| $50,000 to $74,999 | 470 (93.2%) | 34 (6.8%) |
| $75,000 to $99,999 | 451 (97.2%) | 13 (2.8%) |
| $100,000 and over | 135 (100.0%) | 0 (0.0%) |
Public vs Private Health Insurance Coverage by Age in Peebles
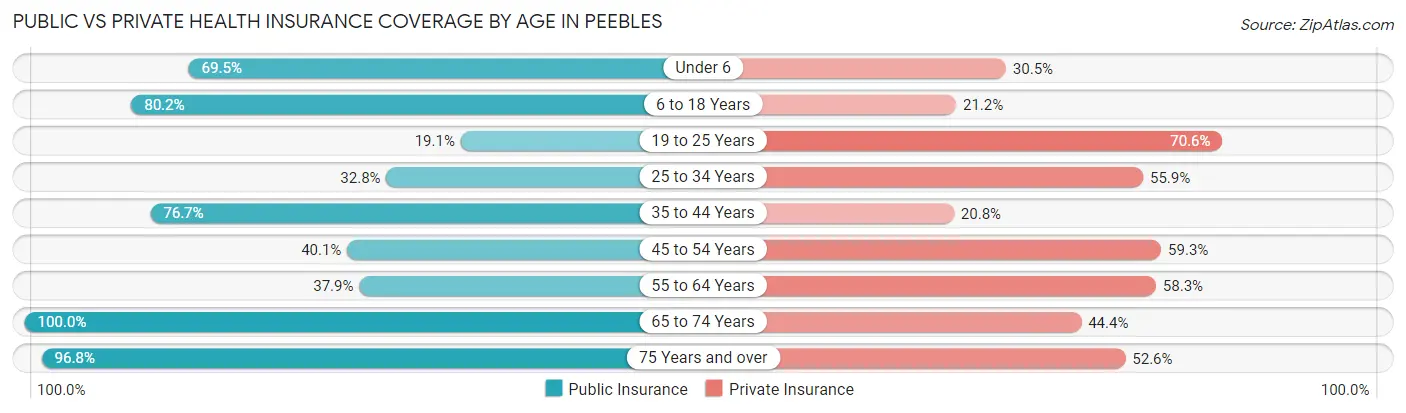
| Age Bracket | Public Insurance | Private Insurance |
| Under 6 | 121 (69.5%) | 53 (30.5%) |
| 6 to 18 Years | 344 (80.2%) | 91 (21.2%) |
| 19 to 25 Years | 48 (19.1%) | 178 (70.6%) |
| 25 to 34 Years | 111 (32.8%) | 189 (55.9%) |
| 35 to 44 Years | 151 (76.6%) | 41 (20.8%) |
| 45 to 54 Years | 67 (40.1%) | 99 (59.3%) |
| 55 to 64 Years | 89 (37.9%) | 137 (58.3%) |
| 65 to 74 Years | 144 (100.0%) | 64 (44.4%) |
| 75 Years and over | 92 (96.8%) | 50 (52.6%) |
| Total | 1,167 (57.5%) | 902 (44.4%) |
Disability Status by Sex by Age in Peebles
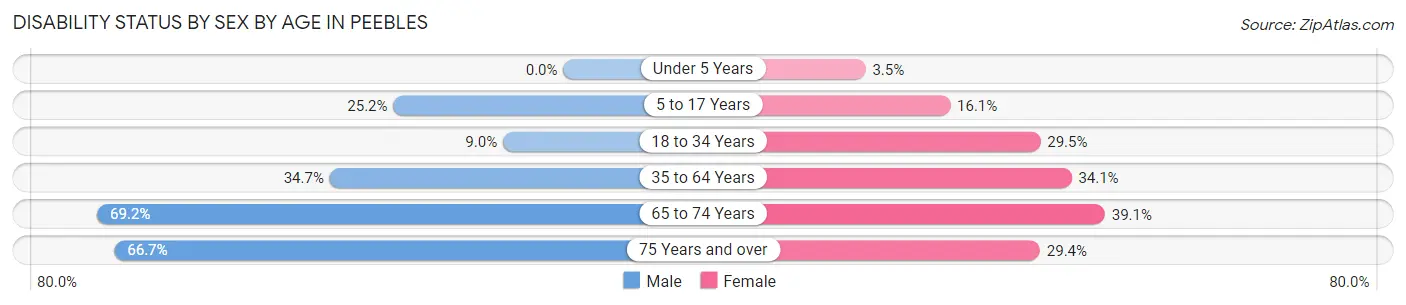
| Age Bracket | Male | Female |
| Under 5 Years | 0 (0.0%) | 2 (3.5%) |
| 5 to 17 Years | 53 (25.2%) | 32 (16.1%) |
| 18 to 34 Years | 31 (9.0%) | 84 (29.5%) |
| 35 to 64 Years | 102 (34.7%) | 104 (34.1%) |
| 65 to 74 Years | 27 (69.2%) | 41 (39.1%) |
| 75 Years and over | 18 (66.7%) | 20 (29.4%) |
Disability Class by Sex by Age in Peebles
Disability Class: Hearing Difficulty
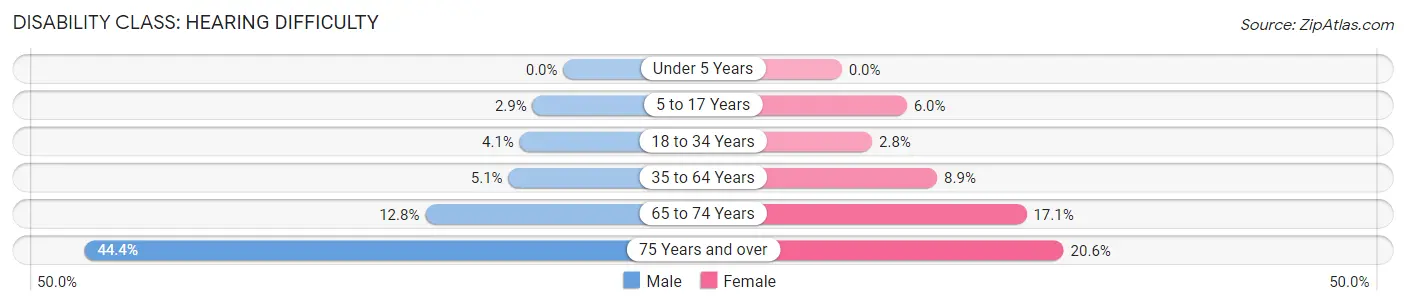
| Age Bracket | Male | Female |
| Under 5 Years | 0 (0.0%) | 0 (0.0%) |
| 5 to 17 Years | 6 (2.9%) | 12 (6.0%) |
| 18 to 34 Years | 14 (4.1%) | 8 (2.8%) |
| 35 to 64 Years | 15 (5.1%) | 27 (8.8%) |
| 65 to 74 Years | 5 (12.8%) | 18 (17.1%) |
| 75 Years and over | 12 (44.4%) | 14 (20.6%) |
Disability Class: Vision Difficulty
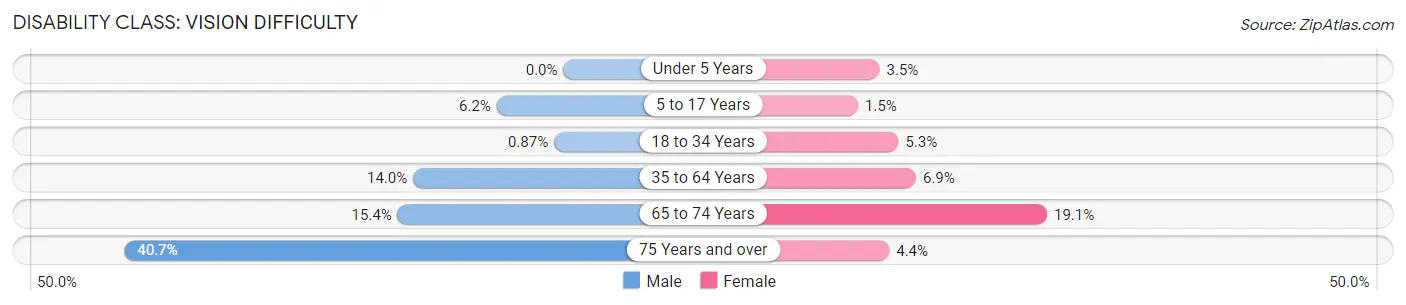
| Age Bracket | Male | Female |
| Under 5 Years | 0 (0.0%) | 2 (3.5%) |
| 5 to 17 Years | 13 (6.2%) | 3 (1.5%) |
| 18 to 34 Years | 3 (0.9%) | 15 (5.3%) |
| 35 to 64 Years | 41 (14.0%) | 21 (6.9%) |
| 65 to 74 Years | 6 (15.4%) | 20 (19.1%) |
| 75 Years and over | 11 (40.7%) | 3 (4.4%) |
Disability Class: Cognitive Difficulty
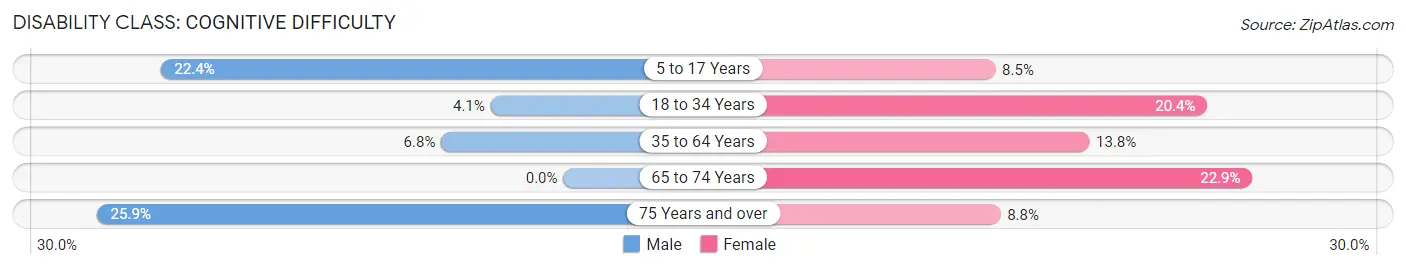
| Age Bracket | Male | Female |
| 5 to 17 Years | 47 (22.4%) | 17 (8.5%) |
| 18 to 34 Years | 14 (4.1%) | 58 (20.3%) |
| 35 to 64 Years | 20 (6.8%) | 42 (13.8%) |
| 65 to 74 Years | 0 (0.0%) | 24 (22.9%) |
| 75 Years and over | 7 (25.9%) | 6 (8.8%) |
Disability Class: Ambulatory Difficulty
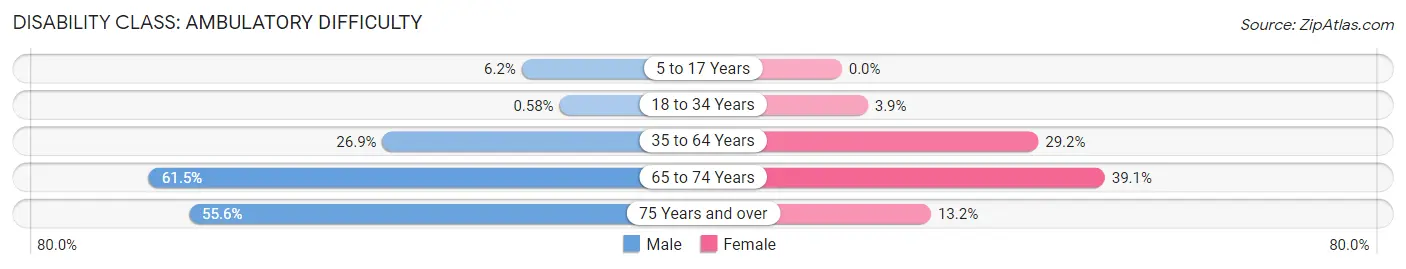
| Age Bracket | Male | Female |
| 5 to 17 Years | 13 (6.2%) | 0 (0.0%) |
| 18 to 34 Years | 2 (0.6%) | 11 (3.9%) |
| 35 to 64 Years | 79 (26.9%) | 89 (29.2%) |
| 65 to 74 Years | 24 (61.5%) | 41 (39.1%) |
| 75 Years and over | 15 (55.6%) | 9 (13.2%) |
Disability Class: Self-Care Difficulty
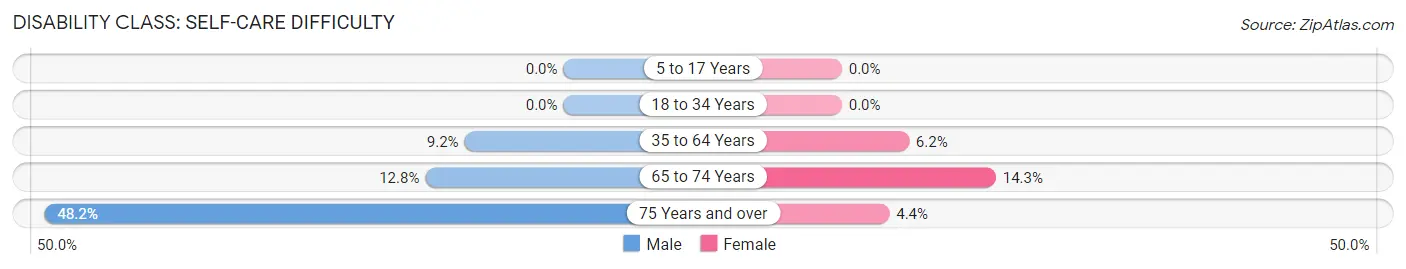
| Age Bracket | Male | Female |
| 5 to 17 Years | 0 (0.0%) | 0 (0.0%) |
| 18 to 34 Years | 0 (0.0%) | 0 (0.0%) |
| 35 to 64 Years | 27 (9.2%) | 19 (6.2%) |
| 65 to 74 Years | 5 (12.8%) | 15 (14.3%) |
| 75 Years and over | 13 (48.1%) | 3 (4.4%) |
Technology Access in Peebles
Computing Device Access in Peebles
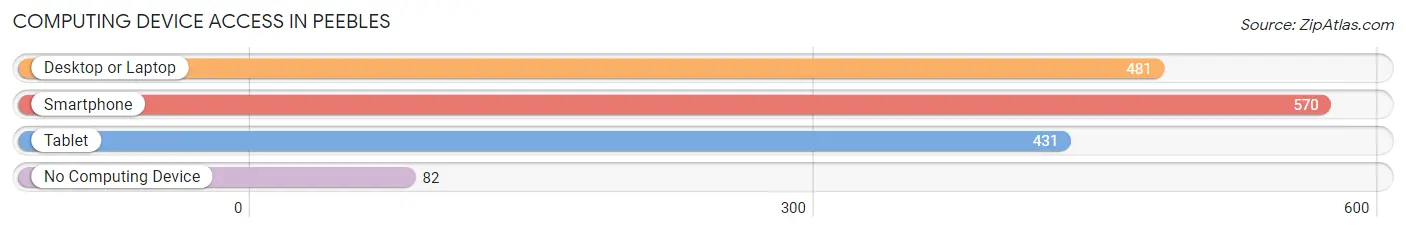
| Device Type | # Households | % Households |
| Desktop or Laptop | 481 | 67.2% |
| Smartphone | 570 | 79.6% |
| Tablet | 431 | 60.2% |
| No Computing Device | 82 | 11.5% |
| Total | 716 | 100.0% |
Internet Access in Peebles
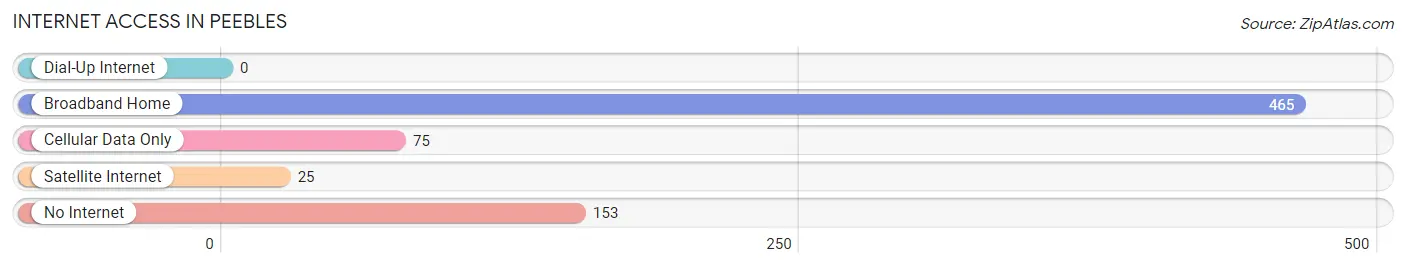
| Internet Type | # Households | % Households |
| Dial-Up Internet | 0 | 0.0% |
| Broadband Home | 465 | 64.9% |
| Cellular Data Only | 75 | 10.5% |
| Satellite Internet | 25 | 3.5% |
| No Internet | 153 | 21.4% |
| Total | 716 | 100.0% |
Peebles Summary
Peebles, Ohio is a small village located in Adams County, Ohio. It is situated along the banks of the Ohio River and is part of the Cincinnati metropolitan area. The village has a population of approximately 1,500 people and is known for its rural charm and small-town atmosphere.
History
Peebles was founded in 1817 by William Peebles, a Revolutionary War veteran. He purchased the land from the government and named the village after himself. The village was incorporated in 1845 and has remained a small, rural community ever since.
The village was an important stop on the Underground Railroad, with many slaves escaping to freedom in Canada. The village was also home to a number of prominent abolitionists, including William Peebles and his son, John Peebles.
Geography
Peebles is located in Adams County, Ohio, along the banks of the Ohio River. The village is situated in a rural area, surrounded by rolling hills and farmland. The village is approximately 30 miles east of Cincinnati and is part of the Cincinnati metropolitan area.
The village is located in the Eastern Time Zone and has a humid continental climate, with hot summers and cold winters. The average annual temperature is around 50 degrees Fahrenheit.
Economy
The economy of Peebles is largely based on agriculture and tourism. The village is home to a number of small businesses, including restaurants, shops, and a local winery. The village also has a number of historic sites, including the Peebles House, which is listed on the National Register of Historic Places.
The village is also home to a number of festivals and events, including the Peebles Country Fair, which is held every summer. The fair features a variety of activities, including a carnival, live music, and a variety of food vendors.
Demographics
As of the 2010 census, the population of Peebles was 1,500. The racial makeup of the village was 97.3% White, 0.7% African American, 0.3% Native American, 0.3% Asian, and 1.3% from other races. The median household income was $37,500, and the median age was 40.
Peebles is a small, rural village with a strong sense of community. The village is home to a number of churches, including the Peebles United Methodist Church, which was founded in 1845. The village also has a number of parks and recreational areas, including the Peebles Park, which is located along the banks of the Ohio River.
Common Questions
What is Per Capita Income in Peebles?
Per Capita income in Peebles is $17,586.
What is the Median Family Income in Peebles?
Median Family Income in Peebles is $51,250.
What is the Median Household income in Peebles?
Median Household Income in Peebles is $44,200.
What is Income or Wage Gap in Peebles?
Income or Wage Gap in Peebles is 48.4%.
Women in Peebles earn 51.6 cents for every dollar earned by a man.
What is Family Income Deficit in Peebles?
Family Income Deficit in Peebles is $9,778.
Families that are below poverty line in Peebles earn $9,778 less on average than the poverty threshold level.
What is Inequality or Gini Index in Peebles?
Inequality or Gini Index in Peebles is 0.41.
What is the Total Population of Peebles?
Total Population of Peebles is 2,031.
What is the Total Male Population of Peebles?
Total Male Population of Peebles is 1,012.
What is the Total Female Population of Peebles?
Total Female Population of Peebles is 1,019.
What is the Ratio of Males per 100 Females in Peebles?
There are 99.31 Males per 100 Females in Peebles.
What is the Ratio of Females per 100 Males in Peebles?
There are 100.69 Females per 100 Males in Peebles.
What is the Median Population Age in Peebles?
Median Population Age in Peebles is 29.7 Years.
What is the Average Family Size in Peebles
Average Family Size in Peebles is 3.4 People.
What is the Average Household Size in Peebles
Average Household Size in Peebles is 2.8 People.
How Large is the Labor Force in Peebles?
There are 838 People in the Labor Forcein in Peebles.
What is the Percentage of People in the Labor Force in Peebles?
53.5% of People are in the Labor Force in Peebles.
What is the Unemployment Rate in Peebles?
Unemployment Rate in Peebles is 17.2%.