Ashtabula, OH Map & Demographics
Ashtabula Map
Ashtabula Overview
$22,595
PER CAPITA INCOME
$44,991
AVG FAMILY INCOME
$39,053
AVG HOUSEHOLD INCOME
25.7%
WAGE / INCOME GAP [ % ]
74.3¢/ $1
WAGE / INCOME GAP [ $ ]
$11,497
FAMILY INCOME DEFICIT
0.47
INEQUALITY / GINI INDEX
18,003
TOTAL POPULATION
8,667
MALE POPULATION
9,336
FEMALE POPULATION
92.83
MALES / 100 FEMALES
107.72
FEMALES / 100 MALES
40.2
MEDIAN AGE
3.0
AVG FAMILY SIZE
2.3
AVG HOUSEHOLD SIZE
8,132
LABOR FORCE [ PEOPLE ]
56.9%
PERCENT IN LABOR FORCE
13.6%
UNEMPLOYMENT RATE
Ashtabula Zip Codes
Ashtabula Area Codes
Income in Ashtabula
Income Overview in Ashtabula
Per Capita Income in Ashtabula is $22,595, while median incomes of families and households are $44,991 and $39,053 respectively.
| Characteristic | Number | Measure |
| Per Capita Income | 18,003 | $22,595 |
| Median Family Income | 4,177 | $44,991 |
| Mean Family Income | 4,177 | $59,184 |
| Median Household Income | 7,666 | $39,053 |
| Mean Household Income | 7,666 | $50,681 |
| Income Deficit | 4,177 | $11,497 |
| Wage / Income Gap (%) | 18,003 | 25.70% |
| Wage / Income Gap ($) | 18,003 | 74.30¢ per $1 |
| Gini / Inequality Index | 18,003 | 0.47 |
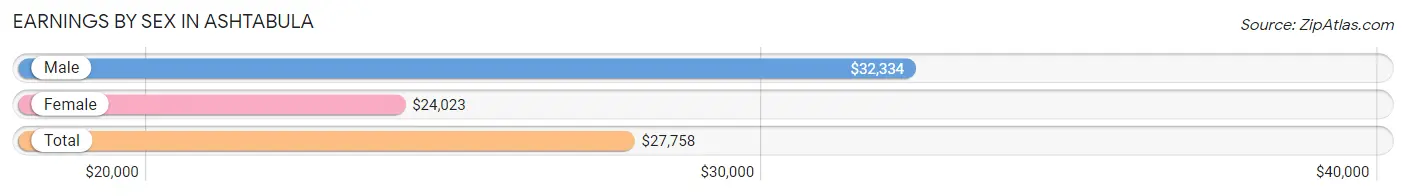
Earnings by Sex in Ashtabula
Average Earnings in Ashtabula are $27,758, $32,334 for men and $24,023 for women, a difference of 25.7%.
| Sex | Number | Average Earnings |
| Male | 4,248 (53.3%) | $32,334 |
| Female | 3,722 (46.7%) | $24,023 |
| Total | 7,970 (100.0%) | $27,758 |
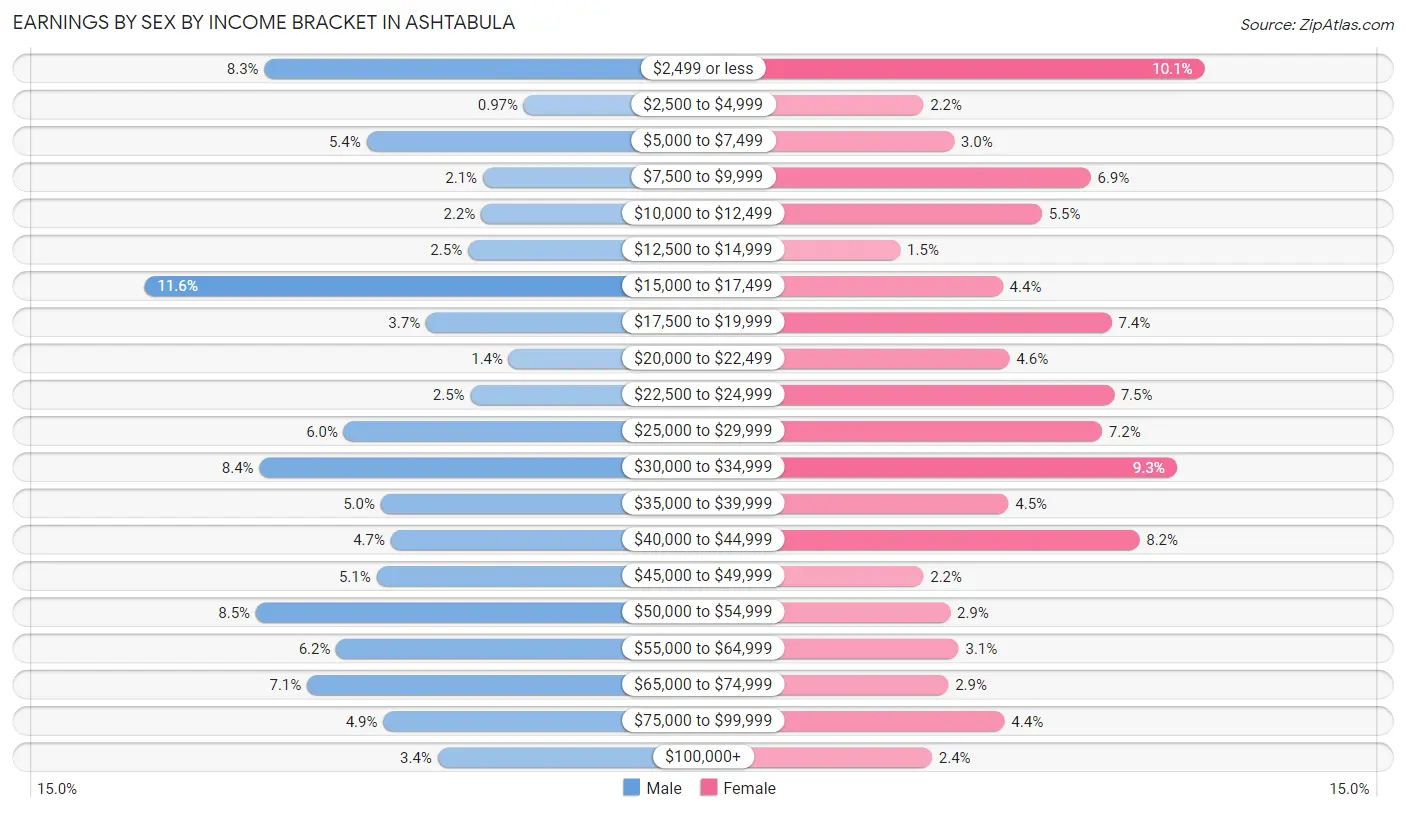
Earnings by Sex by Income Bracket in Ashtabula
The most common earnings brackets in Ashtabula are $15,000 to $17,499 for men (494 | 11.6%) and $2,499 or less for women (374 | 10.1%).
| Income | Male | Female |
| $2,499 or less | 351 (8.3%) | 374 (10.1%) |
| $2,500 to $4,999 | 41 (1.0%) | 80 (2.1%) |
| $5,000 to $7,499 | 229 (5.4%) | 112 (3.0%) |
| $7,500 to $9,999 | 90 (2.1%) | 255 (6.9%) |
| $10,000 to $12,499 | 92 (2.2%) | 204 (5.5%) |
| $12,500 to $14,999 | 108 (2.5%) | 56 (1.5%) |
| $15,000 to $17,499 | 494 (11.6%) | 163 (4.4%) |
| $17,500 to $19,999 | 158 (3.7%) | 277 (7.4%) |
| $20,000 to $22,499 | 59 (1.4%) | 170 (4.6%) |
| $22,500 to $24,999 | 105 (2.5%) | 279 (7.5%) |
| $25,000 to $29,999 | 256 (6.0%) | 267 (7.2%) |
| $30,000 to $34,999 | 357 (8.4%) | 345 (9.3%) |
| $35,000 to $39,999 | 212 (5.0%) | 169 (4.5%) |
| $40,000 to $44,999 | 200 (4.7%) | 306 (8.2%) |
| $45,000 to $49,999 | 217 (5.1%) | 80 (2.1%) |
| $50,000 to $54,999 | 361 (8.5%) | 108 (2.9%) |
| $55,000 to $64,999 | 265 (6.2%) | 117 (3.1%) |
| $65,000 to $74,999 | 300 (7.1%) | 106 (2.9%) |
| $75,000 to $99,999 | 209 (4.9%) | 165 (4.4%) |
| $100,000+ | 144 (3.4%) | 89 (2.4%) |
| Total | 4,248 (100.0%) | 3,722 (100.0%) |
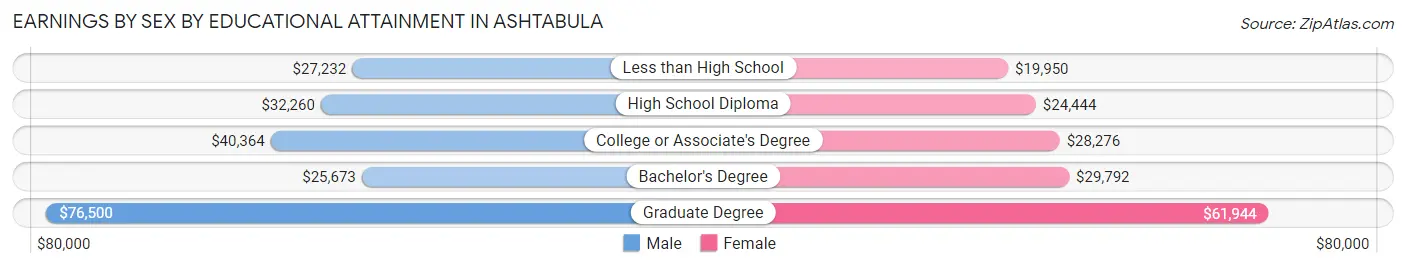
Earnings by Sex by Educational Attainment in Ashtabula
Average earnings in Ashtabula are $34,537 for men and $27,330 for women, a difference of 20.9%. Men with an educational attainment of graduate degree enjoy the highest average annual earnings of $76,500, while those with bachelor's degree education earn the least with $25,673. Women with an educational attainment of graduate degree earn the most with the average annual earnings of $61,944, while those with less than high school education have the smallest earnings of $19,950.
| Educational Attainment | Male Income | Female Income |
| Less than High School | $27,232 | $19,950 |
| High School Diploma | $32,260 | $24,444 |
| College or Associate's Degree | $40,364 | $28,276 |
| Bachelor's Degree | $25,673 | $29,792 |
| Graduate Degree | $76,500 | $61,944 |
| Total | $34,537 | $27,330 |
Family Income in Ashtabula
Family Income Brackets in Ashtabula
According to the Ashtabula family income data, there are 819 families falling into the $50,000 to $74,999 income range, which is the most common income bracket and makes up 19.6% of all families. Conversely, the $200,000+ income bracket is the least frequent group with only 84 families (2.0%) belonging to this category.
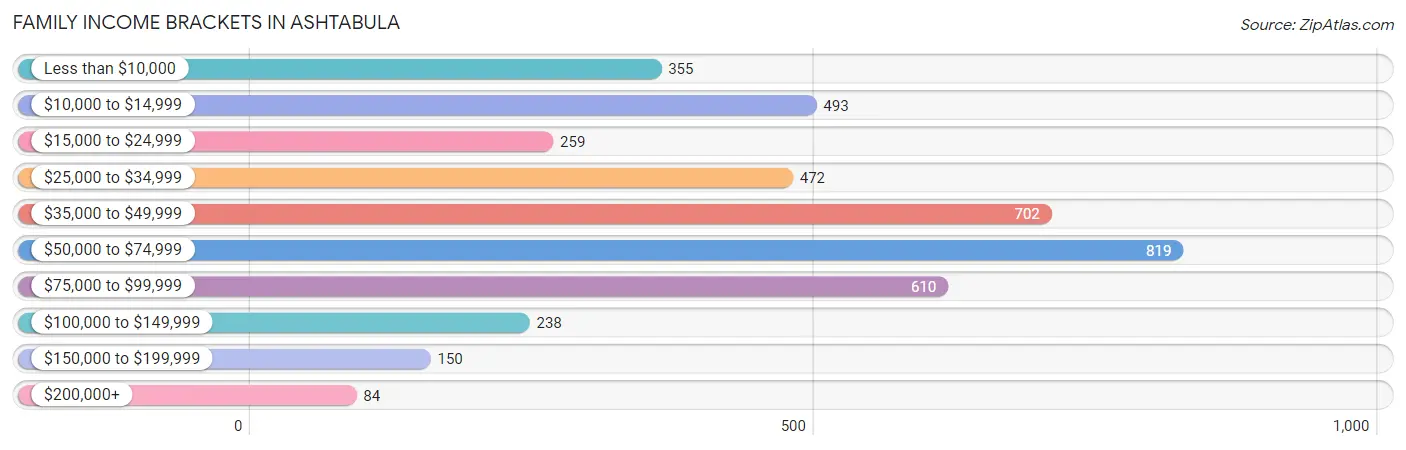
| Income Bracket | # Families | % Families |
| Less than $10,000 | 355 | 8.5% |
| $10,000 to $14,999 | 493 | 11.8% |
| $15,000 to $24,999 | 259 | 6.2% |
| $25,000 to $34,999 | 472 | 11.3% |
| $35,000 to $49,999 | 702 | 16.8% |
| $50,000 to $74,999 | 819 | 19.6% |
| $75,000 to $99,999 | 610 | 14.6% |
| $100,000 to $149,999 | 238 | 5.7% |
| $150,000 to $199,999 | 150 | 3.6% |
| $200,000+ | 84 | 2.0% |
Family Income by Famaliy Size in Ashtabula
6-person families (99 | 2.4%) account for the highest median family income in Ashtabula with $82,228 per family, while 2-person families (2,110 | 50.5%) have the highest median income of $24,082 per family member.
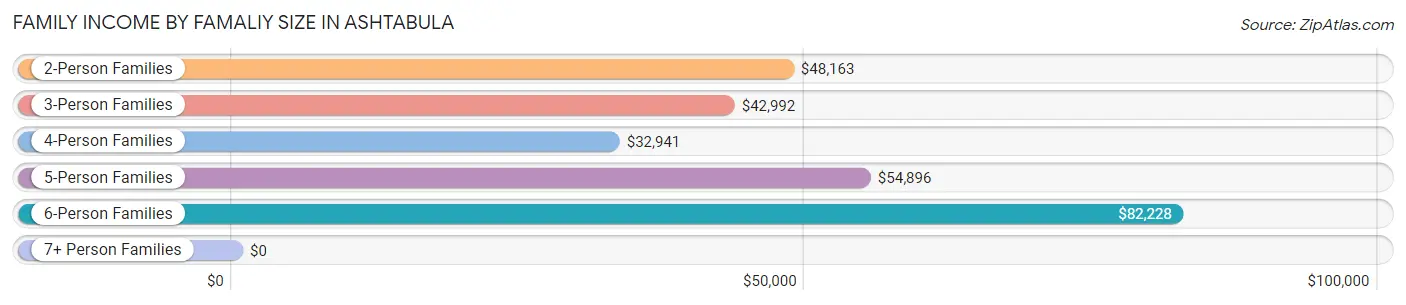
| Income Bracket | # Families | Median Income |
| 2-Person Families | 2,110 (50.5%) | $48,163 |
| 3-Person Families | 1,101 (26.4%) | $42,992 |
| 4-Person Families | 678 (16.2%) | $32,941 |
| 5-Person Families | 189 (4.5%) | $54,896 |
| 6-Person Families | 99 (2.4%) | $82,228 |
| 7+ Person Families | 0 (0.0%) | $0 |
| Total | 4,177 (100.0%) | $44,991 |
Family Income by Number of Earners in Ashtabula
The median family income in Ashtabula is $44,991, with families comprising 3+ earners (152) having the highest median family income of $92,083, while families with no earners (991) have the lowest median family income of $13,728, accounting for 3.6% and 23.7% of families, respectively.
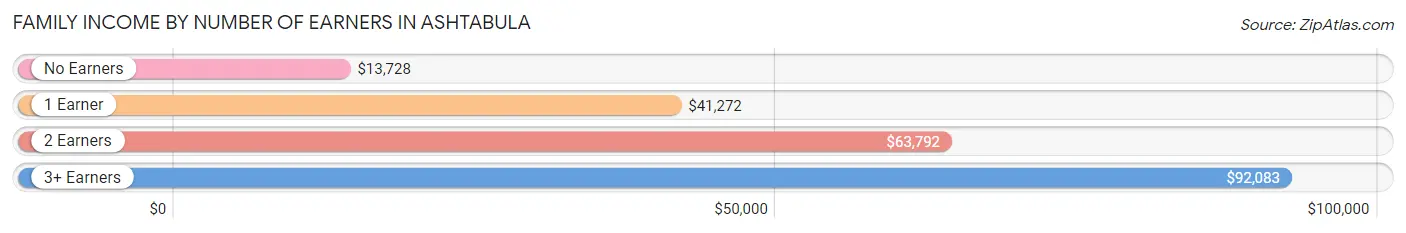
| Number of Earners | # Families | Median Income |
| No Earners | 991 (23.7%) | $13,728 |
| 1 Earner | 1,508 (36.1%) | $41,272 |
| 2 Earners | 1,526 (36.5%) | $63,792 |
| 3+ Earners | 152 (3.6%) | $92,083 |
| Total | 4,177 (100.0%) | $44,991 |
Household Income in Ashtabula
Household Income Brackets in Ashtabula
With 1,365 households falling in the category, the $50,000 to $74,999 income range is the most frequent in Ashtabula, accounting for 17.8% of all households. In contrast, only 92 households (1.2%) fall into the $200,000+ income bracket, making it the least populous group.
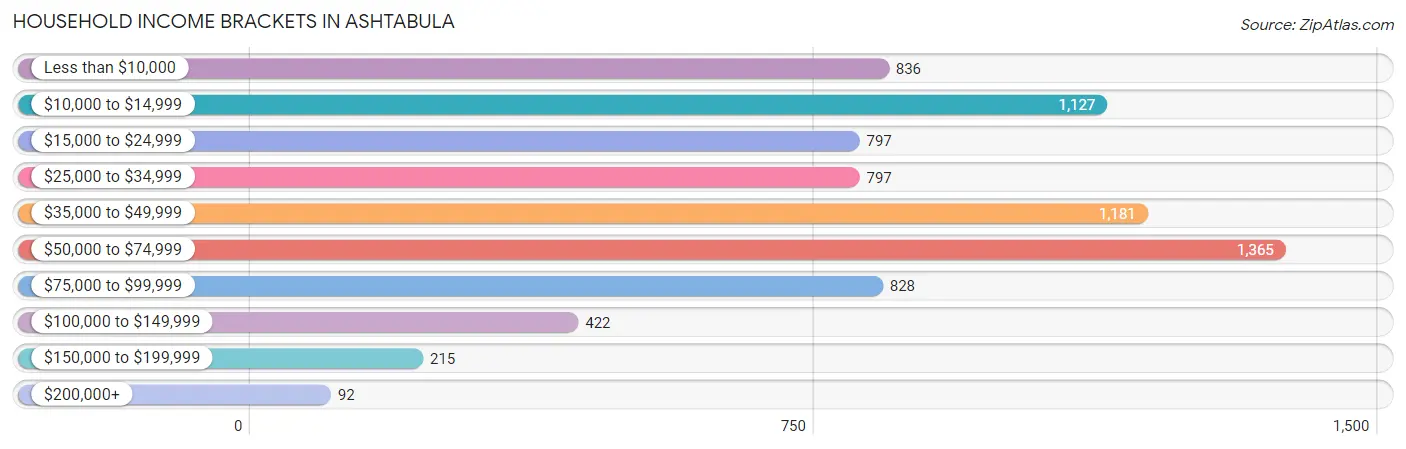
| Income Bracket | # Households | % Households |
| Less than $10,000 | 836 | 10.9% |
| $10,000 to $14,999 | 1,127 | 14.7% |
| $15,000 to $24,999 | 797 | 10.4% |
| $25,000 to $34,999 | 797 | 10.4% |
| $35,000 to $49,999 | 1,181 | 15.4% |
| $50,000 to $74,999 | 1,365 | 17.8% |
| $75,000 to $99,999 | 828 | 10.8% |
| $100,000 to $149,999 | 422 | 5.5% |
| $150,000 to $199,999 | 215 | 2.8% |
| $200,000+ | 92 | 1.2% |
Household Income by Householder Age in Ashtabula
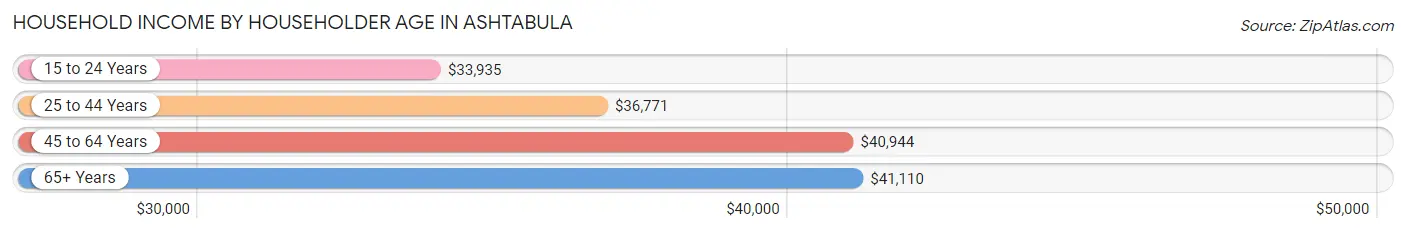
The median household income in Ashtabula is $39,053, with the highest median household income of $41,110 found in the 65+ years age bracket for the primary householder. A total of 2,351 households (30.7%) fall into this category. Meanwhile, the 15 to 24 years age bracket for the primary householder has the lowest median household income of $33,935, with 233 households (3.0%) in this group.
| Income Bracket | # Households | Median Income |
| 15 to 24 Years | 233 (3.0%) | $33,935 |
| 25 to 44 Years | 2,505 (32.7%) | $36,771 |
| 45 to 64 Years | 2,577 (33.6%) | $40,944 |
| 65+ Years | 2,351 (30.7%) | $41,110 |
| Total | 7,666 (100.0%) | $39,053 |
Poverty in Ashtabula
Income Below Poverty by Sex and Age in Ashtabula
With 30.5% poverty level for males and 34.7% for females among the residents of Ashtabula, 16 and 17 year old males and 15 year old females are the most vulnerable to poverty, with 111 males (64.2%) and 70 females (66.7%) in their respective age groups living below the poverty level.
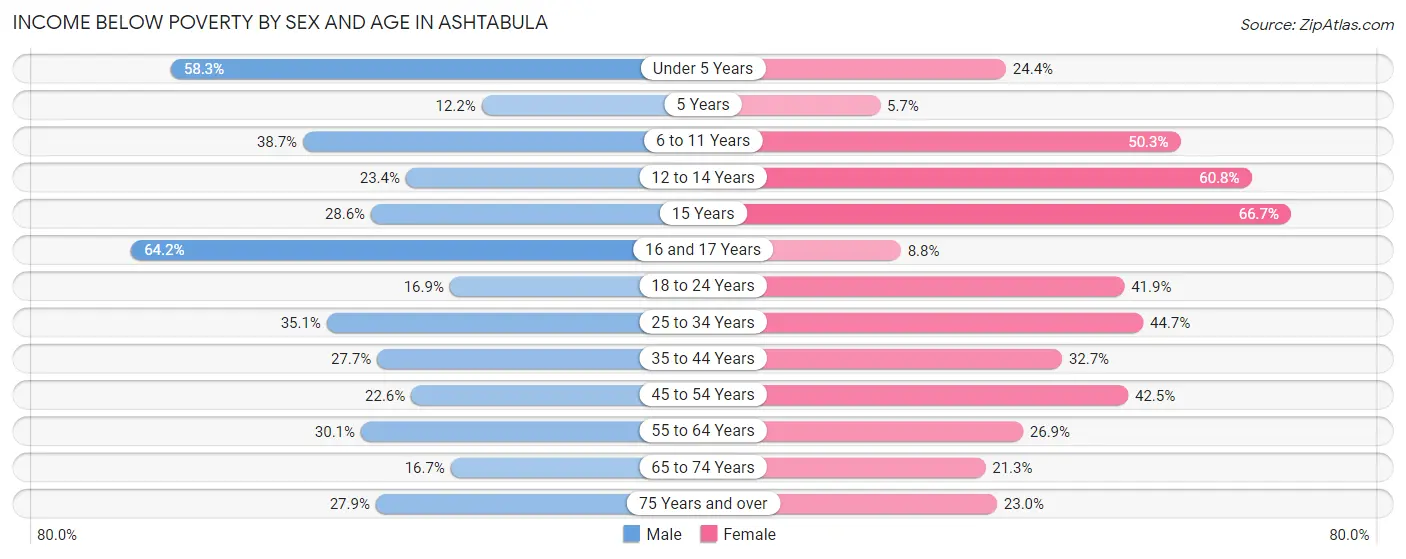
| Age Bracket | Male | Female |
| Under 5 Years | 359 (58.3%) | 144 (24.4%) |
| 5 Years | 13 (12.1%) | 5 (5.7%) |
| 6 to 11 Years | 280 (38.7%) | 391 (50.3%) |
| 12 to 14 Years | 62 (23.4%) | 180 (60.8%) |
| 15 Years | 38 (28.6%) | 70 (66.7%) |
| 16 and 17 Years | 111 (64.2%) | 21 (8.7%) |
| 18 to 24 Years | 83 (16.9%) | 302 (41.9%) |
| 25 to 34 Years | 480 (35.1%) | 523 (44.7%) |
| 35 to 44 Years | 360 (27.7%) | 355 (32.7%) |
| 45 to 54 Years | 218 (22.6%) | 485 (42.5%) |
| 55 to 64 Years | 270 (30.1%) | 335 (26.9%) |
| 65 to 74 Years | 133 (16.7%) | 235 (21.3%) |
| 75 Years and over | 202 (27.9%) | 143 (23.0%) |
| Total | 2,609 (30.5%) | 3,189 (34.7%) |
Income Above Poverty by Sex and Age in Ashtabula
According to the poverty statistics in Ashtabula, males aged 5 years and females aged 5 years are the age groups that are most secure financially, with 87.8% of males and 94.3% of females in these age groups living above the poverty line.
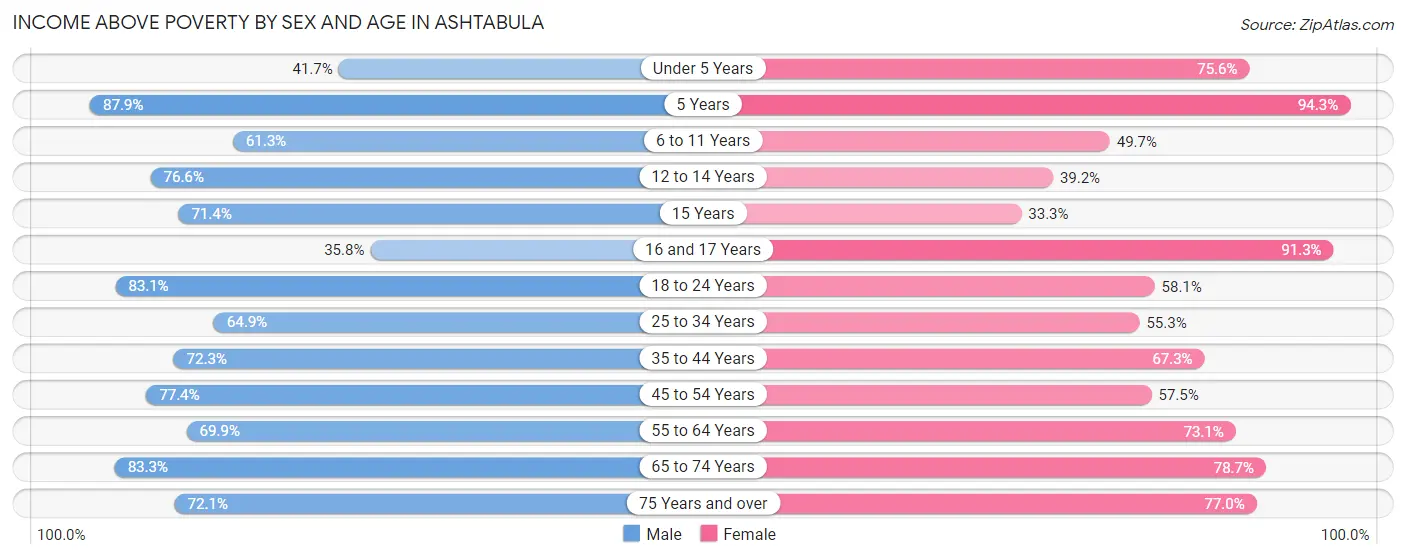
| Age Bracket | Male | Female |
| Under 5 Years | 257 (41.7%) | 447 (75.6%) |
| 5 Years | 94 (87.8%) | 83 (94.3%) |
| 6 to 11 Years | 444 (61.3%) | 387 (49.7%) |
| 12 to 14 Years | 203 (76.6%) | 116 (39.2%) |
| 15 Years | 95 (71.4%) | 35 (33.3%) |
| 16 and 17 Years | 62 (35.8%) | 219 (91.2%) |
| 18 to 24 Years | 409 (83.1%) | 418 (58.1%) |
| 25 to 34 Years | 886 (64.9%) | 646 (55.3%) |
| 35 to 44 Years | 941 (72.3%) | 731 (67.3%) |
| 45 to 54 Years | 746 (77.4%) | 656 (57.5%) |
| 55 to 64 Years | 628 (69.9%) | 911 (73.1%) |
| 65 to 74 Years | 662 (83.3%) | 868 (78.7%) |
| 75 Years and over | 523 (72.1%) | 478 (77.0%) |
| Total | 5,950 (69.5%) | 5,995 (65.3%) |
Income Below Poverty Among Married-Couple Families in Ashtabula
The poverty statistics for married-couple families in Ashtabula show that 13.7% or 332 of the total 2,432 families live below the poverty line. Families with 1 or 2 children have the highest poverty rate of 24.0%, comprising of 148 families. On the other hand, families with no children have the lowest poverty rate of 9.4%, which includes 153 families.
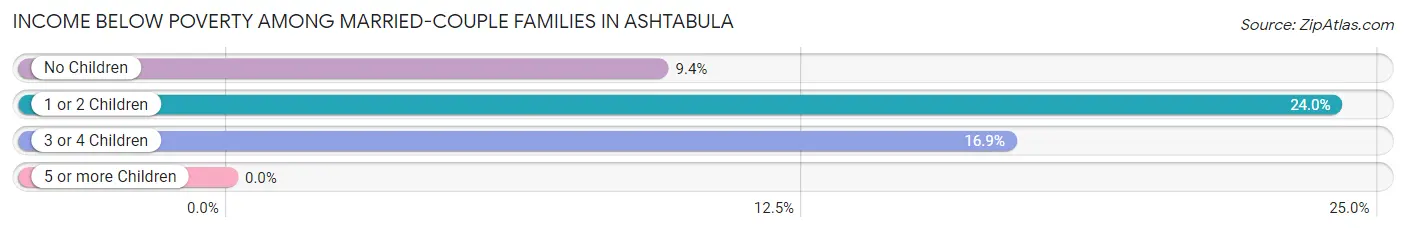
| Children | Above Poverty | Below Poverty |
| No Children | 1,480 (90.6%) | 153 (9.4%) |
| 1 or 2 Children | 468 (76.0%) | 148 (24.0%) |
| 3 or 4 Children | 152 (83.1%) | 31 (16.9%) |
| 5 or more Children | 0 (0.0%) | 0 (0.0%) |
| Total | 2,100 (86.4%) | 332 (13.7%) |
Income Below Poverty Among Single-Parent Households in Ashtabula
According to the poverty data in Ashtabula, 34.8% or 138 single-father households and 50.0% or 675 single-mother households are living below the poverty line. Among single-father households, those with 1 or 2 children have the highest poverty rate, with 115 households (46.6%) experiencing poverty. Likewise, among single-mother households, those with 3 or 4 children have the highest poverty rate, with 205 households (78.8%) falling below the poverty line.
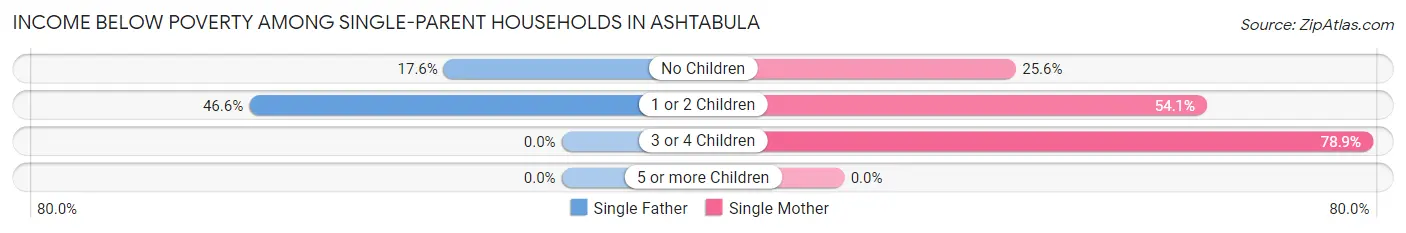
| Children | Single Father | Single Mother |
| No Children | 23 (17.6%) | 101 (25.6%) |
| 1 or 2 Children | 115 (46.6%) | 369 (54.1%) |
| 3 or 4 Children | 0 (0.0%) | 205 (78.8%) |
| 5 or more Children | 0 (0.0%) | 0 (0.0%) |
| Total | 138 (34.8%) | 675 (50.0%) |
Income Below Poverty Among Married-Couple vs Single-Parent Households in Ashtabula
The poverty data for Ashtabula shows that 332 of the married-couple family households (13.7%) and 813 of the single-parent households (46.6%) are living below the poverty level. Within the married-couple family households, those with 1 or 2 children have the highest poverty rate, with 148 households (24.0%) falling below the poverty line. Among the single-parent households, those with 3 or 4 children have the highest poverty rate, with 205 household (73.7%) living below poverty.
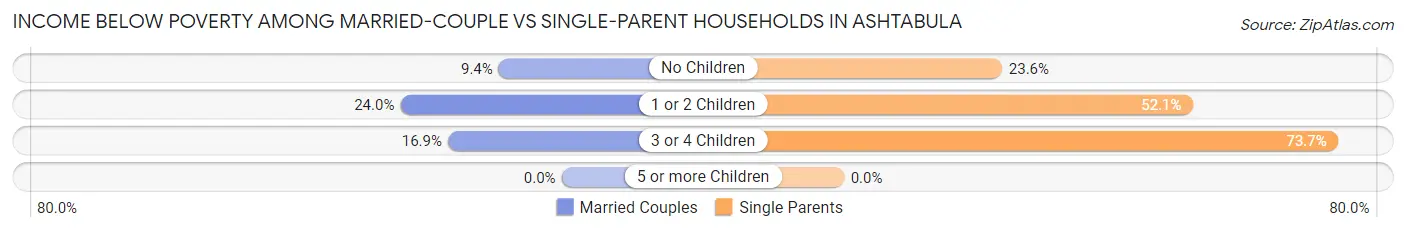
| Children | Married-Couple Families | Single-Parent Households |
| No Children | 153 (9.4%) | 124 (23.6%) |
| 1 or 2 Children | 148 (24.0%) | 484 (52.1%) |
| 3 or 4 Children | 31 (16.9%) | 205 (73.7%) |
| 5 or more Children | 0 (0.0%) | 0 (0.0%) |
| Total | 332 (13.7%) | 813 (46.6%) |
Race in Ashtabula
The most populous races in Ashtabula are White / Caucasian (14,236 | 79.1%), Hispanic or Latino (2,283 | 12.7%), and Two or more Races (1,611 | 8.9%).
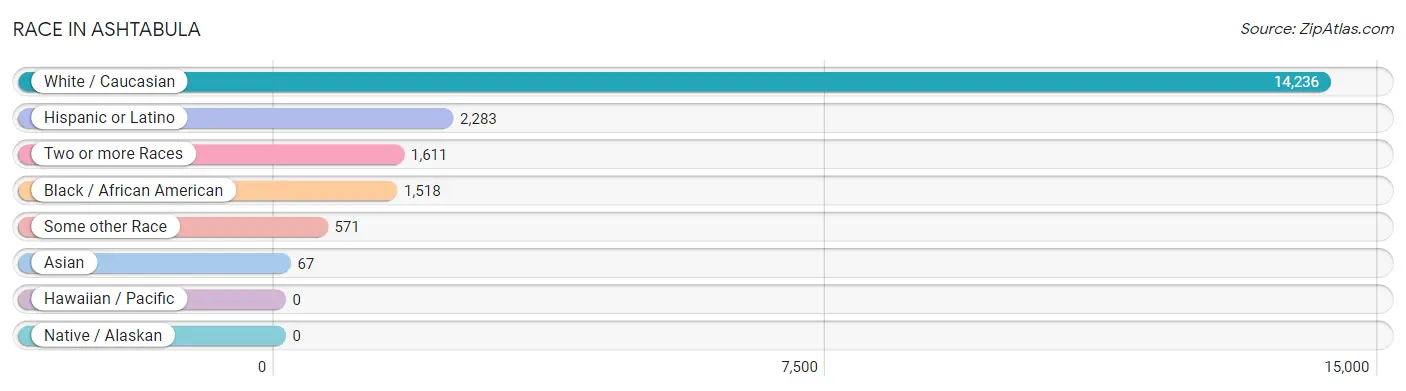
| Race | # Population | % Population |
| Asian | 67 | 0.4% |
| Black / African American | 1,518 | 8.4% |
| Hawaiian / Pacific | 0 | 0.0% |
| Hispanic or Latino | 2,283 | 12.7% |
| Native / Alaskan | 0 | 0.0% |
| White / Caucasian | 14,236 | 79.1% |
| Two or more Races | 1,611 | 8.9% |
| Some other Race | 571 | 3.2% |
| Total | 18,003 | 100.0% |
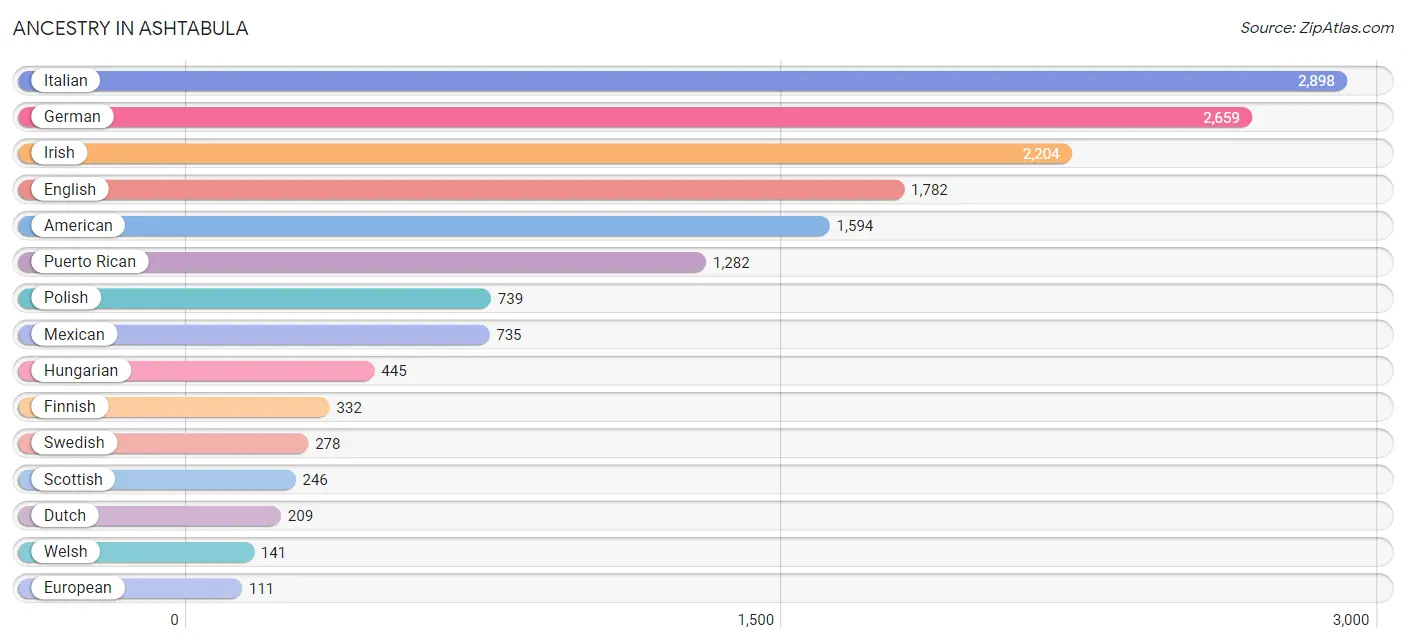
Ancestry in Ashtabula
The most populous ancestries reported in Ashtabula are Italian (2,898 | 16.1%), German (2,659 | 14.8%), Irish (2,204 | 12.2%), English (1,782 | 9.9%), and American (1,594 | 8.8%), together accounting for 61.9% of all Ashtabula residents.
| Ancestry | # Population | % Population |
| African | 69 | 0.4% |
| American | 1,594 | 8.8% |
| Arab | 35 | 0.2% |
| Austrian | 19 | 0.1% |
| Bhutanese | 35 | 0.2% |
| Blackfeet | 58 | 0.3% |
| British | 93 | 0.5% |
| Bulgarian | 5 | 0.0% |
| Central American | 29 | 0.2% |
| Cherokee | 90 | 0.5% |
| Croatian | 18 | 0.1% |
| Cuban | 56 | 0.3% |
| Czech | 101 | 0.6% |
| Dominican | 6 | 0.0% |
| Dutch | 209 | 1.2% |
| English | 1,782 | 9.9% |
| European | 111 | 0.6% |
| Finnish | 332 | 1.8% |
| French | 105 | 0.6% |
| French American Indian | 13 | 0.1% |
| French Canadian | 43 | 0.2% |
| German | 2,659 | 14.8% |
| Greek | 10 | 0.1% |
| Guamanian / Chamorro | 40 | 0.2% |
| Honduran | 13 | 0.1% |
| Hungarian | 445 | 2.5% |
| Icelander | 5 | 0.0% |
| Irish | 2,204 | 12.2% |
| Iroquois | 1 | 0.0% |
| Italian | 2,898 | 16.1% |
| Jamaican | 40 | 0.2% |
| Latvian | 11 | 0.1% |
| Lebanese | 35 | 0.2% |
| Lithuanian | 14 | 0.1% |
| Luxembourger | 15 | 0.1% |
| Mexican | 735 | 4.1% |
| Native Hawaiian | 35 | 0.2% |
| Northern European | 10 | 0.1% |
| Norwegian | 92 | 0.5% |
| Pennsylvania German | 14 | 0.1% |
| Peruvian | 54 | 0.3% |
| Polish | 739 | 4.1% |
| Portuguese | 58 | 0.3% |
| Puerto Rican | 1,282 | 7.1% |
| Romanian | 11 | 0.1% |
| Russian | 10 | 0.1% |
| Salvadoran | 16 | 0.1% |
| Scandinavian | 15 | 0.1% |
| Scotch-Irish | 107 | 0.6% |
| Scottish | 246 | 1.4% |
| Slavic | 6 | 0.0% |
| Slovak | 111 | 0.6% |
| Slovene | 73 | 0.4% |
| South American | 101 | 0.6% |
| Spaniard | 25 | 0.1% |
| Spanish | 49 | 0.3% |
| Subsaharan African | 69 | 0.4% |
| Swedish | 278 | 1.5% |
| Swiss | 29 | 0.2% |
| Thai | 65 | 0.4% |
| Ukrainian | 19 | 0.1% |
| Venezuelan | 47 | 0.3% |
| Welsh | 141 | 0.8% | View All 63 Rows |
Immigrants in Ashtabula
The most numerous immigrant groups reported in Ashtabula came from Latin America (377 | 2.1%), Central America (306 | 1.7%), Mexico (300 | 1.7%), Europe (92 | 0.5%), and South America (71 | 0.4%), together accounting for 6.4% of all Ashtabula residents.
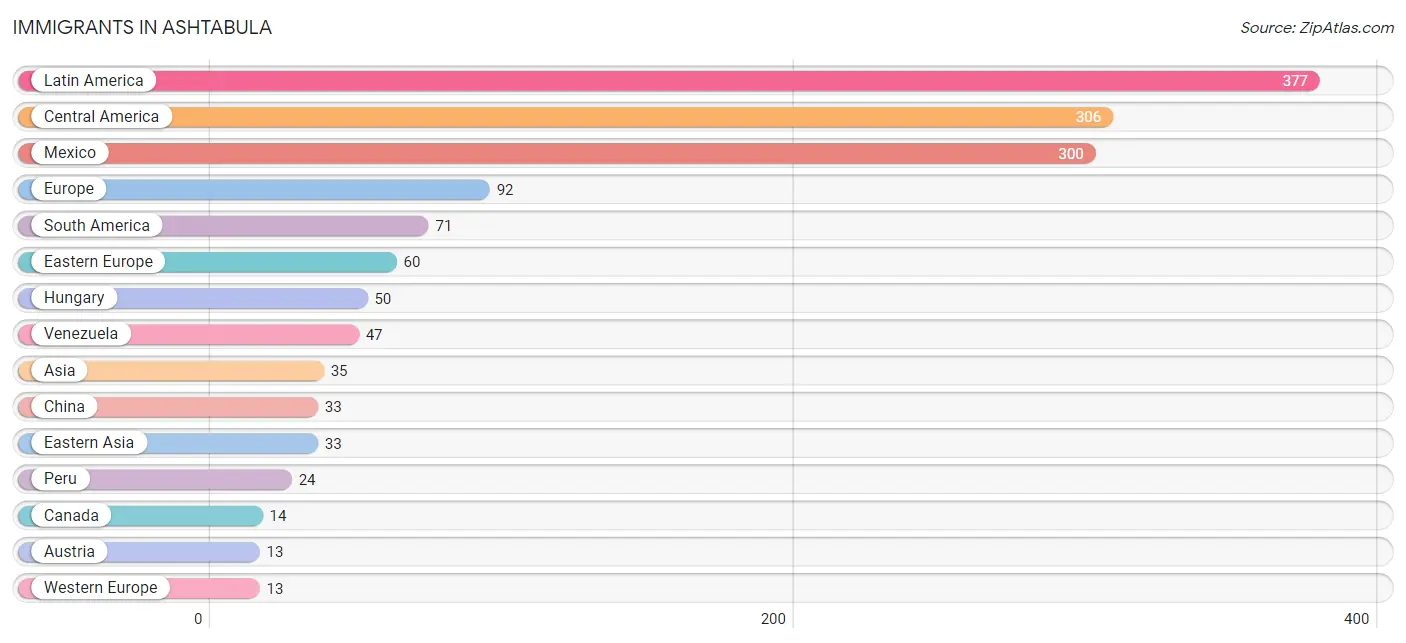
| Immigration Origin | # Population | % Population |
| Africa | 1 | 0.0% |
| Asia | 35 | 0.2% |
| Austria | 13 | 0.1% |
| Canada | 14 | 0.1% |
| Central America | 306 | 1.7% |
| China | 33 | 0.2% |
| Eastern Africa | 1 | 0.0% |
| Eastern Asia | 33 | 0.2% |
| Eastern Europe | 60 | 0.3% |
| Europe | 92 | 0.5% |
| Honduras | 6 | 0.0% |
| Hungary | 50 | 0.3% |
| Ireland | 2 | 0.0% |
| Italy | 7 | 0.0% |
| Latin America | 377 | 2.1% |
| Mexico | 300 | 1.7% |
| Nepal | 2 | 0.0% |
| Northern Europe | 12 | 0.1% |
| Peru | 24 | 0.1% |
| Scotland | 10 | 0.1% |
| South America | 71 | 0.4% |
| South Central Asia | 2 | 0.0% |
| Southern Europe | 7 | 0.0% |
| Ukraine | 10 | 0.1% |
| Venezuela | 47 | 0.3% |
| Western Europe | 13 | 0.1% | View All 26 Rows |
Sex and Age in Ashtabula
Sex and Age in Ashtabula
The most populous age groups in Ashtabula are 25 to 29 Years (790 | 9.1%) for men and 60 to 64 Years (723 | 7.7%) for women.
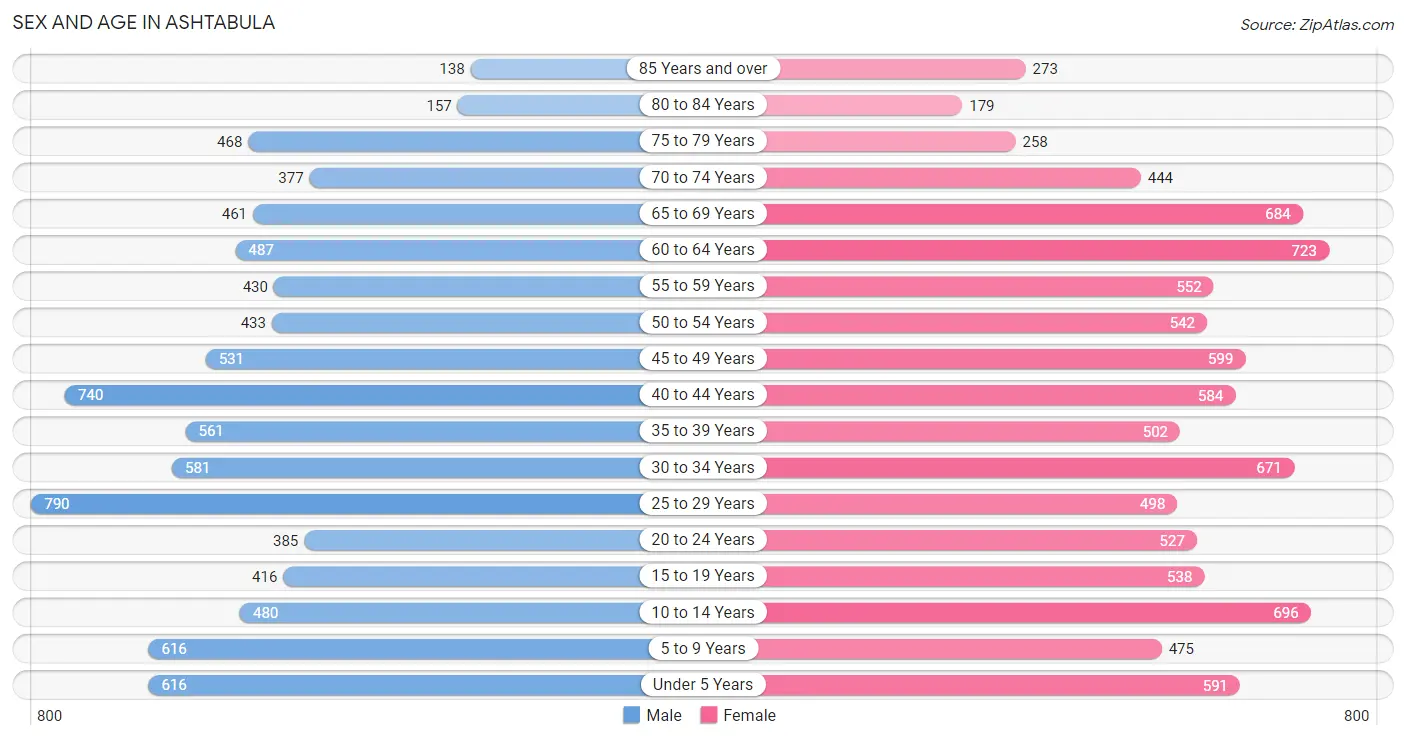
| Age Bracket | Male | Female |
| Under 5 Years | 616 (7.1%) | 591 (6.3%) |
| 5 to 9 Years | 616 (7.1%) | 475 (5.1%) |
| 10 to 14 Years | 480 (5.5%) | 696 (7.5%) |
| 15 to 19 Years | 416 (4.8%) | 538 (5.8%) |
| 20 to 24 Years | 385 (4.4%) | 527 (5.6%) |
| 25 to 29 Years | 790 (9.1%) | 498 (5.3%) |
| 30 to 34 Years | 581 (6.7%) | 671 (7.2%) |
| 35 to 39 Years | 561 (6.5%) | 502 (5.4%) |
| 40 to 44 Years | 740 (8.5%) | 584 (6.3%) |
| 45 to 49 Years | 531 (6.1%) | 599 (6.4%) |
| 50 to 54 Years | 433 (5.0%) | 542 (5.8%) |
| 55 to 59 Years | 430 (5.0%) | 552 (5.9%) |
| 60 to 64 Years | 487 (5.6%) | 723 (7.7%) |
| 65 to 69 Years | 461 (5.3%) | 684 (7.3%) |
| 70 to 74 Years | 377 (4.3%) | 444 (4.8%) |
| 75 to 79 Years | 468 (5.4%) | 258 (2.8%) |
| 80 to 84 Years | 157 (1.8%) | 179 (1.9%) |
| 85 Years and over | 138 (1.6%) | 273 (2.9%) |
| Total | 8,667 (100.0%) | 9,336 (100.0%) |
Families and Households in Ashtabula
Median Family Size in Ashtabula
The median family size in Ashtabula is 3.01 persons per family, with single female/mother families (1,349 | 32.3%) accounting for the largest median family size of 3.3 persons per family. On the other hand, single male/father families (396 | 9.5%) represent the smallest median family size with 2.58 persons per family.
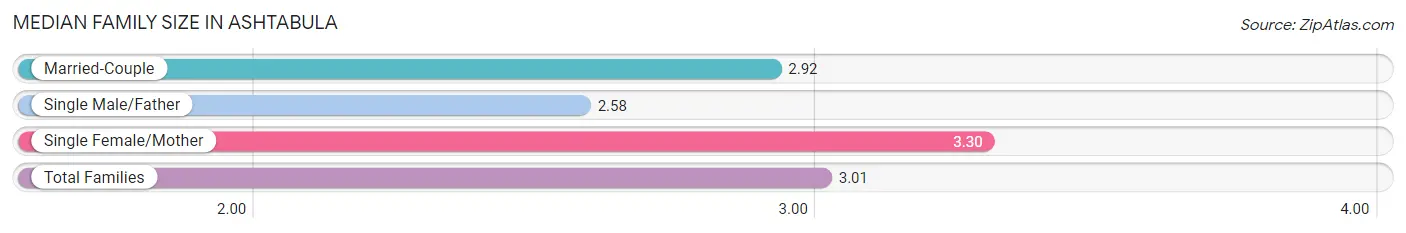
| Family Type | # Families | Family Size |
| Married-Couple | 2,432 (58.2%) | 2.92 |
| Single Male/Father | 396 (9.5%) | 2.58 |
| Single Female/Mother | 1,349 (32.3%) | 3.30 |
| Total Families | 4,177 (100.0%) | 3.01 |
Median Household Size in Ashtabula
The median household size in Ashtabula is 2.31 persons per household, with single female/mother households (1,349 | 17.6%) accounting for the largest median household size of 3.66 persons per household. non-family households (3,489 | 45.5%) represent the smallest median household size with 1.27 persons per household.
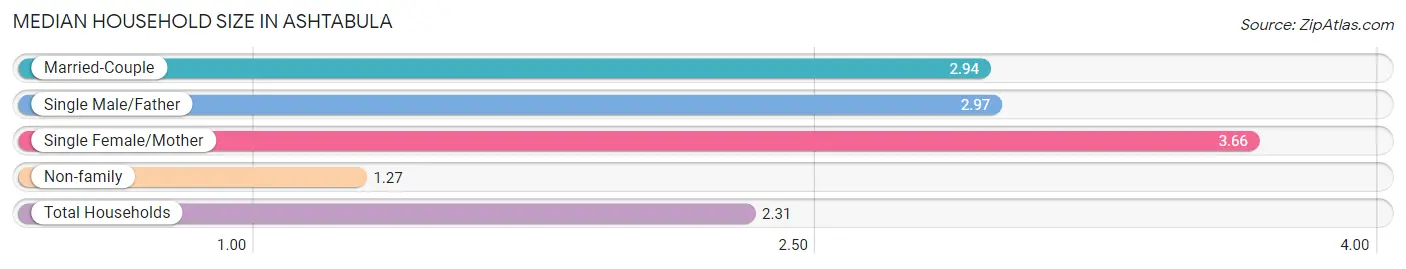
| Household Type | # Households | Household Size |
| Married-Couple | 2,432 (31.7%) | 2.94 |
| Single Male/Father | 396 (5.2%) | 2.97 |
| Single Female/Mother | 1,349 (17.6%) | 3.66 |
| Non-family | 3,489 (45.5%) | 1.27 |
| Total Households | 7,666 (100.0%) | 2.31 |
Household Size by Marriage Status in Ashtabula
Out of a total of 7,666 households in Ashtabula, 4,177 (54.5%) are family households, while 3,489 (45.5%) are nonfamily households. The most numerous type of family households are 2-person households, comprising 1,898, and the most common type of nonfamily households are 1-person households, comprising 2,957.
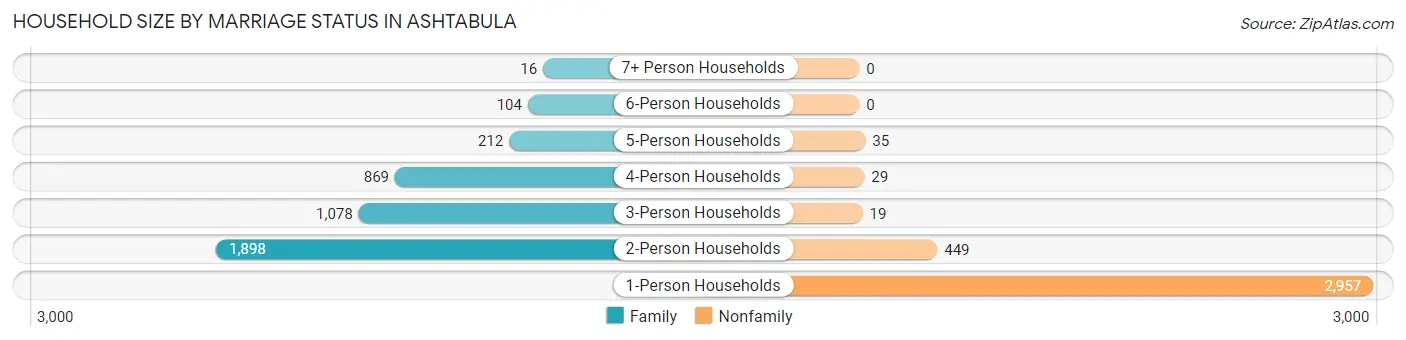
| Household Size | Family Households | Nonfamily Households |
| 1-Person Households | - | 2,957 (38.6%) |
| 2-Person Households | 1,898 (24.8%) | 449 (5.9%) |
| 3-Person Households | 1,078 (14.1%) | 19 (0.3%) |
| 4-Person Households | 869 (11.3%) | 29 (0.4%) |
| 5-Person Households | 212 (2.8%) | 35 (0.5%) |
| 6-Person Households | 104 (1.4%) | 0 (0.0%) |
| 7+ Person Households | 16 (0.2%) | 0 (0.0%) |
| Total | 4,177 (54.5%) | 3,489 (45.5%) |
Female Fertility in Ashtabula
Fertility by Age in Ashtabula
Average fertility rate in Ashtabula is 44.0 births per 1,000 women. Women in the age bracket of 20 to 34 years have the highest fertility rate with 92.0 births per 1,000 women. Women in the age bracket of 20 to 34 years acount for 89.1% of all women with births.
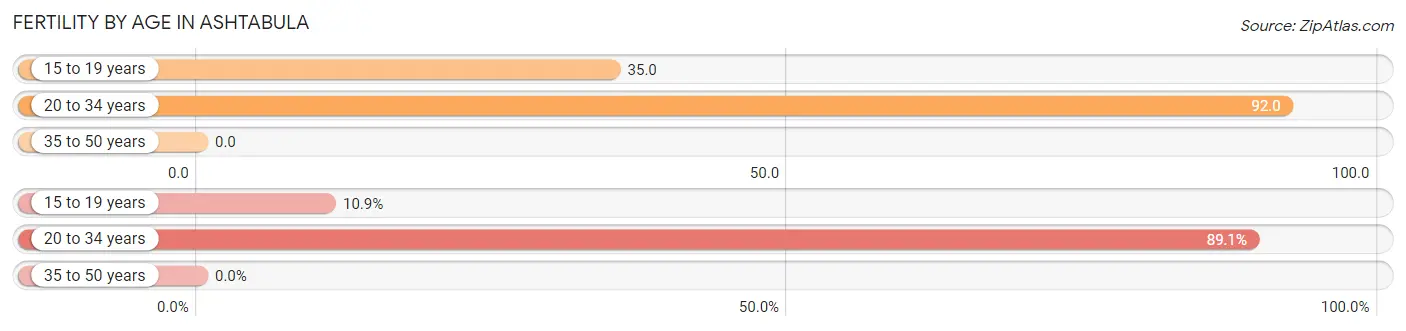
| Age Bracket | Women with Births | Births / 1,000 Women |
| 15 to 19 years | 19 (10.9%) | 35.0 |
| 20 to 34 years | 156 (89.1%) | 92.0 |
| 35 to 50 years | 0 (0.0%) | 0.0 |
| Total | 175 (100.0%) | 44.0 |
Fertility by Age by Marriage Status in Ashtabula
28.6% of women with births (175) in Ashtabula are married. The highest percentage of unmarried women with births falls into 15 to 19 years age bracket with 100.0% of them unmarried at the time of birth, while the lowest percentage of unmarried women with births belong to 20 to 34 years age bracket with 67.9% of them unmarried.
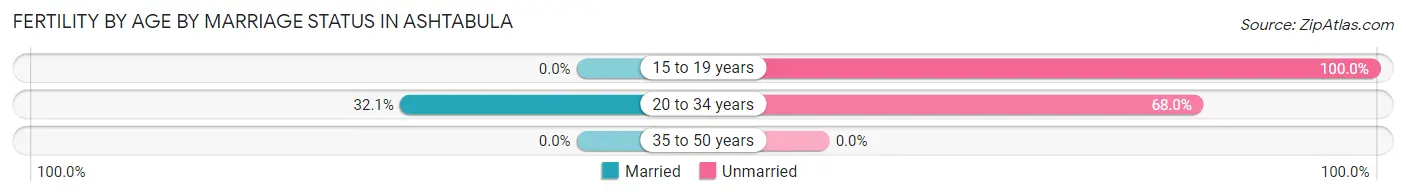
| Age Bracket | Married | Unmarried |
| 15 to 19 years | 0 (0.0%) | 19 (100.0%) |
| 20 to 34 years | 50 (32.1%) | 106 (67.9%) |
| 35 to 50 years | 0 (0.0%) | 0 (0.0%) |
| Total | 50 (28.6%) | 125 (71.4%) |
Fertility by Education in Ashtabula
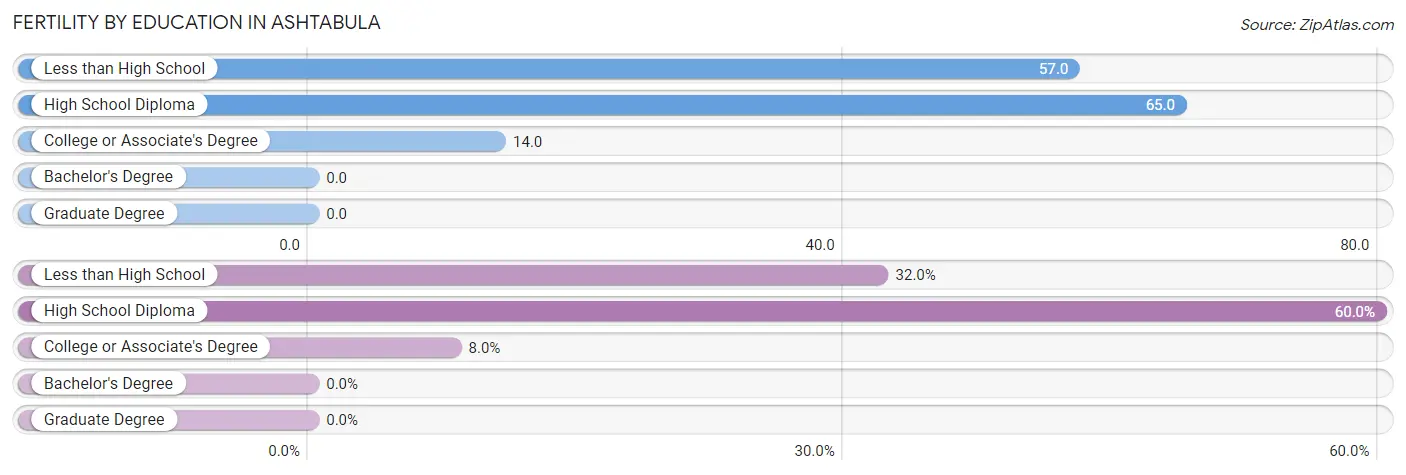
| Educational Attainment | Women with Births | Births / 1,000 Women |
| Less than High School | 56 (32.0%) | 57.0 |
| High School Diploma | 105 (60.0%) | 65.0 |
| College or Associate's Degree | 14 (8.0%) | 14.0 |
| Bachelor's Degree | 0 (0.0%) | 0.0 |
| Graduate Degree | 0 (0.0%) | 0.0 |
| Total | 175 (100.0%) | 44.0 |
Fertility by Education by Marriage Status in Ashtabula
71.4% of women with births in Ashtabula are unmarried. Women with the educational attainment of college or associate's degree are most likely to be married with 100.0% of them married at childbirth, while women with the educational attainment of less than high school are least likely to be married with 100.0% of them unmarried at childbirth.
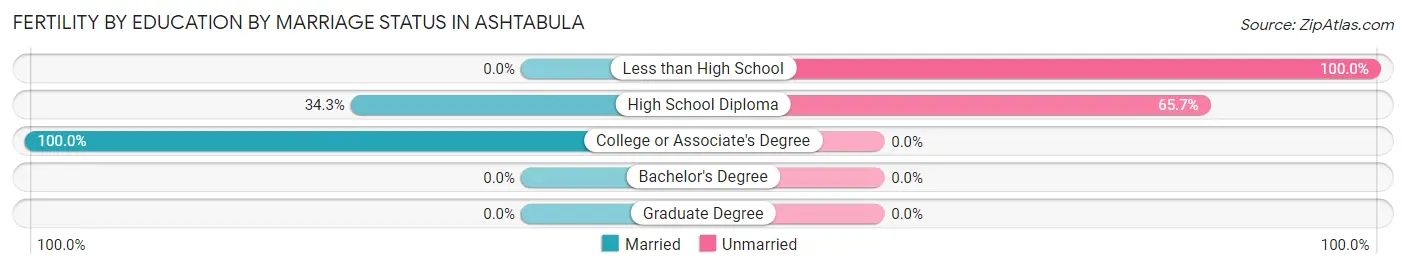
| Educational Attainment | Married | Unmarried |
| Less than High School | 0 (0.0%) | 56 (100.0%) |
| High School Diploma | 36 (34.3%) | 69 (65.7%) |
| College or Associate's Degree | 14 (100.0%) | 0 (0.0%) |
| Bachelor's Degree | 0 (0.0%) | 0 (0.0%) |
| Graduate Degree | 0 (0.0%) | 0 (0.0%) |
| Total | 50 (28.6%) | 125 (71.4%) |
Employment Characteristics in Ashtabula
Employment by Class of Employer in Ashtabula
Among the 6,779 employed individuals in Ashtabula, private company employees (5,128 | 75.6%), not-for-profit organizations (606 | 8.9%), and local government employees (489 | 7.2%) make up the most common classes of employment.
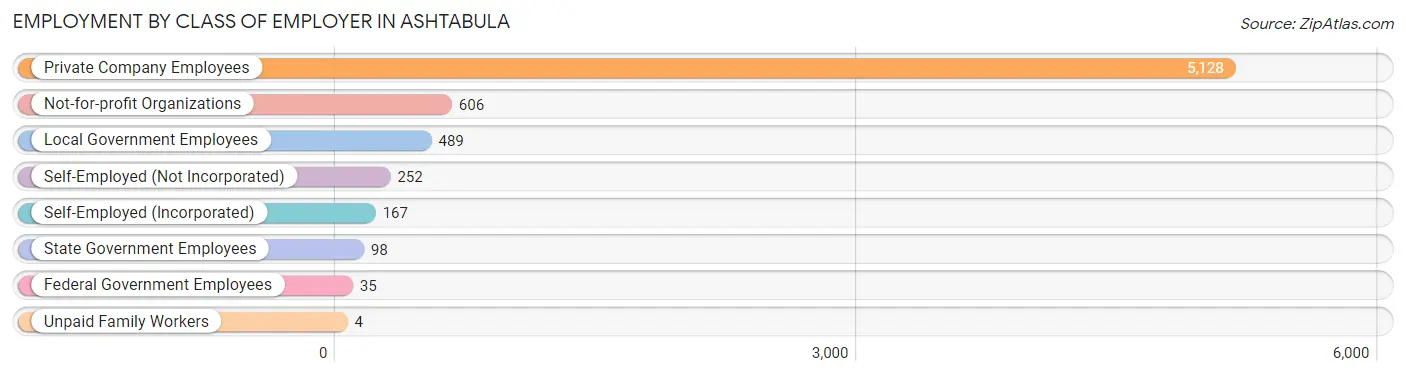
| Employer Class | # Employees | % Employees |
| Private Company Employees | 5,128 | 75.6% |
| Self-Employed (Incorporated) | 167 | 2.5% |
| Self-Employed (Not Incorporated) | 252 | 3.7% |
| Not-for-profit Organizations | 606 | 8.9% |
| Local Government Employees | 489 | 7.2% |
| State Government Employees | 98 | 1.5% |
| Federal Government Employees | 35 | 0.5% |
| Unpaid Family Workers | 4 | 0.1% |
| Total | 6,779 | 100.0% |
Employment Status by Age in Ashtabula
According to the labor force statistics for Ashtabula, out of the total population over 16 years of age (14,291), 56.9% or 8,132 individuals are in the labor force, with 13.6% or 1,106 of them unemployed. The age group with the highest labor force participation rate is 20 to 24 years, with 91.2% or 832 individuals in the labor force. Within the labor force, the 25 to 29 years age range has the highest percentage of unemployed individuals, with 31.7% or 320 of them being unemployed.
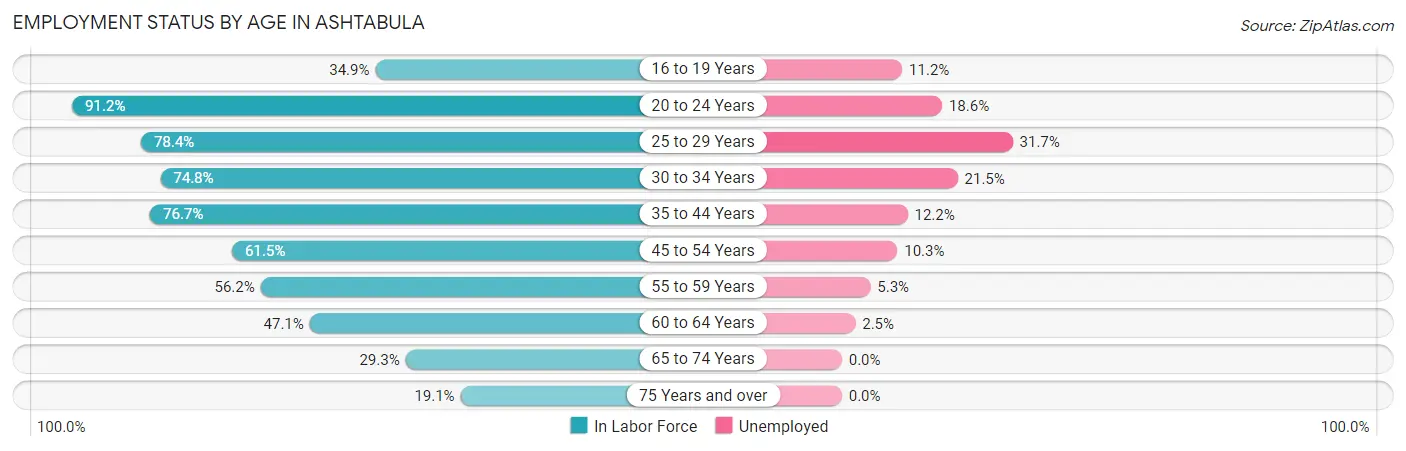
| Age Bracket | In Labor Force | Unemployed |
| 16 to 19 Years | 250 (34.9%) | 28 (11.2%) |
| 20 to 24 Years | 832 (91.2%) | 155 (18.6%) |
| 25 to 29 Years | 1,010 (78.4%) | 320 (31.7%) |
| 30 to 34 Years | 936 (74.8%) | 201 (21.5%) |
| 35 to 44 Years | 1,831 (76.7%) | 223 (12.2%) |
| 45 to 54 Years | 1,295 (61.5%) | 133 (10.3%) |
| 55 to 59 Years | 552 (56.2%) | 29 (5.3%) |
| 60 to 64 Years | 570 (47.1%) | 14 (2.5%) |
| 65 to 74 Years | 576 (29.3%) | 0 (0.0%) |
| 75 Years and over | 281 (19.1%) | 0 (0.0%) |
| Total | 8,132 (56.9%) | 1,106 (13.6%) |
Employment Status by Educational Attainment in Ashtabula
According to labor force statistics for Ashtabula, 67.1% of individuals (6,189) out of the total population between 25 and 64 years of age (9,224) are in the labor force, with 14.9% or 922 of them being unemployed. The group with the highest labor force participation rate are those with the educational attainment of bachelor's degree or higher, with 86.8% or 867 individuals in the labor force. Within the labor force, individuals with less than high school education have the highest percentage of unemployment, with 41.9% or 452 of them being unemployed.
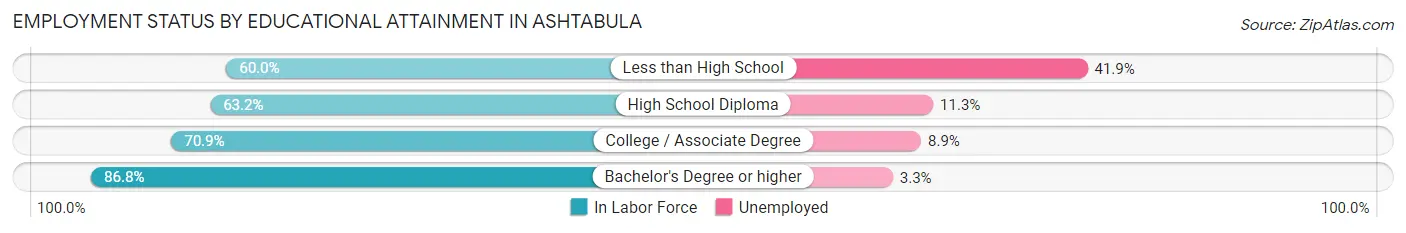
| Educational Attainment | In Labor Force | Unemployed |
| Less than High School | 1,078 (60.0%) | 753 (41.9%) |
| High School Diploma | 2,538 (63.2%) | 454 (11.3%) |
| College / Associate Degree | 1,711 (70.9%) | 215 (8.9%) |
| Bachelor's Degree or higher | 867 (86.8%) | 33 (3.3%) |
| Total | 6,189 (67.1%) | 1,374 (14.9%) |
Employment Occupations by Sex in Ashtabula
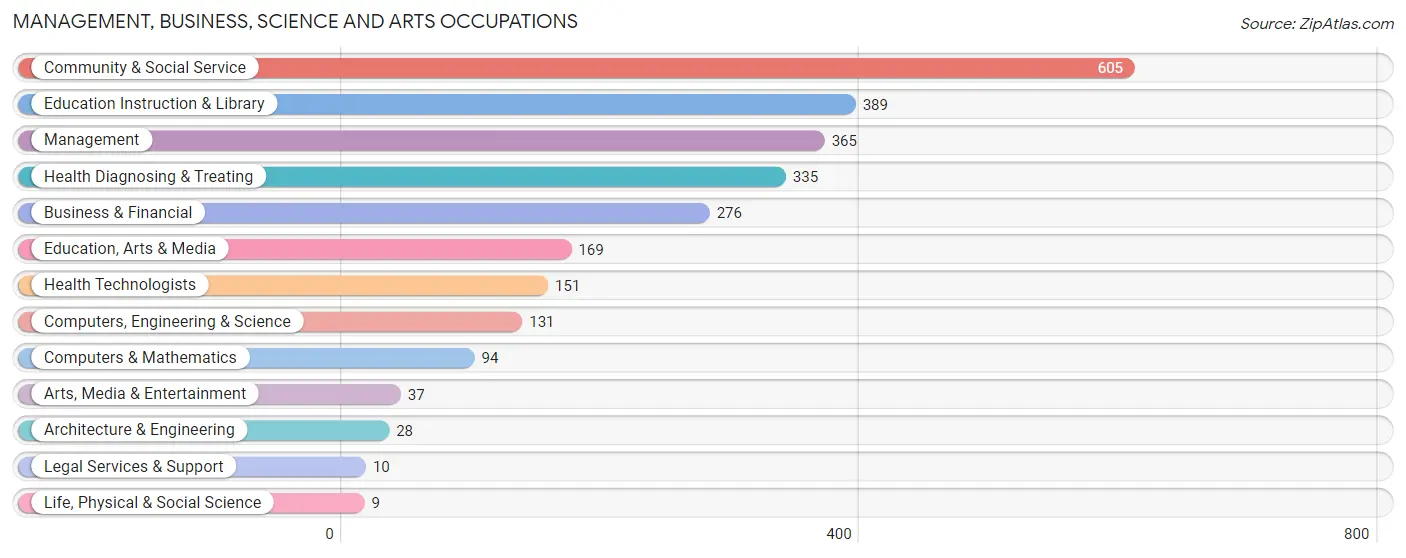
Management, Business, Science and Arts Occupations
The most common Management, Business, Science and Arts occupations in Ashtabula are Community & Social Service (605 | 8.6%), Education Instruction & Library (389 | 5.5%), Management (365 | 5.2%), Health Diagnosing & Treating (335 | 4.8%), and Business & Financial (276 | 3.9%).
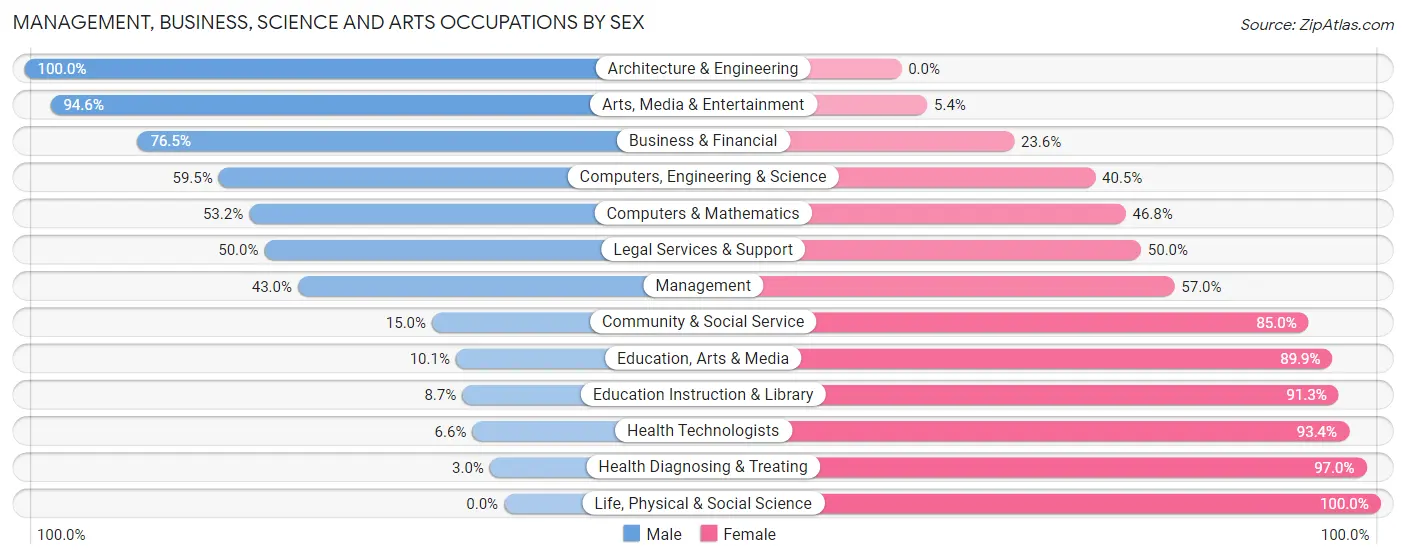
Management, Business, Science and Arts Occupations by Sex
Within the Management, Business, Science and Arts occupations in Ashtabula, the most male-oriented occupations are Architecture & Engineering (100.0%), Arts, Media & Entertainment (94.6%), and Business & Financial (76.4%), while the most female-oriented occupations are Life, Physical & Social Science (100.0%), Health Diagnosing & Treating (97.0%), and Health Technologists (93.4%).
| Occupation | Male | Female |
| Management | 157 (43.0%) | 208 (57.0%) |
| Business & Financial | 211 (76.4%) | 65 (23.5%) |
| Computers, Engineering & Science | 78 (59.5%) | 53 (40.5%) |
| Computers & Mathematics | 50 (53.2%) | 44 (46.8%) |
| Architecture & Engineering | 28 (100.0%) | 0 (0.0%) |
| Life, Physical & Social Science | 0 (0.0%) | 9 (100.0%) |
| Community & Social Service | 91 (15.0%) | 514 (85.0%) |
| Education, Arts & Media | 17 (10.1%) | 152 (89.9%) |
| Legal Services & Support | 5 (50.0%) | 5 (50.0%) |
| Education Instruction & Library | 34 (8.7%) | 355 (91.3%) |
| Arts, Media & Entertainment | 35 (94.6%) | 2 (5.4%) |
| Health Diagnosing & Treating | 10 (3.0%) | 325 (97.0%) |
| Health Technologists | 10 (6.6%) | 141 (93.4%) |
| Total (Category) | 547 (32.0%) | 1,165 (68.0%) |
| Total (Overall) | 3,806 (54.1%) | 3,222 (45.9%) |
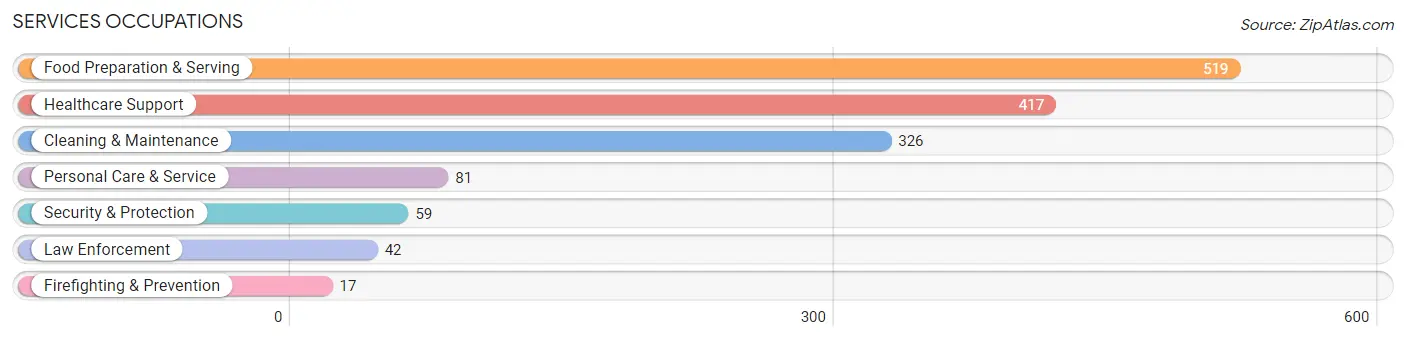
Services Occupations
The most common Services occupations in Ashtabula are Food Preparation & Serving (519 | 7.4%), Healthcare Support (417 | 5.9%), Cleaning & Maintenance (326 | 4.6%), Personal Care & Service (81 | 1.1%), and Security & Protection (59 | 0.8%).
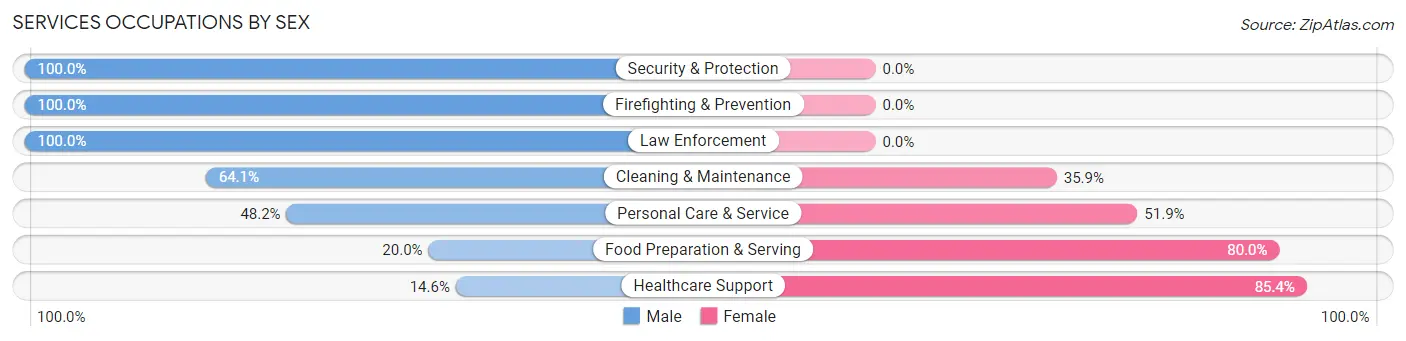
Services Occupations by Sex
Within the Services occupations in Ashtabula, the most male-oriented occupations are Security & Protection (100.0%), Firefighting & Prevention (100.0%), and Law Enforcement (100.0%), while the most female-oriented occupations are Healthcare Support (85.4%), Food Preparation & Serving (80.0%), and Personal Care & Service (51.8%).
| Occupation | Male | Female |
| Healthcare Support | 61 (14.6%) | 356 (85.4%) |
| Security & Protection | 59 (100.0%) | 0 (0.0%) |
| Firefighting & Prevention | 17 (100.0%) | 0 (0.0%) |
| Law Enforcement | 42 (100.0%) | 0 (0.0%) |
| Food Preparation & Serving | 104 (20.0%) | 415 (80.0%) |
| Cleaning & Maintenance | 209 (64.1%) | 117 (35.9%) |
| Personal Care & Service | 39 (48.1%) | 42 (51.8%) |
| Total (Category) | 472 (33.7%) | 930 (66.3%) |
| Total (Overall) | 3,806 (54.1%) | 3,222 (45.9%) |
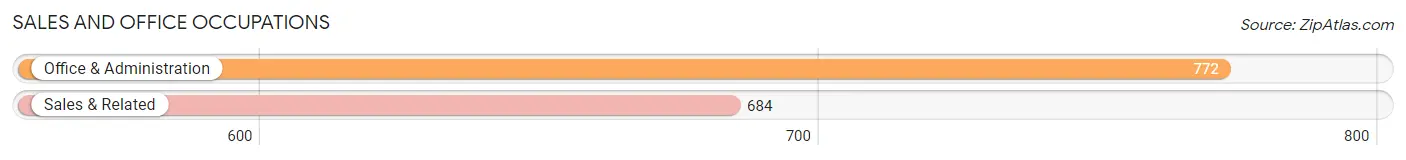
Sales and Office Occupations
The most common Sales and Office occupations in Ashtabula are Office & Administration (772 | 11.0%), and Sales & Related (684 | 9.7%).
Sales and Office Occupations by Sex
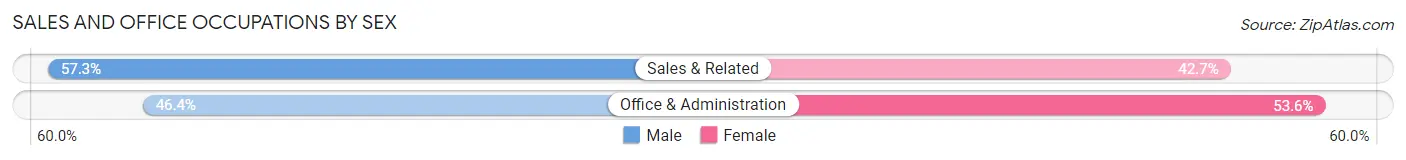
| Occupation | Male | Female |
| Sales & Related | 392 (57.3%) | 292 (42.7%) |
| Office & Administration | 358 (46.4%) | 414 (53.6%) |
| Total (Category) | 750 (51.5%) | 706 (48.5%) |
| Total (Overall) | 3,806 (54.1%) | 3,222 (45.9%) |
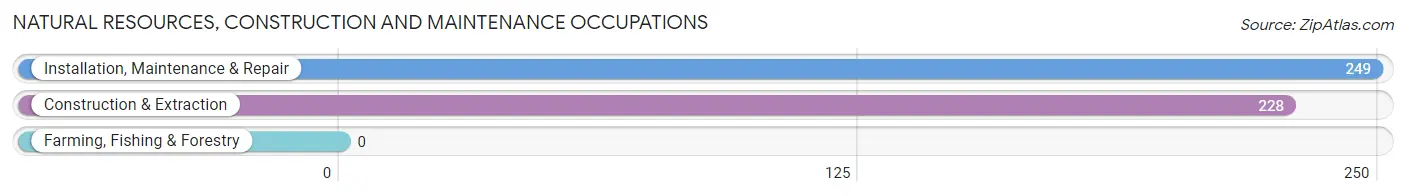
Natural Resources, Construction and Maintenance Occupations
The most common Natural Resources, Construction and Maintenance occupations in Ashtabula are Installation, Maintenance & Repair (249 | 3.5%), and Construction & Extraction (228 | 3.2%).
Natural Resources, Construction and Maintenance Occupations by Sex
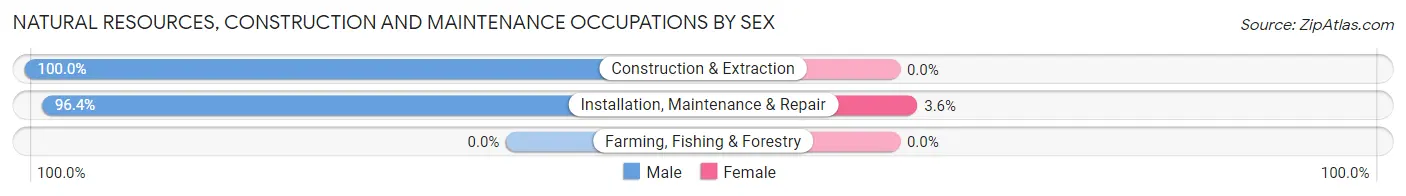
| Occupation | Male | Female |
| Farming, Fishing & Forestry | 0 (0.0%) | 0 (0.0%) |
| Construction & Extraction | 228 (100.0%) | 0 (0.0%) |
| Installation, Maintenance & Repair | 240 (96.4%) | 9 (3.6%) |
| Total (Category) | 468 (98.1%) | 9 (1.9%) |
| Total (Overall) | 3,806 (54.1%) | 3,222 (45.9%) |
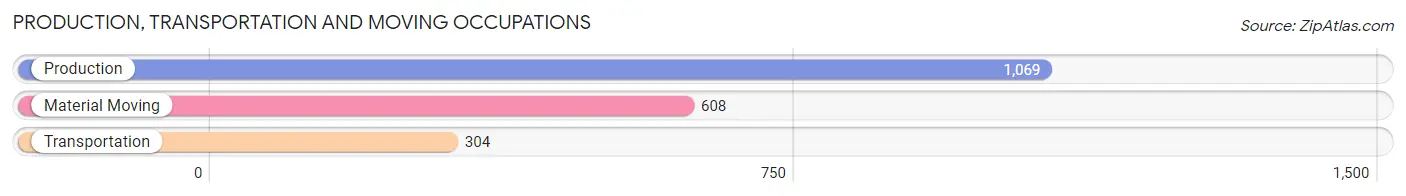
Production, Transportation and Moving Occupations
The most common Production, Transportation and Moving occupations in Ashtabula are Production (1,069 | 15.2%), Material Moving (608 | 8.6%), and Transportation (304 | 4.3%).
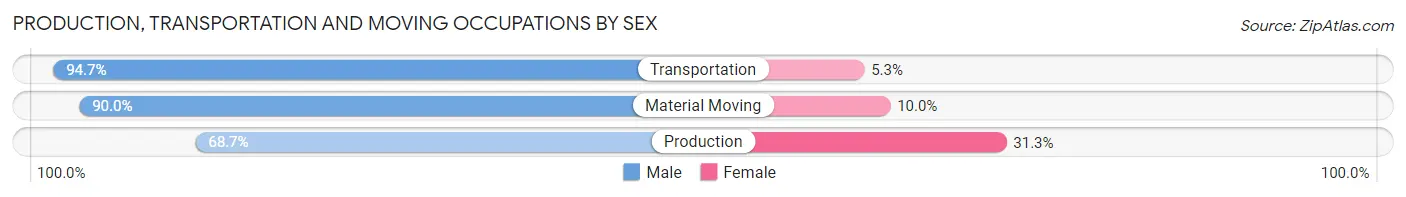
Production, Transportation and Moving Occupations by Sex
| Occupation | Male | Female |
| Production | 734 (68.7%) | 335 (31.3%) |
| Transportation | 288 (94.7%) | 16 (5.3%) |
| Material Moving | 547 (90.0%) | 61 (10.0%) |
| Total (Category) | 1,569 (79.2%) | 412 (20.8%) |
| Total (Overall) | 3,806 (54.1%) | 3,222 (45.9%) |
Employment Industries by Sex in Ashtabula
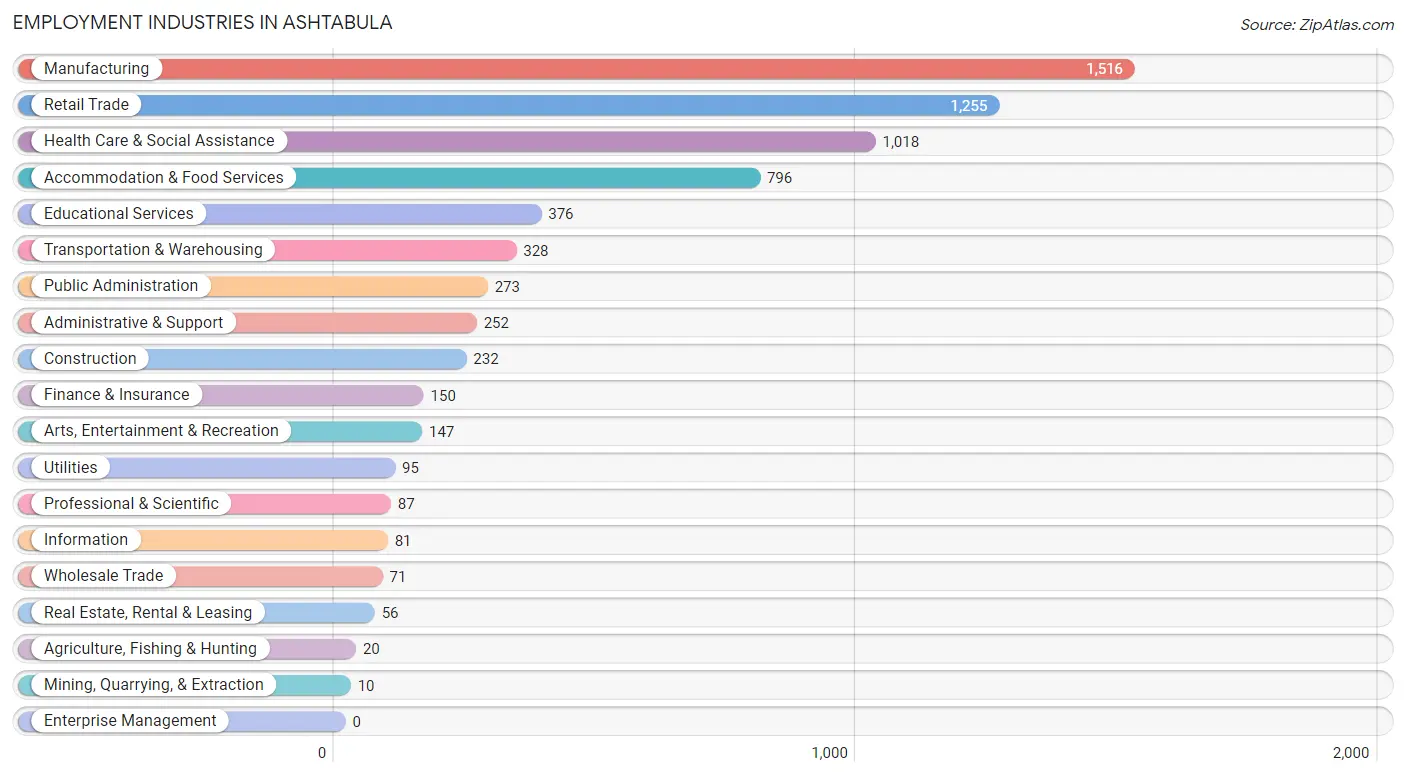
Employment Industries in Ashtabula
The major employment industries in Ashtabula include Manufacturing (1,516 | 21.6%), Retail Trade (1,255 | 17.9%), Health Care & Social Assistance (1,018 | 14.5%), Accommodation & Food Services (796 | 11.3%), and Educational Services (376 | 5.3%).
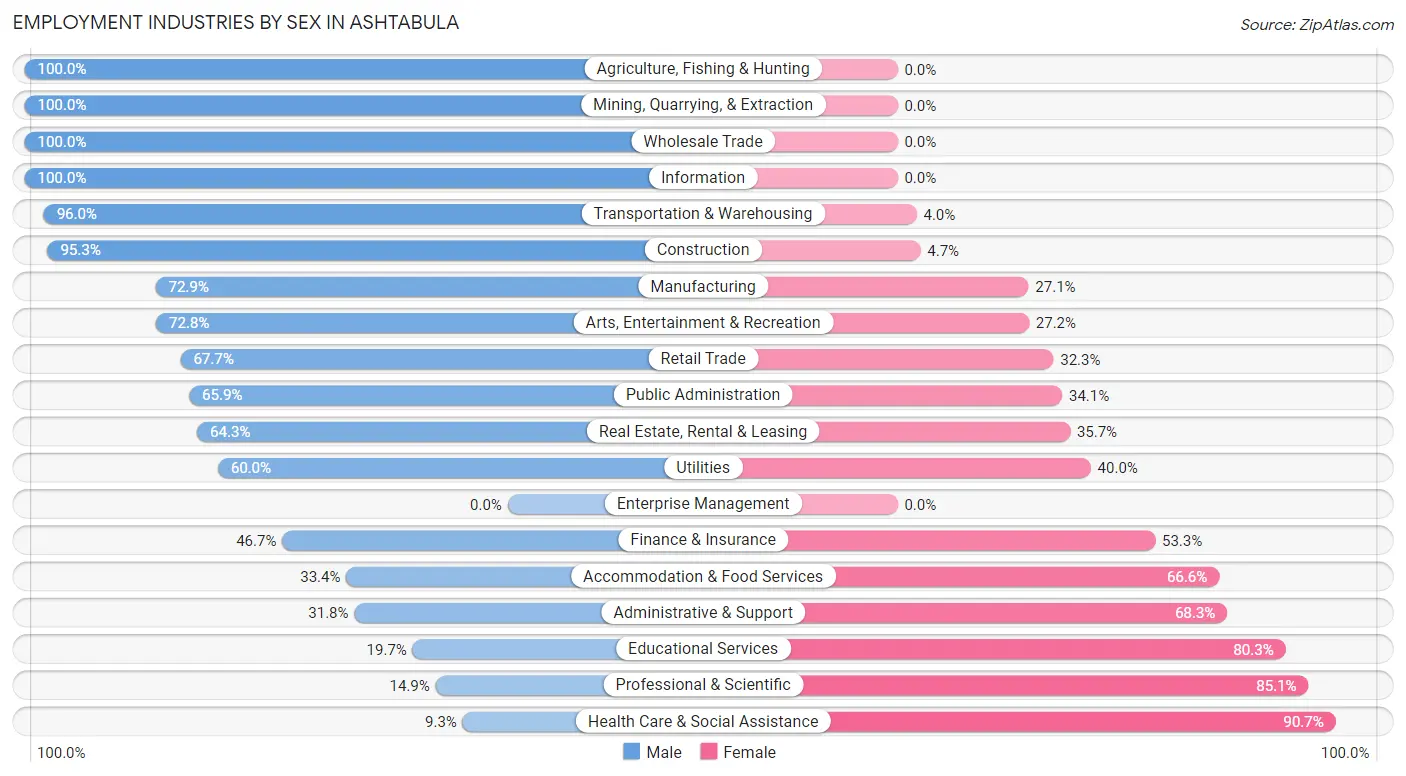
Employment Industries by Sex in Ashtabula
The Ashtabula industries that see more men than women are Agriculture, Fishing & Hunting (100.0%), Mining, Quarrying, & Extraction (100.0%), and Wholesale Trade (100.0%), whereas the industries that tend to have a higher number of women are Health Care & Social Assistance (90.7%), Professional & Scientific (85.1%), and Educational Services (80.3%).
| Industry | Male | Female |
| Agriculture, Fishing & Hunting | 20 (100.0%) | 0 (0.0%) |
| Mining, Quarrying, & Extraction | 10 (100.0%) | 0 (0.0%) |
| Construction | 221 (95.3%) | 11 (4.7%) |
| Manufacturing | 1,105 (72.9%) | 411 (27.1%) |
| Wholesale Trade | 71 (100.0%) | 0 (0.0%) |
| Retail Trade | 850 (67.7%) | 405 (32.3%) |
| Transportation & Warehousing | 315 (96.0%) | 13 (4.0%) |
| Utilities | 57 (60.0%) | 38 (40.0%) |
| Information | 81 (100.0%) | 0 (0.0%) |
| Finance & Insurance | 70 (46.7%) | 80 (53.3%) |
| Real Estate, Rental & Leasing | 36 (64.3%) | 20 (35.7%) |
| Professional & Scientific | 13 (14.9%) | 74 (85.1%) |
| Enterprise Management | 0 (0.0%) | 0 (0.0%) |
| Administrative & Support | 80 (31.8%) | 172 (68.2%) |
| Educational Services | 74 (19.7%) | 302 (80.3%) |
| Health Care & Social Assistance | 95 (9.3%) | 923 (90.7%) |
| Arts, Entertainment & Recreation | 107 (72.8%) | 40 (27.2%) |
| Accommodation & Food Services | 266 (33.4%) | 530 (66.6%) |
| Public Administration | 180 (65.9%) | 93 (34.1%) |
| Total | 3,806 (54.1%) | 3,222 (45.9%) |
Education in Ashtabula
School Enrollment in Ashtabula
The most common levels of schooling among the 3,521 students in Ashtabula are elementary school (912 | 25.9%), middle school (847 | 24.1%), and high school (731 | 20.8%).
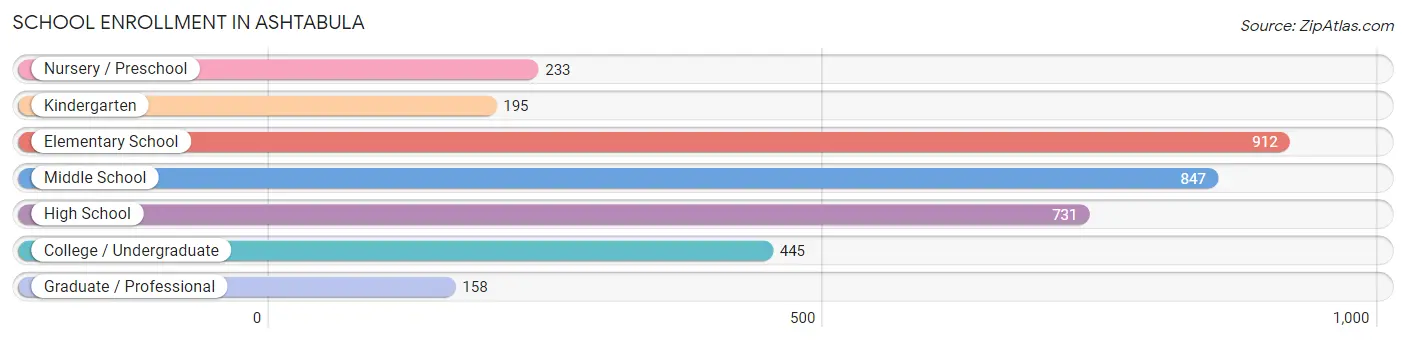
| School Level | # Students | % Students |
| Nursery / Preschool | 233 | 6.6% |
| Kindergarten | 195 | 5.5% |
| Elementary School | 912 | 25.9% |
| Middle School | 847 | 24.1% |
| High School | 731 | 20.8% |
| College / Undergraduate | 445 | 12.6% |
| Graduate / Professional | 158 | 4.5% |
| Total | 3,521 | 100.0% |
School Enrollment by Age by Funding Source in Ashtabula
Out of a total of 3,521 students who are enrolled in schools in Ashtabula, 433 (12.3%) attend a private institution, while the remaining 3,088 (87.7%) are enrolled in public schools. The age group of 3 to 4 year olds has the highest likelihood of being enrolled in private schools, with 70 (46.7% in the age bracket) enrolled. Conversely, the age group of 10 to 14 year olds has the lowest likelihood of being enrolled in a private school, with 1,036 (95.8% in the age bracket) attending a public institution.
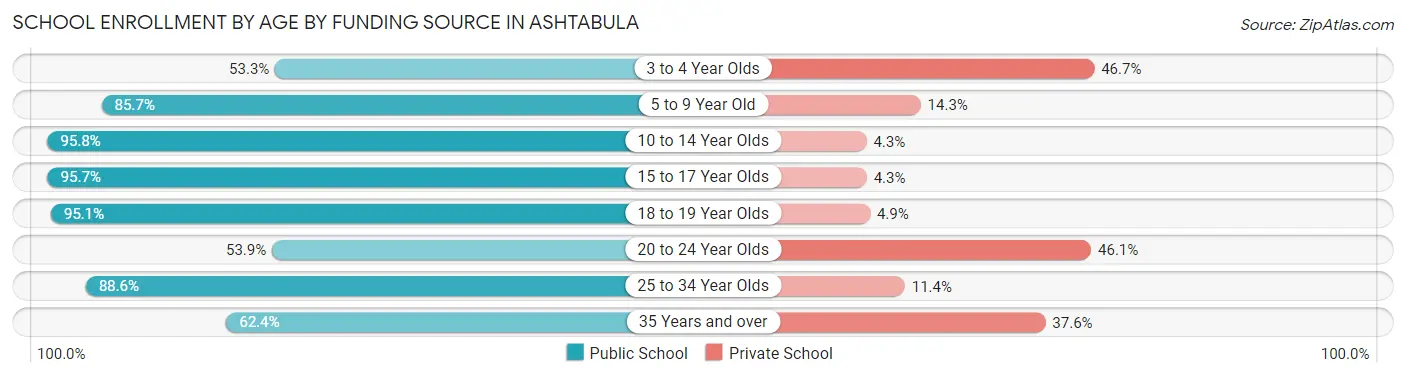
| Age Bracket | Public School | Private School |
| 3 to 4 Year Olds | 80 (53.3%) | 70 (46.7%) |
| 5 to 9 Year Old | 830 (85.7%) | 139 (14.3%) |
| 10 to 14 Year Olds | 1,036 (95.8%) | 46 (4.3%) |
| 15 to 17 Year Olds | 556 (95.7%) | 25 (4.3%) |
| 18 to 19 Year Olds | 214 (95.1%) | 11 (4.9%) |
| 20 to 24 Year Olds | 69 (53.9%) | 59 (46.1%) |
| 25 to 34 Year Olds | 210 (88.6%) | 27 (11.4%) |
| 35 Years and over | 93 (62.4%) | 56 (37.6%) |
| Total | 3,088 (87.7%) | 433 (12.3%) |
Educational Attainment by Field of Study in Ashtabula
Education (355 | 23.4%), business (226 | 14.9%), visual & performing arts (138 | 9.1%), science & technology (130 | 8.6%), and arts & humanities (128 | 8.4%) are the most common fields of study among 1,519 individuals in Ashtabula who have obtained a bachelor's degree or higher.
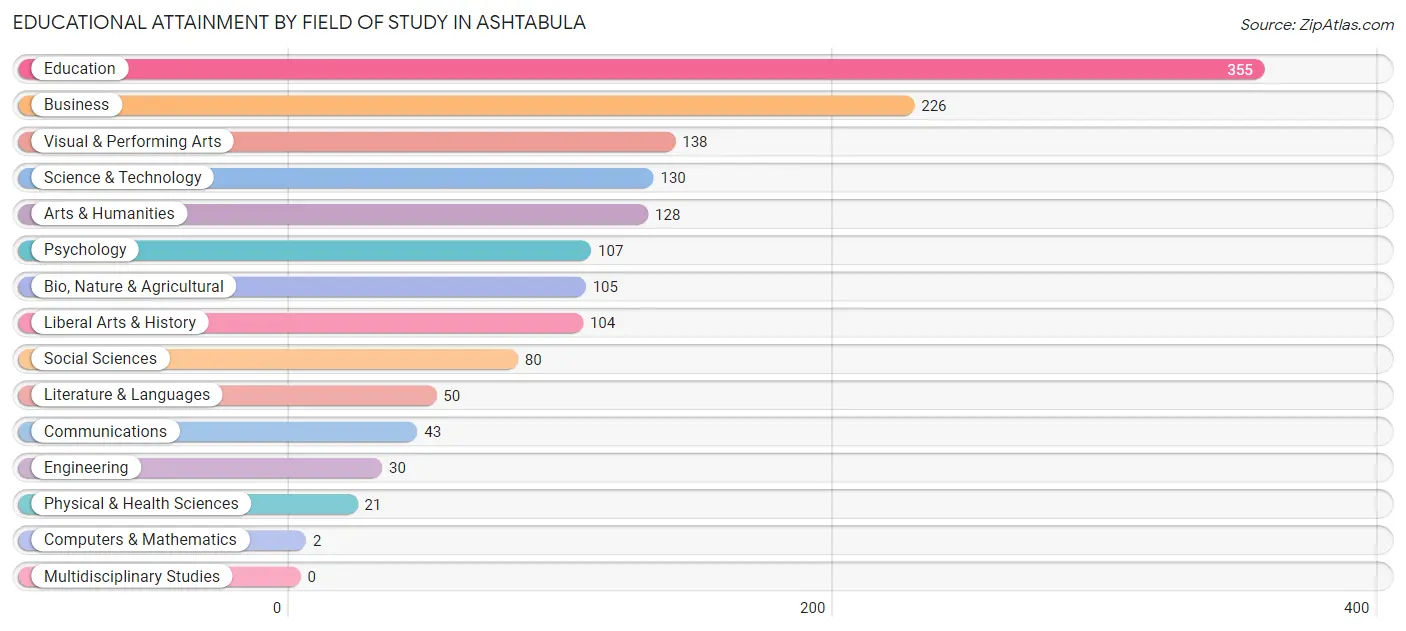
| Field of Study | # Graduates | % Graduates |
| Computers & Mathematics | 2 | 0.1% |
| Bio, Nature & Agricultural | 105 | 6.9% |
| Physical & Health Sciences | 21 | 1.4% |
| Psychology | 107 | 7.0% |
| Social Sciences | 80 | 5.3% |
| Engineering | 30 | 2.0% |
| Multidisciplinary Studies | 0 | 0.0% |
| Science & Technology | 130 | 8.6% |
| Business | 226 | 14.9% |
| Education | 355 | 23.4% |
| Literature & Languages | 50 | 3.3% |
| Liberal Arts & History | 104 | 6.9% |
| Visual & Performing Arts | 138 | 9.1% |
| Communications | 43 | 2.8% |
| Arts & Humanities | 128 | 8.4% |
| Total | 1,519 | 100.0% |
Transportation & Commute in Ashtabula
Vehicle Availability by Sex in Ashtabula
The most prevalent vehicle ownership categories in Ashtabula are males with 2 vehicles (1,708, accounting for 46.9%) and females with 2 vehicles (1,359, making up 54.5%).
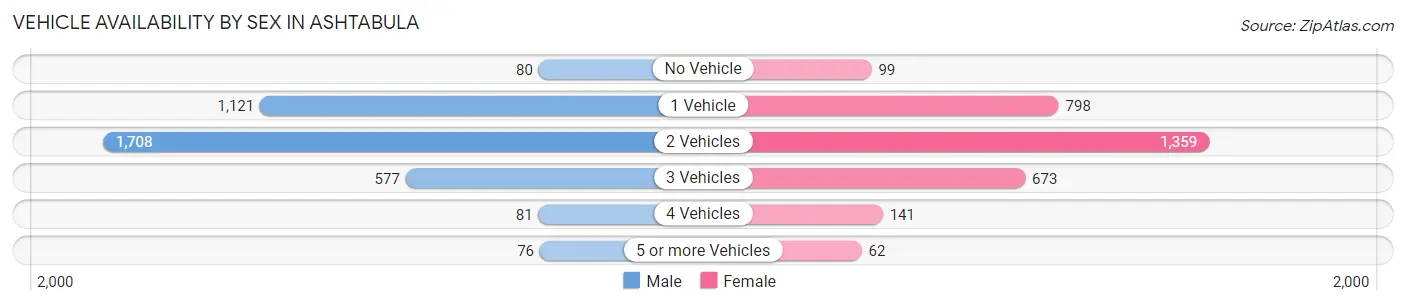
| Vehicles Available | Male | Female |
| No Vehicle | 80 (2.2%) | 99 (3.2%) |
| 1 Vehicle | 1,121 (30.8%) | 798 (25.5%) |
| 2 Vehicles | 1,708 (46.9%) | 1,359 (43.4%) |
| 3 Vehicles | 577 (15.8%) | 673 (21.5%) |
| 4 Vehicles | 81 (2.2%) | 141 (4.5%) |
| 5 or more Vehicles | 76 (2.1%) | 62 (2.0%) |
| Total | 3,643 (100.0%) | 3,132 (100.0%) |
Commute Time in Ashtabula
The most frequently occuring commute durations in Ashtabula are 5 to 9 minutes (1,795 commuters, 26.9%), 10 to 14 minutes (1,147 commuters, 17.2%), and 15 to 19 minutes (1,060 commuters, 15.9%).
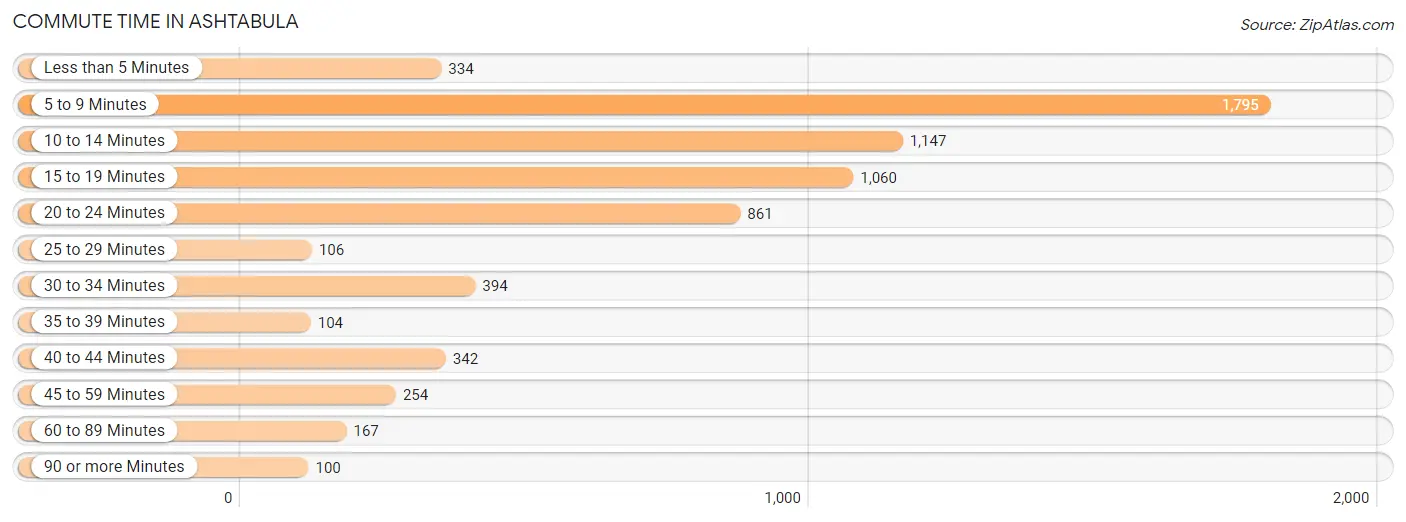
| Commute Time | # Commuters | % Commuters |
| Less than 5 Minutes | 334 | 5.0% |
| 5 to 9 Minutes | 1,795 | 26.9% |
| 10 to 14 Minutes | 1,147 | 17.2% |
| 15 to 19 Minutes | 1,060 | 15.9% |
| 20 to 24 Minutes | 861 | 12.9% |
| 25 to 29 Minutes | 106 | 1.6% |
| 30 to 34 Minutes | 394 | 5.9% |
| 35 to 39 Minutes | 104 | 1.6% |
| 40 to 44 Minutes | 342 | 5.1% |
| 45 to 59 Minutes | 254 | 3.8% |
| 60 to 89 Minutes | 167 | 2.5% |
| 90 or more Minutes | 100 | 1.5% |
Commute Time by Sex in Ashtabula
The most common commute times in Ashtabula are 5 to 9 minutes (856 commuters, 23.9%) for males and 5 to 9 minutes (939 commuters, 30.5%) for females.
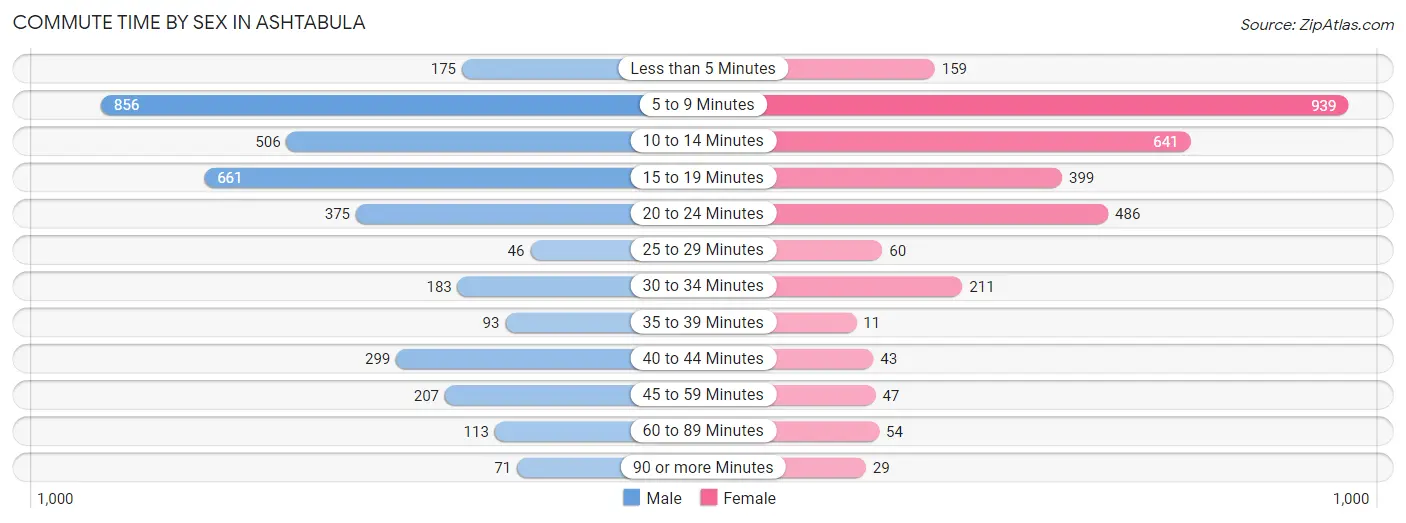
| Commute Time | Male | Female |
| Less than 5 Minutes | 175 (4.9%) | 159 (5.2%) |
| 5 to 9 Minutes | 856 (23.9%) | 939 (30.5%) |
| 10 to 14 Minutes | 506 (14.1%) | 641 (20.8%) |
| 15 to 19 Minutes | 661 (18.4%) | 399 (13.0%) |
| 20 to 24 Minutes | 375 (10.5%) | 486 (15.8%) |
| 25 to 29 Minutes | 46 (1.3%) | 60 (1.9%) |
| 30 to 34 Minutes | 183 (5.1%) | 211 (6.9%) |
| 35 to 39 Minutes | 93 (2.6%) | 11 (0.4%) |
| 40 to 44 Minutes | 299 (8.3%) | 43 (1.4%) |
| 45 to 59 Minutes | 207 (5.8%) | 47 (1.5%) |
| 60 to 89 Minutes | 113 (3.2%) | 54 (1.8%) |
| 90 or more Minutes | 71 (2.0%) | 29 (0.9%) |
Time of Departure to Work by Sex in Ashtabula
The most frequent times of departure to work in Ashtabula are 12:00 PM to 3:59 PM (430, 12.0%) for males and 7:00 AM to 7:29 AM (518, 16.8%) for females.
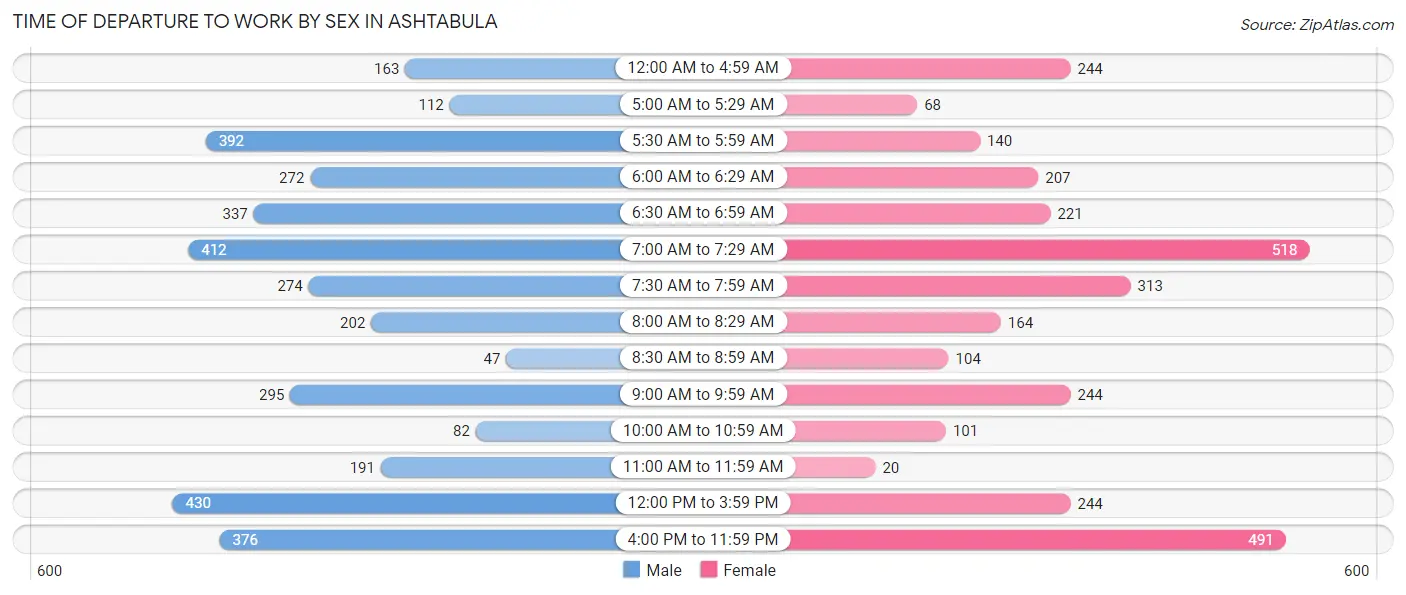
| Time of Departure | Male | Female |
| 12:00 AM to 4:59 AM | 163 (4.5%) | 244 (7.9%) |
| 5:00 AM to 5:29 AM | 112 (3.1%) | 68 (2.2%) |
| 5:30 AM to 5:59 AM | 392 (10.9%) | 140 (4.5%) |
| 6:00 AM to 6:29 AM | 272 (7.6%) | 207 (6.7%) |
| 6:30 AM to 6:59 AM | 337 (9.4%) | 221 (7.2%) |
| 7:00 AM to 7:29 AM | 412 (11.5%) | 518 (16.8%) |
| 7:30 AM to 7:59 AM | 274 (7.6%) | 313 (10.2%) |
| 8:00 AM to 8:29 AM | 202 (5.6%) | 164 (5.3%) |
| 8:30 AM to 8:59 AM | 47 (1.3%) | 104 (3.4%) |
| 9:00 AM to 9:59 AM | 295 (8.2%) | 244 (7.9%) |
| 10:00 AM to 10:59 AM | 82 (2.3%) | 101 (3.3%) |
| 11:00 AM to 11:59 AM | 191 (5.3%) | 20 (0.6%) |
| 12:00 PM to 3:59 PM | 430 (12.0%) | 244 (7.9%) |
| 4:00 PM to 11:59 PM | 376 (10.5%) | 491 (16.0%) |
| Total | 3,585 (100.0%) | 3,079 (100.0%) |
Housing Occupancy in Ashtabula
Occupancy by Ownership in Ashtabula
Of the total 7,666 dwellings in Ashtabula, owner-occupied units account for 4,060 (53.0%), while renter-occupied units make up 3,606 (47.0%).
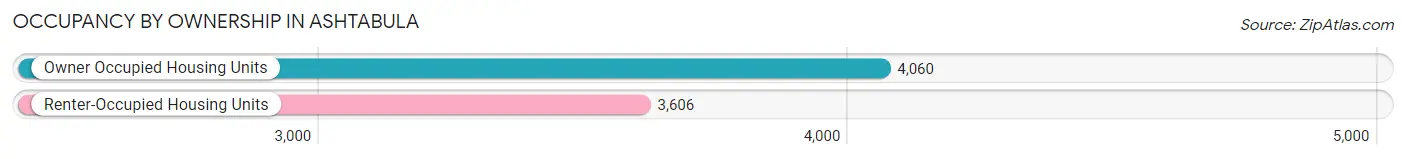
| Occupancy | # Housing Units | % Housing Units |
| Owner Occupied Housing Units | 4,060 | 53.0% |
| Renter-Occupied Housing Units | 3,606 | 47.0% |
| Total Occupied Housing Units | 7,666 | 100.0% |
Occupancy by Household Size in Ashtabula
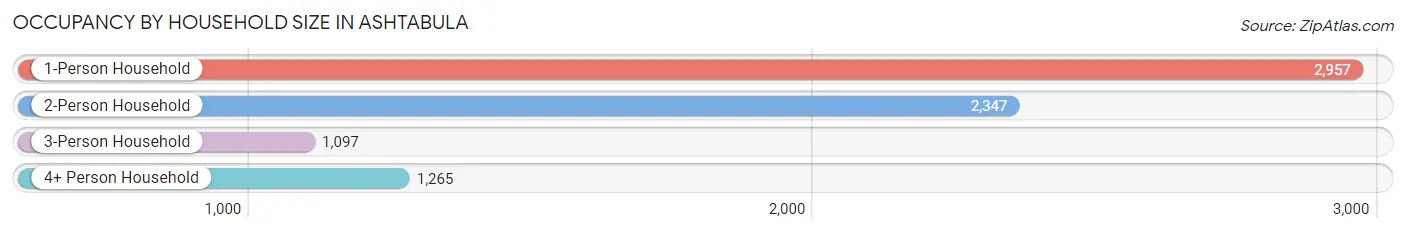
| Household Size | # Housing Units | % Housing Units |
| 1-Person Household | 2,957 | 38.6% |
| 2-Person Household | 2,347 | 30.6% |
| 3-Person Household | 1,097 | 14.3% |
| 4+ Person Household | 1,265 | 16.5% |
| Total Housing Units | 7,666 | 100.0% |
Occupancy by Ownership by Household Size in Ashtabula
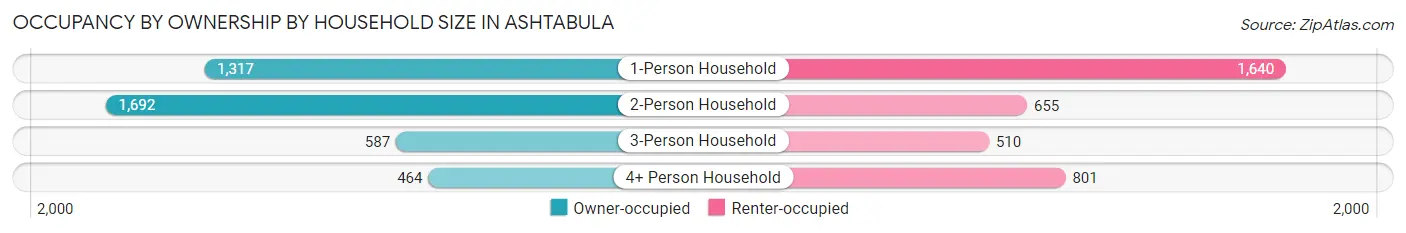
| Household Size | Owner-occupied | Renter-occupied |
| 1-Person Household | 1,317 (44.5%) | 1,640 (55.5%) |
| 2-Person Household | 1,692 (72.1%) | 655 (27.9%) |
| 3-Person Household | 587 (53.5%) | 510 (46.5%) |
| 4+ Person Household | 464 (36.7%) | 801 (63.3%) |
| Total Housing Units | 4,060 (53.0%) | 3,606 (47.0%) |
Occupancy by Educational Attainment in Ashtabula
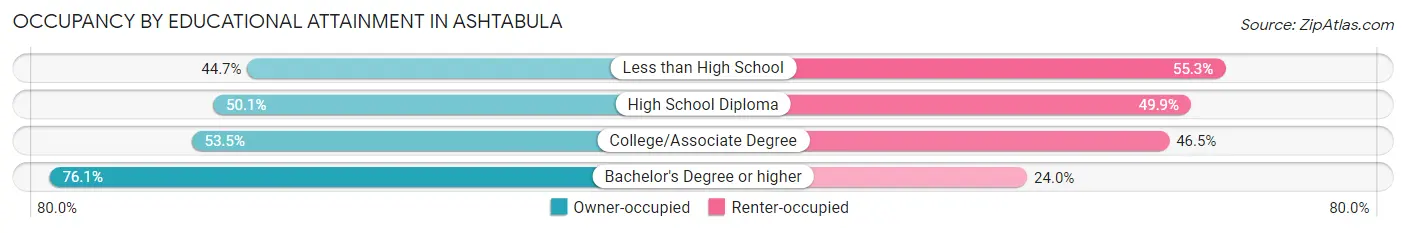
| Household Size | Owner-occupied | Renter-occupied |
| Less than High School | 566 (44.7%) | 701 (55.3%) |
| High School Diploma | 1,733 (50.1%) | 1,727 (49.9%) |
| College/Associate Degree | 1,126 (53.5%) | 978 (46.5%) |
| Bachelor's Degree or higher | 635 (76.0%) | 200 (23.9%) |
Occupancy by Age of Householder in Ashtabula
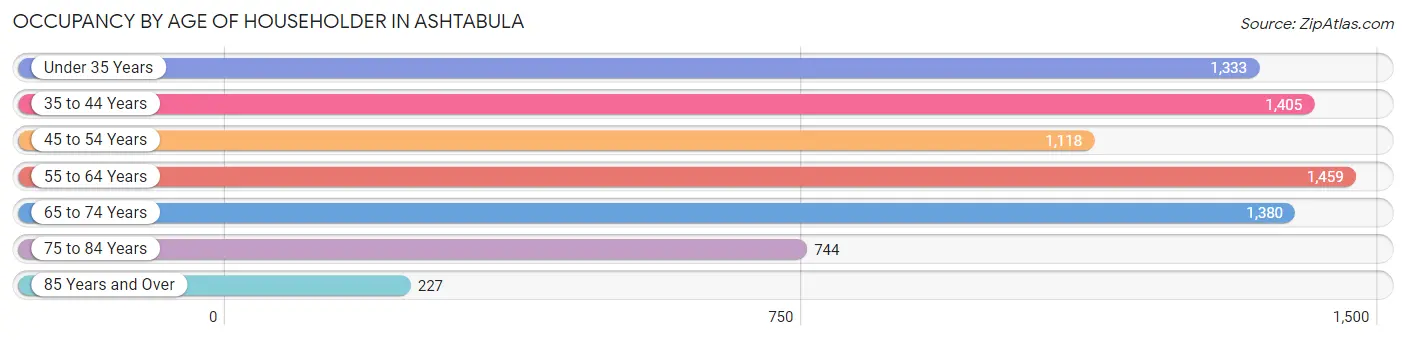
| Age Bracket | # Households | % Households |
| Under 35 Years | 1,333 | 17.4% |
| 35 to 44 Years | 1,405 | 18.3% |
| 45 to 54 Years | 1,118 | 14.6% |
| 55 to 64 Years | 1,459 | 19.0% |
| 65 to 74 Years | 1,380 | 18.0% |
| 75 to 84 Years | 744 | 9.7% |
| 85 Years and Over | 227 | 3.0% |
| Total | 7,666 | 100.0% |
Housing Finances in Ashtabula
Median Income by Occupancy in Ashtabula
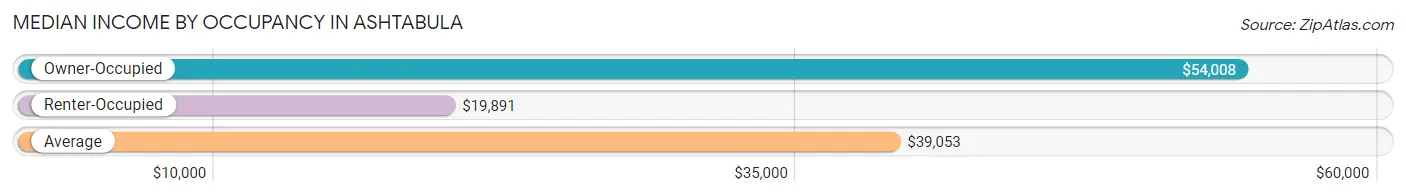
| Occupancy Type | # Households | Median Income |
| Owner-Occupied | 4,060 (53.0%) | $54,008 |
| Renter-Occupied | 3,606 (47.0%) | $19,891 |
| Average | 7,666 (100.0%) | $39,053 |
Occupancy by Householder Income Bracket in Ashtabula
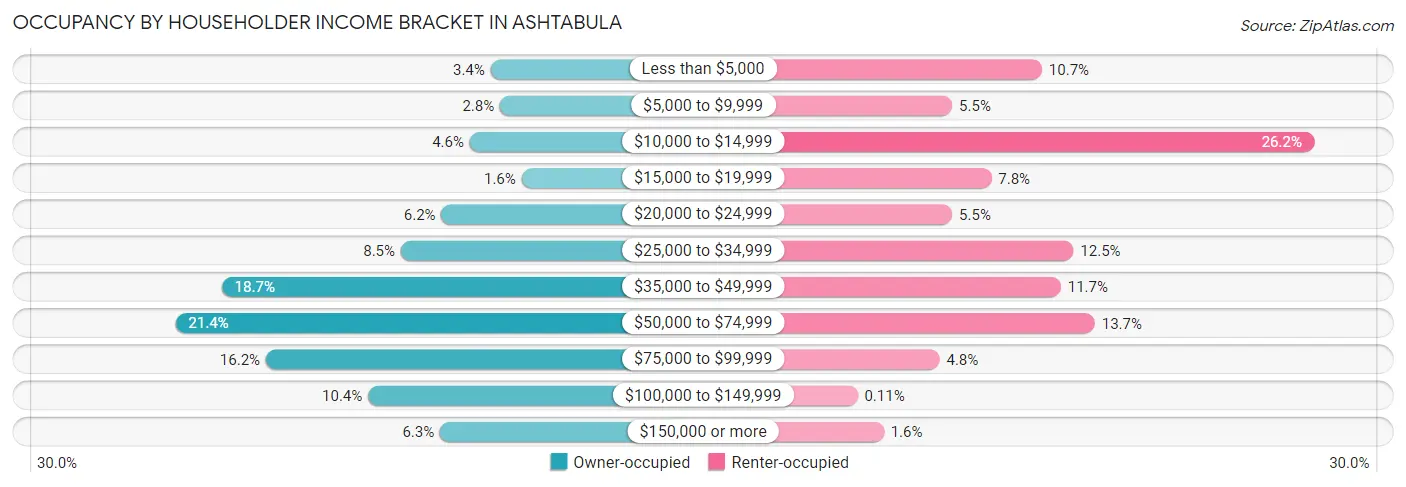
| Income Bracket | Owner-occupied | Renter-occupied |
| Less than $5,000 | 137 (3.4%) | 384 (10.6%) |
| $5,000 to $9,999 | 115 (2.8%) | 199 (5.5%) |
| $10,000 to $14,999 | 185 (4.6%) | 944 (26.2%) |
| $15,000 to $19,999 | 65 (1.6%) | 280 (7.8%) |
| $20,000 to $24,999 | 251 (6.2%) | 199 (5.5%) |
| $25,000 to $34,999 | 345 (8.5%) | 449 (12.4%) |
| $35,000 to $49,999 | 761 (18.7%) | 423 (11.7%) |
| $50,000 to $74,999 | 868 (21.4%) | 493 (13.7%) |
| $75,000 to $99,999 | 658 (16.2%) | 173 (4.8%) |
| $100,000 to $149,999 | 421 (10.4%) | 4 (0.1%) |
| $150,000 or more | 254 (6.3%) | 58 (1.6%) |
| Total | 4,060 (100.0%) | 3,606 (100.0%) |
Monthly Housing Cost Tiers in Ashtabula
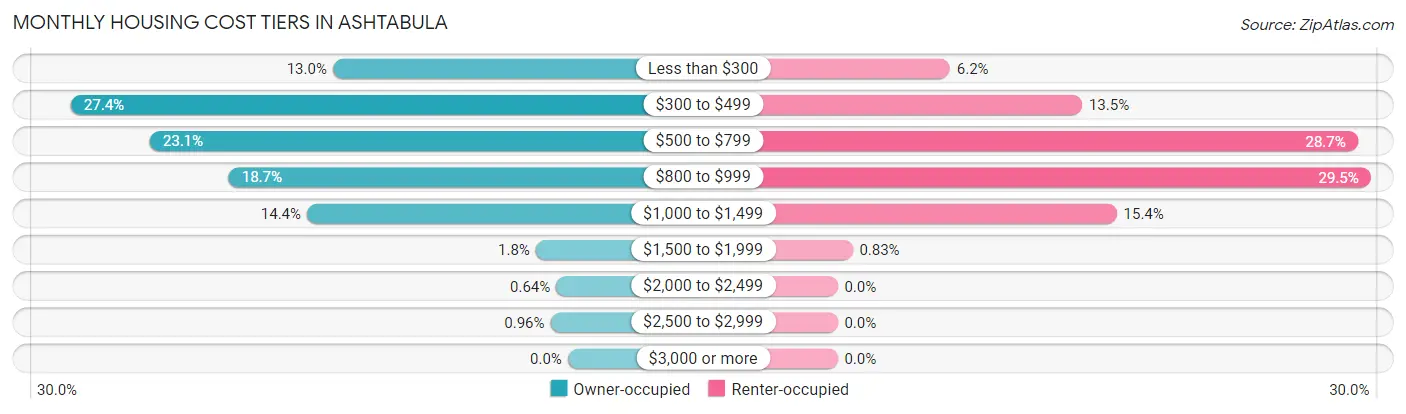
| Monthly Cost | Owner-occupied | Renter-occupied |
| Less than $300 | 527 (13.0%) | 224 (6.2%) |
| $300 to $499 | 1,114 (27.4%) | 487 (13.5%) |
| $500 to $799 | 937 (23.1%) | 1,036 (28.7%) |
| $800 to $999 | 760 (18.7%) | 1,062 (29.4%) |
| $1,000 to $1,499 | 585 (14.4%) | 556 (15.4%) |
| $1,500 to $1,999 | 72 (1.8%) | 30 (0.8%) |
| $2,000 to $2,499 | 26 (0.6%) | 0 (0.0%) |
| $2,500 to $2,999 | 39 (1.0%) | 0 (0.0%) |
| $3,000 or more | 0 (0.0%) | 0 (0.0%) |
| Total | 4,060 (100.0%) | 3,606 (100.0%) |
Physical Housing Characteristics in Ashtabula
Housing Structures in Ashtabula
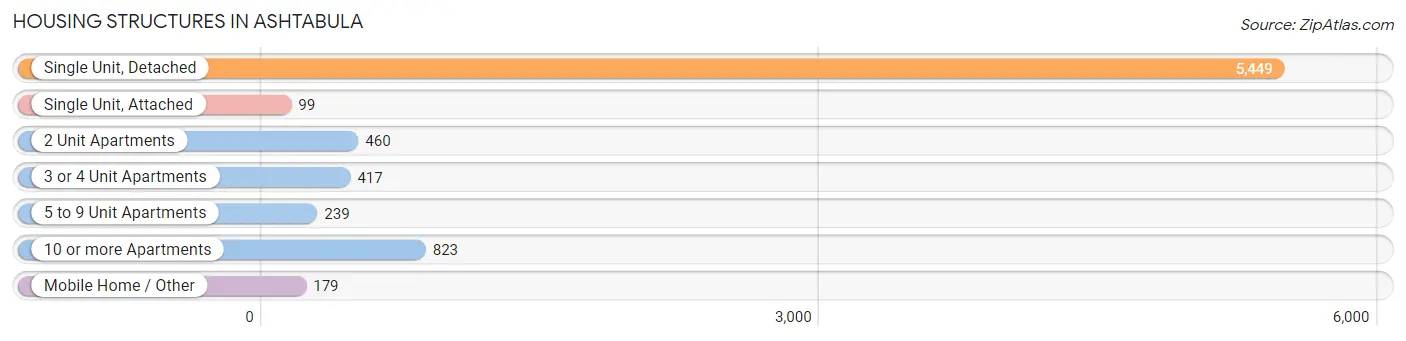
| Structure Type | # Housing Units | % Housing Units |
| Single Unit, Detached | 5,449 | 71.1% |
| Single Unit, Attached | 99 | 1.3% |
| 2 Unit Apartments | 460 | 6.0% |
| 3 or 4 Unit Apartments | 417 | 5.4% |
| 5 to 9 Unit Apartments | 239 | 3.1% |
| 10 or more Apartments | 823 | 10.7% |
| Mobile Home / Other | 179 | 2.3% |
| Total | 7,666 | 100.0% |
Housing Structures by Occupancy in Ashtabula
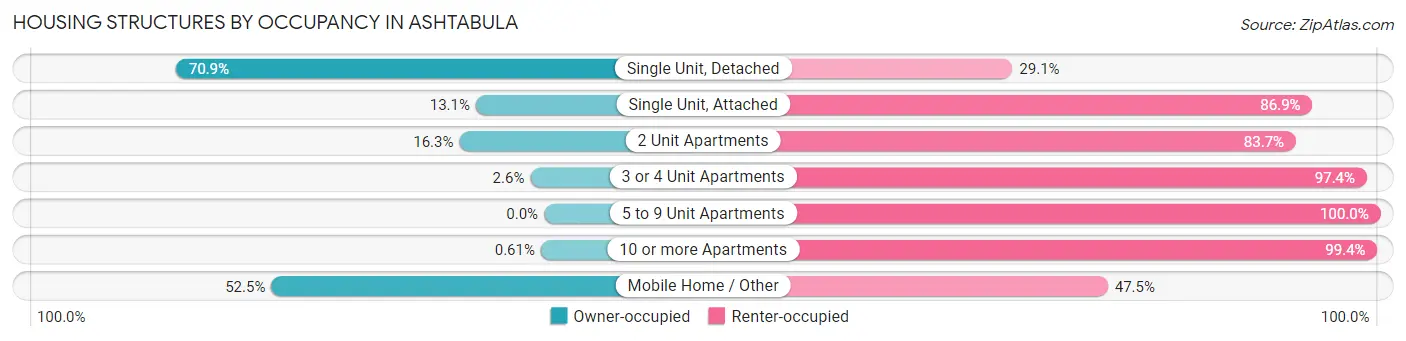
| Structure Type | Owner-occupied | Renter-occupied |
| Single Unit, Detached | 3,862 (70.9%) | 1,587 (29.1%) |
| Single Unit, Attached | 13 (13.1%) | 86 (86.9%) |
| 2 Unit Apartments | 75 (16.3%) | 385 (83.7%) |
| 3 or 4 Unit Apartments | 11 (2.6%) | 406 (97.4%) |
| 5 to 9 Unit Apartments | 0 (0.0%) | 239 (100.0%) |
| 10 or more Apartments | 5 (0.6%) | 818 (99.4%) |
| Mobile Home / Other | 94 (52.5%) | 85 (47.5%) |
| Total | 4,060 (53.0%) | 3,606 (47.0%) |
Housing Structures by Number of Rooms in Ashtabula
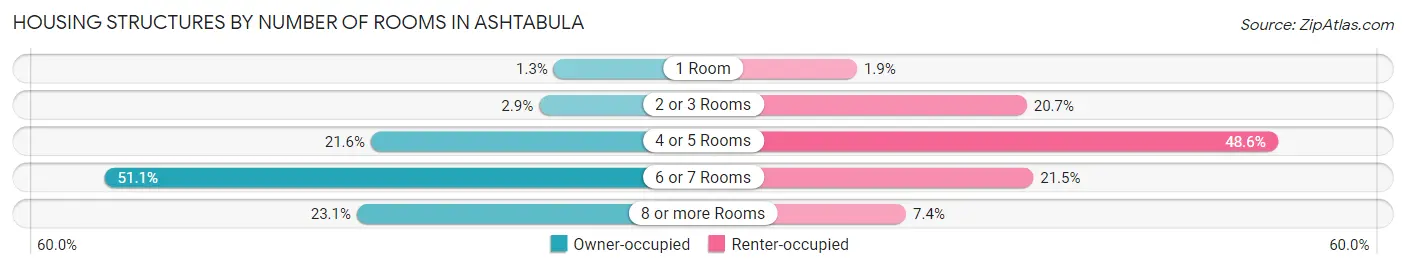
| Number of Rooms | Owner-occupied | Renter-occupied |
| 1 Room | 52 (1.3%) | 68 (1.9%) |
| 2 or 3 Rooms | 118 (2.9%) | 748 (20.7%) |
| 4 or 5 Rooms | 876 (21.6%) | 1,751 (48.6%) |
| 6 or 7 Rooms | 2,075 (51.1%) | 774 (21.5%) |
| 8 or more Rooms | 939 (23.1%) | 265 (7.3%) |
| Total | 4,060 (100.0%) | 3,606 (100.0%) |
Housing Structure by Heating Type in Ashtabula
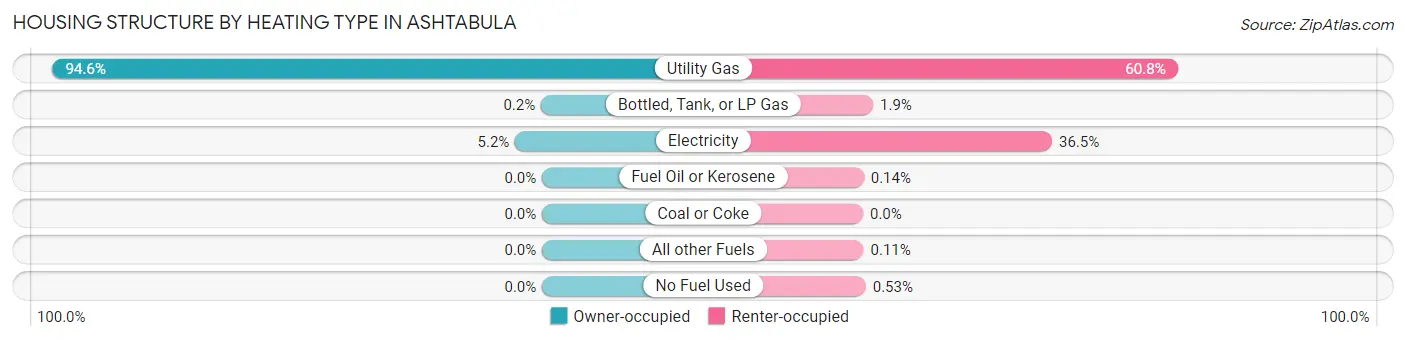
| Heating Type | Owner-occupied | Renter-occupied |
| Utility Gas | 3,841 (94.6%) | 2,191 (60.8%) |
| Bottled, Tank, or LP Gas | 8 (0.2%) | 70 (1.9%) |
| Electricity | 211 (5.2%) | 1,317 (36.5%) |
| Fuel Oil or Kerosene | 0 (0.0%) | 5 (0.1%) |
| Coal or Coke | 0 (0.0%) | 0 (0.0%) |
| All other Fuels | 0 (0.0%) | 4 (0.1%) |
| No Fuel Used | 0 (0.0%) | 19 (0.5%) |
| Total | 4,060 (100.0%) | 3,606 (100.0%) |
Household Vehicle Usage in Ashtabula
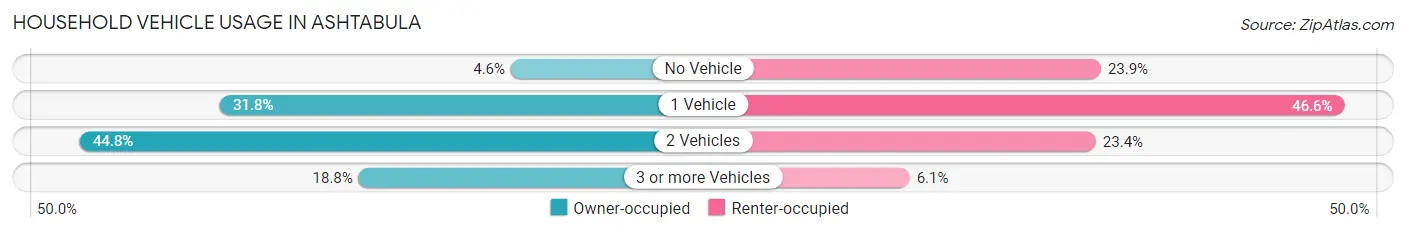
| Vehicles per Household | Owner-occupied | Renter-occupied |
| No Vehicle | 187 (4.6%) | 862 (23.9%) |
| 1 Vehicle | 1,289 (31.8%) | 1,681 (46.6%) |
| 2 Vehicles | 1,820 (44.8%) | 845 (23.4%) |
| 3 or more Vehicles | 764 (18.8%) | 218 (6.0%) |
| Total | 4,060 (100.0%) | 3,606 (100.0%) |
Real Estate & Mortgages in Ashtabula
Real Estate and Mortgage Overview in Ashtabula
| Characteristic | Without Mortgage | With Mortgage |
| Housing Units | 2,085 | 1,975 |
| Median Property Value | $87,800 | $98,200 |
| Median Household Income | $48,991 | $175 |
| Monthly Housing Costs | $414 | $0 |
| Real Estate Taxes | $1,146 | $36 |
Property Value by Mortgage Status in Ashtabula
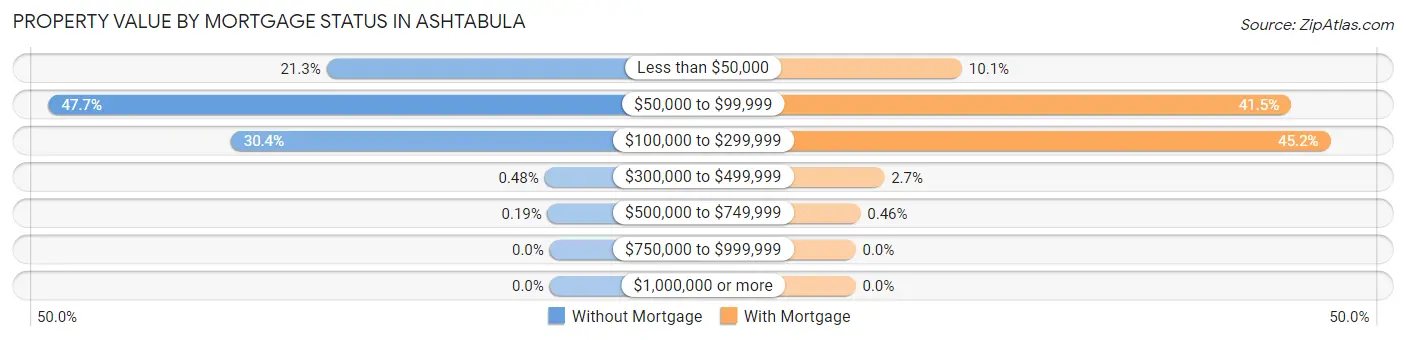
| Property Value | Without Mortgage | With Mortgage |
| Less than $50,000 | 443 (21.2%) | 200 (10.1%) |
| $50,000 to $99,999 | 995 (47.7%) | 819 (41.5%) |
| $100,000 to $299,999 | 633 (30.4%) | 893 (45.2%) |
| $300,000 to $499,999 | 10 (0.5%) | 54 (2.7%) |
| $500,000 to $749,999 | 4 (0.2%) | 9 (0.5%) |
| $750,000 to $999,999 | 0 (0.0%) | 0 (0.0%) |
| $1,000,000 or more | 0 (0.0%) | 0 (0.0%) |
| Total | 2,085 (100.0%) | 1,975 (100.0%) |
Household Income by Mortgage Status in Ashtabula
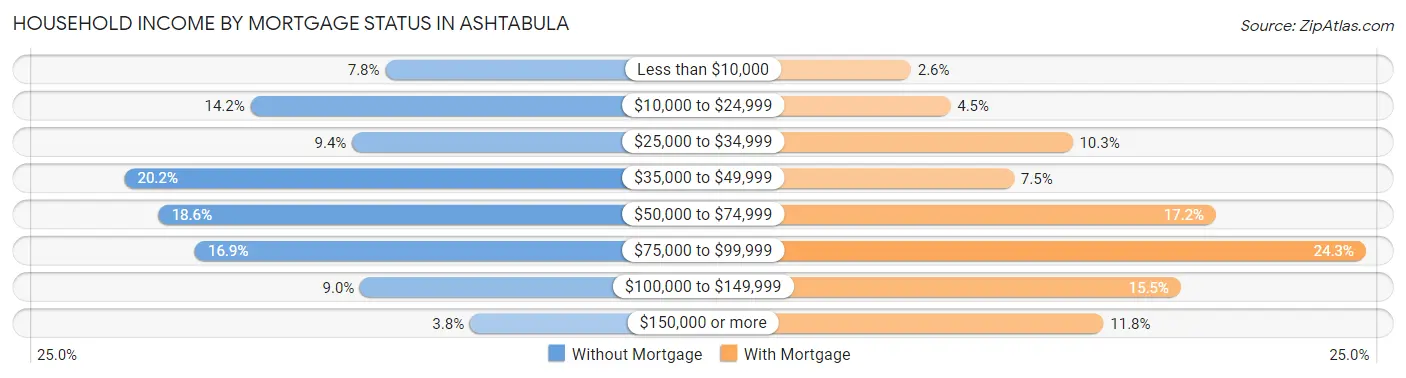
| Household Income | Without Mortgage | With Mortgage |
| Less than $10,000 | 163 (7.8%) | 52 (2.6%) |
| $10,000 to $24,999 | 297 (14.2%) | 89 (4.5%) |
| $25,000 to $34,999 | 196 (9.4%) | 204 (10.3%) |
| $35,000 to $49,999 | 422 (20.2%) | 149 (7.5%) |
| $50,000 to $74,999 | 388 (18.6%) | 339 (17.2%) |
| $75,000 to $99,999 | 352 (16.9%) | 480 (24.3%) |
| $100,000 to $149,999 | 188 (9.0%) | 306 (15.5%) |
| $150,000 or more | 79 (3.8%) | 233 (11.8%) |
| Total | 2,085 (100.0%) | 1,975 (100.0%) |
Property Value to Household Income Ratio in Ashtabula
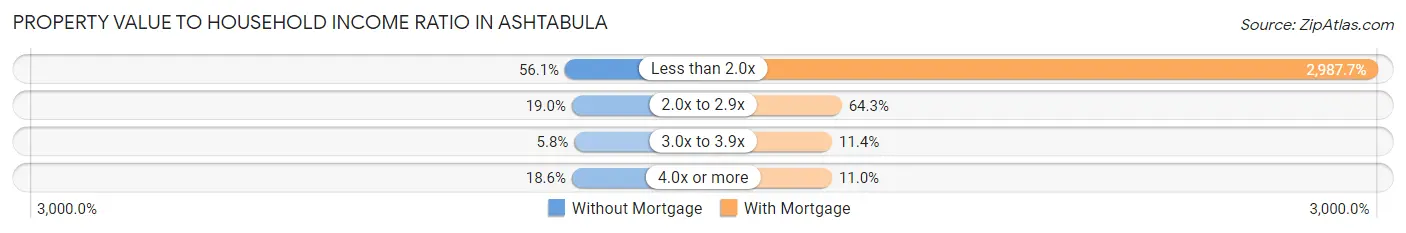
| Value-to-Income Ratio | Without Mortgage | With Mortgage |
| Less than 2.0x | 1,169 (56.1%) | 59,007 (2,987.7%) |
| 2.0x to 2.9x | 396 (19.0%) | 1,270 (64.3%) |
| 3.0x to 3.9x | 120 (5.8%) | 225 (11.4%) |
| 4.0x or more | 387 (18.6%) | 218 (11.0%) |
| Total | 2,085 (100.0%) | 1,975 (100.0%) |
Real Estate Taxes by Mortgage Status in Ashtabula
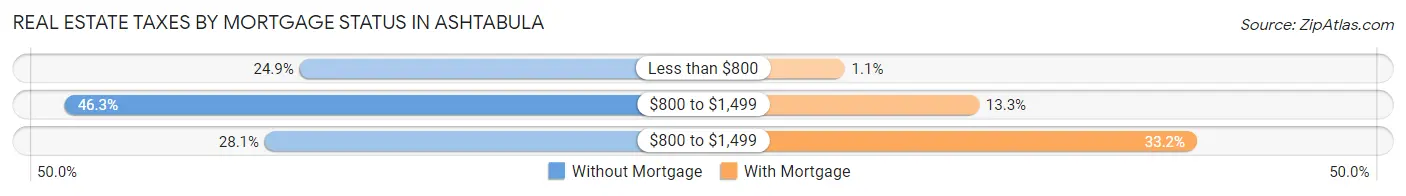
| Property Taxes | Without Mortgage | With Mortgage |
| Less than $800 | 519 (24.9%) | 21 (1.1%) |
| $800 to $1,499 | 966 (46.3%) | 263 (13.3%) |
| $800 to $1,499 | 585 (28.1%) | 656 (33.2%) |
| Total | 2,085 (100.0%) | 1,975 (100.0%) |
Health & Disability in Ashtabula
Health Insurance Coverage by Age in Ashtabula
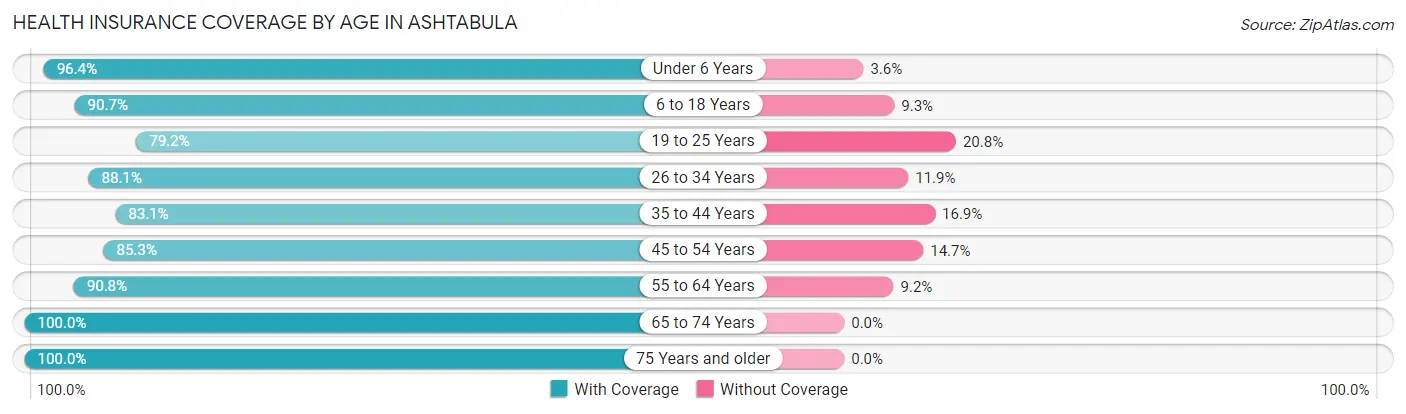
| Age Bracket | With Coverage | Without Coverage |
| Under 6 Years | 1,352 (96.4%) | 50 (3.6%) |
| 6 to 18 Years | 2,614 (90.7%) | 269 (9.3%) |
| 19 to 25 Years | 1,102 (79.2%) | 290 (20.8%) |
| 26 to 34 Years | 1,933 (88.1%) | 262 (11.9%) |
| 35 to 44 Years | 1,983 (83.1%) | 404 (16.9%) |
| 45 to 54 Years | 1,795 (85.3%) | 310 (14.7%) |
| 55 to 64 Years | 1,947 (90.8%) | 197 (9.2%) |
| 65 to 74 Years | 1,898 (100.0%) | 0 (0.0%) |
| 75 Years and older | 1,346 (100.0%) | 0 (0.0%) |
| Total | 15,970 (90.0%) | 1,782 (10.0%) |
Health Insurance Coverage by Citizenship Status in Ashtabula
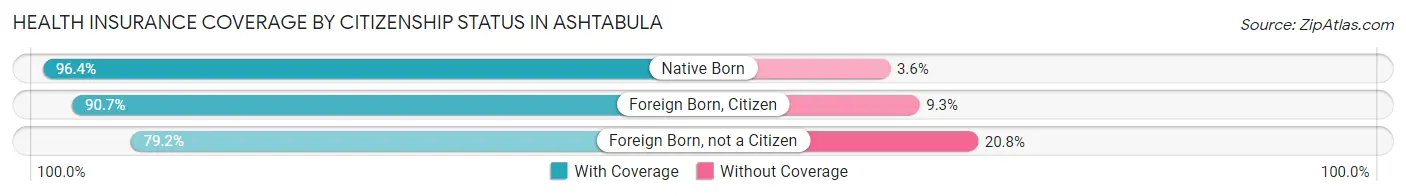
| Citizenship Status | With Coverage | Without Coverage |
| Native Born | 1,352 (96.4%) | 50 (3.6%) |
| Foreign Born, Citizen | 2,614 (90.7%) | 269 (9.3%) |
| Foreign Born, not a Citizen | 1,102 (79.2%) | 290 (20.8%) |
Health Insurance Coverage by Household Income in Ashtabula
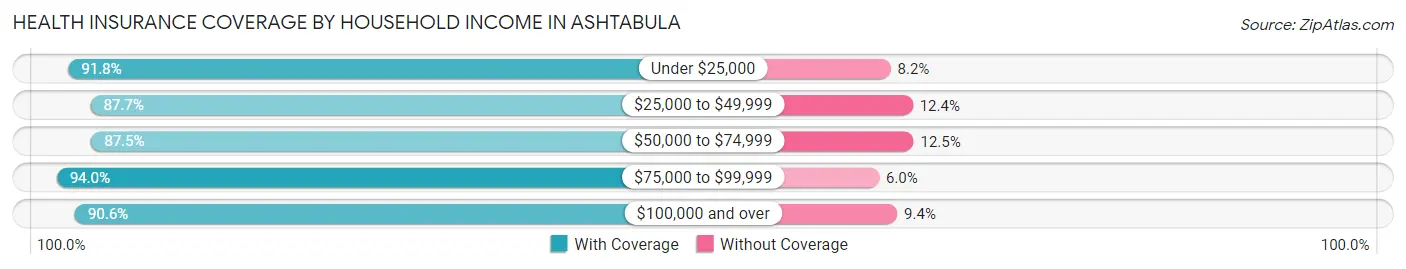
| Household Income | With Coverage | Without Coverage |
| Under $25,000 | 4,317 (91.8%) | 386 (8.2%) |
| $25,000 to $49,999 | 4,569 (87.6%) | 644 (12.3%) |
| $50,000 to $74,999 | 2,882 (87.5%) | 412 (12.5%) |
| $75,000 to $99,999 | 2,433 (94.0%) | 156 (6.0%) |
| $100,000 and over | 1,719 (90.6%) | 179 (9.4%) |
Public vs Private Health Insurance Coverage by Age in Ashtabula
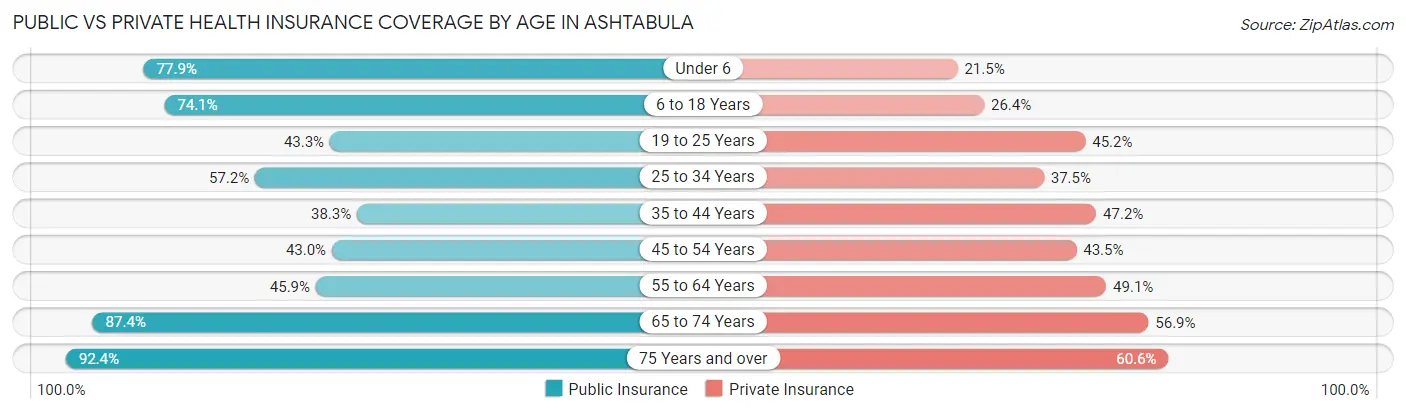
| Age Bracket | Public Insurance | Private Insurance |
| Under 6 | 1,092 (77.9%) | 301 (21.5%) |
| 6 to 18 Years | 2,135 (74.1%) | 761 (26.4%) |
| 19 to 25 Years | 603 (43.3%) | 629 (45.2%) |
| 25 to 34 Years | 1,256 (57.2%) | 823 (37.5%) |
| 35 to 44 Years | 914 (38.3%) | 1,127 (47.2%) |
| 45 to 54 Years | 904 (42.9%) | 916 (43.5%) |
| 55 to 64 Years | 985 (45.9%) | 1,052 (49.1%) |
| 65 to 74 Years | 1,658 (87.4%) | 1,080 (56.9%) |
| 75 Years and over | 1,243 (92.3%) | 816 (60.6%) |
| Total | 10,790 (60.8%) | 7,505 (42.3%) |
Disability Status by Sex by Age in Ashtabula
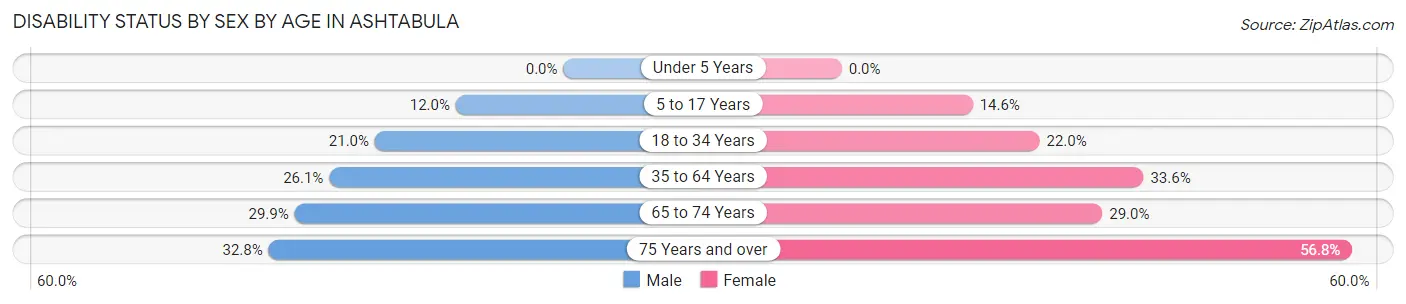
| Age Bracket | Male | Female |
| Under 5 Years | 0 (0.0%) | 0 (0.0%) |
| 5 to 17 Years | 168 (12.0%) | 221 (14.6%) |
| 18 to 34 Years | 390 (21.0%) | 416 (22.0%) |
| 35 to 64 Years | 825 (26.1%) | 1,167 (33.6%) |
| 65 to 74 Years | 238 (29.9%) | 320 (29.0%) |
| 75 Years and over | 238 (32.8%) | 353 (56.8%) |
Disability Class by Sex by Age in Ashtabula
Disability Class: Hearing Difficulty
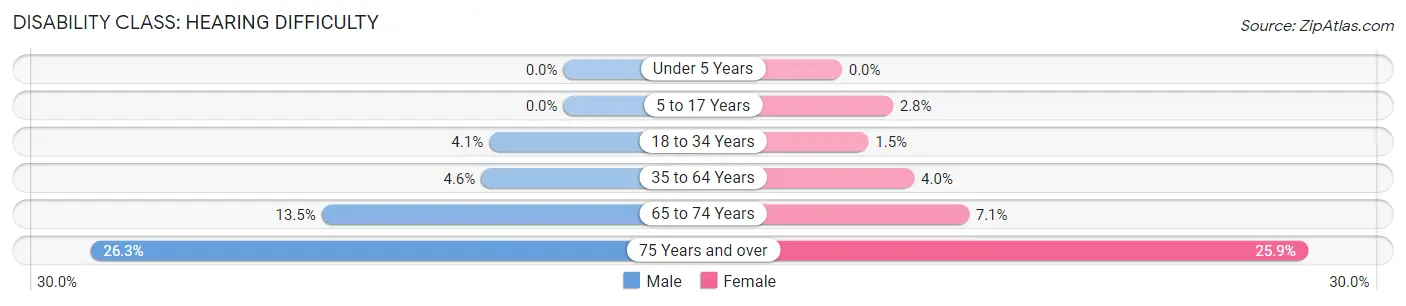
| Age Bracket | Male | Female |
| Under 5 Years | 0 (0.0%) | 0 (0.0%) |
| 5 to 17 Years | 0 (0.0%) | 43 (2.8%) |
| 18 to 34 Years | 77 (4.1%) | 28 (1.5%) |
| 35 to 64 Years | 145 (4.6%) | 140 (4.0%) |
| 65 to 74 Years | 107 (13.5%) | 78 (7.1%) |
| 75 Years and over | 191 (26.3%) | 161 (25.9%) |
Disability Class: Vision Difficulty
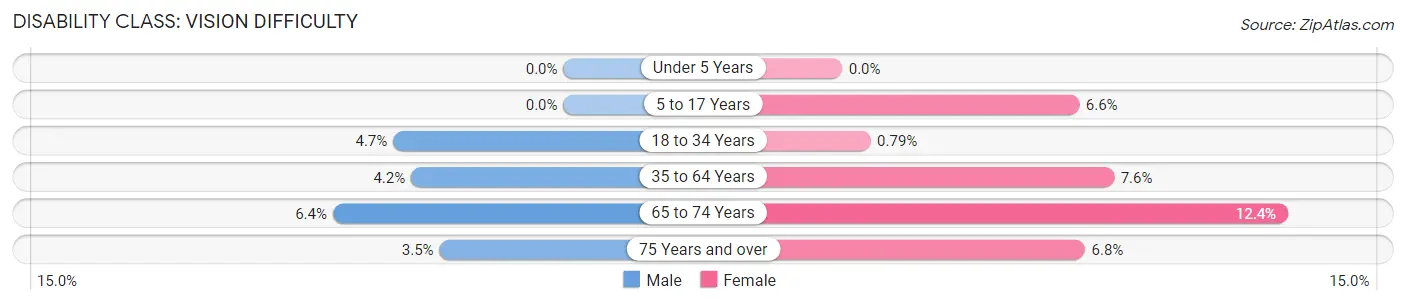
| Age Bracket | Male | Female |
| Under 5 Years | 0 (0.0%) | 0 (0.0%) |
| 5 to 17 Years | 0 (0.0%) | 100 (6.6%) |
| 18 to 34 Years | 88 (4.7%) | 15 (0.8%) |
| 35 to 64 Years | 134 (4.2%) | 263 (7.6%) |
| 65 to 74 Years | 51 (6.4%) | 137 (12.4%) |
| 75 Years and over | 25 (3.5%) | 42 (6.8%) |
Disability Class: Cognitive Difficulty
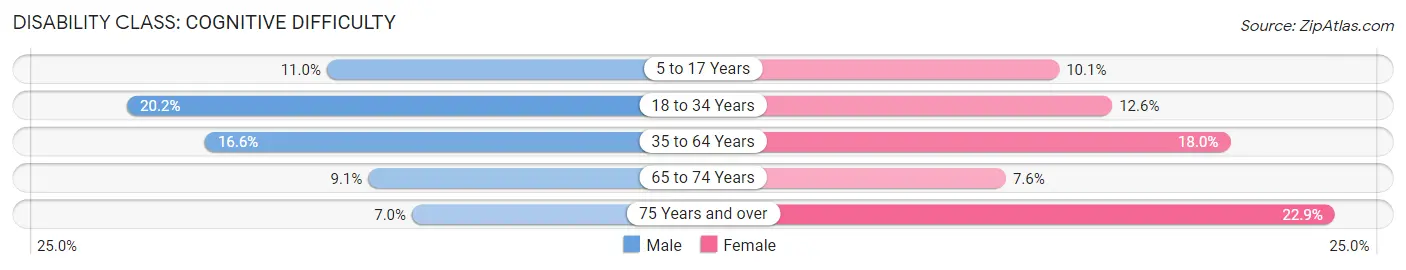
| Age Bracket | Male | Female |
| 5 to 17 Years | 154 (11.0%) | 153 (10.1%) |
| 18 to 34 Years | 376 (20.2%) | 237 (12.6%) |
| 35 to 64 Years | 526 (16.6%) | 626 (18.0%) |
| 65 to 74 Years | 72 (9.1%) | 84 (7.6%) |
| 75 Years and over | 51 (7.0%) | 142 (22.9%) |
Disability Class: Ambulatory Difficulty
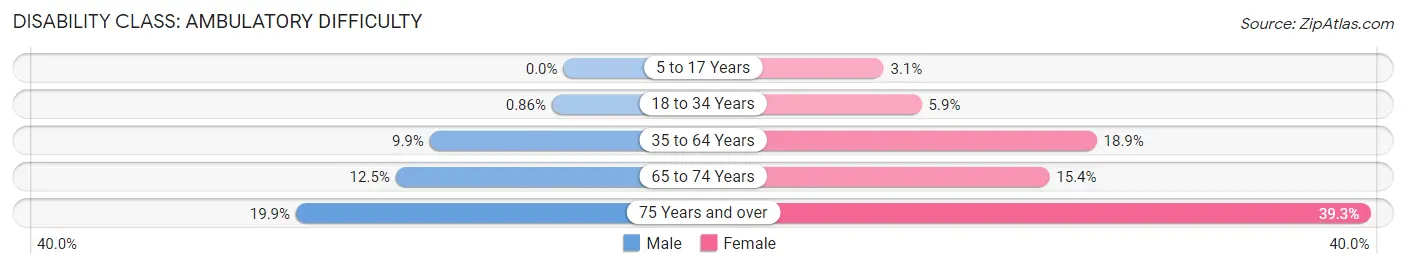
| Age Bracket | Male | Female |
| 5 to 17 Years | 0 (0.0%) | 47 (3.1%) |
| 18 to 34 Years | 16 (0.9%) | 112 (5.9%) |
| 35 to 64 Years | 314 (9.9%) | 657 (18.9%) |
| 65 to 74 Years | 99 (12.4%) | 170 (15.4%) |
| 75 Years and over | 144 (19.9%) | 244 (39.3%) |
Disability Class: Self-Care Difficulty
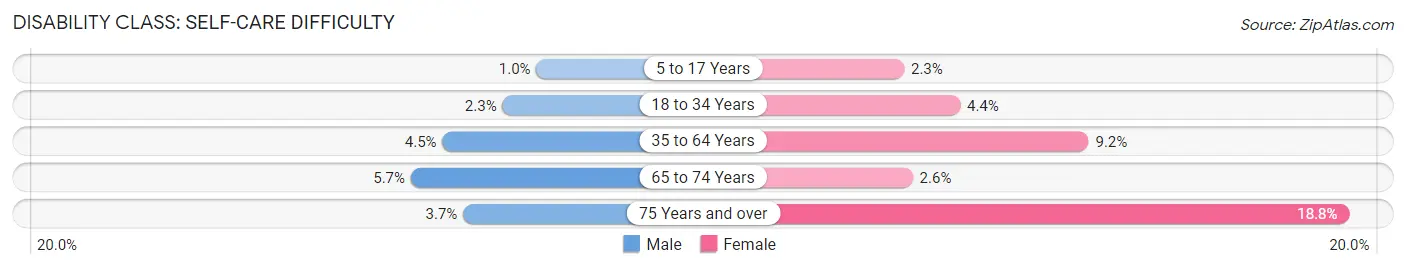
| Age Bracket | Male | Female |
| 5 to 17 Years | 14 (1.0%) | 35 (2.3%) |
| 18 to 34 Years | 42 (2.3%) | 83 (4.4%) |
| 35 to 64 Years | 142 (4.5%) | 318 (9.2%) |
| 65 to 74 Years | 45 (5.7%) | 29 (2.6%) |
| 75 Years and over | 27 (3.7%) | 117 (18.8%) |
Technology Access in Ashtabula
Computing Device Access in Ashtabula
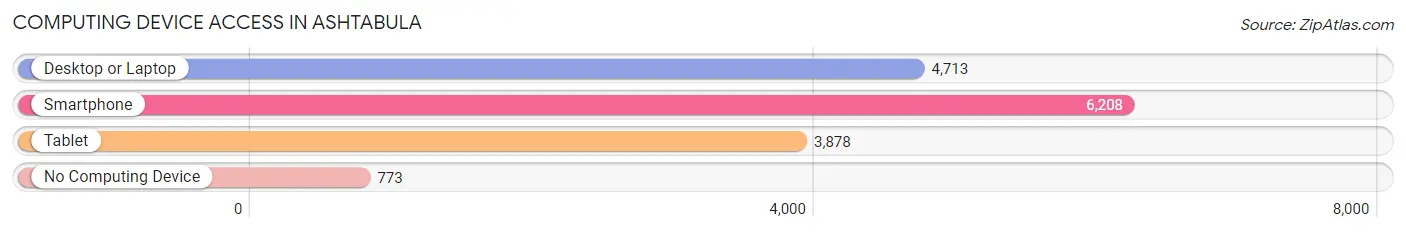
| Device Type | # Households | % Households |
| Desktop or Laptop | 4,713 | 61.5% |
| Smartphone | 6,208 | 81.0% |
| Tablet | 3,878 | 50.6% |
| No Computing Device | 773 | 10.1% |
| Total | 7,666 | 100.0% |
Internet Access in Ashtabula
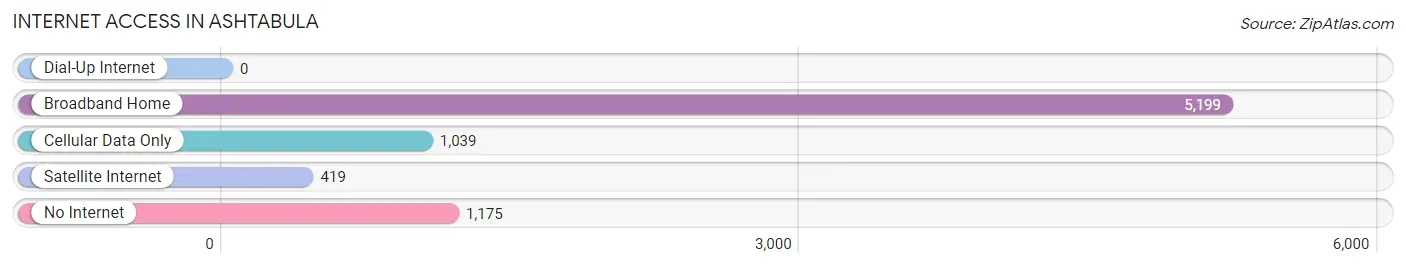
| Internet Type | # Households | % Households |
| Dial-Up Internet | 0 | 0.0% |
| Broadband Home | 5,199 | 67.8% |
| Cellular Data Only | 1,039 | 13.6% |
| Satellite Internet | 419 | 5.5% |
| No Internet | 1,175 | 15.3% |
| Total | 7,666 | 100.0% |
Ashtabula Summary
Ashtabula, Ohio is a city located in the northeastern corner of the state, along the shores of Lake Erie. It is the county seat of Ashtabula County and is part of the Cleveland-Akron-Canton metropolitan area. The city has a population of 19,124 as of the 2010 census, making it the largest city in the county.
History
The area that is now Ashtabula was first settled in 1798 by a group of settlers from Connecticut. The town was originally known as Austinburg, after the first settler, Austin Smith. The town was renamed Ashtabula in 1811, after the Ashtabula River, which flows through the city.
The city was incorporated in 1831 and quickly became a major port on Lake Erie. The city was a major center for the shipping of coal, lumber, and other goods. The city also became a major center for the iron and steel industry.
The city was also a major stop on the Underground Railroad, with many escaped slaves passing through the city on their way to freedom.
Geography
Ashtabula is located at 41°51'N 80°48'W (41.851, -80.800). The city is situated on the western shore of Lake Erie, about 50 miles east of Cleveland. The city is located in the Ashtabula River Valley, which is part of the Great Lakes region.
The city has a total area of 8.3 square miles, of which 7.9 square miles is land and 0.4 square miles is water.
Economy
The economy of Ashtabula is largely based on manufacturing and tourism. The city is home to several manufacturing companies, including a steel mill, a paper mill, and a plastics plant. The city is also home to several wineries, which attract tourists from all over the region.
The city is also home to a number of retail stores, restaurants, and other businesses. The city is also home to a number of educational institutions, including a community college and a branch of Kent State University.
Demographics
As of the 2010 census, the population of Ashtabula was 19,124. The racial makeup of the city was 87.3% White, 8.2% African American, 0.4% Native American, 0.7% Asian, 0.1% Pacific Islander, 0.9% from other races, and 2.4% from two or more races. Hispanic or Latino of any race were 2.7% of the population.
The median income for a household in the city was $33,945, and the median income for a family was $41,945. The per capita income for the city was $17,845. About 16.2% of the population was below the poverty line.
Conclusion
Ashtabula, Ohio is a city located in the northeastern corner of the state, along the shores of Lake Erie. It is the county seat of Ashtabula County and is part of the Cleveland-Akron-Canton metropolitan area. The city has a population of 19,124 as of the 2010 census, making it the largest city in the county. The city has a long history, dating back to its founding in 1798, and has a diverse economy based on manufacturing and tourism. The city has a diverse population, with a median income of $33,945 and a poverty rate of 16.2%.
Common Questions
What is Per Capita Income in Ashtabula?
Per Capita income in Ashtabula is $22,595.
What is the Median Family Income in Ashtabula?
Median Family Income in Ashtabula is $44,991.
What is the Median Household income in Ashtabula?
Median Household Income in Ashtabula is $39,053.
What is Income or Wage Gap in Ashtabula?
Income or Wage Gap in Ashtabula is 25.7%.
Women in Ashtabula earn 74.3 cents for every dollar earned by a man.
What is Family Income Deficit in Ashtabula?
Family Income Deficit in Ashtabula is $11,497.
Families that are below poverty line in Ashtabula earn $11,497 less on average than the poverty threshold level.
What is Inequality or Gini Index in Ashtabula?
Inequality or Gini Index in Ashtabula is 0.47.
What is the Total Population of Ashtabula?
Total Population of Ashtabula is 18,003.
What is the Total Male Population of Ashtabula?
Total Male Population of Ashtabula is 8,667.
What is the Total Female Population of Ashtabula?
Total Female Population of Ashtabula is 9,336.
What is the Ratio of Males per 100 Females in Ashtabula?
There are 92.83 Males per 100 Females in Ashtabula.
What is the Ratio of Females per 100 Males in Ashtabula?
There are 107.72 Females per 100 Males in Ashtabula.
What is the Median Population Age in Ashtabula?
Median Population Age in Ashtabula is 40.2 Years.
What is the Average Family Size in Ashtabula
Average Family Size in Ashtabula is 3.0 People.
What is the Average Household Size in Ashtabula
Average Household Size in Ashtabula is 2.3 People.
How Large is the Labor Force in Ashtabula?
There are 8,132 People in the Labor Forcein in Ashtabula.
What is the Percentage of People in the Labor Force in Ashtabula?
56.9% of People are in the Labor Force in Ashtabula.
What is the Unemployment Rate in Ashtabula?
Unemployment Rate in Ashtabula is 13.6%.