New London, OH Map & Demographics
New London Map
New London Overview
$24,467
PER CAPITA INCOME
$54,750
AVG FAMILY INCOME
$50,778
AVG HOUSEHOLD INCOME
34.5%
WAGE / INCOME GAP [ % ]
65.5¢/ $1
WAGE / INCOME GAP [ $ ]
0.41
INEQUALITY / GINI INDEX
2,531
TOTAL POPULATION
1,291
MALE POPULATION
1,240
FEMALE POPULATION
104.11
MALES / 100 FEMALES
96.05
FEMALES / 100 MALES
37.1
MEDIAN AGE
3.0
AVG FAMILY SIZE
2.5
AVG HOUSEHOLD SIZE
1,161
LABOR FORCE [ PEOPLE ]
59.0%
PERCENT IN LABOR FORCE
8.7%
UNEMPLOYMENT RATE
New London Zip Codes
Income in New London
Income Overview in New London
Per Capita Income in New London is $24,467, while median incomes of families and households are $54,750 and $50,778 respectively.
| Characteristic | Number | Measure |
| Per Capita Income | 2,531 | $24,467 |
| Median Family Income | 659 | $54,750 |
| Mean Family Income | 659 | $70,532 |
| Median Household Income | 980 | $50,778 |
| Mean Household Income | 980 | $60,963 |
| Income Deficit | 659 | $0 |
| Wage / Income Gap (%) | 2,531 | 34.51% |
| Wage / Income Gap ($) | 2,531 | 65.49¢ per $1 |
| Gini / Inequality Index | 2,531 | 0.41 |
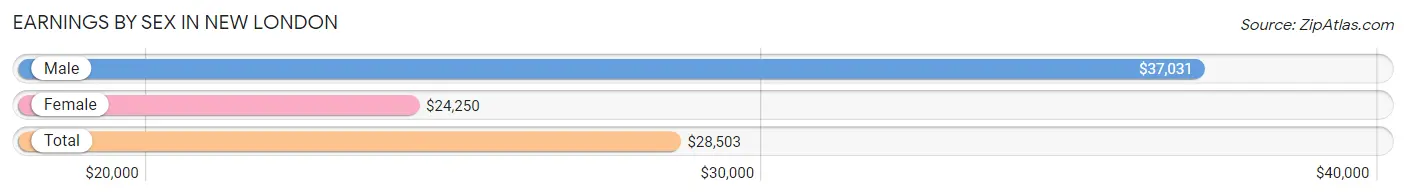
Earnings by Sex in New London
Average Earnings in New London are $28,503, $37,031 for men and $24,250 for women, a difference of 34.5%.
| Sex | Number | Average Earnings |
| Male | 671 (55.0%) | $37,031 |
| Female | 548 (45.0%) | $24,250 |
| Total | 1,219 (100.0%) | $28,503 |
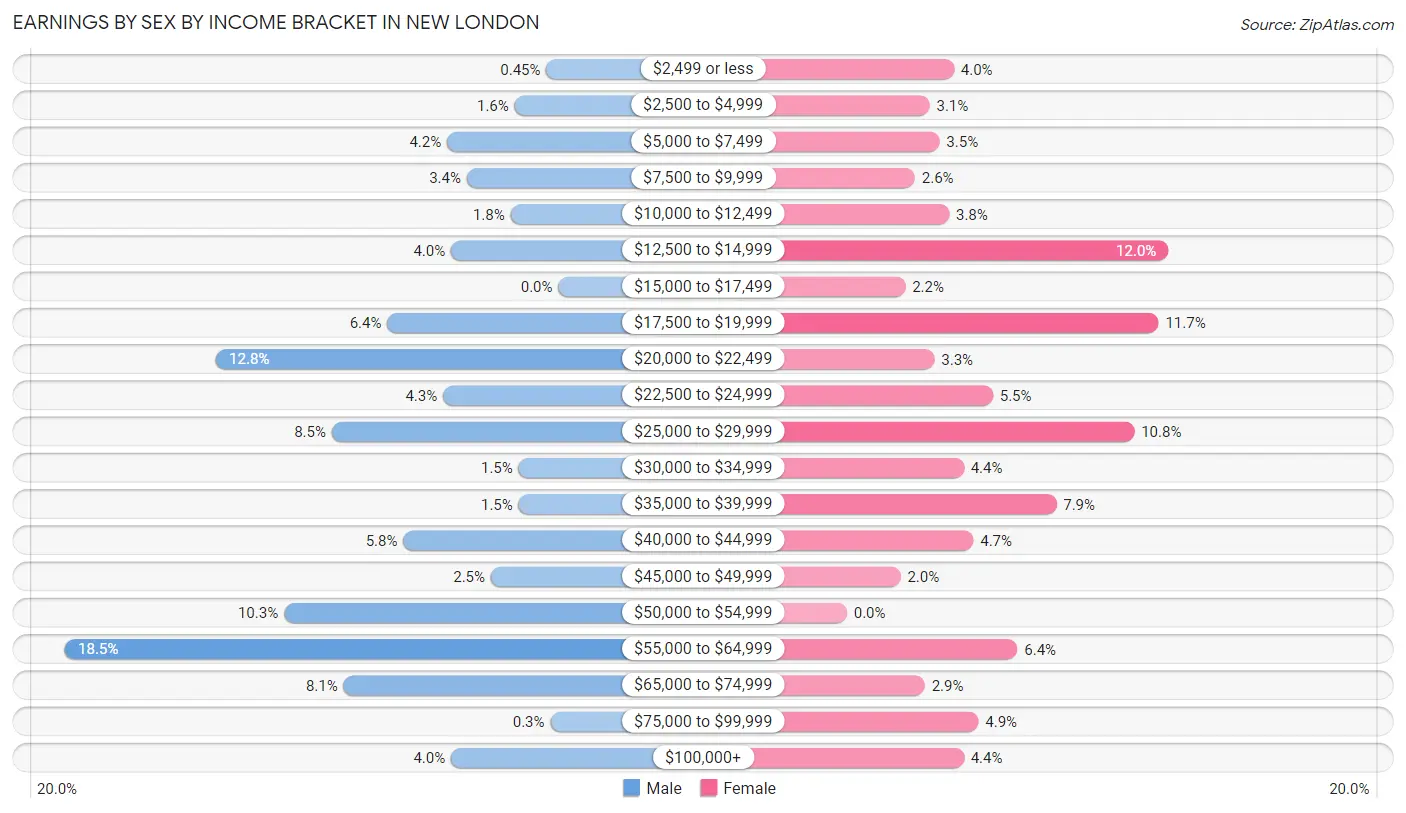
Earnings by Sex by Income Bracket in New London
The most common earnings brackets in New London are $55,000 to $64,999 for men (124 | 18.5%) and $12,500 to $14,999 for women (66 | 12.0%).
| Income | Male | Female |
| $2,499 or less | 3 (0.4%) | 22 (4.0%) |
| $2,500 to $4,999 | 11 (1.6%) | 17 (3.1%) |
| $5,000 to $7,499 | 28 (4.2%) | 19 (3.5%) |
| $7,500 to $9,999 | 23 (3.4%) | 14 (2.5%) |
| $10,000 to $12,499 | 12 (1.8%) | 21 (3.8%) |
| $12,500 to $14,999 | 27 (4.0%) | 66 (12.0%) |
| $15,000 to $17,499 | 0 (0.0%) | 12 (2.2%) |
| $17,500 to $19,999 | 43 (6.4%) | 64 (11.7%) |
| $20,000 to $22,499 | 86 (12.8%) | 18 (3.3%) |
| $22,500 to $24,999 | 29 (4.3%) | 30 (5.5%) |
| $25,000 to $29,999 | 57 (8.5%) | 59 (10.8%) |
| $30,000 to $34,999 | 10 (1.5%) | 24 (4.4%) |
| $35,000 to $39,999 | 10 (1.5%) | 43 (7.9%) |
| $40,000 to $44,999 | 39 (5.8%) | 26 (4.7%) |
| $45,000 to $49,999 | 17 (2.5%) | 11 (2.0%) |
| $50,000 to $54,999 | 69 (10.3%) | 0 (0.0%) |
| $55,000 to $64,999 | 124 (18.5%) | 35 (6.4%) |
| $65,000 to $74,999 | 54 (8.1%) | 16 (2.9%) |
| $75,000 to $99,999 | 2 (0.3%) | 27 (4.9%) |
| $100,000+ | 27 (4.0%) | 24 (4.4%) |
| Total | 671 (100.0%) | 548 (100.0%) |
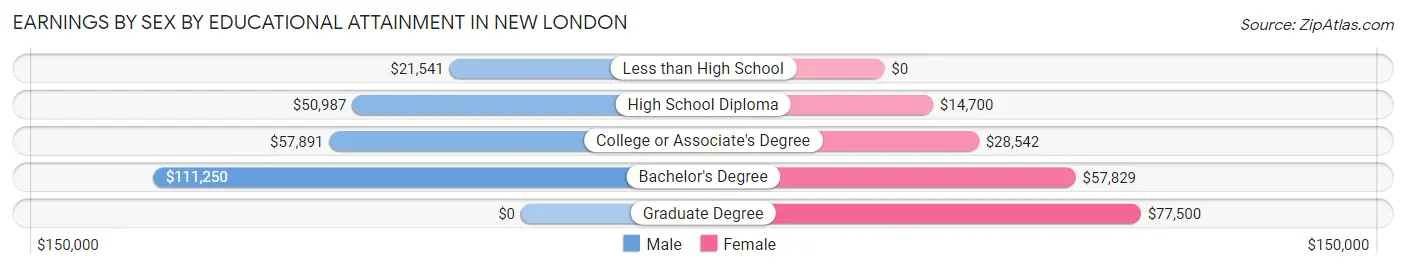
Earnings by Sex by Educational Attainment in New London
Average earnings in New London are $45,441 for men and $26,000 for women, a difference of 42.8%. Men with an educational attainment of bachelor's degree enjoy the highest average annual earnings of $111,250, while those with less than high school education earn the least with $21,541. Women with an educational attainment of graduate degree earn the most with the average annual earnings of $77,500, while those with high school diploma education have the smallest earnings of $14,700.
| Educational Attainment | Male Income | Female Income |
| Less than High School | $21,541 | $0 |
| High School Diploma | $50,987 | $14,700 |
| College or Associate's Degree | $57,891 | $28,542 |
| Bachelor's Degree | $111,250 | $57,829 |
| Graduate Degree | - | - |
| Total | $45,441 | $26,000 |
Family Income in New London
Family Income Brackets in New London
According to the New London family income data, there are 176 families falling into the $50,000 to $74,999 income range, which is the most common income bracket and makes up 26.7% of all families. Conversely, the $10,000 to $14,999 income bracket is the least frequent group with only 3 families (0.5%) belonging to this category.
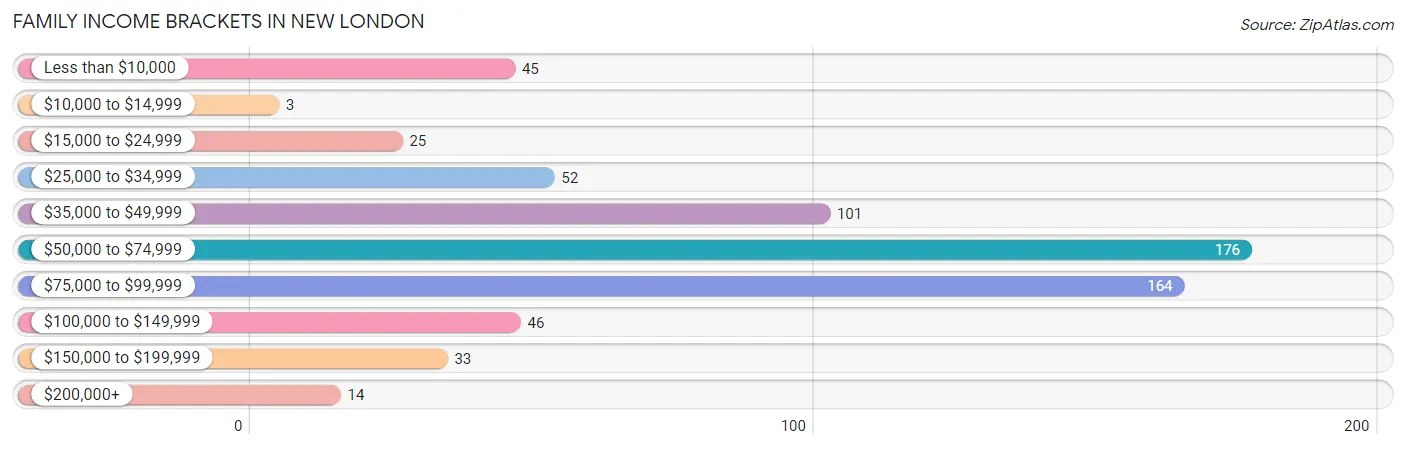
| Income Bracket | # Families | % Families |
| Less than $10,000 | 45 | 6.8% |
| $10,000 to $14,999 | 3 | 0.5% |
| $15,000 to $24,999 | 25 | 3.8% |
| $25,000 to $34,999 | 52 | 7.9% |
| $35,000 to $49,999 | 101 | 15.3% |
| $50,000 to $74,999 | 176 | 26.7% |
| $75,000 to $99,999 | 164 | 24.9% |
| $100,000 to $149,999 | 46 | 7.0% |
| $150,000 to $199,999 | 33 | 5.0% |
| $200,000+ | 14 | 2.1% |
Family Income by Famaliy Size in New London
4-person families (164 | 24.9%) account for the highest median family income in New London with $90,089 per family, while 3-person families (165 | 25.0%) have the highest median income of $23,568 per family member.
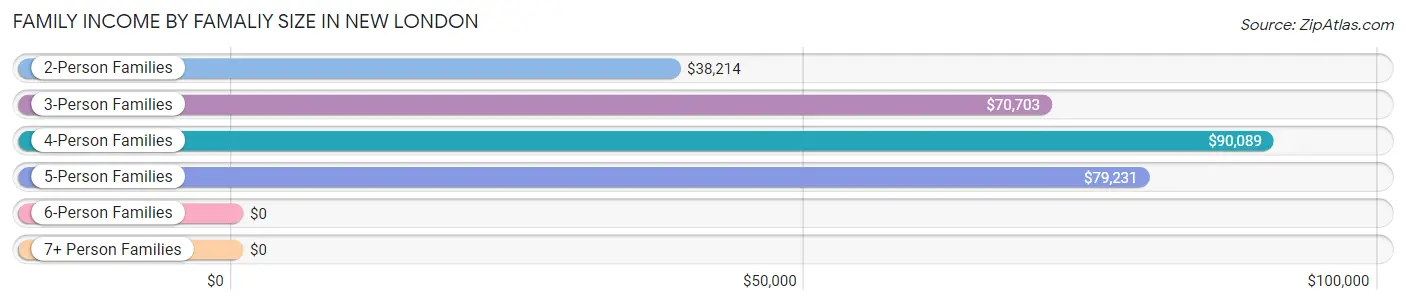
| Income Bracket | # Families | Median Income |
| 2-Person Families | 302 (45.8%) | $38,214 |
| 3-Person Families | 165 (25.0%) | $70,703 |
| 4-Person Families | 164 (24.9%) | $90,089 |
| 5-Person Families | 28 (4.3%) | $79,231 |
| 6-Person Families | 0 (0.0%) | $0 |
| 7+ Person Families | 0 (0.0%) | $0 |
| Total | 659 (100.0%) | $54,750 |
Family Income by Number of Earners in New London
The median family income in New London is $54,750, with families comprising 3+ earners (43) having the highest median family income of $99,792, while families with no earners (101) have the lowest median family income of $22,750, accounting for 6.5% and 15.3% of families, respectively.
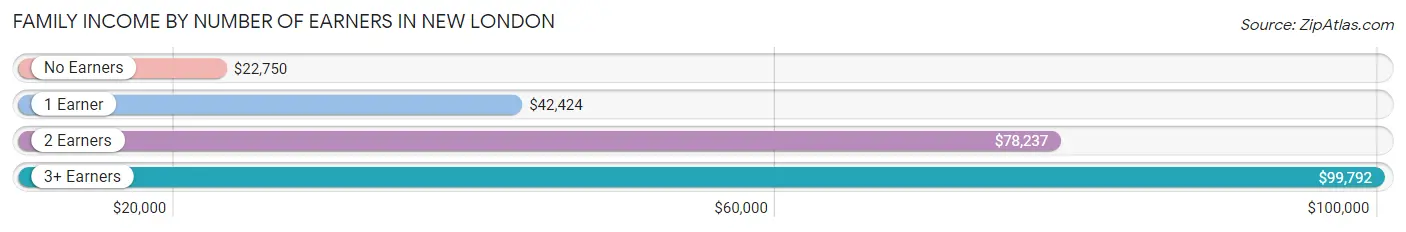
| Number of Earners | # Families | Median Income |
| No Earners | 101 (15.3%) | $22,750 |
| 1 Earner | 232 (35.2%) | $42,424 |
| 2 Earners | 283 (42.9%) | $78,237 |
| 3+ Earners | 43 (6.5%) | $99,792 |
| Total | 659 (100.0%) | $54,750 |
Household Income in New London
Household Income Brackets in New London
With 230 households falling in the category, the $50,000 to $74,999 income range is the most frequent in New London, accounting for 23.5% of all households. In contrast, only 14 households (1.4%) fall into the $200,000+ income bracket, making it the least populous group.
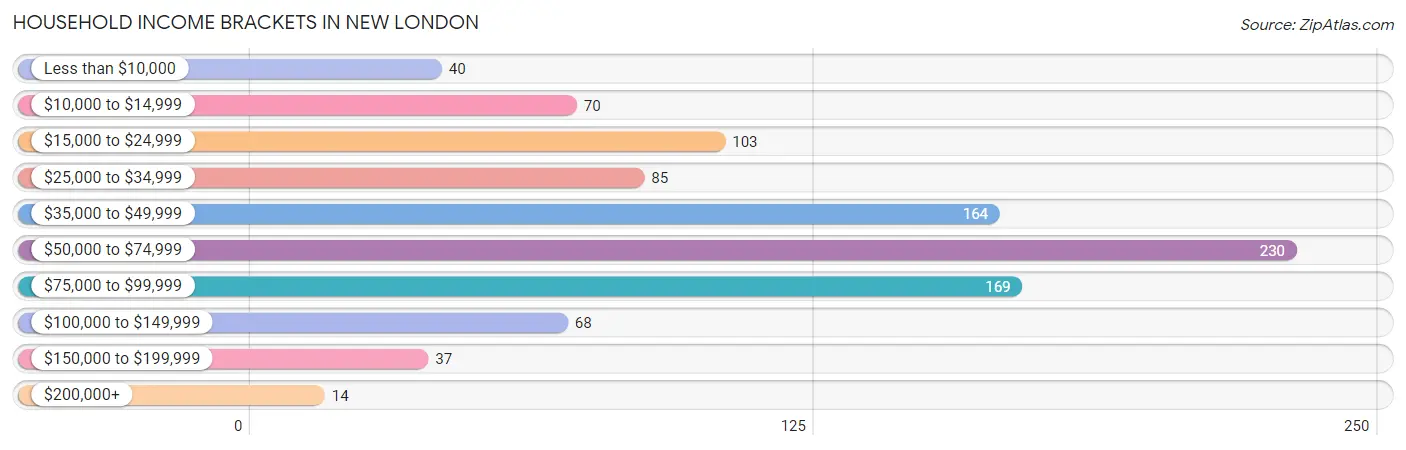
| Income Bracket | # Households | % Households |
| Less than $10,000 | 40 | 4.1% |
| $10,000 to $14,999 | 70 | 7.1% |
| $15,000 to $24,999 | 103 | 10.5% |
| $25,000 to $34,999 | 85 | 8.7% |
| $35,000 to $49,999 | 164 | 16.7% |
| $50,000 to $74,999 | 230 | 23.5% |
| $75,000 to $99,999 | 169 | 17.2% |
| $100,000 to $149,999 | 68 | 6.9% |
| $150,000 to $199,999 | 37 | 3.8% |
| $200,000+ | 14 | 1.4% |
Household Income by Householder Age in New London
The median household income in New London is $50,778, with the highest median household income of $62,250 found in the 25 to 44 years age bracket for the primary householder. A total of 333 households (34.0%) fall into this category. Meanwhile, the 15 to 24 years age bracket for the primary householder has the lowest median household income of $0, with 56 households (5.7%) in this group.
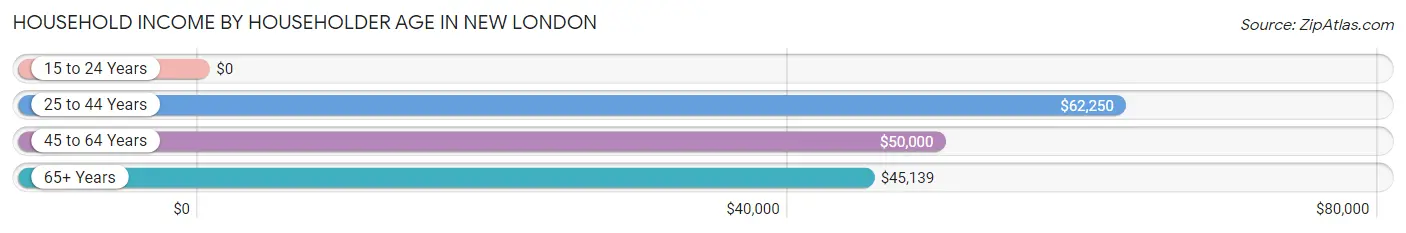
| Income Bracket | # Households | Median Income |
| 15 to 24 Years | 56 (5.7%) | $0 |
| 25 to 44 Years | 333 (34.0%) | $62,250 |
| 45 to 64 Years | 332 (33.9%) | $50,000 |
| 65+ Years | 259 (26.4%) | $45,139 |
| Total | 980 (100.0%) | $50,778 |
Poverty in New London
Income Below Poverty by Sex and Age in New London
With 16.3% poverty level for males and 12.1% for females among the residents of New London, 55 to 64 year old males and 55 to 64 year old females are the most vulnerable to poverty, with 46 males (32.4%) and 52 females (39.7%) in their respective age groups living below the poverty level.
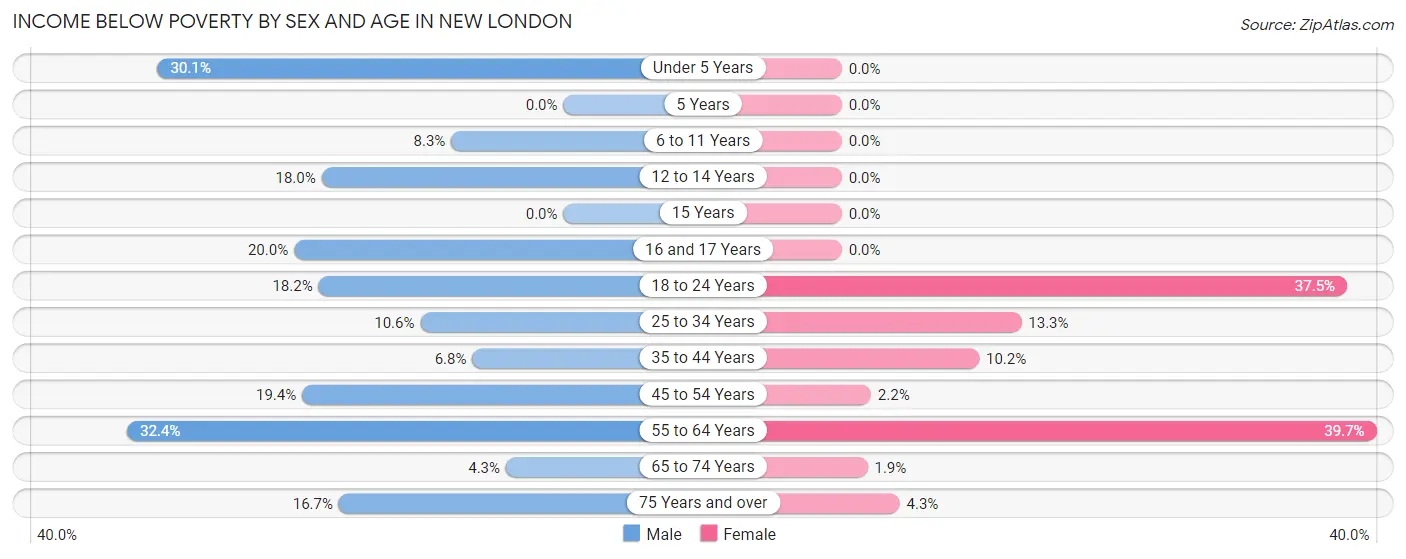
| Age Bracket | Male | Female |
| Under 5 Years | 47 (30.1%) | 0 (0.0%) |
| 5 Years | 0 (0.0%) | 0 (0.0%) |
| 6 to 11 Years | 7 (8.3%) | 0 (0.0%) |
| 12 to 14 Years | 14 (17.9%) | 0 (0.0%) |
| 15 Years | 0 (0.0%) | 0 (0.0%) |
| 16 and 17 Years | 4 (20.0%) | 0 (0.0%) |
| 18 to 24 Years | 22 (18.2%) | 45 (37.5%) |
| 25 to 34 Years | 17 (10.6%) | 24 (13.3%) |
| 35 to 44 Years | 15 (6.8%) | 16 (10.2%) |
| 45 to 54 Years | 26 (19.4%) | 3 (2.2%) |
| 55 to 64 Years | 46 (32.4%) | 52 (39.7%) |
| 65 to 74 Years | 5 (4.3%) | 3 (1.9%) |
| 75 Years and over | 5 (16.7%) | 3 (4.3%) |
| Total | 208 (16.3%) | 146 (12.1%) |
Income Above Poverty by Sex and Age in New London
According to the poverty statistics in New London, males aged 5 years and females aged under 5 years are the age groups that are most secure financially, with 100.0% of males and 100.0% of females in these age groups living above the poverty line.
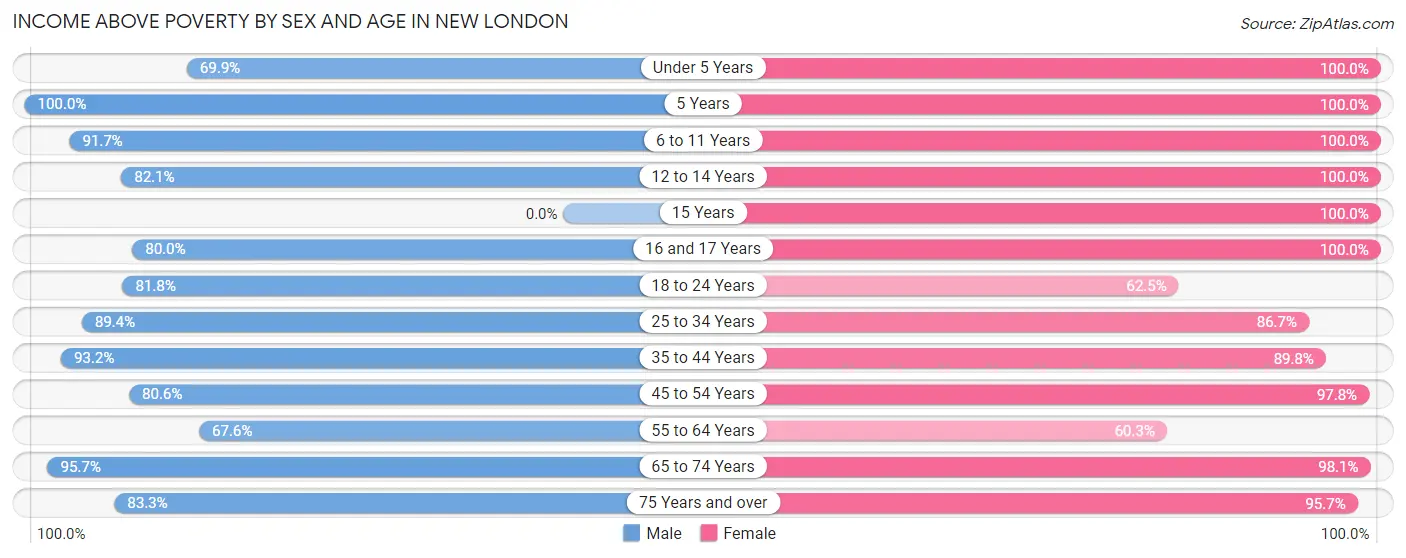
| Age Bracket | Male | Female |
| Under 5 Years | 109 (69.9%) | 87 (100.0%) |
| 5 Years | 9 (100.0%) | 62 (100.0%) |
| 6 to 11 Years | 77 (91.7%) | 45 (100.0%) |
| 12 to 14 Years | 64 (82.1%) | 35 (100.0%) |
| 15 Years | 0 (0.0%) | 8 (100.0%) |
| 16 and 17 Years | 16 (80.0%) | 15 (100.0%) |
| 18 to 24 Years | 99 (81.8%) | 75 (62.5%) |
| 25 to 34 Years | 143 (89.4%) | 156 (86.7%) |
| 35 to 44 Years | 207 (93.2%) | 141 (89.8%) |
| 45 to 54 Years | 108 (80.6%) | 136 (97.8%) |
| 55 to 64 Years | 96 (67.6%) | 79 (60.3%) |
| 65 to 74 Years | 112 (95.7%) | 154 (98.1%) |
| 75 Years and over | 25 (83.3%) | 67 (95.7%) |
| Total | 1,065 (83.7%) | 1,060 (87.9%) |
Income Below Poverty Among Married-Couple Families in New London
The poverty statistics for married-couple families in New London show that 0.9% or 4 of the total 440 families live below the poverty line. Families with no children have the highest poverty rate of 1.7%, comprising of 4 families. On the other hand, families with 1 or 2 children have the lowest poverty rate of 0.0%, which includes 0 families.
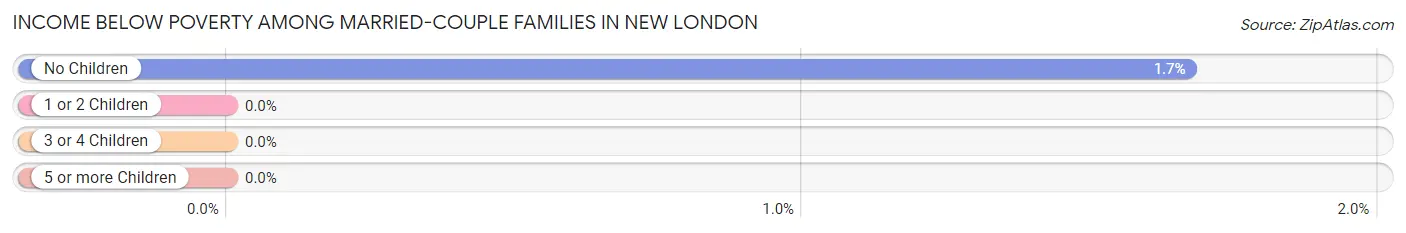
| Children | Above Poverty | Below Poverty |
| No Children | 235 (98.3%) | 4 (1.7%) |
| 1 or 2 Children | 191 (100.0%) | 0 (0.0%) |
| 3 or 4 Children | 10 (100.0%) | 0 (0.0%) |
| 5 or more Children | 0 (0.0%) | 0 (0.0%) |
| Total | 436 (99.1%) | 4 (0.9%) |
Income Below Poverty Among Single-Parent Households in New London
According to the poverty data in New London, 12.5% or 4 single-father households and 29.4% or 55 single-mother households are living below the poverty line. Among single-father households, those with 1 or 2 children have the highest poverty rate, with 4 households (26.7%) experiencing poverty. Likewise, among single-mother households, those with 1 or 2 children have the highest poverty rate, with 55 households (37.4%) falling below the poverty line.
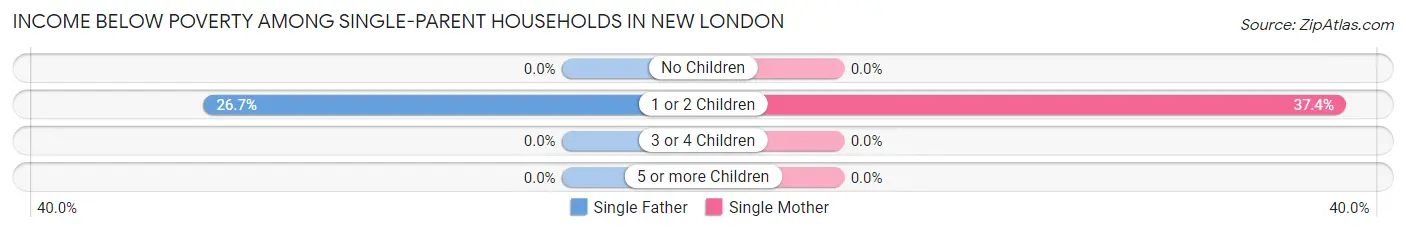
| Children | Single Father | Single Mother |
| No Children | 0 (0.0%) | 0 (0.0%) |
| 1 or 2 Children | 4 (26.7%) | 55 (37.4%) |
| 3 or 4 Children | 0 (0.0%) | 0 (0.0%) |
| 5 or more Children | 0 (0.0%) | 0 (0.0%) |
| Total | 4 (12.5%) | 55 (29.4%) |
Income Below Poverty Among Married-Couple vs Single-Parent Households in New London
The poverty data for New London shows that 4 of the married-couple family households (0.9%) and 59 of the single-parent households (26.9%) are living below the poverty level. Within the married-couple family households, those with no children have the highest poverty rate, with 4 households (1.7%) falling below the poverty line. Among the single-parent households, those with 1 or 2 children have the highest poverty rate, with 59 household (36.4%) living below poverty.
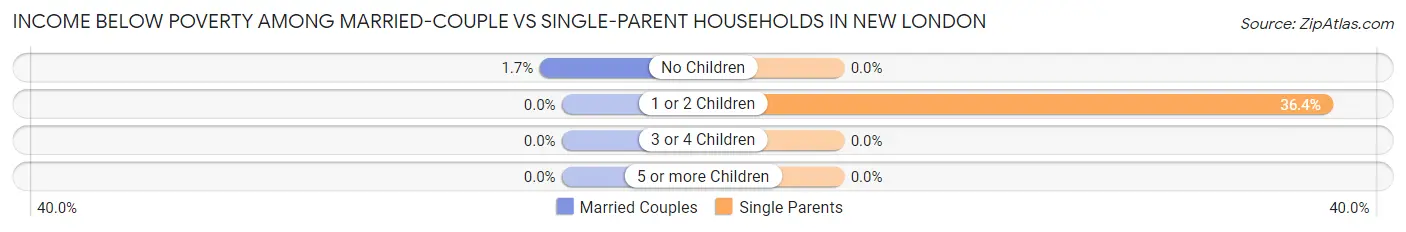
| Children | Married-Couple Families | Single-Parent Households |
| No Children | 4 (1.7%) | 0 (0.0%) |
| 1 or 2 Children | 0 (0.0%) | 59 (36.4%) |
| 3 or 4 Children | 0 (0.0%) | 0 (0.0%) |
| 5 or more Children | 0 (0.0%) | 0 (0.0%) |
| Total | 4 (0.9%) | 59 (26.9%) |
Race in New London
The most populous races in New London are White / Caucasian (2,383 | 94.2%), Two or more Races (104 | 4.1%), and Black / African American (44 | 1.7%).
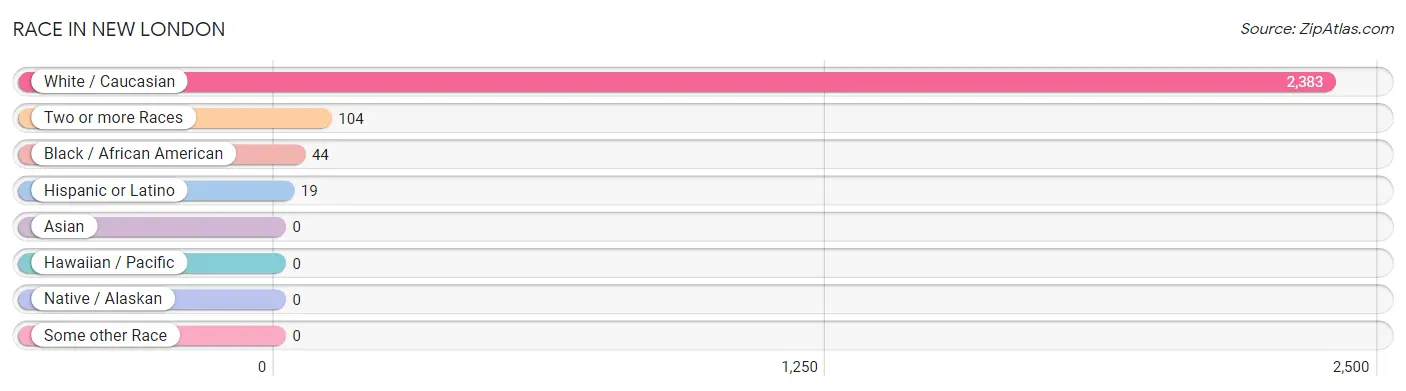
| Race | # Population | % Population |
| Asian | 0 | 0.0% |
| Black / African American | 44 | 1.7% |
| Hawaiian / Pacific | 0 | 0.0% |
| Hispanic or Latino | 19 | 0.7% |
| Native / Alaskan | 0 | 0.0% |
| White / Caucasian | 2,383 | 94.2% |
| Two or more Races | 104 | 4.1% |
| Some other Race | 0 | 0.0% |
| Total | 2,531 | 100.0% |
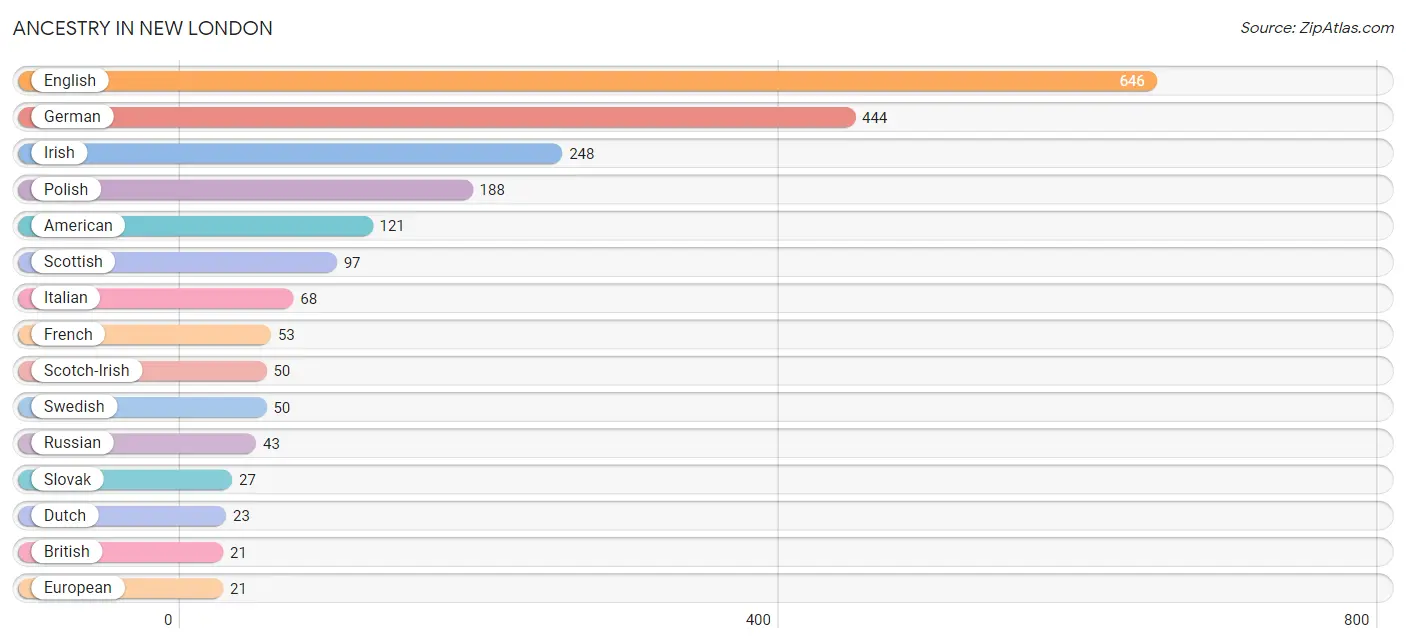
Ancestry in New London
The most populous ancestries reported in New London are English (646 | 25.5%), German (444 | 17.5%), Irish (248 | 9.8%), Polish (188 | 7.4%), and American (121 | 4.8%), together accounting for 65.1% of all New London residents.
| Ancestry | # Population | % Population |
| African | 3 | 0.1% |
| American | 121 | 4.8% |
| Belgian | 9 | 0.4% |
| Blackfeet | 10 | 0.4% |
| British | 21 | 0.8% |
| Cherokee | 17 | 0.7% |
| Czechoslovakian | 4 | 0.2% |
| Dutch | 23 | 0.9% |
| Eastern European | 16 | 0.6% |
| English | 646 | 25.5% |
| European | 21 | 0.8% |
| French | 53 | 2.1% |
| German | 444 | 17.5% |
| Hungarian | 20 | 0.8% |
| Irish | 248 | 9.8% |
| Italian | 68 | 2.7% |
| Northern European | 3 | 0.1% |
| Polish | 188 | 7.4% |
| Puerto Rican | 19 | 0.7% |
| Russian | 43 | 1.7% |
| Scandinavian | 7 | 0.3% |
| Scotch-Irish | 50 | 2.0% |
| Scottish | 97 | 3.8% |
| Slovak | 27 | 1.1% |
| Subsaharan African | 3 | 0.1% |
| Swedish | 50 | 2.0% |
| Ukrainian | 3 | 0.1% |
| Welsh | 6 | 0.2% | View All 28 Rows |
Immigrants in New London
The most numerous immigrant groups reported in New London came from , and Canada (12 | 0.5%), together accounting for 0.5% of all New London residents.

| Immigration Origin | # Population | % Population |
| Canada | 12 | 0.5% | View All 1 Rows |
Sex and Age in New London
Sex and Age in New London
The most populous age groups in New London are 35 to 39 Years (168 | 13.0%) for men and 25 to 29 Years (112 | 9.0%) for women.
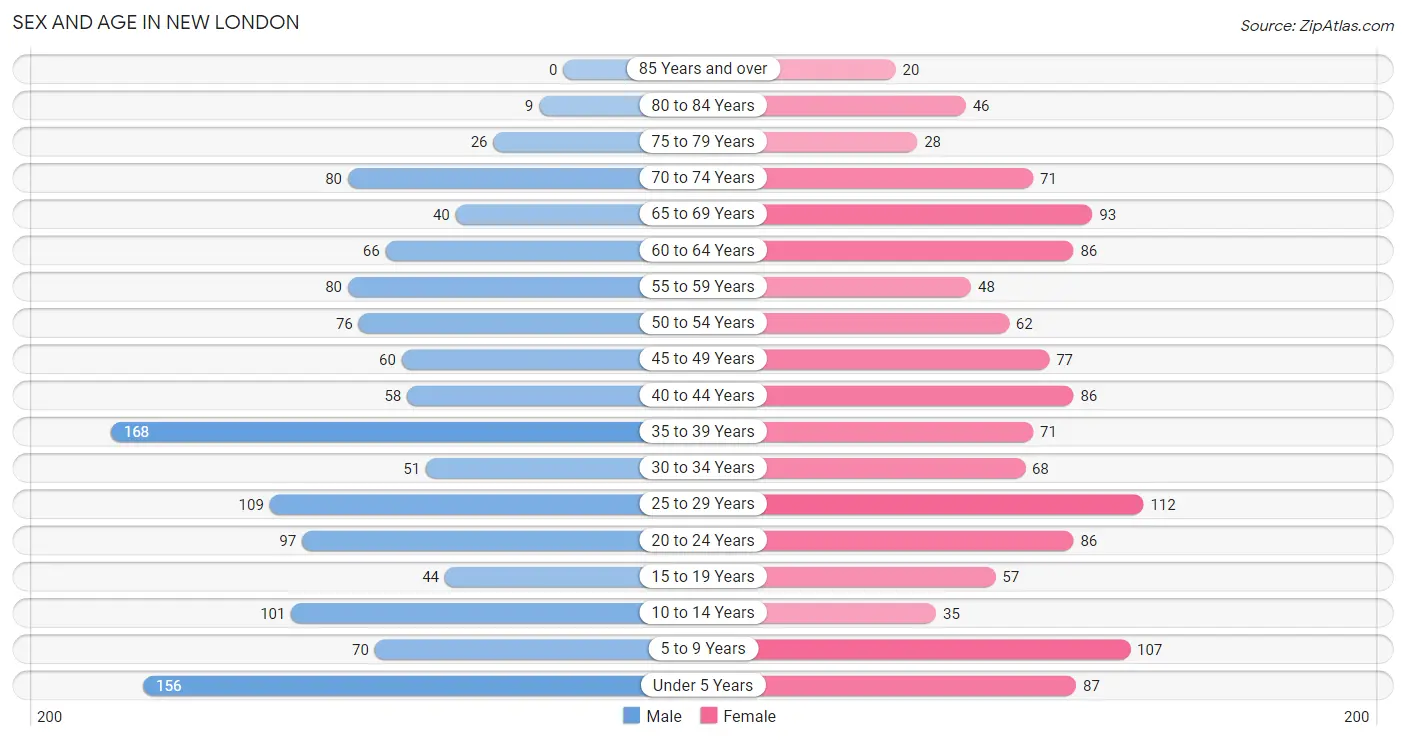
| Age Bracket | Male | Female |
| Under 5 Years | 156 (12.1%) | 87 (7.0%) |
| 5 to 9 Years | 70 (5.4%) | 107 (8.6%) |
| 10 to 14 Years | 101 (7.8%) | 35 (2.8%) |
| 15 to 19 Years | 44 (3.4%) | 57 (4.6%) |
| 20 to 24 Years | 97 (7.5%) | 86 (6.9%) |
| 25 to 29 Years | 109 (8.4%) | 112 (9.0%) |
| 30 to 34 Years | 51 (4.0%) | 68 (5.5%) |
| 35 to 39 Years | 168 (13.0%) | 71 (5.7%) |
| 40 to 44 Years | 58 (4.5%) | 86 (6.9%) |
| 45 to 49 Years | 60 (4.6%) | 77 (6.2%) |
| 50 to 54 Years | 76 (5.9%) | 62 (5.0%) |
| 55 to 59 Years | 80 (6.2%) | 48 (3.9%) |
| 60 to 64 Years | 66 (5.1%) | 86 (6.9%) |
| 65 to 69 Years | 40 (3.1%) | 93 (7.5%) |
| 70 to 74 Years | 80 (6.2%) | 71 (5.7%) |
| 75 to 79 Years | 26 (2.0%) | 28 (2.3%) |
| 80 to 84 Years | 9 (0.7%) | 46 (3.7%) |
| 85 Years and over | 0 (0.0%) | 20 (1.6%) |
| Total | 1,291 (100.0%) | 1,240 (100.0%) |
Families and Households in New London
Median Family Size in New London
The median family size in New London is 3.03 persons per family, with married-couple families (440 | 66.8%) accounting for the largest median family size of 3.14 persons per family. On the other hand, single female/mother families (187 | 28.4%) represent the smallest median family size with 2.77 persons per family.
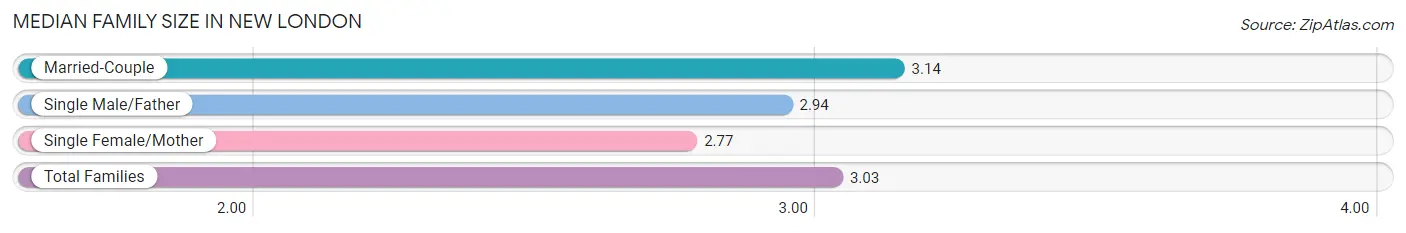
| Family Type | # Families | Family Size |
| Married-Couple | 440 (66.8%) | 3.14 |
| Single Male/Father | 32 (4.9%) | 2.94 |
| Single Female/Mother | 187 (28.4%) | 2.77 |
| Total Families | 659 (100.0%) | 3.03 |
Median Household Size in New London
The median household size in New London is 2.53 persons per household, with single male/father households (32 | 3.3%) accounting for the largest median household size of 3.31 persons per household. non-family households (321 | 32.8%) represent the smallest median household size with 1.29 persons per household.
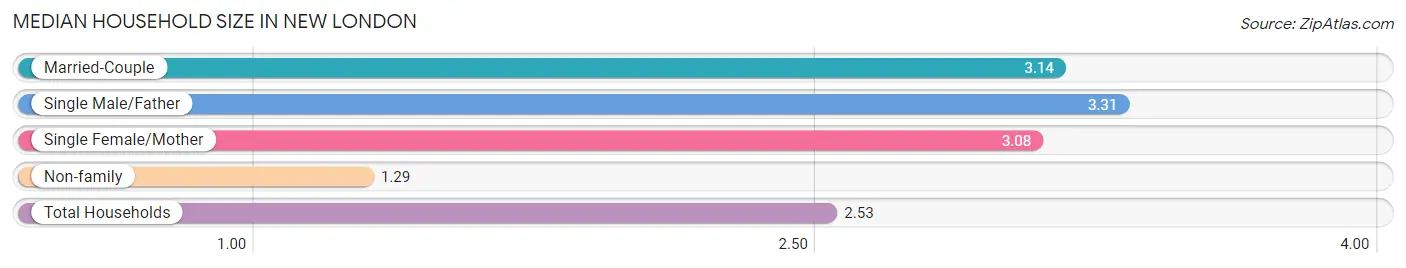
| Household Type | # Households | Household Size |
| Married-Couple | 440 (44.9%) | 3.14 |
| Single Male/Father | 32 (3.3%) | 3.31 |
| Single Female/Mother | 187 (19.1%) | 3.08 |
| Non-family | 321 (32.8%) | 1.29 |
| Total Households | 980 (100.0%) | 2.53 |
Household Size by Marriage Status in New London
Out of a total of 980 households in New London, 659 (67.2%) are family households, while 321 (32.8%) are nonfamily households. The most numerous type of family households are 2-person households, comprising 261, and the most common type of nonfamily households are 1-person households, comprising 255.
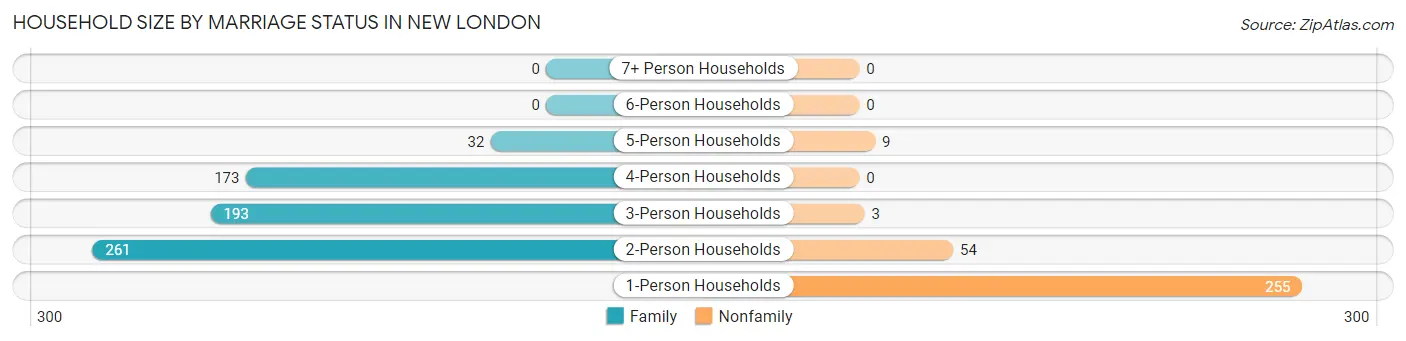
| Household Size | Family Households | Nonfamily Households |
| 1-Person Households | - | 255 (26.0%) |
| 2-Person Households | 261 (26.6%) | 54 (5.5%) |
| 3-Person Households | 193 (19.7%) | 3 (0.3%) |
| 4-Person Households | 173 (17.6%) | 0 (0.0%) |
| 5-Person Households | 32 (3.3%) | 9 (0.9%) |
| 6-Person Households | 0 (0.0%) | 0 (0.0%) |
| 7+ Person Households | 0 (0.0%) | 0 (0.0%) |
| Total | 659 (67.2%) | 321 (32.8%) |
Female Fertility in New London
Fertility by Age in New London
Average fertility rate in New London is 68.0 births per 1,000 women. Women in the age bracket of 20 to 34 years have the highest fertility rate with 128.0 births per 1,000 women. Women in the age bracket of 20 to 34 years acount for 87.2% of all women with births.
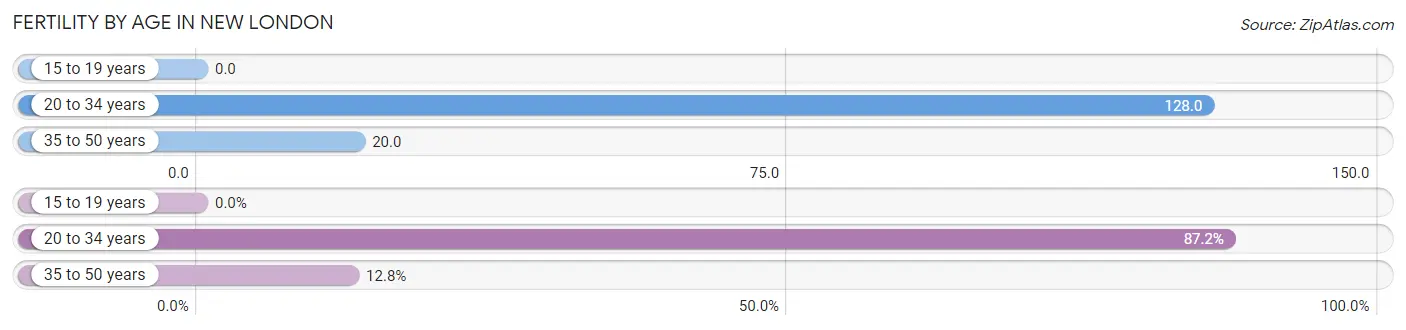
| Age Bracket | Women with Births | Births / 1,000 Women |
| 15 to 19 years | 0 (0.0%) | 0.0 |
| 20 to 34 years | 34 (87.2%) | 128.0 |
| 35 to 50 years | 5 (12.8%) | 20.0 |
| Total | 39 (100.0%) | 68.0 |
Fertility by Age by Marriage Status in New London
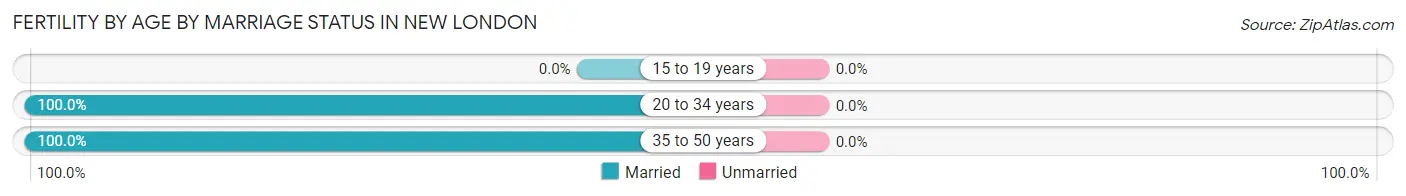
| Age Bracket | Married | Unmarried |
| 15 to 19 years | 0 (0.0%) | 0 (0.0%) |
| 20 to 34 years | 34 (100.0%) | 0 (0.0%) |
| 35 to 50 years | 5 (100.0%) | 0 (0.0%) |
| Total | 39 (100.0%) | 0 (0.0%) |
Fertility by Education in New London
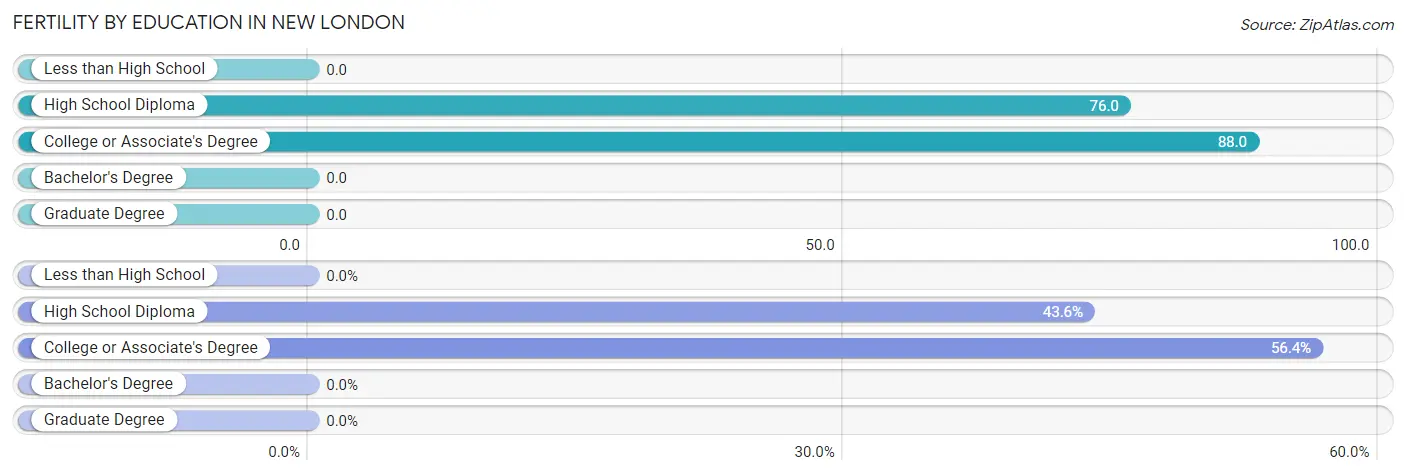
| Educational Attainment | Women with Births | Births / 1,000 Women |
| Less than High School | 0 (0.0%) | 0.0 |
| High School Diploma | 17 (43.6%) | 76.0 |
| College or Associate's Degree | 22 (56.4%) | 88.0 |
| Bachelor's Degree | 0 (0.0%) | 0.0 |
| Graduate Degree | 0 (0.0%) | 0.0 |
| Total | 39 (100.0%) | 68.0 |
Fertility by Education by Marriage Status in New London
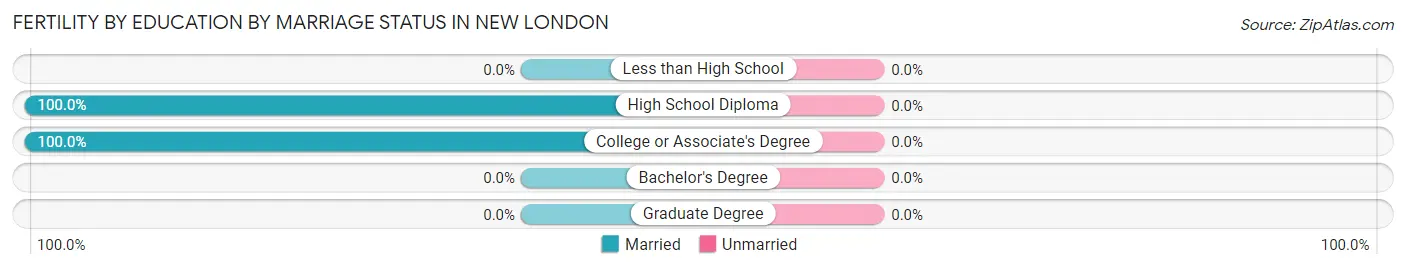
| Educational Attainment | Married | Unmarried |
| Less than High School | 0 (0.0%) | 0 (0.0%) |
| High School Diploma | 17 (100.0%) | 0 (0.0%) |
| College or Associate's Degree | 22 (100.0%) | 0 (0.0%) |
| Bachelor's Degree | 0 (0.0%) | 0 (0.0%) |
| Graduate Degree | 0 (0.0%) | 0 (0.0%) |
| Total | 39 (100.0%) | 0 (0.0%) |
Employment Characteristics in New London
Employment by Class of Employer in New London
Among the 993 employed individuals in New London, private company employees (777 | 78.2%), local government employees (67 | 6.8%), and not-for-profit organizations (47 | 4.7%) make up the most common classes of employment.
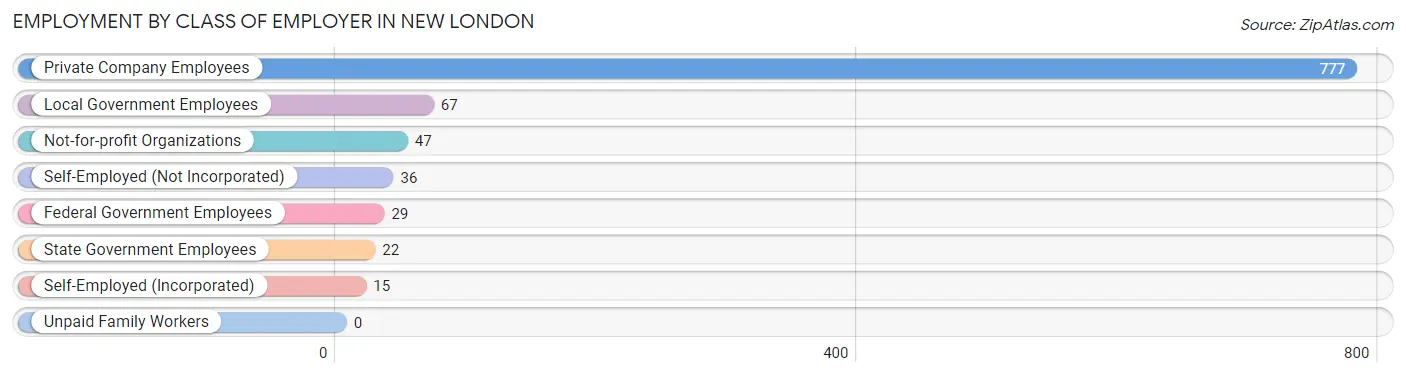
| Employer Class | # Employees | % Employees |
| Private Company Employees | 777 | 78.2% |
| Self-Employed (Incorporated) | 15 | 1.5% |
| Self-Employed (Not Incorporated) | 36 | 3.6% |
| Not-for-profit Organizations | 47 | 4.7% |
| Local Government Employees | 67 | 6.8% |
| State Government Employees | 22 | 2.2% |
| Federal Government Employees | 29 | 2.9% |
| Unpaid Family Workers | 0 | 0.0% |
| Total | 993 | 100.0% |
Employment Status by Age in New London
According to the labor force statistics for New London, out of the total population over 16 years of age (1,967), 59.0% or 1,161 individuals are in the labor force, with 8.7% or 101 of them unemployed. The age group with the highest labor force participation rate is 25 to 29 years, with 89.1% or 197 individuals in the labor force. Within the labor force, the 35 to 44 years age range has the highest percentage of unemployed individuals, with 26.6% or 86 of them being unemployed.
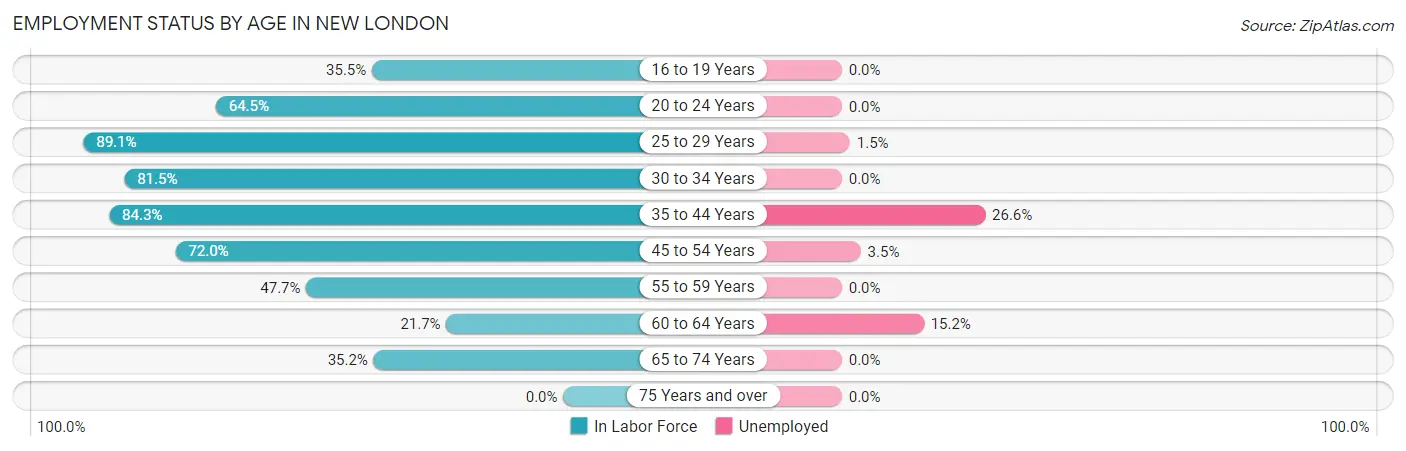
| Age Bracket | In Labor Force | Unemployed |
| 16 to 19 Years | 33 (35.5%) | 0 (0.0%) |
| 20 to 24 Years | 118 (64.5%) | 0 (0.0%) |
| 25 to 29 Years | 197 (89.1%) | 3 (1.5%) |
| 30 to 34 Years | 97 (81.5%) | 0 (0.0%) |
| 35 to 44 Years | 323 (84.3%) | 86 (26.6%) |
| 45 to 54 Years | 198 (72.0%) | 7 (3.5%) |
| 55 to 59 Years | 61 (47.7%) | 0 (0.0%) |
| 60 to 64 Years | 33 (21.7%) | 5 (15.2%) |
| 65 to 74 Years | 100 (35.2%) | 0 (0.0%) |
| 75 Years and over | 0 (0.0%) | 0 (0.0%) |
| Total | 1,161 (59.0%) | 101 (8.7%) |
Employment Status by Educational Attainment in New London
According to labor force statistics for New London, 71.1% of individuals (909) out of the total population between 25 and 64 years of age (1,278) are in the labor force, with 11.1% or 101 of them being unemployed. The group with the highest labor force participation rate are those with the educational attainment of bachelor's degree or higher, with 83.1% or 64 individuals in the labor force. Within the labor force, individuals with less than high school education have the highest percentage of unemployment, with 69.5% or 91 of them being unemployed.
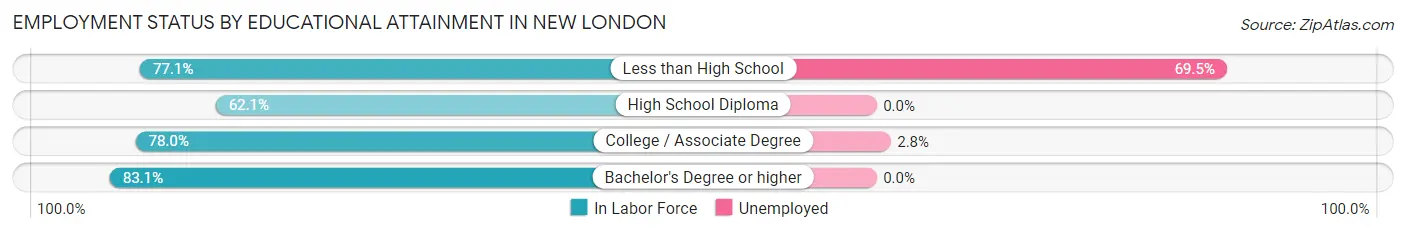
| Educational Attainment | In Labor Force | Unemployed |
| Less than High School | 131 (77.1%) | 118 (69.5%) |
| High School Diploma | 353 (62.1%) | 0 (0.0%) |
| College / Associate Degree | 361 (78.0%) | 13 (2.8%) |
| Bachelor's Degree or higher | 64 (83.1%) | 0 (0.0%) |
| Total | 909 (71.1%) | 142 (11.1%) |
Employment Occupations by Sex in New London
Management, Business, Science and Arts Occupations
The most common Management, Business, Science and Arts occupations in New London are Management (83 | 7.8%), Community & Social Service (67 | 6.3%), Education, Arts & Media (37 | 3.5%), Health Diagnosing & Treating (31 | 2.9%), and Computers, Engineering & Science (27 | 2.5%).
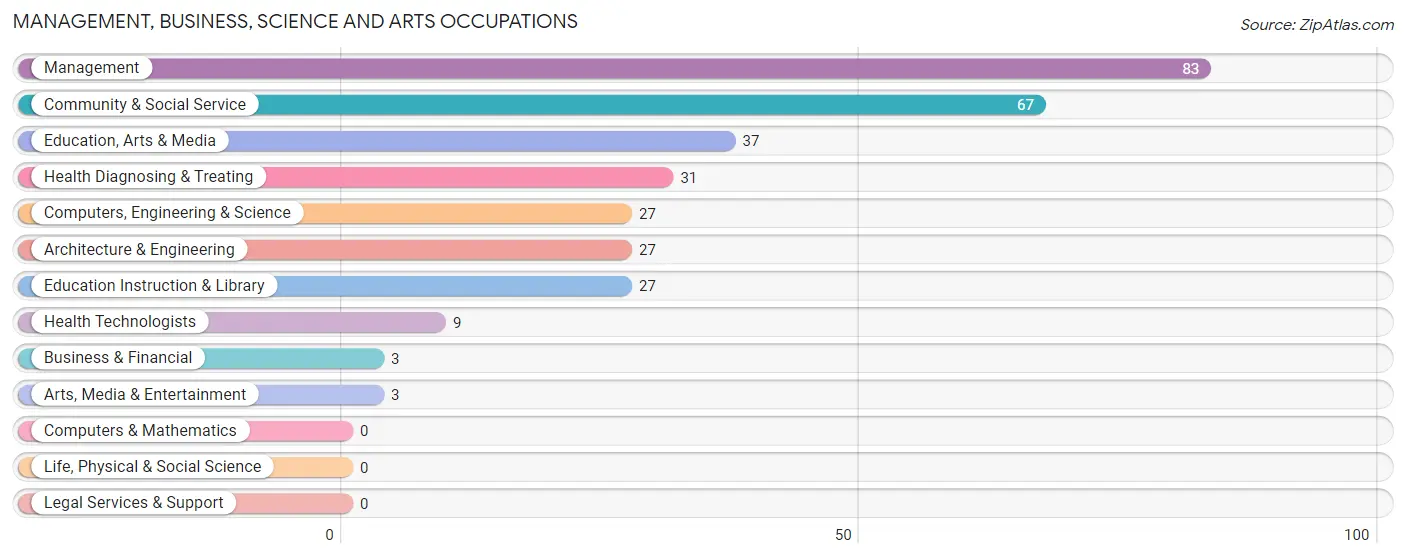
Management, Business, Science and Arts Occupations by Sex
Within the Management, Business, Science and Arts occupations in New London, the most male-oriented occupations are Arts, Media & Entertainment (100.0%), Management (44.6%), and Computers, Engineering & Science (14.8%), while the most female-oriented occupations are Business & Financial (100.0%), Education, Arts & Media (100.0%), and Health Diagnosing & Treating (100.0%).
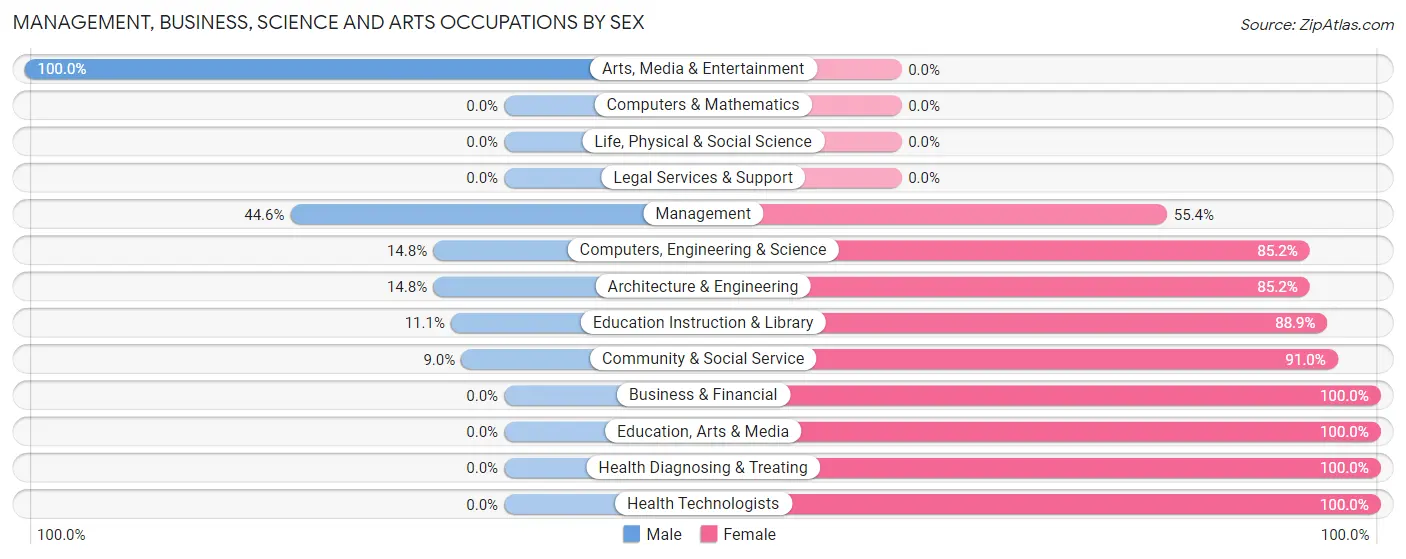
| Occupation | Male | Female |
| Management | 37 (44.6%) | 46 (55.4%) |
| Business & Financial | 0 (0.0%) | 3 (100.0%) |
| Computers, Engineering & Science | 4 (14.8%) | 23 (85.2%) |
| Computers & Mathematics | 0 (0.0%) | 0 (0.0%) |
| Architecture & Engineering | 4 (14.8%) | 23 (85.2%) |
| Life, Physical & Social Science | 0 (0.0%) | 0 (0.0%) |
| Community & Social Service | 6 (9.0%) | 61 (91.0%) |
| Education, Arts & Media | 0 (0.0%) | 37 (100.0%) |
| Legal Services & Support | 0 (0.0%) | 0 (0.0%) |
| Education Instruction & Library | 3 (11.1%) | 24 (88.9%) |
| Arts, Media & Entertainment | 3 (100.0%) | 0 (0.0%) |
| Health Diagnosing & Treating | 0 (0.0%) | 31 (100.0%) |
| Health Technologists | 0 (0.0%) | 9 (100.0%) |
| Total (Category) | 47 (22.3%) | 164 (77.7%) |
| Total (Overall) | 541 (51.1%) | 518 (48.9%) |
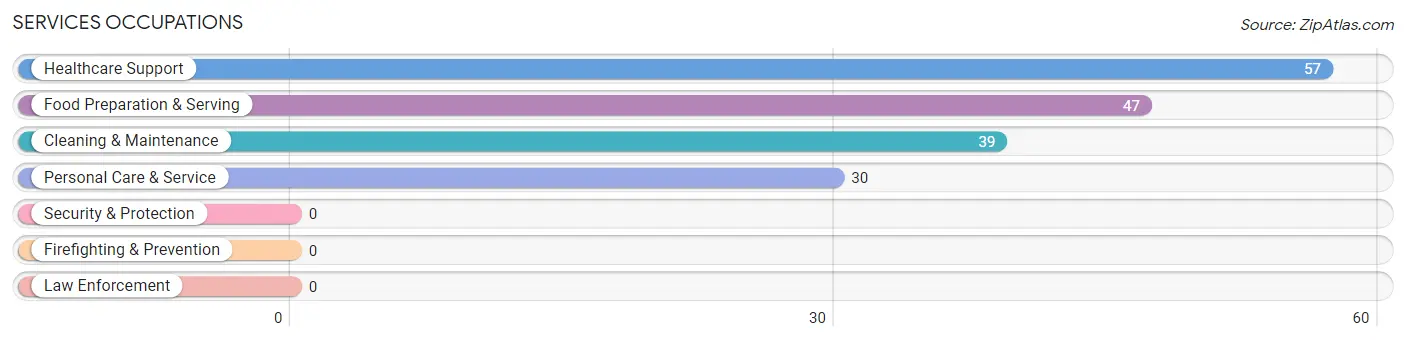
Services Occupations
The most common Services occupations in New London are Healthcare Support (57 | 5.4%), Food Preparation & Serving (47 | 4.4%), Cleaning & Maintenance (39 | 3.7%), and Personal Care & Service (30 | 2.8%).
Services Occupations by Sex
Within the Services occupations in New London, the most male-oriented occupations are Cleaning & Maintenance (76.9%), Food Preparation & Serving (25.5%), and Personal Care & Service (13.3%), while the most female-oriented occupations are Healthcare Support (100.0%), Personal Care & Service (86.7%), and Food Preparation & Serving (74.5%).
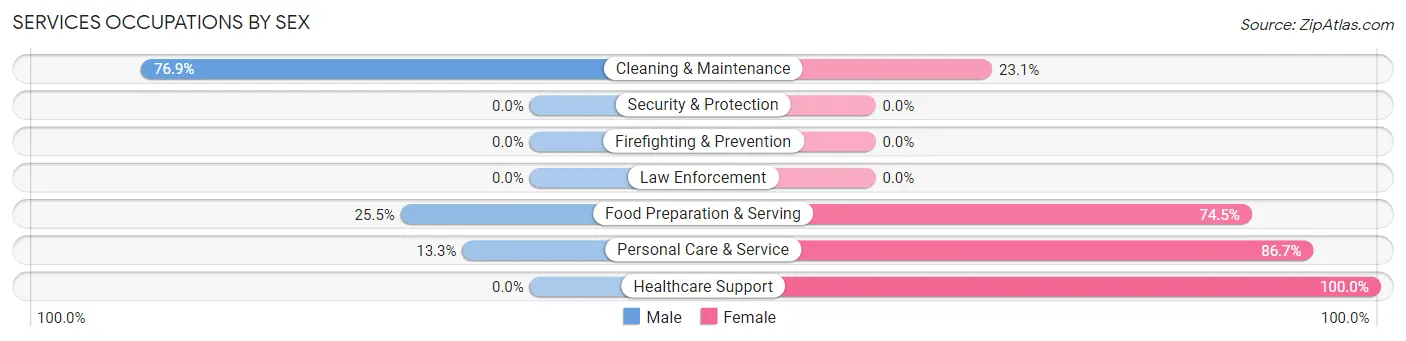
| Occupation | Male | Female |
| Healthcare Support | 0 (0.0%) | 57 (100.0%) |
| Security & Protection | 0 (0.0%) | 0 (0.0%) |
| Firefighting & Prevention | 0 (0.0%) | 0 (0.0%) |
| Law Enforcement | 0 (0.0%) | 0 (0.0%) |
| Food Preparation & Serving | 12 (25.5%) | 35 (74.5%) |
| Cleaning & Maintenance | 30 (76.9%) | 9 (23.1%) |
| Personal Care & Service | 4 (13.3%) | 26 (86.7%) |
| Total (Category) | 46 (26.6%) | 127 (73.4%) |
| Total (Overall) | 541 (51.1%) | 518 (48.9%) |
Sales and Office Occupations
The most common Sales and Office occupations in New London are Office & Administration (111 | 10.5%), and Sales & Related (64 | 6.0%).

Sales and Office Occupations by Sex
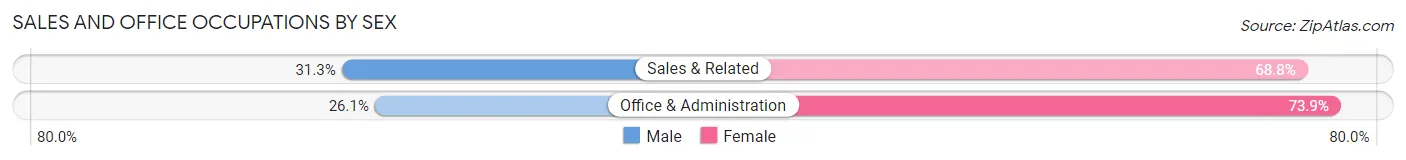
| Occupation | Male | Female |
| Sales & Related | 20 (31.2%) | 44 (68.8%) |
| Office & Administration | 29 (26.1%) | 82 (73.9%) |
| Total (Category) | 49 (28.0%) | 126 (72.0%) |
| Total (Overall) | 541 (51.1%) | 518 (48.9%) |
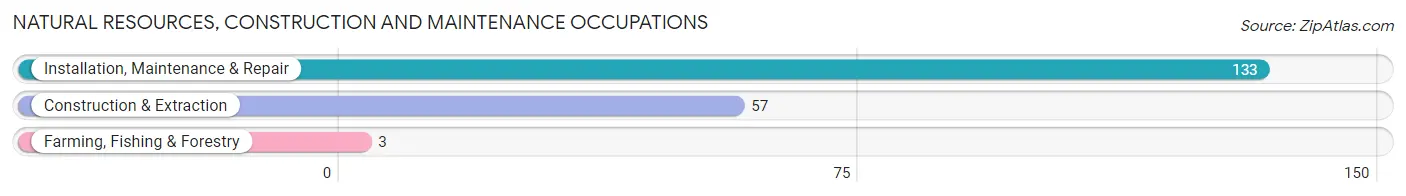
Natural Resources, Construction and Maintenance Occupations
The most common Natural Resources, Construction and Maintenance occupations in New London are Installation, Maintenance & Repair (133 | 12.6%), Construction & Extraction (57 | 5.4%), and Farming, Fishing & Forestry (3 | 0.3%).
Natural Resources, Construction and Maintenance Occupations by Sex
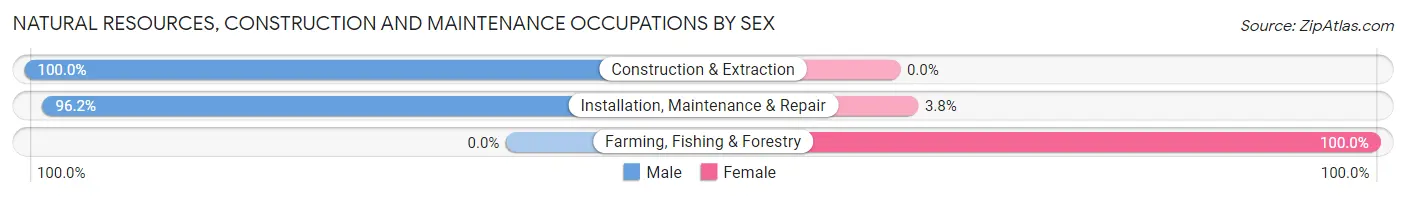
| Occupation | Male | Female |
| Farming, Fishing & Forestry | 0 (0.0%) | 3 (100.0%) |
| Construction & Extraction | 57 (100.0%) | 0 (0.0%) |
| Installation, Maintenance & Repair | 128 (96.2%) | 5 (3.8%) |
| Total (Category) | 185 (95.9%) | 8 (4.2%) |
| Total (Overall) | 541 (51.1%) | 518 (48.9%) |
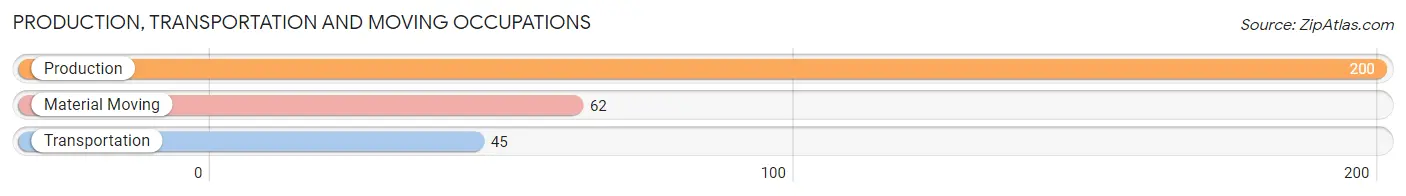
Production, Transportation and Moving Occupations
The most common Production, Transportation and Moving occupations in New London are Production (200 | 18.9%), Material Moving (62 | 5.9%), and Transportation (45 | 4.3%).
Production, Transportation and Moving Occupations by Sex
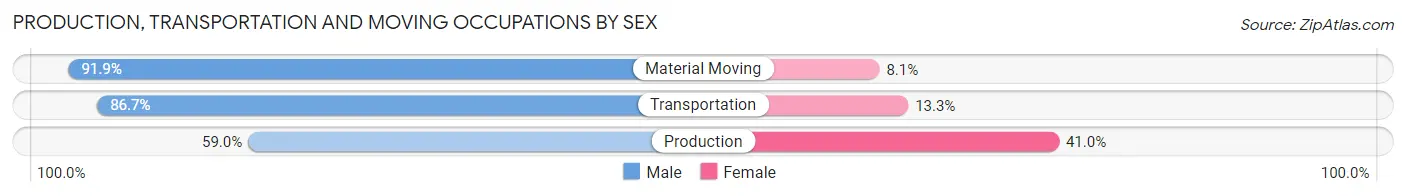
| Occupation | Male | Female |
| Production | 118 (59.0%) | 82 (41.0%) |
| Transportation | 39 (86.7%) | 6 (13.3%) |
| Material Moving | 57 (91.9%) | 5 (8.1%) |
| Total (Category) | 214 (69.7%) | 93 (30.3%) |
| Total (Overall) | 541 (51.1%) | 518 (48.9%) |
Employment Industries by Sex in New London
Employment Industries in New London
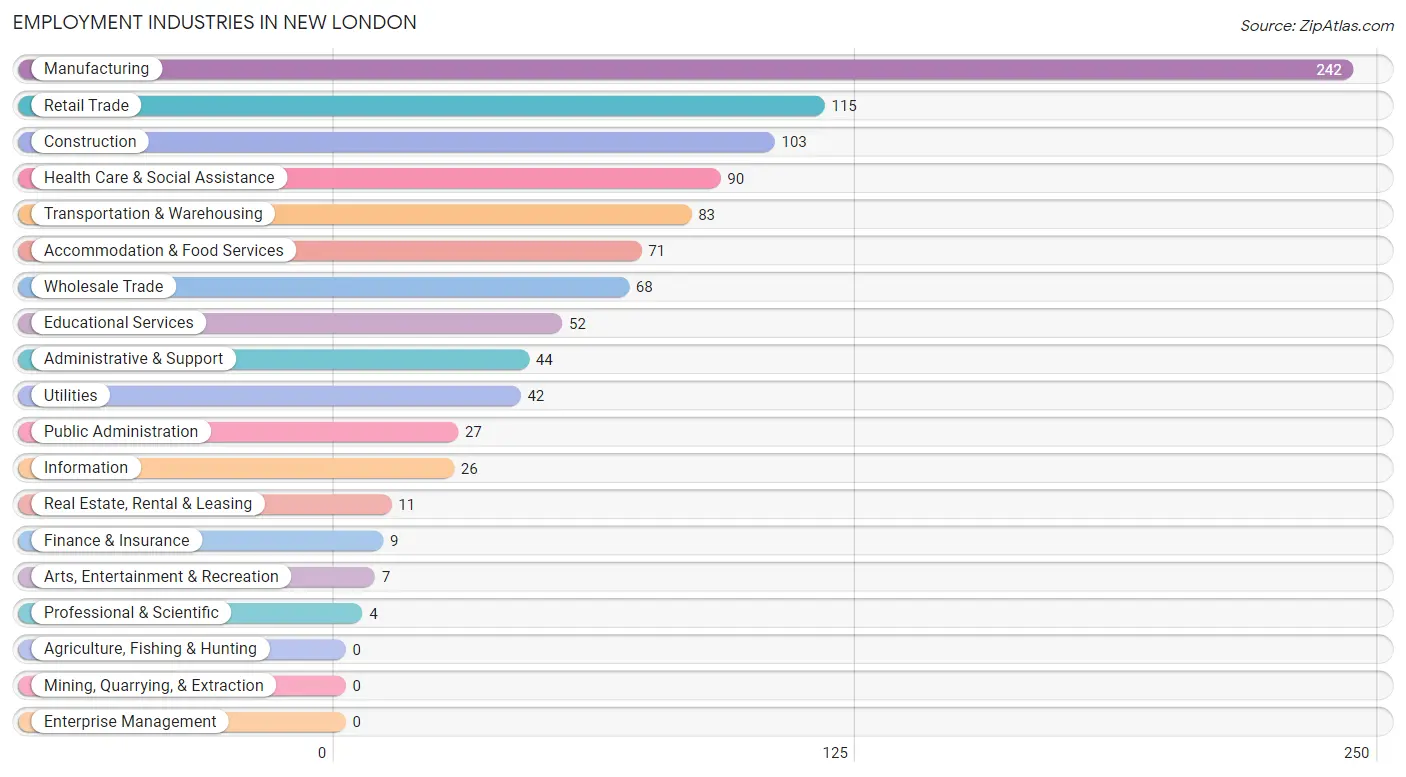
The major employment industries in New London include Manufacturing (242 | 22.9%), Retail Trade (115 | 10.9%), Construction (103 | 9.7%), Health Care & Social Assistance (90 | 8.5%), and Transportation & Warehousing (83 | 7.8%).
Employment Industries by Sex in New London
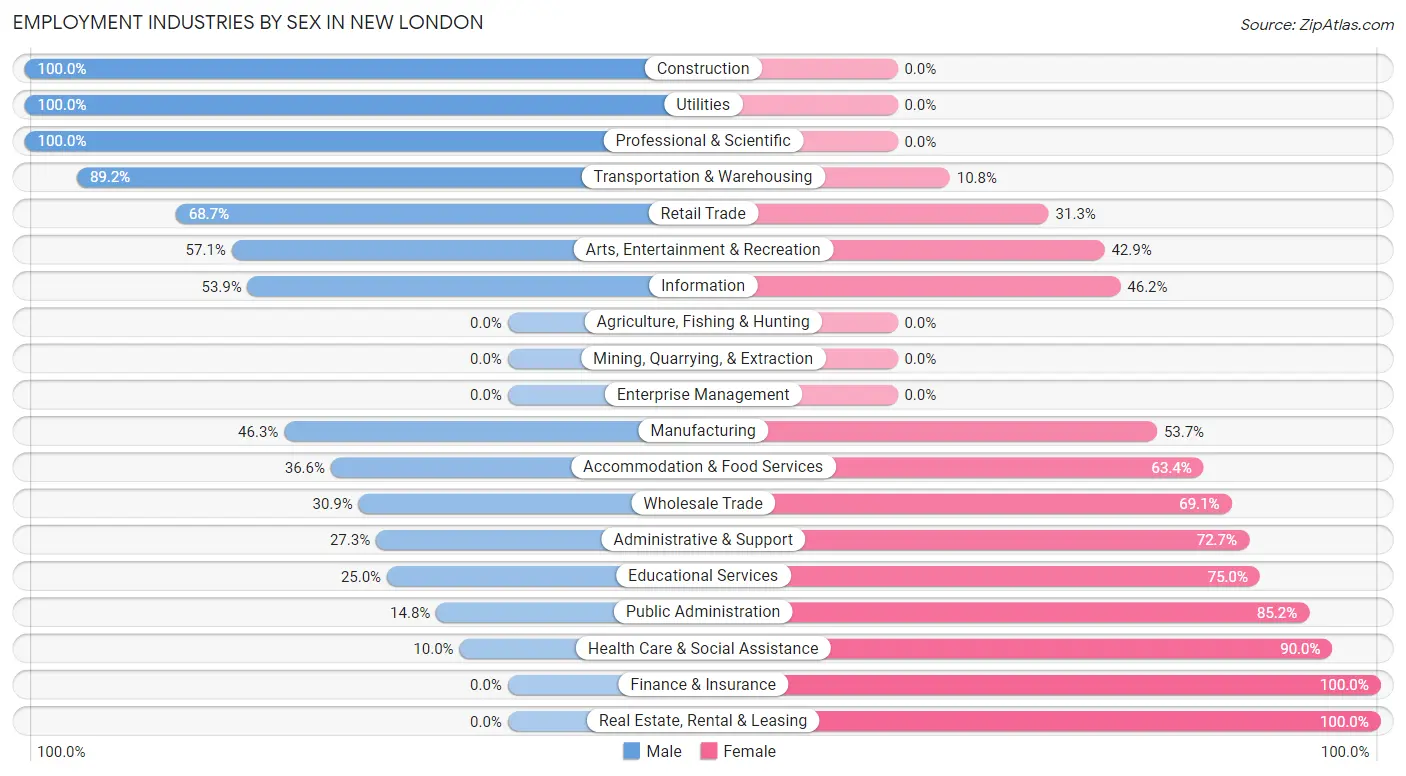
The New London industries that see more men than women are Construction (100.0%), Utilities (100.0%), and Professional & Scientific (100.0%), whereas the industries that tend to have a higher number of women are Finance & Insurance (100.0%), Real Estate, Rental & Leasing (100.0%), and Health Care & Social Assistance (90.0%).
| Industry | Male | Female |
| Agriculture, Fishing & Hunting | 0 (0.0%) | 0 (0.0%) |
| Mining, Quarrying, & Extraction | 0 (0.0%) | 0 (0.0%) |
| Construction | 103 (100.0%) | 0 (0.0%) |
| Manufacturing | 112 (46.3%) | 130 (53.7%) |
| Wholesale Trade | 21 (30.9%) | 47 (69.1%) |
| Retail Trade | 79 (68.7%) | 36 (31.3%) |
| Transportation & Warehousing | 74 (89.2%) | 9 (10.8%) |
| Utilities | 42 (100.0%) | 0 (0.0%) |
| Information | 14 (53.8%) | 12 (46.2%) |
| Finance & Insurance | 0 (0.0%) | 9 (100.0%) |
| Real Estate, Rental & Leasing | 0 (0.0%) | 11 (100.0%) |
| Professional & Scientific | 4 (100.0%) | 0 (0.0%) |
| Enterprise Management | 0 (0.0%) | 0 (0.0%) |
| Administrative & Support | 12 (27.3%) | 32 (72.7%) |
| Educational Services | 13 (25.0%) | 39 (75.0%) |
| Health Care & Social Assistance | 9 (10.0%) | 81 (90.0%) |
| Arts, Entertainment & Recreation | 4 (57.1%) | 3 (42.9%) |
| Accommodation & Food Services | 26 (36.6%) | 45 (63.4%) |
| Public Administration | 4 (14.8%) | 23 (85.2%) |
| Total | 541 (51.1%) | 518 (48.9%) |
Education in New London
School Enrollment in New London
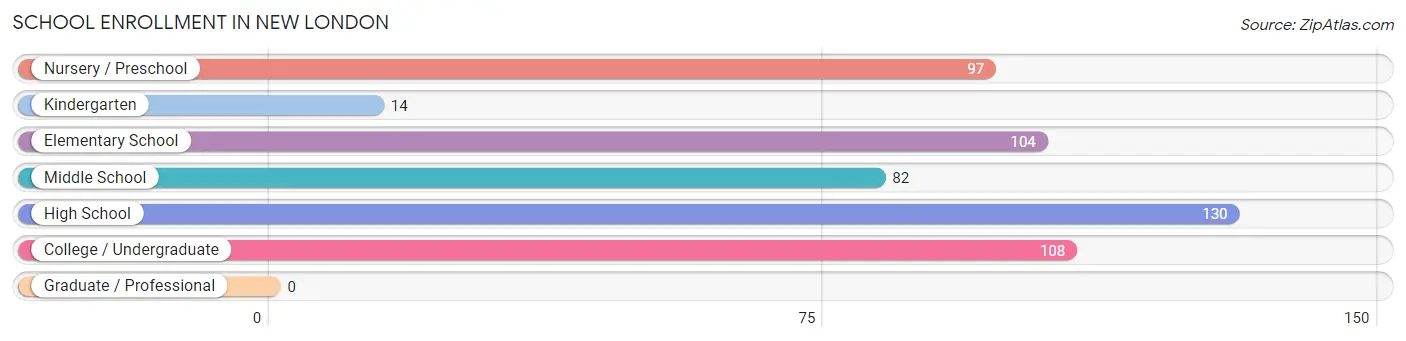
The most common levels of schooling among the 535 students in New London are high school (130 | 24.3%), college / undergraduate (108 | 20.2%), and elementary school (104 | 19.4%).
| School Level | # Students | % Students |
| Nursery / Preschool | 97 | 18.1% |
| Kindergarten | 14 | 2.6% |
| Elementary School | 104 | 19.4% |
| Middle School | 82 | 15.3% |
| High School | 130 | 24.3% |
| College / Undergraduate | 108 | 20.2% |
| Graduate / Professional | 0 | 0.0% |
| Total | 535 | 100.0% |
School Enrollment by Age by Funding Source in New London
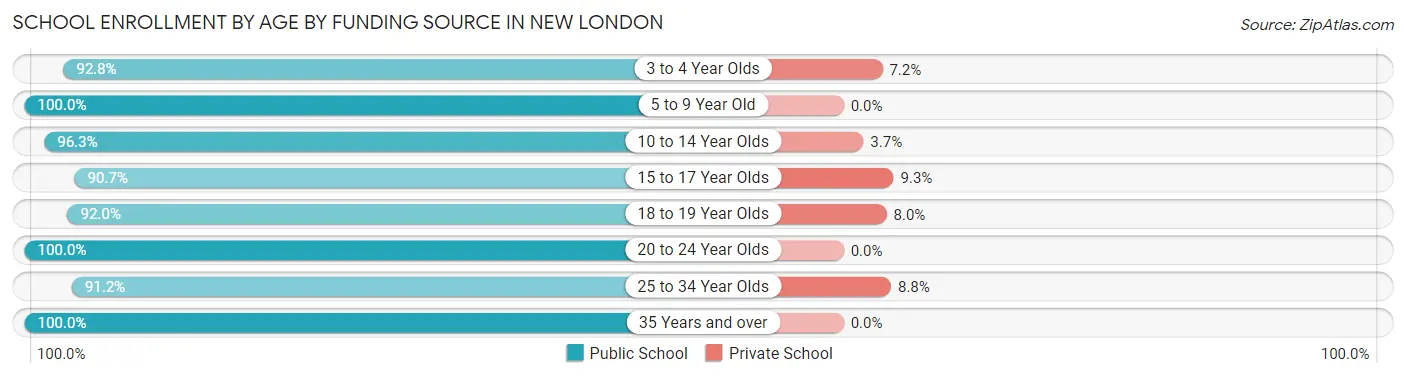
Out of a total of 535 students who are enrolled in schools in New London, 23 (4.3%) attend a private institution, while the remaining 512 (95.7%) are enrolled in public schools. The age group of 15 to 17 year olds has the highest likelihood of being enrolled in private schools, with 4 (9.3% in the age bracket) enrolled. Conversely, the age group of 5 to 9 year old has the lowest likelihood of being enrolled in a private school, with 100 (100.0% in the age bracket) attending a public institution.
| Age Bracket | Public School | Private School |
| 3 to 4 Year Olds | 90 (92.8%) | 7 (7.2%) |
| 5 to 9 Year Old | 100 (100.0%) | 0 (0.0%) |
| 10 to 14 Year Olds | 131 (96.3%) | 5 (3.7%) |
| 15 to 17 Year Olds | 39 (90.7%) | 4 (9.3%) |
| 18 to 19 Year Olds | 46 (92.0%) | 4 (8.0%) |
| 20 to 24 Year Olds | 45 (100.0%) | 0 (0.0%) |
| 25 to 34 Year Olds | 31 (91.2%) | 3 (8.8%) |
| 35 Years and over | 30 (100.0%) | 0 (0.0%) |
| Total | 512 (95.7%) | 23 (4.3%) |
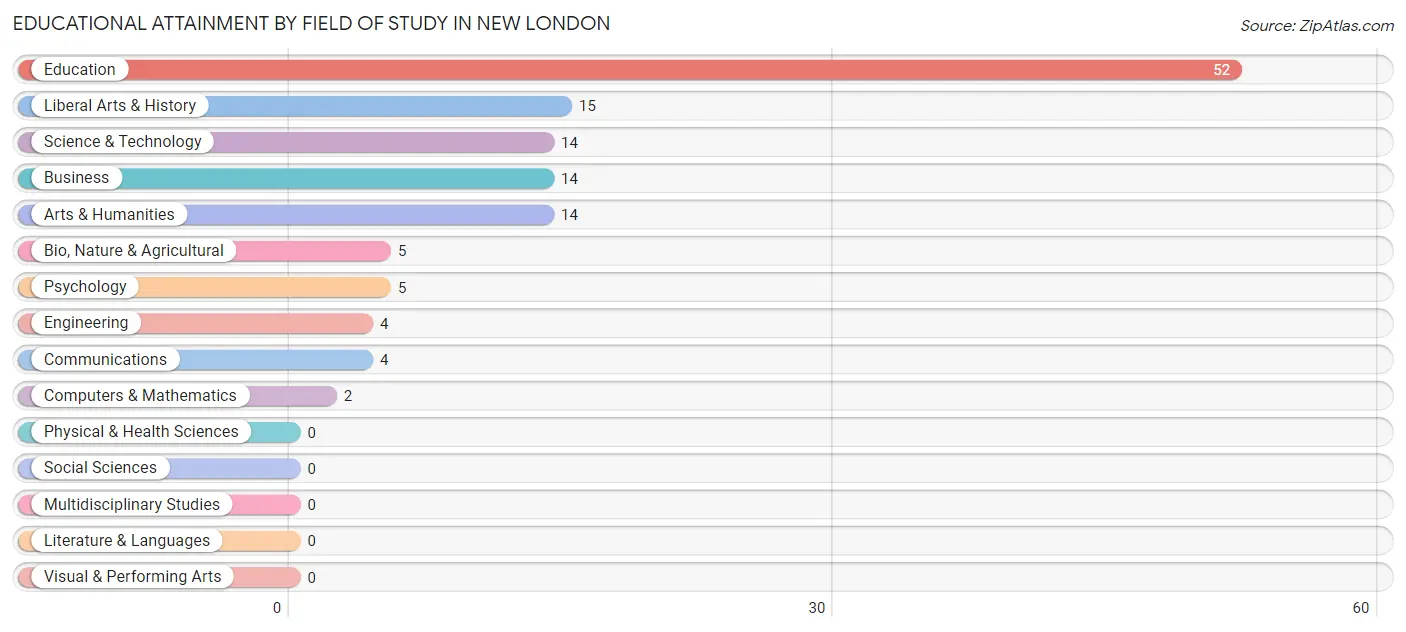
Educational Attainment by Field of Study in New London
Education (52 | 40.3%), liberal arts & history (15 | 11.6%), science & technology (14 | 10.8%), business (14 | 10.8%), and arts & humanities (14 | 10.8%) are the most common fields of study among 129 individuals in New London who have obtained a bachelor's degree or higher.
| Field of Study | # Graduates | % Graduates |
| Computers & Mathematics | 2 | 1.5% |
| Bio, Nature & Agricultural | 5 | 3.9% |
| Physical & Health Sciences | 0 | 0.0% |
| Psychology | 5 | 3.9% |
| Social Sciences | 0 | 0.0% |
| Engineering | 4 | 3.1% |
| Multidisciplinary Studies | 0 | 0.0% |
| Science & Technology | 14 | 10.8% |
| Business | 14 | 10.8% |
| Education | 52 | 40.3% |
| Literature & Languages | 0 | 0.0% |
| Liberal Arts & History | 15 | 11.6% |
| Visual & Performing Arts | 0 | 0.0% |
| Communications | 4 | 3.1% |
| Arts & Humanities | 14 | 10.8% |
| Total | 129 | 100.0% |
Transportation & Commute in New London
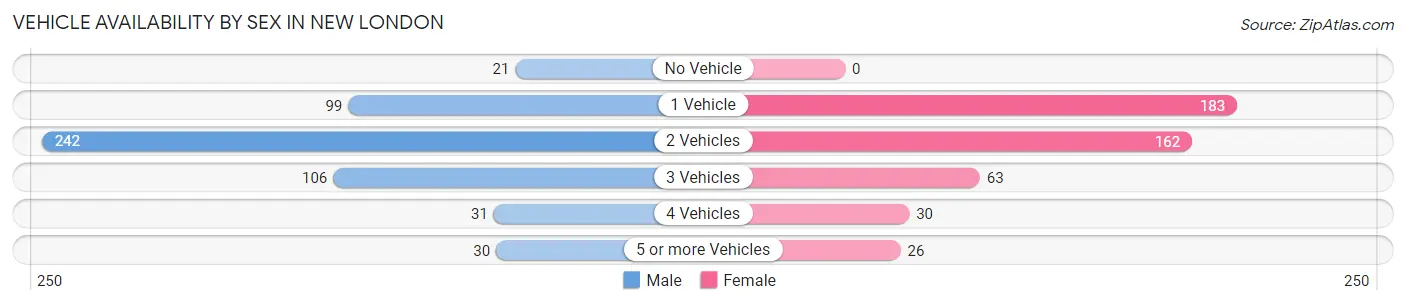
Vehicle Availability by Sex in New London
The most prevalent vehicle ownership categories in New London are males with 2 vehicles (242, accounting for 45.8%) and females with 2 vehicles (162, making up 52.2%).
| Vehicles Available | Male | Female |
| No Vehicle | 21 (4.0%) | 0 (0.0%) |
| 1 Vehicle | 99 (18.7%) | 183 (39.4%) |
| 2 Vehicles | 242 (45.8%) | 162 (34.9%) |
| 3 Vehicles | 106 (20.0%) | 63 (13.6%) |
| 4 Vehicles | 31 (5.9%) | 30 (6.5%) |
| 5 or more Vehicles | 30 (5.7%) | 26 (5.6%) |
| Total | 529 (100.0%) | 464 (100.0%) |
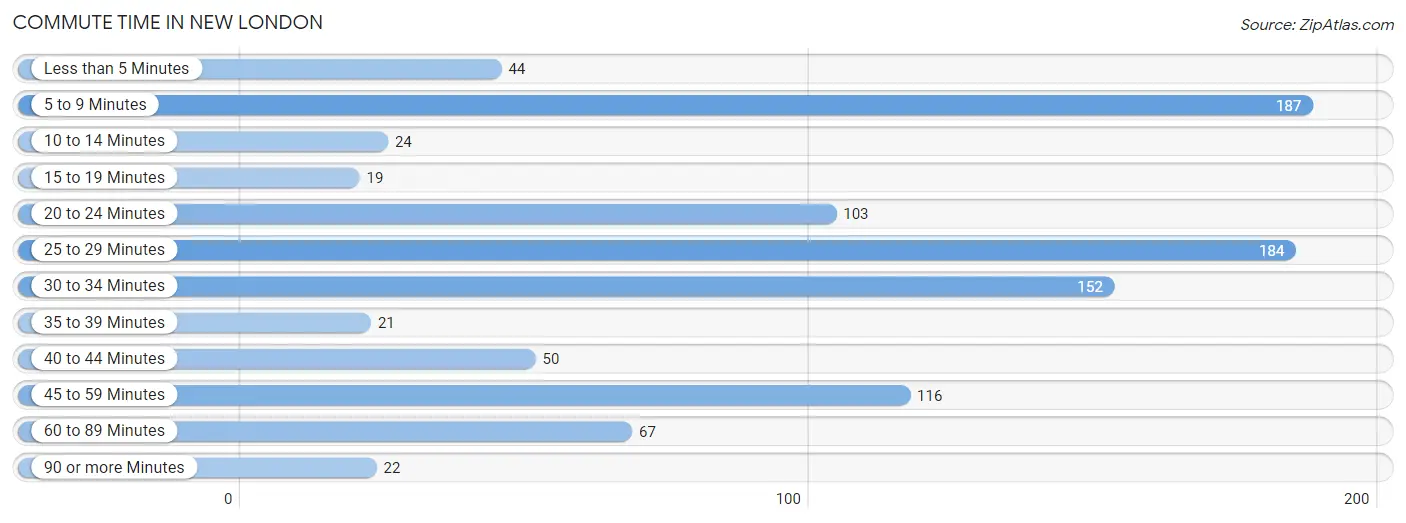
Commute Time in New London
The most frequently occuring commute durations in New London are 5 to 9 minutes (187 commuters, 18.9%), 25 to 29 minutes (184 commuters, 18.6%), and 30 to 34 minutes (152 commuters, 15.4%).
| Commute Time | # Commuters | % Commuters |
| Less than 5 Minutes | 44 | 4.4% |
| 5 to 9 Minutes | 187 | 18.9% |
| 10 to 14 Minutes | 24 | 2.4% |
| 15 to 19 Minutes | 19 | 1.9% |
| 20 to 24 Minutes | 103 | 10.4% |
| 25 to 29 Minutes | 184 | 18.6% |
| 30 to 34 Minutes | 152 | 15.4% |
| 35 to 39 Minutes | 21 | 2.1% |
| 40 to 44 Minutes | 50 | 5.1% |
| 45 to 59 Minutes | 116 | 11.7% |
| 60 to 89 Minutes | 67 | 6.8% |
| 90 or more Minutes | 22 | 2.2% |
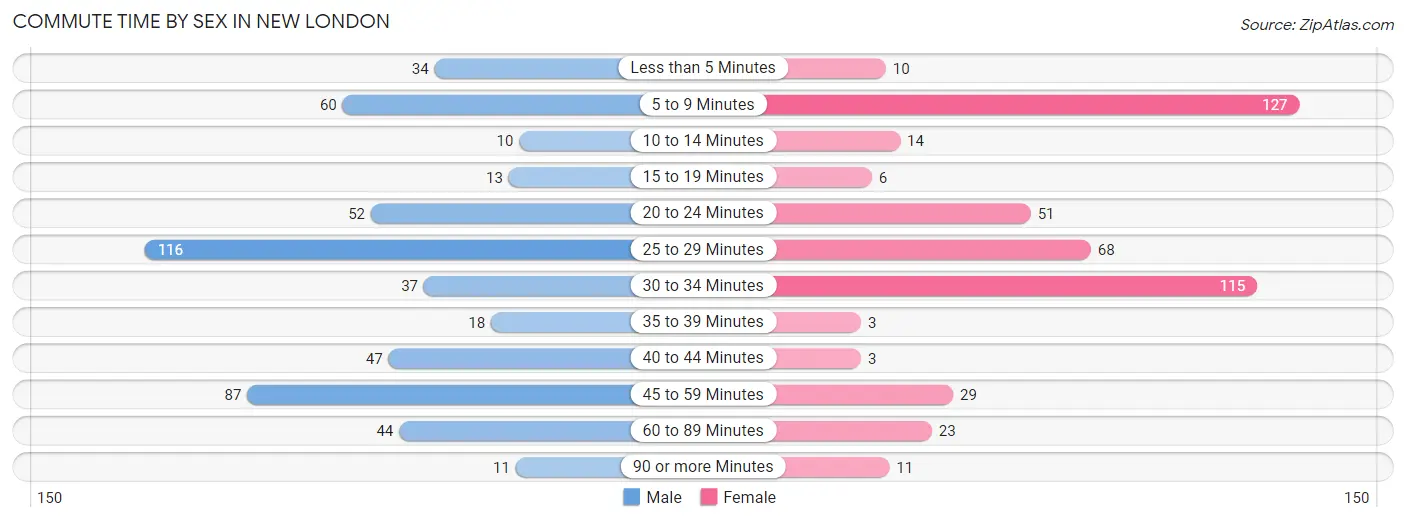
Commute Time by Sex in New London
The most common commute times in New London are 25 to 29 minutes (116 commuters, 21.9%) for males and 5 to 9 minutes (127 commuters, 27.6%) for females.
| Commute Time | Male | Female |
| Less than 5 Minutes | 34 (6.4%) | 10 (2.2%) |
| 5 to 9 Minutes | 60 (11.3%) | 127 (27.6%) |
| 10 to 14 Minutes | 10 (1.9%) | 14 (3.0%) |
| 15 to 19 Minutes | 13 (2.5%) | 6 (1.3%) |
| 20 to 24 Minutes | 52 (9.8%) | 51 (11.1%) |
| 25 to 29 Minutes | 116 (21.9%) | 68 (14.8%) |
| 30 to 34 Minutes | 37 (7.0%) | 115 (25.0%) |
| 35 to 39 Minutes | 18 (3.4%) | 3 (0.6%) |
| 40 to 44 Minutes | 47 (8.9%) | 3 (0.6%) |
| 45 to 59 Minutes | 87 (16.5%) | 29 (6.3%) |
| 60 to 89 Minutes | 44 (8.3%) | 23 (5.0%) |
| 90 or more Minutes | 11 (2.1%) | 11 (2.4%) |
Time of Departure to Work by Sex in New London
The most frequent times of departure to work in New London are 7:00 AM to 7:29 AM (121, 22.9%) for males and 7:00 AM to 7:29 AM (98, 21.3%) for females.
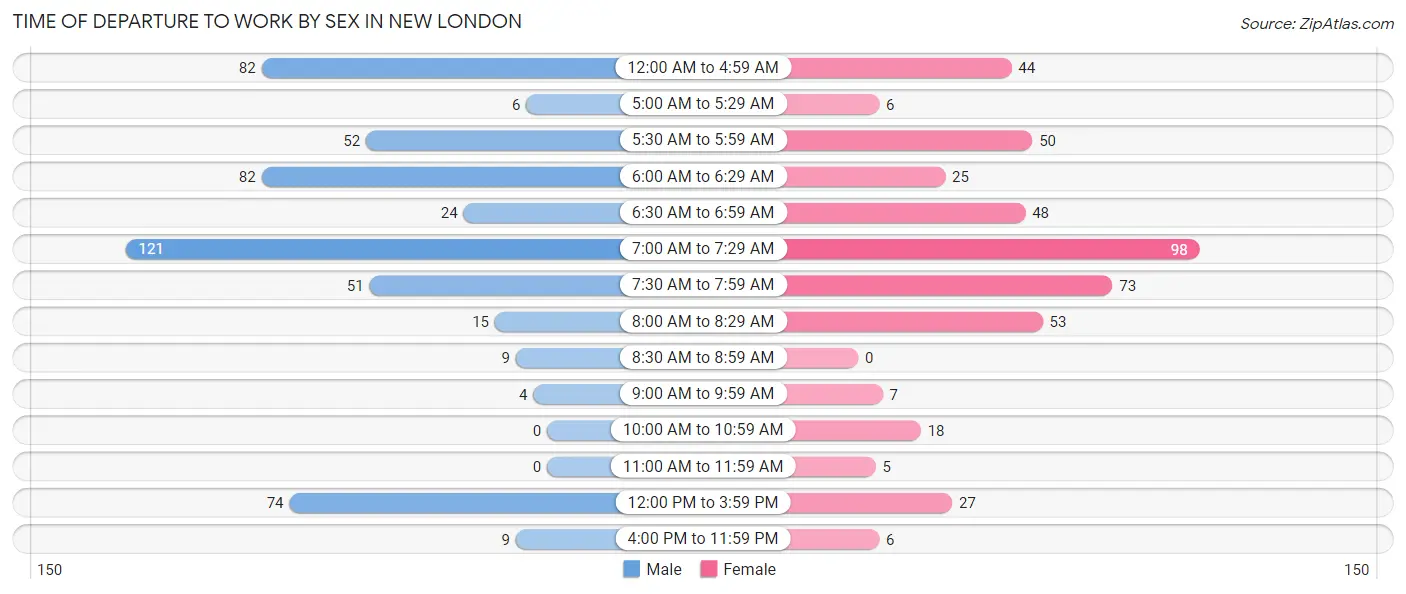
| Time of Departure | Male | Female |
| 12:00 AM to 4:59 AM | 82 (15.5%) | 44 (9.6%) |
| 5:00 AM to 5:29 AM | 6 (1.1%) | 6 (1.3%) |
| 5:30 AM to 5:59 AM | 52 (9.8%) | 50 (10.9%) |
| 6:00 AM to 6:29 AM | 82 (15.5%) | 25 (5.4%) |
| 6:30 AM to 6:59 AM | 24 (4.5%) | 48 (10.4%) |
| 7:00 AM to 7:29 AM | 121 (22.9%) | 98 (21.3%) |
| 7:30 AM to 7:59 AM | 51 (9.6%) | 73 (15.9%) |
| 8:00 AM to 8:29 AM | 15 (2.8%) | 53 (11.5%) |
| 8:30 AM to 8:59 AM | 9 (1.7%) | 0 (0.0%) |
| 9:00 AM to 9:59 AM | 4 (0.8%) | 7 (1.5%) |
| 10:00 AM to 10:59 AM | 0 (0.0%) | 18 (3.9%) |
| 11:00 AM to 11:59 AM | 0 (0.0%) | 5 (1.1%) |
| 12:00 PM to 3:59 PM | 74 (14.0%) | 27 (5.9%) |
| 4:00 PM to 11:59 PM | 9 (1.7%) | 6 (1.3%) |
| Total | 529 (100.0%) | 460 (100.0%) |
Housing Occupancy in New London
Occupancy by Ownership in New London
Of the total 980 dwellings in New London, owner-occupied units account for 618 (63.1%), while renter-occupied units make up 362 (36.9%).
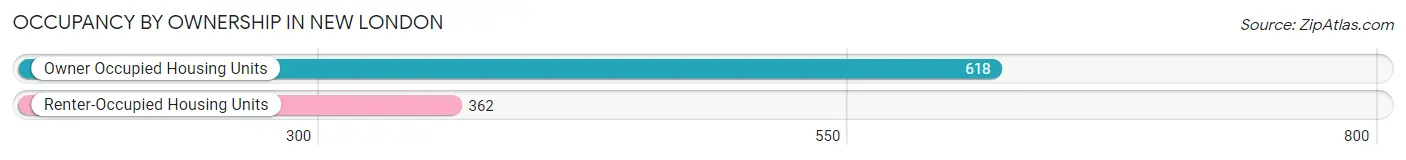
| Occupancy | # Housing Units | % Housing Units |
| Owner Occupied Housing Units | 618 | 63.1% |
| Renter-Occupied Housing Units | 362 | 36.9% |
| Total Occupied Housing Units | 980 | 100.0% |
Occupancy by Household Size in New London
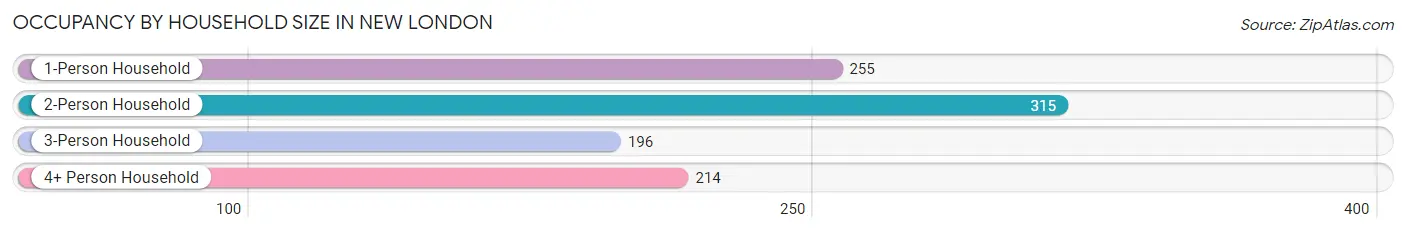
| Household Size | # Housing Units | % Housing Units |
| 1-Person Household | 255 | 26.0% |
| 2-Person Household | 315 | 32.1% |
| 3-Person Household | 196 | 20.0% |
| 4+ Person Household | 214 | 21.8% |
| Total Housing Units | 980 | 100.0% |
Occupancy by Ownership by Household Size in New London
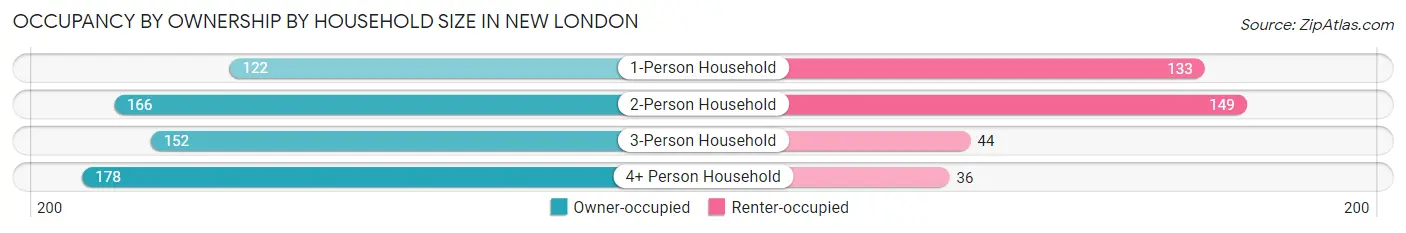
| Household Size | Owner-occupied | Renter-occupied |
| 1-Person Household | 122 (47.8%) | 133 (52.2%) |
| 2-Person Household | 166 (52.7%) | 149 (47.3%) |
| 3-Person Household | 152 (77.5%) | 44 (22.5%) |
| 4+ Person Household | 178 (83.2%) | 36 (16.8%) |
| Total Housing Units | 618 (63.1%) | 362 (36.9%) |
Occupancy by Educational Attainment in New London
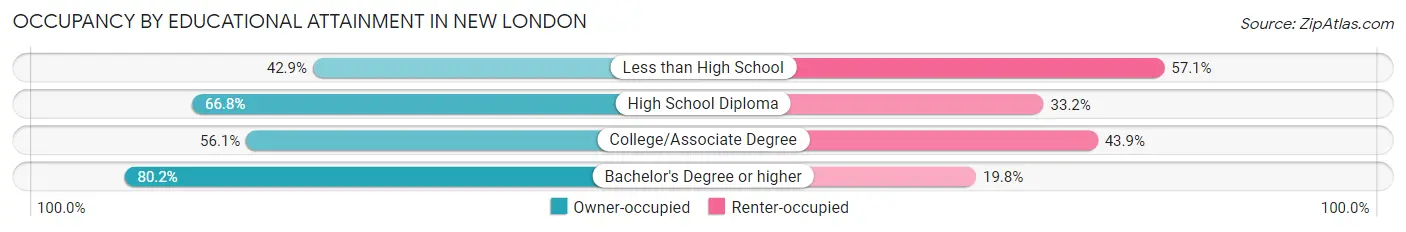
| Household Size | Owner-occupied | Renter-occupied |
| Less than High School | 36 (42.9%) | 48 (57.1%) |
| High School Diploma | 344 (66.8%) | 171 (33.2%) |
| College/Associate Degree | 157 (56.1%) | 123 (43.9%) |
| Bachelor's Degree or higher | 81 (80.2%) | 20 (19.8%) |
Occupancy by Age of Householder in New London
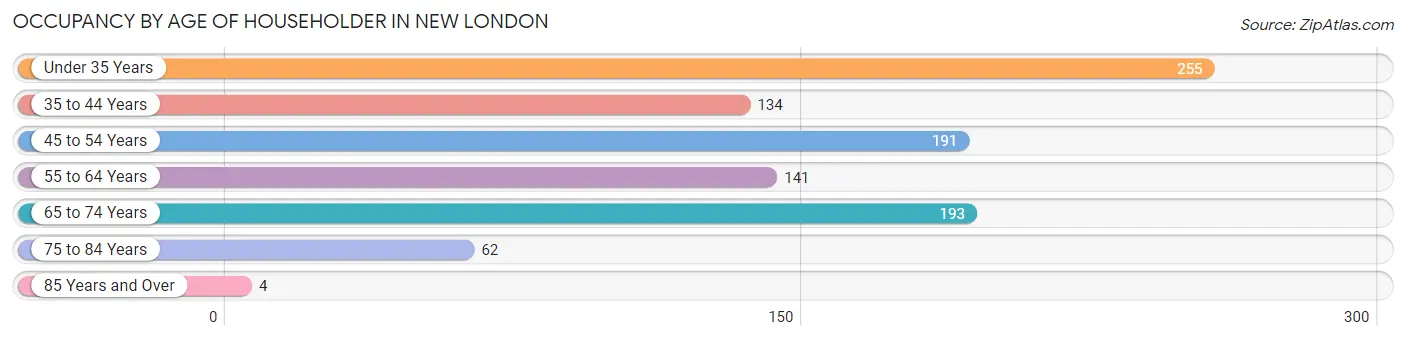
| Age Bracket | # Households | % Households |
| Under 35 Years | 255 | 26.0% |
| 35 to 44 Years | 134 | 13.7% |
| 45 to 54 Years | 191 | 19.5% |
| 55 to 64 Years | 141 | 14.4% |
| 65 to 74 Years | 193 | 19.7% |
| 75 to 84 Years | 62 | 6.3% |
| 85 Years and Over | 4 | 0.4% |
| Total | 980 | 100.0% |
Housing Finances in New London
Median Income by Occupancy in New London
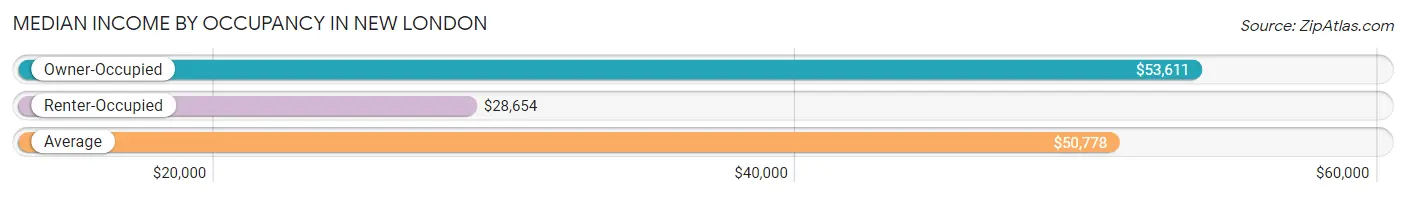
| Occupancy Type | # Households | Median Income |
| Owner-Occupied | 618 (63.1%) | $53,611 |
| Renter-Occupied | 362 (36.9%) | $28,654 |
| Average | 980 (100.0%) | $50,778 |
Occupancy by Householder Income Bracket in New London
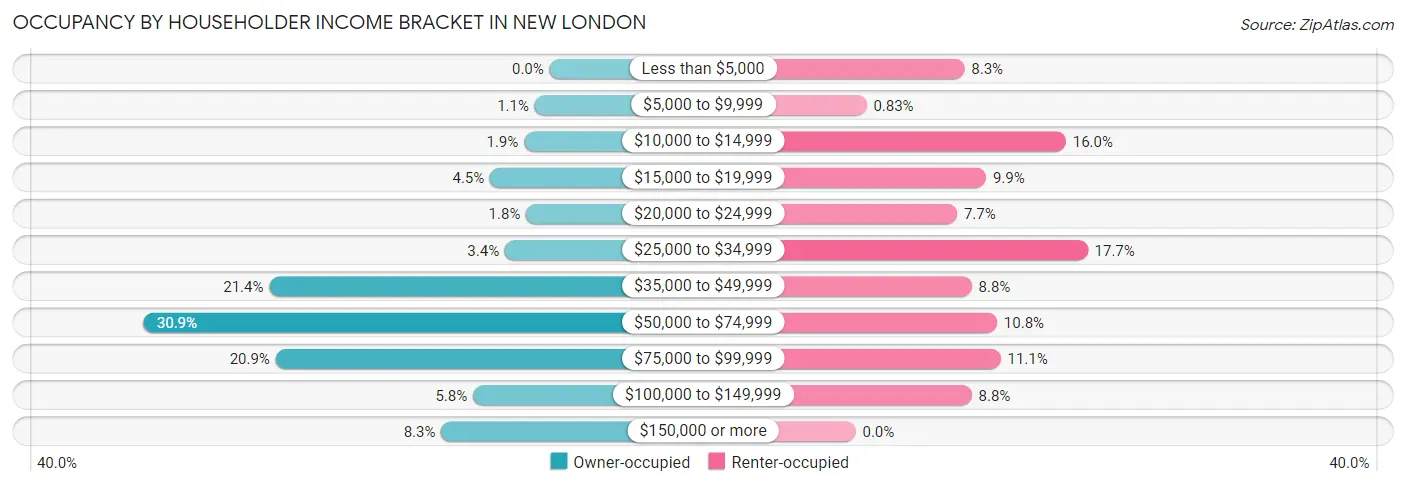
| Income Bracket | Owner-occupied | Renter-occupied |
| Less than $5,000 | 0 (0.0%) | 30 (8.3%) |
| $5,000 to $9,999 | 7 (1.1%) | 3 (0.8%) |
| $10,000 to $14,999 | 12 (1.9%) | 58 (16.0%) |
| $15,000 to $19,999 | 28 (4.5%) | 36 (9.9%) |
| $20,000 to $24,999 | 11 (1.8%) | 28 (7.7%) |
| $25,000 to $34,999 | 21 (3.4%) | 64 (17.7%) |
| $35,000 to $49,999 | 132 (21.4%) | 32 (8.8%) |
| $50,000 to $74,999 | 191 (30.9%) | 39 (10.8%) |
| $75,000 to $99,999 | 129 (20.9%) | 40 (11.1%) |
| $100,000 to $149,999 | 36 (5.8%) | 32 (8.8%) |
| $150,000 or more | 51 (8.3%) | 0 (0.0%) |
| Total | 618 (100.0%) | 362 (100.0%) |
Monthly Housing Cost Tiers in New London
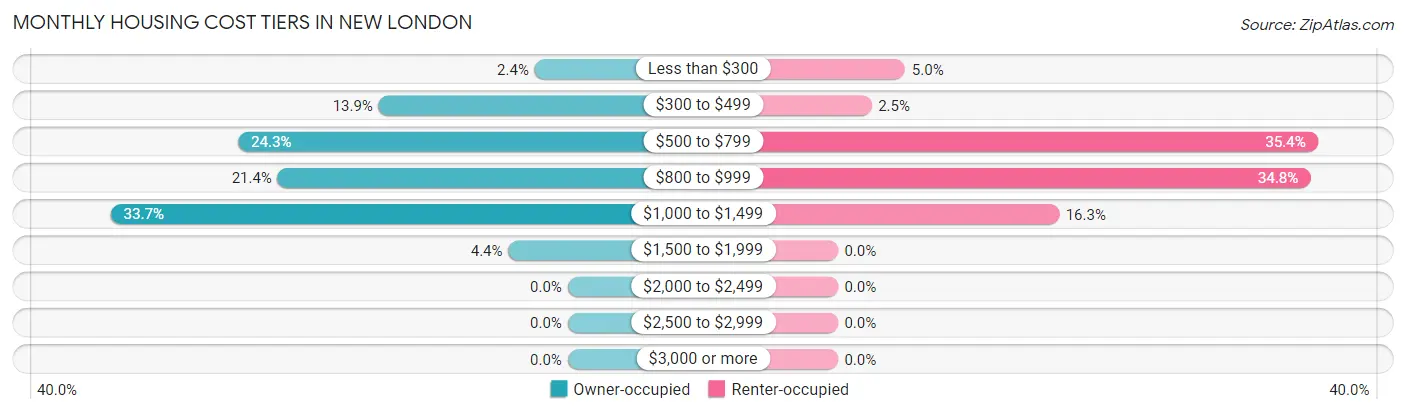
| Monthly Cost | Owner-occupied | Renter-occupied |
| Less than $300 | 15 (2.4%) | 18 (5.0%) |
| $300 to $499 | 86 (13.9%) | 9 (2.5%) |
| $500 to $799 | 150 (24.3%) | 128 (35.4%) |
| $800 to $999 | 132 (21.4%) | 126 (34.8%) |
| $1,000 to $1,499 | 208 (33.7%) | 59 (16.3%) |
| $1,500 to $1,999 | 27 (4.4%) | 0 (0.0%) |
| $2,000 to $2,499 | 0 (0.0%) | 0 (0.0%) |
| $2,500 to $2,999 | 0 (0.0%) | 0 (0.0%) |
| $3,000 or more | 0 (0.0%) | 0 (0.0%) |
| Total | 618 (100.0%) | 362 (100.0%) |
Physical Housing Characteristics in New London
Housing Structures in New London
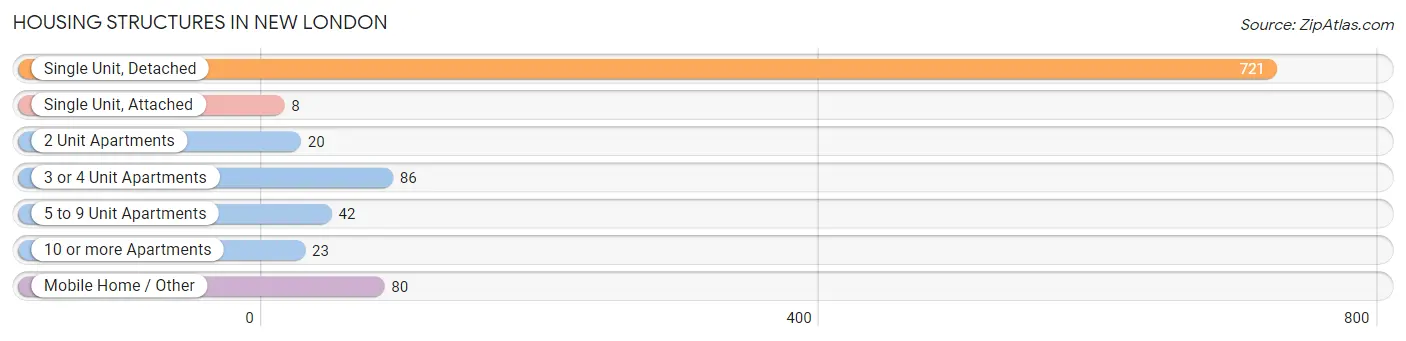
| Structure Type | # Housing Units | % Housing Units |
| Single Unit, Detached | 721 | 73.6% |
| Single Unit, Attached | 8 | 0.8% |
| 2 Unit Apartments | 20 | 2.0% |
| 3 or 4 Unit Apartments | 86 | 8.8% |
| 5 to 9 Unit Apartments | 42 | 4.3% |
| 10 or more Apartments | 23 | 2.4% |
| Mobile Home / Other | 80 | 8.2% |
| Total | 980 | 100.0% |
Housing Structures by Occupancy in New London
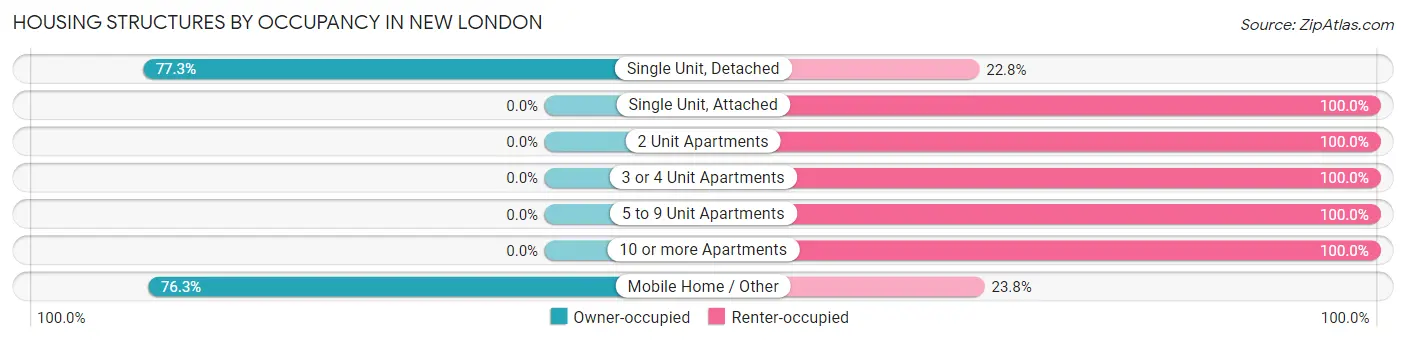
| Structure Type | Owner-occupied | Renter-occupied |
| Single Unit, Detached | 557 (77.2%) | 164 (22.8%) |
| Single Unit, Attached | 0 (0.0%) | 8 (100.0%) |
| 2 Unit Apartments | 0 (0.0%) | 20 (100.0%) |
| 3 or 4 Unit Apartments | 0 (0.0%) | 86 (100.0%) |
| 5 to 9 Unit Apartments | 0 (0.0%) | 42 (100.0%) |
| 10 or more Apartments | 0 (0.0%) | 23 (100.0%) |
| Mobile Home / Other | 61 (76.2%) | 19 (23.7%) |
| Total | 618 (63.1%) | 362 (36.9%) |
Housing Structures by Number of Rooms in New London
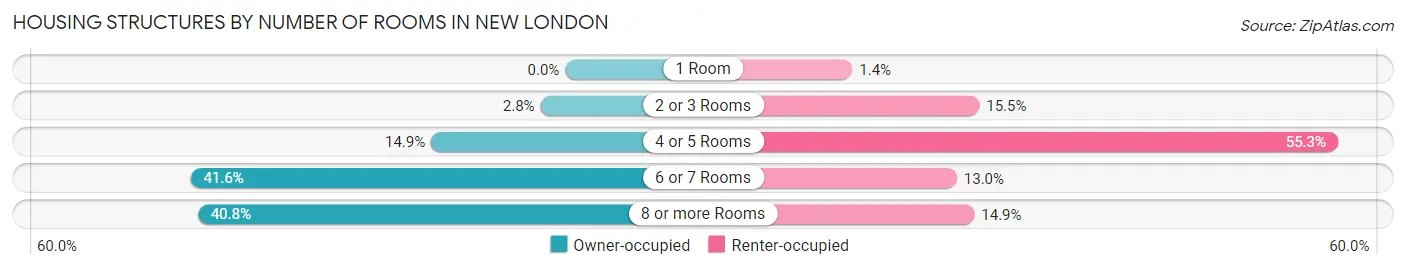
| Number of Rooms | Owner-occupied | Renter-occupied |
| 1 Room | 0 (0.0%) | 5 (1.4%) |
| 2 or 3 Rooms | 17 (2.8%) | 56 (15.5%) |
| 4 or 5 Rooms | 92 (14.9%) | 200 (55.2%) |
| 6 or 7 Rooms | 257 (41.6%) | 47 (13.0%) |
| 8 or more Rooms | 252 (40.8%) | 54 (14.9%) |
| Total | 618 (100.0%) | 362 (100.0%) |
Housing Structure by Heating Type in New London
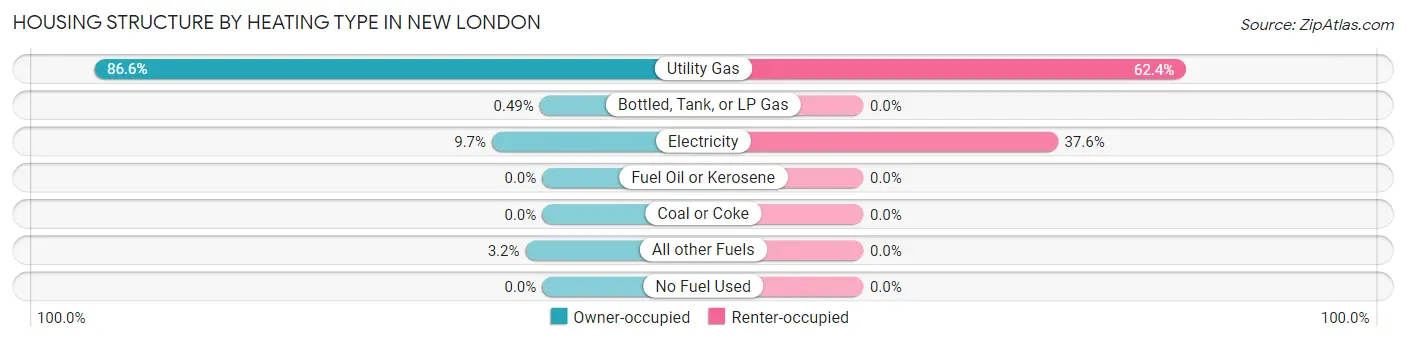
| Heating Type | Owner-occupied | Renter-occupied |
| Utility Gas | 535 (86.6%) | 226 (62.4%) |
| Bottled, Tank, or LP Gas | 3 (0.5%) | 0 (0.0%) |
| Electricity | 60 (9.7%) | 136 (37.6%) |
| Fuel Oil or Kerosene | 0 (0.0%) | 0 (0.0%) |
| Coal or Coke | 0 (0.0%) | 0 (0.0%) |
| All other Fuels | 20 (3.2%) | 0 (0.0%) |
| No Fuel Used | 0 (0.0%) | 0 (0.0%) |
| Total | 618 (100.0%) | 362 (100.0%) |
Household Vehicle Usage in New London
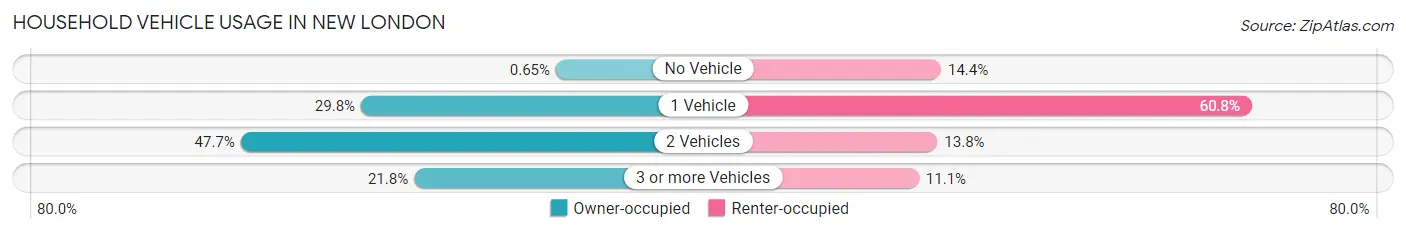
| Vehicles per Household | Owner-occupied | Renter-occupied |
| No Vehicle | 4 (0.6%) | 52 (14.4%) |
| 1 Vehicle | 184 (29.8%) | 220 (60.8%) |
| 2 Vehicles | 295 (47.7%) | 50 (13.8%) |
| 3 or more Vehicles | 135 (21.8%) | 40 (11.1%) |
| Total | 618 (100.0%) | 362 (100.0%) |
Real Estate & Mortgages in New London
Real Estate and Mortgage Overview in New London
| Characteristic | Without Mortgage | With Mortgage |
| Housing Units | 186 | 432 |
| Median Property Value | $94,700 | $102,300 |
| Median Household Income | $50,250 | $40 |
| Monthly Housing Costs | $483 | $0 |
| Real Estate Taxes | $946 | $19 |
Property Value by Mortgage Status in New London
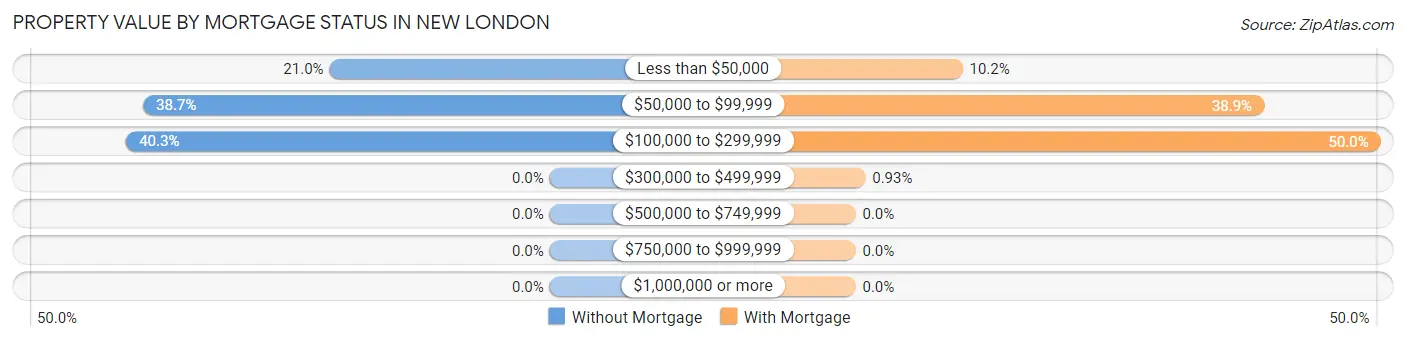
| Property Value | Without Mortgage | With Mortgage |
| Less than $50,000 | 39 (21.0%) | 44 (10.2%) |
| $50,000 to $99,999 | 72 (38.7%) | 168 (38.9%) |
| $100,000 to $299,999 | 75 (40.3%) | 216 (50.0%) |
| $300,000 to $499,999 | 0 (0.0%) | 4 (0.9%) |
| $500,000 to $749,999 | 0 (0.0%) | 0 (0.0%) |
| $750,000 to $999,999 | 0 (0.0%) | 0 (0.0%) |
| $1,000,000 or more | 0 (0.0%) | 0 (0.0%) |
| Total | 186 (100.0%) | 432 (100.0%) |
Household Income by Mortgage Status in New London
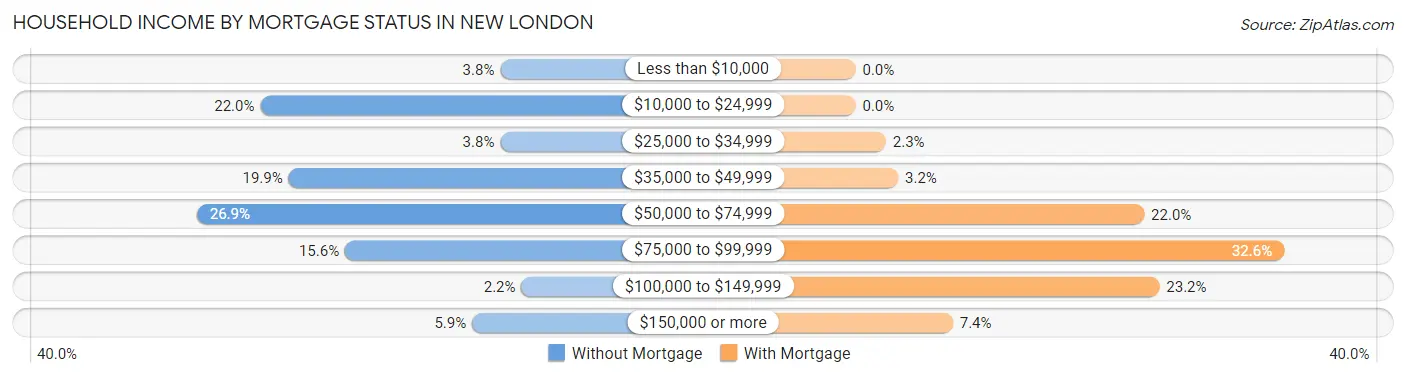
| Household Income | Without Mortgage | With Mortgage |
| Less than $10,000 | 7 (3.8%) | 0 (0.0%) |
| $10,000 to $24,999 | 41 (22.0%) | 0 (0.0%) |
| $25,000 to $34,999 | 7 (3.8%) | 10 (2.3%) |
| $35,000 to $49,999 | 37 (19.9%) | 14 (3.2%) |
| $50,000 to $74,999 | 50 (26.9%) | 95 (22.0%) |
| $75,000 to $99,999 | 29 (15.6%) | 141 (32.6%) |
| $100,000 to $149,999 | 4 (2.1%) | 100 (23.2%) |
| $150,000 or more | 11 (5.9%) | 32 (7.4%) |
| Total | 186 (100.0%) | 432 (100.0%) |
Property Value to Household Income Ratio in New London
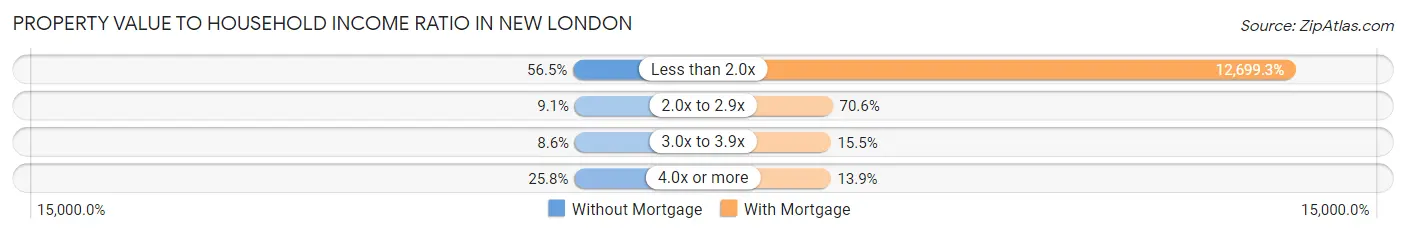
| Value-to-Income Ratio | Without Mortgage | With Mortgage |
| Less than 2.0x | 105 (56.5%) | 54,861 (12,699.3%) |
| 2.0x to 2.9x | 17 (9.1%) | 305 (70.6%) |
| 3.0x to 3.9x | 16 (8.6%) | 67 (15.5%) |
| 4.0x or more | 48 (25.8%) | 60 (13.9%) |
| Total | 186 (100.0%) | 432 (100.0%) |
Real Estate Taxes by Mortgage Status in New London
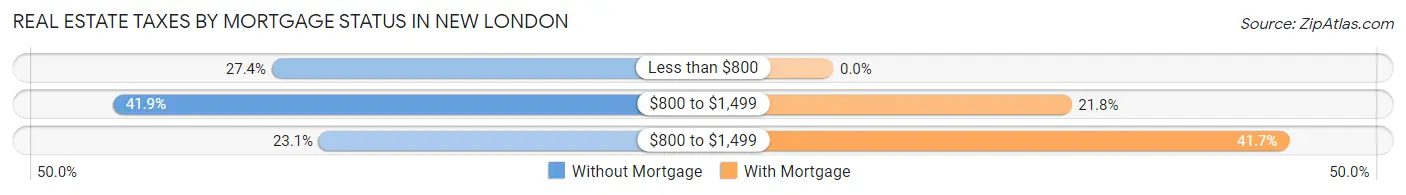
| Property Taxes | Without Mortgage | With Mortgage |
| Less than $800 | 51 (27.4%) | 0 (0.0%) |
| $800 to $1,499 | 78 (41.9%) | 94 (21.8%) |
| $800 to $1,499 | 43 (23.1%) | 180 (41.7%) |
| Total | 186 (100.0%) | 432 (100.0%) |
Health & Disability in New London
Health Insurance Coverage by Age in New London
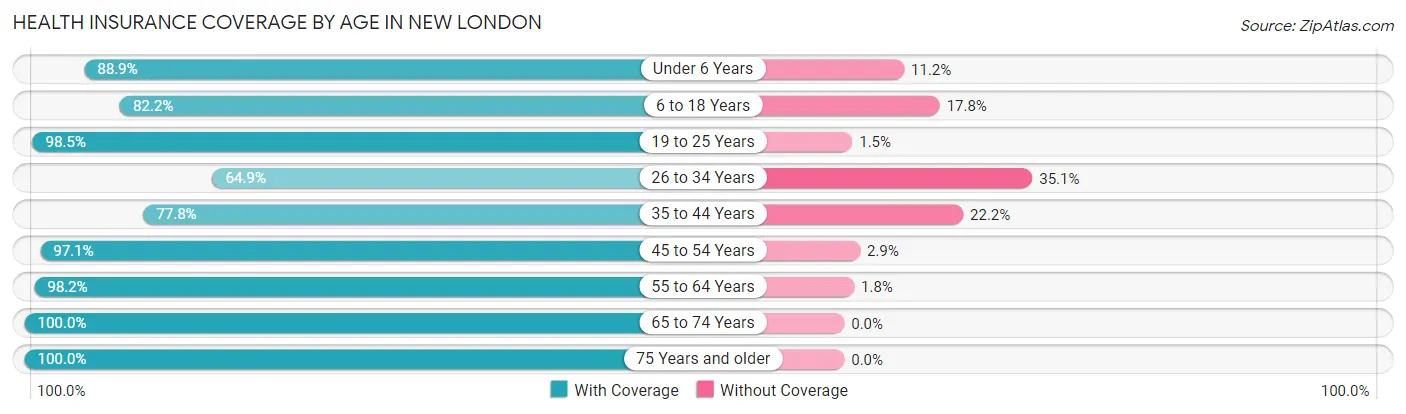
| Age Bracket | With Coverage | Without Coverage |
| Under 6 Years | 279 (88.8%) | 35 (11.2%) |
| 6 to 18 Years | 268 (82.2%) | 58 (17.8%) |
| 19 to 25 Years | 265 (98.5%) | 4 (1.5%) |
| 26 to 34 Years | 176 (64.9%) | 95 (35.1%) |
| 35 to 44 Years | 295 (77.8%) | 84 (22.2%) |
| 45 to 54 Years | 265 (97.1%) | 8 (2.9%) |
| 55 to 64 Years | 268 (98.2%) | 5 (1.8%) |
| 65 to 74 Years | 274 (100.0%) | 0 (0.0%) |
| 75 Years and older | 100 (100.0%) | 0 (0.0%) |
| Total | 2,190 (88.3%) | 289 (11.7%) |
Health Insurance Coverage by Citizenship Status in New London
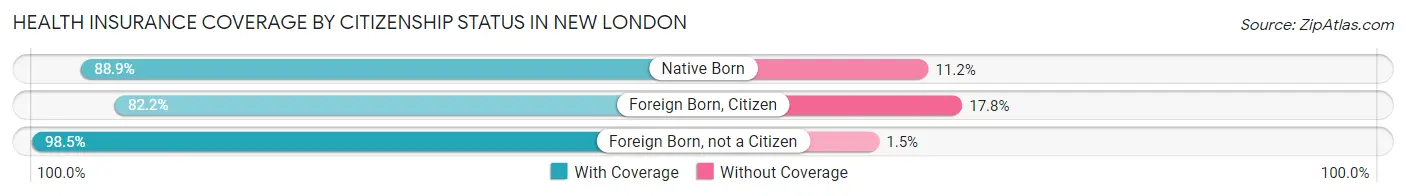
| Citizenship Status | With Coverage | Without Coverage |
| Native Born | 279 (88.8%) | 35 (11.2%) |
| Foreign Born, Citizen | 268 (82.2%) | 58 (17.8%) |
| Foreign Born, not a Citizen | 265 (98.5%) | 4 (1.5%) |
Health Insurance Coverage by Household Income in New London
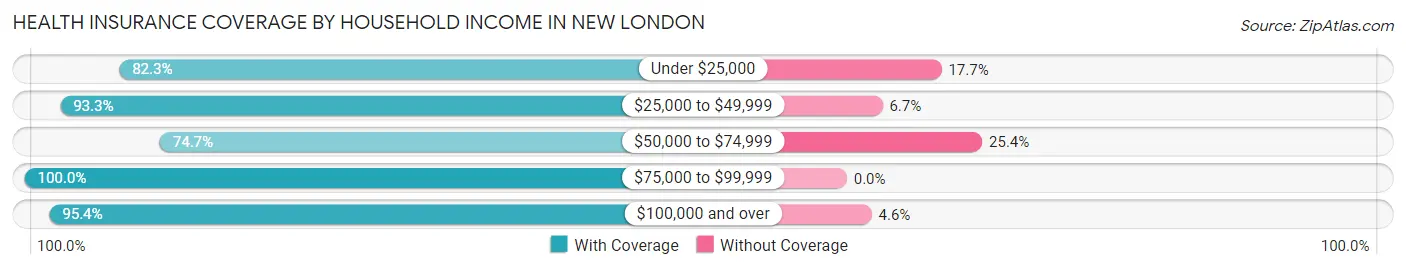
| Household Income | With Coverage | Without Coverage |
| Under $25,000 | 269 (82.3%) | 58 (17.7%) |
| $25,000 to $49,999 | 475 (93.3%) | 34 (6.7%) |
| $50,000 to $74,999 | 530 (74.7%) | 180 (25.4%) |
| $75,000 to $99,999 | 567 (100.0%) | 0 (0.0%) |
| $100,000 and over | 349 (95.4%) | 17 (4.6%) |
Public vs Private Health Insurance Coverage by Age in New London
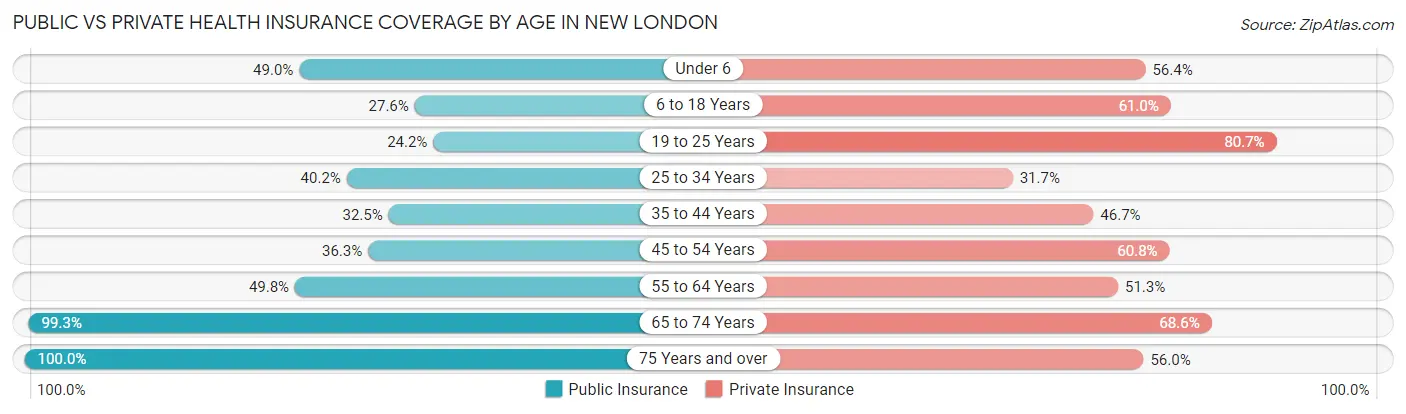
| Age Bracket | Public Insurance | Private Insurance |
| Under 6 | 154 (49.0%) | 177 (56.4%) |
| 6 to 18 Years | 90 (27.6%) | 199 (61.0%) |
| 19 to 25 Years | 65 (24.2%) | 217 (80.7%) |
| 25 to 34 Years | 109 (40.2%) | 86 (31.7%) |
| 35 to 44 Years | 123 (32.5%) | 177 (46.7%) |
| 45 to 54 Years | 99 (36.3%) | 166 (60.8%) |
| 55 to 64 Years | 136 (49.8%) | 140 (51.3%) |
| 65 to 74 Years | 272 (99.3%) | 188 (68.6%) |
| 75 Years and over | 100 (100.0%) | 56 (56.0%) |
| Total | 1,148 (46.3%) | 1,406 (56.7%) |
Disability Status by Sex by Age in New London
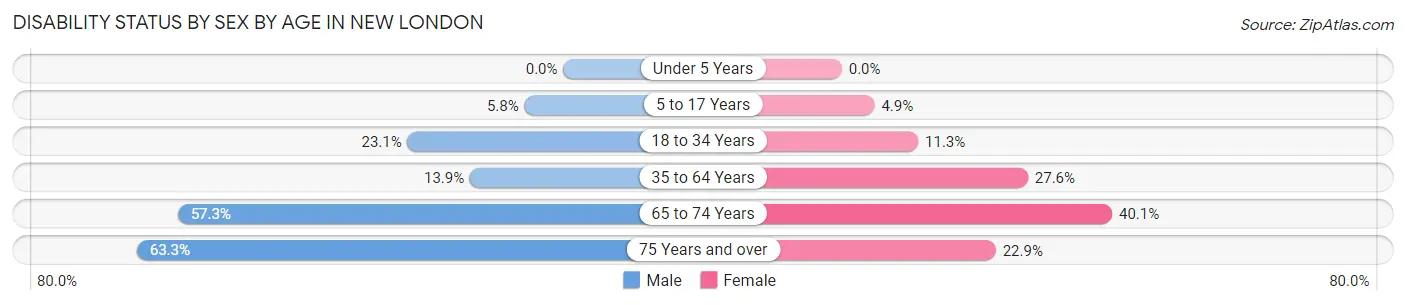
| Age Bracket | Male | Female |
| Under 5 Years | 0 (0.0%) | 0 (0.0%) |
| 5 to 17 Years | 11 (5.8%) | 8 (4.9%) |
| 18 to 34 Years | 65 (23.1%) | 34 (11.3%) |
| 35 to 64 Years | 69 (13.9%) | 118 (27.6%) |
| 65 to 74 Years | 67 (57.3%) | 63 (40.1%) |
| 75 Years and over | 19 (63.3%) | 16 (22.9%) |
Disability Class by Sex by Age in New London
Disability Class: Hearing Difficulty
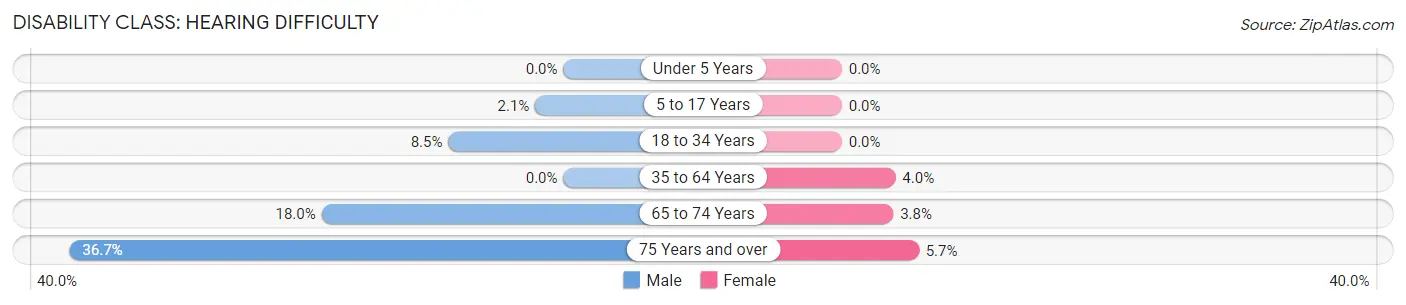
| Age Bracket | Male | Female |
| Under 5 Years | 0 (0.0%) | 0 (0.0%) |
| 5 to 17 Years | 4 (2.1%) | 0 (0.0%) |
| 18 to 34 Years | 24 (8.5%) | 0 (0.0%) |
| 35 to 64 Years | 0 (0.0%) | 17 (4.0%) |
| 65 to 74 Years | 21 (17.9%) | 6 (3.8%) |
| 75 Years and over | 11 (36.7%) | 4 (5.7%) |
Disability Class: Vision Difficulty
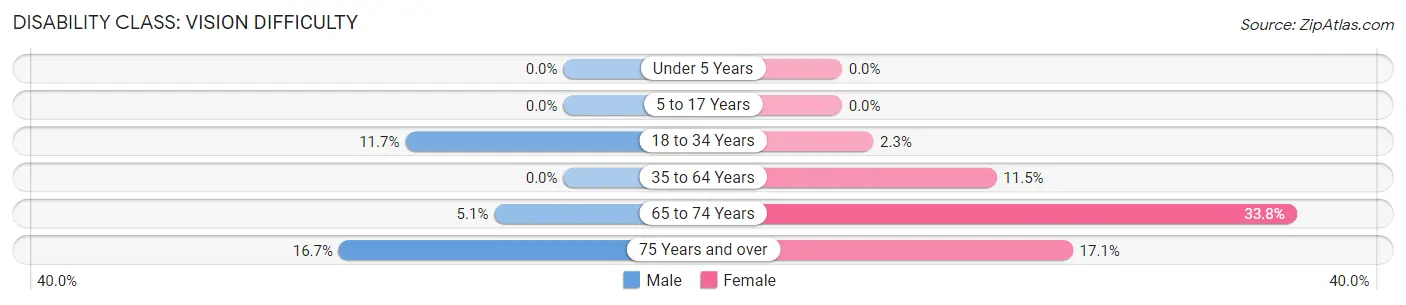
| Age Bracket | Male | Female |
| Under 5 Years | 0 (0.0%) | 0 (0.0%) |
| 5 to 17 Years | 0 (0.0%) | 0 (0.0%) |
| 18 to 34 Years | 33 (11.7%) | 7 (2.3%) |
| 35 to 64 Years | 0 (0.0%) | 49 (11.5%) |
| 65 to 74 Years | 6 (5.1%) | 53 (33.8%) |
| 75 Years and over | 5 (16.7%) | 12 (17.1%) |
Disability Class: Cognitive Difficulty
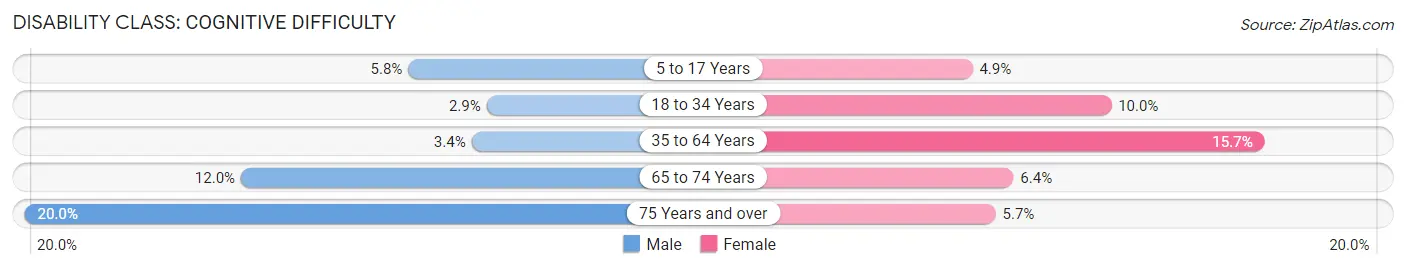
| Age Bracket | Male | Female |
| 5 to 17 Years | 11 (5.8%) | 8 (4.9%) |
| 18 to 34 Years | 8 (2.9%) | 30 (10.0%) |
| 35 to 64 Years | 17 (3.4%) | 67 (15.7%) |
| 65 to 74 Years | 14 (12.0%) | 10 (6.4%) |
| 75 Years and over | 6 (20.0%) | 4 (5.7%) |
Disability Class: Ambulatory Difficulty
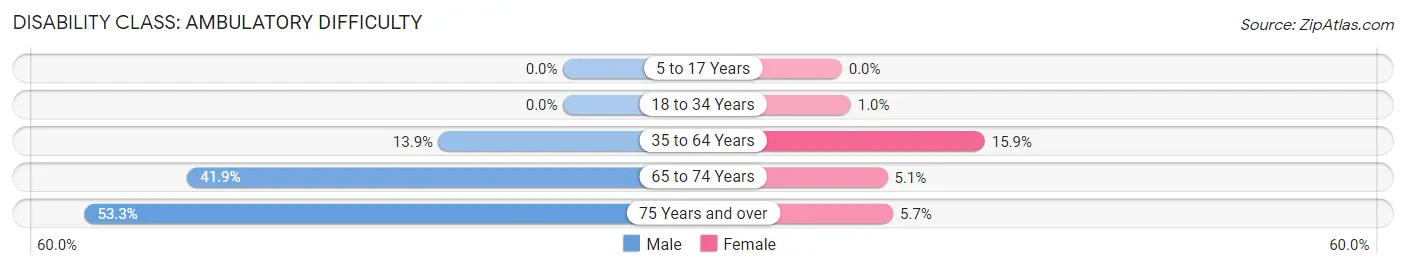
| Age Bracket | Male | Female |
| 5 to 17 Years | 0 (0.0%) | 0 (0.0%) |
| 18 to 34 Years | 0 (0.0%) | 3 (1.0%) |
| 35 to 64 Years | 69 (13.9%) | 68 (15.9%) |
| 65 to 74 Years | 49 (41.9%) | 8 (5.1%) |
| 75 Years and over | 16 (53.3%) | 4 (5.7%) |
Disability Class: Self-Care Difficulty
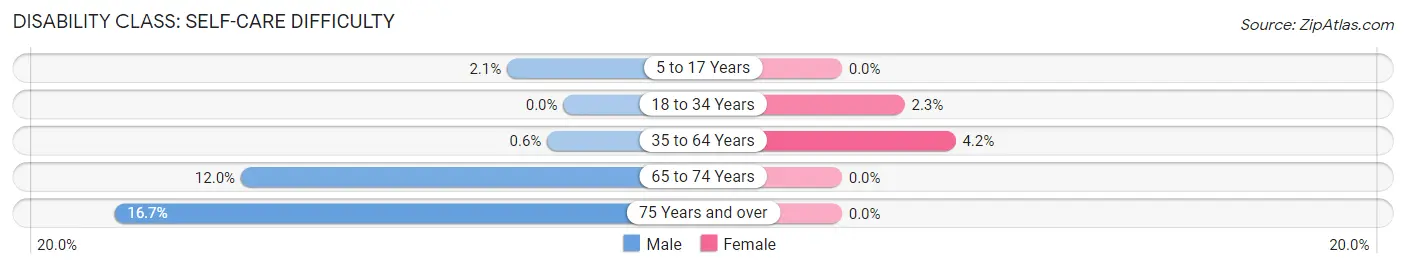
| Age Bracket | Male | Female |
| 5 to 17 Years | 4 (2.1%) | 0 (0.0%) |
| 18 to 34 Years | 0 (0.0%) | 7 (2.3%) |
| 35 to 64 Years | 3 (0.6%) | 18 (4.2%) |
| 65 to 74 Years | 14 (12.0%) | 0 (0.0%) |
| 75 Years and over | 5 (16.7%) | 0 (0.0%) |
Technology Access in New London
Computing Device Access in New London
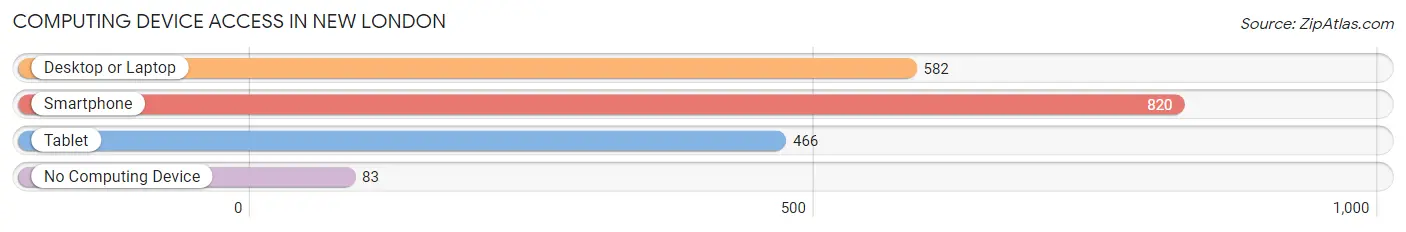
| Device Type | # Households | % Households |
| Desktop or Laptop | 582 | 59.4% |
| Smartphone | 820 | 83.7% |
| Tablet | 466 | 47.5% |
| No Computing Device | 83 | 8.5% |
| Total | 980 | 100.0% |
Internet Access in New London
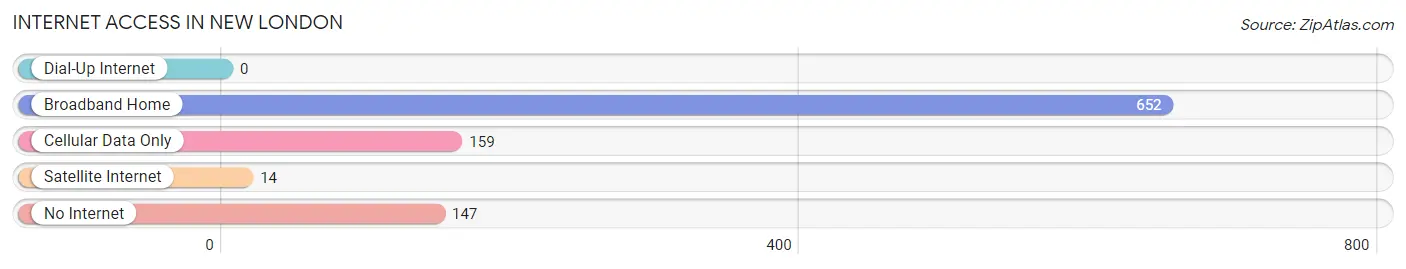
| Internet Type | # Households | % Households |
| Dial-Up Internet | 0 | 0.0% |
| Broadband Home | 652 | 66.5% |
| Cellular Data Only | 159 | 16.2% |
| Satellite Internet | 14 | 1.4% |
| No Internet | 147 | 15.0% |
| Total | 980 | 100.0% |
New London Summary
New London, Ohio is a small village located in Huron County, Ohio. It is situated on the banks of the Vermilion River, approximately 25 miles east of Sandusky and 40 miles west of Cleveland. The village has a population of approximately 1,500 people and covers an area of 1.2 square miles.
History
New London was founded in 1817 by a group of settlers from Connecticut. The village was named after the city of New London, Connecticut. The settlers were attracted to the area due to its fertile soil and abundant natural resources. The first settlers built a sawmill and gristmill on the banks of the Vermilion River. The village quickly grew and by 1820, it had a population of over 500 people.
In 1833, the village was incorporated and the first mayor was elected. The village continued to grow and by the late 1800s, it had become a thriving agricultural and industrial center. The village was home to several factories, including a woolen mill, a flour mill, a furniture factory, and a brickyard.
Geography
New London is located in Huron County, Ohio. It is situated on the banks of the Vermilion River, approximately 25 miles east of Sandusky and 40 miles west of Cleveland. The village has a total area of 1.2 square miles, all of which is land. The village is located in a flat, open area and is surrounded by farmland.
Economy
New London’s economy is largely based on agriculture and manufacturing. The village is home to several factories, including a woolen mill, a flour mill, a furniture factory, and a brickyard. The village also has several small businesses, including restaurants, shops, and service providers.
Demographics
As of the 2010 census, the population of New London was 1,500 people. The racial makeup of the village was 97.3% White, 0.7% African American, 0.3% Native American, 0.3% Asian, and 1.3% from other races. The median household income was $41,250 and the median family income was $50,000. The per capita income was $20,000.
Conclusion
New London, Ohio is a small village located in Huron County, Ohio. It was founded in 1817 by a group of settlers from Connecticut and has a population of approximately 1,500 people. The village’s economy is largely based on agriculture and manufacturing and it is home to several factories and small businesses. The racial makeup of the village is predominantly White, with a small percentage of African American, Native American, and Asian residents. The median household income is $41,250 and the per capita income is $20,000.
Common Questions
What is Per Capita Income in New London?
Per Capita income in New London is $24,467.
What is the Median Family Income in New London?
Median Family Income in New London is $54,750.
What is the Median Household income in New London?
Median Household Income in New London is $50,778.
What is Income or Wage Gap in New London?
Income or Wage Gap in New London is 34.5%.
Women in New London earn 65.5 cents for every dollar earned by a man.
What is Inequality or Gini Index in New London?
Inequality or Gini Index in New London is 0.41.
What is the Total Population of New London?
Total Population of New London is 2,531.
What is the Total Male Population of New London?
Total Male Population of New London is 1,291.
What is the Total Female Population of New London?
Total Female Population of New London is 1,240.
What is the Ratio of Males per 100 Females in New London?
There are 104.11 Males per 100 Females in New London.
What is the Ratio of Females per 100 Males in New London?
There are 96.05 Females per 100 Males in New London.
What is the Median Population Age in New London?
Median Population Age in New London is 37.1 Years.
What is the Average Family Size in New London
Average Family Size in New London is 3.0 People.
What is the Average Household Size in New London
Average Household Size in New London is 2.5 People.
How Large is the Labor Force in New London?
There are 1,161 People in the Labor Forcein in New London.
What is the Percentage of People in the Labor Force in New London?
59.0% of People are in the Labor Force in New London.
What is the Unemployment Rate in New London?
Unemployment Rate in New London is 8.7%.