North Lewisburg, OH Map & Demographics
North Lewisburg Map
North Lewisburg Overview
$29,659
PER CAPITA INCOME
$60,197
AVG FAMILY INCOME
$53,580
AVG HOUSEHOLD INCOME
36.1%
WAGE / INCOME GAP [ % ]
63.9¢/ $1
WAGE / INCOME GAP [ $ ]
0.40
INEQUALITY / GINI INDEX
1,768
TOTAL POPULATION
867
MALE POPULATION
901
FEMALE POPULATION
96.23
MALES / 100 FEMALES
103.92
FEMALES / 100 MALES
34.0
MEDIAN AGE
3.0
AVG FAMILY SIZE
2.4
AVG HOUSEHOLD SIZE
867
LABOR FORCE [ PEOPLE ]
64.3%
PERCENT IN LABOR FORCE
9.6%
UNEMPLOYMENT RATE
North Lewisburg Zip Codes
North Lewisburg Area Codes
Income in North Lewisburg
Income Overview in North Lewisburg
Per Capita Income in North Lewisburg is $29,659, while median incomes of families and households are $60,197 and $53,580 respectively.
| Characteristic | Number | Measure |
| Per Capita Income | 1,768 | $29,659 |
| Median Family Income | 465 | $60,197 |
| Mean Family Income | 465 | $78,483 |
| Median Household Income | 745 | $53,580 |
| Mean Household Income | 745 | $69,464 |
| Income Deficit | 465 | $0 |
| Wage / Income Gap (%) | 1,768 | 36.06% |
| Wage / Income Gap ($) | 1,768 | 63.94¢ per $1 |
| Gini / Inequality Index | 1,768 | 0.40 |
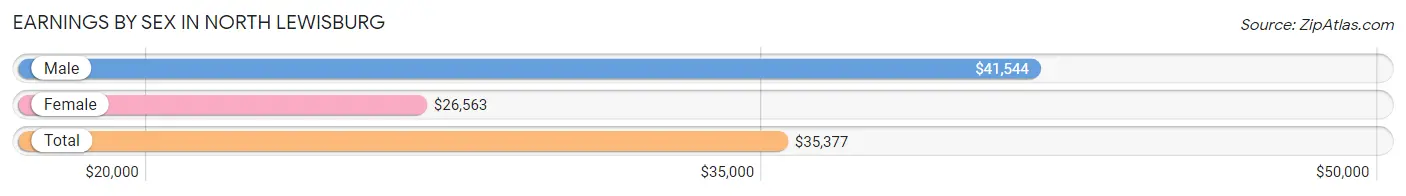
Earnings by Sex in North Lewisburg
Average Earnings in North Lewisburg are $35,377, $41,544 for men and $26,563 for women, a difference of 36.1%.
| Sex | Number | Average Earnings |
| Male | 457 (50.7%) | $41,544 |
| Female | 445 (49.3%) | $26,563 |
| Total | 902 (100.0%) | $35,377 |
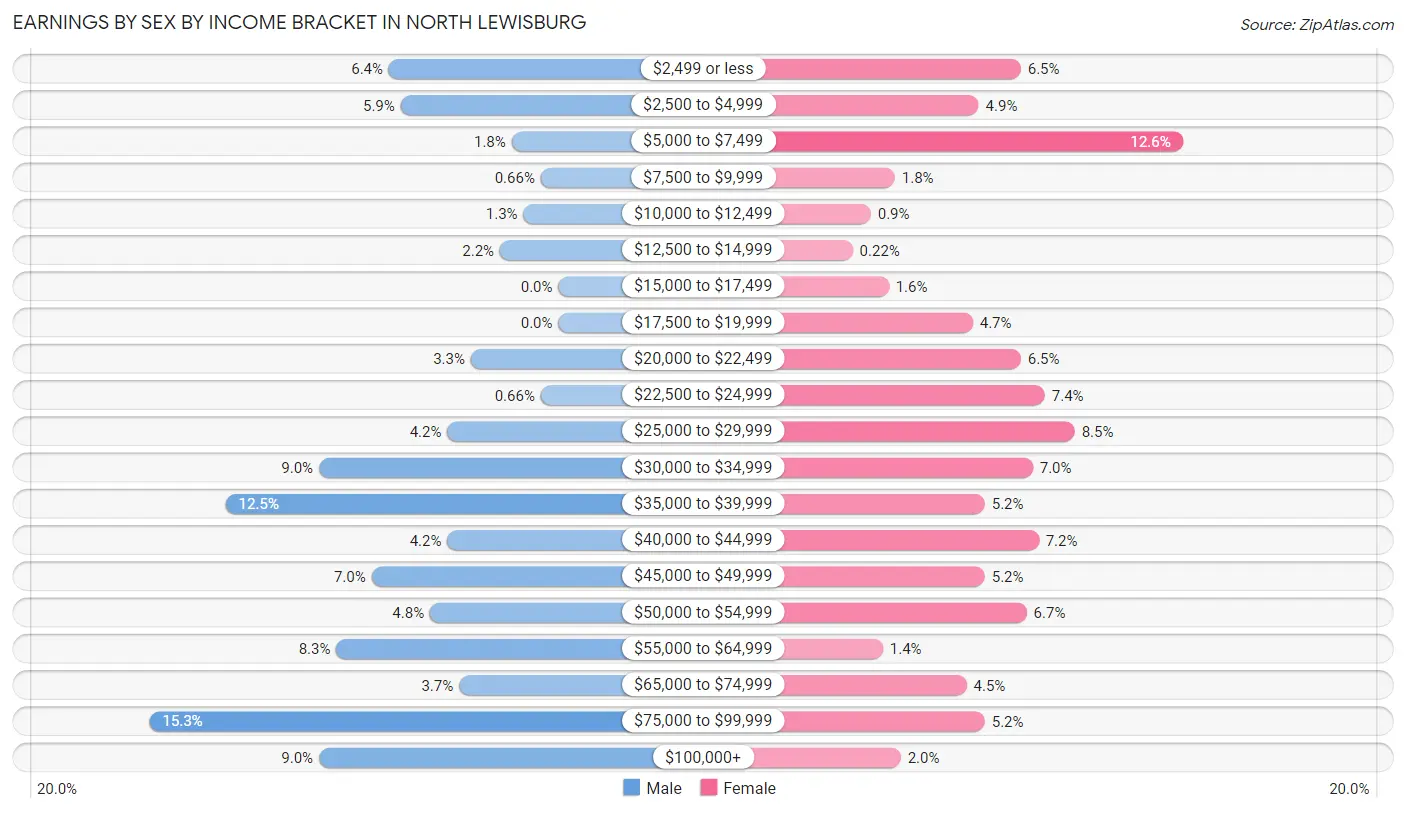
Earnings by Sex by Income Bracket in North Lewisburg
The most common earnings brackets in North Lewisburg are $75,000 to $99,999 for men (70 | 15.3%) and $5,000 to $7,499 for women (56 | 12.6%).
| Income | Male | Female |
| $2,499 or less | 29 (6.4%) | 29 (6.5%) |
| $2,500 to $4,999 | 27 (5.9%) | 22 (4.9%) |
| $5,000 to $7,499 | 8 (1.8%) | 56 (12.6%) |
| $7,500 to $9,999 | 3 (0.7%) | 8 (1.8%) |
| $10,000 to $12,499 | 6 (1.3%) | 4 (0.9%) |
| $12,500 to $14,999 | 10 (2.2%) | 1 (0.2%) |
| $15,000 to $17,499 | 0 (0.0%) | 7 (1.6%) |
| $17,500 to $19,999 | 0 (0.0%) | 21 (4.7%) |
| $20,000 to $22,499 | 15 (3.3%) | 29 (6.5%) |
| $22,500 to $24,999 | 3 (0.7%) | 33 (7.4%) |
| $25,000 to $29,999 | 19 (4.2%) | 38 (8.5%) |
| $30,000 to $34,999 | 41 (9.0%) | 31 (7.0%) |
| $35,000 to $39,999 | 57 (12.5%) | 23 (5.2%) |
| $40,000 to $44,999 | 19 (4.2%) | 32 (7.2%) |
| $45,000 to $49,999 | 32 (7.0%) | 23 (5.2%) |
| $50,000 to $54,999 | 22 (4.8%) | 30 (6.7%) |
| $55,000 to $64,999 | 38 (8.3%) | 6 (1.3%) |
| $65,000 to $74,999 | 17 (3.7%) | 20 (4.5%) |
| $75,000 to $99,999 | 70 (15.3%) | 23 (5.2%) |
| $100,000+ | 41 (9.0%) | 9 (2.0%) |
| Total | 457 (100.0%) | 445 (100.0%) |
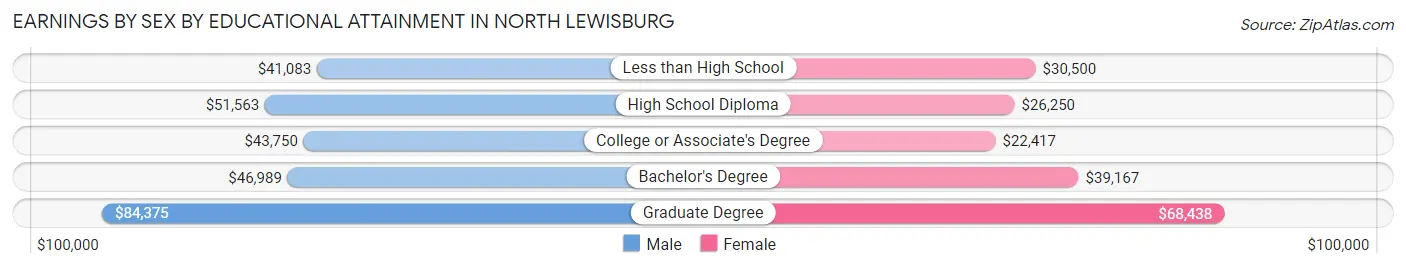
Earnings by Sex by Educational Attainment in North Lewisburg
Average earnings in North Lewisburg are $46,758 for men and $28,819 for women, a difference of 38.4%. Men with an educational attainment of graduate degree enjoy the highest average annual earnings of $84,375, while those with less than high school education earn the least with $41,083. Women with an educational attainment of graduate degree earn the most with the average annual earnings of $68,438, while those with college or associate's degree education have the smallest earnings of $22,417.
| Educational Attainment | Male Income | Female Income |
| Less than High School | $41,083 | $30,500 |
| High School Diploma | $51,563 | $26,250 |
| College or Associate's Degree | $43,750 | $22,417 |
| Bachelor's Degree | $46,989 | $39,167 |
| Graduate Degree | $84,375 | $68,438 |
| Total | $46,758 | $28,819 |
Family Income in North Lewisburg
Family Income Brackets in North Lewisburg
According to the North Lewisburg family income data, there are 132 families falling into the $50,000 to $74,999 income range, which is the most common income bracket and makes up 28.4% of all families. Conversely, the $200,000+ income bracket is the least frequent group with only 6 families (1.3%) belonging to this category.
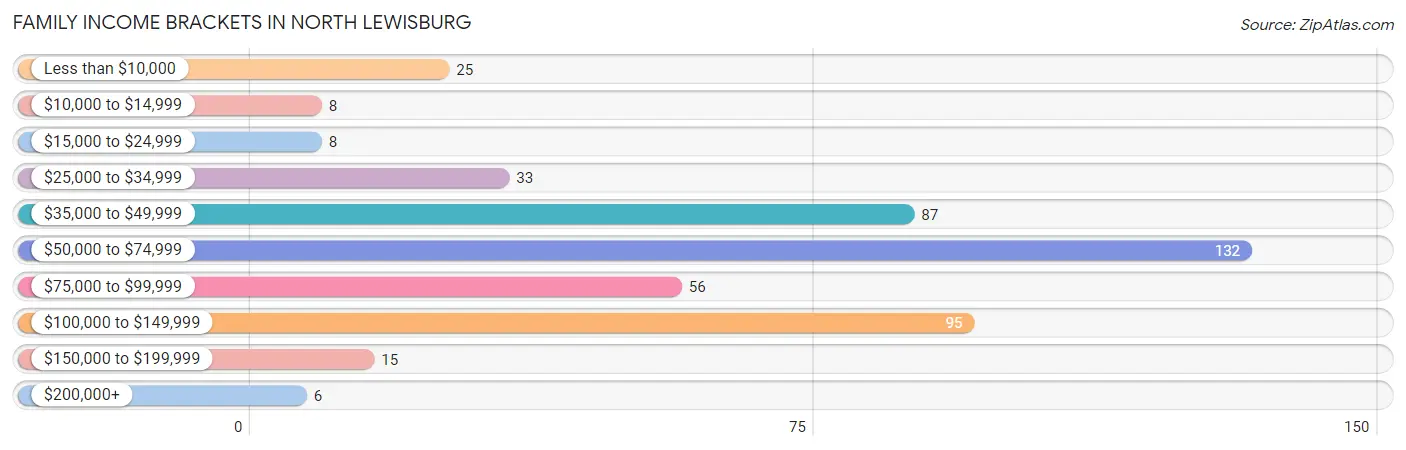
| Income Bracket | # Families | % Families |
| Less than $10,000 | 25 | 5.4% |
| $10,000 to $14,999 | 8 | 1.7% |
| $15,000 to $24,999 | 8 | 1.7% |
| $25,000 to $34,999 | 33 | 7.1% |
| $35,000 to $49,999 | 87 | 18.7% |
| $50,000 to $74,999 | 132 | 28.4% |
| $75,000 to $99,999 | 56 | 12.0% |
| $100,000 to $149,999 | 95 | 20.4% |
| $150,000 to $199,999 | 15 | 3.2% |
| $200,000+ | 6 | 1.3% |
Family Income by Famaliy Size in North Lewisburg
5-person families (22 | 4.7%) account for the highest median family income in North Lewisburg with $102,500 per family, while 2-person families (179 | 38.5%) have the highest median income of $31,152 per family member.
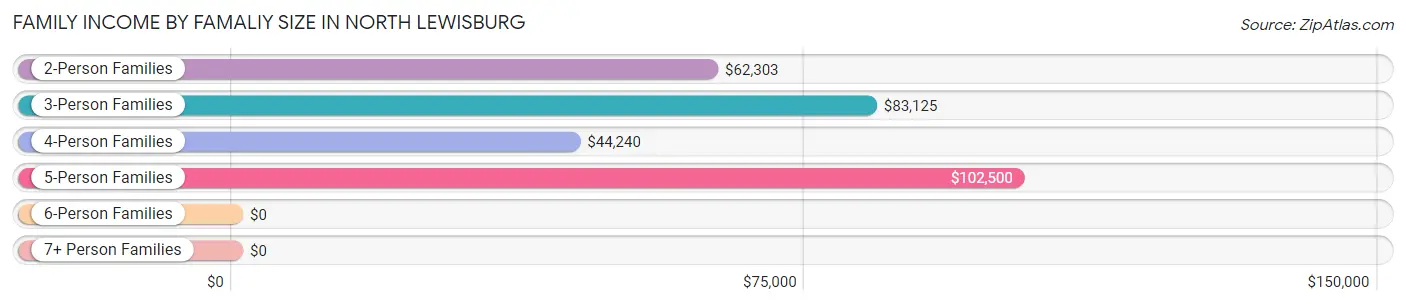
| Income Bracket | # Families | Median Income |
| 2-Person Families | 179 (38.5%) | $62,303 |
| 3-Person Families | 111 (23.9%) | $83,125 |
| 4-Person Families | 137 (29.5%) | $44,240 |
| 5-Person Families | 22 (4.7%) | $102,500 |
| 6-Person Families | 14 (3.0%) | $0 |
| 7+ Person Families | 2 (0.4%) | $0 |
| Total | 465 (100.0%) | $60,197 |
Family Income by Number of Earners in North Lewisburg
The median family income in North Lewisburg is $60,197, with families comprising 3+ earners (17) having the highest median family income of $128,750, while families with no earners (71) have the lowest median family income of $57,708, accounting for 3.7% and 15.3% of families, respectively.
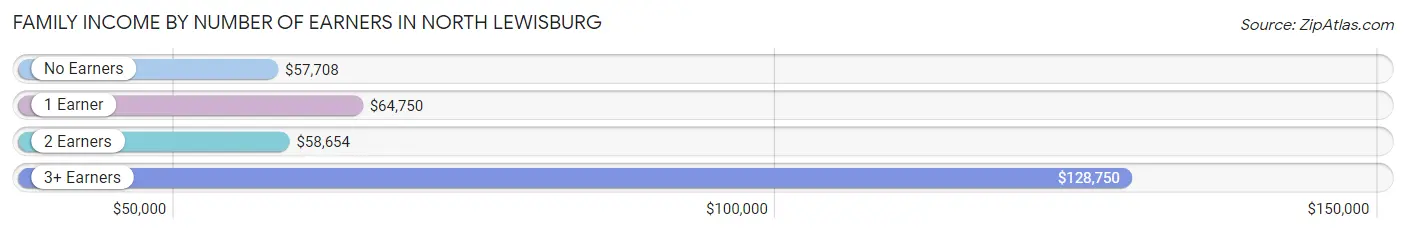
| Number of Earners | # Families | Median Income |
| No Earners | 71 (15.3%) | $57,708 |
| 1 Earner | 127 (27.3%) | $64,750 |
| 2 Earners | 250 (53.8%) | $58,654 |
| 3+ Earners | 17 (3.7%) | $128,750 |
| Total | 465 (100.0%) | $60,197 |
Household Income in North Lewisburg
Household Income Brackets in North Lewisburg
With 161 households falling in the category, the $50,000 to $74,999 income range is the most frequent in North Lewisburg, accounting for 21.6% of all households. In contrast, only 9 households (1.2%) fall into the $200,000+ income bracket, making it the least populous group.
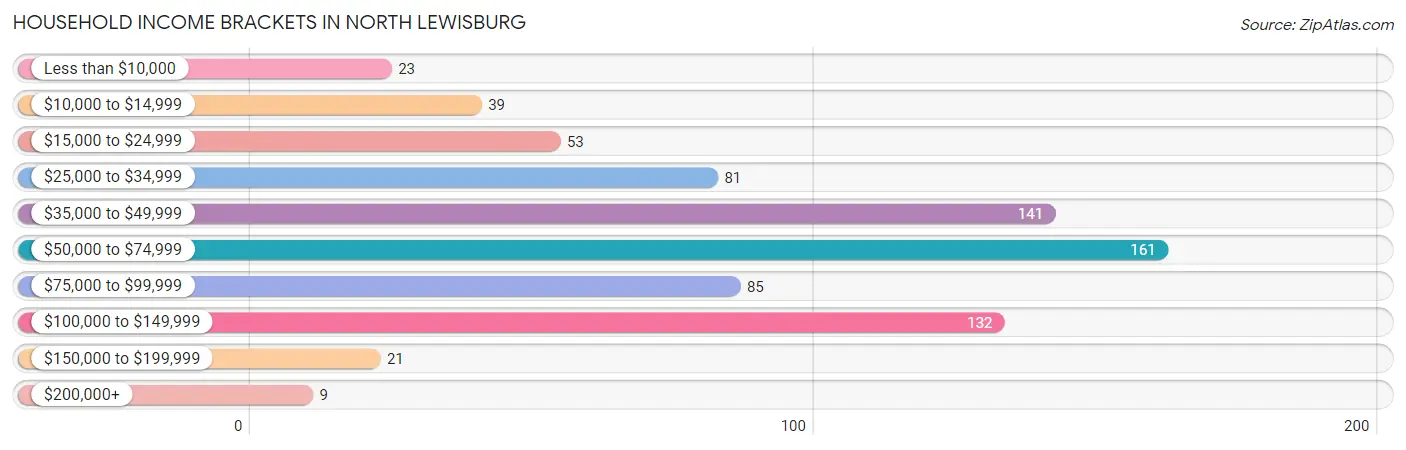
| Income Bracket | # Households | % Households |
| Less than $10,000 | 23 | 3.1% |
| $10,000 to $14,999 | 39 | 5.2% |
| $15,000 to $24,999 | 53 | 7.1% |
| $25,000 to $34,999 | 81 | 10.9% |
| $35,000 to $49,999 | 141 | 18.9% |
| $50,000 to $74,999 | 161 | 21.6% |
| $75,000 to $99,999 | 85 | 11.4% |
| $100,000 to $149,999 | 132 | 17.7% |
| $150,000 to $199,999 | 21 | 2.8% |
| $200,000+ | 9 | 1.2% |
Household Income by Householder Age in North Lewisburg
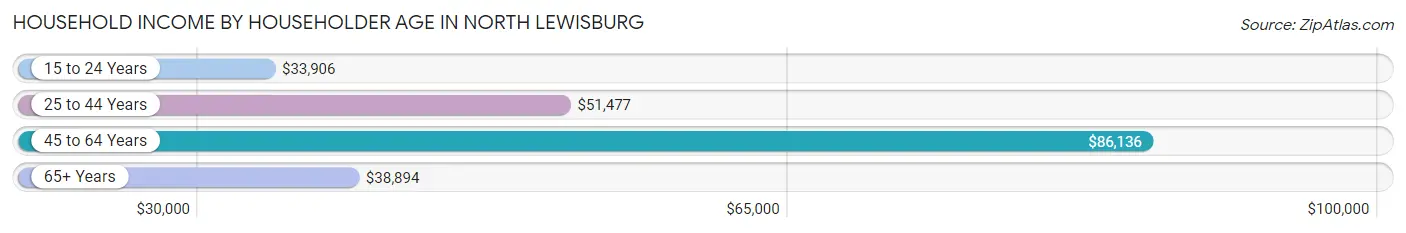
The median household income in North Lewisburg is $53,580, with the highest median household income of $86,136 found in the 45 to 64 years age bracket for the primary householder. A total of 248 households (33.3%) fall into this category. Meanwhile, the 15 to 24 years age bracket for the primary householder has the lowest median household income of $33,906, with 21 households (2.8%) in this group.
| Income Bracket | # Households | Median Income |
| 15 to 24 Years | 21 (2.8%) | $33,906 |
| 25 to 44 Years | 251 (33.7%) | $51,477 |
| 45 to 64 Years | 248 (33.3%) | $86,136 |
| 65+ Years | 225 (30.2%) | $38,894 |
| Total | 745 (100.0%) | $53,580 |
Poverty in North Lewisburg
Income Below Poverty by Sex and Age in North Lewisburg
With 8.5% poverty level for males and 11.7% for females among the residents of North Lewisburg, 16 and 17 year old males and 18 to 24 year old females are the most vulnerable to poverty, with 8 males (28.6%) and 18 females (40.0%) in their respective age groups living below the poverty level.
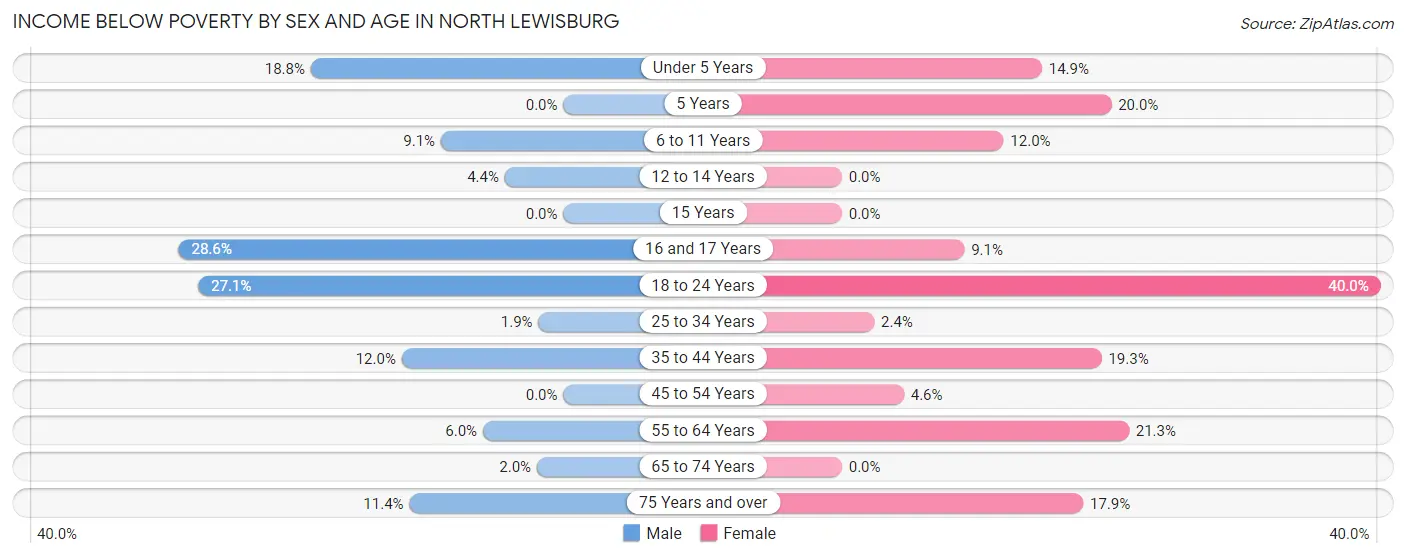
| Age Bracket | Male | Female |
| Under 5 Years | 21 (18.8%) | 15 (14.8%) |
| 5 Years | 0 (0.0%) | 2 (20.0%) |
| 6 to 11 Years | 4 (9.1%) | 6 (12.0%) |
| 12 to 14 Years | 2 (4.3%) | 0 (0.0%) |
| 15 Years | 0 (0.0%) | 0 (0.0%) |
| 16 and 17 Years | 8 (28.6%) | 2 (9.1%) |
| 18 to 24 Years | 16 (27.1%) | 18 (40.0%) |
| 25 to 34 Years | 3 (1.8%) | 4 (2.4%) |
| 35 to 44 Years | 9 (12.0%) | 16 (19.3%) |
| 45 to 54 Years | 0 (0.0%) | 4 (4.6%) |
| 55 to 64 Years | 4 (6.0%) | 26 (21.3%) |
| 65 to 74 Years | 2 (2.0%) | 0 (0.0%) |
| 75 Years and over | 4 (11.4%) | 12 (17.9%) |
| Total | 73 (8.5%) | 105 (11.7%) |
Income Above Poverty by Sex and Age in North Lewisburg
According to the poverty statistics in North Lewisburg, males aged 5 years and females aged 12 to 14 years are the age groups that are most secure financially, with 100.0% of males and 100.0% of females in these age groups living above the poverty line.
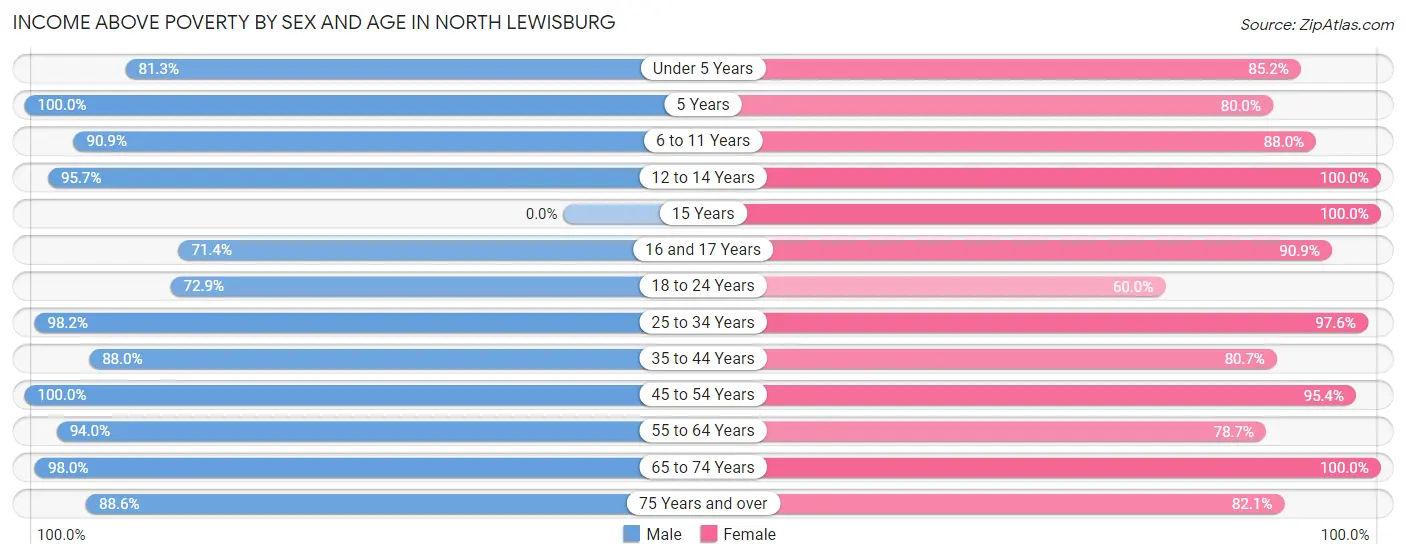
| Age Bracket | Male | Female |
| Under 5 Years | 91 (81.2%) | 86 (85.2%) |
| 5 Years | 18 (100.0%) | 8 (80.0%) |
| 6 to 11 Years | 40 (90.9%) | 44 (88.0%) |
| 12 to 14 Years | 44 (95.7%) | 31 (100.0%) |
| 15 Years | 0 (0.0%) | 3 (100.0%) |
| 16 and 17 Years | 20 (71.4%) | 20 (90.9%) |
| 18 to 24 Years | 43 (72.9%) | 27 (60.0%) |
| 25 to 34 Years | 159 (98.2%) | 163 (97.6%) |
| 35 to 44 Years | 66 (88.0%) | 67 (80.7%) |
| 45 to 54 Years | 115 (100.0%) | 83 (95.4%) |
| 55 to 64 Years | 63 (94.0%) | 96 (78.7%) |
| 65 to 74 Years | 100 (98.0%) | 113 (100.0%) |
| 75 Years and over | 31 (88.6%) | 55 (82.1%) |
| Total | 790 (91.5%) | 796 (88.3%) |
Income Below Poverty Among Married-Couple Families in North Lewisburg
The poverty statistics for married-couple families in North Lewisburg show that 4.1% or 14 of the total 341 families live below the poverty line. Families with no children have the highest poverty rate of 5.2%, comprising of 8 families. On the other hand, families with 3 or 4 children have the lowest poverty rate of 0.0%, which includes 0 families.
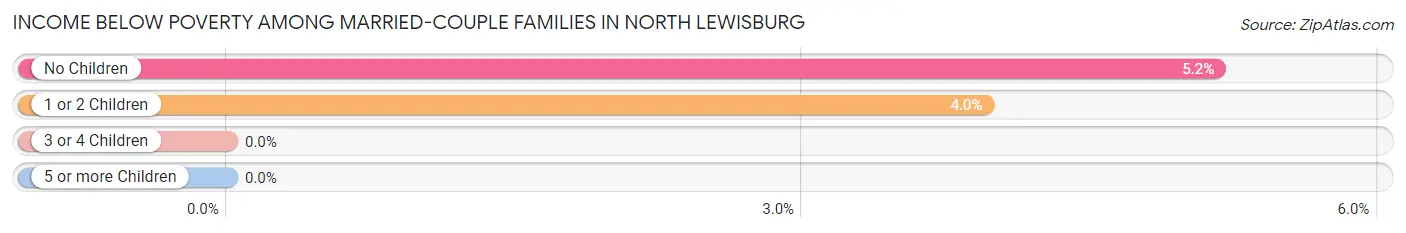
| Children | Above Poverty | Below Poverty |
| No Children | 147 (94.8%) | 8 (5.2%) |
| 1 or 2 Children | 146 (96.1%) | 6 (4.0%) |
| 3 or 4 Children | 34 (100.0%) | 0 (0.0%) |
| 5 or more Children | 0 (0.0%) | 0 (0.0%) |
| Total | 327 (95.9%) | 14 (4.1%) |
Income Below Poverty Among Single-Parent Households in North Lewisburg
According to the poverty data in North Lewisburg, 9.1% or 3 single-father households and 23.1% or 21 single-mother households are living below the poverty line. Among single-father households, those with 1 or 2 children have the highest poverty rate, with 3 households (15.0%) experiencing poverty. Likewise, among single-mother households, those with 3 or 4 children have the highest poverty rate, with 5 households (35.7%) falling below the poverty line.
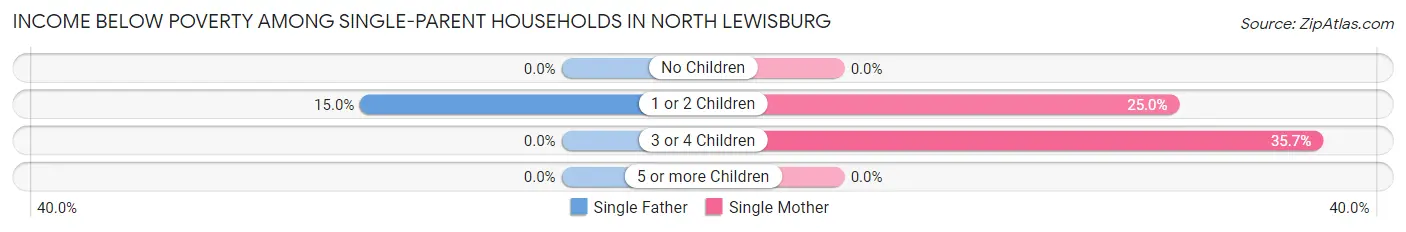
| Children | Single Father | Single Mother |
| No Children | 0 (0.0%) | 0 (0.0%) |
| 1 or 2 Children | 3 (15.0%) | 16 (25.0%) |
| 3 or 4 Children | 0 (0.0%) | 5 (35.7%) |
| 5 or more Children | 0 (0.0%) | 0 (0.0%) |
| Total | 3 (9.1%) | 21 (23.1%) |
Income Below Poverty Among Married-Couple vs Single-Parent Households in North Lewisburg
The poverty data for North Lewisburg shows that 14 of the married-couple family households (4.1%) and 24 of the single-parent households (19.4%) are living below the poverty level. Within the married-couple family households, those with no children have the highest poverty rate, with 8 households (5.2%) falling below the poverty line. Among the single-parent households, those with 3 or 4 children have the highest poverty rate, with 5 household (26.3%) living below poverty.
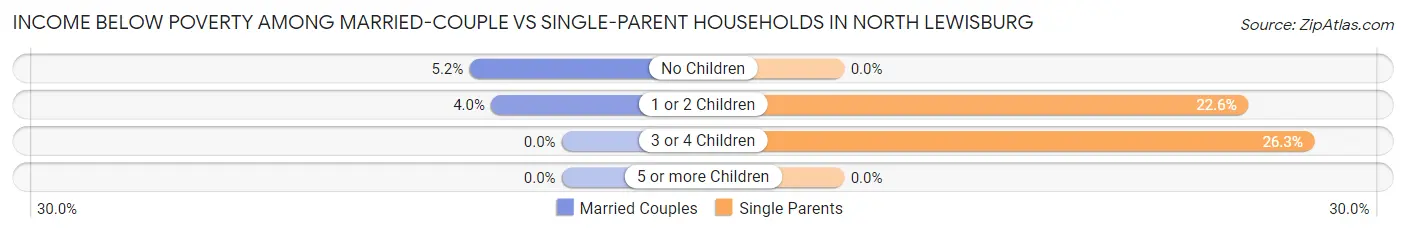
| Children | Married-Couple Families | Single-Parent Households |
| No Children | 8 (5.2%) | 0 (0.0%) |
| 1 or 2 Children | 6 (4.0%) | 19 (22.6%) |
| 3 or 4 Children | 0 (0.0%) | 5 (26.3%) |
| 5 or more Children | 0 (0.0%) | 0 (0.0%) |
| Total | 14 (4.1%) | 24 (19.4%) |
Race in North Lewisburg
The most populous races in North Lewisburg are White / Caucasian (1,707 | 96.6%), Two or more Races (49 | 2.8%), and Hispanic or Latino (12 | 0.7%).
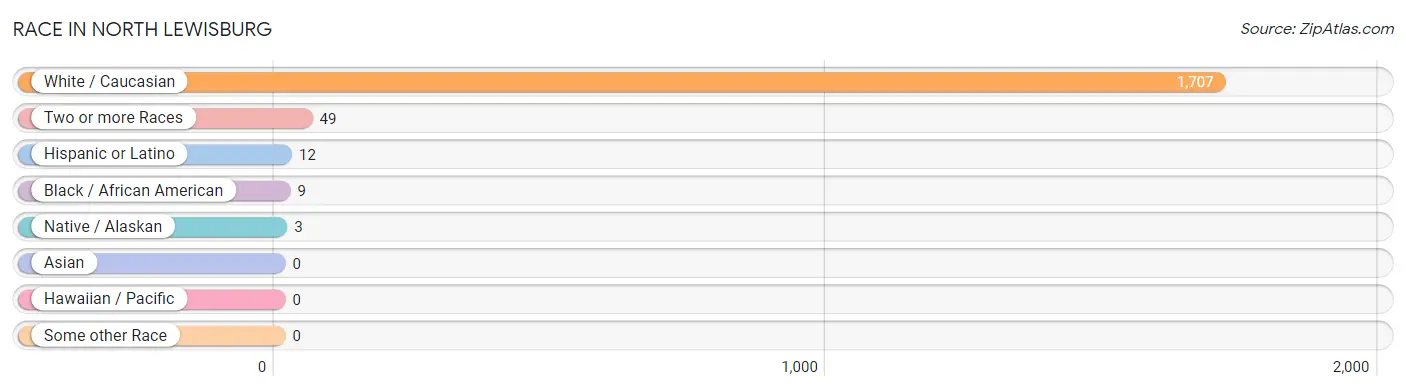
| Race | # Population | % Population |
| Asian | 0 | 0.0% |
| Black / African American | 9 | 0.5% |
| Hawaiian / Pacific | 0 | 0.0% |
| Hispanic or Latino | 12 | 0.7% |
| Native / Alaskan | 3 | 0.2% |
| White / Caucasian | 1,707 | 96.6% |
| Two or more Races | 49 | 2.8% |
| Some other Race | 0 | 0.0% |
| Total | 1,768 | 100.0% |
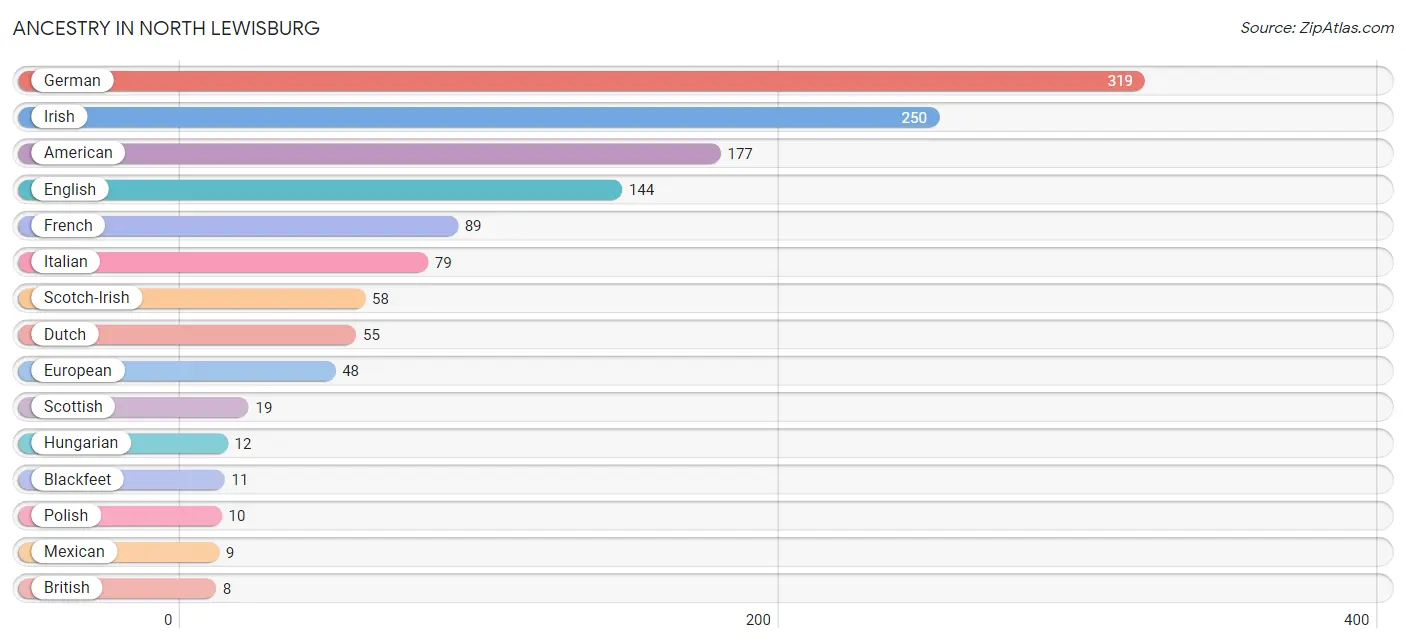
Ancestry in North Lewisburg
The most populous ancestries reported in North Lewisburg are German (319 | 18.0%), Irish (250 | 14.1%), American (177 | 10.0%), English (144 | 8.1%), and French (89 | 5.0%), together accounting for 55.4% of all North Lewisburg residents.
| Ancestry | # Population | % Population |
| American | 177 | 10.0% |
| Austrian | 5 | 0.3% |
| Bhutanese | 3 | 0.2% |
| Blackfeet | 11 | 0.6% |
| British | 8 | 0.4% |
| Central American | 3 | 0.2% |
| Central American Indian | 3 | 0.2% |
| Cherokee | 8 | 0.4% |
| Dutch | 55 | 3.1% |
| Eastern European | 2 | 0.1% |
| English | 144 | 8.1% |
| European | 48 | 2.7% |
| French | 89 | 5.0% |
| German | 319 | 18.0% |
| Greek | 8 | 0.4% |
| Guatemalan | 3 | 0.2% |
| Hungarian | 12 | 0.7% |
| Irish | 250 | 14.1% |
| Italian | 79 | 4.5% |
| Mexican | 9 | 0.5% |
| Norwegian | 6 | 0.3% |
| Polish | 10 | 0.6% |
| Romanian | 6 | 0.3% |
| Scotch-Irish | 58 | 3.3% |
| Scottish | 19 | 1.1% |
| Swiss | 6 | 0.3% |
| Ukrainian | 3 | 0.2% |
| Welsh | 7 | 0.4% | View All 28 Rows |
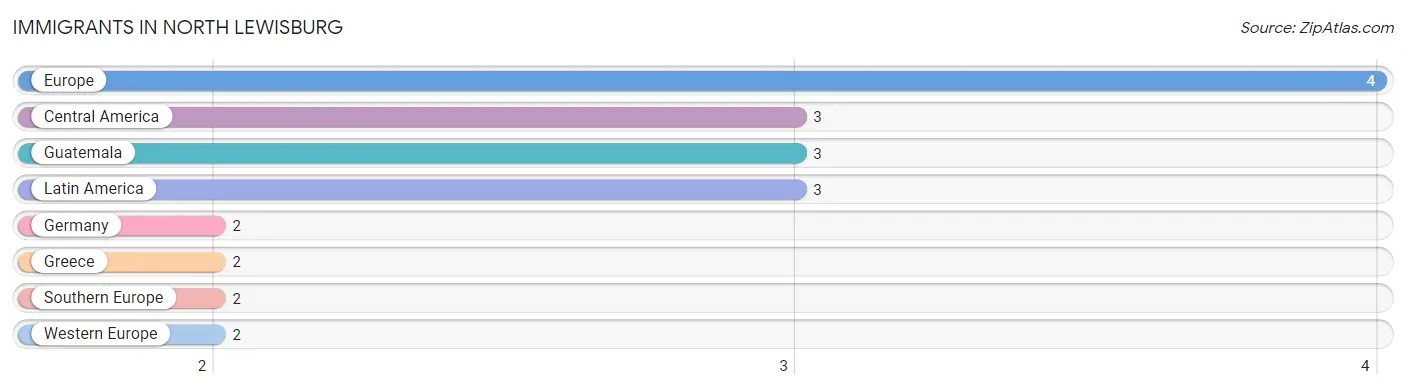
Immigrants in North Lewisburg
The most numerous immigrant groups reported in North Lewisburg came from Europe (4 | 0.2%), Central America (3 | 0.2%), Guatemala (3 | 0.2%), Latin America (3 | 0.2%), and Germany (2 | 0.1%), together accounting for 0.9% of all North Lewisburg residents.
| Immigration Origin | # Population | % Population |
| Central America | 3 | 0.2% |
| Europe | 4 | 0.2% |
| Germany | 2 | 0.1% |
| Greece | 2 | 0.1% |
| Guatemala | 3 | 0.2% |
| Latin America | 3 | 0.2% |
| Southern Europe | 2 | 0.1% |
| Western Europe | 2 | 0.1% | View All 8 Rows |
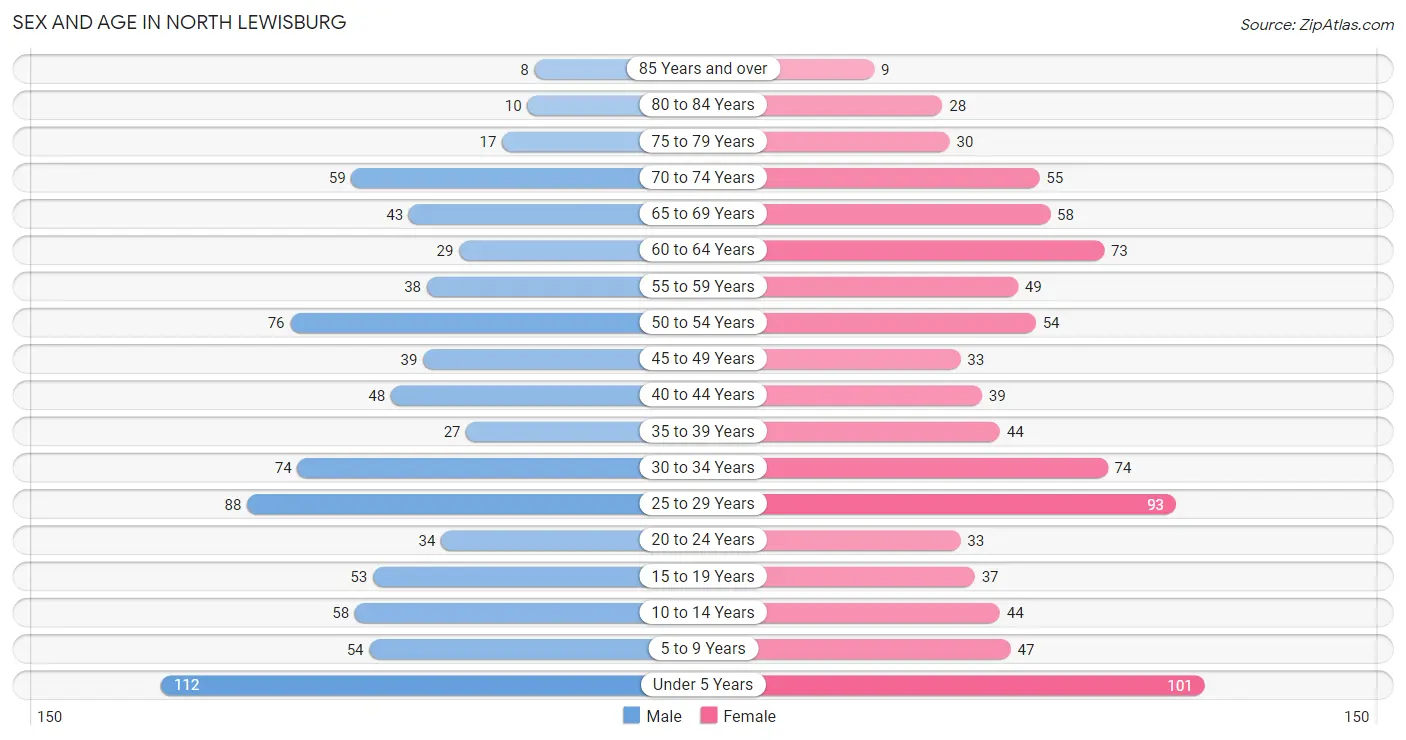
Sex and Age in North Lewisburg
Sex and Age in North Lewisburg
The most populous age groups in North Lewisburg are Under 5 Years (112 | 12.9%) for men and Under 5 Years (101 | 11.2%) for women.
| Age Bracket | Male | Female |
| Under 5 Years | 112 (12.9%) | 101 (11.2%) |
| 5 to 9 Years | 54 (6.2%) | 47 (5.2%) |
| 10 to 14 Years | 58 (6.7%) | 44 (4.9%) |
| 15 to 19 Years | 53 (6.1%) | 37 (4.1%) |
| 20 to 24 Years | 34 (3.9%) | 33 (3.7%) |
| 25 to 29 Years | 88 (10.2%) | 93 (10.3%) |
| 30 to 34 Years | 74 (8.5%) | 74 (8.2%) |
| 35 to 39 Years | 27 (3.1%) | 44 (4.9%) |
| 40 to 44 Years | 48 (5.5%) | 39 (4.3%) |
| 45 to 49 Years | 39 (4.5%) | 33 (3.7%) |
| 50 to 54 Years | 76 (8.8%) | 54 (6.0%) |
| 55 to 59 Years | 38 (4.4%) | 49 (5.4%) |
| 60 to 64 Years | 29 (3.3%) | 73 (8.1%) |
| 65 to 69 Years | 43 (5.0%) | 58 (6.4%) |
| 70 to 74 Years | 59 (6.8%) | 55 (6.1%) |
| 75 to 79 Years | 17 (2.0%) | 30 (3.3%) |
| 80 to 84 Years | 10 (1.1%) | 28 (3.1%) |
| 85 Years and over | 8 (0.9%) | 9 (1.0%) |
| Total | 867 (100.0%) | 901 (100.0%) |
Families and Households in North Lewisburg
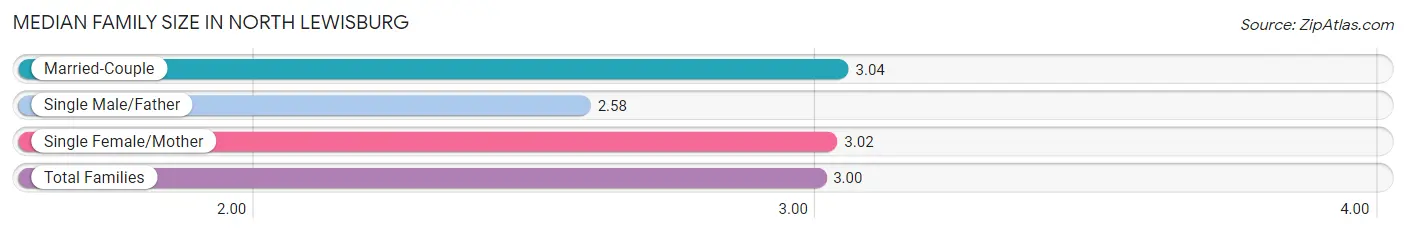
Median Family Size in North Lewisburg
The median family size in North Lewisburg is 3.00 persons per family, with married-couple families (341 | 73.3%) accounting for the largest median family size of 3.04 persons per family. On the other hand, single male/father families (33 | 7.1%) represent the smallest median family size with 2.58 persons per family.
| Family Type | # Families | Family Size |
| Married-Couple | 341 (73.3%) | 3.04 |
| Single Male/Father | 33 (7.1%) | 2.58 |
| Single Female/Mother | 91 (19.6%) | 3.02 |
| Total Families | 465 (100.0%) | 3.00 |
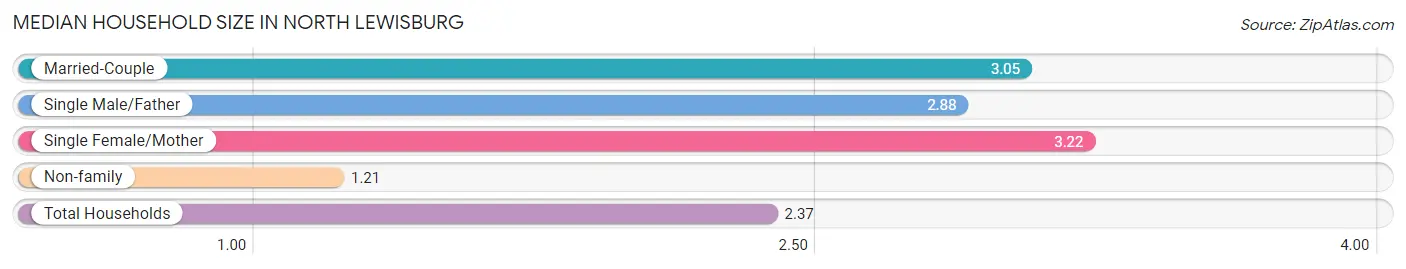
Median Household Size in North Lewisburg
The median household size in North Lewisburg is 2.37 persons per household, with single female/mother households (91 | 12.2%) accounting for the largest median household size of 3.22 persons per household. non-family households (280 | 37.6%) represent the smallest median household size with 1.21 persons per household.
| Household Type | # Households | Household Size |
| Married-Couple | 341 (45.8%) | 3.05 |
| Single Male/Father | 33 (4.4%) | 2.88 |
| Single Female/Mother | 91 (12.2%) | 3.22 |
| Non-family | 280 (37.6%) | 1.21 |
| Total Households | 745 (100.0%) | 2.37 |
Household Size by Marriage Status in North Lewisburg
Out of a total of 745 households in North Lewisburg, 465 (62.4%) are family households, while 280 (37.6%) are nonfamily households. The most numerous type of family households are 2-person households, comprising 170, and the most common type of nonfamily households are 1-person households, comprising 223.
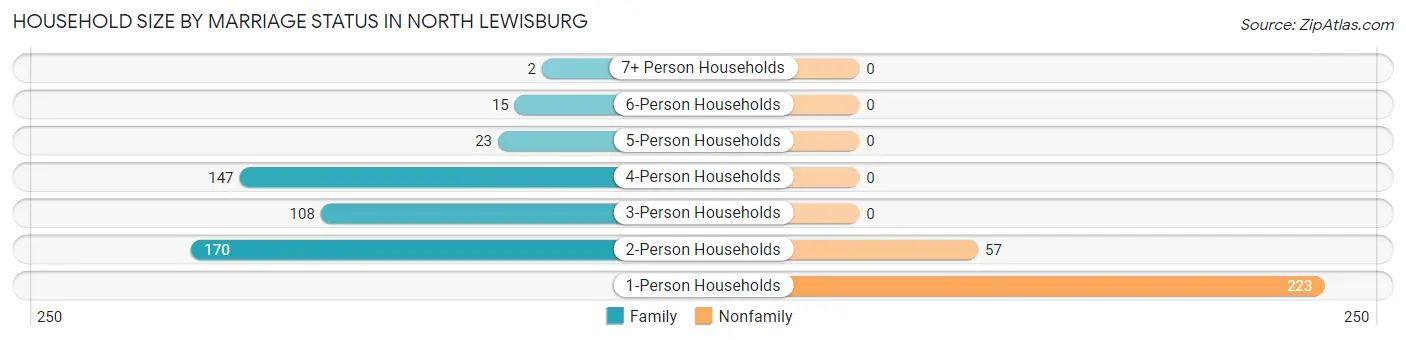
| Household Size | Family Households | Nonfamily Households |
| 1-Person Households | - | 223 (29.9%) |
| 2-Person Households | 170 (22.8%) | 57 (7.6%) |
| 3-Person Households | 108 (14.5%) | 0 (0.0%) |
| 4-Person Households | 147 (19.7%) | 0 (0.0%) |
| 5-Person Households | 23 (3.1%) | 0 (0.0%) |
| 6-Person Households | 15 (2.0%) | 0 (0.0%) |
| 7+ Person Households | 2 (0.3%) | 0 (0.0%) |
| Total | 465 (62.4%) | 280 (37.6%) |
Female Fertility in North Lewisburg
Fertility by Age in North Lewisburg
Average fertility rate in North Lewisburg is 206.0 births per 1,000 women. Women in the age bracket of 20 to 34 years have the highest fertility rate with 335.0 births per 1,000 women. Women in the age bracket of 20 to 34 years acount for 90.5% of all women with births.
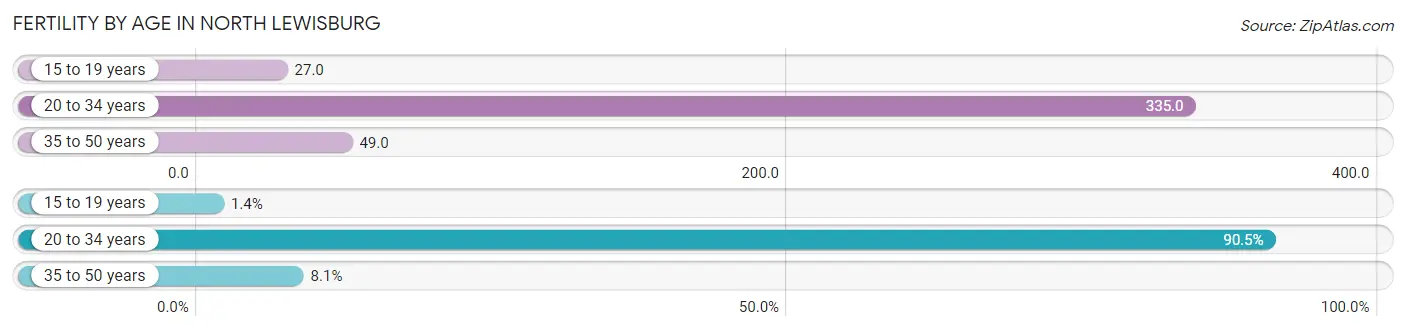
| Age Bracket | Women with Births | Births / 1,000 Women |
| 15 to 19 years | 1 (1.3%) | 27.0 |
| 20 to 34 years | 67 (90.5%) | 335.0 |
| 35 to 50 years | 6 (8.1%) | 49.0 |
| Total | 74 (100.0%) | 206.0 |
Fertility by Age by Marriage Status in North Lewisburg
75.7% of women with births (74) in North Lewisburg are married. The highest percentage of unmarried women with births falls into 15 to 19 years age bracket with 100.0% of them unmarried at the time of birth, while the lowest percentage of unmarried women with births belong to 20 to 34 years age bracket with 17.9% of them unmarried.
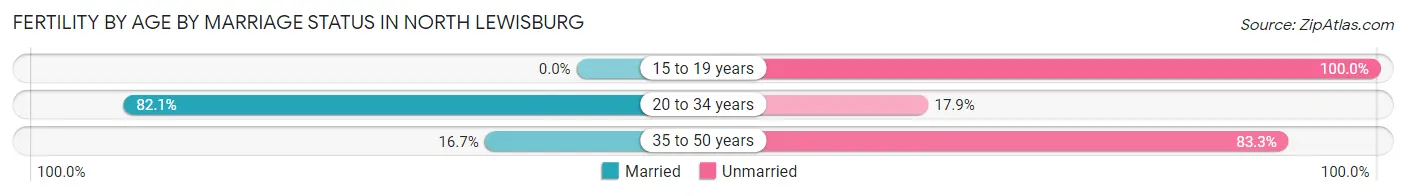
| Age Bracket | Married | Unmarried |
| 15 to 19 years | 0 (0.0%) | 1 (100.0%) |
| 20 to 34 years | 55 (82.1%) | 12 (17.9%) |
| 35 to 50 years | 1 (16.7%) | 5 (83.3%) |
| Total | 56 (75.7%) | 18 (24.3%) |
Fertility by Education in North Lewisburg
Average fertility rate in North Lewisburg is 206.0 births per 1,000 women. Women with the education attainment of graduate degree have the highest fertility rate of 333.0 births per 1,000 women, while women with the education attainment of less than high school have the lowest fertility at 27.0 births per 1,000 women. Women with the education attainment of college or associate's degree represent 50.0% of all women with births.
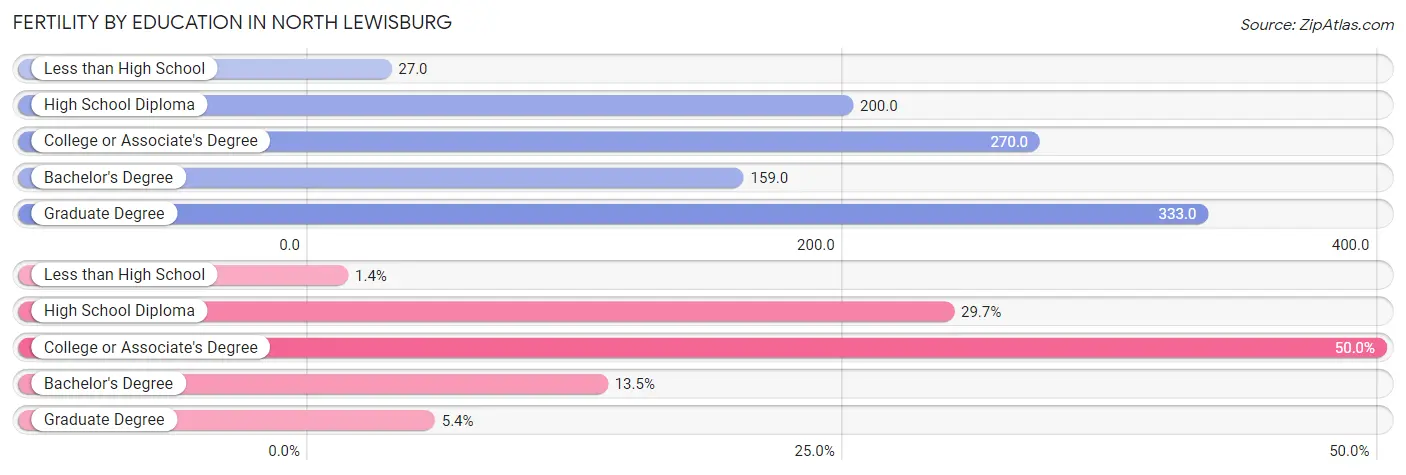
| Educational Attainment | Women with Births | Births / 1,000 Women |
| Less than High School | 1 (1.3%) | 27.0 |
| High School Diploma | 22 (29.7%) | 200.0 |
| College or Associate's Degree | 37 (50.0%) | 270.0 |
| Bachelor's Degree | 10 (13.5%) | 159.0 |
| Graduate Degree | 4 (5.4%) | 333.0 |
| Total | 74 (100.0%) | 206.0 |
Fertility by Education by Marriage Status in North Lewisburg
24.3% of women with births in North Lewisburg are unmarried. Women with the educational attainment of college or associate's degree are most likely to be married with 100.0% of them married at childbirth, while women with the educational attainment of less than high school are least likely to be married with 100.0% of them unmarried at childbirth.
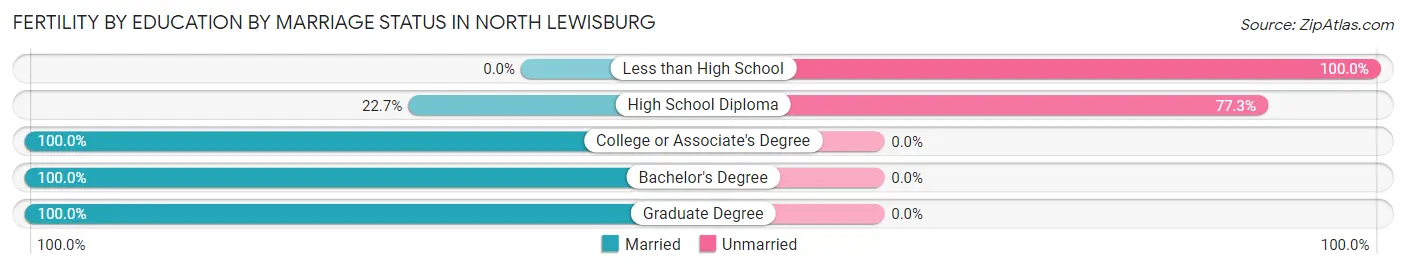
| Educational Attainment | Married | Unmarried |
| Less than High School | 0 (0.0%) | 1 (100.0%) |
| High School Diploma | 5 (22.7%) | 17 (77.3%) |
| College or Associate's Degree | 37 (100.0%) | 0 (0.0%) |
| Bachelor's Degree | 10 (100.0%) | 0 (0.0%) |
| Graduate Degree | 4 (100.0%) | 0 (0.0%) |
| Total | 56 (75.7%) | 18 (24.3%) |
Employment Characteristics in North Lewisburg
Employment by Class of Employer in North Lewisburg
Among the 726 employed individuals in North Lewisburg, private company employees (553 | 76.2%), not-for-profit organizations (63 | 8.7%), and local government employees (58 | 8.0%) make up the most common classes of employment.
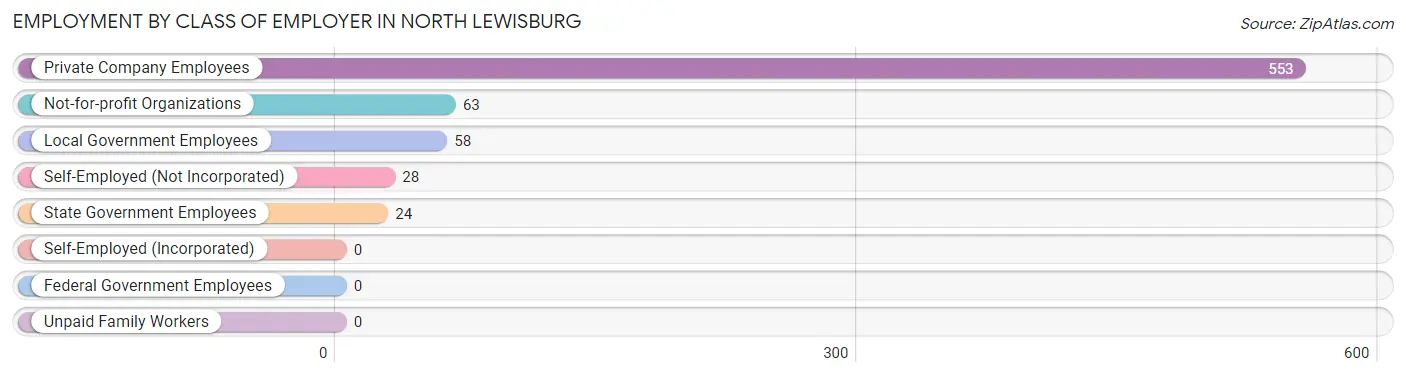
| Employer Class | # Employees | % Employees |
| Private Company Employees | 553 | 76.2% |
| Self-Employed (Incorporated) | 0 | 0.0% |
| Self-Employed (Not Incorporated) | 28 | 3.9% |
| Not-for-profit Organizations | 63 | 8.7% |
| Local Government Employees | 58 | 8.0% |
| State Government Employees | 24 | 3.3% |
| Federal Government Employees | 0 | 0.0% |
| Unpaid Family Workers | 0 | 0.0% |
| Total | 726 | 100.0% |
Employment Status by Age in North Lewisburg
According to the labor force statistics for North Lewisburg, out of the total population over 16 years of age (1,349), 64.3% or 867 individuals are in the labor force, with 9.6% or 83 of them unemployed. The age group with the highest labor force participation rate is 25 to 29 years, with 96.1% or 174 individuals in the labor force. Within the labor force, the 20 to 24 years age range has the highest percentage of unemployed individuals, with 39.5% or 17 of them being unemployed.
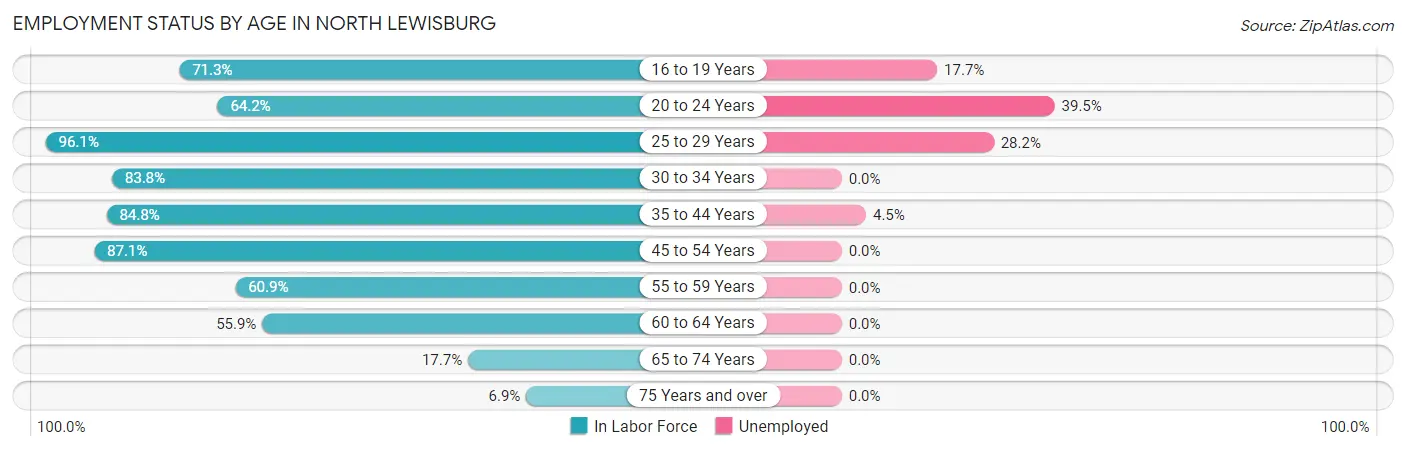
| Age Bracket | In Labor Force | Unemployed |
| 16 to 19 Years | 62 (71.3%) | 11 (17.7%) |
| 20 to 24 Years | 43 (64.2%) | 17 (39.5%) |
| 25 to 29 Years | 174 (96.1%) | 49 (28.2%) |
| 30 to 34 Years | 124 (83.8%) | 0 (0.0%) |
| 35 to 44 Years | 134 (84.8%) | 6 (4.5%) |
| 45 to 54 Years | 176 (87.1%) | 0 (0.0%) |
| 55 to 59 Years | 53 (60.9%) | 0 (0.0%) |
| 60 to 64 Years | 57 (55.9%) | 0 (0.0%) |
| 65 to 74 Years | 38 (17.7%) | 0 (0.0%) |
| 75 Years and over | 7 (6.9%) | 0 (0.0%) |
| Total | 867 (64.3%) | 83 (9.6%) |
Employment Status by Educational Attainment in North Lewisburg
According to labor force statistics for North Lewisburg, 81.8% of individuals (718) out of the total population between 25 and 64 years of age (878) are in the labor force, with 7.7% or 55 of them being unemployed. The group with the highest labor force participation rate are those with the educational attainment of bachelor's degree or higher, with 93.8% or 136 individuals in the labor force. Within the labor force, individuals with college / associate degree education have the highest percentage of unemployment, with 18.9% or 49 of them being unemployed.
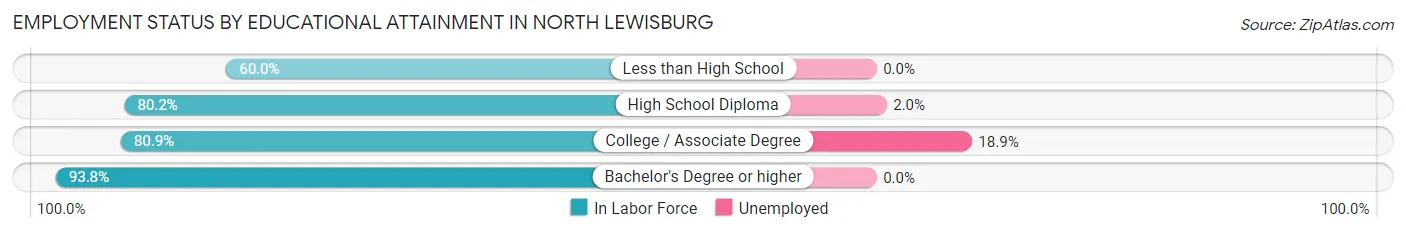
| Educational Attainment | In Labor Force | Unemployed |
| Less than High School | 24 (60.0%) | 0 (0.0%) |
| High School Diploma | 299 (80.2%) | 7 (2.0%) |
| College / Associate Degree | 259 (80.9%) | 60 (18.9%) |
| Bachelor's Degree or higher | 136 (93.8%) | 0 (0.0%) |
| Total | 718 (81.8%) | 68 (7.7%) |
Employment Occupations by Sex in North Lewisburg
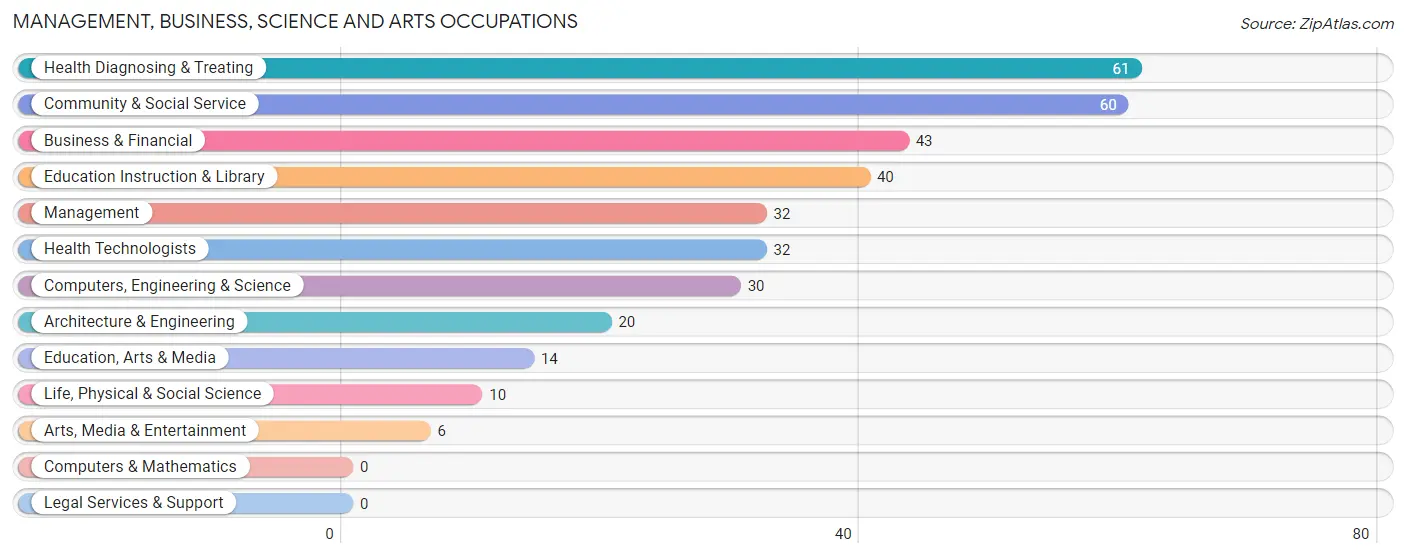
Management, Business, Science and Arts Occupations
The most common Management, Business, Science and Arts occupations in North Lewisburg are Health Diagnosing & Treating (61 | 7.8%), Community & Social Service (60 | 7.6%), Business & Financial (43 | 5.5%), Education Instruction & Library (40 | 5.1%), and Management (32 | 4.1%).
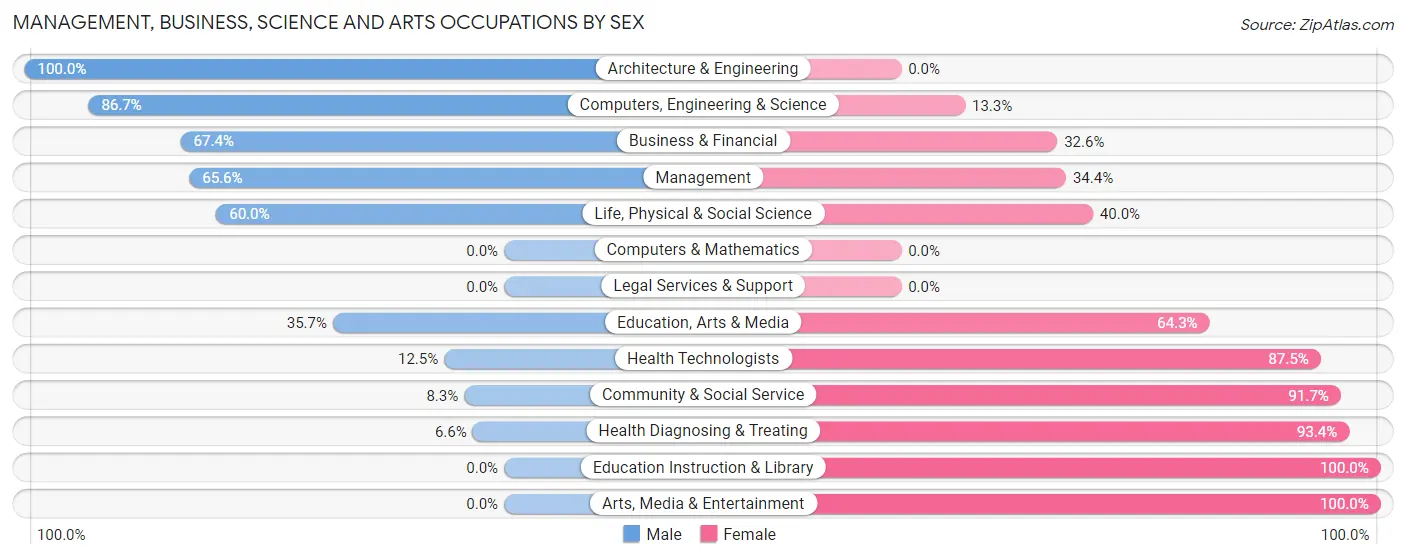
Management, Business, Science and Arts Occupations by Sex
Within the Management, Business, Science and Arts occupations in North Lewisburg, the most male-oriented occupations are Architecture & Engineering (100.0%), Computers, Engineering & Science (86.7%), and Business & Financial (67.4%), while the most female-oriented occupations are Education Instruction & Library (100.0%), Arts, Media & Entertainment (100.0%), and Health Diagnosing & Treating (93.4%).
| Occupation | Male | Female |
| Management | 21 (65.6%) | 11 (34.4%) |
| Business & Financial | 29 (67.4%) | 14 (32.6%) |
| Computers, Engineering & Science | 26 (86.7%) | 4 (13.3%) |
| Computers & Mathematics | 0 (0.0%) | 0 (0.0%) |
| Architecture & Engineering | 20 (100.0%) | 0 (0.0%) |
| Life, Physical & Social Science | 6 (60.0%) | 4 (40.0%) |
| Community & Social Service | 5 (8.3%) | 55 (91.7%) |
| Education, Arts & Media | 5 (35.7%) | 9 (64.3%) |
| Legal Services & Support | 0 (0.0%) | 0 (0.0%) |
| Education Instruction & Library | 0 (0.0%) | 40 (100.0%) |
| Arts, Media & Entertainment | 0 (0.0%) | 6 (100.0%) |
| Health Diagnosing & Treating | 4 (6.6%) | 57 (93.4%) |
| Health Technologists | 4 (12.5%) | 28 (87.5%) |
| Total (Category) | 85 (37.6%) | 141 (62.4%) |
| Total (Overall) | 382 (48.7%) | 403 (51.3%) |
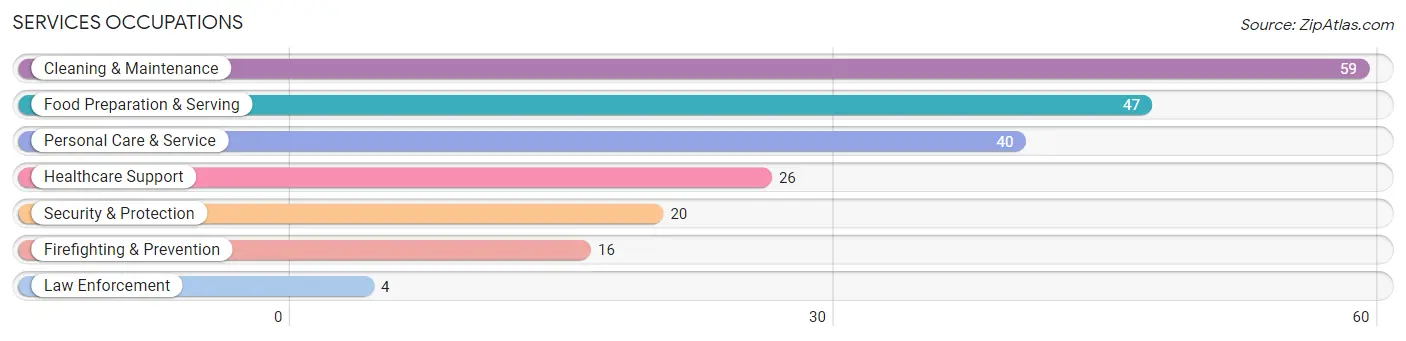
Services Occupations
The most common Services occupations in North Lewisburg are Cleaning & Maintenance (59 | 7.5%), Food Preparation & Serving (47 | 6.0%), Personal Care & Service (40 | 5.1%), Healthcare Support (26 | 3.3%), and Security & Protection (20 | 2.5%).
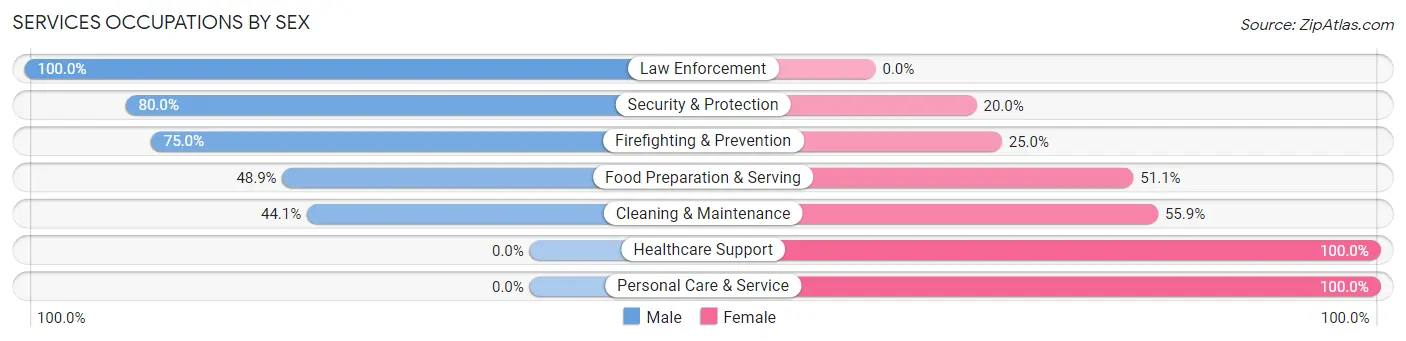
Services Occupations by Sex
Within the Services occupations in North Lewisburg, the most male-oriented occupations are Law Enforcement (100.0%), Security & Protection (80.0%), and Firefighting & Prevention (75.0%), while the most female-oriented occupations are Healthcare Support (100.0%), Personal Care & Service (100.0%), and Cleaning & Maintenance (55.9%).
| Occupation | Male | Female |
| Healthcare Support | 0 (0.0%) | 26 (100.0%) |
| Security & Protection | 16 (80.0%) | 4 (20.0%) |
| Firefighting & Prevention | 12 (75.0%) | 4 (25.0%) |
| Law Enforcement | 4 (100.0%) | 0 (0.0%) |
| Food Preparation & Serving | 23 (48.9%) | 24 (51.1%) |
| Cleaning & Maintenance | 26 (44.1%) | 33 (55.9%) |
| Personal Care & Service | 0 (0.0%) | 40 (100.0%) |
| Total (Category) | 65 (33.9%) | 127 (66.1%) |
| Total (Overall) | 382 (48.7%) | 403 (51.3%) |
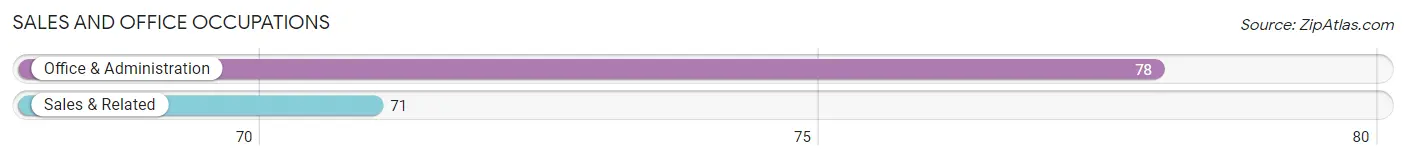
Sales and Office Occupations
The most common Sales and Office occupations in North Lewisburg are Office & Administration (78 | 9.9%), and Sales & Related (71 | 9.0%).
Sales and Office Occupations by Sex
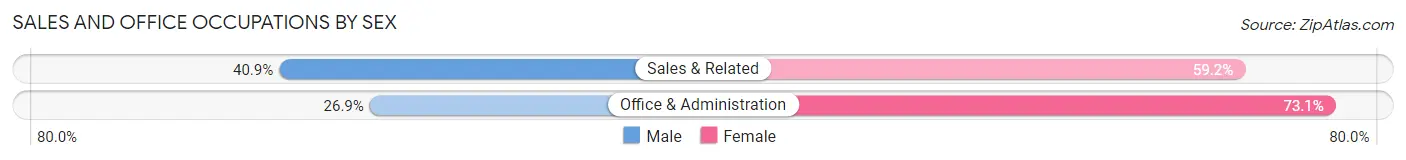
| Occupation | Male | Female |
| Sales & Related | 29 (40.8%) | 42 (59.2%) |
| Office & Administration | 21 (26.9%) | 57 (73.1%) |
| Total (Category) | 50 (33.6%) | 99 (66.4%) |
| Total (Overall) | 382 (48.7%) | 403 (51.3%) |
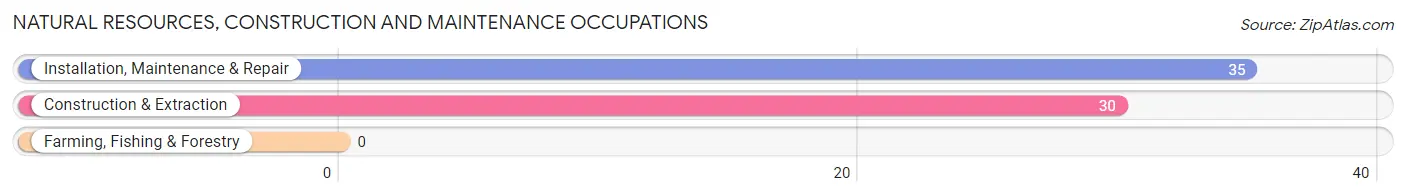
Natural Resources, Construction and Maintenance Occupations
The most common Natural Resources, Construction and Maintenance occupations in North Lewisburg are Installation, Maintenance & Repair (35 | 4.5%), and Construction & Extraction (30 | 3.8%).
Natural Resources, Construction and Maintenance Occupations by Sex
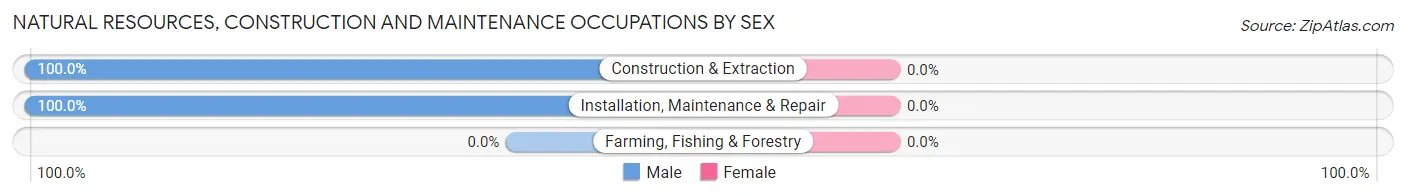
| Occupation | Male | Female |
| Farming, Fishing & Forestry | 0 (0.0%) | 0 (0.0%) |
| Construction & Extraction | 30 (100.0%) | 0 (0.0%) |
| Installation, Maintenance & Repair | 35 (100.0%) | 0 (0.0%) |
| Total (Category) | 65 (100.0%) | 0 (0.0%) |
| Total (Overall) | 382 (48.7%) | 403 (51.3%) |
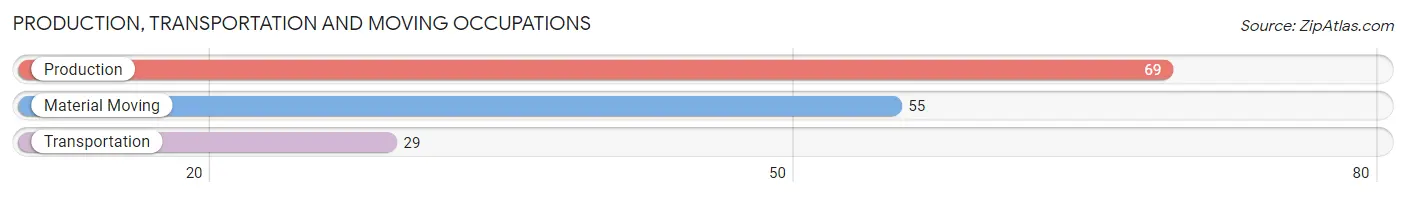
Production, Transportation and Moving Occupations
The most common Production, Transportation and Moving occupations in North Lewisburg are Production (69 | 8.8%), Material Moving (55 | 7.0%), and Transportation (29 | 3.7%).
Production, Transportation and Moving Occupations by Sex
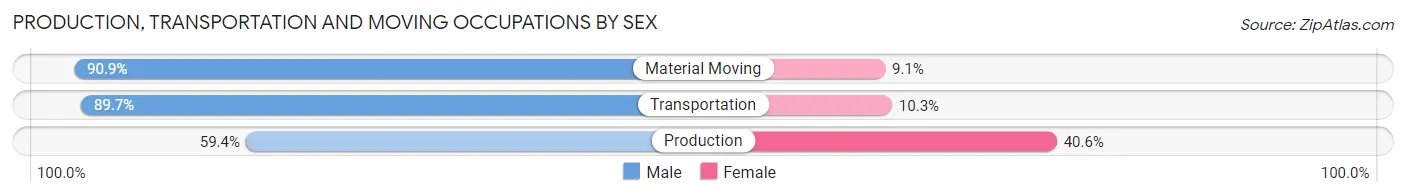
| Occupation | Male | Female |
| Production | 41 (59.4%) | 28 (40.6%) |
| Transportation | 26 (89.7%) | 3 (10.3%) |
| Material Moving | 50 (90.9%) | 5 (9.1%) |
| Total (Category) | 117 (76.5%) | 36 (23.5%) |
| Total (Overall) | 382 (48.7%) | 403 (51.3%) |
Employment Industries by Sex in North Lewisburg
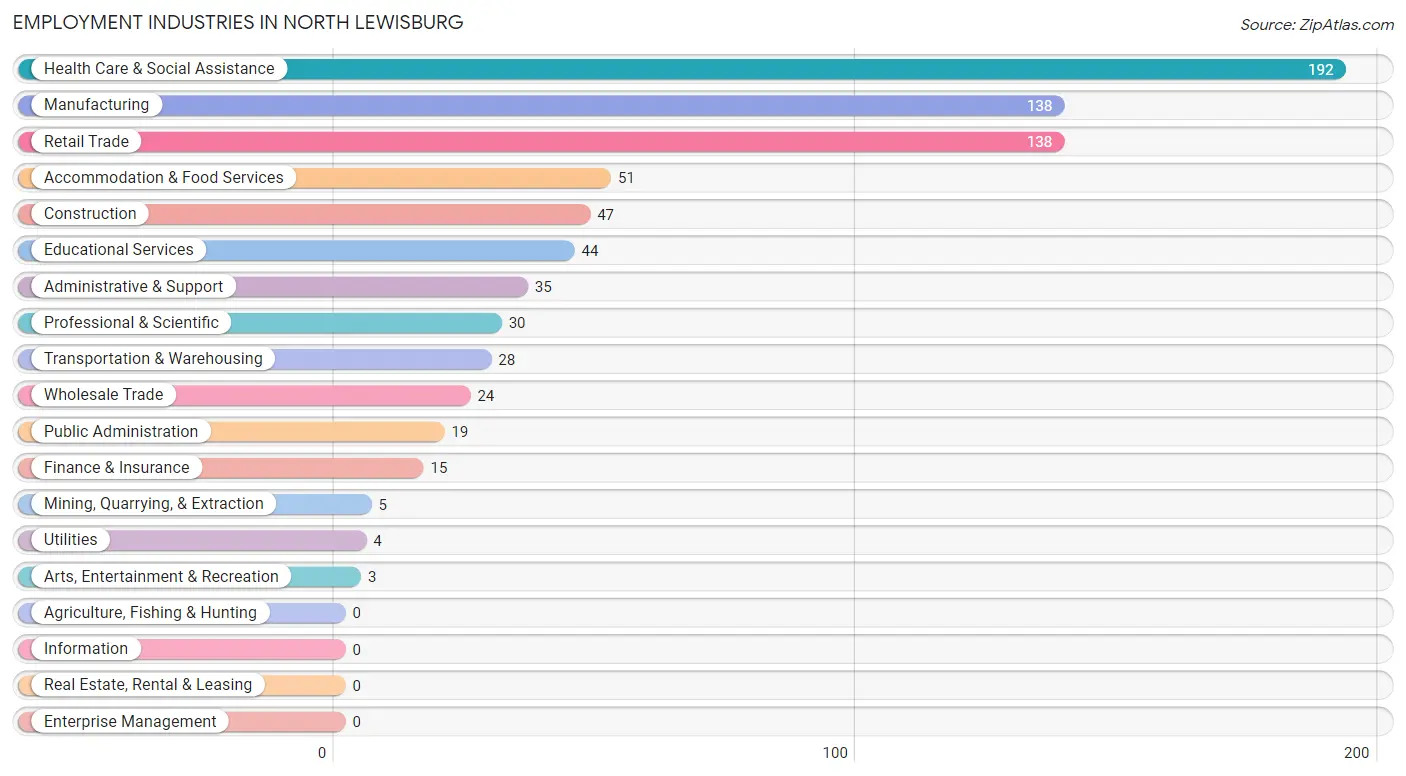
Employment Industries in North Lewisburg
The major employment industries in North Lewisburg include Health Care & Social Assistance (192 | 24.5%), Manufacturing (138 | 17.6%), Retail Trade (138 | 17.6%), Accommodation & Food Services (51 | 6.5%), and Construction (47 | 6.0%).
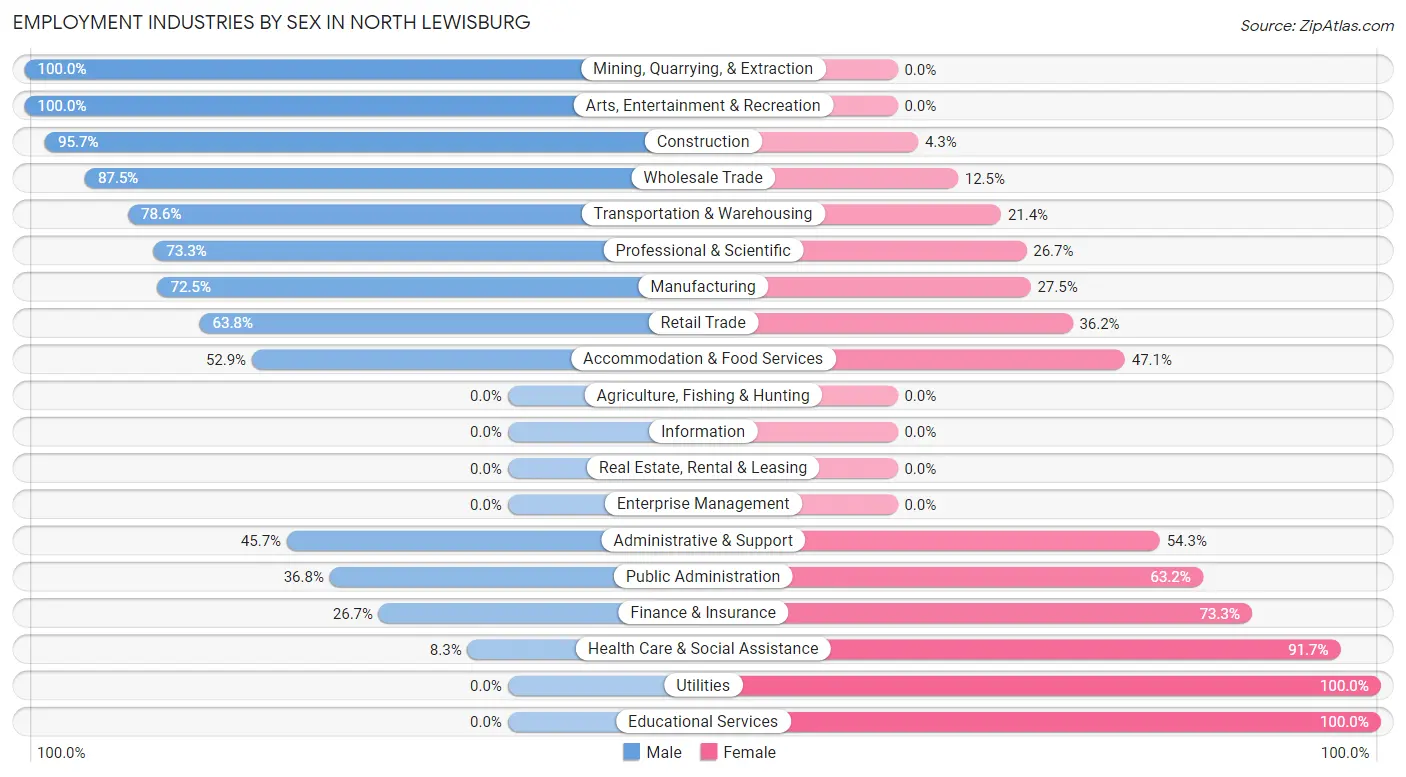
Employment Industries by Sex in North Lewisburg
The North Lewisburg industries that see more men than women are Mining, Quarrying, & Extraction (100.0%), Arts, Entertainment & Recreation (100.0%), and Construction (95.7%), whereas the industries that tend to have a higher number of women are Utilities (100.0%), Educational Services (100.0%), and Health Care & Social Assistance (91.7%).
| Industry | Male | Female |
| Agriculture, Fishing & Hunting | 0 (0.0%) | 0 (0.0%) |
| Mining, Quarrying, & Extraction | 5 (100.0%) | 0 (0.0%) |
| Construction | 45 (95.7%) | 2 (4.3%) |
| Manufacturing | 100 (72.5%) | 38 (27.5%) |
| Wholesale Trade | 21 (87.5%) | 3 (12.5%) |
| Retail Trade | 88 (63.8%) | 50 (36.2%) |
| Transportation & Warehousing | 22 (78.6%) | 6 (21.4%) |
| Utilities | 0 (0.0%) | 4 (100.0%) |
| Information | 0 (0.0%) | 0 (0.0%) |
| Finance & Insurance | 4 (26.7%) | 11 (73.3%) |
| Real Estate, Rental & Leasing | 0 (0.0%) | 0 (0.0%) |
| Professional & Scientific | 22 (73.3%) | 8 (26.7%) |
| Enterprise Management | 0 (0.0%) | 0 (0.0%) |
| Administrative & Support | 16 (45.7%) | 19 (54.3%) |
| Educational Services | 0 (0.0%) | 44 (100.0%) |
| Health Care & Social Assistance | 16 (8.3%) | 176 (91.7%) |
| Arts, Entertainment & Recreation | 3 (100.0%) | 0 (0.0%) |
| Accommodation & Food Services | 27 (52.9%) | 24 (47.1%) |
| Public Administration | 7 (36.8%) | 12 (63.2%) |
| Total | 382 (48.7%) | 403 (51.3%) |
Education in North Lewisburg
School Enrollment in North Lewisburg
The most common levels of schooling among the 335 students in North Lewisburg are high school (83 | 24.8%), middle school (82 | 24.5%), and elementary school (49 | 14.6%).
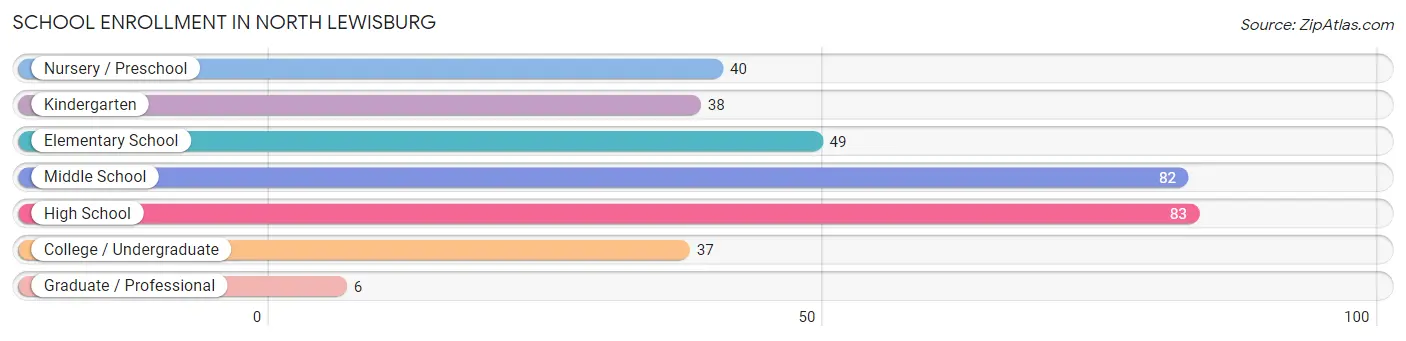
| School Level | # Students | % Students |
| Nursery / Preschool | 40 | 11.9% |
| Kindergarten | 38 | 11.3% |
| Elementary School | 49 | 14.6% |
| Middle School | 82 | 24.5% |
| High School | 83 | 24.8% |
| College / Undergraduate | 37 | 11.0% |
| Graduate / Professional | 6 | 1.8% |
| Total | 335 | 100.0% |
School Enrollment by Age by Funding Source in North Lewisburg
Out of a total of 335 students who are enrolled in schools in North Lewisburg, 26 (7.8%) attend a private institution, while the remaining 309 (92.2%) are enrolled in public schools. The age group of 3 to 4 year olds has the highest likelihood of being enrolled in private schools, with 15 (57.7% in the age bracket) enrolled. Conversely, the age group of 15 to 17 year olds has the lowest likelihood of being enrolled in a private school, with 53 (100.0% in the age bracket) attending a public institution.
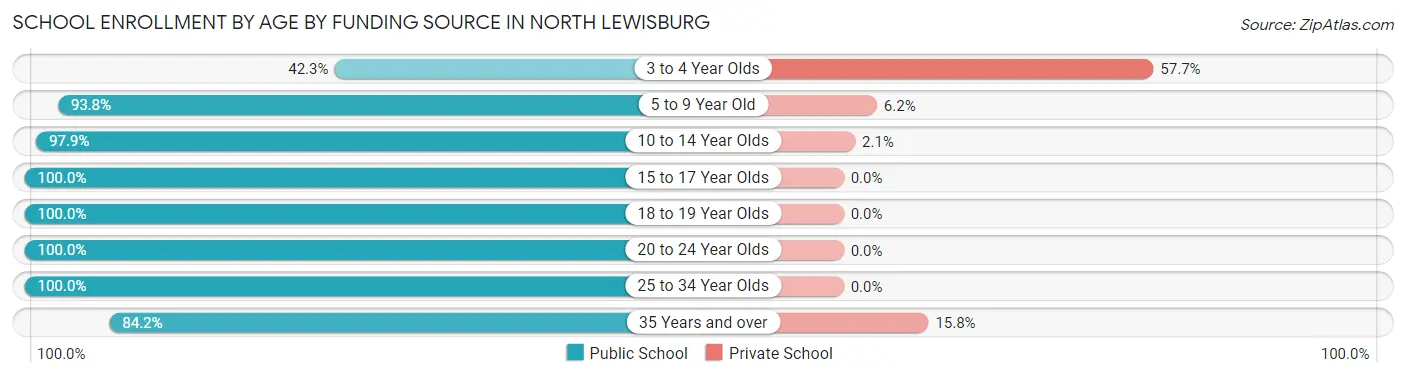
| Age Bracket | Public School | Private School |
| 3 to 4 Year Olds | 11 (42.3%) | 15 (57.7%) |
| 5 to 9 Year Old | 91 (93.8%) | 6 (6.2%) |
| 10 to 14 Year Olds | 92 (97.9%) | 2 (2.1%) |
| 15 to 17 Year Olds | 53 (100.0%) | 0 (0.0%) |
| 18 to 19 Year Olds | 27 (100.0%) | 0 (0.0%) |
| 20 to 24 Year Olds | 12 (100.0%) | 0 (0.0%) |
| 25 to 34 Year Olds | 7 (100.0%) | 0 (0.0%) |
| 35 Years and over | 16 (84.2%) | 3 (15.8%) |
| Total | 309 (92.2%) | 26 (7.8%) |
Educational Attainment by Field of Study in North Lewisburg
Education (47 | 27.8%), business (21 | 12.4%), arts & humanities (21 | 12.4%), liberal arts & history (20 | 11.8%), and visual & performing arts (12 | 7.1%) are the most common fields of study among 169 individuals in North Lewisburg who have obtained a bachelor's degree or higher.
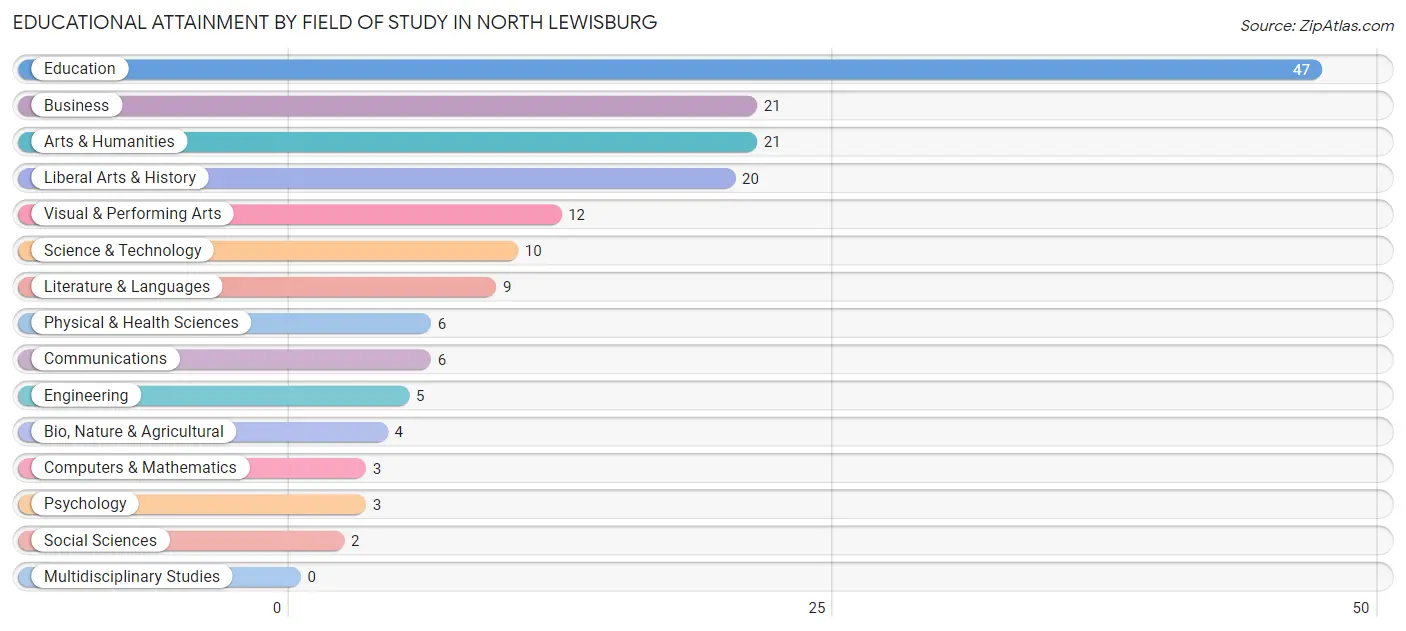
| Field of Study | # Graduates | % Graduates |
| Computers & Mathematics | 3 | 1.8% |
| Bio, Nature & Agricultural | 4 | 2.4% |
| Physical & Health Sciences | 6 | 3.5% |
| Psychology | 3 | 1.8% |
| Social Sciences | 2 | 1.2% |
| Engineering | 5 | 3.0% |
| Multidisciplinary Studies | 0 | 0.0% |
| Science & Technology | 10 | 5.9% |
| Business | 21 | 12.4% |
| Education | 47 | 27.8% |
| Literature & Languages | 9 | 5.3% |
| Liberal Arts & History | 20 | 11.8% |
| Visual & Performing Arts | 12 | 7.1% |
| Communications | 6 | 3.5% |
| Arts & Humanities | 21 | 12.4% |
| Total | 169 | 100.0% |
Transportation & Commute in North Lewisburg
Vehicle Availability by Sex in North Lewisburg
The most prevalent vehicle ownership categories in North Lewisburg are males with 2 vehicles (157, accounting for 42.4%) and females with 2 vehicles (142, making up 44.1%).
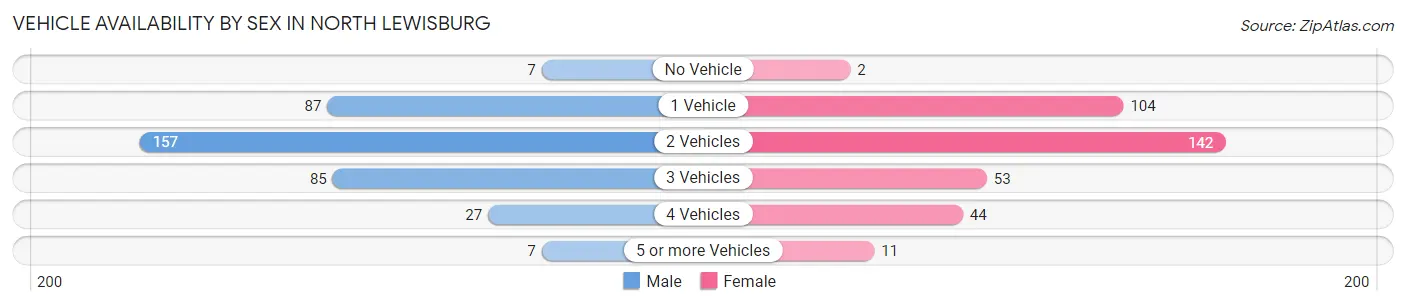
| Vehicles Available | Male | Female |
| No Vehicle | 7 (1.9%) | 2 (0.6%) |
| 1 Vehicle | 87 (23.5%) | 104 (29.2%) |
| 2 Vehicles | 157 (42.4%) | 142 (39.9%) |
| 3 Vehicles | 85 (23.0%) | 53 (14.9%) |
| 4 Vehicles | 27 (7.3%) | 44 (12.4%) |
| 5 or more Vehicles | 7 (1.9%) | 11 (3.1%) |
| Total | 370 (100.0%) | 356 (100.0%) |
Commute Time in North Lewisburg
The most frequently occuring commute durations in North Lewisburg are 20 to 24 minutes (200 commuters, 28.6%), 15 to 19 minutes (192 commuters, 27.5%), and 45 to 59 minutes (60 commuters, 8.6%).
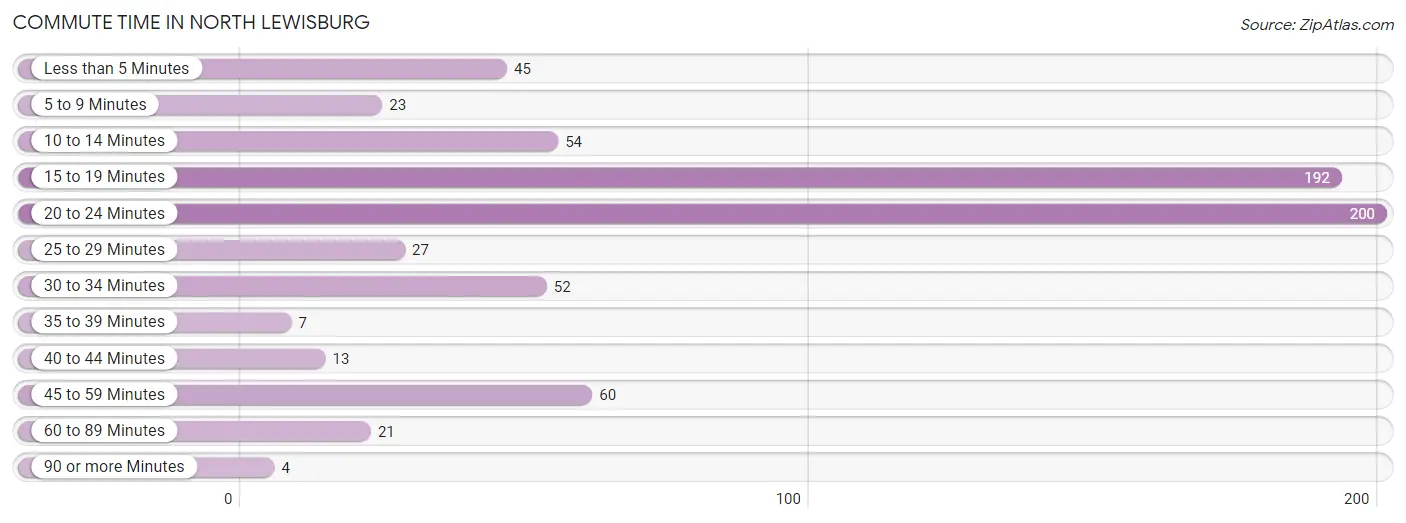
| Commute Time | # Commuters | % Commuters |
| Less than 5 Minutes | 45 | 6.5% |
| 5 to 9 Minutes | 23 | 3.3% |
| 10 to 14 Minutes | 54 | 7.7% |
| 15 to 19 Minutes | 192 | 27.5% |
| 20 to 24 Minutes | 200 | 28.6% |
| 25 to 29 Minutes | 27 | 3.9% |
| 30 to 34 Minutes | 52 | 7.4% |
| 35 to 39 Minutes | 7 | 1.0% |
| 40 to 44 Minutes | 13 | 1.9% |
| 45 to 59 Minutes | 60 | 8.6% |
| 60 to 89 Minutes | 21 | 3.0% |
| 90 or more Minutes | 4 | 0.6% |
Commute Time by Sex in North Lewisburg
The most common commute times in North Lewisburg are 20 to 24 minutes (103 commuters, 29.2%) for males and 15 to 19 minutes (114 commuters, 33.0%) for females.
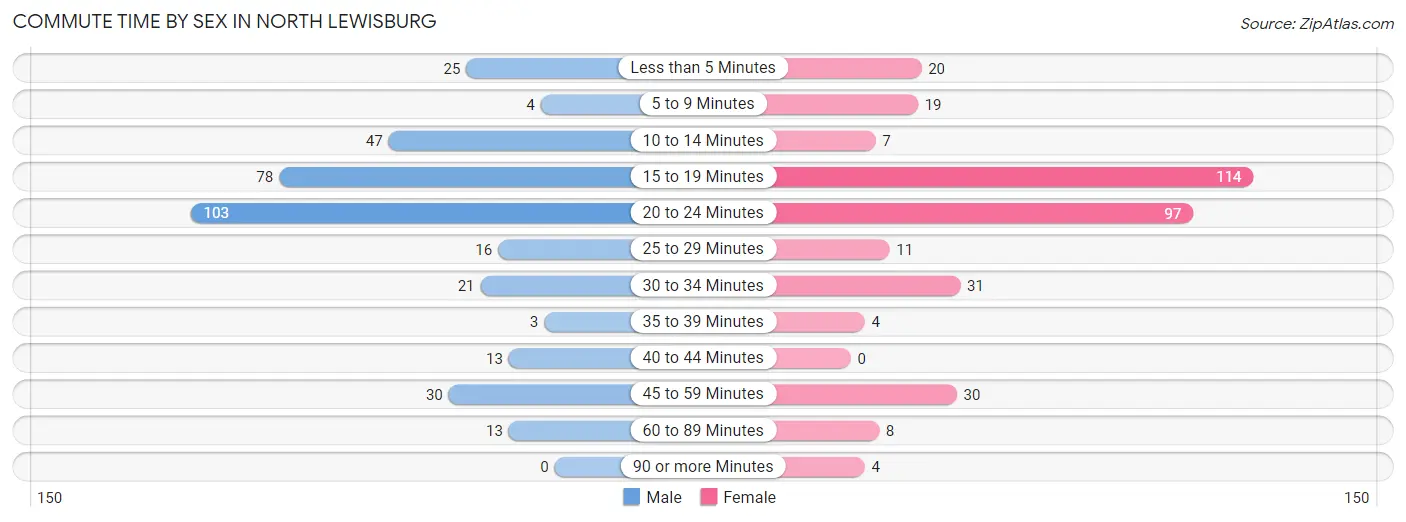
| Commute Time | Male | Female |
| Less than 5 Minutes | 25 (7.1%) | 20 (5.8%) |
| 5 to 9 Minutes | 4 (1.1%) | 19 (5.5%) |
| 10 to 14 Minutes | 47 (13.3%) | 7 (2.0%) |
| 15 to 19 Minutes | 78 (22.1%) | 114 (33.0%) |
| 20 to 24 Minutes | 103 (29.2%) | 97 (28.1%) |
| 25 to 29 Minutes | 16 (4.5%) | 11 (3.2%) |
| 30 to 34 Minutes | 21 (5.9%) | 31 (9.0%) |
| 35 to 39 Minutes | 3 (0.9%) | 4 (1.2%) |
| 40 to 44 Minutes | 13 (3.7%) | 0 (0.0%) |
| 45 to 59 Minutes | 30 (8.5%) | 30 (8.7%) |
| 60 to 89 Minutes | 13 (3.7%) | 8 (2.3%) |
| 90 or more Minutes | 0 (0.0%) | 4 (1.2%) |
Time of Departure to Work by Sex in North Lewisburg
The most frequent times of departure to work in North Lewisburg are 6:00 AM to 6:29 AM (69, 19.6%) for males and 7:00 AM to 7:29 AM (87, 25.2%) for females.
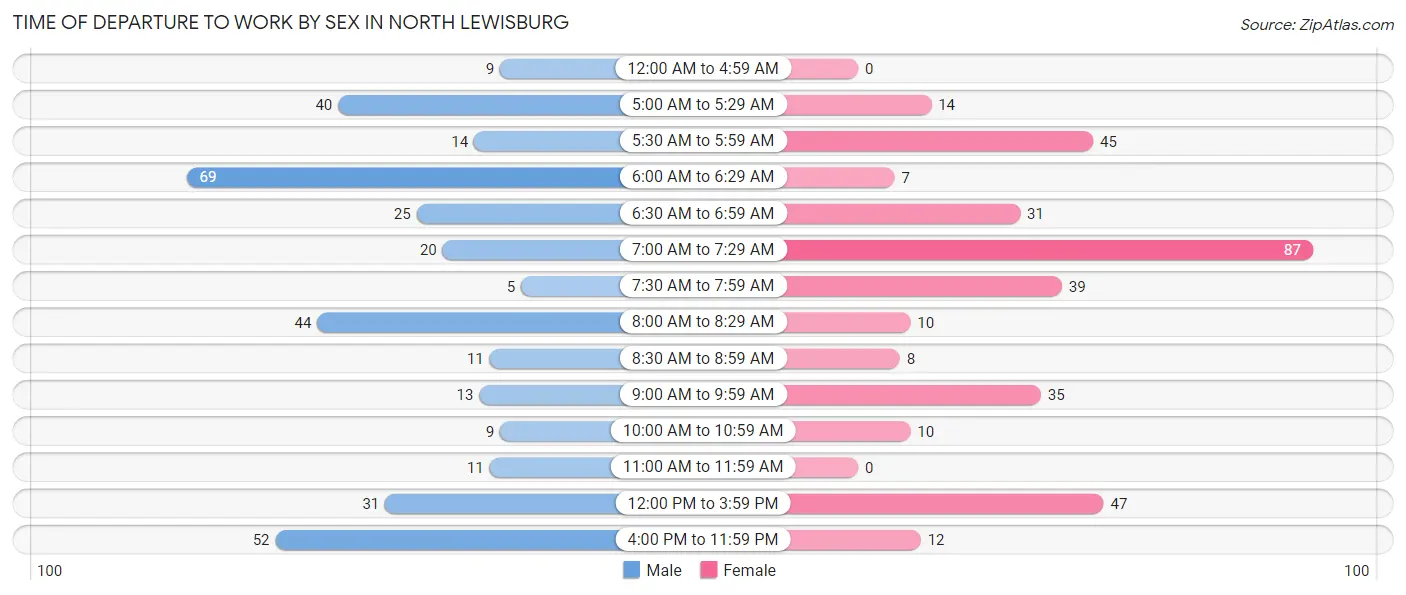
| Time of Departure | Male | Female |
| 12:00 AM to 4:59 AM | 9 (2.5%) | 0 (0.0%) |
| 5:00 AM to 5:29 AM | 40 (11.3%) | 14 (4.1%) |
| 5:30 AM to 5:59 AM | 14 (4.0%) | 45 (13.0%) |
| 6:00 AM to 6:29 AM | 69 (19.6%) | 7 (2.0%) |
| 6:30 AM to 6:59 AM | 25 (7.1%) | 31 (9.0%) |
| 7:00 AM to 7:29 AM | 20 (5.7%) | 87 (25.2%) |
| 7:30 AM to 7:59 AM | 5 (1.4%) | 39 (11.3%) |
| 8:00 AM to 8:29 AM | 44 (12.5%) | 10 (2.9%) |
| 8:30 AM to 8:59 AM | 11 (3.1%) | 8 (2.3%) |
| 9:00 AM to 9:59 AM | 13 (3.7%) | 35 (10.1%) |
| 10:00 AM to 10:59 AM | 9 (2.5%) | 10 (2.9%) |
| 11:00 AM to 11:59 AM | 11 (3.1%) | 0 (0.0%) |
| 12:00 PM to 3:59 PM | 31 (8.8%) | 47 (13.6%) |
| 4:00 PM to 11:59 PM | 52 (14.7%) | 12 (3.5%) |
| Total | 353 (100.0%) | 345 (100.0%) |
Housing Occupancy in North Lewisburg
Occupancy by Ownership in North Lewisburg
Of the total 745 dwellings in North Lewisburg, owner-occupied units account for 508 (68.2%), while renter-occupied units make up 237 (31.8%).
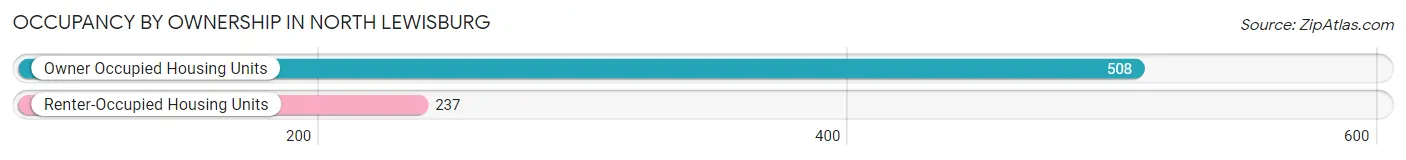
| Occupancy | # Housing Units | % Housing Units |
| Owner Occupied Housing Units | 508 | 68.2% |
| Renter-Occupied Housing Units | 237 | 31.8% |
| Total Occupied Housing Units | 745 | 100.0% |
Occupancy by Household Size in North Lewisburg
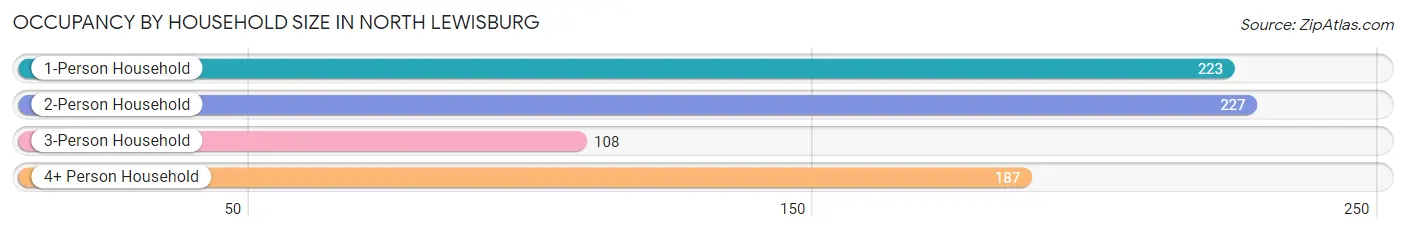
| Household Size | # Housing Units | % Housing Units |
| 1-Person Household | 223 | 29.9% |
| 2-Person Household | 227 | 30.5% |
| 3-Person Household | 108 | 14.5% |
| 4+ Person Household | 187 | 25.1% |
| Total Housing Units | 745 | 100.0% |
Occupancy by Ownership by Household Size in North Lewisburg
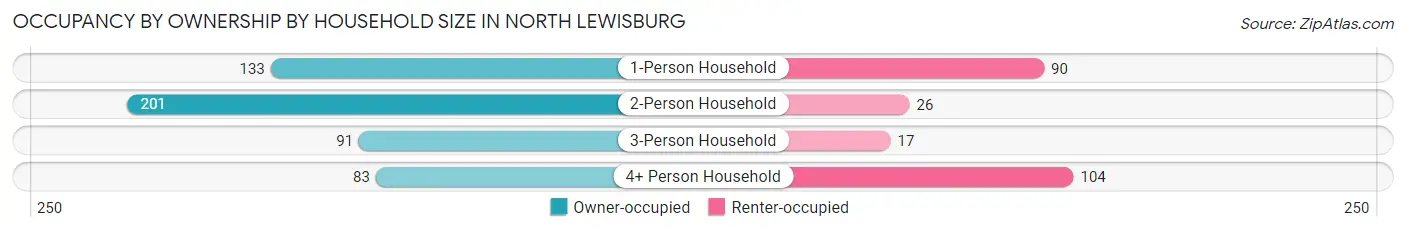
| Household Size | Owner-occupied | Renter-occupied |
| 1-Person Household | 133 (59.6%) | 90 (40.4%) |
| 2-Person Household | 201 (88.5%) | 26 (11.5%) |
| 3-Person Household | 91 (84.3%) | 17 (15.7%) |
| 4+ Person Household | 83 (44.4%) | 104 (55.6%) |
| Total Housing Units | 508 (68.2%) | 237 (31.8%) |
Occupancy by Educational Attainment in North Lewisburg
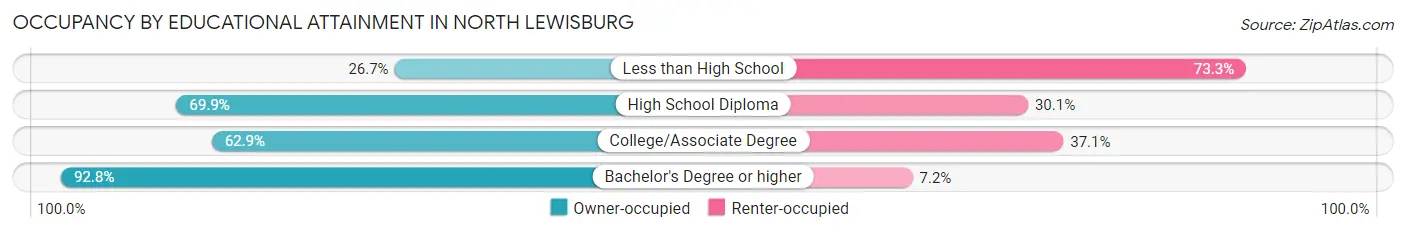
| Household Size | Owner-occupied | Renter-occupied |
| Less than High School | 12 (26.7%) | 33 (73.3%) |
| High School Diploma | 267 (69.9%) | 115 (30.1%) |
| College/Associate Degree | 139 (62.9%) | 82 (37.1%) |
| Bachelor's Degree or higher | 90 (92.8%) | 7 (7.2%) |
Occupancy by Age of Householder in North Lewisburg
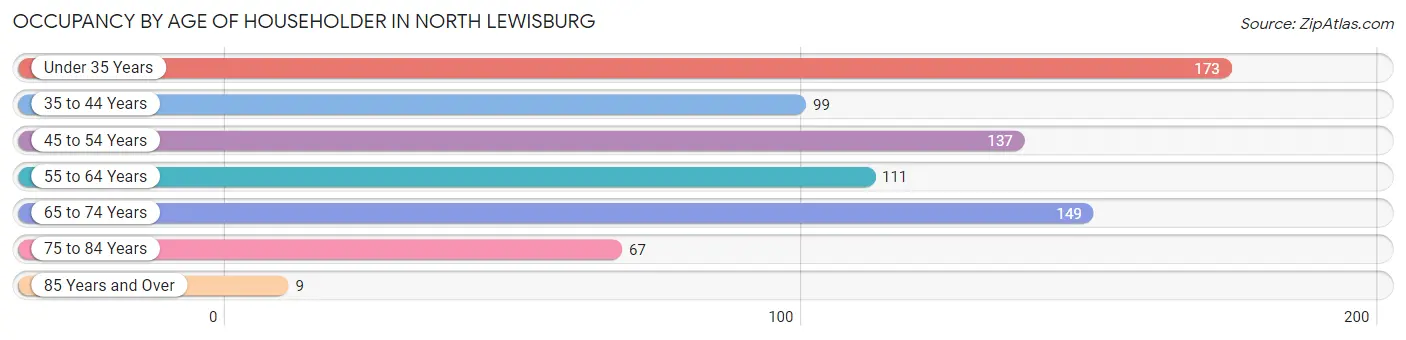
| Age Bracket | # Households | % Households |
| Under 35 Years | 173 | 23.2% |
| 35 to 44 Years | 99 | 13.3% |
| 45 to 54 Years | 137 | 18.4% |
| 55 to 64 Years | 111 | 14.9% |
| 65 to 74 Years | 149 | 20.0% |
| 75 to 84 Years | 67 | 9.0% |
| 85 Years and Over | 9 | 1.2% |
| Total | 745 | 100.0% |
Housing Finances in North Lewisburg
Median Income by Occupancy in North Lewisburg
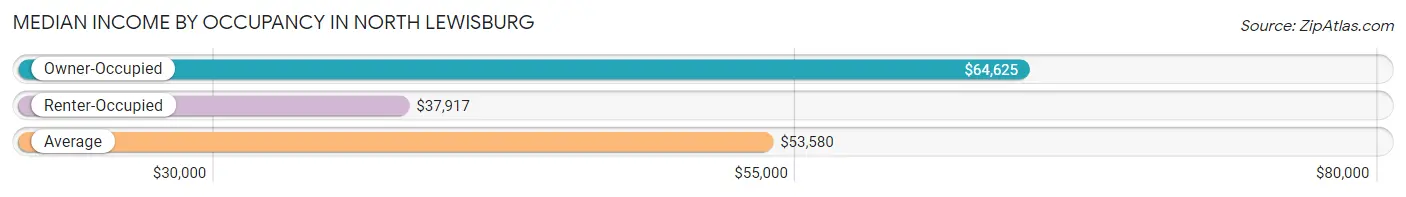
| Occupancy Type | # Households | Median Income |
| Owner-Occupied | 508 (68.2%) | $64,625 |
| Renter-Occupied | 237 (31.8%) | $37,917 |
| Average | 745 (100.0%) | $53,580 |
Occupancy by Householder Income Bracket in North Lewisburg
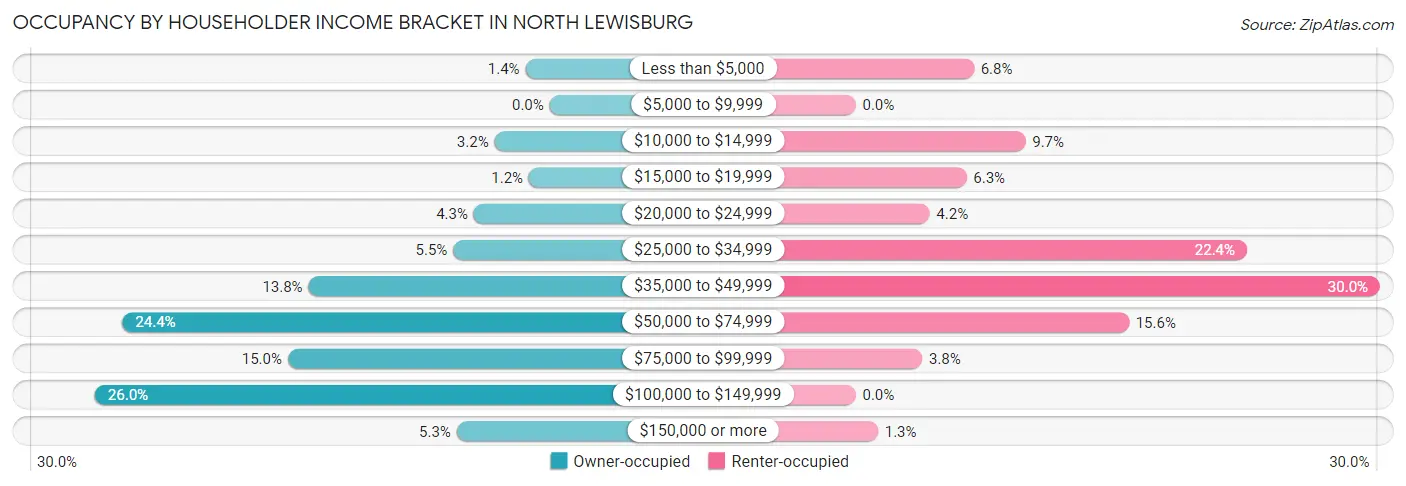
| Income Bracket | Owner-occupied | Renter-occupied |
| Less than $5,000 | 7 (1.4%) | 16 (6.8%) |
| $5,000 to $9,999 | 0 (0.0%) | 0 (0.0%) |
| $10,000 to $14,999 | 16 (3.2%) | 23 (9.7%) |
| $15,000 to $19,999 | 6 (1.2%) | 15 (6.3%) |
| $20,000 to $24,999 | 22 (4.3%) | 10 (4.2%) |
| $25,000 to $34,999 | 28 (5.5%) | 53 (22.4%) |
| $35,000 to $49,999 | 70 (13.8%) | 71 (30.0%) |
| $50,000 to $74,999 | 124 (24.4%) | 37 (15.6%) |
| $75,000 to $99,999 | 76 (15.0%) | 9 (3.8%) |
| $100,000 to $149,999 | 132 (26.0%) | 0 (0.0%) |
| $150,000 or more | 27 (5.3%) | 3 (1.3%) |
| Total | 508 (100.0%) | 237 (100.0%) |
Monthly Housing Cost Tiers in North Lewisburg
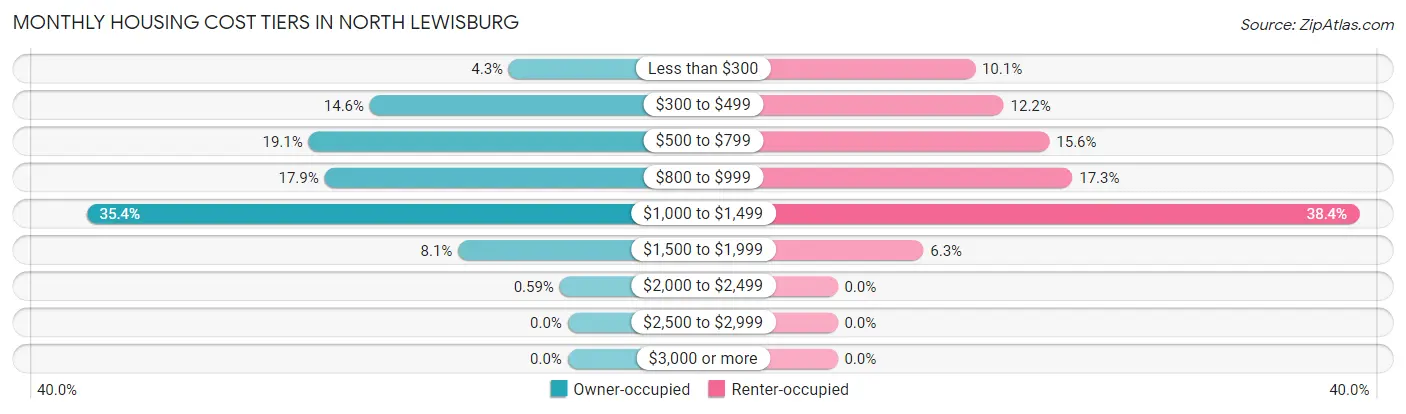
| Monthly Cost | Owner-occupied | Renter-occupied |
| Less than $300 | 22 (4.3%) | 24 (10.1%) |
| $300 to $499 | 74 (14.6%) | 29 (12.2%) |
| $500 to $799 | 97 (19.1%) | 37 (15.6%) |
| $800 to $999 | 91 (17.9%) | 41 (17.3%) |
| $1,000 to $1,499 | 180 (35.4%) | 91 (38.4%) |
| $1,500 to $1,999 | 41 (8.1%) | 15 (6.3%) |
| $2,000 to $2,499 | 3 (0.6%) | 0 (0.0%) |
| $2,500 to $2,999 | 0 (0.0%) | 0 (0.0%) |
| $3,000 or more | 0 (0.0%) | 0 (0.0%) |
| Total | 508 (100.0%) | 237 (100.0%) |
Physical Housing Characteristics in North Lewisburg
Housing Structures in North Lewisburg
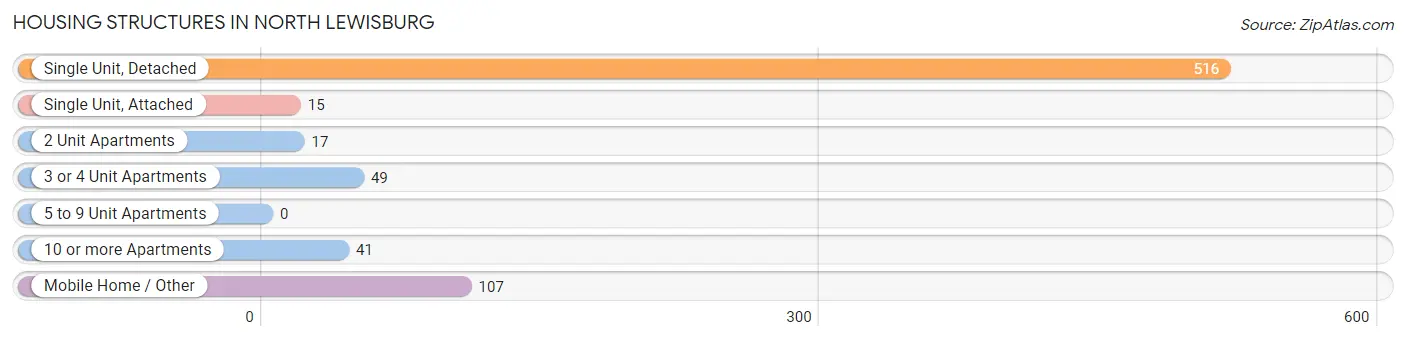
| Structure Type | # Housing Units | % Housing Units |
| Single Unit, Detached | 516 | 69.3% |
| Single Unit, Attached | 15 | 2.0% |
| 2 Unit Apartments | 17 | 2.3% |
| 3 or 4 Unit Apartments | 49 | 6.6% |
| 5 to 9 Unit Apartments | 0 | 0.0% |
| 10 or more Apartments | 41 | 5.5% |
| Mobile Home / Other | 107 | 14.4% |
| Total | 745 | 100.0% |
Housing Structures by Occupancy in North Lewisburg

| Structure Type | Owner-occupied | Renter-occupied |
| Single Unit, Detached | 439 (85.1%) | 77 (14.9%) |
| Single Unit, Attached | 12 (80.0%) | 3 (20.0%) |
| 2 Unit Apartments | 0 (0.0%) | 17 (100.0%) |
| 3 or 4 Unit Apartments | 0 (0.0%) | 49 (100.0%) |
| 5 to 9 Unit Apartments | 0 (0.0%) | 0 (0.0%) |
| 10 or more Apartments | 0 (0.0%) | 41 (100.0%) |
| Mobile Home / Other | 57 (53.3%) | 50 (46.7%) |
| Total | 508 (68.2%) | 237 (31.8%) |
Housing Structures by Number of Rooms in North Lewisburg
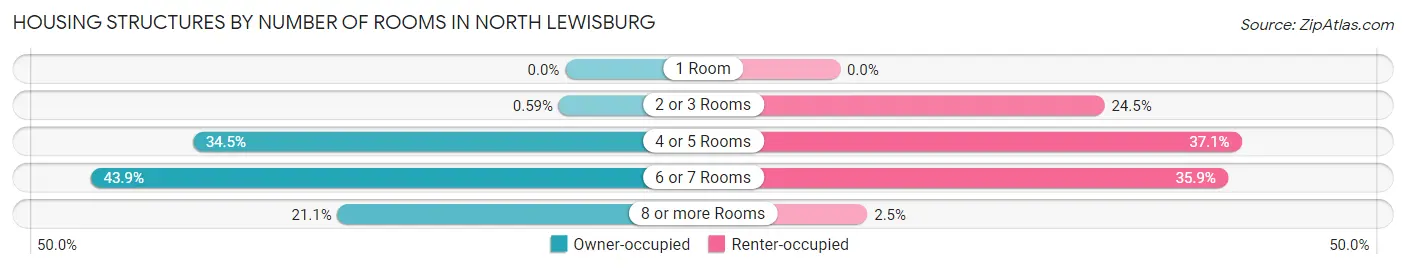
| Number of Rooms | Owner-occupied | Renter-occupied |
| 1 Room | 0 (0.0%) | 0 (0.0%) |
| 2 or 3 Rooms | 3 (0.6%) | 58 (24.5%) |
| 4 or 5 Rooms | 175 (34.4%) | 88 (37.1%) |
| 6 or 7 Rooms | 223 (43.9%) | 85 (35.9%) |
| 8 or more Rooms | 107 (21.1%) | 6 (2.5%) |
| Total | 508 (100.0%) | 237 (100.0%) |
Housing Structure by Heating Type in North Lewisburg
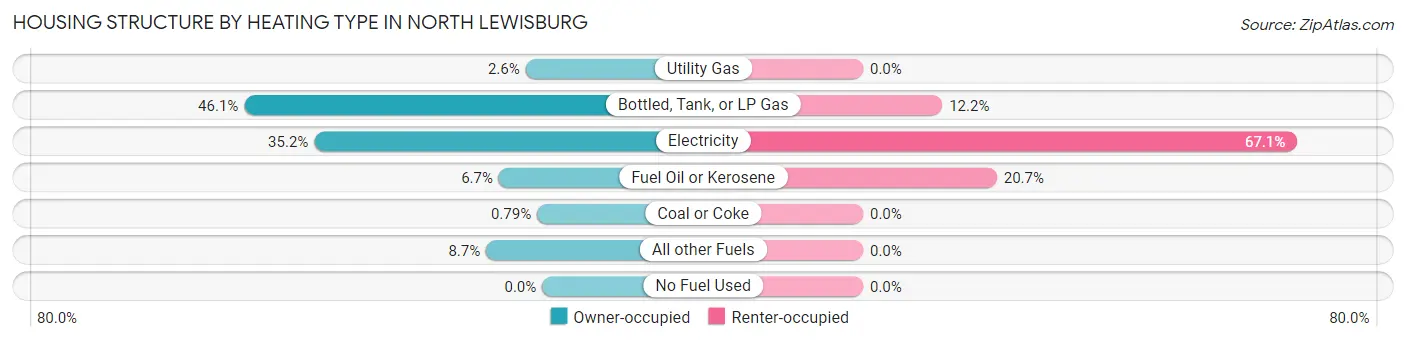
| Heating Type | Owner-occupied | Renter-occupied |
| Utility Gas | 13 (2.6%) | 0 (0.0%) |
| Bottled, Tank, or LP Gas | 234 (46.1%) | 29 (12.2%) |
| Electricity | 179 (35.2%) | 159 (67.1%) |
| Fuel Oil or Kerosene | 34 (6.7%) | 49 (20.7%) |
| Coal or Coke | 4 (0.8%) | 0 (0.0%) |
| All other Fuels | 44 (8.7%) | 0 (0.0%) |
| No Fuel Used | 0 (0.0%) | 0 (0.0%) |
| Total | 508 (100.0%) | 237 (100.0%) |
Household Vehicle Usage in North Lewisburg
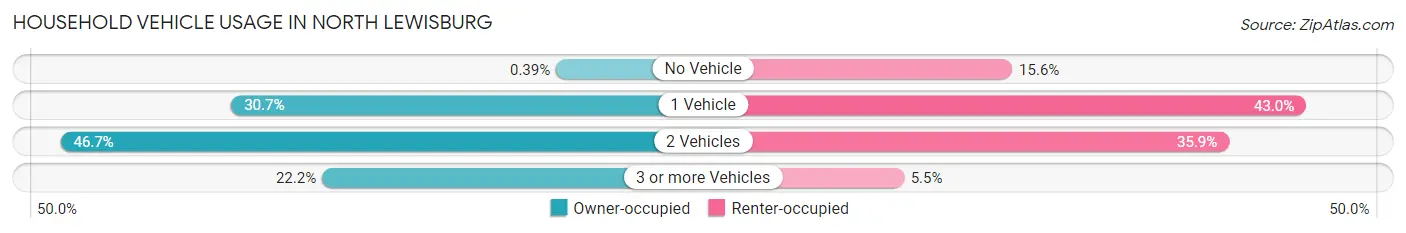
| Vehicles per Household | Owner-occupied | Renter-occupied |
| No Vehicle | 2 (0.4%) | 37 (15.6%) |
| 1 Vehicle | 156 (30.7%) | 102 (43.0%) |
| 2 Vehicles | 237 (46.7%) | 85 (35.9%) |
| 3 or more Vehicles | 113 (22.2%) | 13 (5.5%) |
| Total | 508 (100.0%) | 237 (100.0%) |
Real Estate & Mortgages in North Lewisburg
Real Estate and Mortgage Overview in North Lewisburg
| Characteristic | Without Mortgage | With Mortgage |
| Housing Units | 181 | 327 |
| Median Property Value | $132,300 | $153,700 |
| Median Household Income | $53,958 | $15 |
| Monthly Housing Costs | $497 | $0 |
| Real Estate Taxes | $1,326 | $15 |
Property Value by Mortgage Status in North Lewisburg
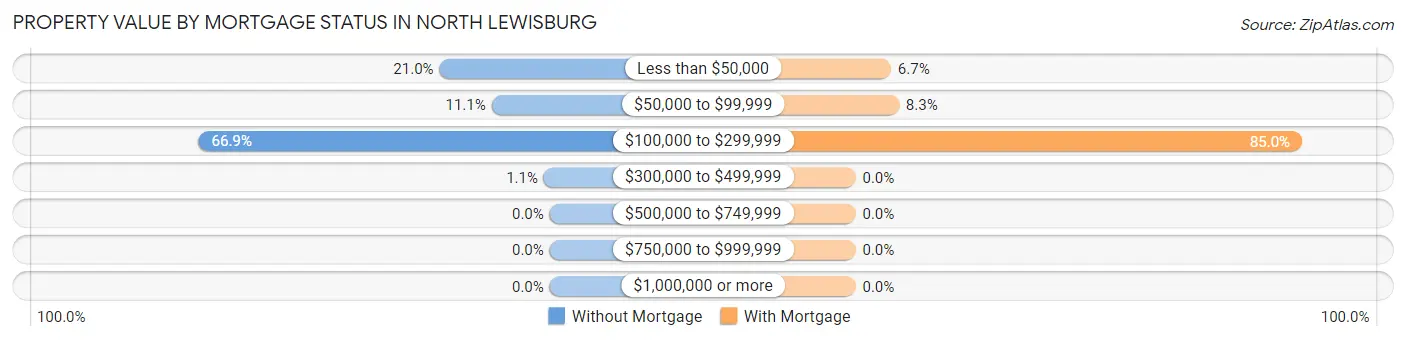
| Property Value | Without Mortgage | With Mortgage |
| Less than $50,000 | 38 (21.0%) | 22 (6.7%) |
| $50,000 to $99,999 | 20 (11.1%) | 27 (8.3%) |
| $100,000 to $299,999 | 121 (66.8%) | 278 (85.0%) |
| $300,000 to $499,999 | 2 (1.1%) | 0 (0.0%) |
| $500,000 to $749,999 | 0 (0.0%) | 0 (0.0%) |
| $750,000 to $999,999 | 0 (0.0%) | 0 (0.0%) |
| $1,000,000 or more | 0 (0.0%) | 0 (0.0%) |
| Total | 181 (100.0%) | 327 (100.0%) |
Household Income by Mortgage Status in North Lewisburg
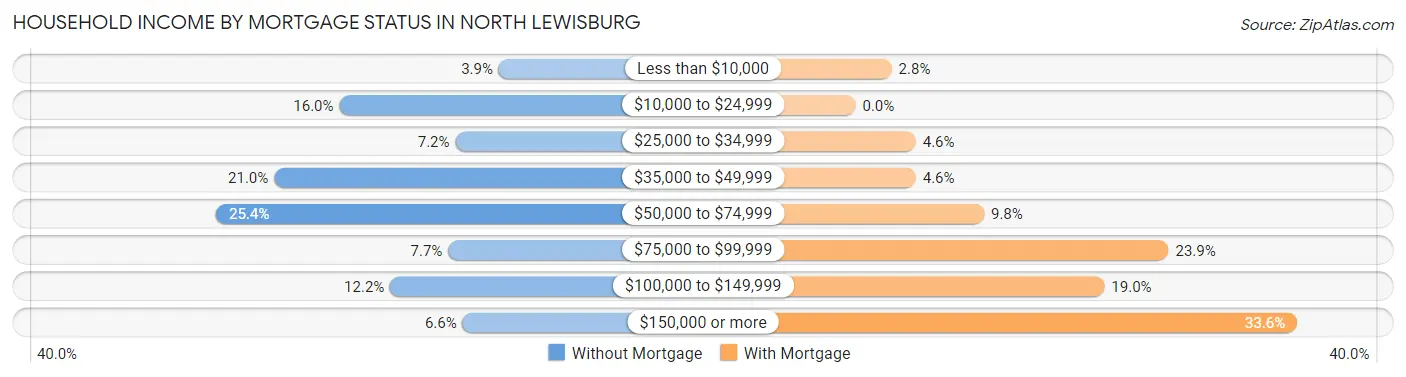
| Household Income | Without Mortgage | With Mortgage |
| Less than $10,000 | 7 (3.9%) | 9 (2.8%) |
| $10,000 to $24,999 | 29 (16.0%) | 0 (0.0%) |
| $25,000 to $34,999 | 13 (7.2%) | 15 (4.6%) |
| $35,000 to $49,999 | 38 (21.0%) | 15 (4.6%) |
| $50,000 to $74,999 | 46 (25.4%) | 32 (9.8%) |
| $75,000 to $99,999 | 14 (7.7%) | 78 (23.8%) |
| $100,000 to $149,999 | 22 (12.1%) | 62 (19.0%) |
| $150,000 or more | 12 (6.6%) | 110 (33.6%) |
| Total | 181 (100.0%) | 327 (100.0%) |
Property Value to Household Income Ratio in North Lewisburg
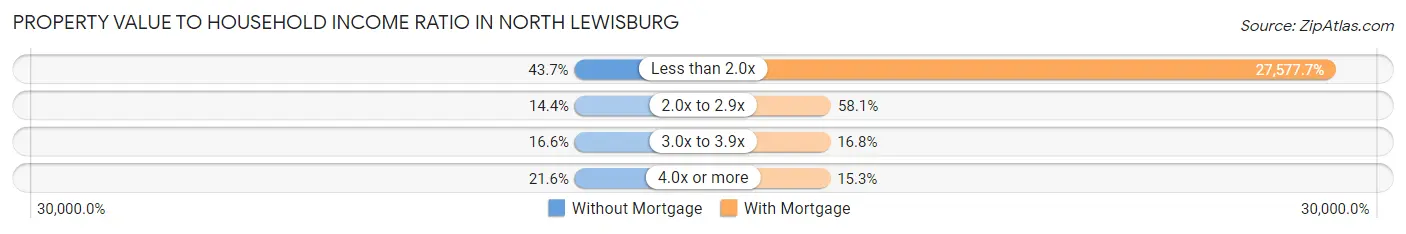
| Value-to-Income Ratio | Without Mortgage | With Mortgage |
| Less than 2.0x | 79 (43.6%) | 90,179 (27,577.7%) |
| 2.0x to 2.9x | 26 (14.4%) | 190 (58.1%) |
| 3.0x to 3.9x | 30 (16.6%) | 55 (16.8%) |
| 4.0x or more | 39 (21.5%) | 50 (15.3%) |
| Total | 181 (100.0%) | 327 (100.0%) |
Real Estate Taxes by Mortgage Status in North Lewisburg
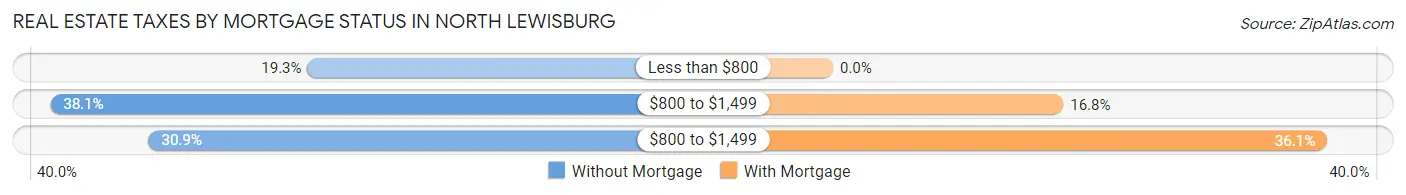
| Property Taxes | Without Mortgage | With Mortgage |
| Less than $800 | 35 (19.3%) | 0 (0.0%) |
| $800 to $1,499 | 69 (38.1%) | 55 (16.8%) |
| $800 to $1,499 | 56 (30.9%) | 118 (36.1%) |
| Total | 181 (100.0%) | 327 (100.0%) |
Health & Disability in North Lewisburg
Health Insurance Coverage by Age in North Lewisburg
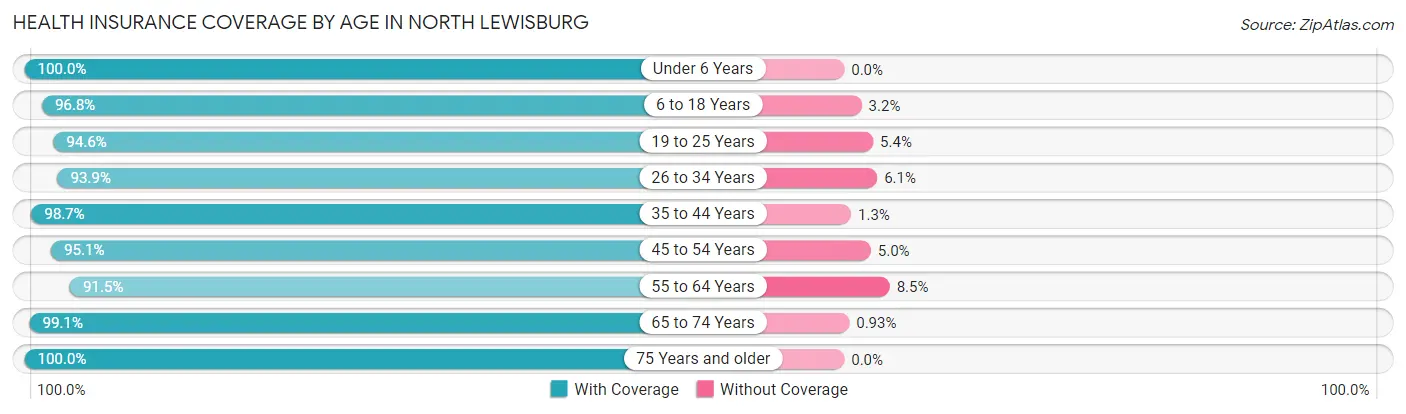
| Age Bracket | With Coverage | Without Coverage |
| Under 6 Years | 241 (100.0%) | 0 (0.0%) |
| 6 to 18 Years | 239 (96.8%) | 8 (3.2%) |
| 19 to 25 Years | 176 (94.6%) | 10 (5.4%) |
| 26 to 34 Years | 214 (93.9%) | 14 (6.1%) |
| 35 to 44 Years | 156 (98.7%) | 2 (1.3%) |
| 45 to 54 Years | 192 (95.1%) | 10 (5.0%) |
| 55 to 64 Years | 173 (91.5%) | 16 (8.5%) |
| 65 to 74 Years | 213 (99.1%) | 2 (0.9%) |
| 75 Years and older | 102 (100.0%) | 0 (0.0%) |
| Total | 1,706 (96.5%) | 62 (3.5%) |
Health Insurance Coverage by Citizenship Status in North Lewisburg
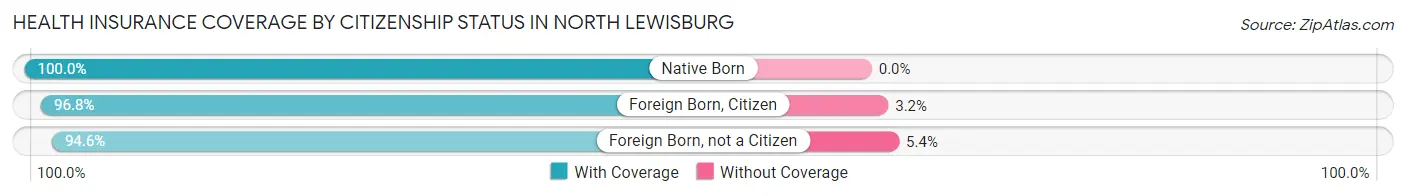
| Citizenship Status | With Coverage | Without Coverage |
| Native Born | 241 (100.0%) | 0 (0.0%) |
| Foreign Born, Citizen | 239 (96.8%) | 8 (3.2%) |
| Foreign Born, not a Citizen | 176 (94.6%) | 10 (5.4%) |
Health Insurance Coverage by Household Income in North Lewisburg
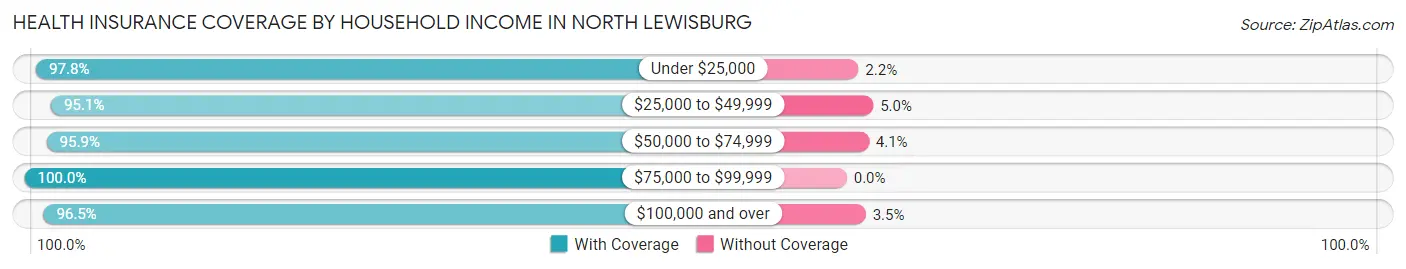
| Household Income | With Coverage | Without Coverage |
| Under $25,000 | 180 (97.8%) | 4 (2.2%) |
| $25,000 to $49,999 | 499 (95.1%) | 26 (5.0%) |
| $50,000 to $74,999 | 371 (95.9%) | 16 (4.1%) |
| $75,000 to $99,999 | 220 (100.0%) | 0 (0.0%) |
| $100,000 and over | 436 (96.5%) | 16 (3.5%) |
Public vs Private Health Insurance Coverage by Age in North Lewisburg
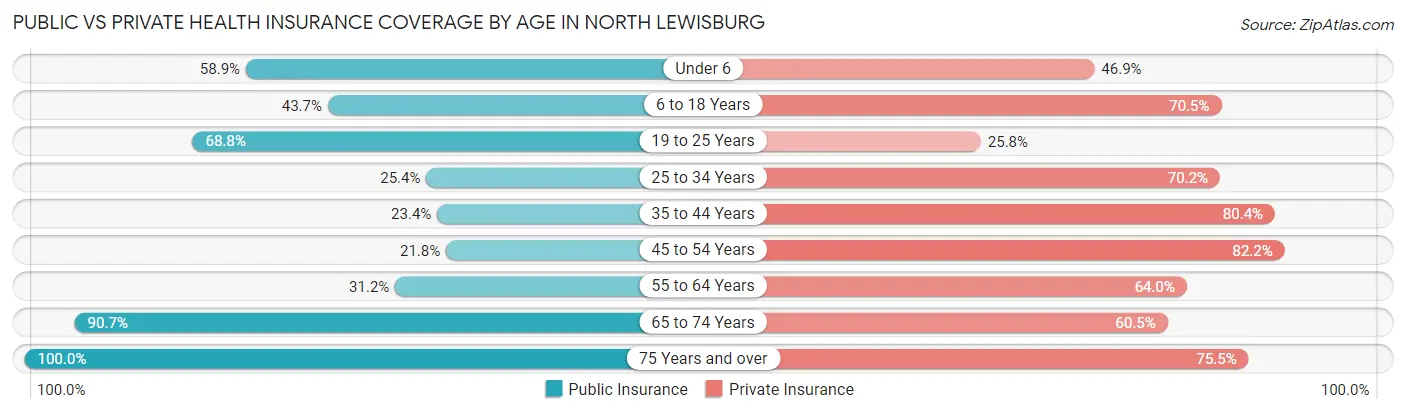
| Age Bracket | Public Insurance | Private Insurance |
| Under 6 | 142 (58.9%) | 113 (46.9%) |
| 6 to 18 Years | 108 (43.7%) | 174 (70.5%) |
| 19 to 25 Years | 128 (68.8%) | 48 (25.8%) |
| 25 to 34 Years | 58 (25.4%) | 160 (70.2%) |
| 35 to 44 Years | 37 (23.4%) | 127 (80.4%) |
| 45 to 54 Years | 44 (21.8%) | 166 (82.2%) |
| 55 to 64 Years | 59 (31.2%) | 121 (64.0%) |
| 65 to 74 Years | 195 (90.7%) | 130 (60.5%) |
| 75 Years and over | 102 (100.0%) | 77 (75.5%) |
| Total | 873 (49.4%) | 1,116 (63.1%) |
Disability Status by Sex by Age in North Lewisburg
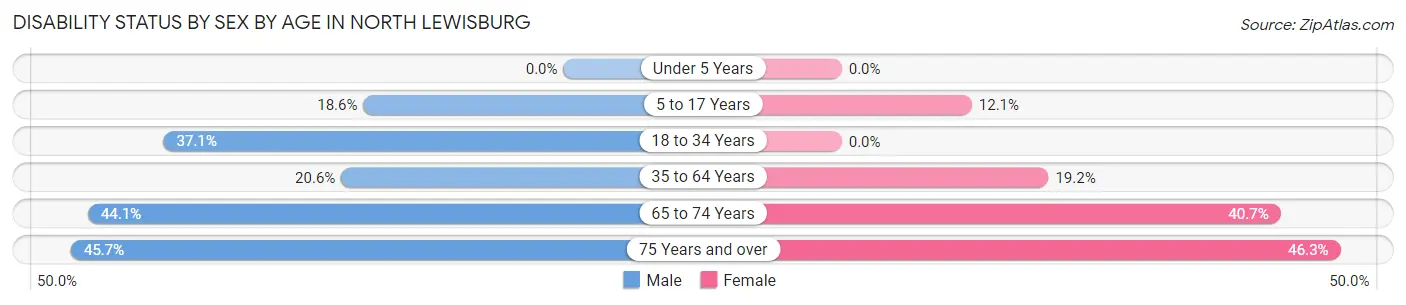
| Age Bracket | Male | Female |
| Under 5 Years | 0 (0.0%) | 0 (0.0%) |
| 5 to 17 Years | 26 (18.6%) | 14 (12.1%) |
| 18 to 34 Years | 82 (37.1%) | 0 (0.0%) |
| 35 to 64 Years | 53 (20.6%) | 56 (19.2%) |
| 65 to 74 Years | 45 (44.1%) | 46 (40.7%) |
| 75 Years and over | 16 (45.7%) | 31 (46.3%) |
Disability Class by Sex by Age in North Lewisburg
Disability Class: Hearing Difficulty
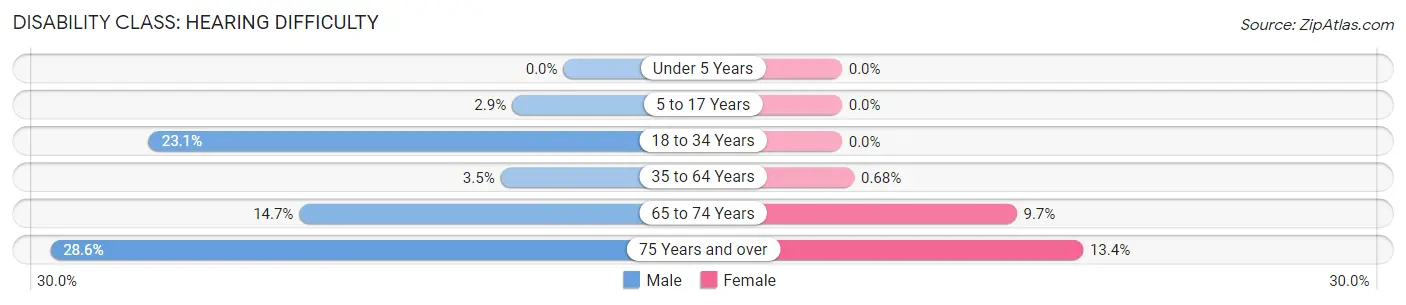
| Age Bracket | Male | Female |
| Under 5 Years | 0 (0.0%) | 0 (0.0%) |
| 5 to 17 Years | 4 (2.9%) | 0 (0.0%) |
| 18 to 34 Years | 51 (23.1%) | 0 (0.0%) |
| 35 to 64 Years | 9 (3.5%) | 2 (0.7%) |
| 65 to 74 Years | 15 (14.7%) | 11 (9.7%) |
| 75 Years and over | 10 (28.6%) | 9 (13.4%) |
Disability Class: Vision Difficulty
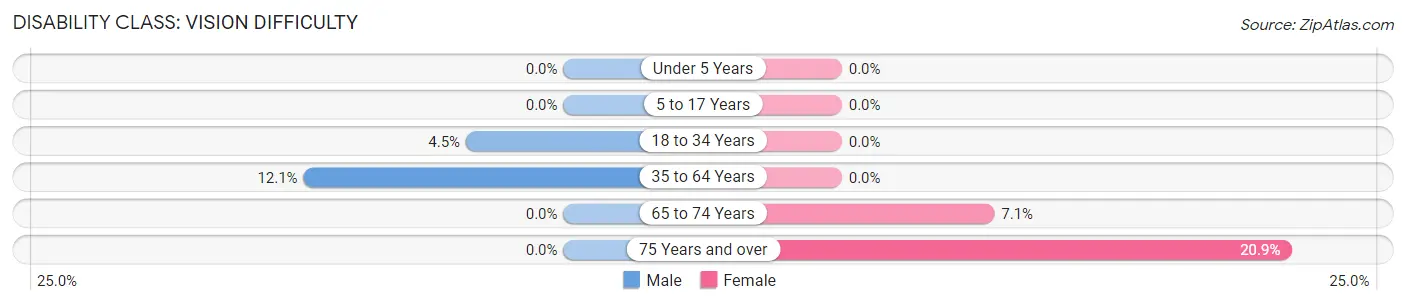
| Age Bracket | Male | Female |
| Under 5 Years | 0 (0.0%) | 0 (0.0%) |
| 5 to 17 Years | 0 (0.0%) | 0 (0.0%) |
| 18 to 34 Years | 10 (4.5%) | 0 (0.0%) |
| 35 to 64 Years | 31 (12.1%) | 0 (0.0%) |
| 65 to 74 Years | 0 (0.0%) | 8 (7.1%) |
| 75 Years and over | 0 (0.0%) | 14 (20.9%) |
Disability Class: Cognitive Difficulty
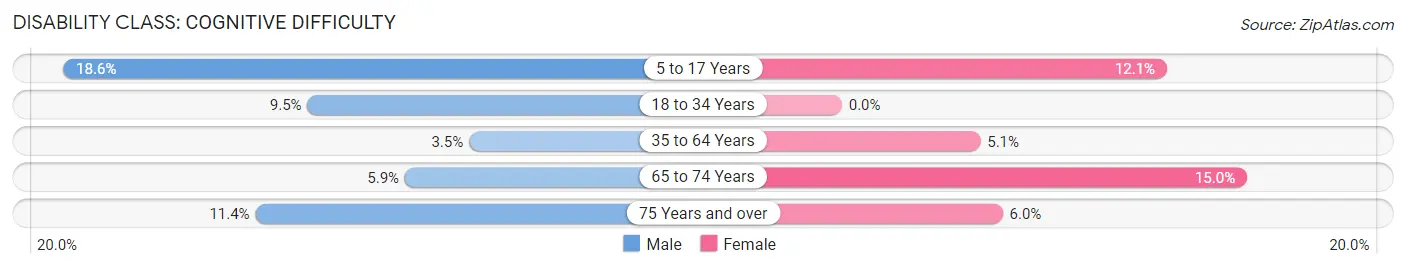
| Age Bracket | Male | Female |
| 5 to 17 Years | 26 (18.6%) | 14 (12.1%) |
| 18 to 34 Years | 21 (9.5%) | 0 (0.0%) |
| 35 to 64 Years | 9 (3.5%) | 15 (5.1%) |
| 65 to 74 Years | 6 (5.9%) | 17 (15.0%) |
| 75 Years and over | 4 (11.4%) | 4 (6.0%) |
Disability Class: Ambulatory Difficulty
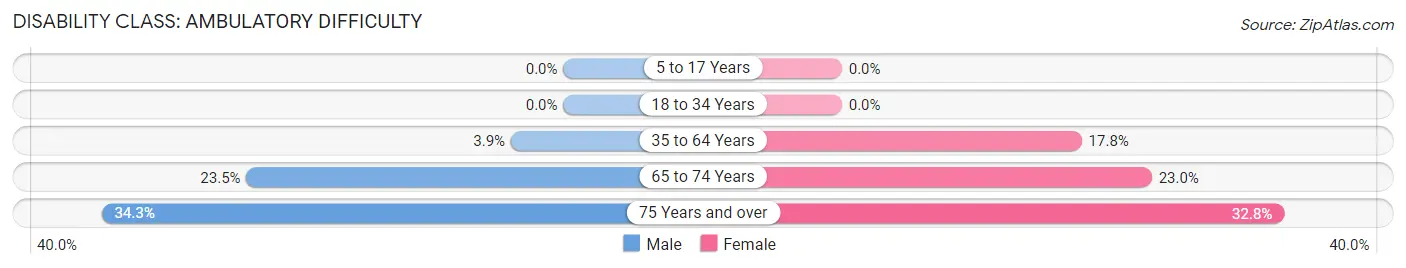
| Age Bracket | Male | Female |
| 5 to 17 Years | 0 (0.0%) | 0 (0.0%) |
| 18 to 34 Years | 0 (0.0%) | 0 (0.0%) |
| 35 to 64 Years | 10 (3.9%) | 52 (17.8%) |
| 65 to 74 Years | 24 (23.5%) | 26 (23.0%) |
| 75 Years and over | 12 (34.3%) | 22 (32.8%) |
Disability Class: Self-Care Difficulty
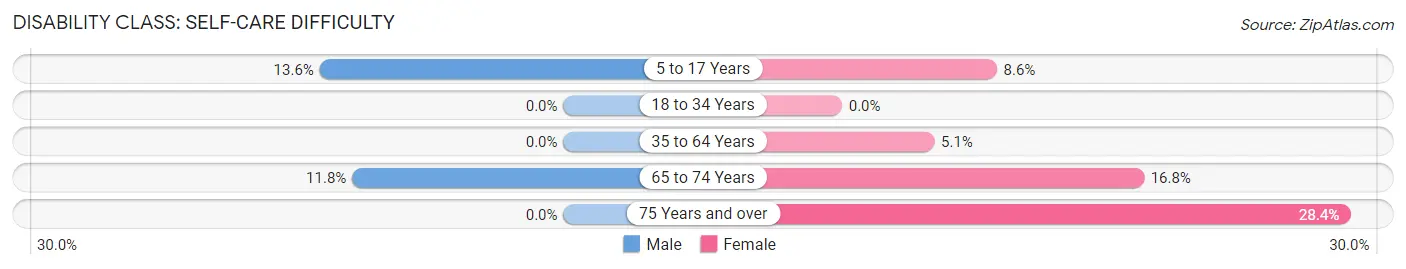
| Age Bracket | Male | Female |
| 5 to 17 Years | 19 (13.6%) | 10 (8.6%) |
| 18 to 34 Years | 0 (0.0%) | 0 (0.0%) |
| 35 to 64 Years | 0 (0.0%) | 15 (5.1%) |
| 65 to 74 Years | 12 (11.8%) | 19 (16.8%) |
| 75 Years and over | 0 (0.0%) | 19 (28.4%) |
Technology Access in North Lewisburg
Computing Device Access in North Lewisburg
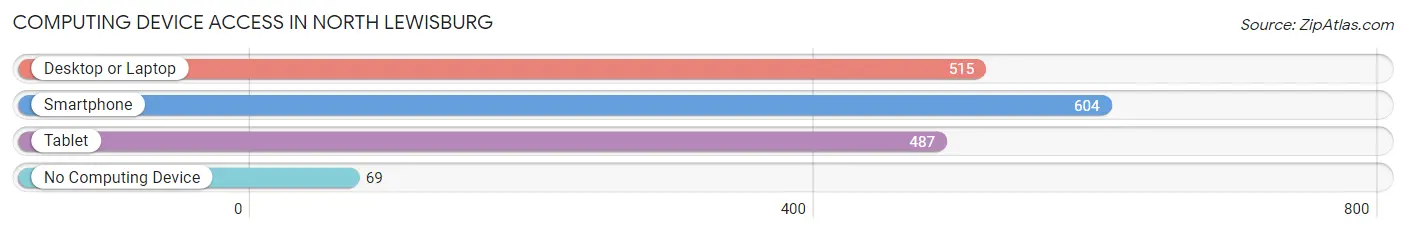
| Device Type | # Households | % Households |
| Desktop or Laptop | 515 | 69.1% |
| Smartphone | 604 | 81.1% |
| Tablet | 487 | 65.4% |
| No Computing Device | 69 | 9.3% |
| Total | 745 | 100.0% |
Internet Access in North Lewisburg
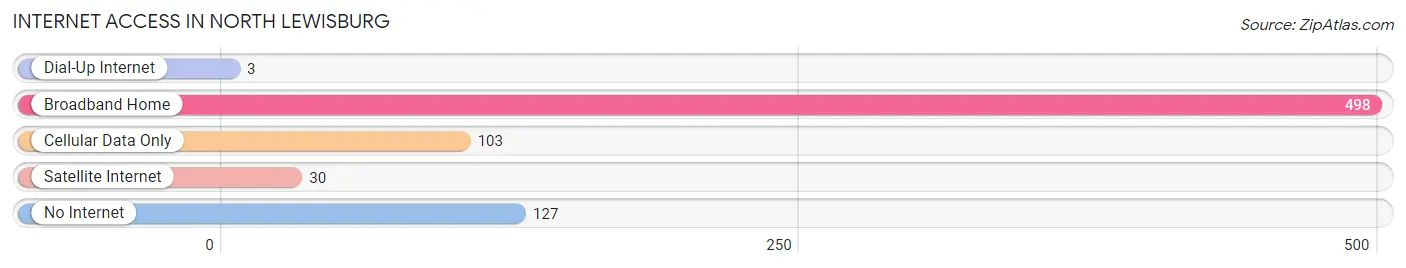
| Internet Type | # Households | % Households |
| Dial-Up Internet | 3 | 0.4% |
| Broadband Home | 498 | 66.8% |
| Cellular Data Only | 103 | 13.8% |
| Satellite Internet | 30 | 4.0% |
| No Internet | 127 | 17.1% |
| Total | 745 | 100.0% |
North Lewisburg Summary
Lewisburg is a small village located in Champaign County, Ohio, United States. The village is situated along the Mad River, approximately 10 miles south of Urbana and 25 miles northwest of Columbus. The population of Lewisburg was 1,717 at the 2010 census.
History
The area that is now Lewisburg was first settled in 1805 by a group of Quakers from North Carolina. The village was originally known as Quaker Settlement, but was later renamed Lewisburg in honor of William Lewis, a local landowner. The village was officially incorporated in 1837.
In the early 19th century, Lewisburg was a thriving agricultural community. The village was home to several mills, including a sawmill, a gristmill, and a woolen mill. The village also had a blacksmith shop, a tannery, and a general store.
Geography
Lewisburg is located at 40°14'25" North, 83°45'45" West (40.240278, -83.7625). According to the United States Census Bureau, the village has a total area of 1.2 square miles, all of it land.
Economy
Lewisburg is a small, rural community with a primarily agricultural economy. The village is home to several small businesses, including a grocery store, a hardware store, and a few restaurants. The village also has a post office and a bank.
Demographics
As of the 2010 census, there were 1,717 people, 690 households, and 463 families residing in Lewisburg. The population density was 1,427.5 people per square mile. The racial makeup of the village was 97.2% White, 0.6% African American, 0.2% Native American, 0.2% Asian, 0.1% Pacific Islander, 0.6% from other races, and 1.1% from two or more races. Hispanic or Latino of any race were 1.2% of the population.
The median age in Lewisburg was 40.2 years. 22.2% of residents were under the age of 18; 7.3% were between the ages of 18 and 24; 24.7% were from 25 to 44; 28.2% were from 45 to 64; and 17.6% were 65 years of age or older. The gender makeup of the village was 48.2% male and 51.8% female.
The median income for a household in Lewisburg was $45,938, and the median income for a family was $54,375. Males had a median income of $41,250 versus $27,500 for females. The per capita income for the village was $20,945. About 5.2% of families and 7.2% of the population were below the poverty line, including 8.3% of those under age 18 and 6.2% of those age 65 or over.
Common Questions
What is Per Capita Income in North Lewisburg?
Per Capita income in North Lewisburg is $29,659.
What is the Median Family Income in North Lewisburg?
Median Family Income in North Lewisburg is $60,197.
What is the Median Household income in North Lewisburg?
Median Household Income in North Lewisburg is $53,580.
What is Income or Wage Gap in North Lewisburg?
Income or Wage Gap in North Lewisburg is 36.1%.
Women in North Lewisburg earn 63.9 cents for every dollar earned by a man.
What is Inequality or Gini Index in North Lewisburg?
Inequality or Gini Index in North Lewisburg is 0.40.
What is the Total Population of North Lewisburg?
Total Population of North Lewisburg is 1,768.
What is the Total Male Population of North Lewisburg?
Total Male Population of North Lewisburg is 867.
What is the Total Female Population of North Lewisburg?
Total Female Population of North Lewisburg is 901.
What is the Ratio of Males per 100 Females in North Lewisburg?
There are 96.23 Males per 100 Females in North Lewisburg.
What is the Ratio of Females per 100 Males in North Lewisburg?
There are 103.92 Females per 100 Males in North Lewisburg.
What is the Median Population Age in North Lewisburg?
Median Population Age in North Lewisburg is 34.0 Years.
What is the Average Family Size in North Lewisburg
Average Family Size in North Lewisburg is 3.0 People.
What is the Average Household Size in North Lewisburg
Average Household Size in North Lewisburg is 2.4 People.
How Large is the Labor Force in North Lewisburg?
There are 867 People in the Labor Forcein in North Lewisburg.
What is the Percentage of People in the Labor Force in North Lewisburg?
64.3% of People are in the Labor Force in North Lewisburg.
What is the Unemployment Rate in North Lewisburg?
Unemployment Rate in North Lewisburg is 9.6%.