Rosemount, OH Map & Demographics
Rosemount Map
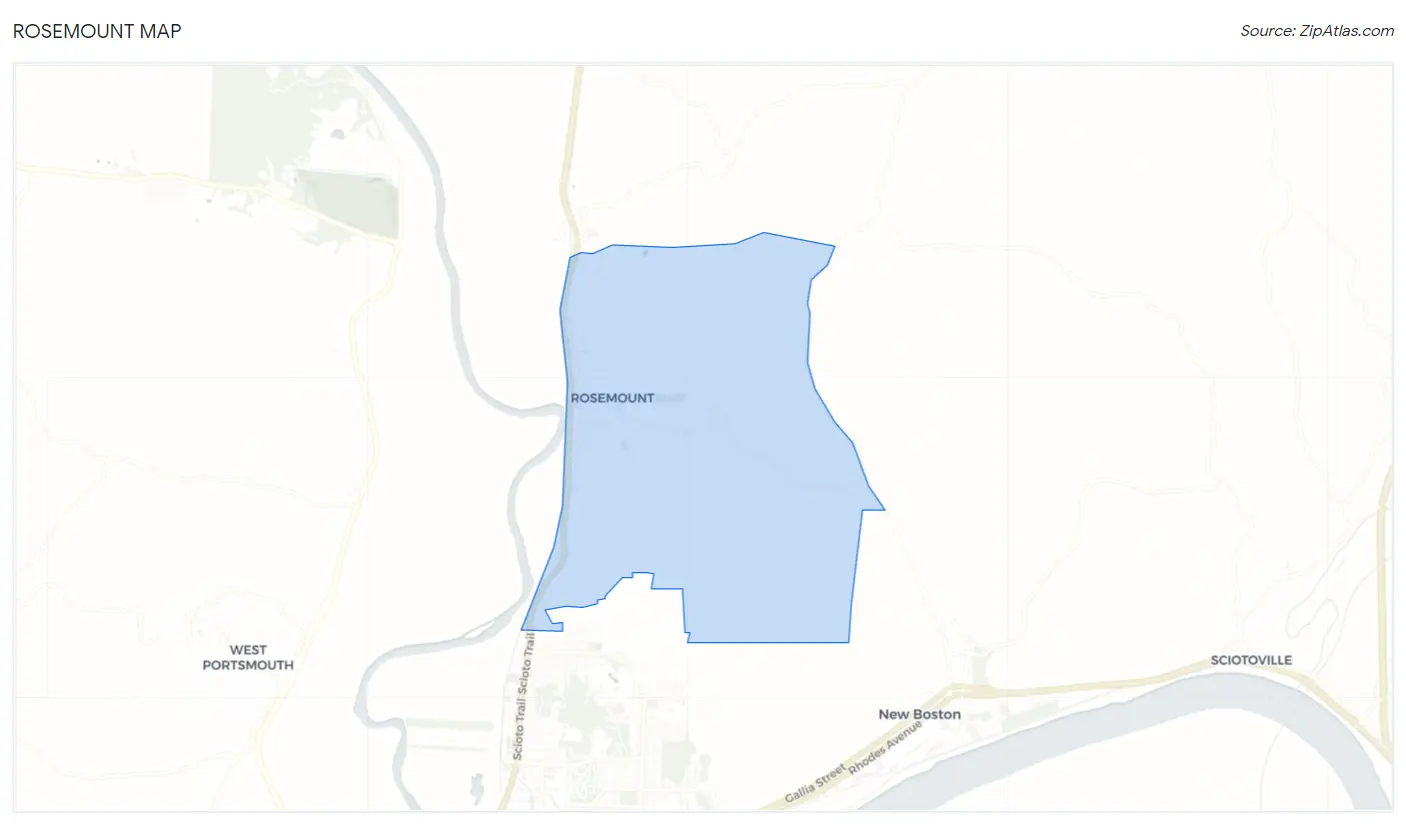
Rosemount Overview
$25,119
PER CAPITA INCOME
$45,820
AVG FAMILY INCOME
$45,117
AVG HOUSEHOLD INCOME
32.7%
WAGE / INCOME GAP [ % ]
67.3¢/ $1
WAGE / INCOME GAP [ $ ]
0.42
INEQUALITY / GINI INDEX
2,013
TOTAL POPULATION
864
MALE POPULATION
1,149
FEMALE POPULATION
75.20
MALES / 100 FEMALES
132.99
FEMALES / 100 MALES
49.4
MEDIAN AGE
2.7
AVG FAMILY SIZE
2.5
AVG HOUSEHOLD SIZE
1,022
LABOR FORCE [ PEOPLE ]
55.8%
PERCENT IN LABOR FORCE
10.9%
UNEMPLOYMENT RATE
Income in Rosemount
Income Overview in Rosemount
Per Capita Income in Rosemount is $25,119, while median incomes of families and households are $45,820 and $45,117 respectively.
| Characteristic | Number | Measure |
| Per Capita Income | 2,013 | $25,119 |
| Median Family Income | 641 | $45,820 |
| Mean Family Income | 641 | $63,206 |
| Median Household Income | 777 | $45,117 |
| Mean Household Income | 777 | $59,865 |
| Income Deficit | 641 | $0 |
| Wage / Income Gap (%) | 2,013 | 32.73% |
| Wage / Income Gap ($) | 2,013 | 67.27¢ per $1 |
| Gini / Inequality Index | 2,013 | 0.42 |
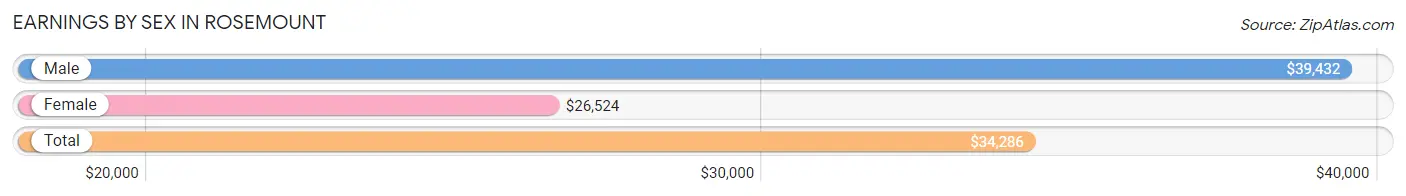
Earnings by Sex in Rosemount
Average Earnings in Rosemount are $34,286, $39,432 for men and $26,524 for women, a difference of 32.7%.
| Sex | Number | Average Earnings |
| Male | 458 (44.2%) | $39,432 |
| Female | 578 (55.8%) | $26,524 |
| Total | 1,036 (100.0%) | $34,286 |
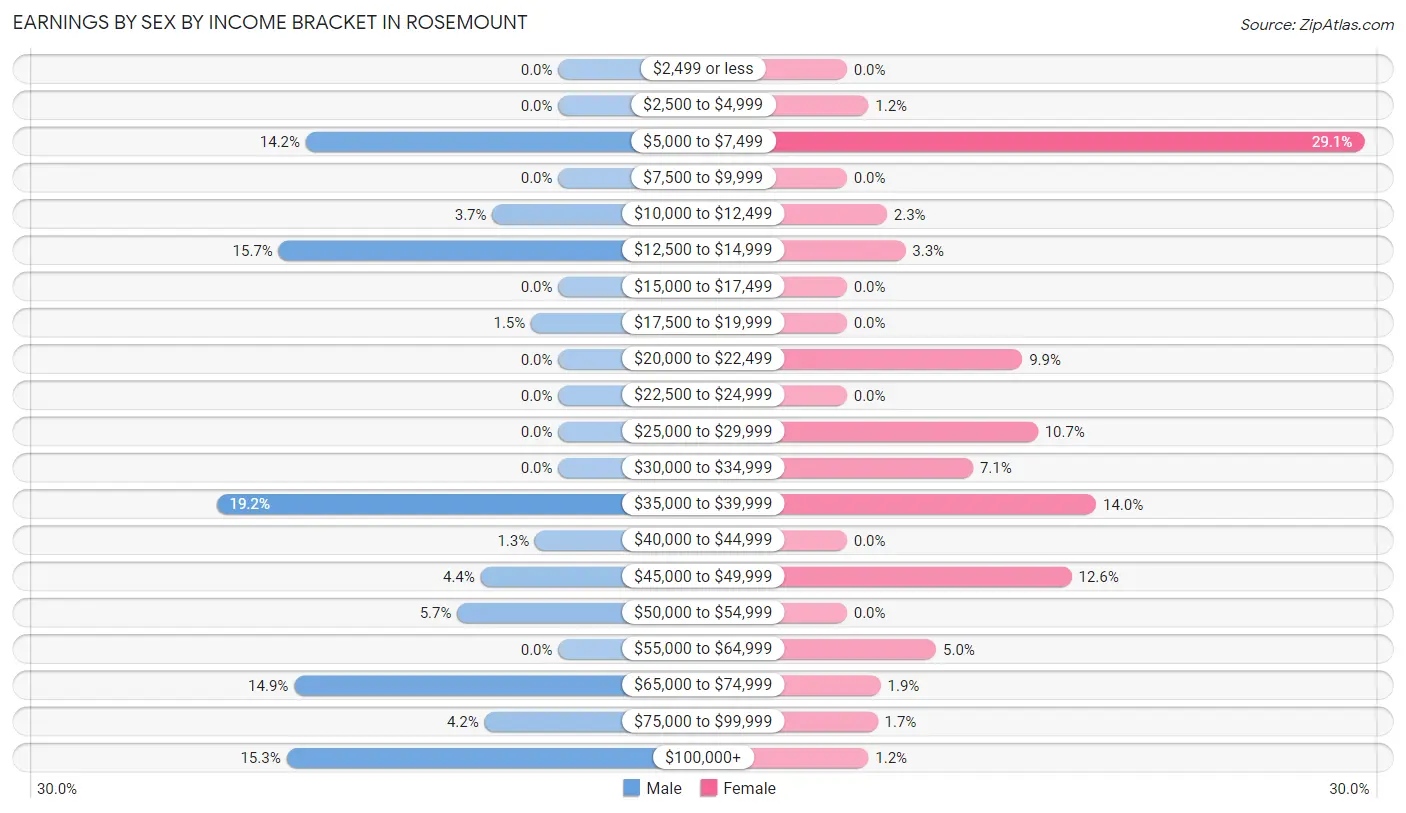
Earnings by Sex by Income Bracket in Rosemount
The most common earnings brackets in Rosemount are $35,000 to $39,999 for men (88 | 19.2%) and $5,000 to $7,499 for women (168 | 29.1%).
| Income | Male | Female |
| $2,499 or less | 0 (0.0%) | 0 (0.0%) |
| $2,500 to $4,999 | 0 (0.0%) | 7 (1.2%) |
| $5,000 to $7,499 | 65 (14.2%) | 168 (29.1%) |
| $7,500 to $9,999 | 0 (0.0%) | 0 (0.0%) |
| $10,000 to $12,499 | 17 (3.7%) | 13 (2.2%) |
| $12,500 to $14,999 | 72 (15.7%) | 19 (3.3%) |
| $15,000 to $17,499 | 0 (0.0%) | 0 (0.0%) |
| $17,500 to $19,999 | 7 (1.5%) | 0 (0.0%) |
| $20,000 to $22,499 | 0 (0.0%) | 57 (9.9%) |
| $22,500 to $24,999 | 0 (0.0%) | 0 (0.0%) |
| $25,000 to $29,999 | 0 (0.0%) | 62 (10.7%) |
| $30,000 to $34,999 | 0 (0.0%) | 41 (7.1%) |
| $35,000 to $39,999 | 88 (19.2%) | 81 (14.0%) |
| $40,000 to $44,999 | 6 (1.3%) | 0 (0.0%) |
| $45,000 to $49,999 | 20 (4.4%) | 73 (12.6%) |
| $50,000 to $54,999 | 26 (5.7%) | 0 (0.0%) |
| $55,000 to $64,999 | 0 (0.0%) | 29 (5.0%) |
| $65,000 to $74,999 | 68 (14.8%) | 11 (1.9%) |
| $75,000 to $99,999 | 19 (4.2%) | 10 (1.7%) |
| $100,000+ | 70 (15.3%) | 7 (1.2%) |
| Total | 458 (100.0%) | 578 (100.0%) |
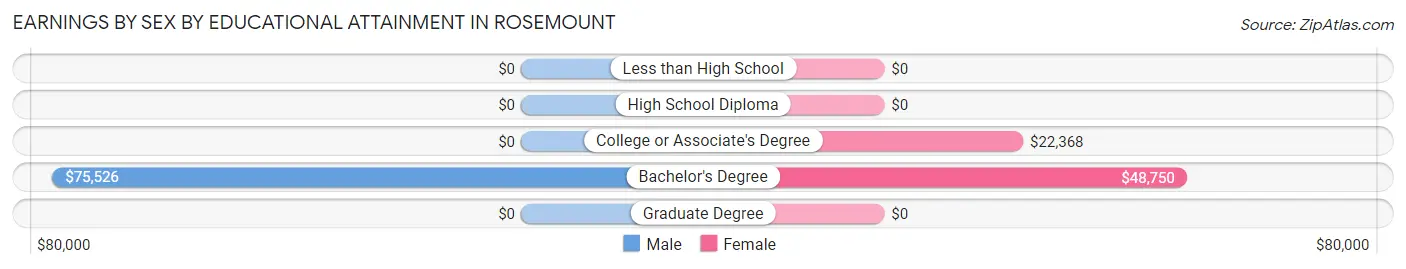
Earnings by Sex by Educational Attainment in Rosemount
Average earnings in Rosemount are $39,759 for men and $22,259 for women, a difference of 44.0%. Men with an educational attainment of bachelor's degree enjoy the highest average annual earnings of $75,526, while those with bachelor's degree education earn the least with $75,526. Women with an educational attainment of bachelor's degree earn the most with the average annual earnings of $48,750, while those with college or associate's degree education have the smallest earnings of $22,368.
| Educational Attainment | Male Income | Female Income |
| Less than High School | - | - |
| High School Diploma | - | - |
| College or Associate's Degree | - | - |
| Bachelor's Degree | $75,526 | $48,750 |
| Graduate Degree | - | - |
| Total | $39,759 | $22,259 |
Family Income in Rosemount
Family Income Brackets in Rosemount
According to the Rosemount family income data, there are 220 families falling into the $15,000 to $24,999 income range, which is the most common income bracket and makes up 34.3% of all families. Conversely, the less than $10,000 income bracket is the least frequent group with only 4 families (0.6%) belonging to this category.
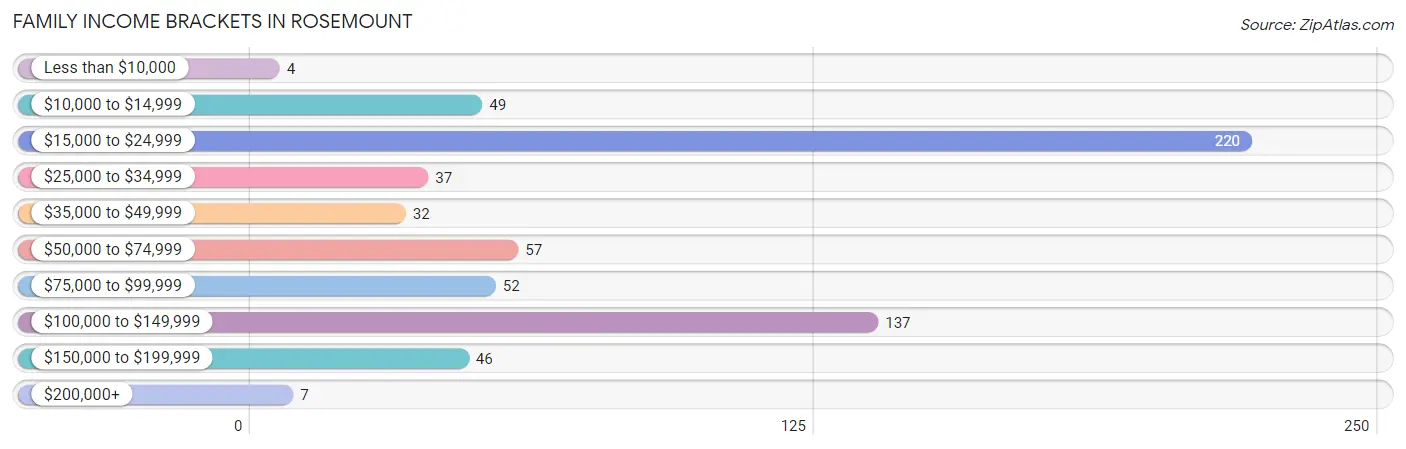
| Income Bracket | # Families | % Families |
| Less than $10,000 | 4 | 0.6% |
| $10,000 to $14,999 | 49 | 7.6% |
| $15,000 to $24,999 | 220 | 34.3% |
| $25,000 to $34,999 | 37 | 5.8% |
| $35,000 to $49,999 | 32 | 5.0% |
| $50,000 to $74,999 | 57 | 8.9% |
| $75,000 to $99,999 | 52 | 8.1% |
| $100,000 to $149,999 | 137 | 21.4% |
| $150,000 to $199,999 | 46 | 7.2% |
| $200,000+ | 7 | 1.1% |
Family Income by Famaliy Size in Rosemount
3-person families (198 | 30.9%) account for the highest median family income in Rosemount with $91,250 per family, while 3-person families (198 | 30.9%) have the highest median income of $30,417 per family member.
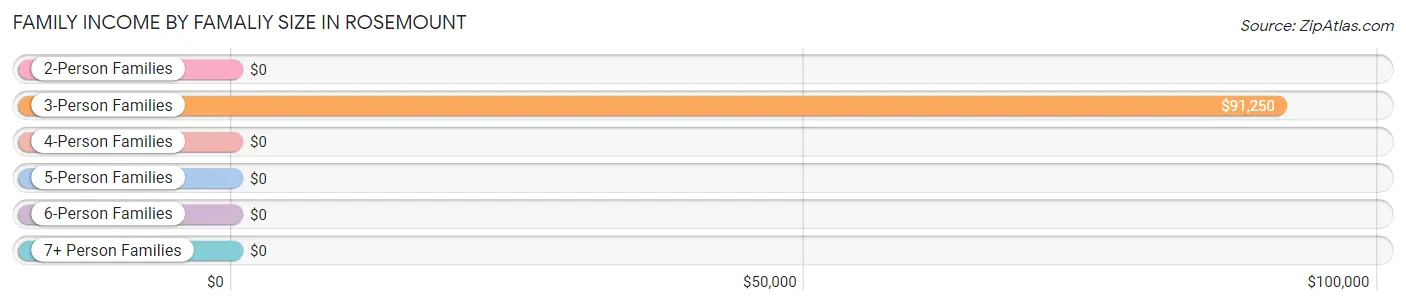
| Income Bracket | # Families | Median Income |
| 2-Person Families | 403 (62.9%) | $0 |
| 3-Person Families | 198 (30.9%) | $91,250 |
| 4-Person Families | 17 (2.6%) | $0 |
| 5-Person Families | 5 (0.8%) | $0 |
| 6-Person Families | 0 (0.0%) | $0 |
| 7+ Person Families | 18 (2.8%) | $0 |
| Total | 641 (100.0%) | $45,820 |
Family Income by Number of Earners in Rosemount
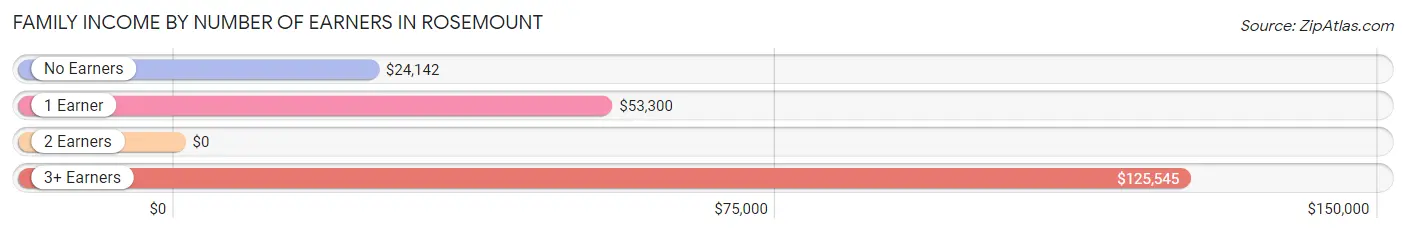
| Number of Earners | # Families | Median Income |
| No Earners | 163 (25.4%) | $24,142 |
| 1 Earner | 186 (29.0%) | $53,300 |
| 2 Earners | 206 (32.1%) | $0 |
| 3+ Earners | 86 (13.4%) | $125,545 |
| Total | 641 (100.0%) | $45,820 |
Household Income in Rosemount
Household Income Brackets in Rosemount
With 284 households falling in the category, the $15,000 to $24,999 income range is the most frequent in Rosemount, accounting for 36.5% of all households. In contrast, only 4 households (0.5%) fall into the less than $10,000 income bracket, making it the least populous group.
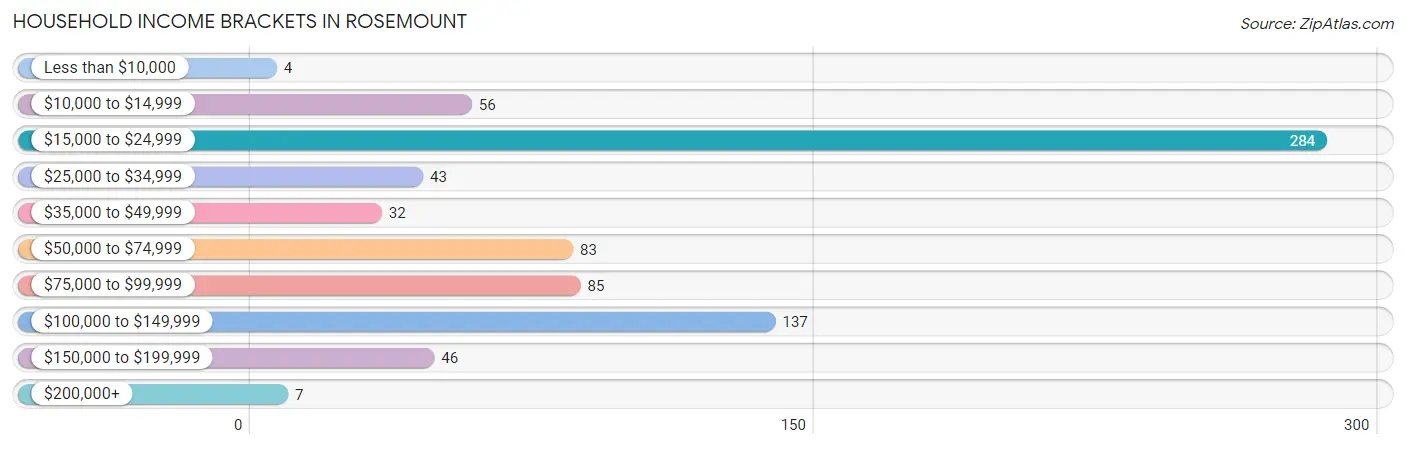
| Income Bracket | # Households | % Households |
| Less than $10,000 | 4 | 0.5% |
| $10,000 to $14,999 | 56 | 7.2% |
| $15,000 to $24,999 | 284 | 36.6% |
| $25,000 to $34,999 | 43 | 5.5% |
| $35,000 to $49,999 | 32 | 4.1% |
| $50,000 to $74,999 | 83 | 10.7% |
| $75,000 to $99,999 | 85 | 10.9% |
| $100,000 to $149,999 | 137 | 17.6% |
| $150,000 to $199,999 | 46 | 5.9% |
| $200,000+ | 7 | 0.9% |
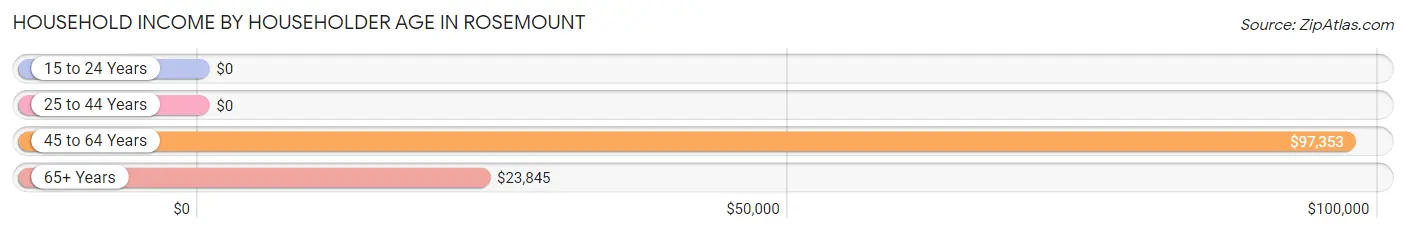
Household Income by Householder Age in Rosemount
The median household income in Rosemount is $45,117, with the highest median household income of $97,353 found in the 45 to 64 years age bracket for the primary householder. A total of 278 households (35.8%) fall into this category. Meanwhile, the 15 to 24 years age bracket for the primary householder has the lowest median household income of $0, with 7 households (0.9%) in this group.
| Income Bracket | # Households | Median Income |
| 15 to 24 Years | 7 (0.9%) | $0 |
| 25 to 44 Years | 229 (29.5%) | $0 |
| 45 to 64 Years | 278 (35.8%) | $97,353 |
| 65+ Years | 263 (33.9%) | $23,845 |
| Total | 777 (100.0%) | $45,117 |
Poverty in Rosemount
Income Below Poverty by Sex and Age in Rosemount
With 2.3% poverty level for males and 19.9% for females among the residents of Rosemount, 45 to 54 year old males and 12 to 14 year old females are the most vulnerable to poverty, with 14 males (5.6%) and 5 females (100.0%) in their respective age groups living below the poverty level.
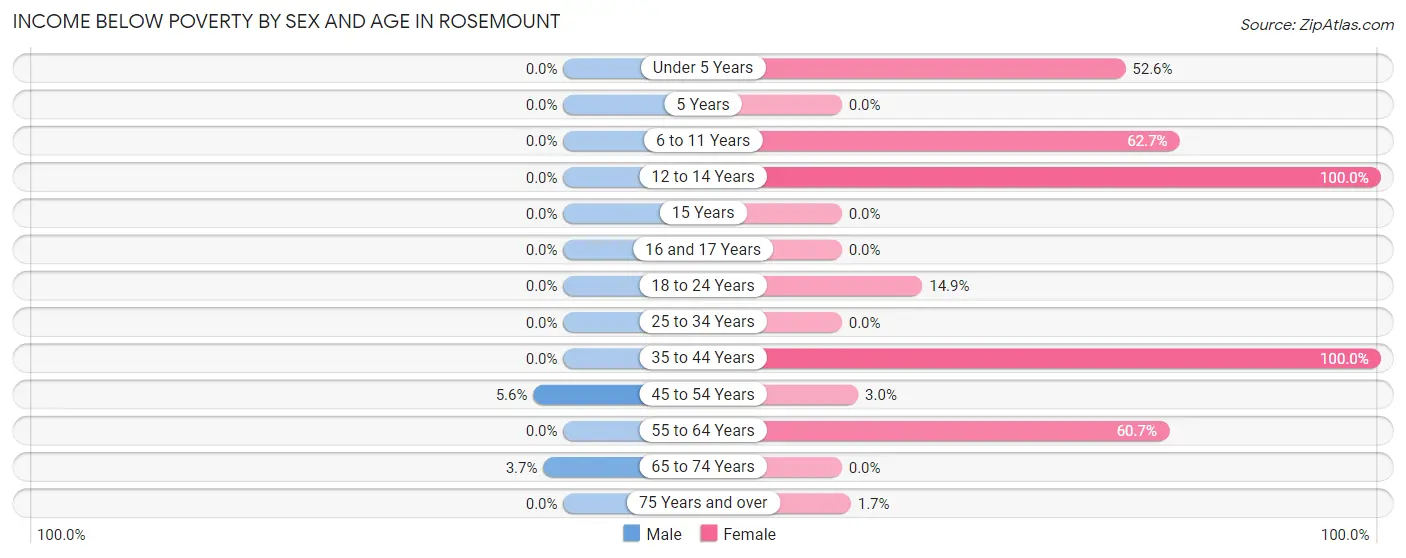
| Age Bracket | Male | Female |
| Under 5 Years | 0 (0.0%) | 20 (52.6%) |
| 5 Years | 0 (0.0%) | 0 (0.0%) |
| 6 to 11 Years | 0 (0.0%) | 47 (62.7%) |
| 12 to 14 Years | 0 (0.0%) | 5 (100.0%) |
| 15 Years | 0 (0.0%) | 0 (0.0%) |
| 16 and 17 Years | 0 (0.0%) | 0 (0.0%) |
| 18 to 24 Years | 0 (0.0%) | 13 (14.9%) |
| 25 to 34 Years | 0 (0.0%) | 0 (0.0%) |
| 35 to 44 Years | 0 (0.0%) | 49 (100.0%) |
| 45 to 54 Years | 14 (5.6%) | 7 (3.0%) |
| 55 to 64 Years | 0 (0.0%) | 71 (60.7%) |
| 65 to 74 Years | 5 (3.7%) | 0 (0.0%) |
| 75 Years and over | 0 (0.0%) | 4 (1.7%) |
| Total | 19 (2.3%) | 216 (19.9%) |
Income Above Poverty by Sex and Age in Rosemount
According to the poverty statistics in Rosemount, males aged under 5 years and females aged 25 to 34 years are the age groups that are most secure financially, with 100.0% of males and 100.0% of females in these age groups living above the poverty line.
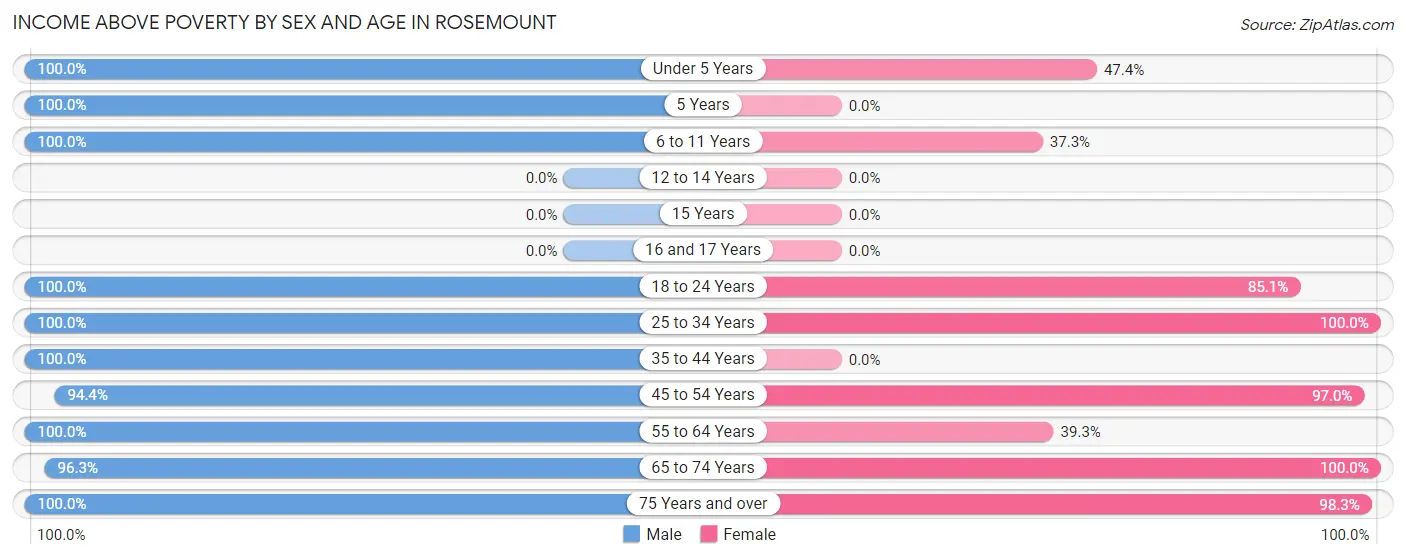
| Age Bracket | Male | Female |
| Under 5 Years | 30 (100.0%) | 18 (47.4%) |
| 5 Years | 16 (100.0%) | 0 (0.0%) |
| 6 to 11 Years | 17 (100.0%) | 28 (37.3%) |
| 12 to 14 Years | 0 (0.0%) | 0 (0.0%) |
| 15 Years | 0 (0.0%) | 0 (0.0%) |
| 16 and 17 Years | 0 (0.0%) | 0 (0.0%) |
| 18 to 24 Years | 29 (100.0%) | 74 (85.1%) |
| 25 to 34 Years | 212 (100.0%) | 233 (100.0%) |
| 35 to 44 Years | 42 (100.0%) | 0 (0.0%) |
| 45 to 54 Years | 237 (94.4%) | 223 (97.0%) |
| 55 to 64 Years | 48 (100.0%) | 46 (39.3%) |
| 65 to 74 Years | 129 (96.3%) | 14 (100.0%) |
| 75 Years and over | 54 (100.0%) | 235 (98.3%) |
| Total | 814 (97.7%) | 871 (80.1%) |
Income Below Poverty Among Married-Couple Families in Rosemount
The poverty statistics for married-couple families in Rosemount show that 1.3% or 5 of the total 396 families live below the poverty line. Families with 1 or 2 children have the highest poverty rate of 11.1%, comprising of 5 families. On the other hand, families with no children have the lowest poverty rate of 0.0%, which includes 0 families.
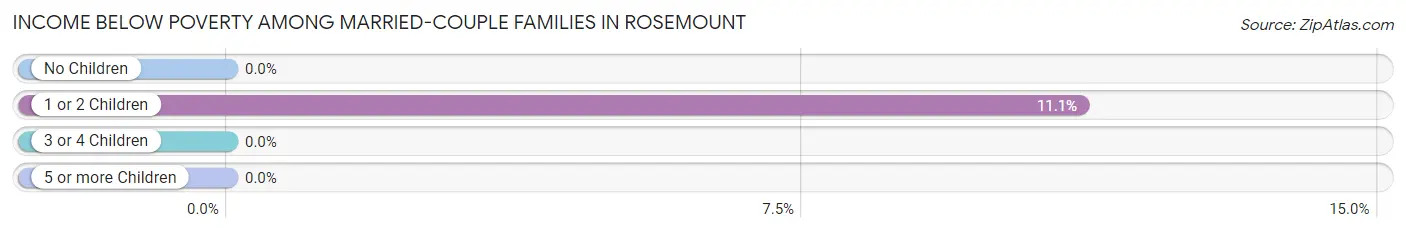
| Children | Above Poverty | Below Poverty |
| No Children | 333 (100.0%) | 0 (0.0%) |
| 1 or 2 Children | 40 (88.9%) | 5 (11.1%) |
| 3 or 4 Children | 0 (0.0%) | 0 (0.0%) |
| 5 or more Children | 18 (100.0%) | 0 (0.0%) |
| Total | 391 (98.7%) | 5 (1.3%) |
Income Below Poverty Among Single-Parent Households in Rosemount
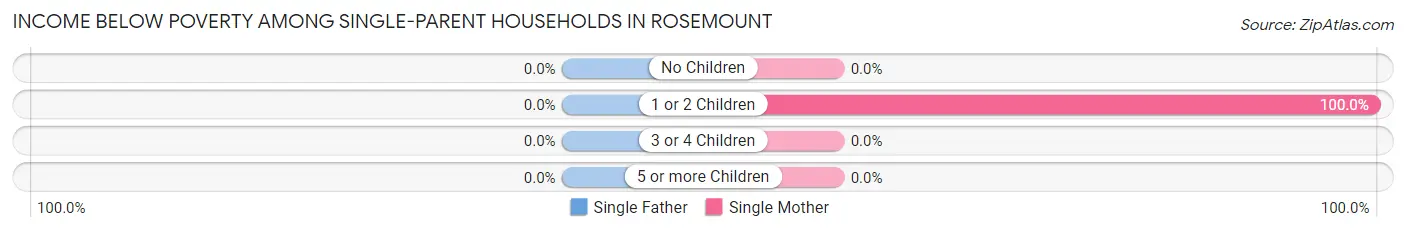
| Children | Single Father | Single Mother |
| No Children | 0 (0.0%) | 0 (0.0%) |
| 1 or 2 Children | 0 (0.0%) | 53 (100.0%) |
| 3 or 4 Children | 0 (0.0%) | 0 (0.0%) |
| 5 or more Children | 0 (0.0%) | 0 (0.0%) |
| Total | 0 (0.0%) | 53 (22.9%) |
Income Below Poverty Among Married-Couple vs Single-Parent Households in Rosemount
The poverty data for Rosemount shows that 5 of the married-couple family households (1.3%) and 53 of the single-parent households (21.6%) are living below the poverty level. Within the married-couple family households, those with 1 or 2 children have the highest poverty rate, with 5 households (11.1%) falling below the poverty line. Among the single-parent households, those with 1 or 2 children have the highest poverty rate, with 53 household (100.0%) living below poverty.
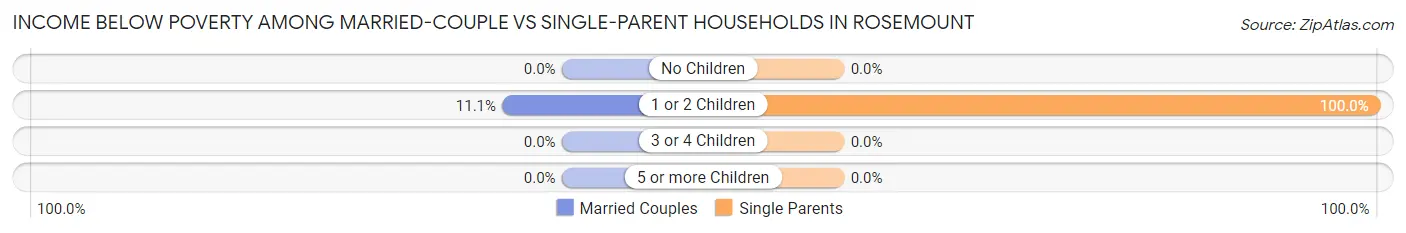
| Children | Married-Couple Families | Single-Parent Households |
| No Children | 0 (0.0%) | 0 (0.0%) |
| 1 or 2 Children | 5 (11.1%) | 53 (100.0%) |
| 3 or 4 Children | 0 (0.0%) | 0 (0.0%) |
| 5 or more Children | 0 (0.0%) | 0 (0.0%) |
| Total | 5 (1.3%) | 53 (21.6%) |
Race in Rosemount
The most populous races in Rosemount are White / Caucasian (1,953 | 97.0%), Two or more Races (56 | 2.8%), and Black / African American (4 | 0.2%).
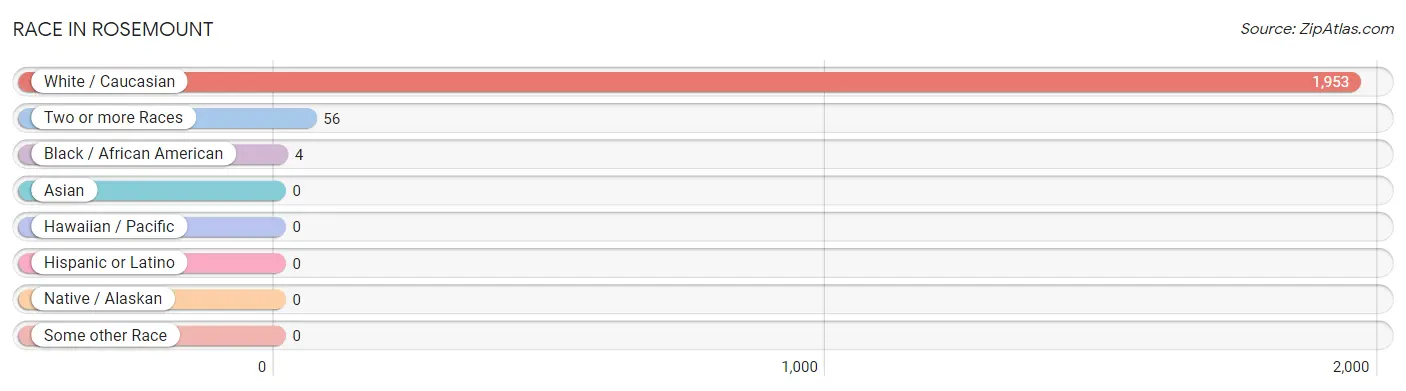
| Race | # Population | % Population |
| Asian | 0 | 0.0% |
| Black / African American | 4 | 0.2% |
| Hawaiian / Pacific | 0 | 0.0% |
| Hispanic or Latino | 0 | 0.0% |
| Native / Alaskan | 0 | 0.0% |
| White / Caucasian | 1,953 | 97.0% |
| Two or more Races | 56 | 2.8% |
| Some other Race | 0 | 0.0% |
| Total | 2,013 | 100.0% |
Ancestry in Rosemount
The most populous ancestries reported in Rosemount are Irish (477 | 23.7%), English (425 | 21.1%), German (381 | 18.9%), French (131 | 6.5%), and American (102 | 5.1%), together accounting for 75.3% of all Rosemount residents.
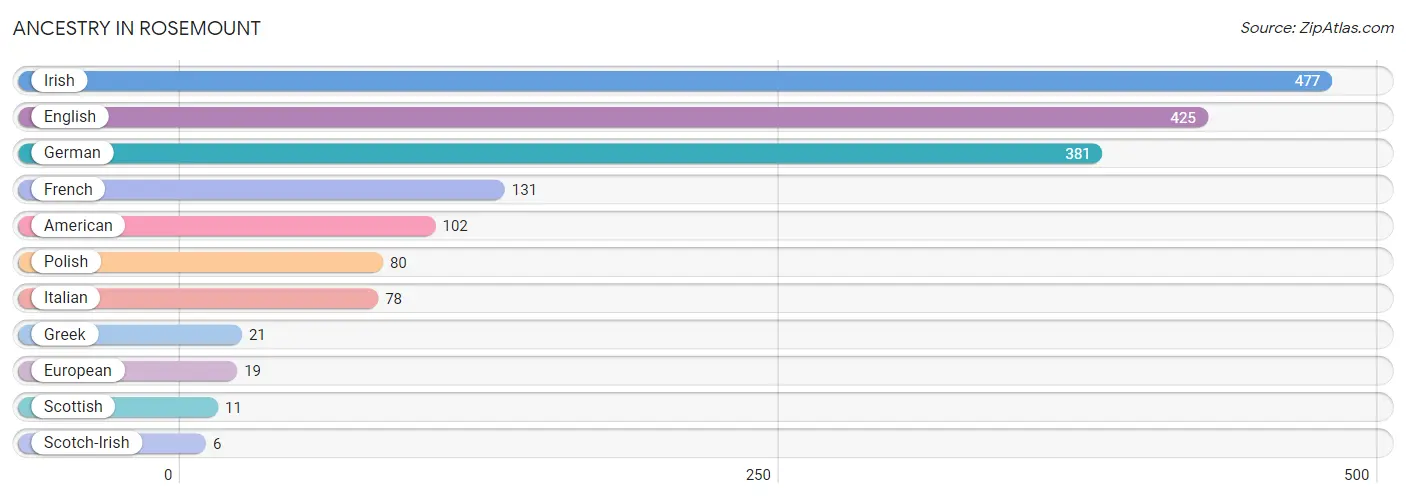
| Ancestry | # Population | % Population |
| American | 102 | 5.1% |
| English | 425 | 21.1% |
| European | 19 | 0.9% |
| French | 131 | 6.5% |
| German | 381 | 18.9% |
| Greek | 21 | 1.0% |
| Irish | 477 | 23.7% |
| Italian | 78 | 3.9% |
| Polish | 80 | 4.0% |
| Scotch-Irish | 6 | 0.3% |
| Scottish | 11 | 0.5% | View All 11 Rows |
Immigrants in Rosemount

| Immigration Origin | # Population | % Population | View All 0 Rows |
Sex and Age in Rosemount
Sex and Age in Rosemount
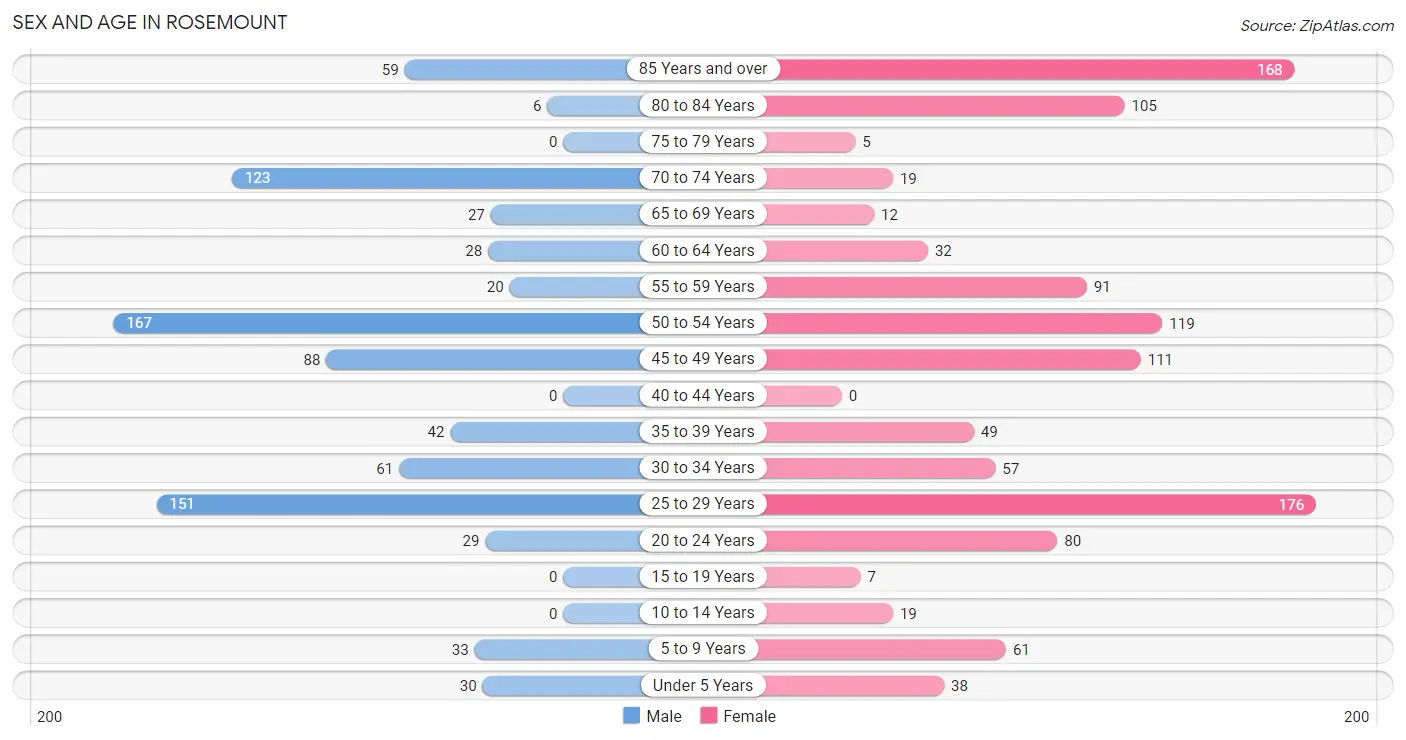
The most populous age groups in Rosemount are 50 to 54 Years (167 | 19.3%) for men and 25 to 29 Years (176 | 15.3%) for women.
| Age Bracket | Male | Female |
| Under 5 Years | 30 (3.5%) | 38 (3.3%) |
| 5 to 9 Years | 33 (3.8%) | 61 (5.3%) |
| 10 to 14 Years | 0 (0.0%) | 19 (1.7%) |
| 15 to 19 Years | 0 (0.0%) | 7 (0.6%) |
| 20 to 24 Years | 29 (3.4%) | 80 (7.0%) |
| 25 to 29 Years | 151 (17.5%) | 176 (15.3%) |
| 30 to 34 Years | 61 (7.1%) | 57 (5.0%) |
| 35 to 39 Years | 42 (4.9%) | 49 (4.3%) |
| 40 to 44 Years | 0 (0.0%) | 0 (0.0%) |
| 45 to 49 Years | 88 (10.2%) | 111 (9.7%) |
| 50 to 54 Years | 167 (19.3%) | 119 (10.4%) |
| 55 to 59 Years | 20 (2.3%) | 91 (7.9%) |
| 60 to 64 Years | 28 (3.2%) | 32 (2.8%) |
| 65 to 69 Years | 27 (3.1%) | 12 (1.0%) |
| 70 to 74 Years | 123 (14.2%) | 19 (1.7%) |
| 75 to 79 Years | 0 (0.0%) | 5 (0.4%) |
| 80 to 84 Years | 6 (0.7%) | 105 (9.1%) |
| 85 Years and over | 59 (6.8%) | 168 (14.6%) |
| Total | 864 (100.0%) | 1,149 (100.0%) |
Families and Households in Rosemount
Median Family Size in Rosemount
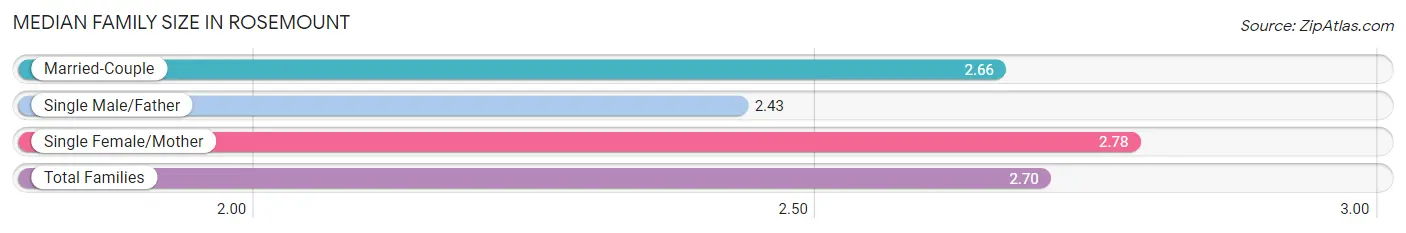
The median family size in Rosemount is 2.70 persons per family, with single female/mother families (231 | 36.0%) accounting for the largest median family size of 2.78 persons per family. On the other hand, single male/father families (14 | 2.2%) represent the smallest median family size with 2.43 persons per family.
| Family Type | # Families | Family Size |
| Married-Couple | 396 (61.8%) | 2.66 |
| Single Male/Father | 14 (2.2%) | 2.43 |
| Single Female/Mother | 231 (36.0%) | 2.78 |
| Total Families | 641 (100.0%) | 2.70 |
Median Household Size in Rosemount
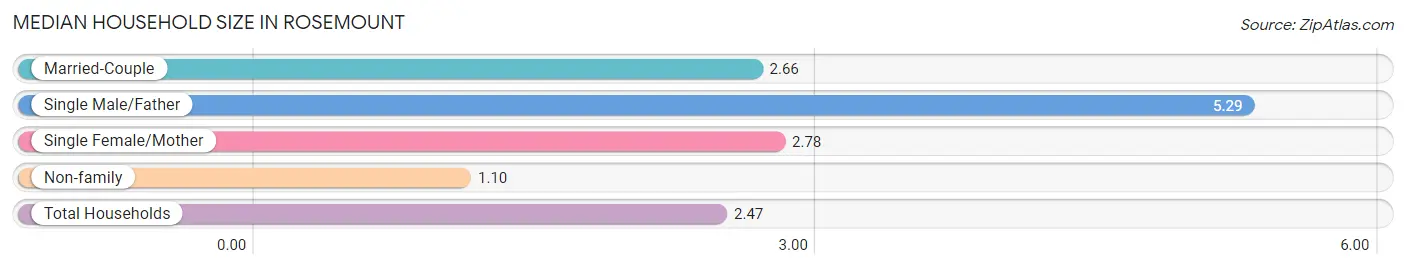
The median household size in Rosemount is 2.47 persons per household, with single male/father households (14 | 1.8%) accounting for the largest median household size of 5.29 persons per household. non-family households (136 | 17.5%) represent the smallest median household size with 1.10 persons per household.
| Household Type | # Households | Household Size |
| Married-Couple | 396 (51.0%) | 2.66 |
| Single Male/Father | 14 (1.8%) | 5.29 |
| Single Female/Mother | 231 (29.7%) | 2.78 |
| Non-family | 136 (17.5%) | 1.10 |
| Total Households | 777 (100.0%) | 2.47 |
Household Size by Marriage Status in Rosemount
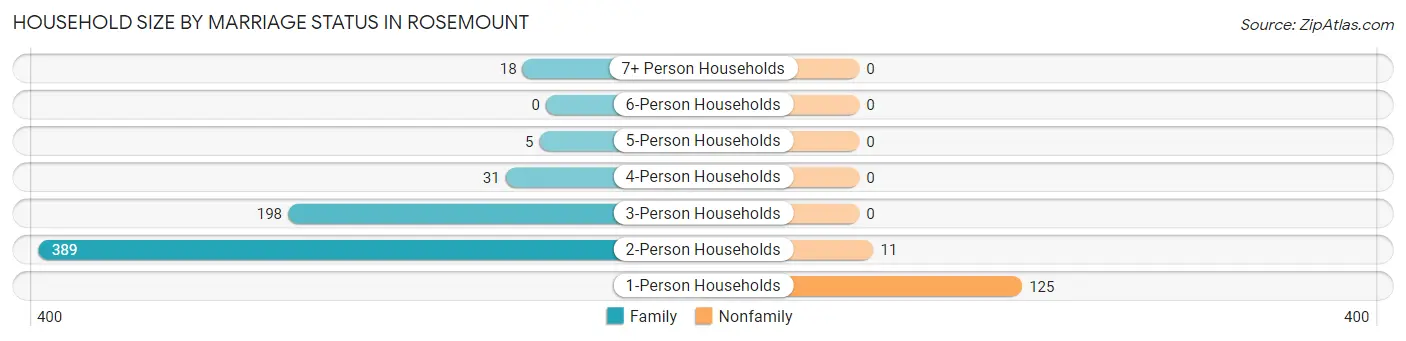
Out of a total of 777 households in Rosemount, 641 (82.5%) are family households, while 136 (17.5%) are nonfamily households. The most numerous type of family households are 2-person households, comprising 389, and the most common type of nonfamily households are 1-person households, comprising 125.
| Household Size | Family Households | Nonfamily Households |
| 1-Person Households | - | 125 (16.1%) |
| 2-Person Households | 389 (50.1%) | 11 (1.4%) |
| 3-Person Households | 198 (25.5%) | 0 (0.0%) |
| 4-Person Households | 31 (4.0%) | 0 (0.0%) |
| 5-Person Households | 5 (0.6%) | 0 (0.0%) |
| 6-Person Households | 0 (0.0%) | 0 (0.0%) |
| 7+ Person Households | 18 (2.3%) | 0 (0.0%) |
| Total | 641 (82.5%) | 136 (17.5%) |
Female Fertility in Rosemount
Fertility by Age in Rosemount
Average fertility rate in Rosemount is 13.0 births per 1,000 women. Women in the age bracket of 35 to 50 years have the highest fertility rate with 32.0 births per 1,000 women. Women in the age bracket of 35 to 50 years acount for 100.0% of all women with births.
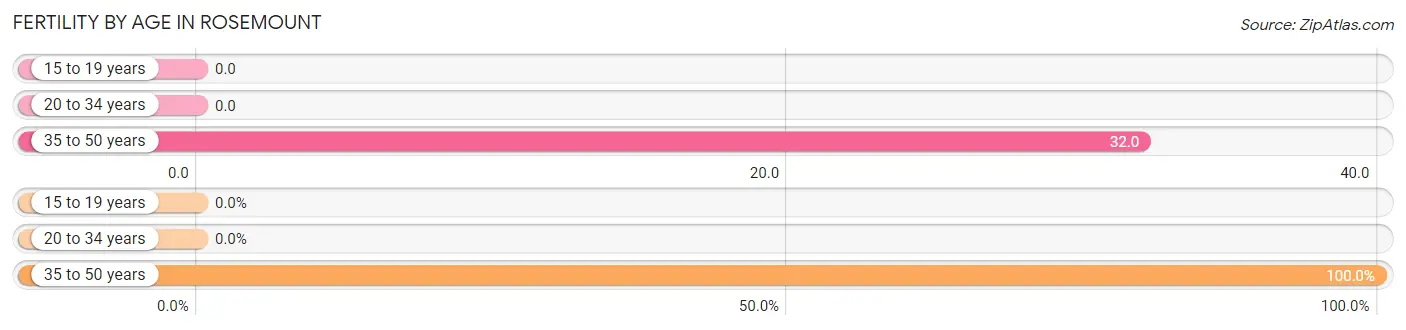
| Age Bracket | Women with Births | Births / 1,000 Women |
| 15 to 19 years | 0 (0.0%) | 0.0 |
| 20 to 34 years | 0 (0.0%) | 0.0 |
| 35 to 50 years | 7 (100.0%) | 32.0 |
| Total | 7 (100.0%) | 13.0 |
Fertility by Age by Marriage Status in Rosemount
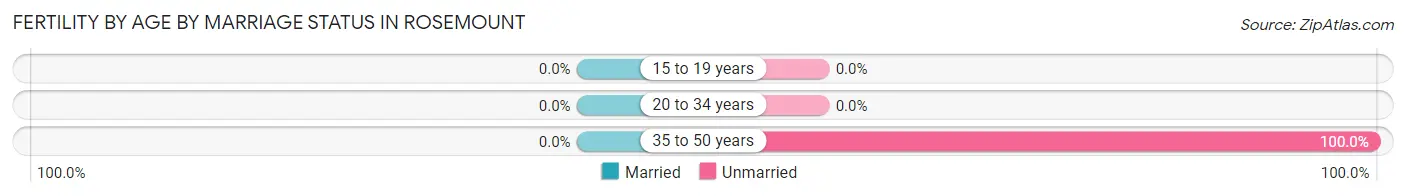
| Age Bracket | Married | Unmarried |
| 15 to 19 years | 0 (0.0%) | 0 (0.0%) |
| 20 to 34 years | 0 (0.0%) | 0 (0.0%) |
| 35 to 50 years | 0 (0.0%) | 7 (100.0%) |
| Total | 0 (0.0%) | 7 (100.0%) |
Fertility by Education in Rosemount
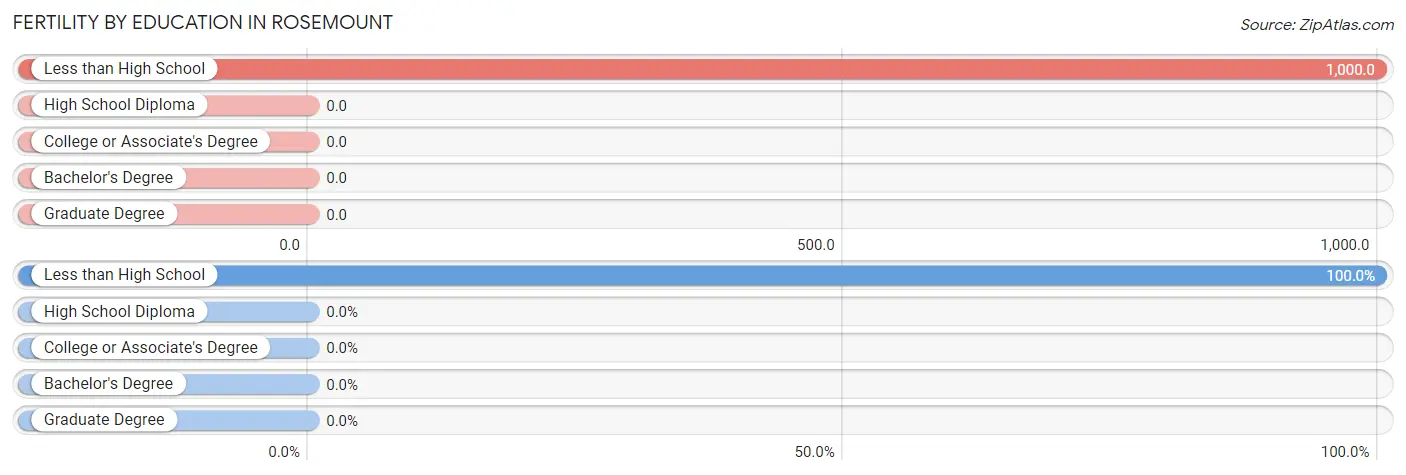
| Educational Attainment | Women with Births | Births / 1,000 Women |
| Less than High School | 7 (100.0%) | 1,000.0 |
| High School Diploma | 0 (0.0%) | 0.0 |
| College or Associate's Degree | 0 (0.0%) | 0.0 |
| Bachelor's Degree | 0 (0.0%) | 0.0 |
| Graduate Degree | 0 (0.0%) | 0.0 |
| Total | 7 (100.0%) | 13.0 |
Fertility by Education by Marriage Status in Rosemount
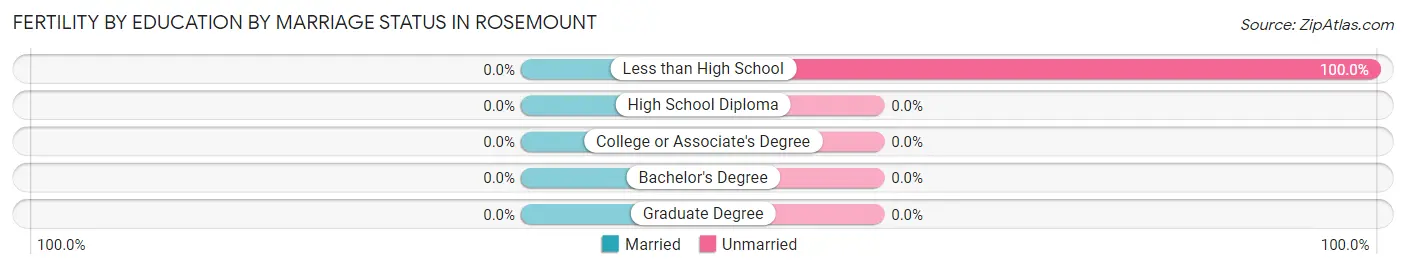
| Educational Attainment | Married | Unmarried |
| Less than High School | 0 (0.0%) | 7 (100.0%) |
| High School Diploma | 0 (0.0%) | 0 (0.0%) |
| College or Associate's Degree | 0 (0.0%) | 0 (0.0%) |
| Bachelor's Degree | 0 (0.0%) | 0 (0.0%) |
| Graduate Degree | 0 (0.0%) | 0 (0.0%) |
| Total | 0 (0.0%) | 7 (100.0%) |
Employment Characteristics in Rosemount
Employment by Class of Employer in Rosemount
Among the 912 employed individuals in Rosemount, private company employees (626 | 68.6%), not-for-profit organizations (107 | 11.7%), and self-employed (not incorporated) (79 | 8.7%) make up the most common classes of employment.
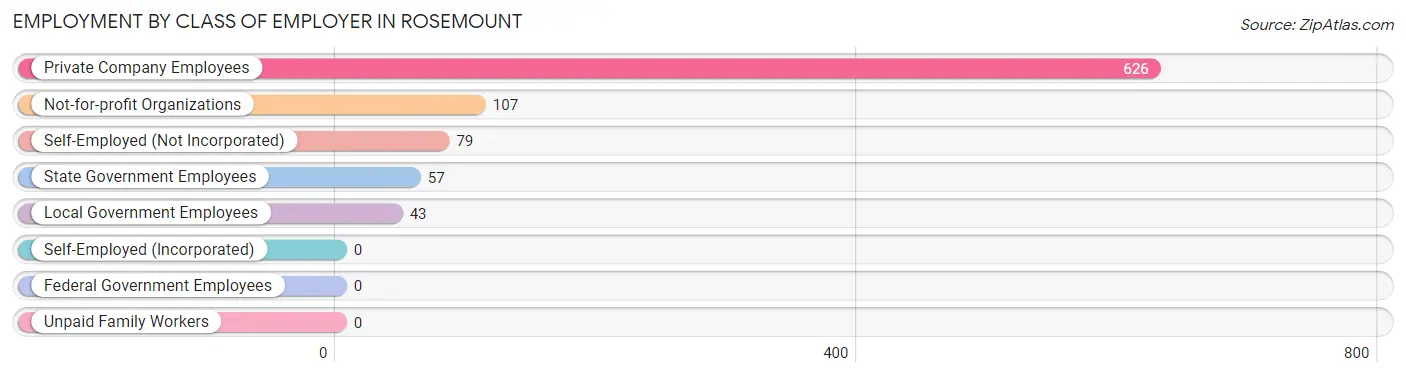
| Employer Class | # Employees | % Employees |
| Private Company Employees | 626 | 68.6% |
| Self-Employed (Incorporated) | 0 | 0.0% |
| Self-Employed (Not Incorporated) | 79 | 8.7% |
| Not-for-profit Organizations | 107 | 11.7% |
| Local Government Employees | 43 | 4.7% |
| State Government Employees | 57 | 6.2% |
| Federal Government Employees | 0 | 0.0% |
| Unpaid Family Workers | 0 | 0.0% |
| Total | 912 | 100.0% |
Employment Status by Age in Rosemount
According to the labor force statistics for Rosemount, out of the total population over 16 years of age (1,832), 55.8% or 1,022 individuals are in the labor force, with 10.9% or 111 of them unemployed. The age group with the highest labor force participation rate is 16 to 19 years, with 100.0% or 7 individuals in the labor force. Within the labor force, the 30 to 34 years age range has the highest percentage of unemployed individuals, with 25.9% or 21 of them being unemployed.
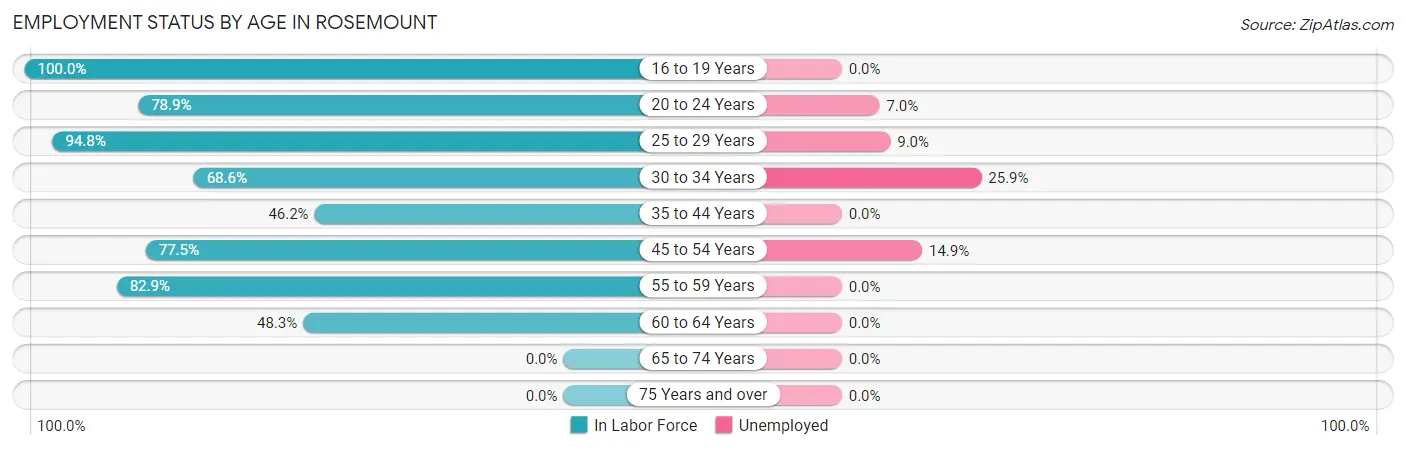
| Age Bracket | In Labor Force | Unemployed |
| 16 to 19 Years | 7 (100.0%) | 0 (0.0%) |
| 20 to 24 Years | 86 (78.9%) | 6 (7.0%) |
| 25 to 29 Years | 310 (94.8%) | 28 (9.0%) |
| 30 to 34 Years | 81 (68.6%) | 21 (25.9%) |
| 35 to 44 Years | 42 (46.2%) | 0 (0.0%) |
| 45 to 54 Years | 376 (77.5%) | 56 (14.9%) |
| 55 to 59 Years | 92 (82.9%) | 0 (0.0%) |
| 60 to 64 Years | 29 (48.3%) | 0 (0.0%) |
| 65 to 74 Years | 0 (0.0%) | 0 (0.0%) |
| 75 Years and over | 0 (0.0%) | 0 (0.0%) |
| Total | 1,022 (55.8%) | 111 (10.9%) |
Employment Status by Educational Attainment in Rosemount
According to labor force statistics for Rosemount, 78.0% of individuals (930) out of the total population between 25 and 64 years of age (1,192) are in the labor force, with 11.3% or 105 of them being unemployed. The group with the highest labor force participation rate are those with the educational attainment of bachelor's degree or higher, with 84.0% or 273 individuals in the labor force. Within the labor force, individuals with less than high school education have the highest percentage of unemployment, with 100.0% or 28 of them being unemployed.
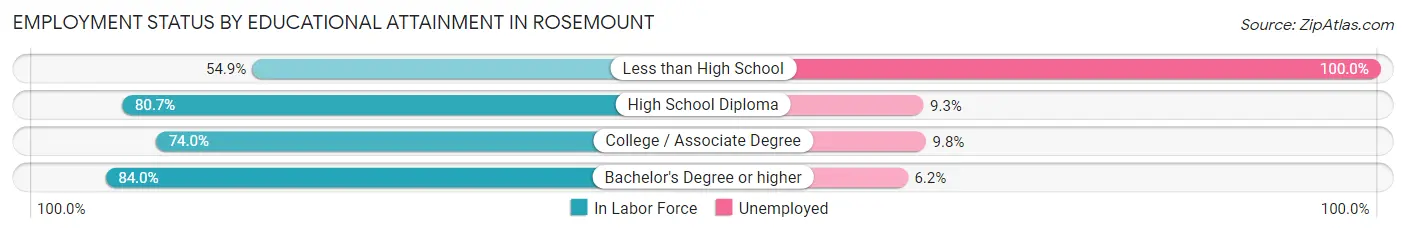
| Educational Attainment | In Labor Force | Unemployed |
| Less than High School | 28 (54.9%) | 51 (100.0%) |
| High School Diploma | 302 (80.7%) | 35 (9.3%) |
| College / Associate Degree | 327 (74.0%) | 43 (9.8%) |
| Bachelor's Degree or higher | 273 (84.0%) | 20 (6.2%) |
| Total | 930 (78.0%) | 135 (11.3%) |
Employment Occupations by Sex in Rosemount
Management, Business, Science and Arts Occupations
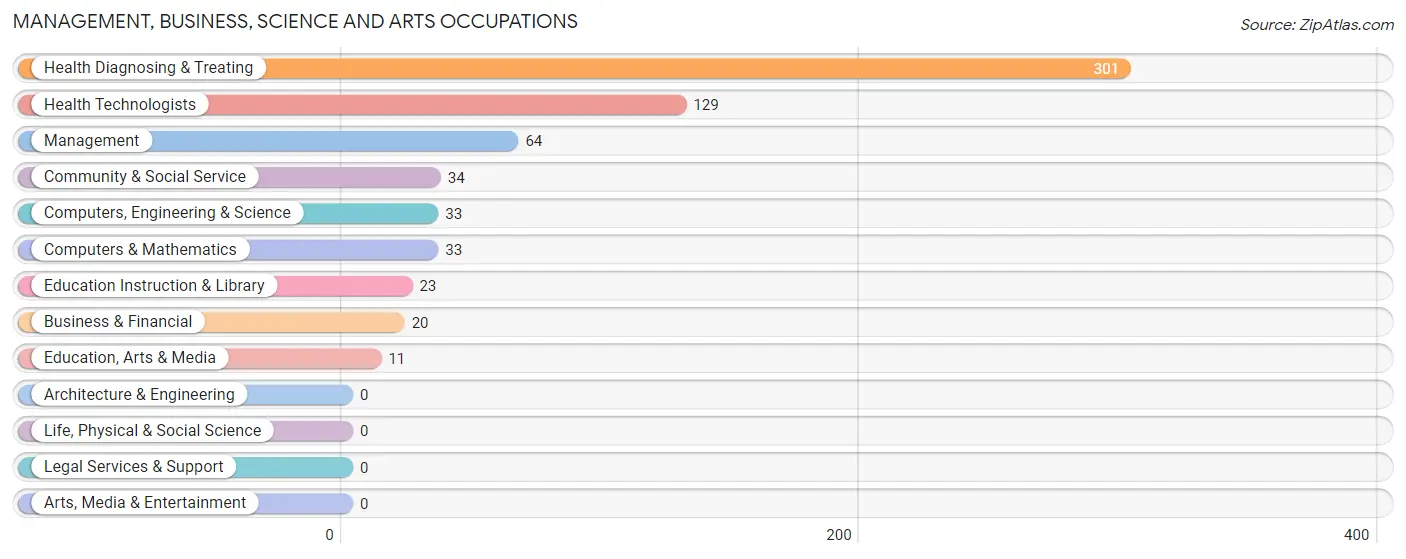
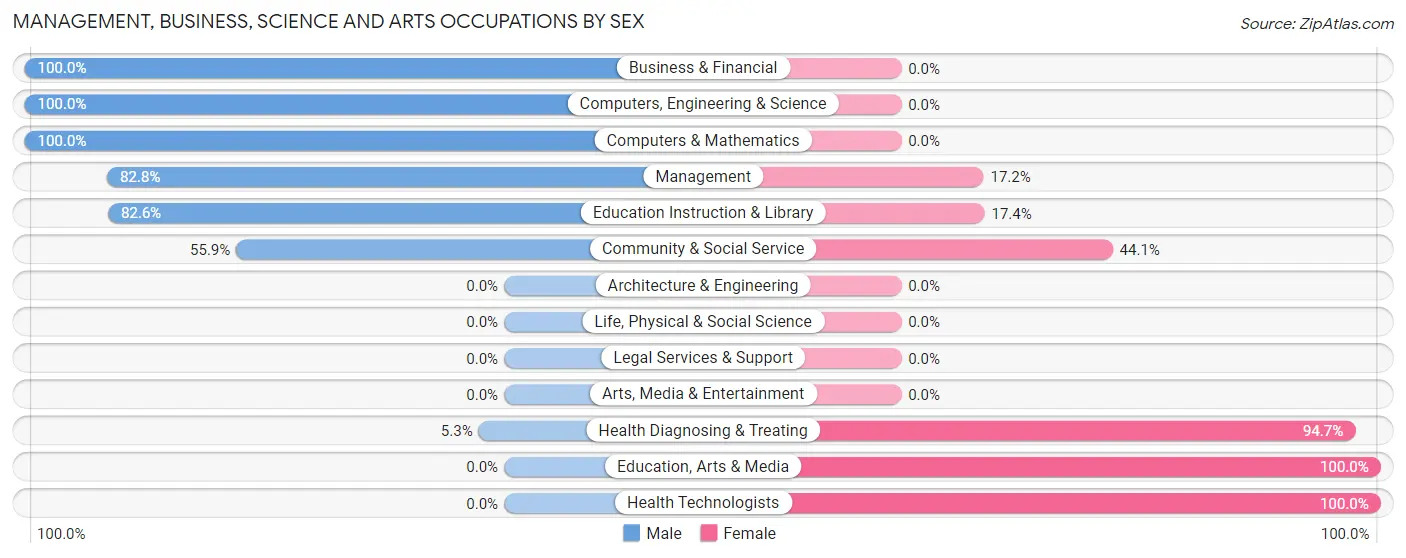
The most common Management, Business, Science and Arts occupations in Rosemount are Health Diagnosing & Treating (301 | 33.0%), Health Technologists (129 | 14.1%), Management (64 | 7.0%), Community & Social Service (34 | 3.7%), and Computers, Engineering & Science (33 | 3.6%).
Management, Business, Science and Arts Occupations by Sex
Within the Management, Business, Science and Arts occupations in Rosemount, the most male-oriented occupations are Business & Financial (100.0%), Computers, Engineering & Science (100.0%), and Computers & Mathematics (100.0%), while the most female-oriented occupations are Education, Arts & Media (100.0%), Health Technologists (100.0%), and Health Diagnosing & Treating (94.7%).
| Occupation | Male | Female |
| Management | 53 (82.8%) | 11 (17.2%) |
| Business & Financial | 20 (100.0%) | 0 (0.0%) |
| Computers, Engineering & Science | 33 (100.0%) | 0 (0.0%) |
| Computers & Mathematics | 33 (100.0%) | 0 (0.0%) |
| Architecture & Engineering | 0 (0.0%) | 0 (0.0%) |
| Life, Physical & Social Science | 0 (0.0%) | 0 (0.0%) |
| Community & Social Service | 19 (55.9%) | 15 (44.1%) |
| Education, Arts & Media | 0 (0.0%) | 11 (100.0%) |
| Legal Services & Support | 0 (0.0%) | 0 (0.0%) |
| Education Instruction & Library | 19 (82.6%) | 4 (17.4%) |
| Arts, Media & Entertainment | 0 (0.0%) | 0 (0.0%) |
| Health Diagnosing & Treating | 16 (5.3%) | 285 (94.7%) |
| Health Technologists | 0 (0.0%) | 129 (100.0%) |
| Total (Category) | 141 (31.2%) | 311 (68.8%) |
| Total (Overall) | 418 (45.8%) | 494 (54.2%) |
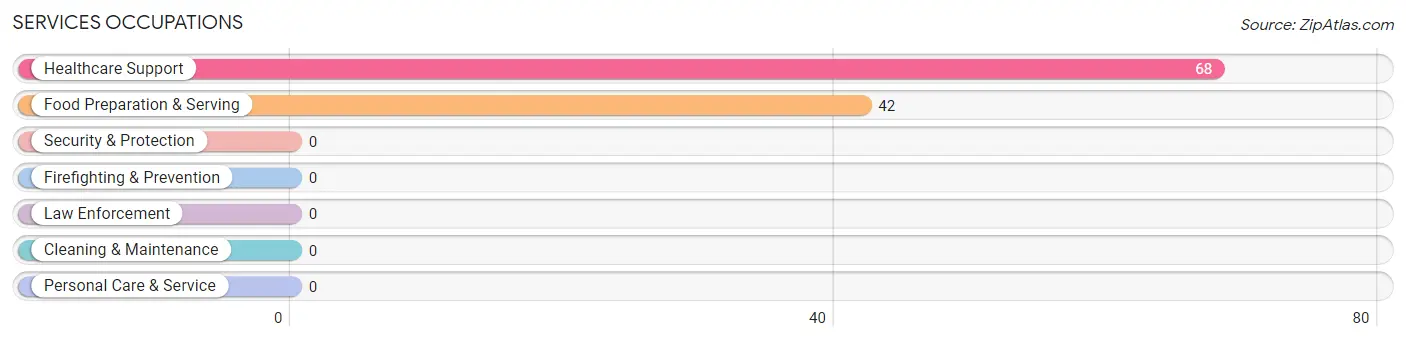
Services Occupations
The most common Services occupations in Rosemount are Healthcare Support (68 | 7.5%), and Food Preparation & Serving (42 | 4.6%).
Services Occupations by Sex
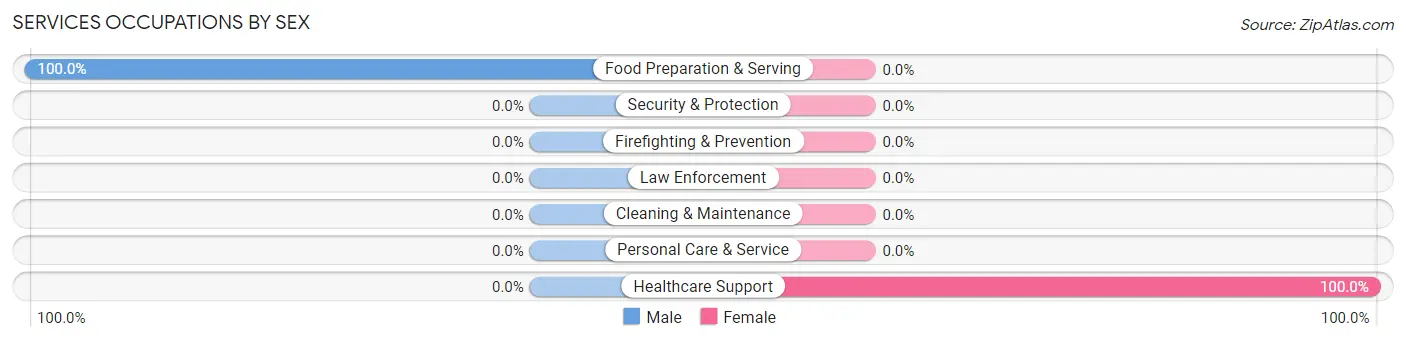
| Occupation | Male | Female |
| Healthcare Support | 0 (0.0%) | 68 (100.0%) |
| Security & Protection | 0 (0.0%) | 0 (0.0%) |
| Firefighting & Prevention | 0 (0.0%) | 0 (0.0%) |
| Law Enforcement | 0 (0.0%) | 0 (0.0%) |
| Food Preparation & Serving | 42 (100.0%) | 0 (0.0%) |
| Cleaning & Maintenance | 0 (0.0%) | 0 (0.0%) |
| Personal Care & Service | 0 (0.0%) | 0 (0.0%) |
| Total (Category) | 42 (38.2%) | 68 (61.8%) |
| Total (Overall) | 418 (45.8%) | 494 (54.2%) |
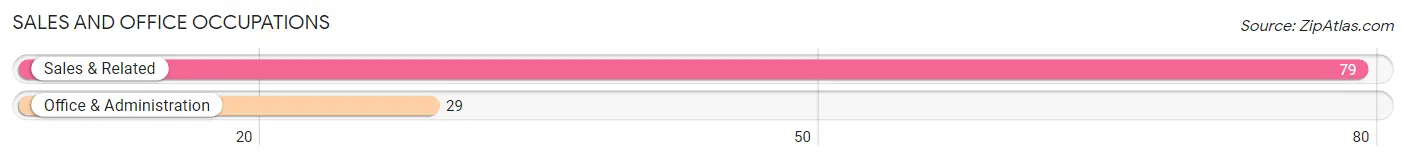
Sales and Office Occupations
The most common Sales and Office occupations in Rosemount are Sales & Related (79 | 8.7%), and Office & Administration (29 | 3.2%).
Sales and Office Occupations by Sex
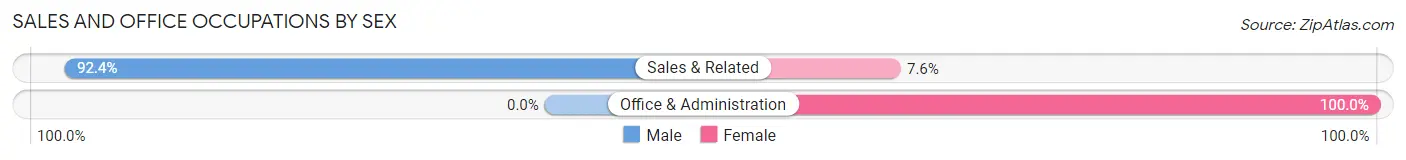
| Occupation | Male | Female |
| Sales & Related | 73 (92.4%) | 6 (7.6%) |
| Office & Administration | 0 (0.0%) | 29 (100.0%) |
| Total (Category) | 73 (67.6%) | 35 (32.4%) |
| Total (Overall) | 418 (45.8%) | 494 (54.2%) |
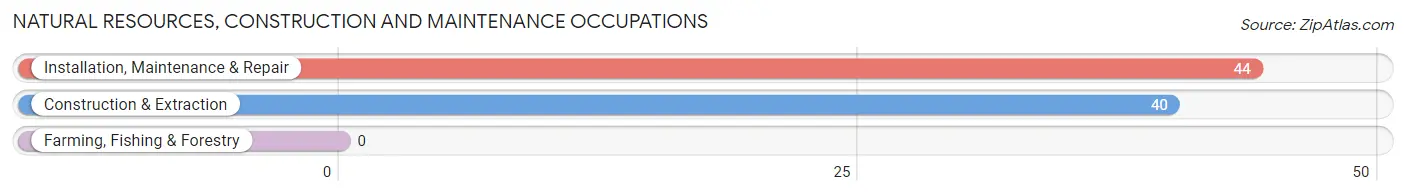
Natural Resources, Construction and Maintenance Occupations
The most common Natural Resources, Construction and Maintenance occupations in Rosemount are Installation, Maintenance & Repair (44 | 4.8%), and Construction & Extraction (40 | 4.4%).
Natural Resources, Construction and Maintenance Occupations by Sex
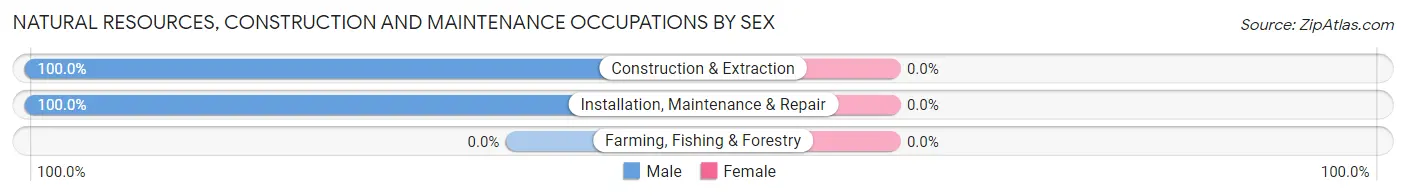
| Occupation | Male | Female |
| Farming, Fishing & Forestry | 0 (0.0%) | 0 (0.0%) |
| Construction & Extraction | 40 (100.0%) | 0 (0.0%) |
| Installation, Maintenance & Repair | 44 (100.0%) | 0 (0.0%) |
| Total (Category) | 84 (100.0%) | 0 (0.0%) |
| Total (Overall) | 418 (45.8%) | 494 (54.2%) |
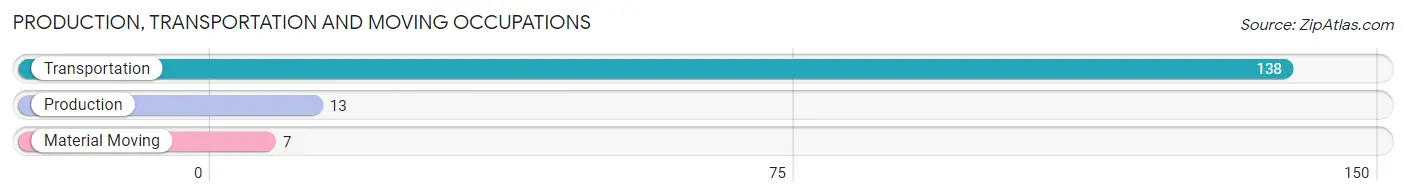
Production, Transportation and Moving Occupations
The most common Production, Transportation and Moving occupations in Rosemount are Transportation (138 | 15.1%), Production (13 | 1.4%), and Material Moving (7 | 0.8%).
Production, Transportation and Moving Occupations by Sex
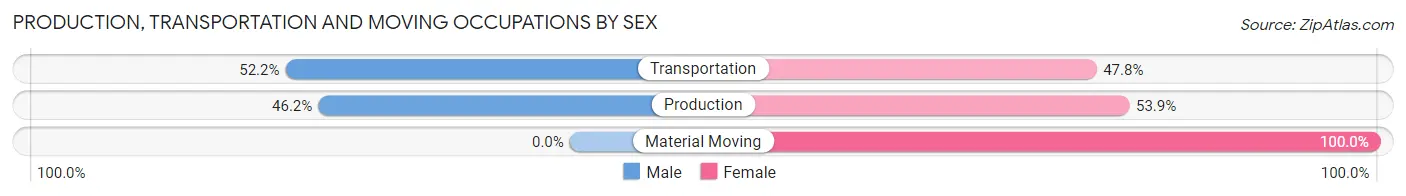
| Occupation | Male | Female |
| Production | 6 (46.2%) | 7 (53.8%) |
| Transportation | 72 (52.2%) | 66 (47.8%) |
| Material Moving | 0 (0.0%) | 7 (100.0%) |
| Total (Category) | 78 (49.4%) | 80 (50.6%) |
| Total (Overall) | 418 (45.8%) | 494 (54.2%) |
Employment Industries by Sex in Rosemount
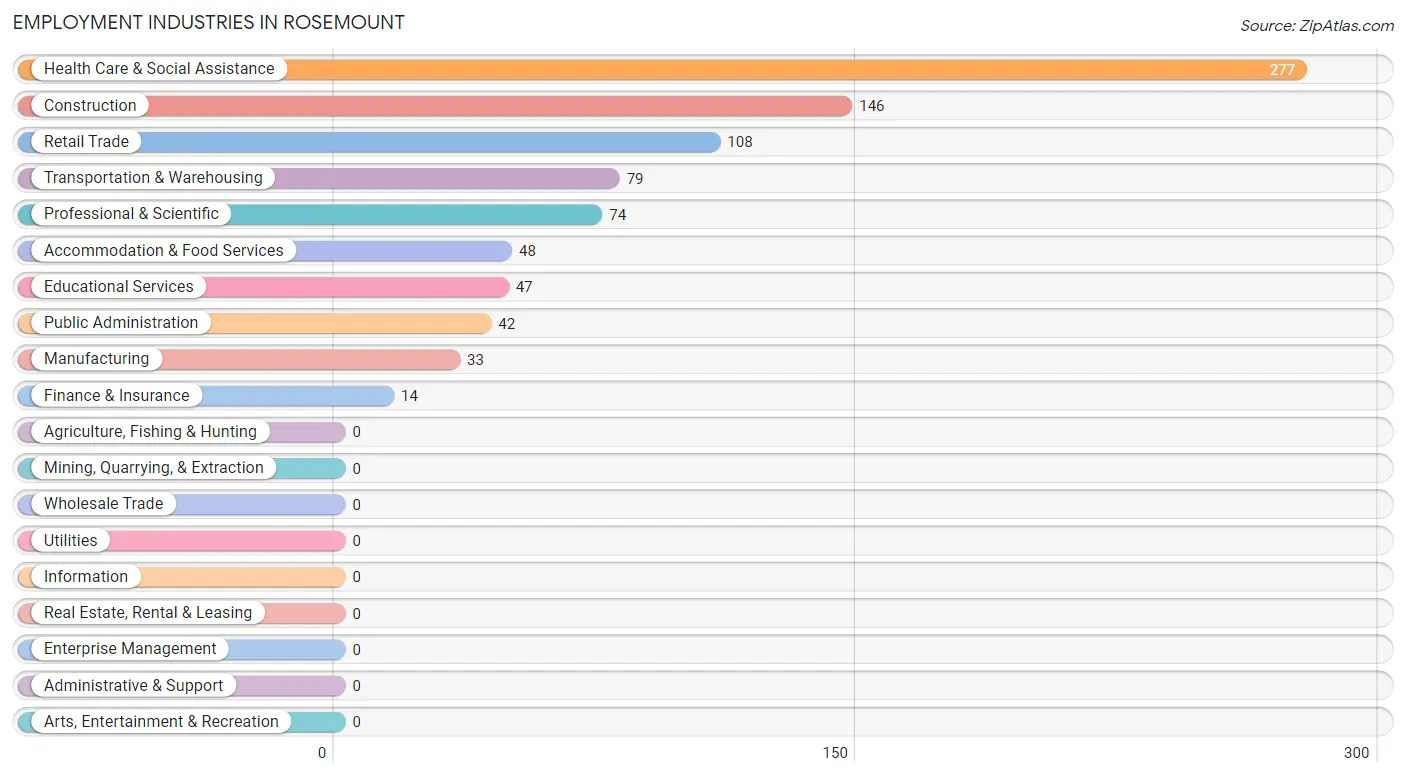
Employment Industries in Rosemount
The major employment industries in Rosemount include Health Care & Social Assistance (277 | 30.4%), Construction (146 | 16.0%), Retail Trade (108 | 11.8%), Transportation & Warehousing (79 | 8.7%), and Professional & Scientific (74 | 8.1%).
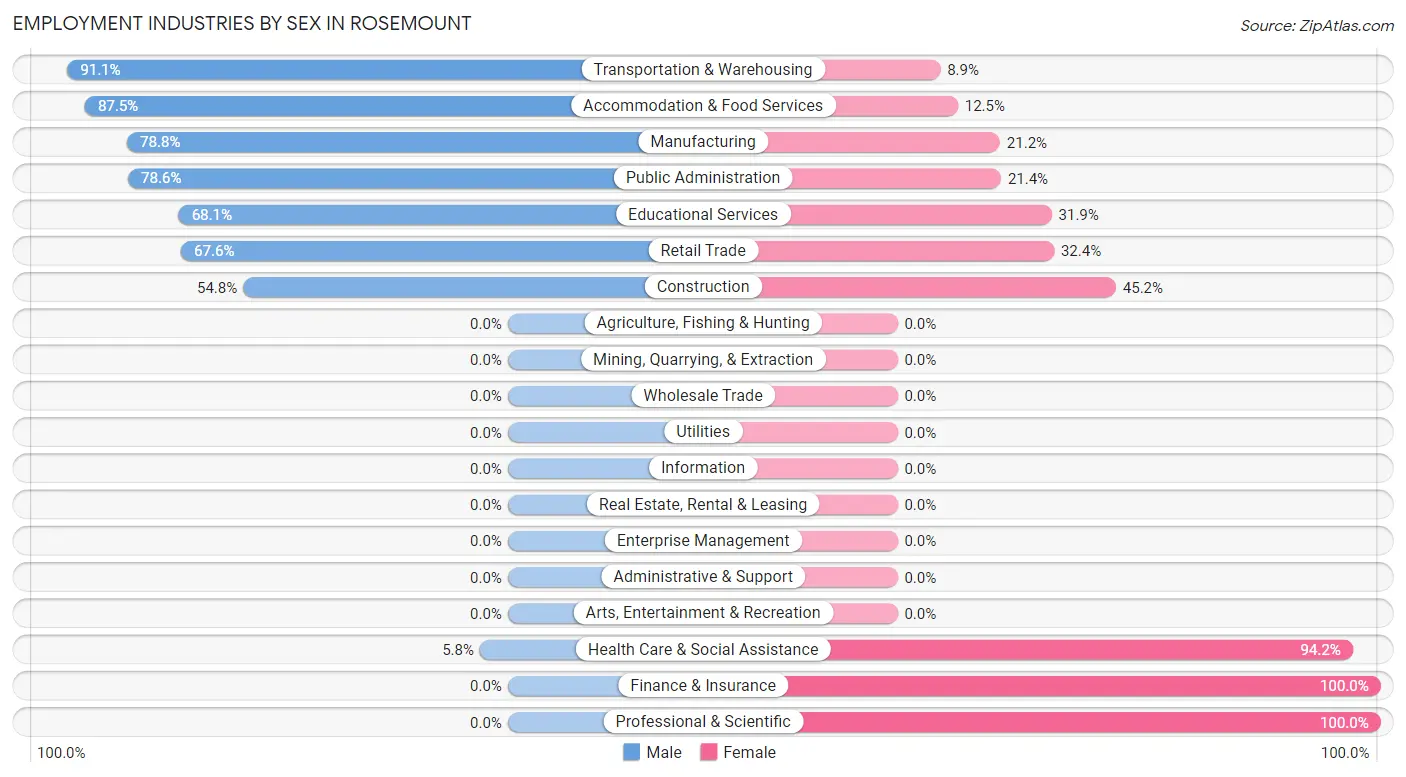
Employment Industries by Sex in Rosemount
The Rosemount industries that see more men than women are Transportation & Warehousing (91.1%), Accommodation & Food Services (87.5%), and Manufacturing (78.8%), whereas the industries that tend to have a higher number of women are Finance & Insurance (100.0%), Professional & Scientific (100.0%), and Health Care & Social Assistance (94.2%).
| Industry | Male | Female |
| Agriculture, Fishing & Hunting | 0 (0.0%) | 0 (0.0%) |
| Mining, Quarrying, & Extraction | 0 (0.0%) | 0 (0.0%) |
| Construction | 80 (54.8%) | 66 (45.2%) |
| Manufacturing | 26 (78.8%) | 7 (21.2%) |
| Wholesale Trade | 0 (0.0%) | 0 (0.0%) |
| Retail Trade | 73 (67.6%) | 35 (32.4%) |
| Transportation & Warehousing | 72 (91.1%) | 7 (8.9%) |
| Utilities | 0 (0.0%) | 0 (0.0%) |
| Information | 0 (0.0%) | 0 (0.0%) |
| Finance & Insurance | 0 (0.0%) | 14 (100.0%) |
| Real Estate, Rental & Leasing | 0 (0.0%) | 0 (0.0%) |
| Professional & Scientific | 0 (0.0%) | 74 (100.0%) |
| Enterprise Management | 0 (0.0%) | 0 (0.0%) |
| Administrative & Support | 0 (0.0%) | 0 (0.0%) |
| Educational Services | 32 (68.1%) | 15 (31.9%) |
| Health Care & Social Assistance | 16 (5.8%) | 261 (94.2%) |
| Arts, Entertainment & Recreation | 0 (0.0%) | 0 (0.0%) |
| Accommodation & Food Services | 42 (87.5%) | 6 (12.5%) |
| Public Administration | 33 (78.6%) | 9 (21.4%) |
| Total | 418 (45.8%) | 494 (54.2%) |
Education in Rosemount
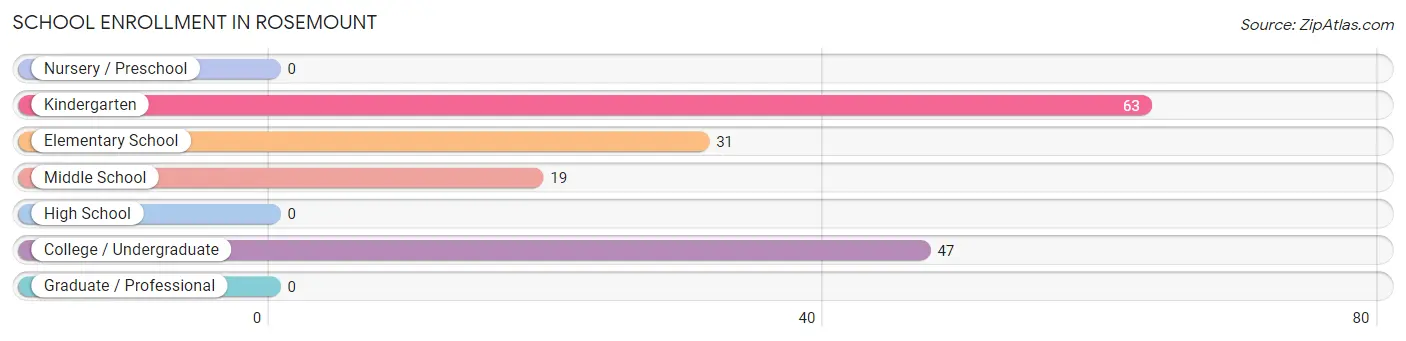
School Enrollment in Rosemount
The most common levels of schooling among the 160 students in Rosemount are kindergarten (63 | 39.4%), college / undergraduate (47 | 29.4%), and elementary school (31 | 19.4%).
| School Level | # Students | % Students |
| Nursery / Preschool | 0 | 0.0% |
| Kindergarten | 63 | 39.4% |
| Elementary School | 31 | 19.4% |
| Middle School | 19 | 11.9% |
| High School | 0 | 0.0% |
| College / Undergraduate | 47 | 29.4% |
| Graduate / Professional | 0 | 0.0% |
| Total | 160 | 100.0% |
School Enrollment by Age by Funding Source in Rosemount
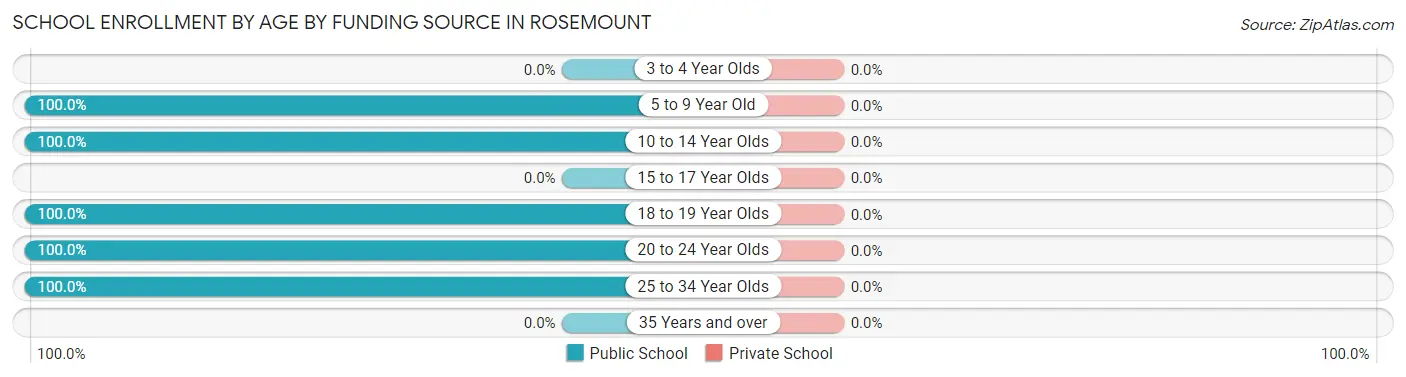
| Age Bracket | Public School | Private School |
| 3 to 4 Year Olds | 0 (0.0%) | 0 (0.0%) |
| 5 to 9 Year Old | 94 (100.0%) | 0 (0.0%) |
| 10 to 14 Year Olds | 19 (100.0%) | 0 (0.0%) |
| 15 to 17 Year Olds | 0 (0.0%) | 0 (0.0%) |
| 18 to 19 Year Olds | 7 (100.0%) | 0 (0.0%) |
| 20 to 24 Year Olds | 23 (100.0%) | 0 (0.0%) |
| 25 to 34 Year Olds | 17 (100.0%) | 0 (0.0%) |
| 35 Years and over | 0 (0.0%) | 0 (0.0%) |
| Total | 160 (100.0%) | 0 (0.0%) |
Educational Attainment by Field of Study in Rosemount
Physical & health sciences (123 | 27.2%), bio, nature & agricultural (102 | 22.5%), business (83 | 18.3%), science & technology (53 | 11.7%), and liberal arts & history (33 | 7.3%) are the most common fields of study among 453 individuals in Rosemount who have obtained a bachelor's degree or higher.
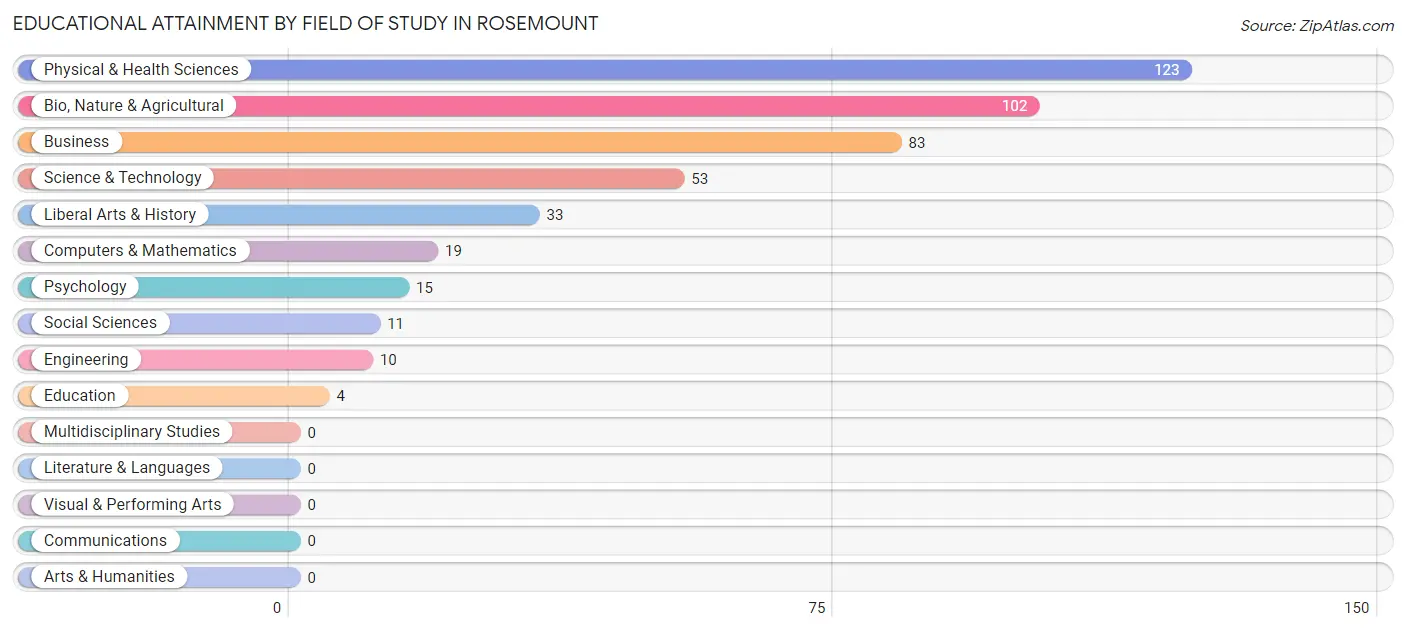
| Field of Study | # Graduates | % Graduates |
| Computers & Mathematics | 19 | 4.2% |
| Bio, Nature & Agricultural | 102 | 22.5% |
| Physical & Health Sciences | 123 | 27.2% |
| Psychology | 15 | 3.3% |
| Social Sciences | 11 | 2.4% |
| Engineering | 10 | 2.2% |
| Multidisciplinary Studies | 0 | 0.0% |
| Science & Technology | 53 | 11.7% |
| Business | 83 | 18.3% |
| Education | 4 | 0.9% |
| Literature & Languages | 0 | 0.0% |
| Liberal Arts & History | 33 | 7.3% |
| Visual & Performing Arts | 0 | 0.0% |
| Communications | 0 | 0.0% |
| Arts & Humanities | 0 | 0.0% |
| Total | 453 | 100.0% |
Transportation & Commute in Rosemount
Vehicle Availability by Sex in Rosemount
The most prevalent vehicle ownership categories in Rosemount are males with 3 vehicles (243, accounting for 58.1%) and females with 3 vehicles (263, making up 49.2%).
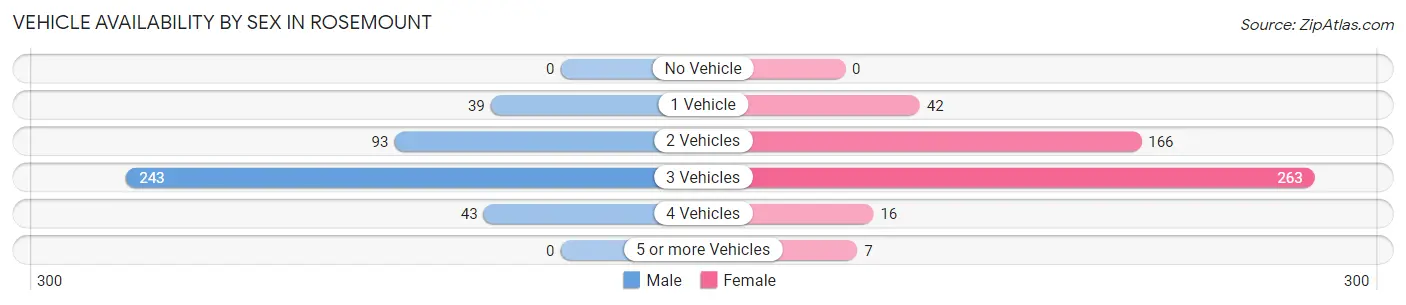
| Vehicles Available | Male | Female |
| No Vehicle | 0 (0.0%) | 0 (0.0%) |
| 1 Vehicle | 39 (9.3%) | 42 (8.5%) |
| 2 Vehicles | 93 (22.3%) | 166 (33.6%) |
| 3 Vehicles | 243 (58.1%) | 263 (53.2%) |
| 4 Vehicles | 43 (10.3%) | 16 (3.2%) |
| 5 or more Vehicles | 0 (0.0%) | 7 (1.4%) |
| Total | 418 (100.0%) | 494 (100.0%) |
Commute Time in Rosemount
The most frequently occuring commute durations in Rosemount are 25 to 29 minutes (229 commuters, 28.7%), 10 to 14 minutes (195 commuters, 24.4%), and 5 to 9 minutes (108 commuters, 13.5%).
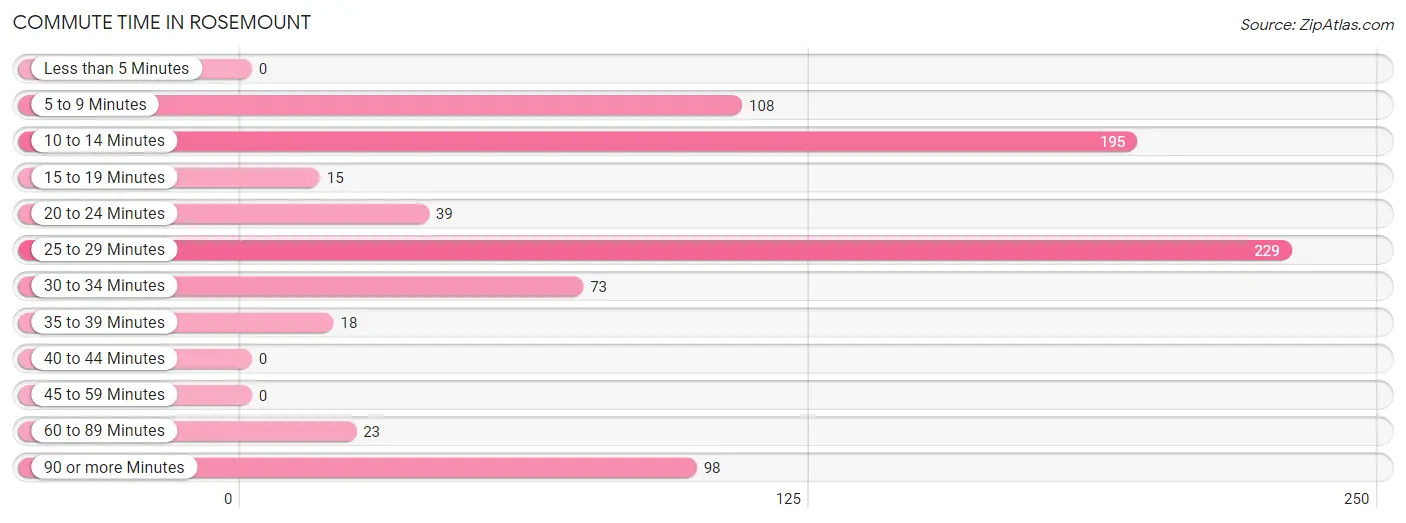
| Commute Time | # Commuters | % Commuters |
| Less than 5 Minutes | 0 | 0.0% |
| 5 to 9 Minutes | 108 | 13.5% |
| 10 to 14 Minutes | 195 | 24.4% |
| 15 to 19 Minutes | 15 | 1.9% |
| 20 to 24 Minutes | 39 | 4.9% |
| 25 to 29 Minutes | 229 | 28.7% |
| 30 to 34 Minutes | 73 | 9.1% |
| 35 to 39 Minutes | 18 | 2.3% |
| 40 to 44 Minutes | 0 | 0.0% |
| 45 to 59 Minutes | 0 | 0.0% |
| 60 to 89 Minutes | 23 | 2.9% |
| 90 or more Minutes | 98 | 12.3% |
Commute Time by Sex in Rosemount
The most common commute times in Rosemount are 90 or more minutes (98 commuters, 25.9%) for males and 25 to 29 minutes (185 commuters, 44.1%) for females.
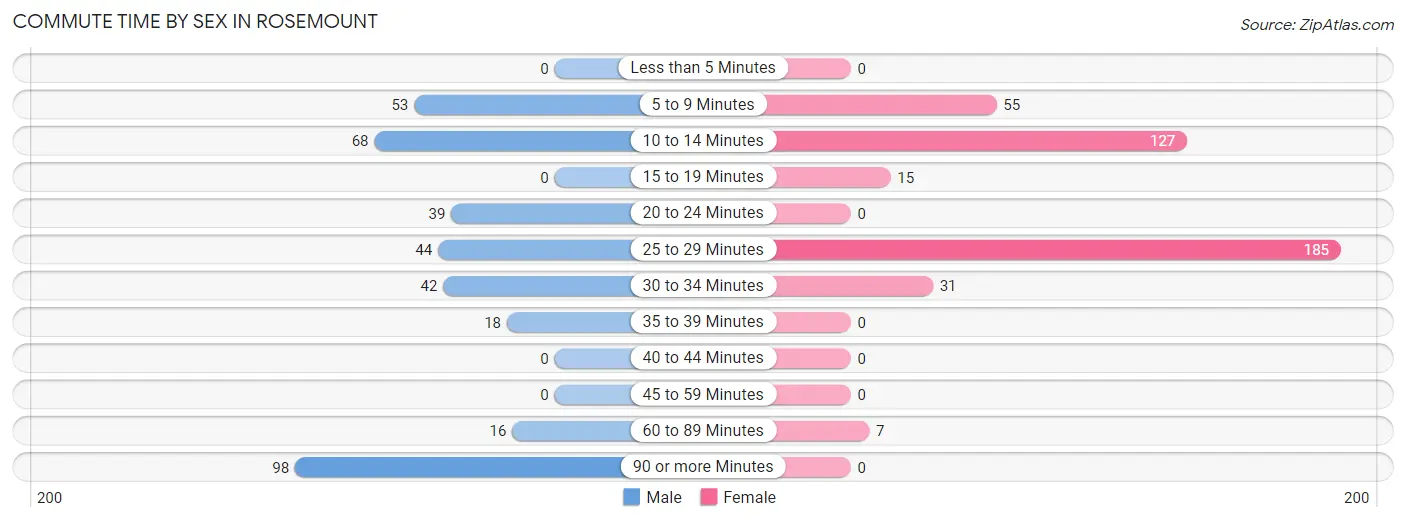
| Commute Time | Male | Female |
| Less than 5 Minutes | 0 (0.0%) | 0 (0.0%) |
| 5 to 9 Minutes | 53 (14.0%) | 55 (13.1%) |
| 10 to 14 Minutes | 68 (18.0%) | 127 (30.2%) |
| 15 to 19 Minutes | 0 (0.0%) | 15 (3.6%) |
| 20 to 24 Minutes | 39 (10.3%) | 0 (0.0%) |
| 25 to 29 Minutes | 44 (11.6%) | 185 (44.1%) |
| 30 to 34 Minutes | 42 (11.1%) | 31 (7.4%) |
| 35 to 39 Minutes | 18 (4.8%) | 0 (0.0%) |
| 40 to 44 Minutes | 0 (0.0%) | 0 (0.0%) |
| 45 to 59 Minutes | 0 (0.0%) | 0 (0.0%) |
| 60 to 89 Minutes | 16 (4.2%) | 7 (1.7%) |
| 90 or more Minutes | 98 (25.9%) | 0 (0.0%) |
Time of Departure to Work by Sex in Rosemount
The most frequent times of departure to work in Rosemount are 12:00 AM to 4:59 AM (90, 23.8%) for males and 7:30 AM to 7:59 AM (275, 65.5%) for females.
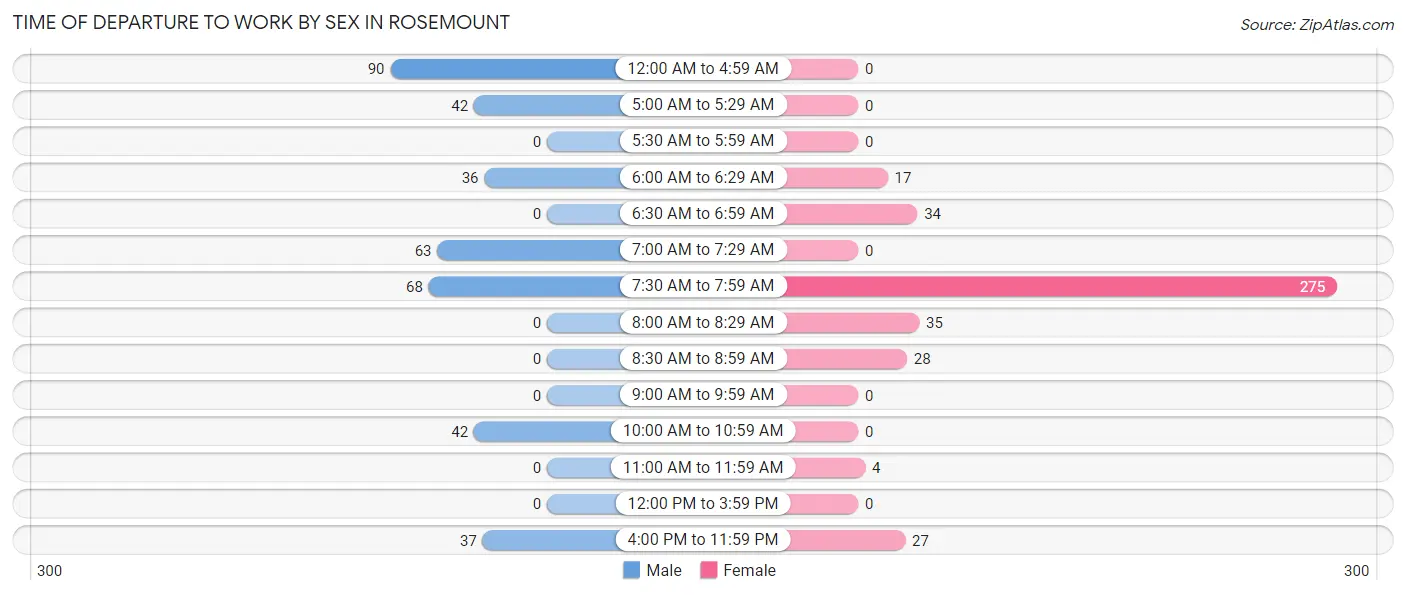
| Time of Departure | Male | Female |
| 12:00 AM to 4:59 AM | 90 (23.8%) | 0 (0.0%) |
| 5:00 AM to 5:29 AM | 42 (11.1%) | 0 (0.0%) |
| 5:30 AM to 5:59 AM | 0 (0.0%) | 0 (0.0%) |
| 6:00 AM to 6:29 AM | 36 (9.5%) | 17 (4.1%) |
| 6:30 AM to 6:59 AM | 0 (0.0%) | 34 (8.1%) |
| 7:00 AM to 7:29 AM | 63 (16.7%) | 0 (0.0%) |
| 7:30 AM to 7:59 AM | 68 (18.0%) | 275 (65.5%) |
| 8:00 AM to 8:29 AM | 0 (0.0%) | 35 (8.3%) |
| 8:30 AM to 8:59 AM | 0 (0.0%) | 28 (6.7%) |
| 9:00 AM to 9:59 AM | 0 (0.0%) | 0 (0.0%) |
| 10:00 AM to 10:59 AM | 42 (11.1%) | 0 (0.0%) |
| 11:00 AM to 11:59 AM | 0 (0.0%) | 4 (0.9%) |
| 12:00 PM to 3:59 PM | 0 (0.0%) | 0 (0.0%) |
| 4:00 PM to 11:59 PM | 37 (9.8%) | 27 (6.4%) |
| Total | 378 (100.0%) | 420 (100.0%) |
Housing Occupancy in Rosemount
Occupancy by Ownership in Rosemount
Of the total 777 dwellings in Rosemount, owner-occupied units account for 562 (72.3%), while renter-occupied units make up 215 (27.7%).
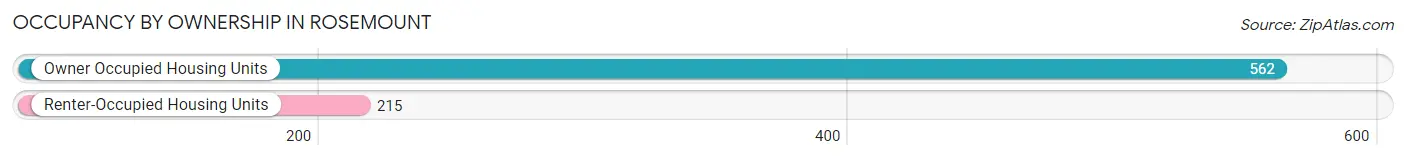
| Occupancy | # Housing Units | % Housing Units |
| Owner Occupied Housing Units | 562 | 72.3% |
| Renter-Occupied Housing Units | 215 | 27.7% |
| Total Occupied Housing Units | 777 | 100.0% |
Occupancy by Household Size in Rosemount
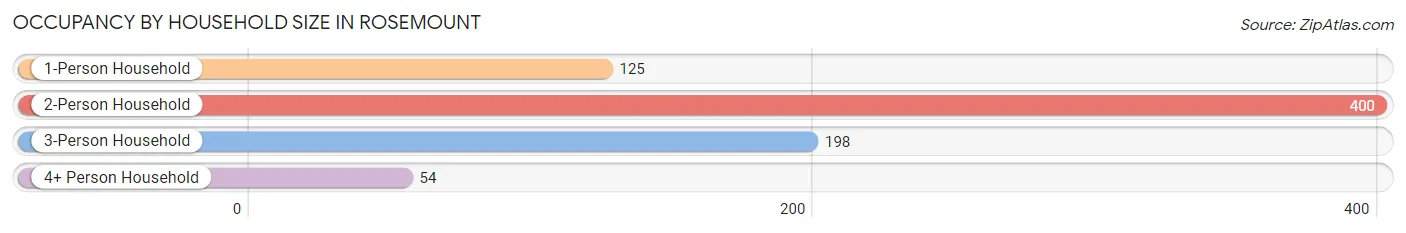
| Household Size | # Housing Units | % Housing Units |
| 1-Person Household | 125 | 16.1% |
| 2-Person Household | 400 | 51.5% |
| 3-Person Household | 198 | 25.5% |
| 4+ Person Household | 54 | 7.0% |
| Total Housing Units | 777 | 100.0% |
Occupancy by Ownership by Household Size in Rosemount
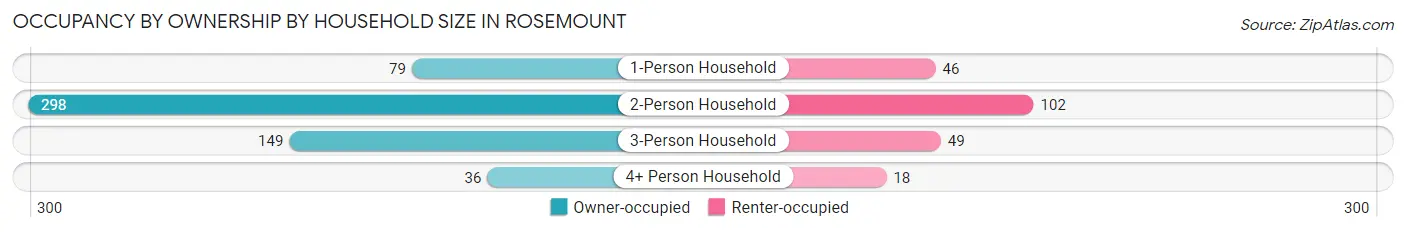
| Household Size | Owner-occupied | Renter-occupied |
| 1-Person Household | 79 (63.2%) | 46 (36.8%) |
| 2-Person Household | 298 (74.5%) | 102 (25.5%) |
| 3-Person Household | 149 (75.2%) | 49 (24.7%) |
| 4+ Person Household | 36 (66.7%) | 18 (33.3%) |
| Total Housing Units | 562 (72.3%) | 215 (27.7%) |
Occupancy by Educational Attainment in Rosemount
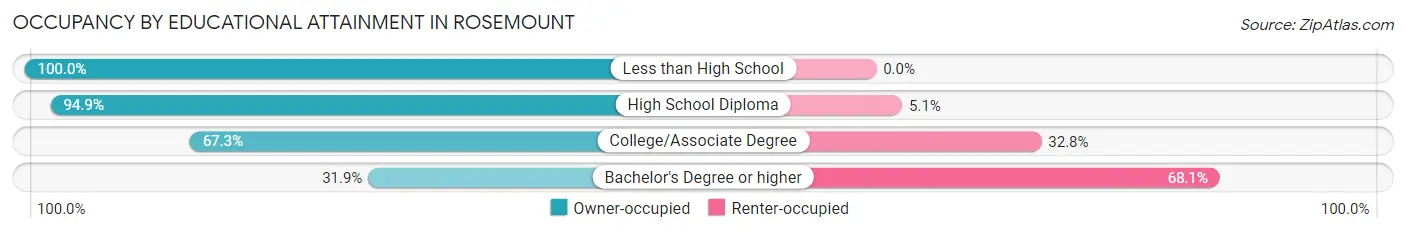
| Household Size | Owner-occupied | Renter-occupied |
| Less than High School | 49 (100.0%) | 0 (0.0%) |
| High School Diploma | 332 (94.9%) | 18 (5.1%) |
| College/Associate Degree | 115 (67.2%) | 56 (32.8%) |
| Bachelor's Degree or higher | 66 (31.9%) | 141 (68.1%) |
Occupancy by Age of Householder in Rosemount
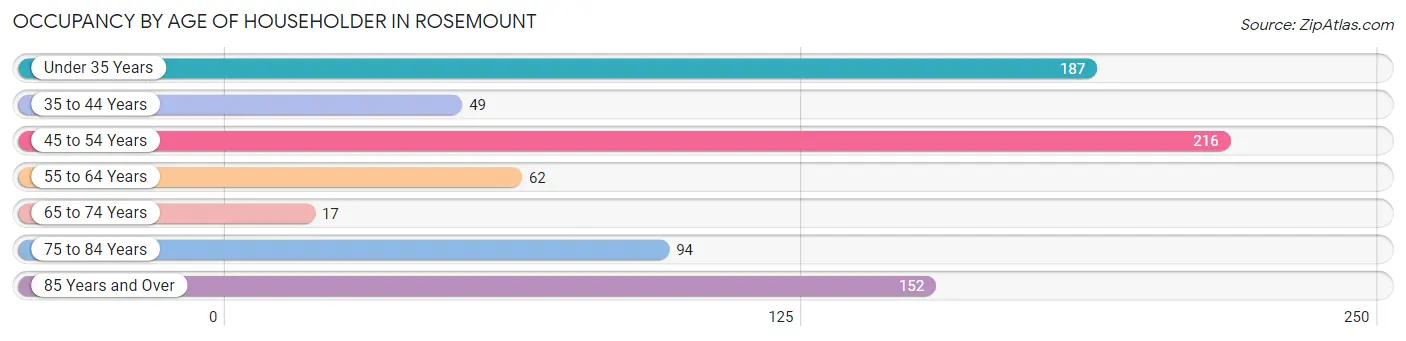
| Age Bracket | # Households | % Households |
| Under 35 Years | 187 | 24.1% |
| 35 to 44 Years | 49 | 6.3% |
| 45 to 54 Years | 216 | 27.8% |
| 55 to 64 Years | 62 | 8.0% |
| 65 to 74 Years | 17 | 2.2% |
| 75 to 84 Years | 94 | 12.1% |
| 85 Years and Over | 152 | 19.6% |
| Total | 777 | 100.0% |
Housing Finances in Rosemount
Median Income by Occupancy in Rosemount

| Occupancy Type | # Households | Median Income |
| Owner-Occupied | 562 (72.3%) | $54,500 |
| Renter-Occupied | 215 (27.7%) | $0 |
| Average | 777 (100.0%) | $45,117 |
Occupancy by Householder Income Bracket in Rosemount
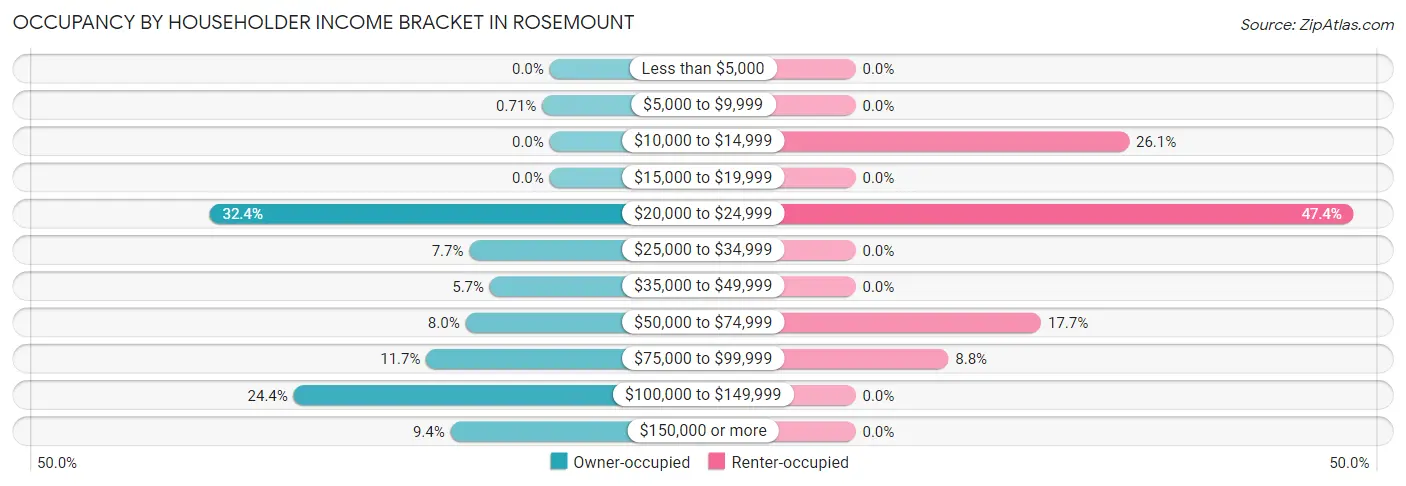
| Income Bracket | Owner-occupied | Renter-occupied |
| Less than $5,000 | 0 (0.0%) | 0 (0.0%) |
| $5,000 to $9,999 | 4 (0.7%) | 0 (0.0%) |
| $10,000 to $14,999 | 0 (0.0%) | 56 (26.1%) |
| $15,000 to $19,999 | 0 (0.0%) | 0 (0.0%) |
| $20,000 to $24,999 | 182 (32.4%) | 102 (47.4%) |
| $25,000 to $34,999 | 43 (7.6%) | 0 (0.0%) |
| $35,000 to $49,999 | 32 (5.7%) | 0 (0.0%) |
| $50,000 to $74,999 | 45 (8.0%) | 38 (17.7%) |
| $75,000 to $99,999 | 66 (11.7%) | 19 (8.8%) |
| $100,000 to $149,999 | 137 (24.4%) | 0 (0.0%) |
| $150,000 or more | 53 (9.4%) | 0 (0.0%) |
| Total | 562 (100.0%) | 215 (100.0%) |
Monthly Housing Cost Tiers in Rosemount
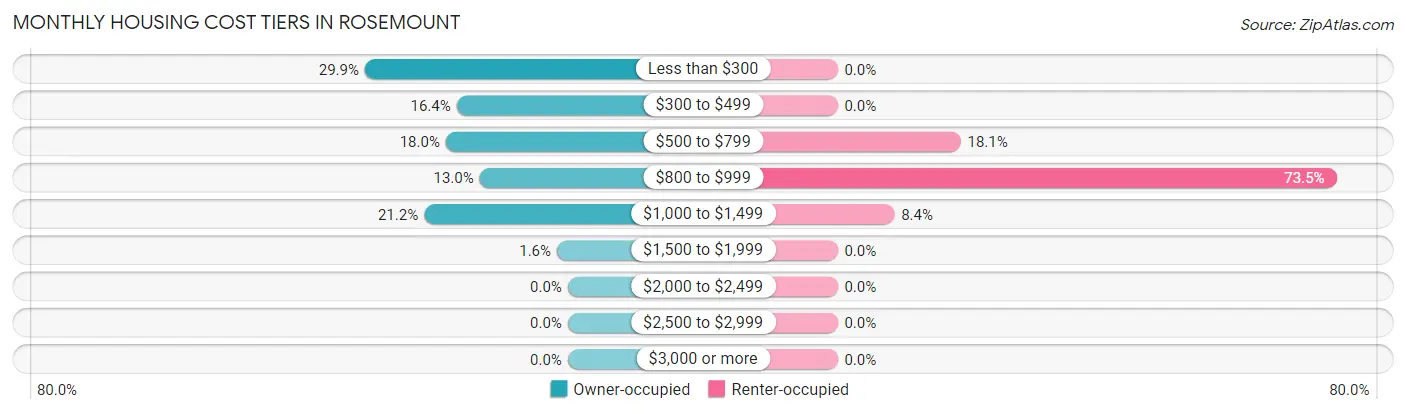
| Monthly Cost | Owner-occupied | Renter-occupied |
| Less than $300 | 168 (29.9%) | 0 (0.0%) |
| $300 to $499 | 92 (16.4%) | 0 (0.0%) |
| $500 to $799 | 101 (18.0%) | 39 (18.1%) |
| $800 to $999 | 73 (13.0%) | 158 (73.5%) |
| $1,000 to $1,499 | 119 (21.2%) | 18 (8.4%) |
| $1,500 to $1,999 | 9 (1.6%) | 0 (0.0%) |
| $2,000 to $2,499 | 0 (0.0%) | 0 (0.0%) |
| $2,500 to $2,999 | 0 (0.0%) | 0 (0.0%) |
| $3,000 or more | 0 (0.0%) | 0 (0.0%) |
| Total | 562 (100.0%) | 215 (100.0%) |
Physical Housing Characteristics in Rosemount
Housing Structures in Rosemount
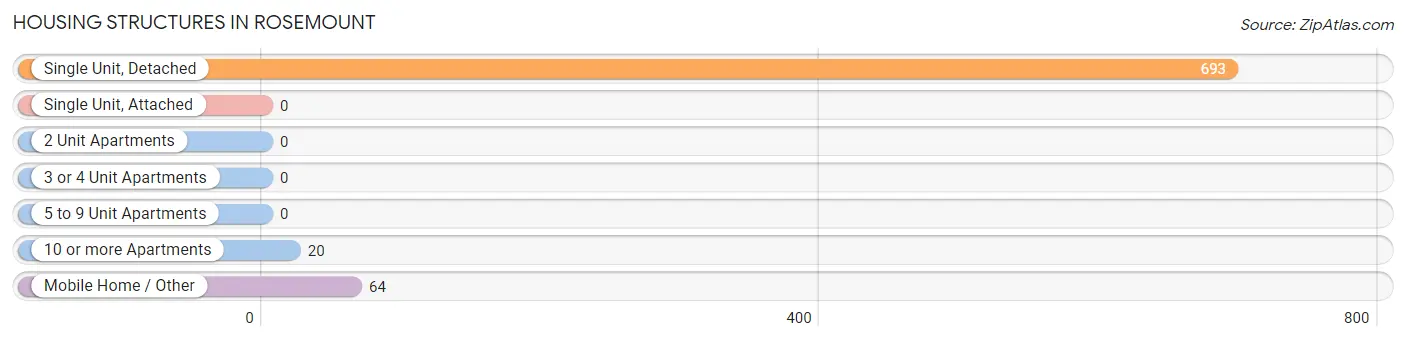
| Structure Type | # Housing Units | % Housing Units |
| Single Unit, Detached | 693 | 89.2% |
| Single Unit, Attached | 0 | 0.0% |
| 2 Unit Apartments | 0 | 0.0% |
| 3 or 4 Unit Apartments | 0 | 0.0% |
| 5 to 9 Unit Apartments | 0 | 0.0% |
| 10 or more Apartments | 20 | 2.6% |
| Mobile Home / Other | 64 | 8.2% |
| Total | 777 | 100.0% |
Housing Structures by Occupancy in Rosemount
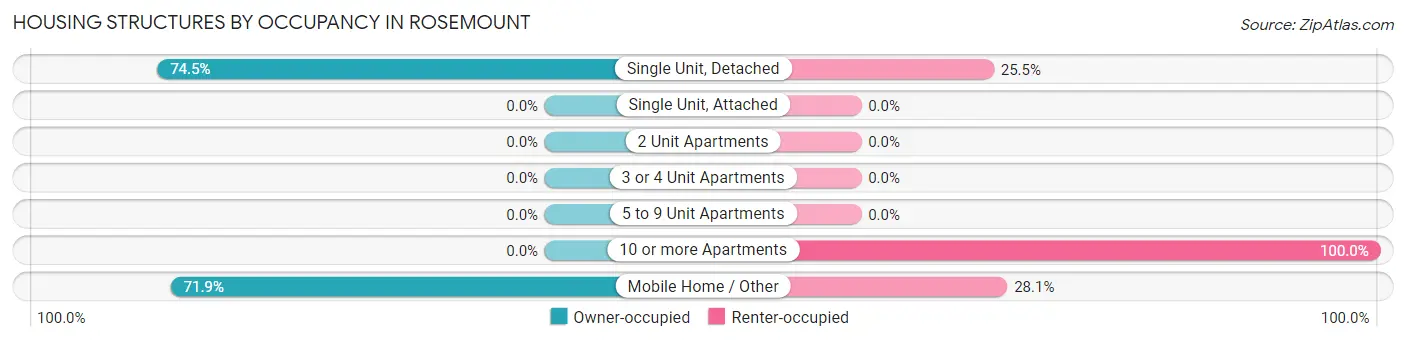
| Structure Type | Owner-occupied | Renter-occupied |
| Single Unit, Detached | 516 (74.5%) | 177 (25.5%) |
| Single Unit, Attached | 0 (0.0%) | 0 (0.0%) |
| 2 Unit Apartments | 0 (0.0%) | 0 (0.0%) |
| 3 or 4 Unit Apartments | 0 (0.0%) | 0 (0.0%) |
| 5 to 9 Unit Apartments | 0 (0.0%) | 0 (0.0%) |
| 10 or more Apartments | 0 (0.0%) | 20 (100.0%) |
| Mobile Home / Other | 46 (71.9%) | 18 (28.1%) |
| Total | 562 (72.3%) | 215 (27.7%) |
Housing Structures by Number of Rooms in Rosemount
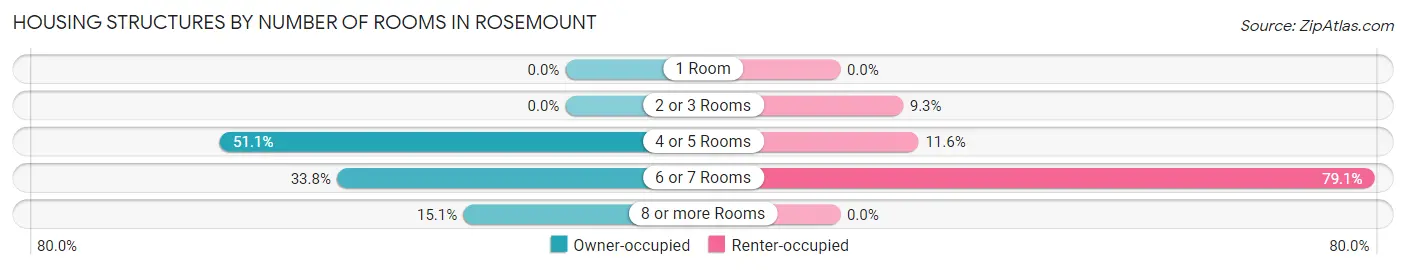
| Number of Rooms | Owner-occupied | Renter-occupied |
| 1 Room | 0 (0.0%) | 0 (0.0%) |
| 2 or 3 Rooms | 0 (0.0%) | 20 (9.3%) |
| 4 or 5 Rooms | 287 (51.1%) | 25 (11.6%) |
| 6 or 7 Rooms | 190 (33.8%) | 170 (79.1%) |
| 8 or more Rooms | 85 (15.1%) | 0 (0.0%) |
| Total | 562 (100.0%) | 215 (100.0%) |
Housing Structure by Heating Type in Rosemount
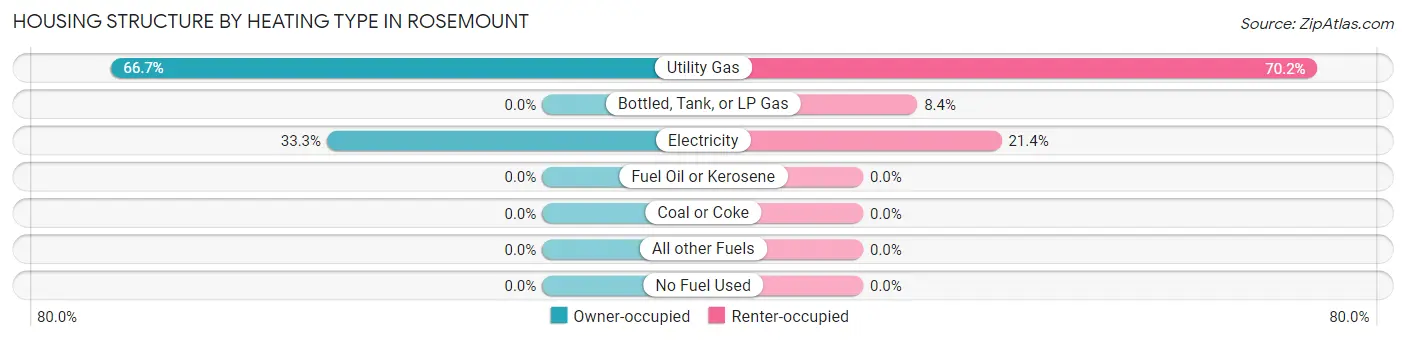
| Heating Type | Owner-occupied | Renter-occupied |
| Utility Gas | 375 (66.7%) | 151 (70.2%) |
| Bottled, Tank, or LP Gas | 0 (0.0%) | 18 (8.4%) |
| Electricity | 187 (33.3%) | 46 (21.4%) |
| Fuel Oil or Kerosene | 0 (0.0%) | 0 (0.0%) |
| Coal or Coke | 0 (0.0%) | 0 (0.0%) |
| All other Fuels | 0 (0.0%) | 0 (0.0%) |
| No Fuel Used | 0 (0.0%) | 0 (0.0%) |
| Total | 562 (100.0%) | 215 (100.0%) |
Household Vehicle Usage in Rosemount
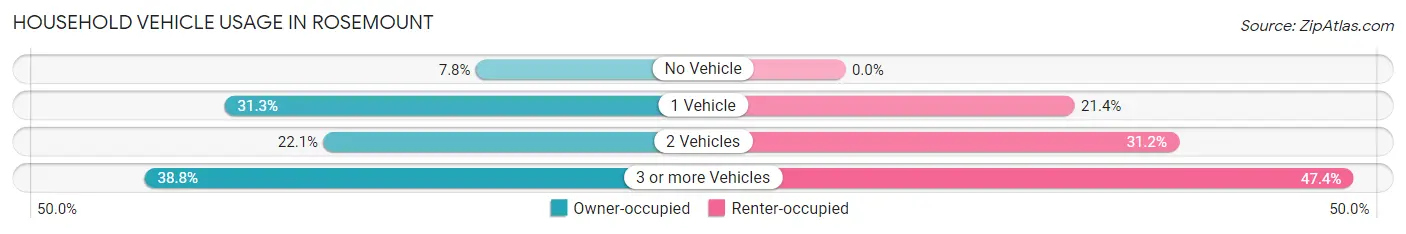
| Vehicles per Household | Owner-occupied | Renter-occupied |
| No Vehicle | 44 (7.8%) | 0 (0.0%) |
| 1 Vehicle | 176 (31.3%) | 46 (21.4%) |
| 2 Vehicles | 124 (22.1%) | 67 (31.2%) |
| 3 or more Vehicles | 218 (38.8%) | 102 (47.4%) |
| Total | 562 (100.0%) | 215 (100.0%) |
Real Estate & Mortgages in Rosemount
Real Estate and Mortgage Overview in Rosemount
| Characteristic | Without Mortgage | With Mortgage |
| Housing Units | 369 | 193 |
| Median Property Value | $86,900 | $122,000 |
| Median Household Income | - | - |
| Monthly Housing Costs | $368 | $0 |
| Real Estate Taxes | - | - |
Property Value by Mortgage Status in Rosemount
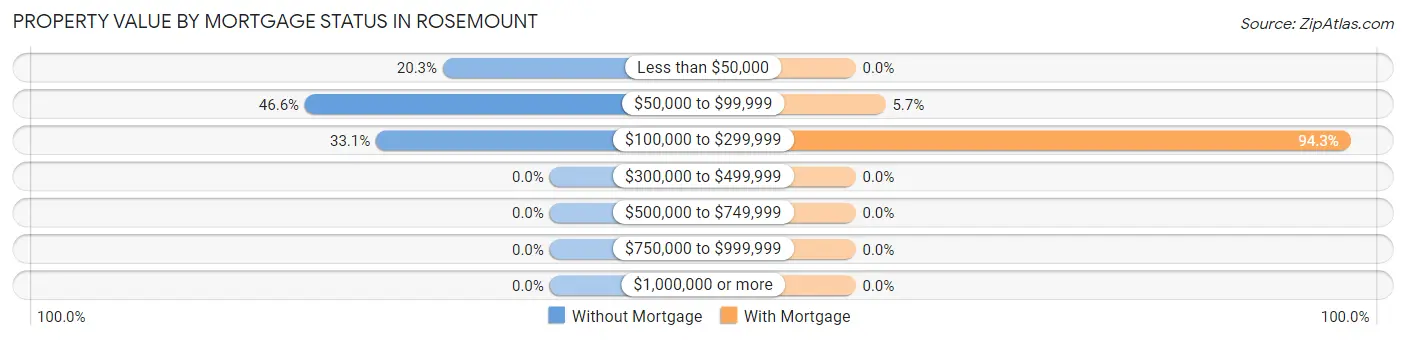
| Property Value | Without Mortgage | With Mortgage |
| Less than $50,000 | 75 (20.3%) | 0 (0.0%) |
| $50,000 to $99,999 | 172 (46.6%) | 11 (5.7%) |
| $100,000 to $299,999 | 122 (33.1%) | 182 (94.3%) |
| $300,000 to $499,999 | 0 (0.0%) | 0 (0.0%) |
| $500,000 to $749,999 | 0 (0.0%) | 0 (0.0%) |
| $750,000 to $999,999 | 0 (0.0%) | 0 (0.0%) |
| $1,000,000 or more | 0 (0.0%) | 0 (0.0%) |
| Total | 369 (100.0%) | 193 (100.0%) |
Household Income by Mortgage Status in Rosemount
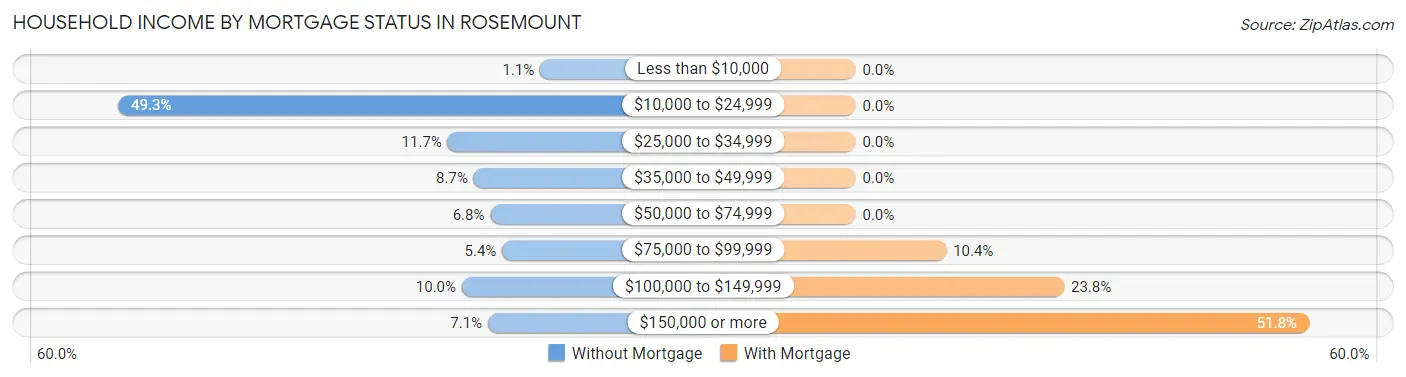
| Household Income | Without Mortgage | With Mortgage |
| Less than $10,000 | 4 (1.1%) | 0 (0.0%) |
| $10,000 to $24,999 | 182 (49.3%) | 0 (0.0%) |
| $25,000 to $34,999 | 43 (11.7%) | 0 (0.0%) |
| $35,000 to $49,999 | 32 (8.7%) | 0 (0.0%) |
| $50,000 to $74,999 | 25 (6.8%) | 0 (0.0%) |
| $75,000 to $99,999 | 20 (5.4%) | 20 (10.4%) |
| $100,000 to $149,999 | 37 (10.0%) | 46 (23.8%) |
| $150,000 or more | 26 (7.0%) | 100 (51.8%) |
| Total | 369 (100.0%) | 193 (100.0%) |
Property Value to Household Income Ratio in Rosemount
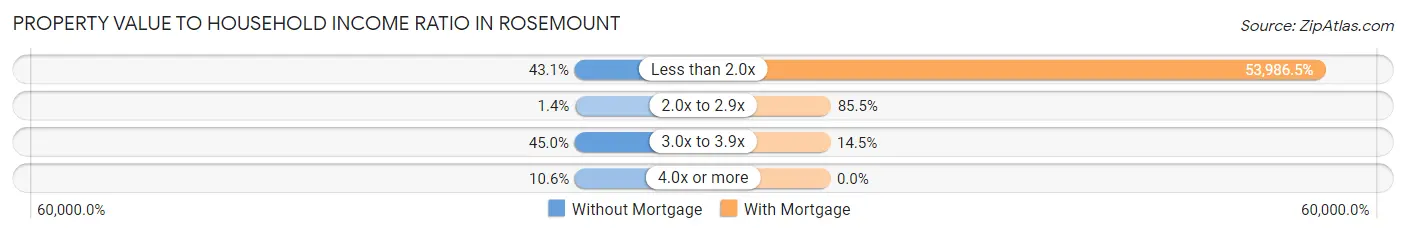
| Value-to-Income Ratio | Without Mortgage | With Mortgage |
| Less than 2.0x | 159 (43.1%) | 104,194 (53,986.5%) |
| 2.0x to 2.9x | 5 (1.4%) | 165 (85.5%) |
| 3.0x to 3.9x | 166 (45.0%) | 28 (14.5%) |
| 4.0x or more | 39 (10.6%) | 0 (0.0%) |
| Total | 369 (100.0%) | 193 (100.0%) |
Real Estate Taxes by Mortgage Status in Rosemount
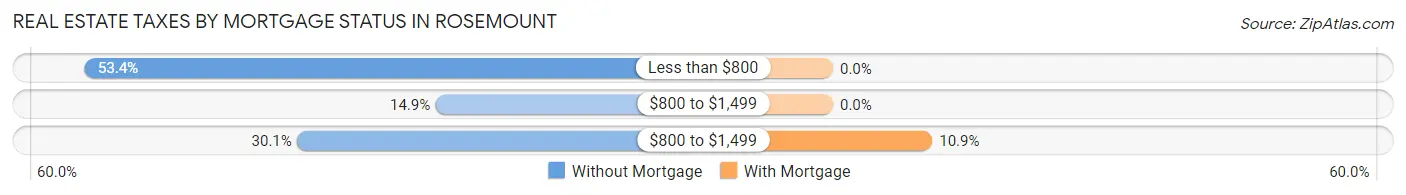
| Property Taxes | Without Mortgage | With Mortgage |
| Less than $800 | 197 (53.4%) | 0 (0.0%) |
| $800 to $1,499 | 55 (14.9%) | 0 (0.0%) |
| $800 to $1,499 | 111 (30.1%) | 21 (10.9%) |
| Total | 369 (100.0%) | 193 (100.0%) |
Health & Disability in Rosemount
Health Insurance Coverage by Age in Rosemount
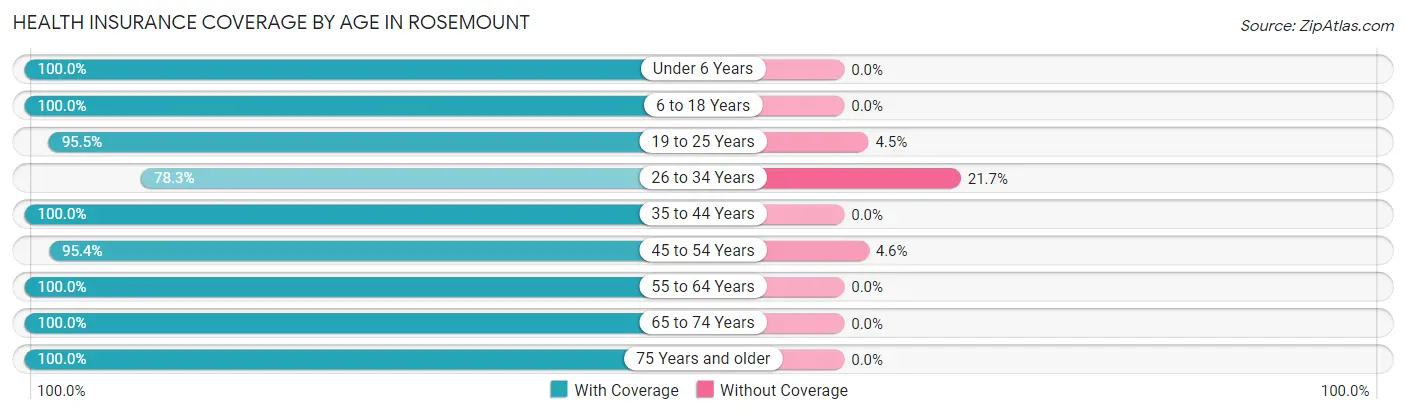
| Age Bracket | With Coverage | Without Coverage |
| Under 6 Years | 84 (100.0%) | 0 (0.0%) |
| 6 to 18 Years | 97 (100.0%) | 0 (0.0%) |
| 19 to 25 Years | 127 (95.5%) | 6 (4.5%) |
| 26 to 34 Years | 335 (78.3%) | 93 (21.7%) |
| 35 to 44 Years | 91 (100.0%) | 0 (0.0%) |
| 45 to 54 Years | 459 (95.4%) | 22 (4.6%) |
| 55 to 64 Years | 165 (100.0%) | 0 (0.0%) |
| 65 to 74 Years | 148 (100.0%) | 0 (0.0%) |
| 75 Years and older | 293 (100.0%) | 0 (0.0%) |
| Total | 1,799 (93.7%) | 121 (6.3%) |
Health Insurance Coverage by Citizenship Status in Rosemount
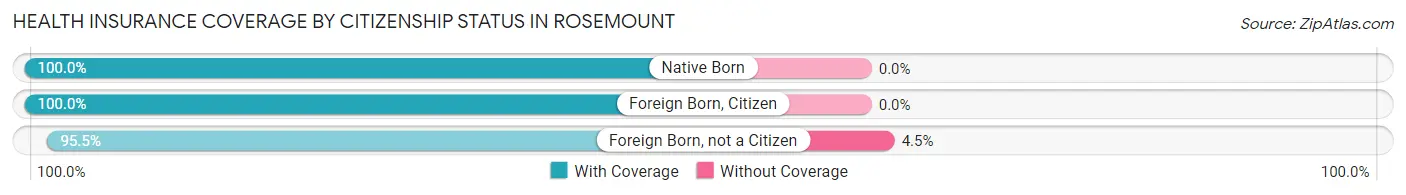
| Citizenship Status | With Coverage | Without Coverage |
| Native Born | 84 (100.0%) | 0 (0.0%) |
| Foreign Born, Citizen | 97 (100.0%) | 0 (0.0%) |
| Foreign Born, not a Citizen | 127 (95.5%) | 6 (4.5%) |
Health Insurance Coverage by Household Income in Rosemount
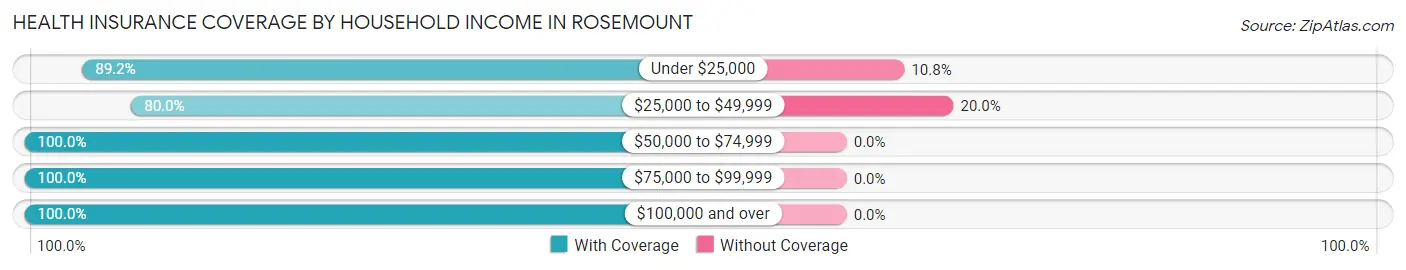
| Household Income | With Coverage | Without Coverage |
| Under $25,000 | 594 (89.2%) | 72 (10.8%) |
| $25,000 to $49,999 | 196 (80.0%) | 49 (20.0%) |
| $50,000 to $74,999 | 219 (100.0%) | 0 (0.0%) |
| $75,000 to $99,999 | 300 (100.0%) | 0 (0.0%) |
| $100,000 and over | 490 (100.0%) | 0 (0.0%) |
Public vs Private Health Insurance Coverage by Age in Rosemount
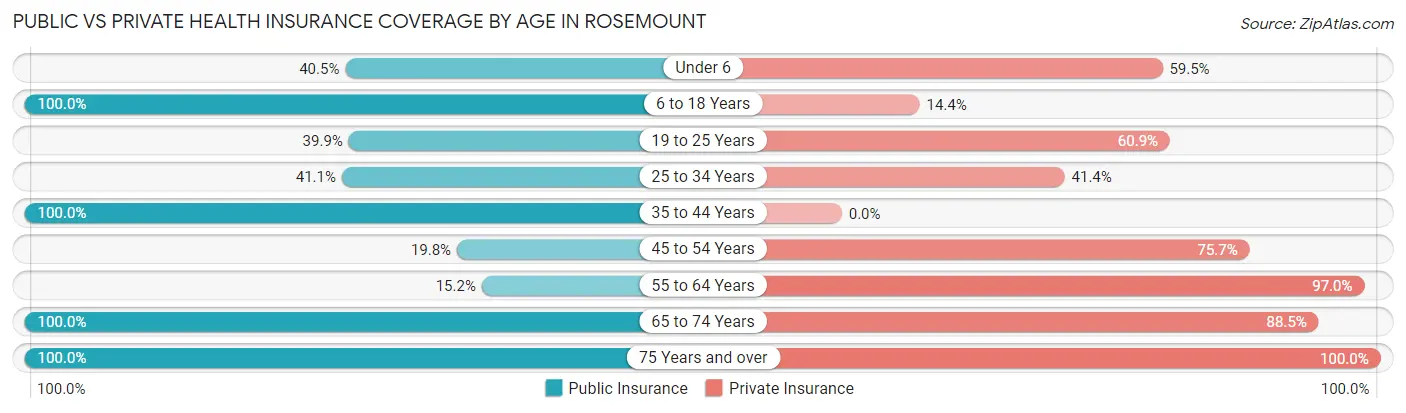
| Age Bracket | Public Insurance | Private Insurance |
| Under 6 | 34 (40.5%) | 50 (59.5%) |
| 6 to 18 Years | 97 (100.0%) | 14 (14.4%) |
| 19 to 25 Years | 53 (39.9%) | 81 (60.9%) |
| 25 to 34 Years | 176 (41.1%) | 177 (41.4%) |
| 35 to 44 Years | 91 (100.0%) | 0 (0.0%) |
| 45 to 54 Years | 95 (19.8%) | 364 (75.7%) |
| 55 to 64 Years | 25 (15.1%) | 160 (97.0%) |
| 65 to 74 Years | 148 (100.0%) | 131 (88.5%) |
| 75 Years and over | 293 (100.0%) | 293 (100.0%) |
| Total | 1,012 (52.7%) | 1,270 (66.1%) |
Disability Status by Sex by Age in Rosemount
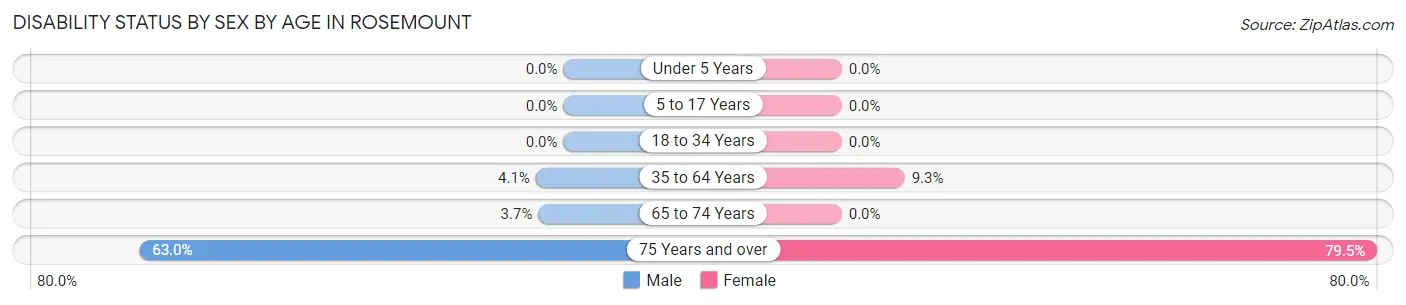
| Age Bracket | Male | Female |
| Under 5 Years | 0 (0.0%) | 0 (0.0%) |
| 5 to 17 Years | 0 (0.0%) | 0 (0.0%) |
| 18 to 34 Years | 0 (0.0%) | 0 (0.0%) |
| 35 to 64 Years | 14 (4.1%) | 37 (9.3%) |
| 65 to 74 Years | 5 (3.7%) | 0 (0.0%) |
| 75 Years and over | 34 (63.0%) | 190 (79.5%) |
Disability Class by Sex by Age in Rosemount
Disability Class: Hearing Difficulty
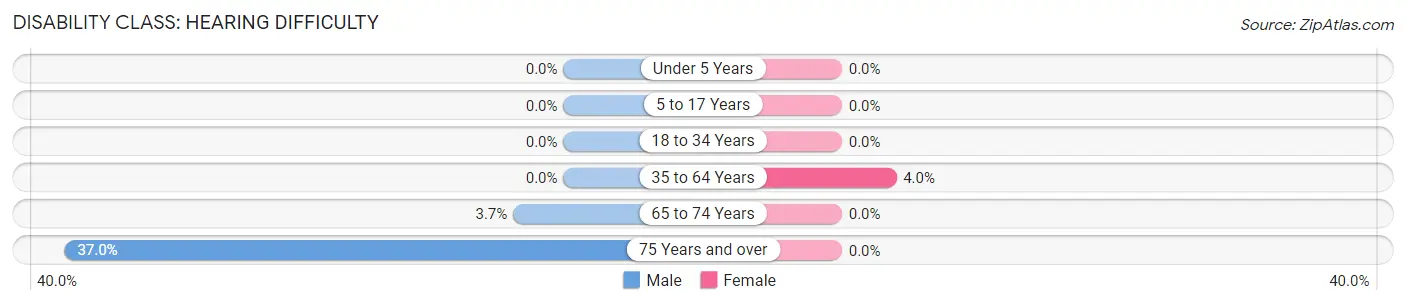
| Age Bracket | Male | Female |
| Under 5 Years | 0 (0.0%) | 0 (0.0%) |
| 5 to 17 Years | 0 (0.0%) | 0 (0.0%) |
| 18 to 34 Years | 0 (0.0%) | 0 (0.0%) |
| 35 to 64 Years | 0 (0.0%) | 16 (4.0%) |
| 65 to 74 Years | 5 (3.7%) | 0 (0.0%) |
| 75 Years and over | 20 (37.0%) | 0 (0.0%) |
Disability Class: Vision Difficulty
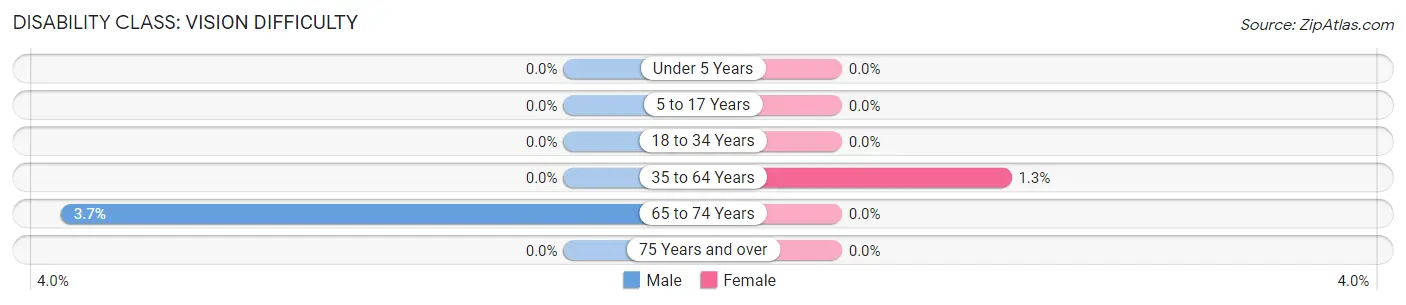
| Age Bracket | Male | Female |
| Under 5 Years | 0 (0.0%) | 0 (0.0%) |
| 5 to 17 Years | 0 (0.0%) | 0 (0.0%) |
| 18 to 34 Years | 0 (0.0%) | 0 (0.0%) |
| 35 to 64 Years | 0 (0.0%) | 5 (1.3%) |
| 65 to 74 Years | 5 (3.7%) | 0 (0.0%) |
| 75 Years and over | 0 (0.0%) | 0 (0.0%) |
Disability Class: Cognitive Difficulty
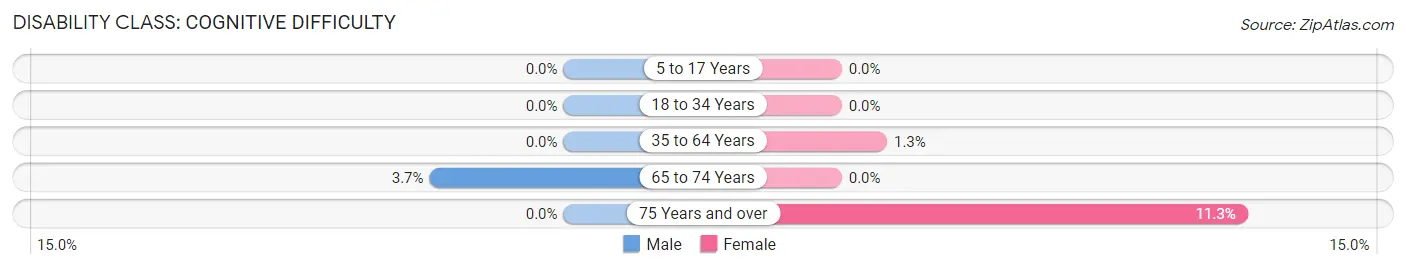
| Age Bracket | Male | Female |
| 5 to 17 Years | 0 (0.0%) | 0 (0.0%) |
| 18 to 34 Years | 0 (0.0%) | 0 (0.0%) |
| 35 to 64 Years | 0 (0.0%) | 5 (1.3%) |
| 65 to 74 Years | 5 (3.7%) | 0 (0.0%) |
| 75 Years and over | 0 (0.0%) | 27 (11.3%) |
Disability Class: Ambulatory Difficulty
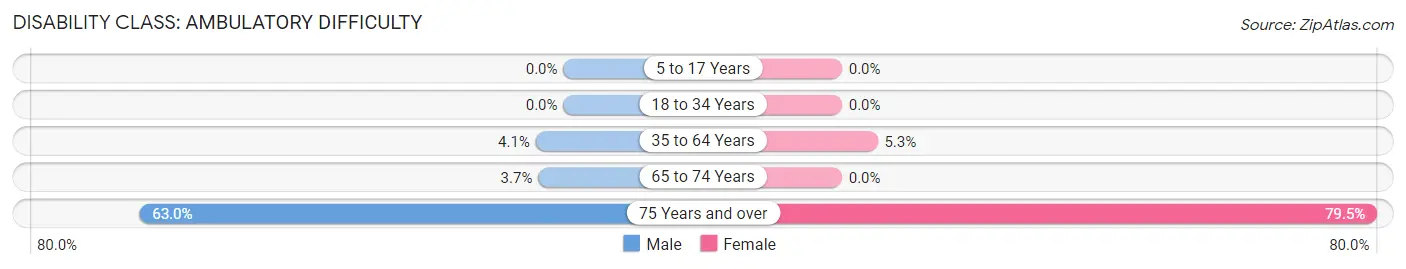
| Age Bracket | Male | Female |
| 5 to 17 Years | 0 (0.0%) | 0 (0.0%) |
| 18 to 34 Years | 0 (0.0%) | 0 (0.0%) |
| 35 to 64 Years | 14 (4.1%) | 21 (5.3%) |
| 65 to 74 Years | 5 (3.7%) | 0 (0.0%) |
| 75 Years and over | 34 (63.0%) | 190 (79.5%) |
Disability Class: Self-Care Difficulty
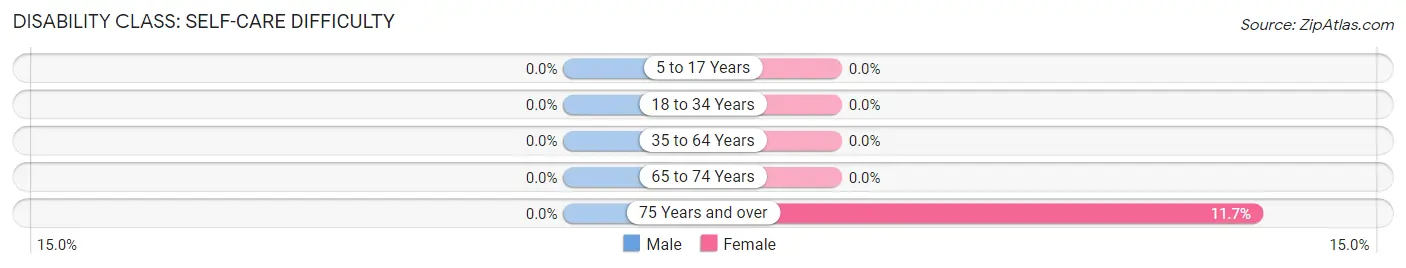
| Age Bracket | Male | Female |
| 5 to 17 Years | 0 (0.0%) | 0 (0.0%) |
| 18 to 34 Years | 0 (0.0%) | 0 (0.0%) |
| 35 to 64 Years | 0 (0.0%) | 0 (0.0%) |
| 65 to 74 Years | 0 (0.0%) | 0 (0.0%) |
| 75 Years and over | 0 (0.0%) | 28 (11.7%) |
Technology Access in Rosemount
Computing Device Access in Rosemount
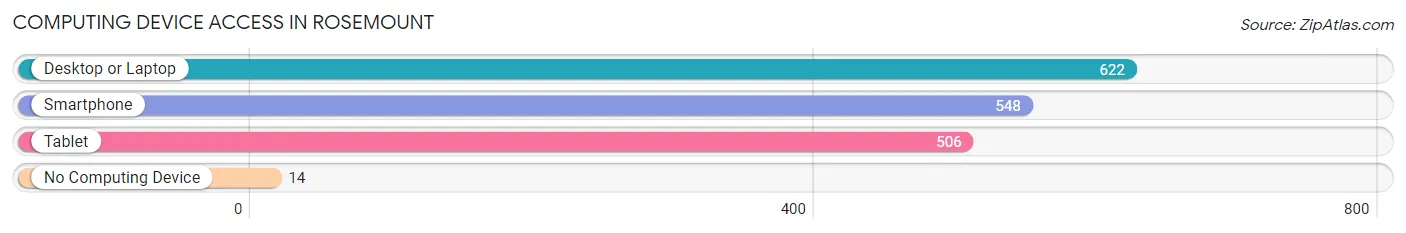
| Device Type | # Households | % Households |
| Desktop or Laptop | 622 | 80.0% |
| Smartphone | 548 | 70.5% |
| Tablet | 506 | 65.1% |
| No Computing Device | 14 | 1.8% |
| Total | 777 | 100.0% |
Internet Access in Rosemount
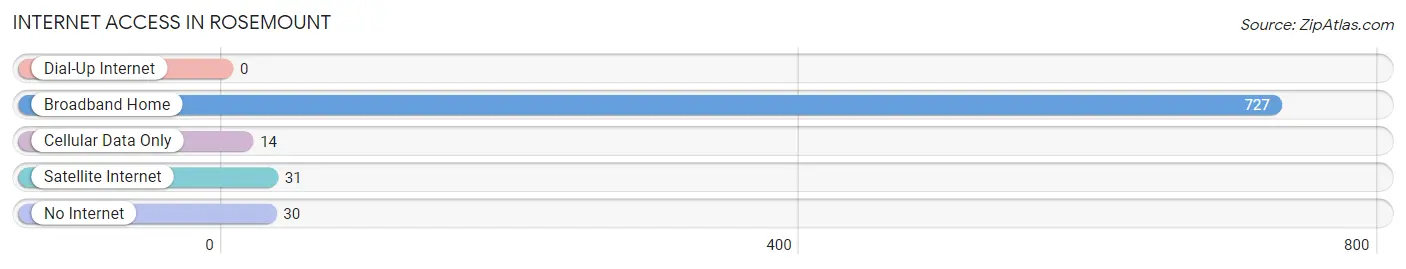
| Internet Type | # Households | % Households |
| Dial-Up Internet | 0 | 0.0% |
| Broadband Home | 727 | 93.6% |
| Cellular Data Only | 14 | 1.8% |
| Satellite Internet | 31 | 4.0% |
| No Internet | 30 | 3.9% |
| Total | 777 | 100.0% |
Rosemount Summary
History
The small village of Rosemount, Ohio is located in the southeastern corner of the state, in the Appalachian foothills. It was first settled in the early 1800s by a group of settlers from Pennsylvania. The village was named after the nearby Rosemount Creek, which was named for the abundance of wild roses that grew along its banks. The first post office was established in 1837, and the village was officially incorporated in 1845.
Rosemount was a small farming community for much of its history, with a population of just over 500 people in the early 1900s. The village was home to a variety of small businesses, including a general store, a blacksmith shop, and a grist mill. The village also had a school, a church, and a few other small businesses.
In the mid-1900s, Rosemount began to experience a period of growth and development. The village was connected to the larger cities of Cincinnati and Columbus by a new highway, and the population began to grow. The village also saw the construction of a new school, a library, and a community center.
Geography
Rosemount is located in the southeastern corner of Ohio, in the Appalachian foothills. The village is situated on the banks of the Rosemount Creek, which flows through the village and into the nearby Ohio River. The village is surrounded by rolling hills and forests, and is located about 25 miles from the larger cities of Cincinnati and Columbus.
The climate in Rosemount is temperate, with hot summers and cold winters. The average annual temperature is around 50 degrees Fahrenheit, and the average annual precipitation is around 40 inches.
Economy
The economy of Rosemount is largely based on agriculture and tourism. The village is home to several small farms, which produce a variety of crops, including corn, soybeans, and wheat. The village also has a few small businesses, including a general store, a hardware store, and a few restaurants.
The village is also a popular tourist destination, due to its proximity to the larger cities of Cincinnati and Columbus. The village is home to several historic sites, including the Rosemount Museum, which houses artifacts from the village’s history. The village also has several parks and recreational areas, including the Rosemount Nature Preserve.
Demographics
As of the 2010 census, the population of Rosemount was 1,093. The racial makeup of the village was 97.3% White, 0.7% African American, 0.3% Native American, 0.2% Asian, and 1.5% from other races. The median household income was $41,250, and the median family income was $50,000. The per capita income was $20,845.
Common Questions
What is Per Capita Income in Rosemount?
Per Capita income in Rosemount is $25,119.
What is the Median Family Income in Rosemount?
Median Family Income in Rosemount is $45,820.
What is the Median Household income in Rosemount?
Median Household Income in Rosemount is $45,117.
What is Income or Wage Gap in Rosemount?
Income or Wage Gap in Rosemount is 32.7%.
Women in Rosemount earn 67.3 cents for every dollar earned by a man.
What is Inequality or Gini Index in Rosemount?
Inequality or Gini Index in Rosemount is 0.42.
What is the Total Population of Rosemount?
Total Population of Rosemount is 2,013.
What is the Total Male Population of Rosemount?
Total Male Population of Rosemount is 864.
What is the Total Female Population of Rosemount?
Total Female Population of Rosemount is 1,149.
What is the Ratio of Males per 100 Females in Rosemount?
There are 75.20 Males per 100 Females in Rosemount.
What is the Ratio of Females per 100 Males in Rosemount?
There are 132.99 Females per 100 Males in Rosemount.
What is the Median Population Age in Rosemount?
Median Population Age in Rosemount is 49.4 Years.
What is the Average Family Size in Rosemount
Average Family Size in Rosemount is 2.7 People.
What is the Average Household Size in Rosemount
Average Household Size in Rosemount is 2.5 People.
How Large is the Labor Force in Rosemount?
There are 1,022 People in the Labor Forcein in Rosemount.
What is the Percentage of People in the Labor Force in Rosemount?
55.8% of People are in the Labor Force in Rosemount.
What is the Unemployment Rate in Rosemount?
Unemployment Rate in Rosemount is 10.9%.