Coalton, OH Map & Demographics
Coalton Map
Coalton Overview
$20,478
PER CAPITA INCOME
$42,966
AVG HOUSEHOLD INCOME
53.8%
WAGE / INCOME GAP [ % ]
46.2¢/ $1
WAGE / INCOME GAP [ $ ]
0.39
INEQUALITY / GINI INDEX
403
TOTAL POPULATION
172
MALE POPULATION
231
FEMALE POPULATION
74.46
MALES / 100 FEMALES
134.30
FEMALES / 100 MALES
53.5
MEDIAN AGE
3.1
AVG FAMILY SIZE
1.9
AVG HOUSEHOLD SIZE
184
LABOR FORCE [ PEOPLE ]
50.8%
PERCENT IN LABOR FORCE
36.4%
UNEMPLOYMENT RATE
Coalton Zip Codes
Coalton Area Codes
Income in Coalton
Income Overview in Coalton
| Characteristic | Number | Measure |
| Per Capita Income | 403 | $20,478 |
| Median Family Income | 55 | $0 |
| Mean Family Income | 55 | $46,724 |
| Median Household Income | 209 | $42,966 |
| Mean Household Income | 209 | $38,730 |
| Income Deficit | 55 | $0 |
| Wage / Income Gap (%) | 403 | 53.83% |
| Wage / Income Gap ($) | 403 | 46.17¢ per $1 |
| Gini / Inequality Index | 403 | 0.39 |
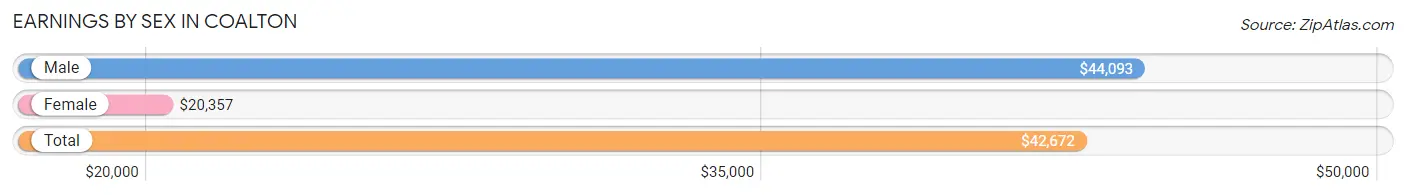
Earnings by Sex in Coalton
Average Earnings in Coalton are $42,672, $44,093 for men and $20,357 for women, a difference of 53.8%.
| Sex | Number | Average Earnings |
| Male | 113 (62.4%) | $44,093 |
| Female | 68 (37.6%) | $20,357 |
| Total | 181 (100.0%) | $42,672 |
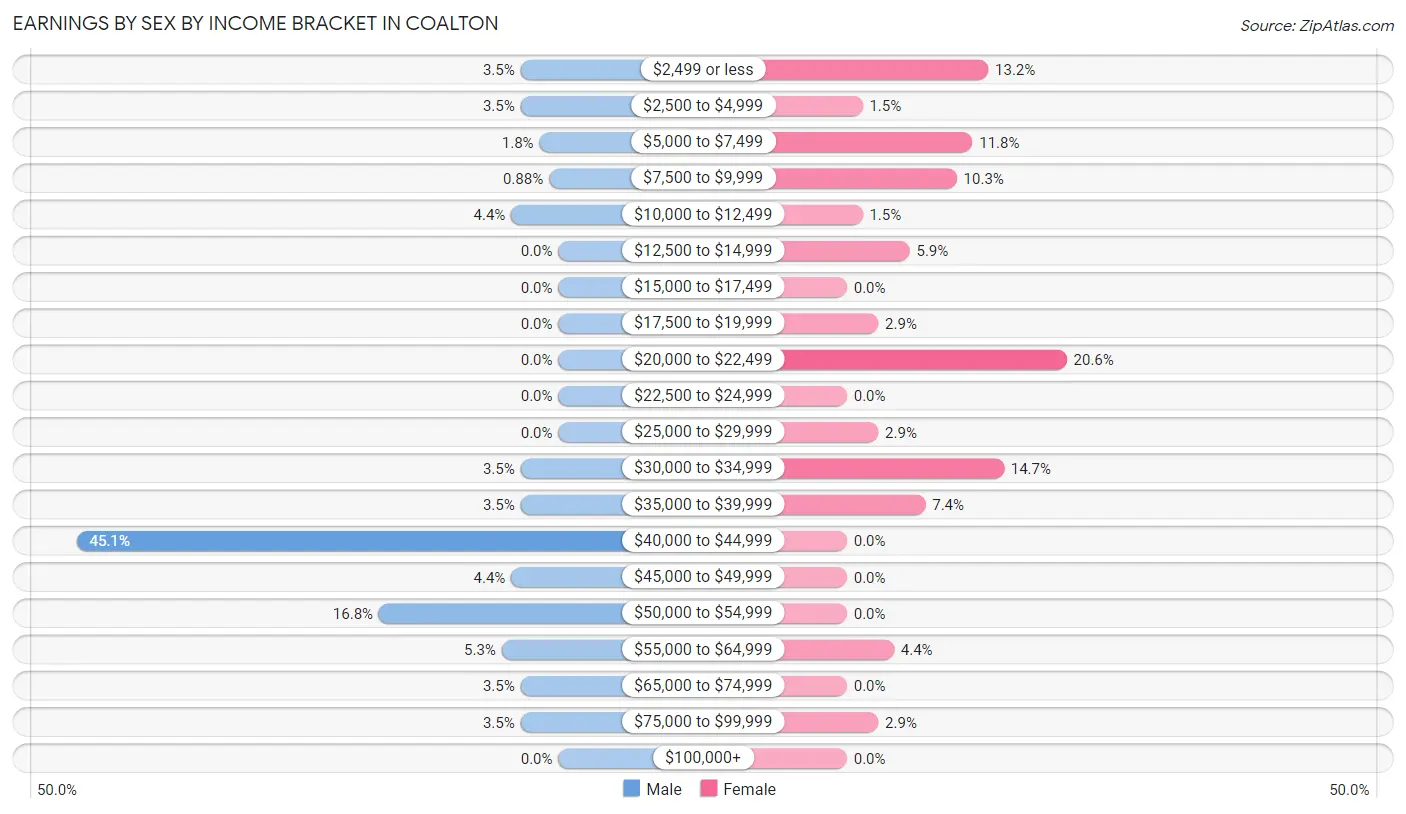
Earnings by Sex by Income Bracket in Coalton
The most common earnings brackets in Coalton are $40,000 to $44,999 for men (51 | 45.1%) and $20,000 to $22,499 for women (14 | 20.6%).
| Income | Male | Female |
| $2,499 or less | 4 (3.5%) | 9 (13.2%) |
| $2,500 to $4,999 | 4 (3.5%) | 1 (1.5%) |
| $5,000 to $7,499 | 2 (1.8%) | 8 (11.8%) |
| $7,500 to $9,999 | 1 (0.9%) | 7 (10.3%) |
| $10,000 to $12,499 | 5 (4.4%) | 1 (1.5%) |
| $12,500 to $14,999 | 0 (0.0%) | 4 (5.9%) |
| $15,000 to $17,499 | 0 (0.0%) | 0 (0.0%) |
| $17,500 to $19,999 | 0 (0.0%) | 2 (2.9%) |
| $20,000 to $22,499 | 0 (0.0%) | 14 (20.6%) |
| $22,500 to $24,999 | 0 (0.0%) | 0 (0.0%) |
| $25,000 to $29,999 | 0 (0.0%) | 2 (2.9%) |
| $30,000 to $34,999 | 4 (3.5%) | 10 (14.7%) |
| $35,000 to $39,999 | 4 (3.5%) | 5 (7.3%) |
| $40,000 to $44,999 | 51 (45.1%) | 0 (0.0%) |
| $45,000 to $49,999 | 5 (4.4%) | 0 (0.0%) |
| $50,000 to $54,999 | 19 (16.8%) | 0 (0.0%) |
| $55,000 to $64,999 | 6 (5.3%) | 3 (4.4%) |
| $65,000 to $74,999 | 4 (3.5%) | 0 (0.0%) |
| $75,000 to $99,999 | 4 (3.5%) | 2 (2.9%) |
| $100,000+ | 0 (0.0%) | 0 (0.0%) |
| Total | 113 (100.0%) | 68 (100.0%) |
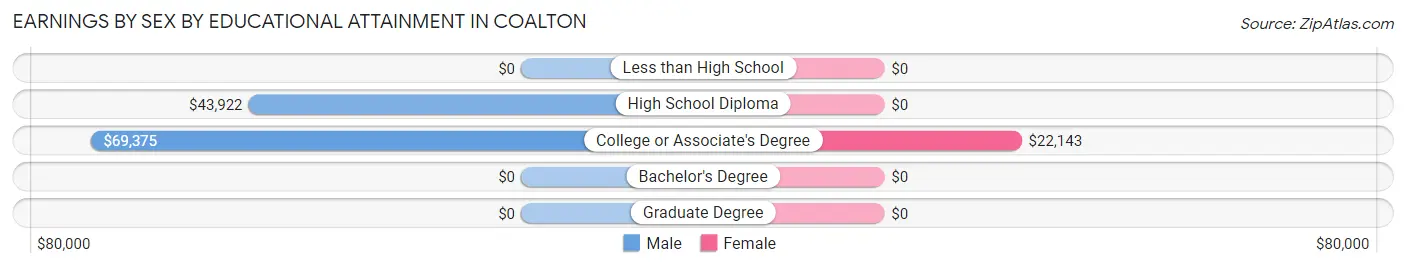
Earnings by Sex by Educational Attainment in Coalton
Average earnings in Coalton are $44,314 for men and $21,518 for women, a difference of 51.4%. Men with an educational attainment of college or associate's degree enjoy the highest average annual earnings of $69,375, while those with high school diploma education earn the least with $43,922. Women with an educational attainment of college or associate's degree earn the most with the average annual earnings of $22,143, while those with college or associate's degree education have the smallest earnings of $22,143.
| Educational Attainment | Male Income | Female Income |
| Less than High School | - | - |
| High School Diploma | $43,922 | $0 |
| College or Associate's Degree | $69,375 | $22,143 |
| Bachelor's Degree | - | - |
| Graduate Degree | - | - |
| Total | $44,314 | $21,518 |
Family Income in Coalton
Family Income Brackets in Coalton
According to the Coalton family income data, there are 14 families falling into the $15,000 to $24,999 income range, which is the most common income bracket and makes up 25.5% of all families.
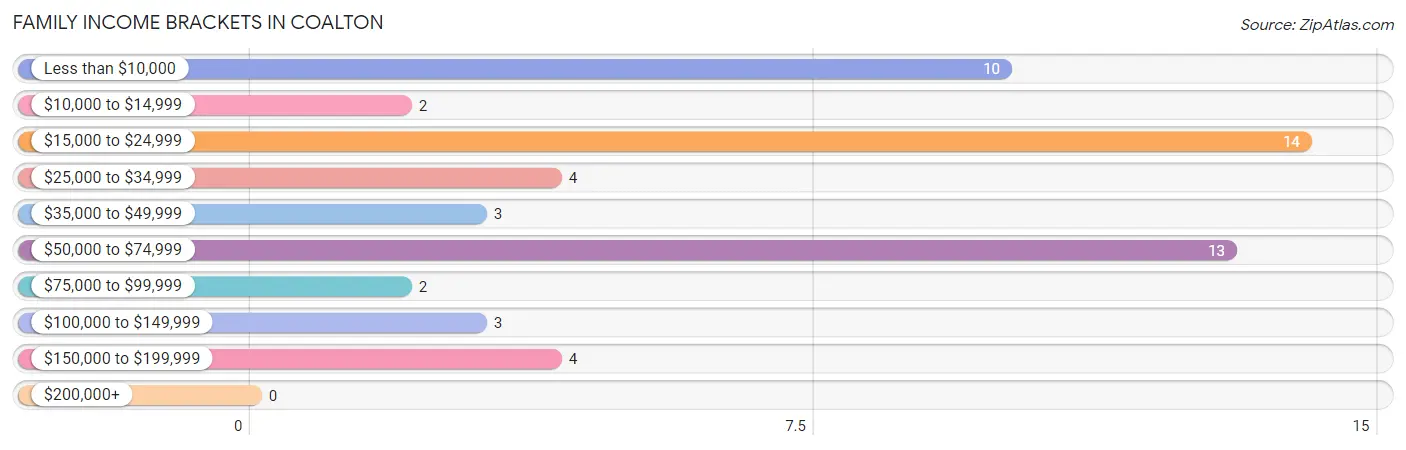
| Income Bracket | # Families | % Families |
| Less than $10,000 | 10 | 18.2% |
| $10,000 to $14,999 | 2 | 3.6% |
| $15,000 to $24,999 | 14 | 25.5% |
| $25,000 to $34,999 | 4 | 7.3% |
| $35,000 to $49,999 | 3 | 5.5% |
| $50,000 to $74,999 | 13 | 23.6% |
| $75,000 to $99,999 | 2 | 3.6% |
| $100,000 to $149,999 | 3 | 5.5% |
| $150,000 to $199,999 | 4 | 7.3% |
| $200,000+ | 0 | 0.0% |
Family Income by Famaliy Size in Coalton
2-person families (22 | 40.0%) account for the highest median family income in Coalton with $58,500 per family, while 2-person families (22 | 40.0%) have the highest median income of $29,250 per family member.
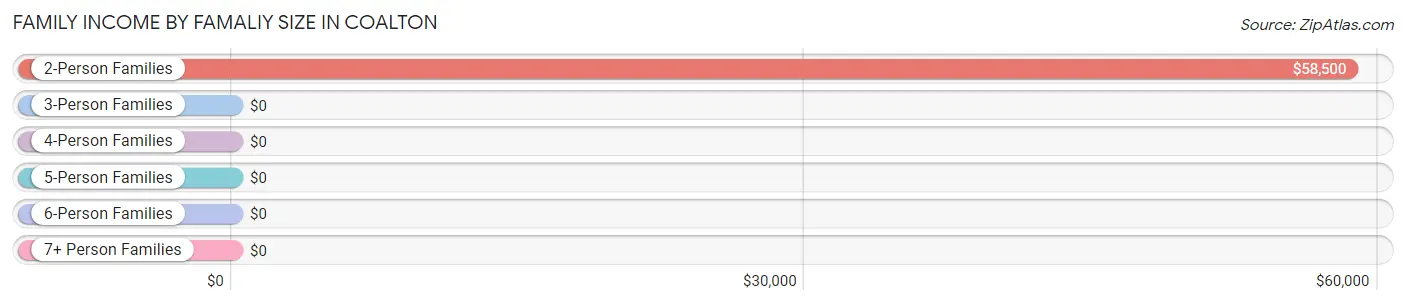
| Income Bracket | # Families | Median Income |
| 2-Person Families | 22 (40.0%) | $58,500 |
| 3-Person Families | 23 (41.8%) | $0 |
| 4-Person Families | 6 (10.9%) | $0 |
| 5-Person Families | 0 (0.0%) | $0 |
| 6-Person Families | 4 (7.3%) | $0 |
| 7+ Person Families | 0 (0.0%) | $0 |
| Total | 55 (100.0%) | $0 |
Family Income by Number of Earners in Coalton
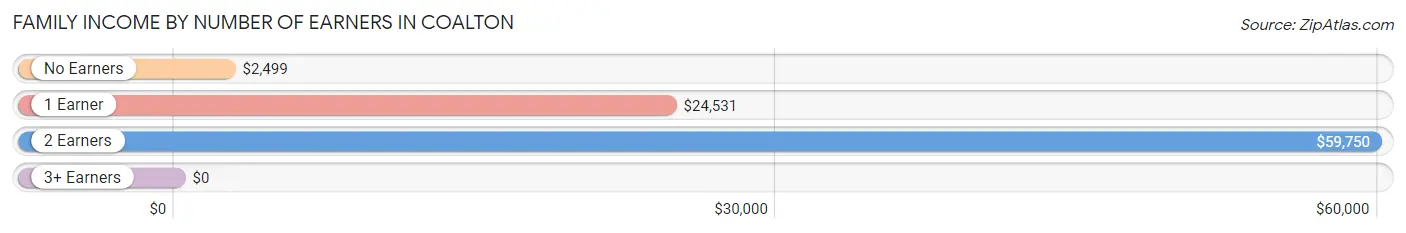
| Number of Earners | # Families | Median Income |
| No Earners | 10 (18.2%) | $2,499 |
| 1 Earner | 17 (30.9%) | $24,531 |
| 2 Earners | 21 (38.2%) | $59,750 |
| 3+ Earners | 7 (12.7%) | $0 |
| Total | 55 (100.0%) | $0 |
Household Income in Coalton
Household Income Brackets in Coalton
With 54 households falling in the category, the $35,000 to $49,999 income range is the most frequent in Coalton, accounting for 25.8% of all households.
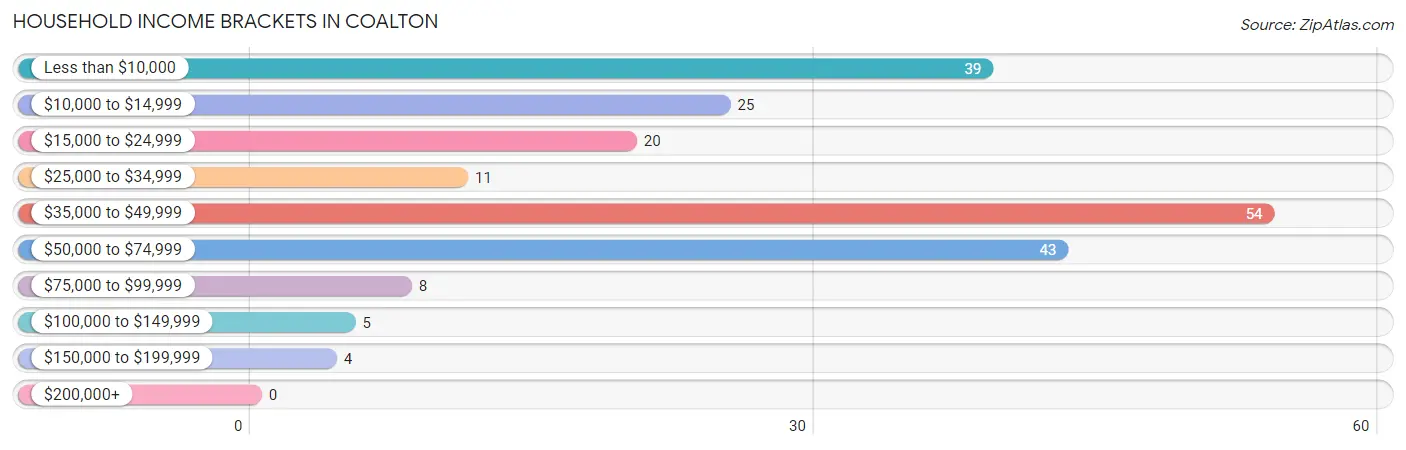
| Income Bracket | # Households | % Households |
| Less than $10,000 | 39 | 18.7% |
| $10,000 to $14,999 | 25 | 12.0% |
| $15,000 to $24,999 | 20 | 9.6% |
| $25,000 to $34,999 | 11 | 5.3% |
| $35,000 to $49,999 | 54 | 25.8% |
| $50,000 to $74,999 | 43 | 20.6% |
| $75,000 to $99,999 | 8 | 3.8% |
| $100,000 to $149,999 | 5 | 2.4% |
| $150,000 to $199,999 | 4 | 1.9% |
| $200,000+ | 0 | 0.0% |
Household Income by Householder Age in Coalton
The median household income in Coalton is $42,966, with the highest median household income of $43,775 found in the 45 to 64 years age bracket for the primary householder. A total of 108 households (51.7%) fall into this category. Meanwhile, the 15 to 24 years age bracket for the primary householder has the lowest median household income of $0, with 3 households (1.4%) in this group.
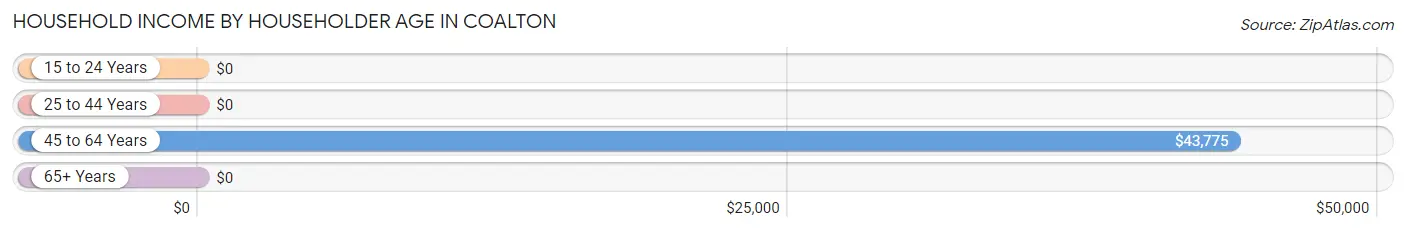
| Income Bracket | # Households | Median Income |
| 15 to 24 Years | 3 (1.4%) | $0 |
| 25 to 44 Years | 27 (12.9%) | $0 |
| 45 to 64 Years | 108 (51.7%) | $43,775 |
| 65+ Years | 71 (34.0%) | $0 |
| Total | 209 (100.0%) | $42,966 |
Poverty in Coalton
Income Below Poverty by Sex and Age in Coalton
With 27.3% poverty level for males and 64.1% for females among the residents of Coalton, 12 to 14 year old males and 6 to 11 year old females are the most vulnerable to poverty, with 6 males (100.0%) and 3 females (100.0%) in their respective age groups living below the poverty level.
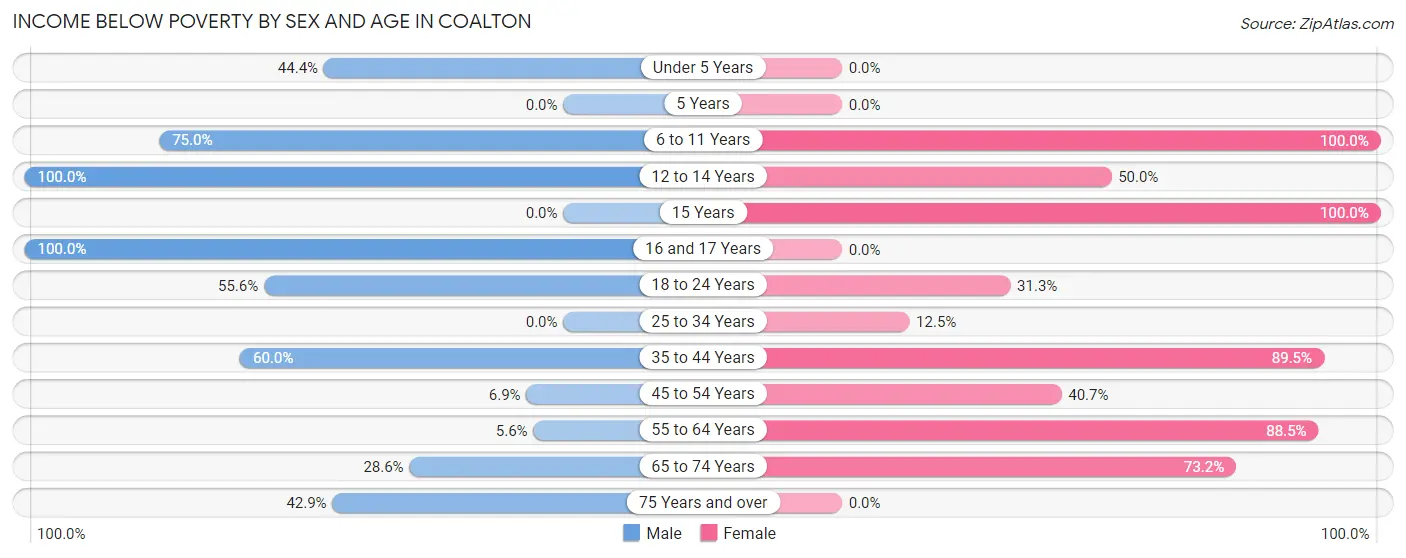
| Age Bracket | Male | Female |
| Under 5 Years | 4 (44.4%) | 0 (0.0%) |
| 5 Years | 0 (0.0%) | 0 (0.0%) |
| 6 to 11 Years | 3 (75.0%) | 3 (100.0%) |
| 12 to 14 Years | 6 (100.0%) | 2 (50.0%) |
| 15 Years | 0 (0.0%) | 9 (100.0%) |
| 16 and 17 Years | 9 (100.0%) | 0 (0.0%) |
| 18 to 24 Years | 5 (55.6%) | 5 (31.2%) |
| 25 to 34 Years | 0 (0.0%) | 2 (12.5%) |
| 35 to 44 Years | 6 (60.0%) | 17 (89.5%) |
| 45 to 54 Years | 5 (6.9%) | 11 (40.7%) |
| 55 to 64 Years | 1 (5.6%) | 69 (88.5%) |
| 65 to 74 Years | 2 (28.6%) | 30 (73.2%) |
| 75 Years and over | 6 (42.9%) | 0 (0.0%) |
| Total | 47 (27.3%) | 148 (64.1%) |
Income Above Poverty by Sex and Age in Coalton
According to the poverty statistics in Coalton, males aged 25 to 34 years and females aged under 5 years are the age groups that are most secure financially, with 100.0% of males and 100.0% of females in these age groups living above the poverty line.
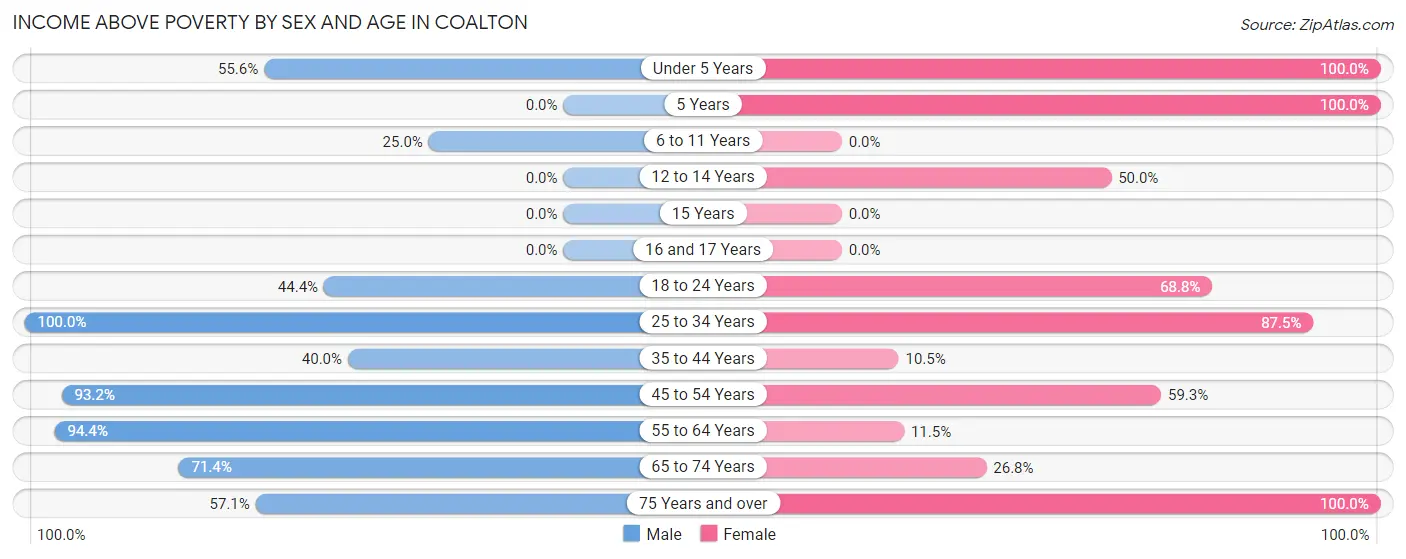
| Age Bracket | Male | Female |
| Under 5 Years | 5 (55.6%) | 4 (100.0%) |
| 5 Years | 0 (0.0%) | 2 (100.0%) |
| 6 to 11 Years | 1 (25.0%) | 0 (0.0%) |
| 12 to 14 Years | 0 (0.0%) | 2 (50.0%) |
| 15 Years | 0 (0.0%) | 0 (0.0%) |
| 16 and 17 Years | 0 (0.0%) | 0 (0.0%) |
| 18 to 24 Years | 4 (44.4%) | 11 (68.8%) |
| 25 to 34 Years | 13 (100.0%) | 14 (87.5%) |
| 35 to 44 Years | 4 (40.0%) | 2 (10.5%) |
| 45 to 54 Years | 68 (93.1%) | 16 (59.3%) |
| 55 to 64 Years | 17 (94.4%) | 9 (11.5%) |
| 65 to 74 Years | 5 (71.4%) | 11 (26.8%) |
| 75 Years and over | 8 (57.1%) | 12 (100.0%) |
| Total | 125 (72.7%) | 83 (35.9%) |
Income Below Poverty Among Married-Couple Families in Coalton
The poverty statistics for married-couple families in Coalton show that 28.1% or 9 of the total 32 families live below the poverty line. Families with 3 or 4 children have the highest poverty rate of 100.0%, comprising of 4 families. On the other hand, families with no children have the lowest poverty rate of 0.0%, which includes 0 families.
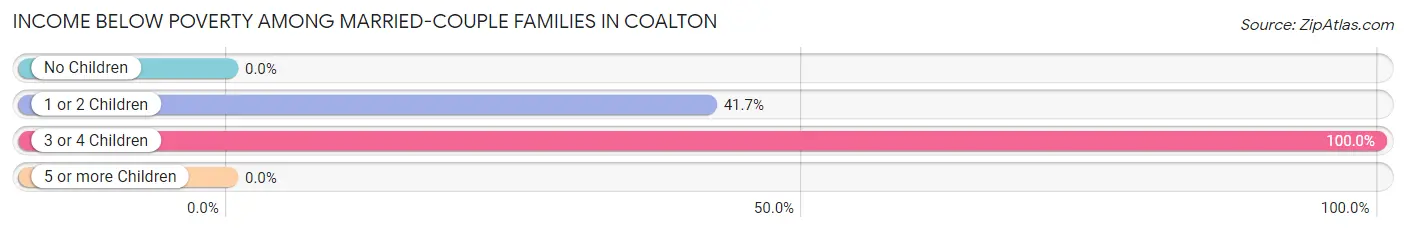
| Children | Above Poverty | Below Poverty |
| No Children | 16 (100.0%) | 0 (0.0%) |
| 1 or 2 Children | 7 (58.3%) | 5 (41.7%) |
| 3 or 4 Children | 0 (0.0%) | 4 (100.0%) |
| 5 or more Children | 0 (0.0%) | 0 (0.0%) |
| Total | 23 (71.9%) | 9 (28.1%) |
Income Below Poverty Among Single-Parent Households in Coalton
According to the poverty data in Coalton, 40.0% or 4 single-father households and 61.5% or 8 single-mother households are living below the poverty line. Among single-father households, those with 1 or 2 children have the highest poverty rate, with 2 households (50.0%) experiencing poverty. Likewise, among single-mother households, those with 1 or 2 children have the highest poverty rate, with 8 households (100.0%) falling below the poverty line.
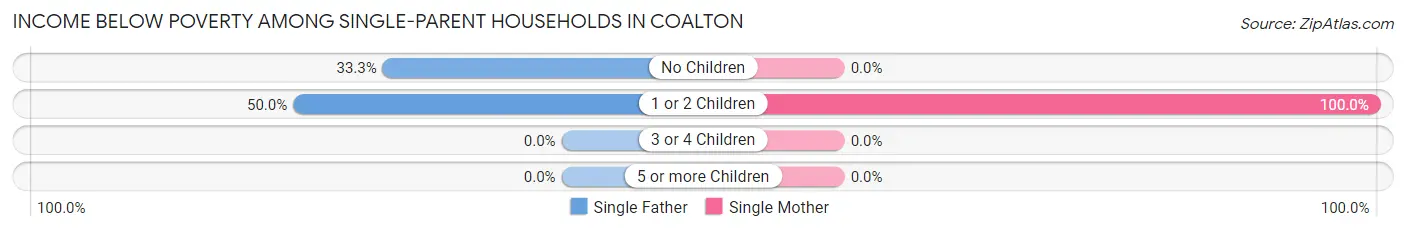
| Children | Single Father | Single Mother |
| No Children | 2 (33.3%) | 0 (0.0%) |
| 1 or 2 Children | 2 (50.0%) | 8 (100.0%) |
| 3 or 4 Children | 0 (0.0%) | 0 (0.0%) |
| 5 or more Children | 0 (0.0%) | 0 (0.0%) |
| Total | 4 (40.0%) | 8 (61.5%) |
Income Below Poverty Among Married-Couple vs Single-Parent Households in Coalton
The poverty data for Coalton shows that 9 of the married-couple family households (28.1%) and 12 of the single-parent households (52.2%) are living below the poverty level. Within the married-couple family households, those with 3 or 4 children have the highest poverty rate, with 4 households (100.0%) falling below the poverty line. Among the single-parent households, those with 1 or 2 children have the highest poverty rate, with 10 household (83.3%) living below poverty.
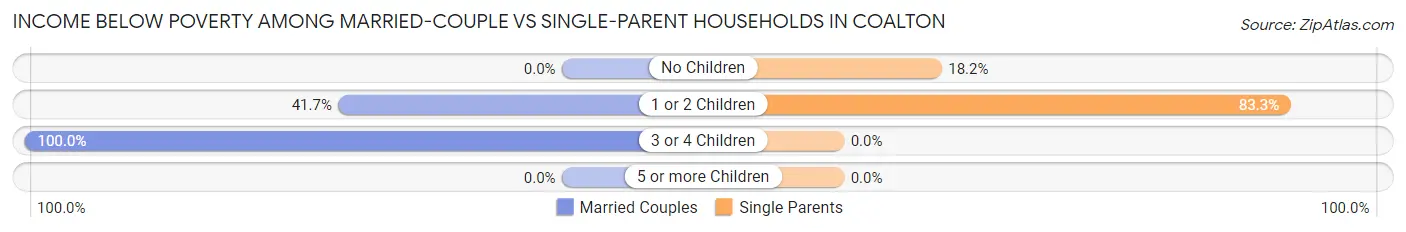
| Children | Married-Couple Families | Single-Parent Households |
| No Children | 0 (0.0%) | 2 (18.2%) |
| 1 or 2 Children | 5 (41.7%) | 10 (83.3%) |
| 3 or 4 Children | 4 (100.0%) | 0 (0.0%) |
| 5 or more Children | 0 (0.0%) | 0 (0.0%) |
| Total | 9 (28.1%) | 12 (52.2%) |
Race in Coalton
The most populous races in Coalton are , and White / Caucasian (403 | 100.0%).
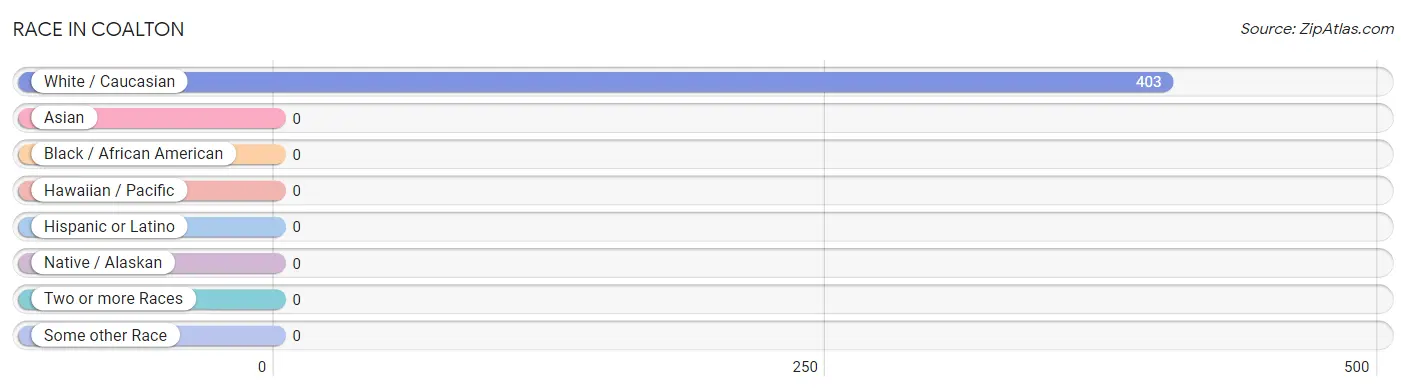
| Race | # Population | % Population |
| Asian | 0 | 0.0% |
| Black / African American | 0 | 0.0% |
| Hawaiian / Pacific | 0 | 0.0% |
| Hispanic or Latino | 0 | 0.0% |
| Native / Alaskan | 0 | 0.0% |
| White / Caucasian | 403 | 100.0% |
| Two or more Races | 0 | 0.0% |
| Some other Race | 0 | 0.0% |
| Total | 403 | 100.0% |
Ancestry in Coalton
The most populous ancestries reported in Coalton are English (113 | 28.0%), Italian (36 | 8.9%), Irish (33 | 8.2%), French (21 | 5.2%), and German (21 | 5.2%), together accounting for 55.6% of all Coalton residents.
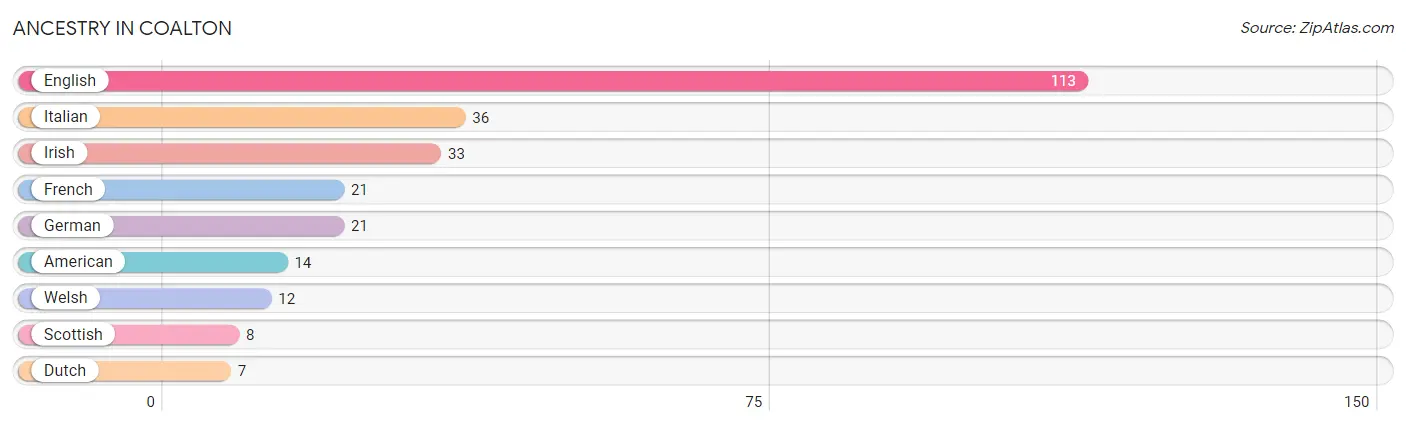
| Ancestry | # Population | % Population |
| American | 14 | 3.5% |
| Dutch | 7 | 1.7% |
| English | 113 | 28.0% |
| French | 21 | 5.2% |
| German | 21 | 5.2% |
| Irish | 33 | 8.2% |
| Italian | 36 | 8.9% |
| Scottish | 8 | 2.0% |
| Welsh | 12 | 3.0% | View All 9 Rows |
Immigrants in Coalton

| Immigration Origin | # Population | % Population | View All 0 Rows |
Sex and Age in Coalton
Sex and Age in Coalton
The most populous age groups in Coalton are 50 to 54 Years (53 | 30.8%) for men and 55 to 59 Years (71 | 30.7%) for women.
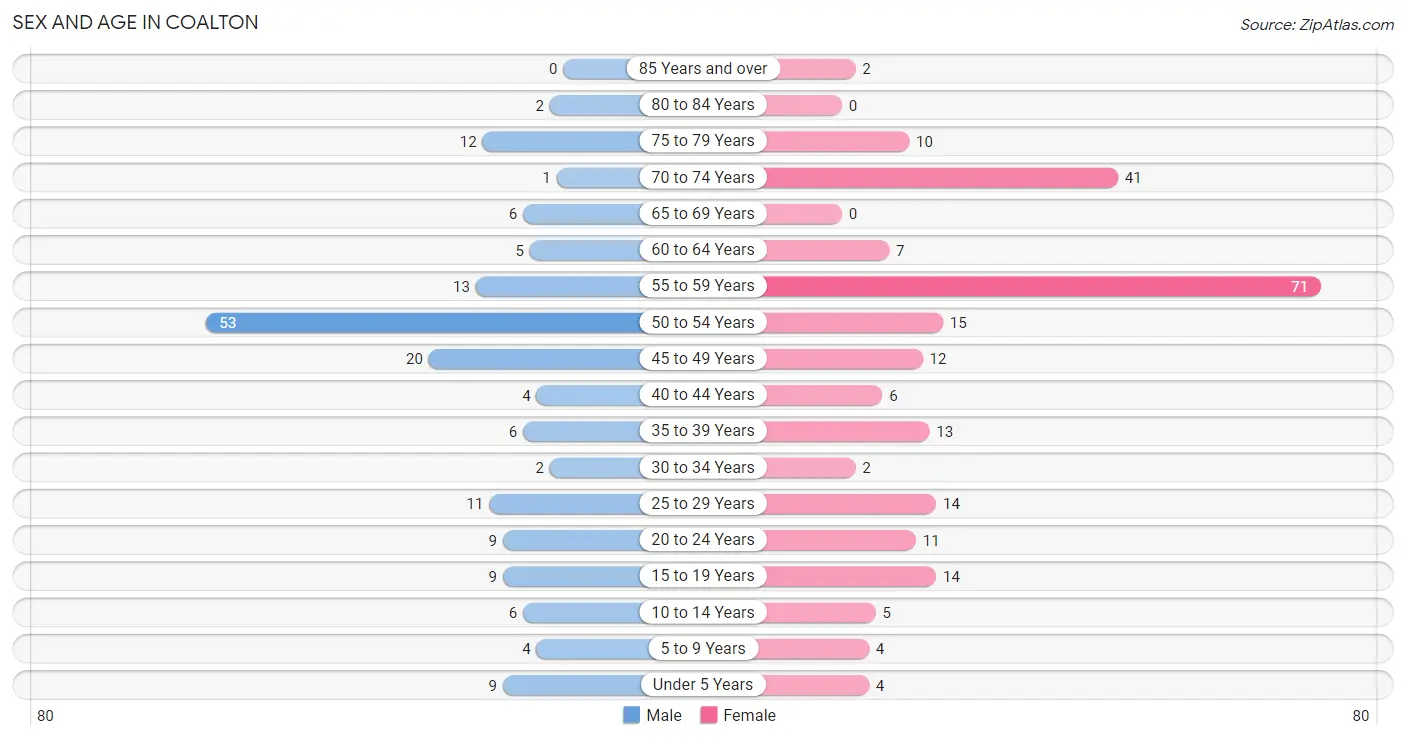
| Age Bracket | Male | Female |
| Under 5 Years | 9 (5.2%) | 4 (1.7%) |
| 5 to 9 Years | 4 (2.3%) | 4 (1.7%) |
| 10 to 14 Years | 6 (3.5%) | 5 (2.2%) |
| 15 to 19 Years | 9 (5.2%) | 14 (6.1%) |
| 20 to 24 Years | 9 (5.2%) | 11 (4.8%) |
| 25 to 29 Years | 11 (6.4%) | 14 (6.1%) |
| 30 to 34 Years | 2 (1.2%) | 2 (0.9%) |
| 35 to 39 Years | 6 (3.5%) | 13 (5.6%) |
| 40 to 44 Years | 4 (2.3%) | 6 (2.6%) |
| 45 to 49 Years | 20 (11.6%) | 12 (5.2%) |
| 50 to 54 Years | 53 (30.8%) | 15 (6.5%) |
| 55 to 59 Years | 13 (7.6%) | 71 (30.7%) |
| 60 to 64 Years | 5 (2.9%) | 7 (3.0%) |
| 65 to 69 Years | 6 (3.5%) | 0 (0.0%) |
| 70 to 74 Years | 1 (0.6%) | 41 (17.7%) |
| 75 to 79 Years | 12 (7.0%) | 10 (4.3%) |
| 80 to 84 Years | 2 (1.2%) | 0 (0.0%) |
| 85 Years and over | 0 (0.0%) | 2 (0.9%) |
| Total | 172 (100.0%) | 231 (100.0%) |
Families and Households in Coalton
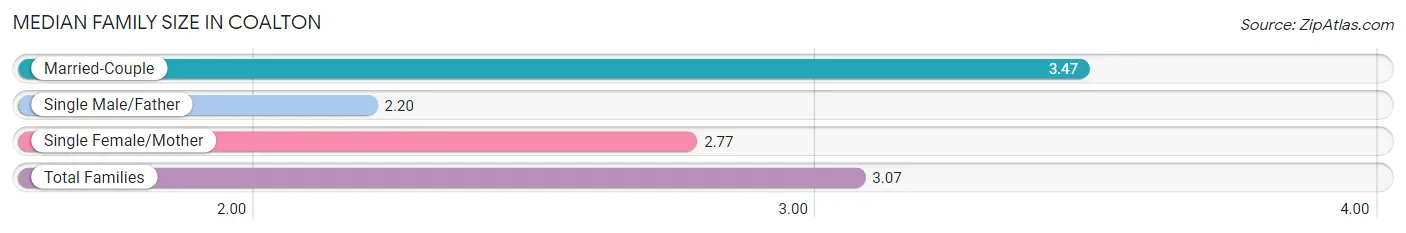
Median Family Size in Coalton
The median family size in Coalton is 3.07 persons per family, with married-couple families (32 | 58.2%) accounting for the largest median family size of 3.47 persons per family. On the other hand, single male/father families (10 | 18.2%) represent the smallest median family size with 2.20 persons per family.
| Family Type | # Families | Family Size |
| Married-Couple | 32 (58.2%) | 3.47 |
| Single Male/Father | 10 (18.2%) | 2.20 |
| Single Female/Mother | 13 (23.6%) | 2.77 |
| Total Families | 55 (100.0%) | 3.07 |
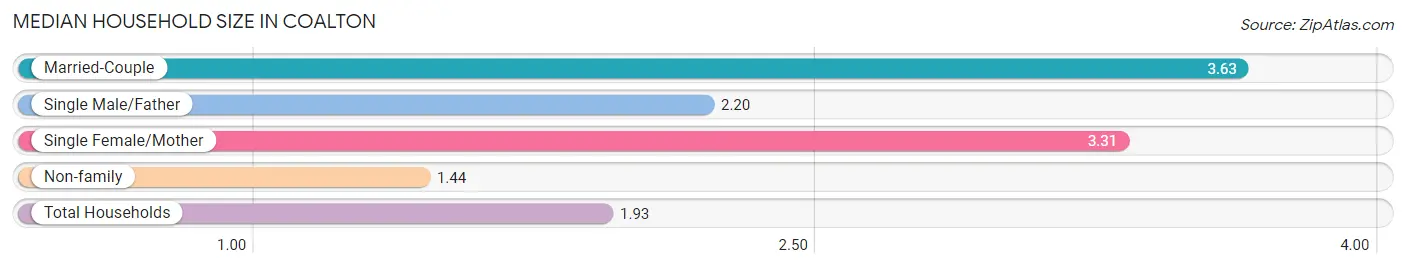
Median Household Size in Coalton
The median household size in Coalton is 1.93 persons per household, with married-couple households (32 | 15.3%) accounting for the largest median household size of 3.63 persons per household. non-family households (154 | 73.7%) represent the smallest median household size with 1.44 persons per household.
| Household Type | # Households | Household Size |
| Married-Couple | 32 (15.3%) | 3.63 |
| Single Male/Father | 10 (4.8%) | 2.20 |
| Single Female/Mother | 13 (6.2%) | 3.31 |
| Non-family | 154 (73.7%) | 1.44 |
| Total Households | 209 (100.0%) | 1.93 |
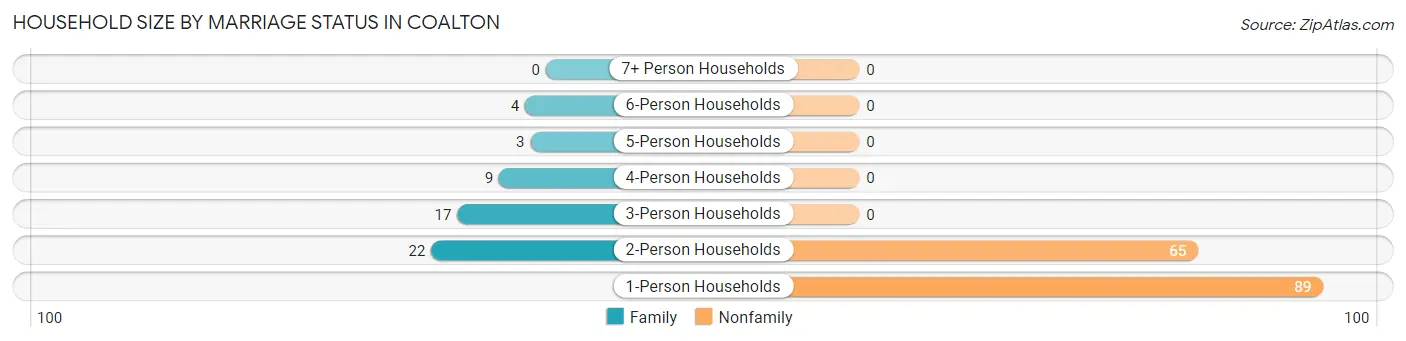
Household Size by Marriage Status in Coalton
Out of a total of 209 households in Coalton, 55 (26.3%) are family households, while 154 (73.7%) are nonfamily households. The most numerous type of family households are 2-person households, comprising 22, and the most common type of nonfamily households are 1-person households, comprising 89.
| Household Size | Family Households | Nonfamily Households |
| 1-Person Households | - | 89 (42.6%) |
| 2-Person Households | 22 (10.5%) | 65 (31.1%) |
| 3-Person Households | 17 (8.1%) | 0 (0.0%) |
| 4-Person Households | 9 (4.3%) | 0 (0.0%) |
| 5-Person Households | 3 (1.4%) | 0 (0.0%) |
| 6-Person Households | 4 (1.9%) | 0 (0.0%) |
| 7+ Person Households | 0 (0.0%) | 0 (0.0%) |
| Total | 55 (26.3%) | 154 (73.7%) |
Female Fertility in Coalton
Fertility by Age in Coalton
| Age Bracket | Women with Births | Births / 1,000 Women |
| 15 to 19 years | 0 (0.0%) | 0.0 |
| 20 to 34 years | 0 (0.0%) | 0.0 |
| 35 to 50 years | 0 (0.0%) | 0.0 |
| Total | 0 (0.0%) | 0.0 |
Fertility by Age by Marriage Status in Coalton
| Age Bracket | Married | Unmarried |
| 15 to 19 years | 0 (0.0%) | 0 (0.0%) |
| 20 to 34 years | 0 (0.0%) | 0 (0.0%) |
| 35 to 50 years | 0 (0.0%) | 0 (0.0%) |
| Total | 0 (0.0%) | 0 (0.0%) |
Fertility by Education in Coalton
| Educational Attainment | Women with Births | Births / 1,000 Women |
| Less than High School | 0 (0.0%) | 0.0 |
| High School Diploma | 0 (0.0%) | 0.0 |
| College or Associate's Degree | 0 (0.0%) | 0.0 |
| Bachelor's Degree | 0 (0.0%) | 0.0 |
| Graduate Degree | 0 (0.0%) | 0.0 |
| Total | 0 (0.0%) | 0.0 |
Fertility by Education by Marriage Status in Coalton
| Educational Attainment | Married | Unmarried |
| Less than High School | 0 (0.0%) | 0 (0.0%) |
| High School Diploma | 0 (0.0%) | 0 (0.0%) |
| College or Associate's Degree | 0 (0.0%) | 0 (0.0%) |
| Bachelor's Degree | 0 (0.0%) | 0 (0.0%) |
| Graduate Degree | 0 (0.0%) | 0 (0.0%) |
| Total | 0 (0.0%) | 0 (0.0%) |
Employment Characteristics in Coalton
Employment by Class of Employer in Coalton
Among the 117 employed individuals in Coalton, private company employees (87 | 74.4%), local government employees (14 | 12.0%), and not-for-profit organizations (8 | 6.8%) make up the most common classes of employment.
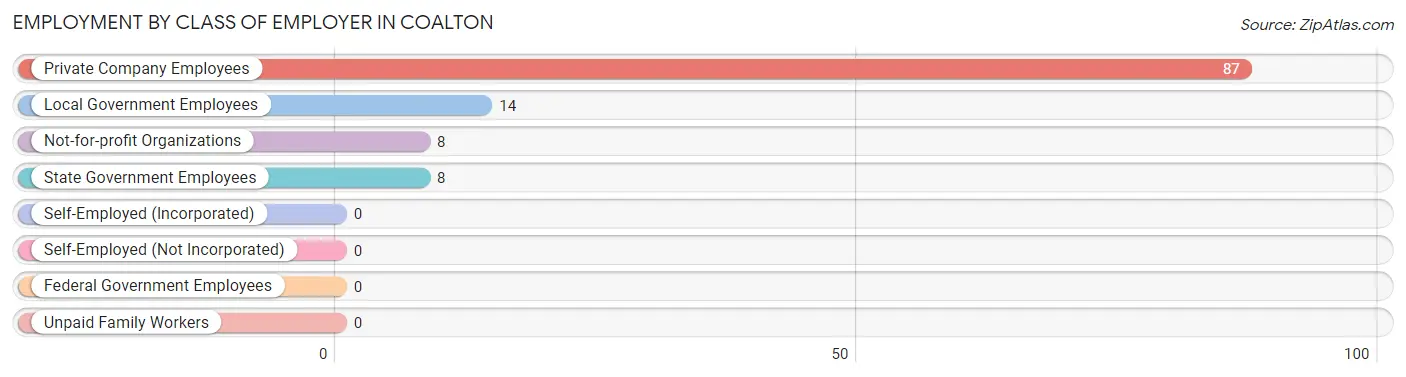
| Employer Class | # Employees | % Employees |
| Private Company Employees | 87 | 74.4% |
| Self-Employed (Incorporated) | 0 | 0.0% |
| Self-Employed (Not Incorporated) | 0 | 0.0% |
| Not-for-profit Organizations | 8 | 6.8% |
| Local Government Employees | 14 | 12.0% |
| State Government Employees | 8 | 6.8% |
| Federal Government Employees | 0 | 0.0% |
| Unpaid Family Workers | 0 | 0.0% |
| Total | 117 | 100.0% |
Employment Status by Age in Coalton
According to the labor force statistics for Coalton, out of the total population over 16 years of age (362), 50.8% or 184 individuals are in the labor force, with 36.4% or 67 of them unemployed. The age group with the highest labor force participation rate is 25 to 29 years, with 100.0% or 25 individuals in the labor force. Within the labor force, the 45 to 54 years age range has the highest percentage of unemployed individuals, with 60.0% or 51 of them being unemployed.
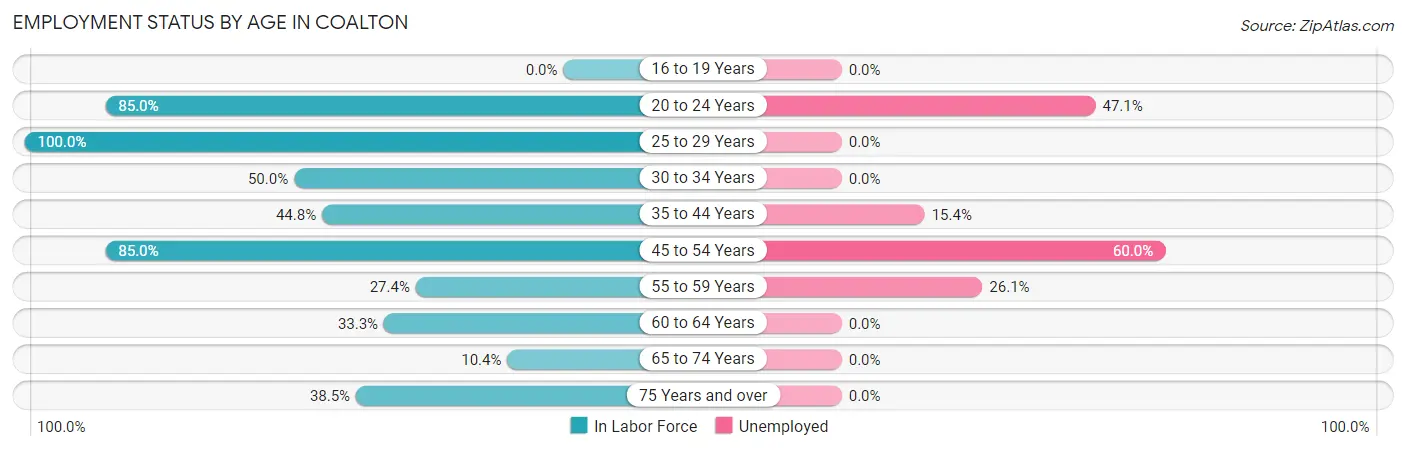
| Age Bracket | In Labor Force | Unemployed |
| 16 to 19 Years | 0 (0.0%) | 0 (0.0%) |
| 20 to 24 Years | 17 (85.0%) | 8 (47.1%) |
| 25 to 29 Years | 25 (100.0%) | 0 (0.0%) |
| 30 to 34 Years | 2 (50.0%) | 0 (0.0%) |
| 35 to 44 Years | 13 (44.8%) | 2 (15.4%) |
| 45 to 54 Years | 85 (85.0%) | 51 (60.0%) |
| 55 to 59 Years | 23 (27.4%) | 6 (26.1%) |
| 60 to 64 Years | 4 (33.3%) | 0 (0.0%) |
| 65 to 74 Years | 5 (10.4%) | 0 (0.0%) |
| 75 Years and over | 10 (38.5%) | 0 (0.0%) |
| Total | 184 (50.8%) | 67 (36.4%) |
Employment Status by Educational Attainment in Coalton
According to labor force statistics for Coalton, 59.8% of individuals (152) out of the total population between 25 and 64 years of age (254) are in the labor force, with 38.8% or 59 of them being unemployed. The group with the highest labor force participation rate are those with the educational attainment of bachelor's degree or higher, with 100.0% or 12 individuals in the labor force. Within the labor force, individuals with high school diploma education have the highest percentage of unemployment, with 65.6% or 59 of them being unemployed.
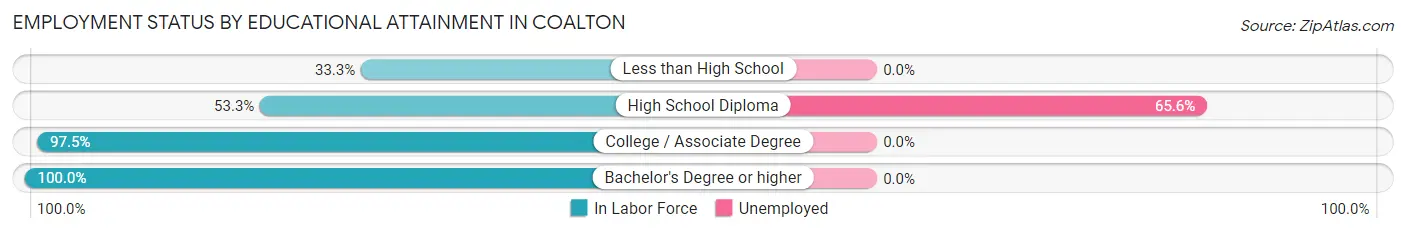
| Educational Attainment | In Labor Force | Unemployed |
| Less than High School | 11 (33.3%) | 0 (0.0%) |
| High School Diploma | 90 (53.3%) | 111 (65.6%) |
| College / Associate Degree | 39 (97.5%) | 0 (0.0%) |
| Bachelor's Degree or higher | 12 (100.0%) | 0 (0.0%) |
| Total | 152 (59.8%) | 99 (38.8%) |
Employment Occupations by Sex in Coalton
Management, Business, Science and Arts Occupations
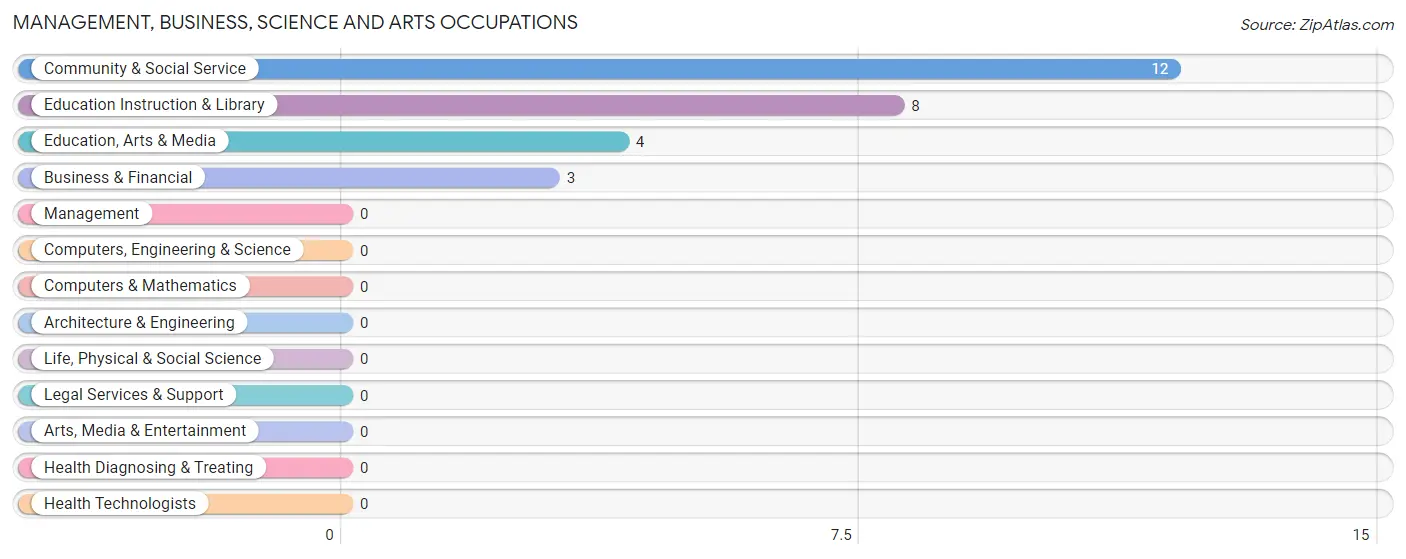
The most common Management, Business, Science and Arts occupations in Coalton are Community & Social Service (12 | 10.3%), Education Instruction & Library (8 | 6.8%), Education, Arts & Media (4 | 3.4%), and Business & Financial (3 | 2.6%).
Management, Business, Science and Arts Occupations by Sex
Within the Management, Business, Science and Arts occupations in Coalton, the most male-oriented occupations are Education Instruction & Library (75.0%), and Community & Social Service (50.0%), while the most female-oriented occupations are Business & Financial (100.0%), Education, Arts & Media (100.0%), and Community & Social Service (50.0%).
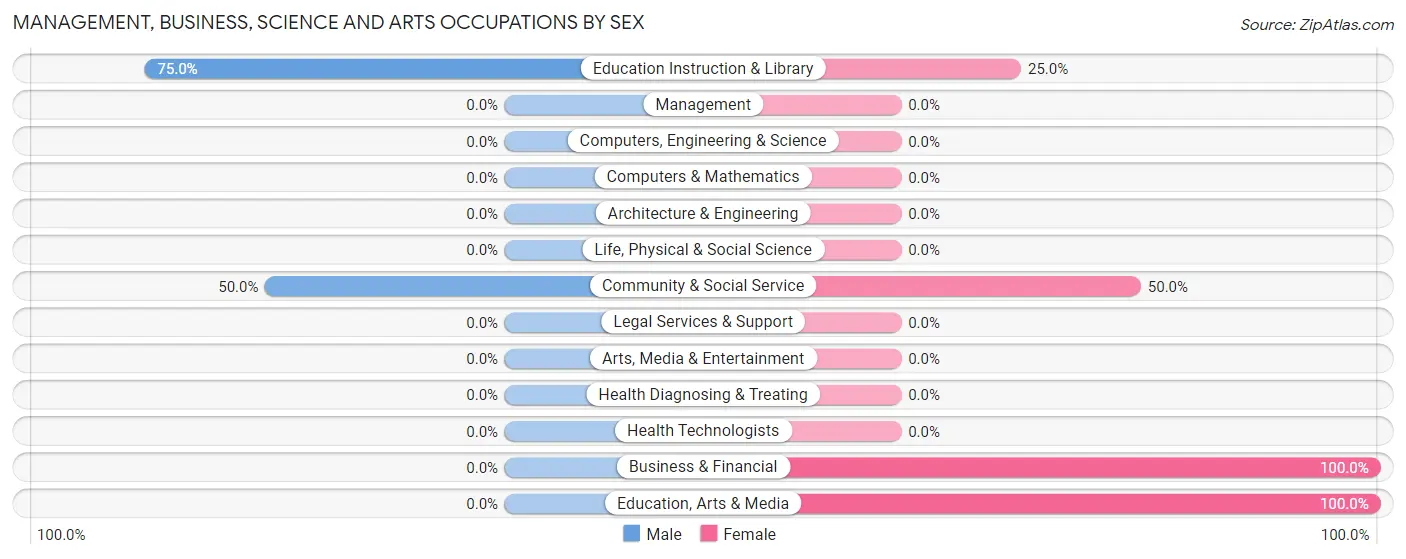
| Occupation | Male | Female |
| Management | 0 (0.0%) | 0 (0.0%) |
| Business & Financial | 0 (0.0%) | 3 (100.0%) |
| Computers, Engineering & Science | 0 (0.0%) | 0 (0.0%) |
| Computers & Mathematics | 0 (0.0%) | 0 (0.0%) |
| Architecture & Engineering | 0 (0.0%) | 0 (0.0%) |
| Life, Physical & Social Science | 0 (0.0%) | 0 (0.0%) |
| Community & Social Service | 6 (50.0%) | 6 (50.0%) |
| Education, Arts & Media | 0 (0.0%) | 4 (100.0%) |
| Legal Services & Support | 0 (0.0%) | 0 (0.0%) |
| Education Instruction & Library | 6 (75.0%) | 2 (25.0%) |
| Arts, Media & Entertainment | 0 (0.0%) | 0 (0.0%) |
| Health Diagnosing & Treating | 0 (0.0%) | 0 (0.0%) |
| Health Technologists | 0 (0.0%) | 0 (0.0%) |
| Total (Category) | 6 (40.0%) | 9 (60.0%) |
| Total (Overall) | 57 (48.7%) | 60 (51.3%) |
Services Occupations
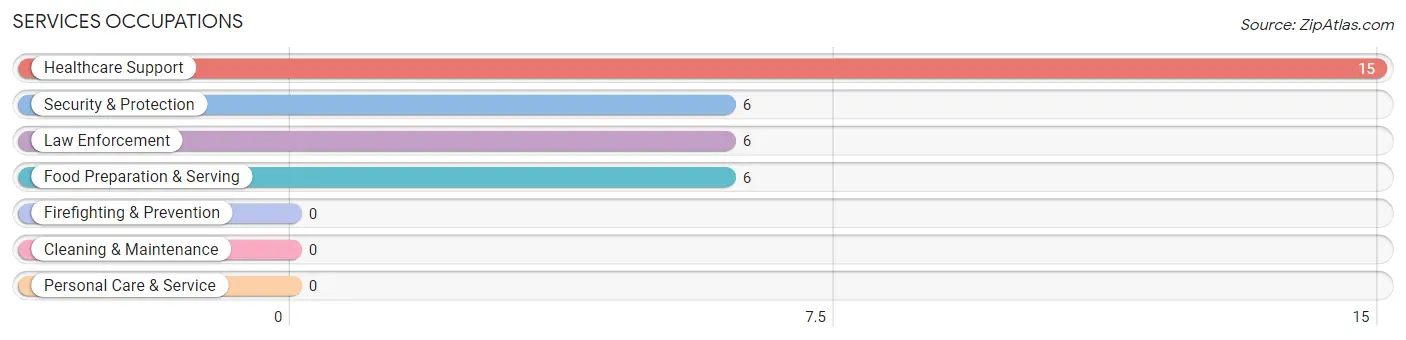
The most common Services occupations in Coalton are Healthcare Support (15 | 12.8%), Security & Protection (6 | 5.1%), Law Enforcement (6 | 5.1%), and Food Preparation & Serving (6 | 5.1%).
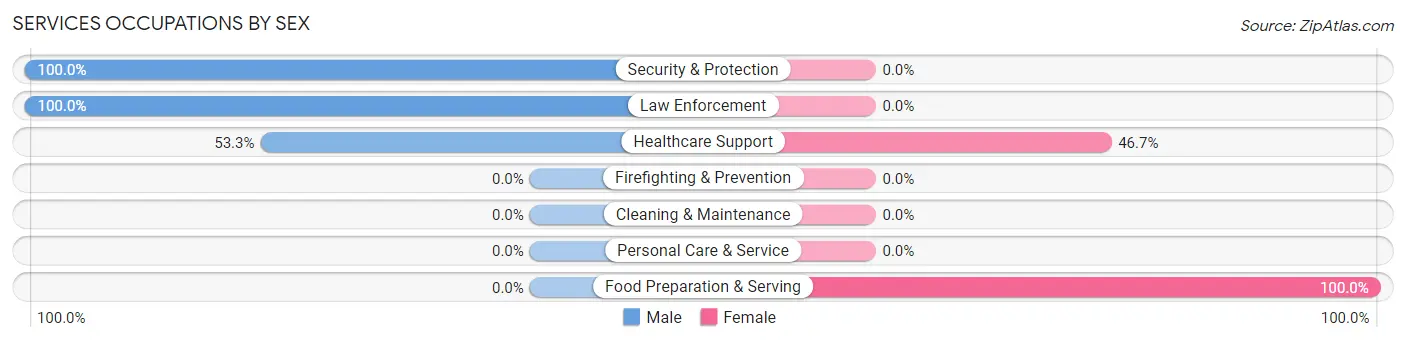
Services Occupations by Sex
Within the Services occupations in Coalton, the most male-oriented occupations are Security & Protection (100.0%), Law Enforcement (100.0%), and Healthcare Support (53.3%), while the most female-oriented occupations are Food Preparation & Serving (100.0%), and Healthcare Support (46.7%).
| Occupation | Male | Female |
| Healthcare Support | 8 (53.3%) | 7 (46.7%) |
| Security & Protection | 6 (100.0%) | 0 (0.0%) |
| Firefighting & Prevention | 0 (0.0%) | 0 (0.0%) |
| Law Enforcement | 6 (100.0%) | 0 (0.0%) |
| Food Preparation & Serving | 0 (0.0%) | 6 (100.0%) |
| Cleaning & Maintenance | 0 (0.0%) | 0 (0.0%) |
| Personal Care & Service | 0 (0.0%) | 0 (0.0%) |
| Total (Category) | 14 (51.8%) | 13 (48.1%) |
| Total (Overall) | 57 (48.7%) | 60 (51.3%) |
Sales and Office Occupations
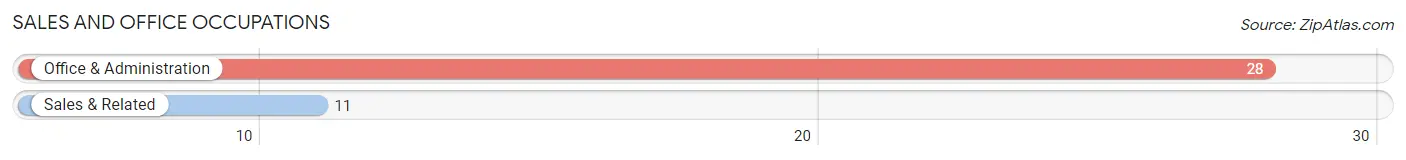
The most common Sales and Office occupations in Coalton are Office & Administration (28 | 23.9%), and Sales & Related (11 | 9.4%).
Sales and Office Occupations by Sex
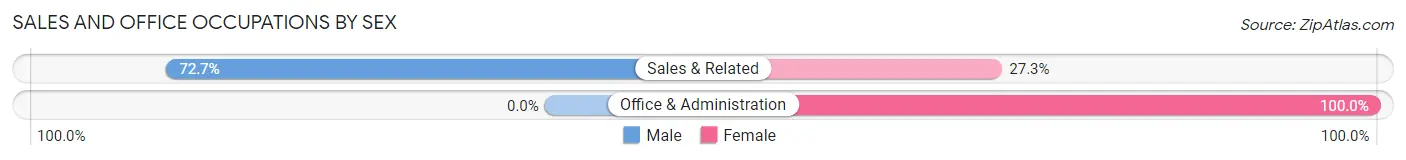
| Occupation | Male | Female |
| Sales & Related | 8 (72.7%) | 3 (27.3%) |
| Office & Administration | 0 (0.0%) | 28 (100.0%) |
| Total (Category) | 8 (20.5%) | 31 (79.5%) |
| Total (Overall) | 57 (48.7%) | 60 (51.3%) |
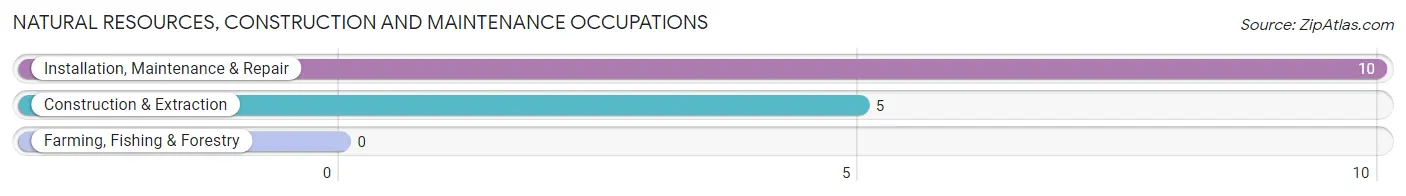
Natural Resources, Construction and Maintenance Occupations
The most common Natural Resources, Construction and Maintenance occupations in Coalton are Installation, Maintenance & Repair (10 | 8.6%), and Construction & Extraction (5 | 4.3%).
Natural Resources, Construction and Maintenance Occupations by Sex
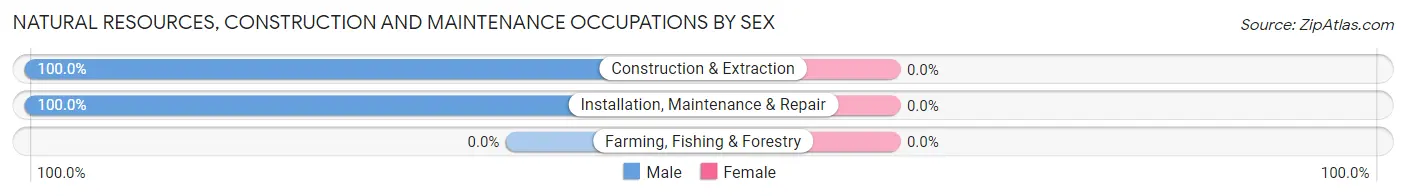
| Occupation | Male | Female |
| Farming, Fishing & Forestry | 0 (0.0%) | 0 (0.0%) |
| Construction & Extraction | 5 (100.0%) | 0 (0.0%) |
| Installation, Maintenance & Repair | 10 (100.0%) | 0 (0.0%) |
| Total (Category) | 15 (100.0%) | 0 (0.0%) |
| Total (Overall) | 57 (48.7%) | 60 (51.3%) |
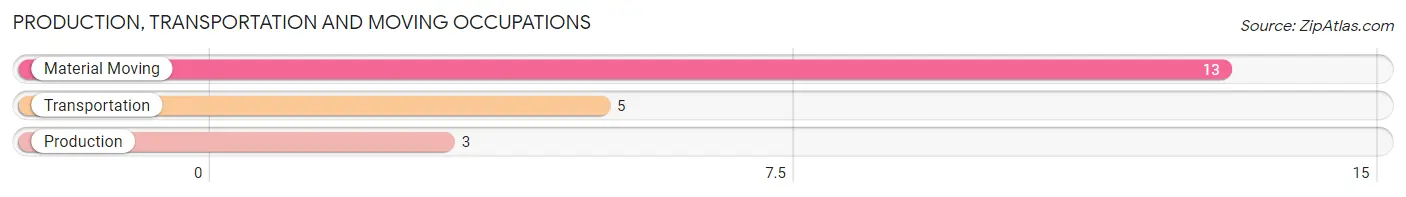
Production, Transportation and Moving Occupations
The most common Production, Transportation and Moving occupations in Coalton are Material Moving (13 | 11.1%), Transportation (5 | 4.3%), and Production (3 | 2.6%).
Production, Transportation and Moving Occupations by Sex
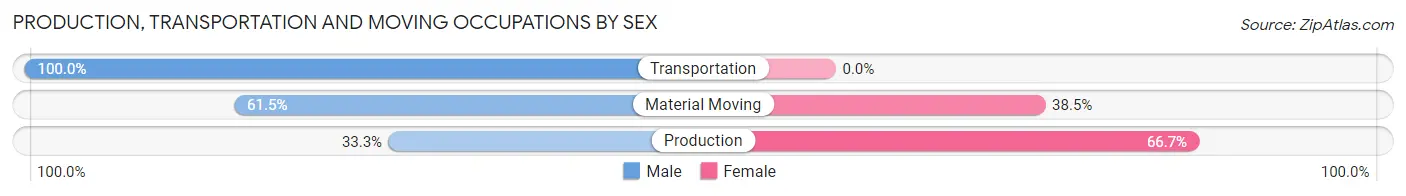
| Occupation | Male | Female |
| Production | 1 (33.3%) | 2 (66.7%) |
| Transportation | 5 (100.0%) | 0 (0.0%) |
| Material Moving | 8 (61.5%) | 5 (38.5%) |
| Total (Category) | 14 (66.7%) | 7 (33.3%) |
| Total (Overall) | 57 (48.7%) | 60 (51.3%) |
Employment Industries by Sex in Coalton
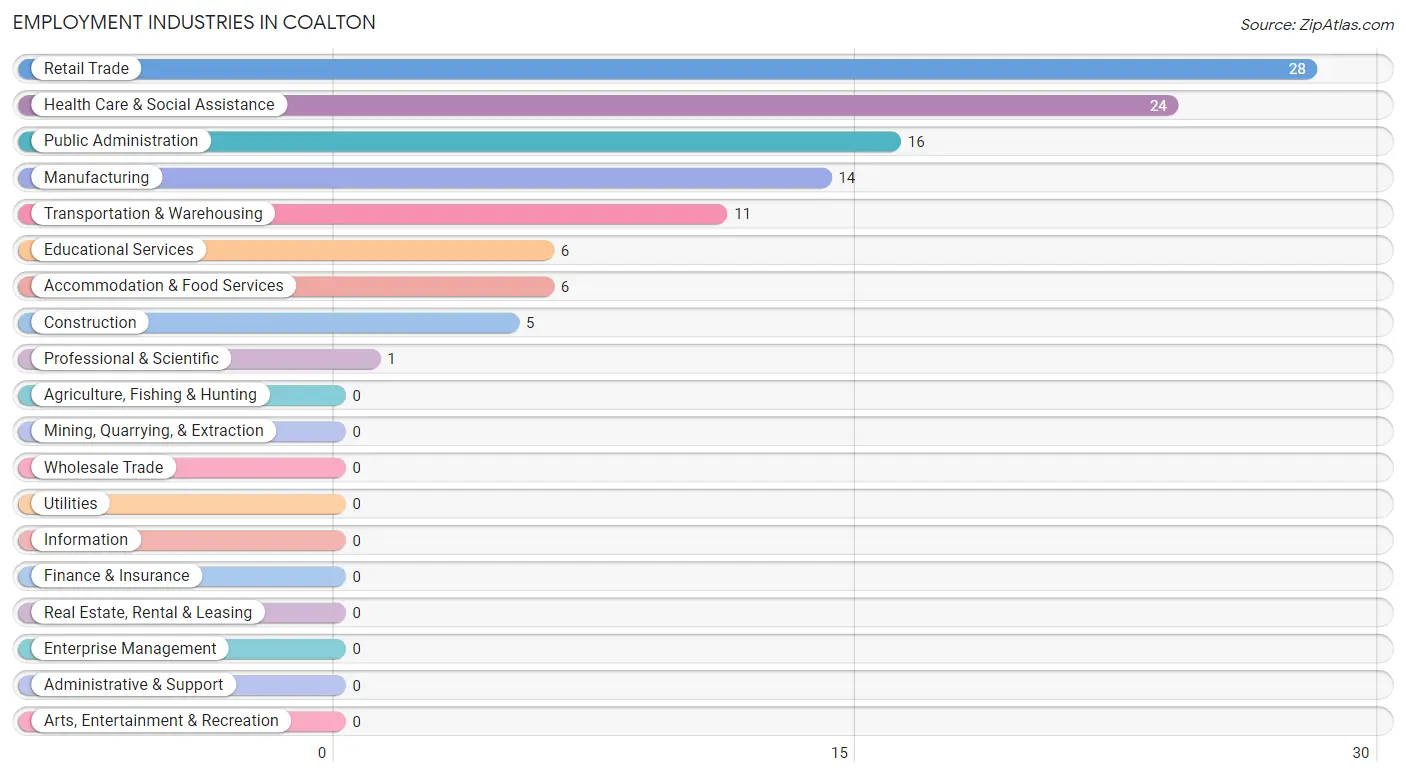
Employment Industries in Coalton
The major employment industries in Coalton include Retail Trade (28 | 23.9%), Health Care & Social Assistance (24 | 20.5%), Public Administration (16 | 13.7%), Manufacturing (14 | 12.0%), and Transportation & Warehousing (11 | 9.4%).
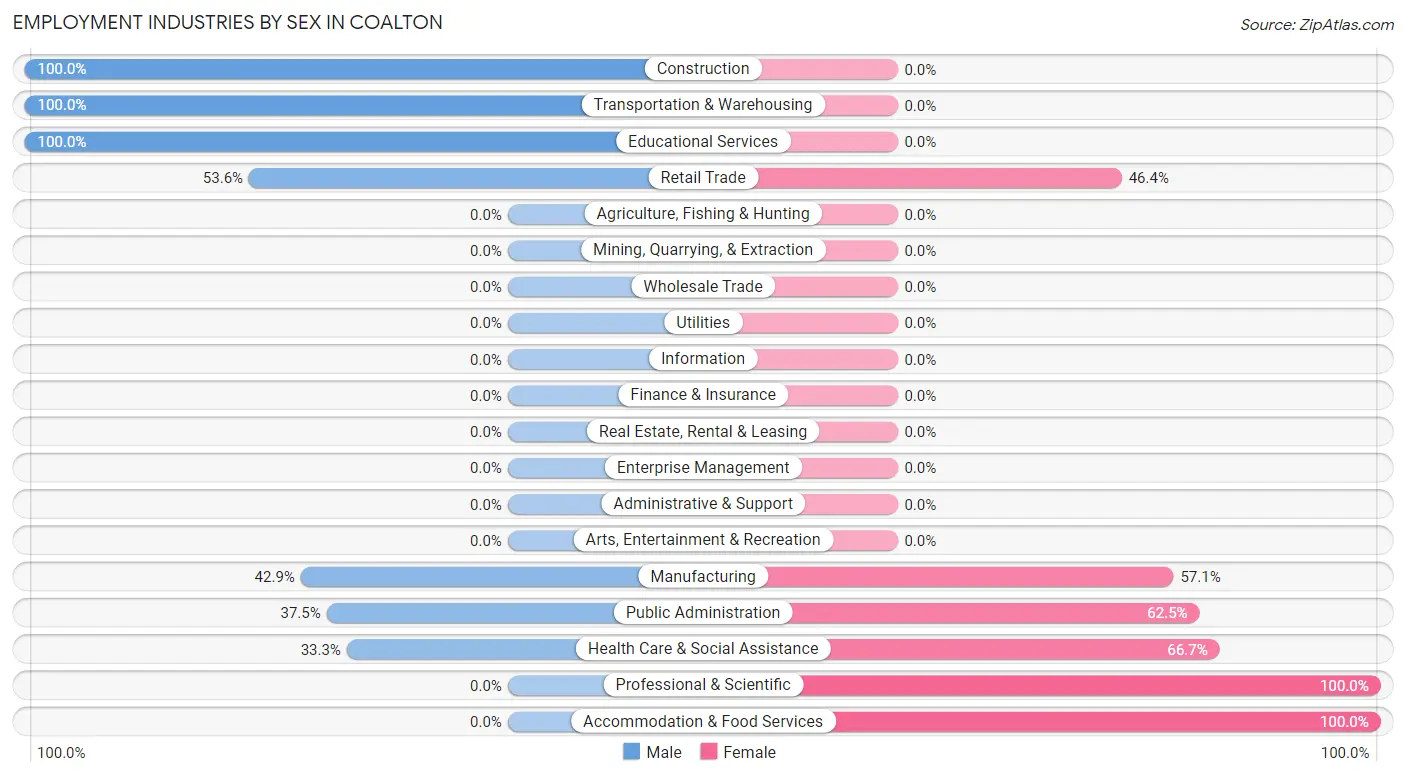
Employment Industries by Sex in Coalton
The Coalton industries that see more men than women are Construction (100.0%), Transportation & Warehousing (100.0%), and Educational Services (100.0%), whereas the industries that tend to have a higher number of women are Professional & Scientific (100.0%), Accommodation & Food Services (100.0%), and Health Care & Social Assistance (66.7%).
| Industry | Male | Female |
| Agriculture, Fishing & Hunting | 0 (0.0%) | 0 (0.0%) |
| Mining, Quarrying, & Extraction | 0 (0.0%) | 0 (0.0%) |
| Construction | 5 (100.0%) | 0 (0.0%) |
| Manufacturing | 6 (42.9%) | 8 (57.1%) |
| Wholesale Trade | 0 (0.0%) | 0 (0.0%) |
| Retail Trade | 15 (53.6%) | 13 (46.4%) |
| Transportation & Warehousing | 11 (100.0%) | 0 (0.0%) |
| Utilities | 0 (0.0%) | 0 (0.0%) |
| Information | 0 (0.0%) | 0 (0.0%) |
| Finance & Insurance | 0 (0.0%) | 0 (0.0%) |
| Real Estate, Rental & Leasing | 0 (0.0%) | 0 (0.0%) |
| Professional & Scientific | 0 (0.0%) | 1 (100.0%) |
| Enterprise Management | 0 (0.0%) | 0 (0.0%) |
| Administrative & Support | 0 (0.0%) | 0 (0.0%) |
| Educational Services | 6 (100.0%) | 0 (0.0%) |
| Health Care & Social Assistance | 8 (33.3%) | 16 (66.7%) |
| Arts, Entertainment & Recreation | 0 (0.0%) | 0 (0.0%) |
| Accommodation & Food Services | 0 (0.0%) | 6 (100.0%) |
| Public Administration | 6 (37.5%) | 10 (62.5%) |
| Total | 57 (48.7%) | 60 (51.3%) |
Education in Coalton
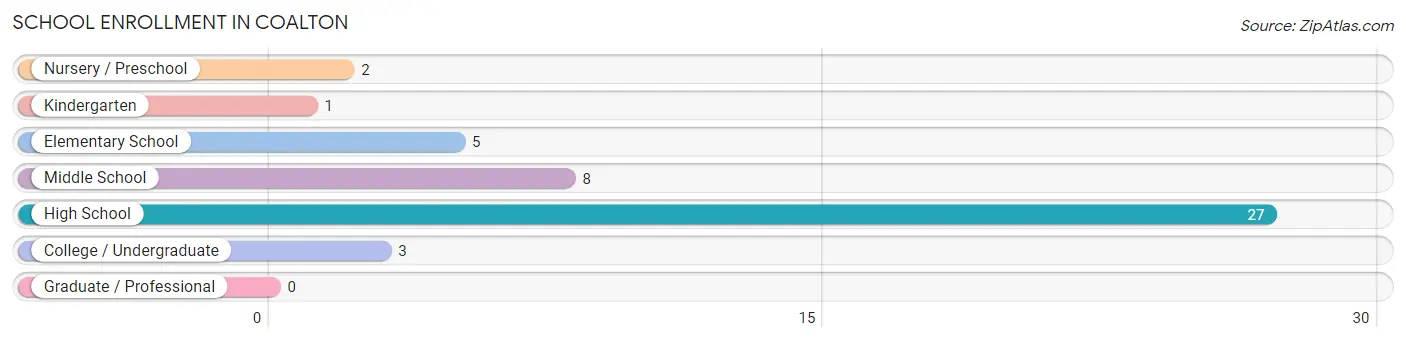
School Enrollment in Coalton
The most common levels of schooling among the 46 students in Coalton are high school (27 | 58.7%), middle school (8 | 17.4%), and elementary school (5 | 10.9%).
| School Level | # Students | % Students |
| Nursery / Preschool | 2 | 4.3% |
| Kindergarten | 1 | 2.2% |
| Elementary School | 5 | 10.9% |
| Middle School | 8 | 17.4% |
| High School | 27 | 58.7% |
| College / Undergraduate | 3 | 6.5% |
| Graduate / Professional | 0 | 0.0% |
| Total | 46 | 100.0% |
School Enrollment by Age by Funding Source in Coalton
Out of a total of 46 students who are enrolled in schools in Coalton, 17 (37.0%) attend a private institution, while the remaining 29 (63.0%) are enrolled in public schools. The age group of 15 to 17 year olds has the highest likelihood of being enrolled in private schools, with 15 (83.3% in the age bracket) enrolled. Conversely, the age group of 5 to 9 year old has the lowest likelihood of being enrolled in a private school, with 8 (100.0% in the age bracket) attending a public institution.
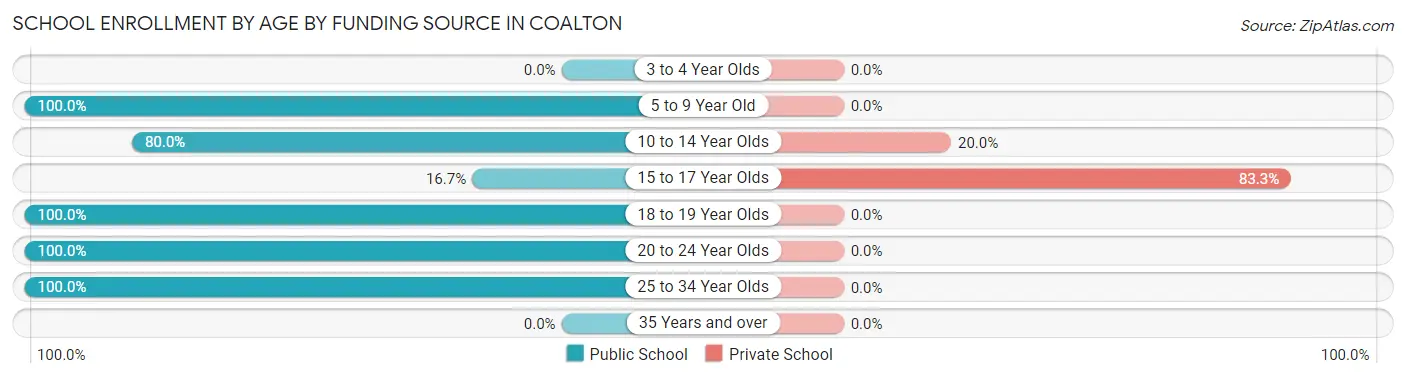
| Age Bracket | Public School | Private School |
| 3 to 4 Year Olds | 0 (0.0%) | 0 (0.0%) |
| 5 to 9 Year Old | 8 (100.0%) | 0 (0.0%) |
| 10 to 14 Year Olds | 8 (80.0%) | 2 (20.0%) |
| 15 to 17 Year Olds | 3 (16.7%) | 15 (83.3%) |
| 18 to 19 Year Olds | 5 (100.0%) | 0 (0.0%) |
| 20 to 24 Year Olds | 3 (100.0%) | 0 (0.0%) |
| 25 to 34 Year Olds | 2 (100.0%) | 0 (0.0%) |
| 35 Years and over | 0 (0.0%) | 0 (0.0%) |
| Total | 29 (63.0%) | 17 (37.0%) |
Educational Attainment by Field of Study in Coalton
Psychology (6 | 37.5%), education (6 | 37.5%), and business (4 | 25.0%) are the most common fields of study among 16 individuals in Coalton who have obtained a bachelor's degree or higher.
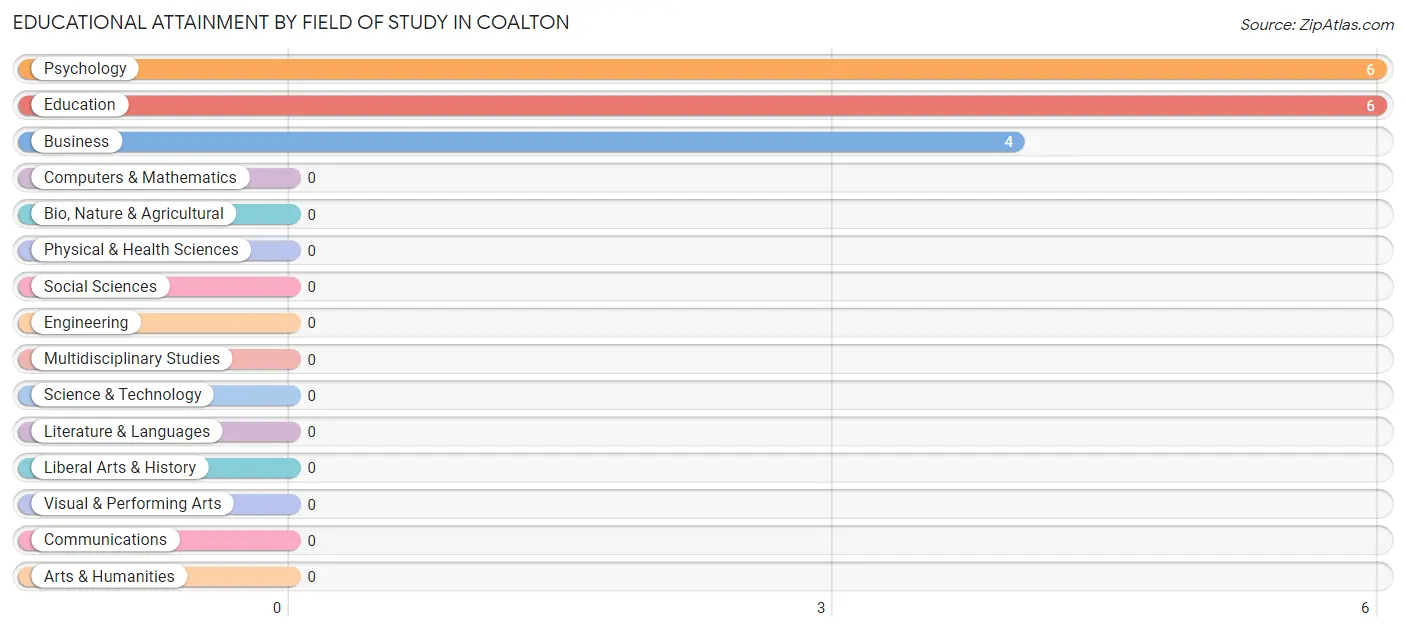
| Field of Study | # Graduates | % Graduates |
| Computers & Mathematics | 0 | 0.0% |
| Bio, Nature & Agricultural | 0 | 0.0% |
| Physical & Health Sciences | 0 | 0.0% |
| Psychology | 6 | 37.5% |
| Social Sciences | 0 | 0.0% |
| Engineering | 0 | 0.0% |
| Multidisciplinary Studies | 0 | 0.0% |
| Science & Technology | 0 | 0.0% |
| Business | 4 | 25.0% |
| Education | 6 | 37.5% |
| Literature & Languages | 0 | 0.0% |
| Liberal Arts & History | 0 | 0.0% |
| Visual & Performing Arts | 0 | 0.0% |
| Communications | 0 | 0.0% |
| Arts & Humanities | 0 | 0.0% |
| Total | 16 | 100.0% |
Transportation & Commute in Coalton
Vehicle Availability by Sex in Coalton
The most prevalent vehicle ownership categories in Coalton are males with 2 vehicles (31, accounting for 54.4%) and females with 2 vehicles (27, making up 51.7%).
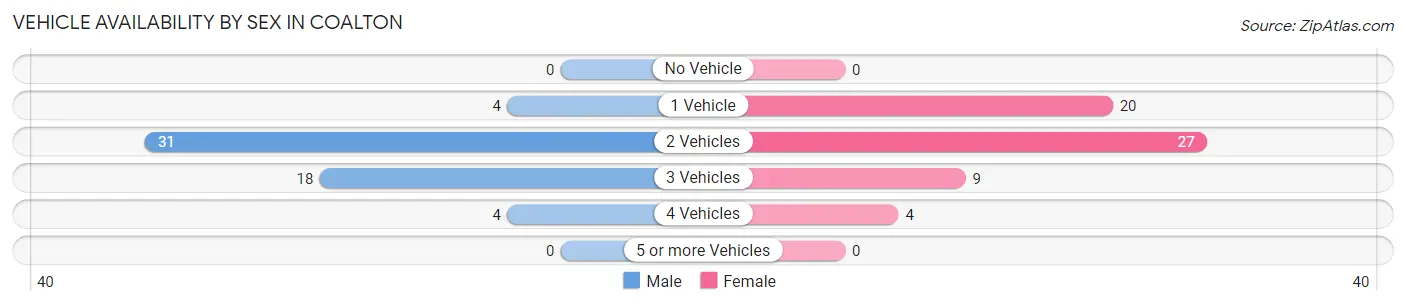
| Vehicles Available | Male | Female |
| No Vehicle | 0 (0.0%) | 0 (0.0%) |
| 1 Vehicle | 4 (7.0%) | 20 (33.3%) |
| 2 Vehicles | 31 (54.4%) | 27 (45.0%) |
| 3 Vehicles | 18 (31.6%) | 9 (15.0%) |
| 4 Vehicles | 4 (7.0%) | 4 (6.7%) |
| 5 or more Vehicles | 0 (0.0%) | 0 (0.0%) |
| Total | 57 (100.0%) | 60 (100.0%) |
Commute Time in Coalton
The most frequently occuring commute durations in Coalton are 10 to 14 minutes (30 commuters, 28.8%), less than 5 minutes (17 commuters, 16.4%), and 15 to 19 minutes (17 commuters, 16.4%).
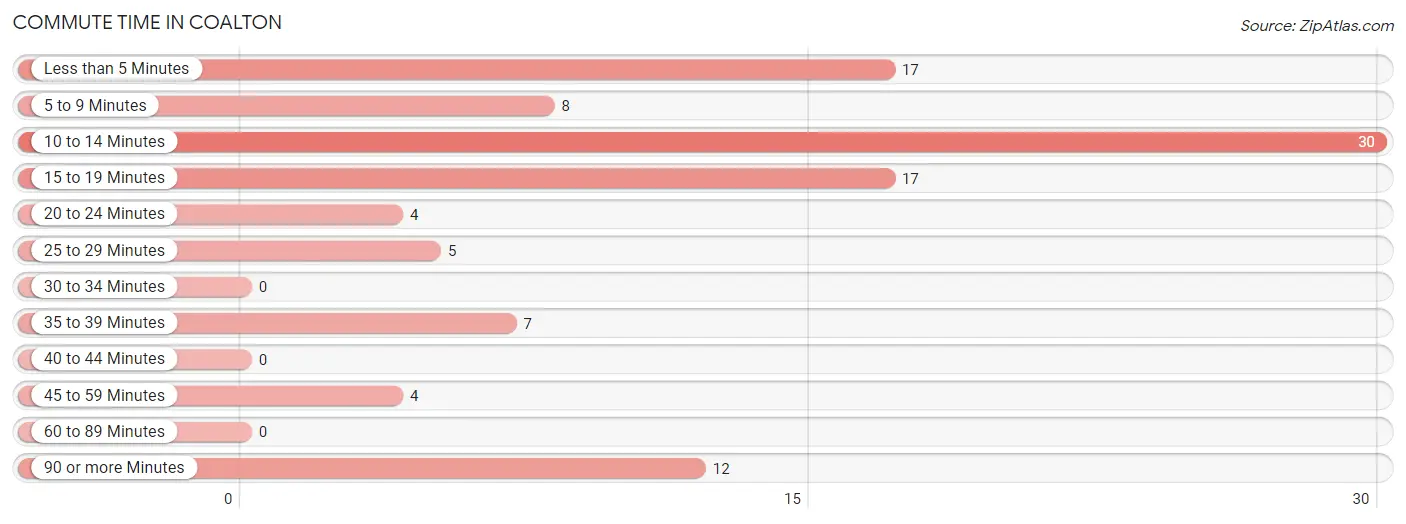
| Commute Time | # Commuters | % Commuters |
| Less than 5 Minutes | 17 | 16.4% |
| 5 to 9 Minutes | 8 | 7.7% |
| 10 to 14 Minutes | 30 | 28.8% |
| 15 to 19 Minutes | 17 | 16.4% |
| 20 to 24 Minutes | 4 | 3.8% |
| 25 to 29 Minutes | 5 | 4.8% |
| 30 to 34 Minutes | 0 | 0.0% |
| 35 to 39 Minutes | 7 | 6.7% |
| 40 to 44 Minutes | 0 | 0.0% |
| 45 to 59 Minutes | 4 | 3.8% |
| 60 to 89 Minutes | 0 | 0.0% |
| 90 or more Minutes | 12 | 11.5% |
Commute Time by Sex in Coalton
The most common commute times in Coalton are 10 to 14 minutes (16 commuters, 31.4%) for males and less than 5 minutes (17 commuters, 32.1%) for females.
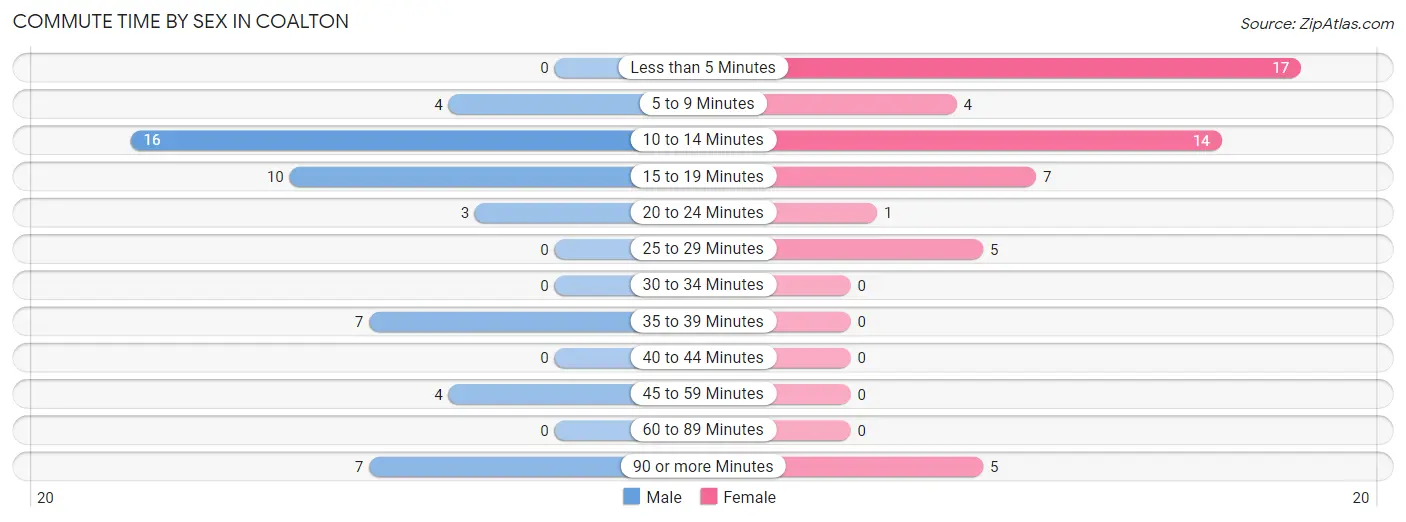
| Commute Time | Male | Female |
| Less than 5 Minutes | 0 (0.0%) | 17 (32.1%) |
| 5 to 9 Minutes | 4 (7.8%) | 4 (7.5%) |
| 10 to 14 Minutes | 16 (31.4%) | 14 (26.4%) |
| 15 to 19 Minutes | 10 (19.6%) | 7 (13.2%) |
| 20 to 24 Minutes | 3 (5.9%) | 1 (1.9%) |
| 25 to 29 Minutes | 0 (0.0%) | 5 (9.4%) |
| 30 to 34 Minutes | 0 (0.0%) | 0 (0.0%) |
| 35 to 39 Minutes | 7 (13.7%) | 0 (0.0%) |
| 40 to 44 Minutes | 0 (0.0%) | 0 (0.0%) |
| 45 to 59 Minutes | 4 (7.8%) | 0 (0.0%) |
| 60 to 89 Minutes | 0 (0.0%) | 0 (0.0%) |
| 90 or more Minutes | 7 (13.7%) | 5 (9.4%) |
Time of Departure to Work by Sex in Coalton
The most frequent times of departure to work in Coalton are 6:30 AM to 6:59 AM (15, 29.4%) for males and 12:00 PM to 3:59 PM (23, 43.4%) for females.
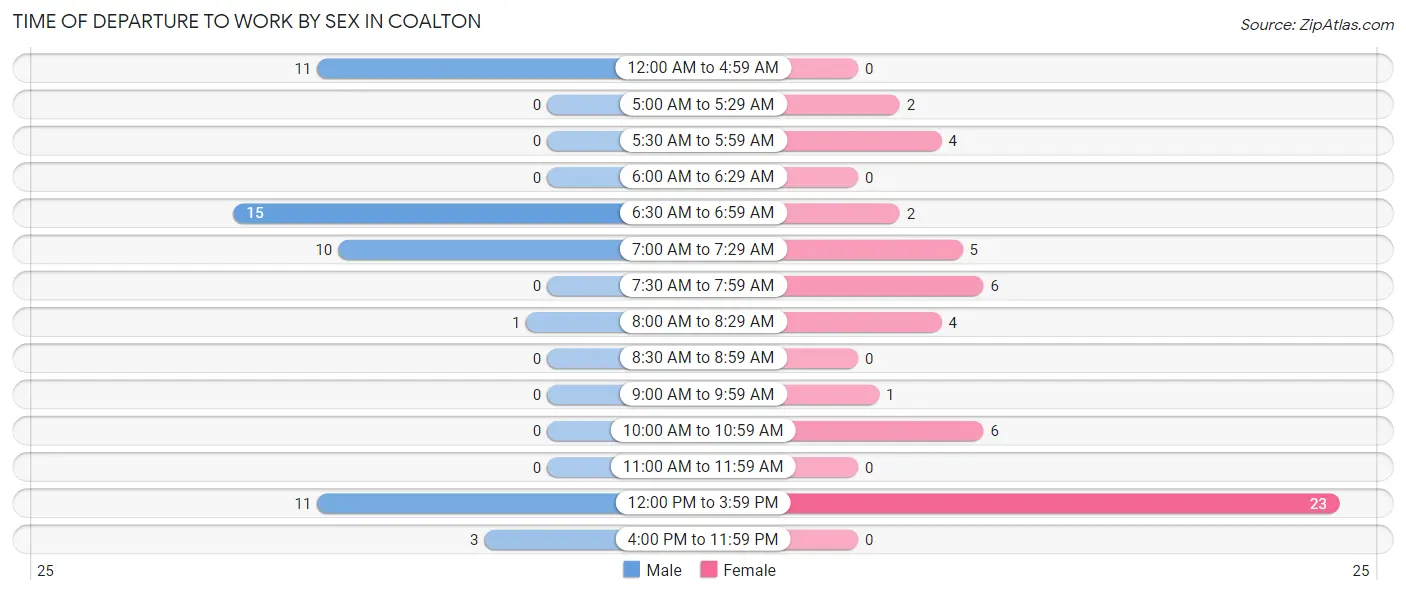
| Time of Departure | Male | Female |
| 12:00 AM to 4:59 AM | 11 (21.6%) | 0 (0.0%) |
| 5:00 AM to 5:29 AM | 0 (0.0%) | 2 (3.8%) |
| 5:30 AM to 5:59 AM | 0 (0.0%) | 4 (7.5%) |
| 6:00 AM to 6:29 AM | 0 (0.0%) | 0 (0.0%) |
| 6:30 AM to 6:59 AM | 15 (29.4%) | 2 (3.8%) |
| 7:00 AM to 7:29 AM | 10 (19.6%) | 5 (9.4%) |
| 7:30 AM to 7:59 AM | 0 (0.0%) | 6 (11.3%) |
| 8:00 AM to 8:29 AM | 1 (2.0%) | 4 (7.5%) |
| 8:30 AM to 8:59 AM | 0 (0.0%) | 0 (0.0%) |
| 9:00 AM to 9:59 AM | 0 (0.0%) | 1 (1.9%) |
| 10:00 AM to 10:59 AM | 0 (0.0%) | 6 (11.3%) |
| 11:00 AM to 11:59 AM | 0 (0.0%) | 0 (0.0%) |
| 12:00 PM to 3:59 PM | 11 (21.6%) | 23 (43.4%) |
| 4:00 PM to 11:59 PM | 3 (5.9%) | 0 (0.0%) |
| Total | 51 (100.0%) | 53 (100.0%) |
Housing Occupancy in Coalton
Occupancy by Ownership in Coalton
Of the total 209 dwellings in Coalton, owner-occupied units account for 124 (59.3%), while renter-occupied units make up 85 (40.7%).
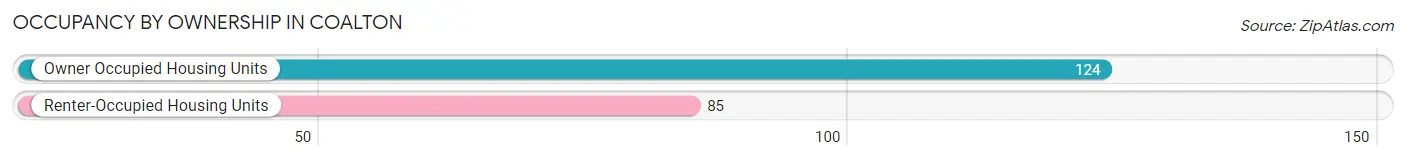
| Occupancy | # Housing Units | % Housing Units |
| Owner Occupied Housing Units | 124 | 59.3% |
| Renter-Occupied Housing Units | 85 | 40.7% |
| Total Occupied Housing Units | 209 | 100.0% |
Occupancy by Household Size in Coalton
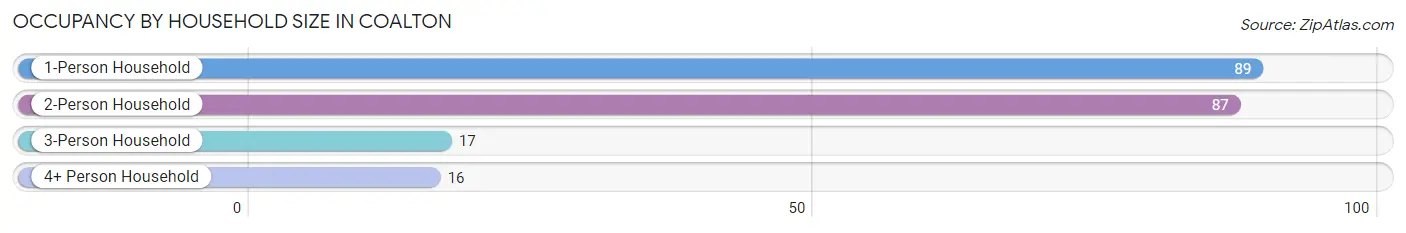
| Household Size | # Housing Units | % Housing Units |
| 1-Person Household | 89 | 42.6% |
| 2-Person Household | 87 | 41.6% |
| 3-Person Household | 17 | 8.1% |
| 4+ Person Household | 16 | 7.7% |
| Total Housing Units | 209 | 100.0% |
Occupancy by Ownership by Household Size in Coalton
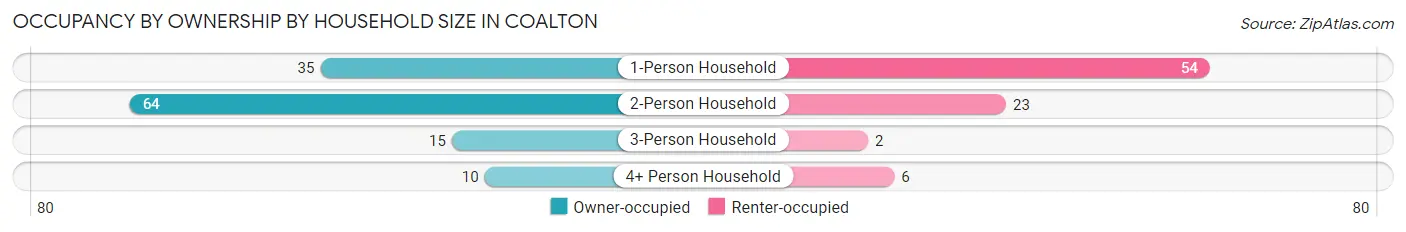
| Household Size | Owner-occupied | Renter-occupied |
| 1-Person Household | 35 (39.3%) | 54 (60.7%) |
| 2-Person Household | 64 (73.6%) | 23 (26.4%) |
| 3-Person Household | 15 (88.2%) | 2 (11.8%) |
| 4+ Person Household | 10 (62.5%) | 6 (37.5%) |
| Total Housing Units | 124 (59.3%) | 85 (40.7%) |
Occupancy by Educational Attainment in Coalton
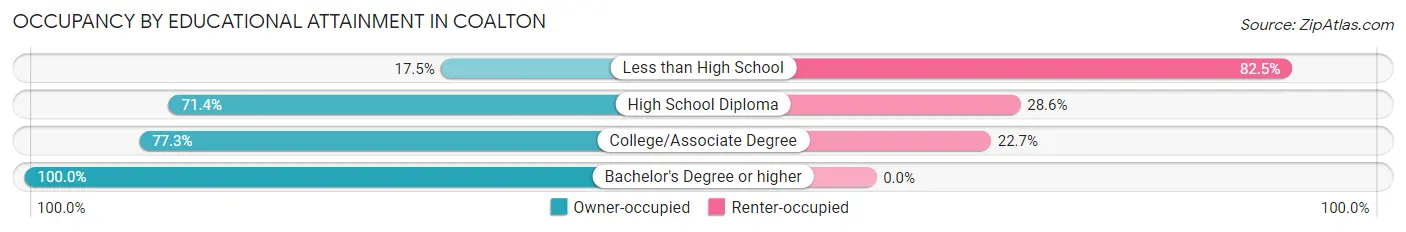
| Household Size | Owner-occupied | Renter-occupied |
| Less than High School | 10 (17.5%) | 47 (82.5%) |
| High School Diploma | 70 (71.4%) | 28 (28.6%) |
| College/Associate Degree | 34 (77.3%) | 10 (22.7%) |
| Bachelor's Degree or higher | 10 (100.0%) | 0 (0.0%) |
Occupancy by Age of Householder in Coalton
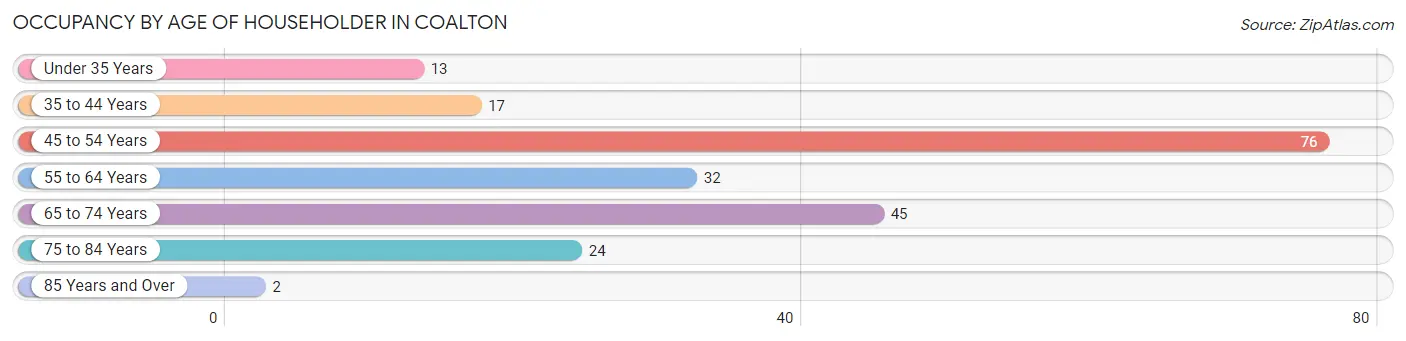
| Age Bracket | # Households | % Households |
| Under 35 Years | 13 | 6.2% |
| 35 to 44 Years | 17 | 8.1% |
| 45 to 54 Years | 76 | 36.4% |
| 55 to 64 Years | 32 | 15.3% |
| 65 to 74 Years | 45 | 21.5% |
| 75 to 84 Years | 24 | 11.5% |
| 85 Years and Over | 2 | 1.0% |
| Total | 209 | 100.0% |
Housing Finances in Coalton
Median Income by Occupancy in Coalton
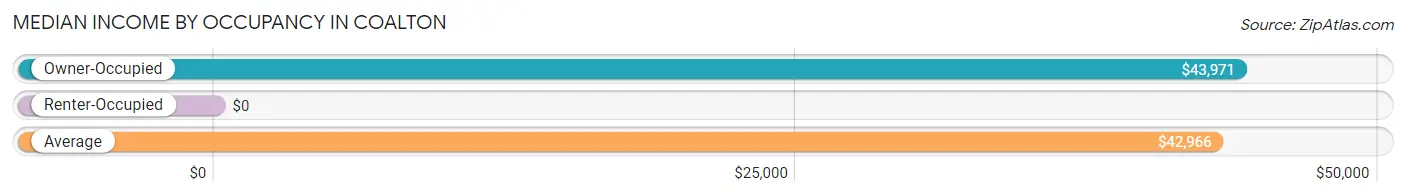
| Occupancy Type | # Households | Median Income |
| Owner-Occupied | 124 (59.3%) | $43,971 |
| Renter-Occupied | 85 (40.7%) | $0 |
| Average | 209 (100.0%) | $42,966 |
Occupancy by Householder Income Bracket in Coalton
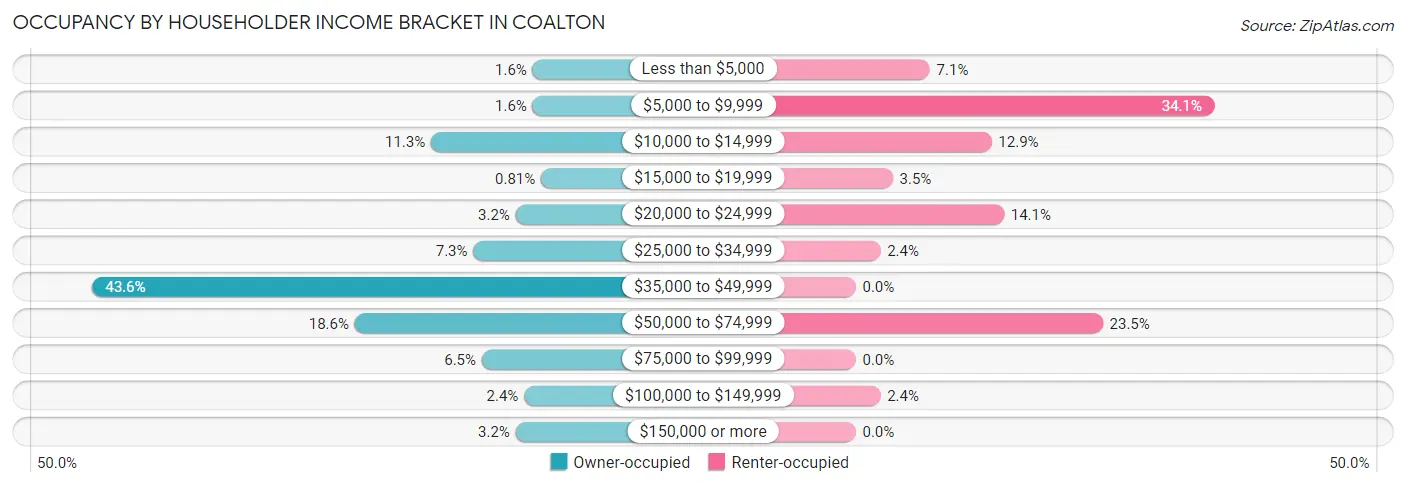
| Income Bracket | Owner-occupied | Renter-occupied |
| Less than $5,000 | 2 (1.6%) | 6 (7.1%) |
| $5,000 to $9,999 | 2 (1.6%) | 29 (34.1%) |
| $10,000 to $14,999 | 14 (11.3%) | 11 (12.9%) |
| $15,000 to $19,999 | 1 (0.8%) | 3 (3.5%) |
| $20,000 to $24,999 | 4 (3.2%) | 12 (14.1%) |
| $25,000 to $34,999 | 9 (7.3%) | 2 (2.4%) |
| $35,000 to $49,999 | 54 (43.5%) | 0 (0.0%) |
| $50,000 to $74,999 | 23 (18.5%) | 20 (23.5%) |
| $75,000 to $99,999 | 8 (6.5%) | 0 (0.0%) |
| $100,000 to $149,999 | 3 (2.4%) | 2 (2.4%) |
| $150,000 or more | 4 (3.2%) | 0 (0.0%) |
| Total | 124 (100.0%) | 85 (100.0%) |
Monthly Housing Cost Tiers in Coalton
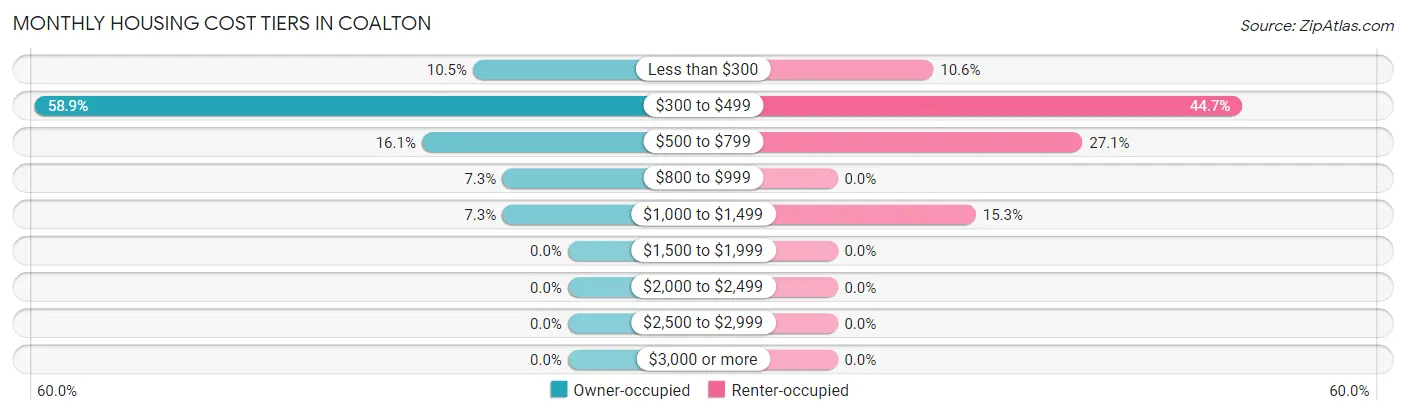
| Monthly Cost | Owner-occupied | Renter-occupied |
| Less than $300 | 13 (10.5%) | 9 (10.6%) |
| $300 to $499 | 73 (58.9%) | 38 (44.7%) |
| $500 to $799 | 20 (16.1%) | 23 (27.1%) |
| $800 to $999 | 9 (7.3%) | 0 (0.0%) |
| $1,000 to $1,499 | 9 (7.3%) | 13 (15.3%) |
| $1,500 to $1,999 | 0 (0.0%) | 0 (0.0%) |
| $2,000 to $2,499 | 0 (0.0%) | 0 (0.0%) |
| $2,500 to $2,999 | 0 (0.0%) | 0 (0.0%) |
| $3,000 or more | 0 (0.0%) | 0 (0.0%) |
| Total | 124 (100.0%) | 85 (100.0%) |
Physical Housing Characteristics in Coalton
Housing Structures in Coalton
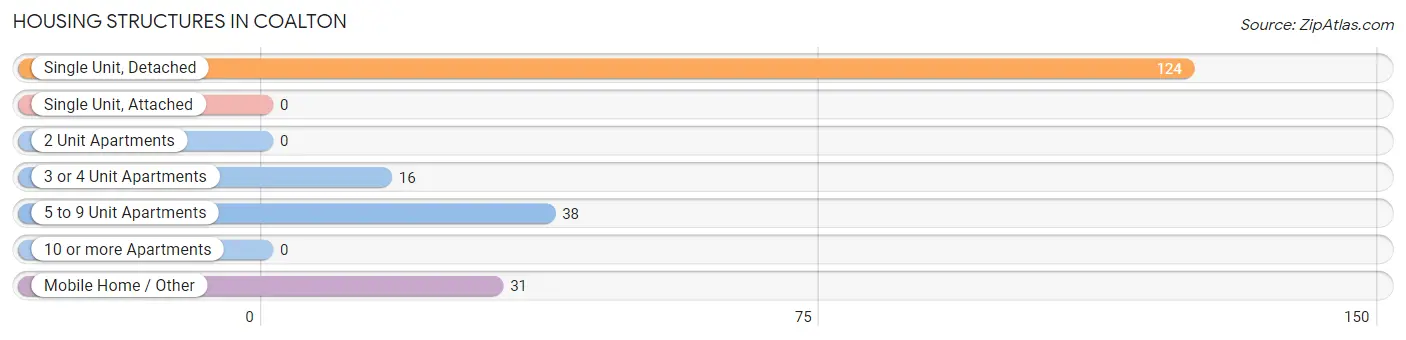
| Structure Type | # Housing Units | % Housing Units |
| Single Unit, Detached | 124 | 59.3% |
| Single Unit, Attached | 0 | 0.0% |
| 2 Unit Apartments | 0 | 0.0% |
| 3 or 4 Unit Apartments | 16 | 7.7% |
| 5 to 9 Unit Apartments | 38 | 18.2% |
| 10 or more Apartments | 0 | 0.0% |
| Mobile Home / Other | 31 | 14.8% |
| Total | 209 | 100.0% |
Housing Structures by Occupancy in Coalton
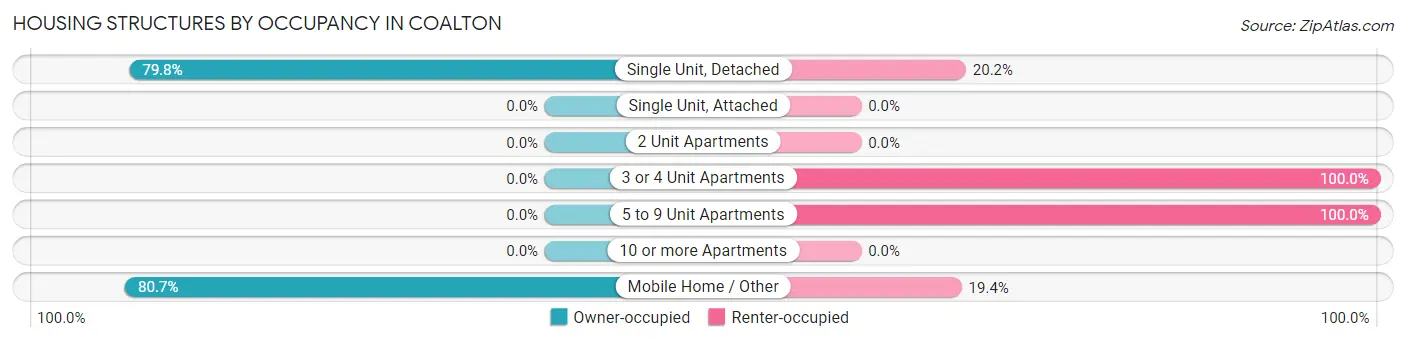
| Structure Type | Owner-occupied | Renter-occupied |
| Single Unit, Detached | 99 (79.8%) | 25 (20.2%) |
| Single Unit, Attached | 0 (0.0%) | 0 (0.0%) |
| 2 Unit Apartments | 0 (0.0%) | 0 (0.0%) |
| 3 or 4 Unit Apartments | 0 (0.0%) | 16 (100.0%) |
| 5 to 9 Unit Apartments | 0 (0.0%) | 38 (100.0%) |
| 10 or more Apartments | 0 (0.0%) | 0 (0.0%) |
| Mobile Home / Other | 25 (80.6%) | 6 (19.4%) |
| Total | 124 (59.3%) | 85 (40.7%) |
Housing Structures by Number of Rooms in Coalton
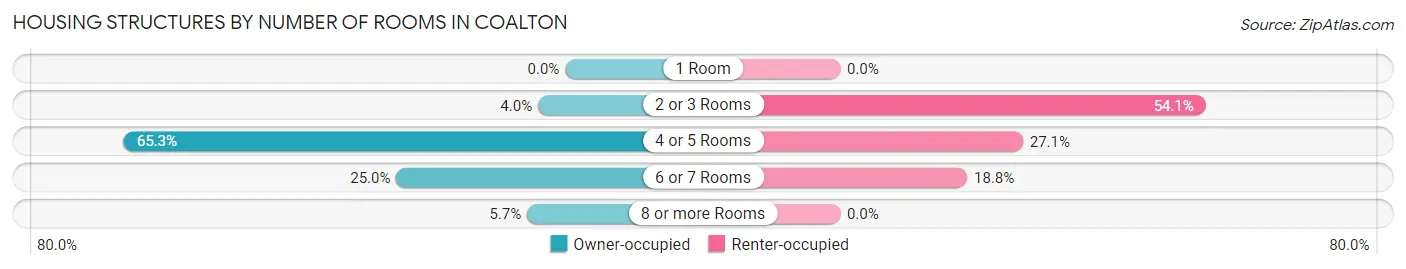
| Number of Rooms | Owner-occupied | Renter-occupied |
| 1 Room | 0 (0.0%) | 0 (0.0%) |
| 2 or 3 Rooms | 5 (4.0%) | 46 (54.1%) |
| 4 or 5 Rooms | 81 (65.3%) | 23 (27.1%) |
| 6 or 7 Rooms | 31 (25.0%) | 16 (18.8%) |
| 8 or more Rooms | 7 (5.7%) | 0 (0.0%) |
| Total | 124 (100.0%) | 85 (100.0%) |
Housing Structure by Heating Type in Coalton
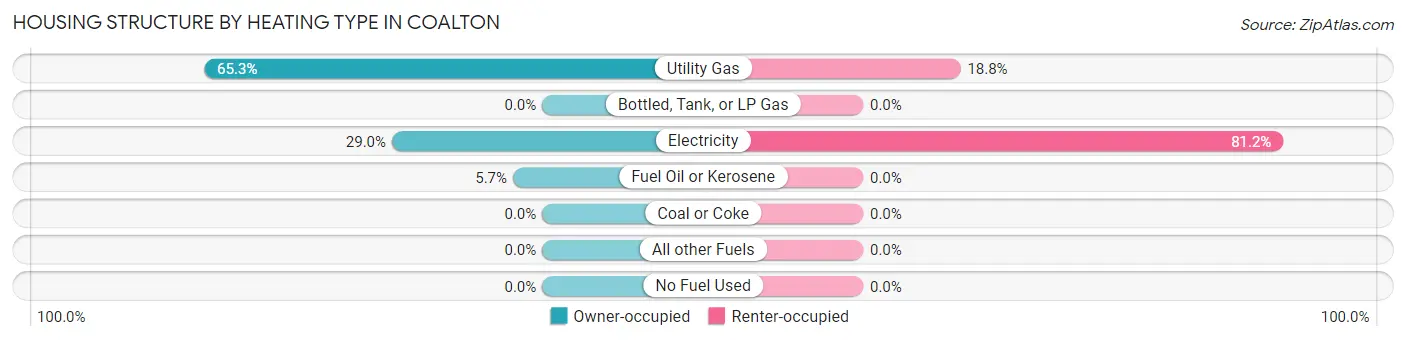
| Heating Type | Owner-occupied | Renter-occupied |
| Utility Gas | 81 (65.3%) | 16 (18.8%) |
| Bottled, Tank, or LP Gas | 0 (0.0%) | 0 (0.0%) |
| Electricity | 36 (29.0%) | 69 (81.2%) |
| Fuel Oil or Kerosene | 7 (5.7%) | 0 (0.0%) |
| Coal or Coke | 0 (0.0%) | 0 (0.0%) |
| All other Fuels | 0 (0.0%) | 0 (0.0%) |
| No Fuel Used | 0 (0.0%) | 0 (0.0%) |
| Total | 124 (100.0%) | 85 (100.0%) |
Household Vehicle Usage in Coalton
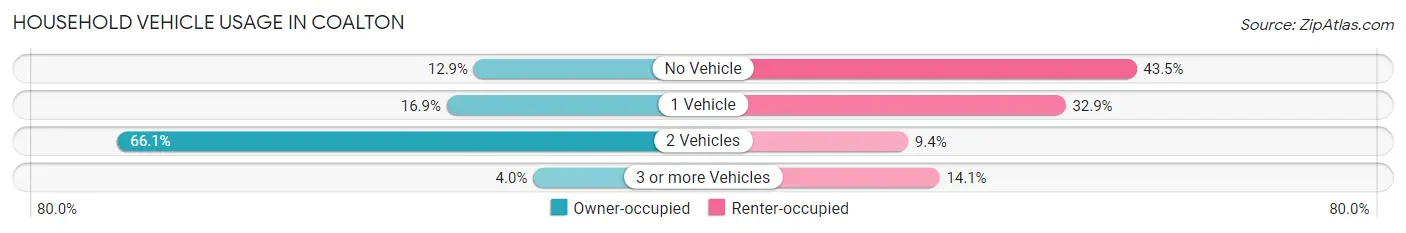
| Vehicles per Household | Owner-occupied | Renter-occupied |
| No Vehicle | 16 (12.9%) | 37 (43.5%) |
| 1 Vehicle | 21 (16.9%) | 28 (32.9%) |
| 2 Vehicles | 82 (66.1%) | 8 (9.4%) |
| 3 or more Vehicles | 5 (4.0%) | 12 (14.1%) |
| Total | 124 (100.0%) | 85 (100.0%) |
Real Estate & Mortgages in Coalton
Real Estate and Mortgage Overview in Coalton
| Characteristic | Without Mortgage | With Mortgage |
| Housing Units | 96 | 28 |
| Median Property Value | $53,800 | $0 |
| Median Household Income | $43,284 | $4 |
| Monthly Housing Costs | $433 | $0 |
| Real Estate Taxes | - | - |
Property Value by Mortgage Status in Coalton
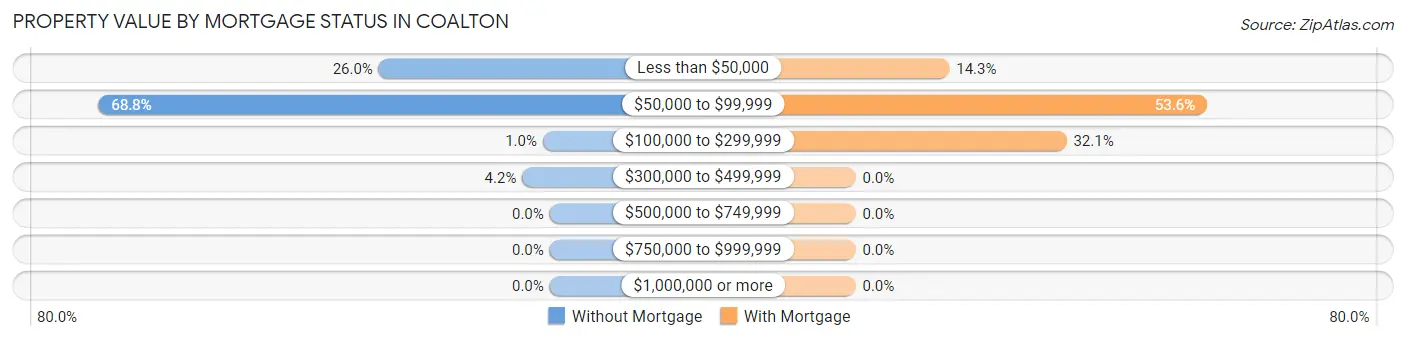
| Property Value | Without Mortgage | With Mortgage |
| Less than $50,000 | 25 (26.0%) | 4 (14.3%) |
| $50,000 to $99,999 | 66 (68.8%) | 15 (53.6%) |
| $100,000 to $299,999 | 1 (1.0%) | 9 (32.1%) |
| $300,000 to $499,999 | 4 (4.2%) | 0 (0.0%) |
| $500,000 to $749,999 | 0 (0.0%) | 0 (0.0%) |
| $750,000 to $999,999 | 0 (0.0%) | 0 (0.0%) |
| $1,000,000 or more | 0 (0.0%) | 0 (0.0%) |
| Total | 96 (100.0%) | 28 (100.0%) |
Household Income by Mortgage Status in Coalton
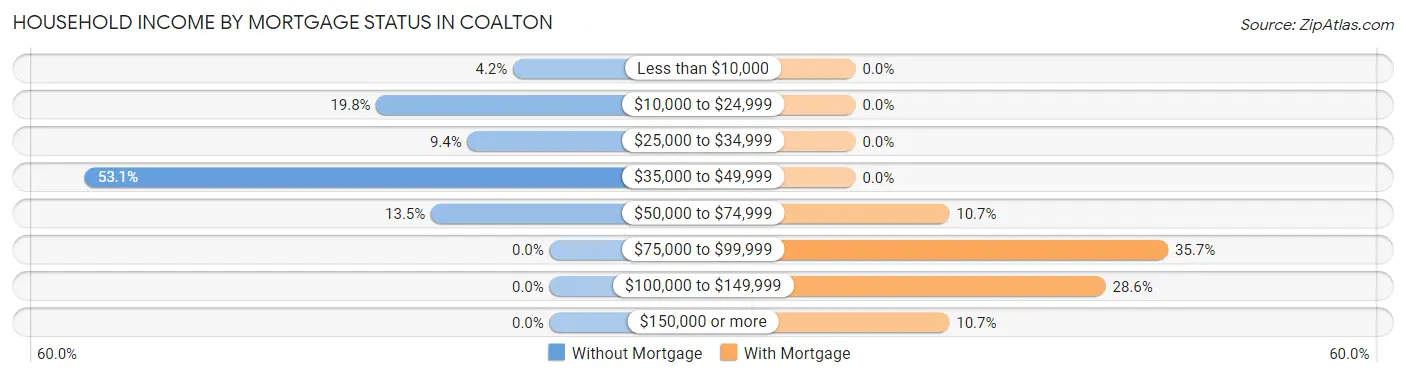
| Household Income | Without Mortgage | With Mortgage |
| Less than $10,000 | 4 (4.2%) | 0 (0.0%) |
| $10,000 to $24,999 | 19 (19.8%) | 0 (0.0%) |
| $25,000 to $34,999 | 9 (9.4%) | 0 (0.0%) |
| $35,000 to $49,999 | 51 (53.1%) | 0 (0.0%) |
| $50,000 to $74,999 | 13 (13.5%) | 3 (10.7%) |
| $75,000 to $99,999 | 0 (0.0%) | 10 (35.7%) |
| $100,000 to $149,999 | 0 (0.0%) | 8 (28.6%) |
| $150,000 or more | 0 (0.0%) | 3 (10.7%) |
| Total | 96 (100.0%) | 28 (100.0%) |
Property Value to Household Income Ratio in Coalton
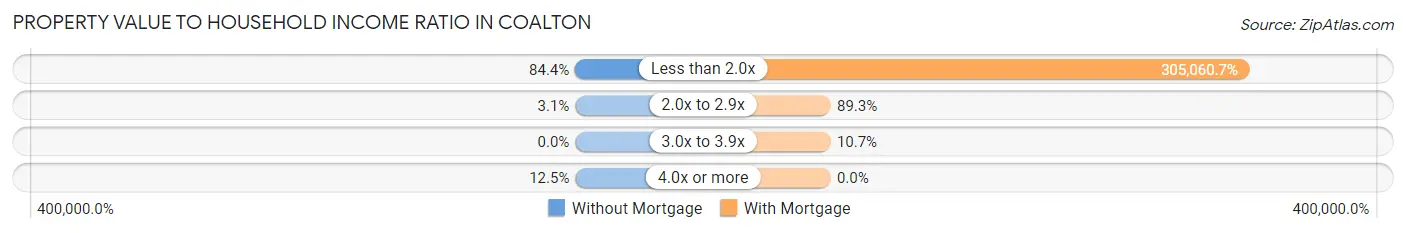
| Value-to-Income Ratio | Without Mortgage | With Mortgage |
| Less than 2.0x | 81 (84.4%) | 85,417 (305,060.7%) |
| 2.0x to 2.9x | 3 (3.1%) | 25 (89.3%) |
| 3.0x to 3.9x | 0 (0.0%) | 3 (10.7%) |
| 4.0x or more | 12 (12.5%) | 0 (0.0%) |
| Total | 96 (100.0%) | 28 (100.0%) |
Real Estate Taxes by Mortgage Status in Coalton
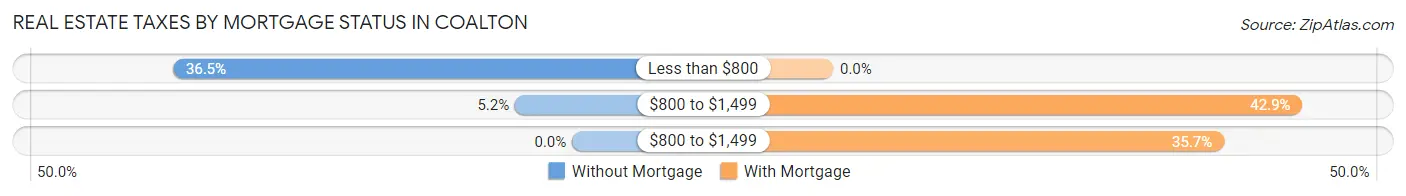
| Property Taxes | Without Mortgage | With Mortgage |
| Less than $800 | 35 (36.5%) | 0 (0.0%) |
| $800 to $1,499 | 5 (5.2%) | 12 (42.9%) |
| $800 to $1,499 | 0 (0.0%) | 10 (35.7%) |
| Total | 96 (100.0%) | 28 (100.0%) |
Health & Disability in Coalton
Health Insurance Coverage by Age in Coalton
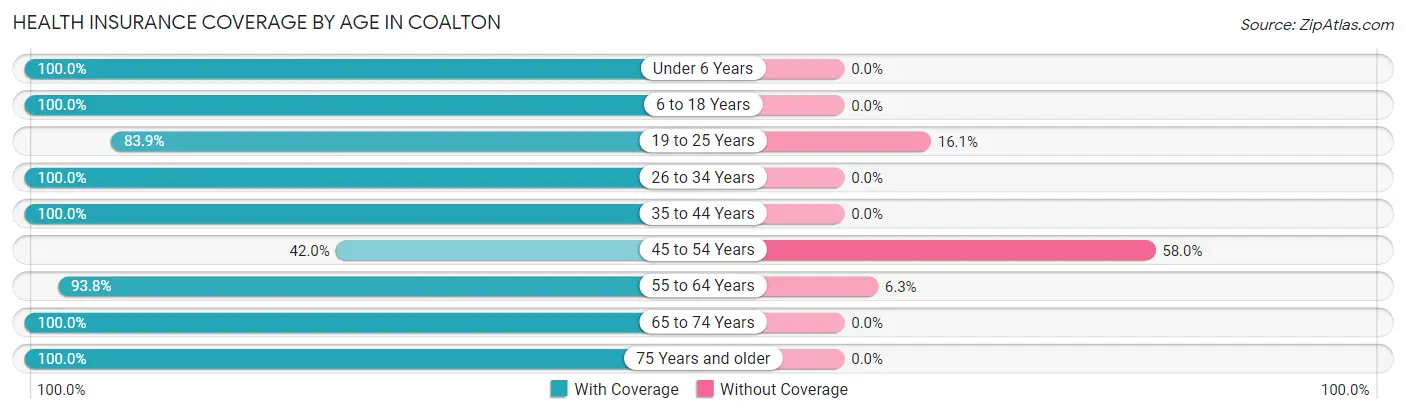
| Age Bracket | With Coverage | Without Coverage |
| Under 6 Years | 15 (100.0%) | 0 (0.0%) |
| 6 to 18 Years | 40 (100.0%) | 0 (0.0%) |
| 19 to 25 Years | 26 (83.9%) | 5 (16.1%) |
| 26 to 34 Years | 18 (100.0%) | 0 (0.0%) |
| 35 to 44 Years | 29 (100.0%) | 0 (0.0%) |
| 45 to 54 Years | 42 (42.0%) | 58 (58.0%) |
| 55 to 64 Years | 90 (93.8%) | 6 (6.2%) |
| 65 to 74 Years | 48 (100.0%) | 0 (0.0%) |
| 75 Years and older | 26 (100.0%) | 0 (0.0%) |
| Total | 334 (82.9%) | 69 (17.1%) |
Health Insurance Coverage by Citizenship Status in Coalton
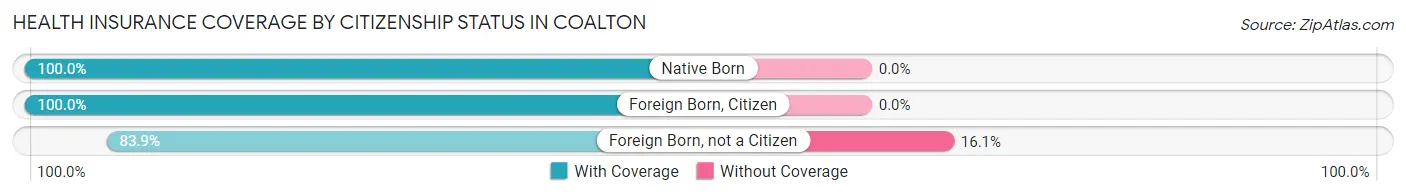
| Citizenship Status | With Coverage | Without Coverage |
| Native Born | 15 (100.0%) | 0 (0.0%) |
| Foreign Born, Citizen | 40 (100.0%) | 0 (0.0%) |
| Foreign Born, not a Citizen | 26 (83.9%) | 5 (16.1%) |
Health Insurance Coverage by Household Income in Coalton
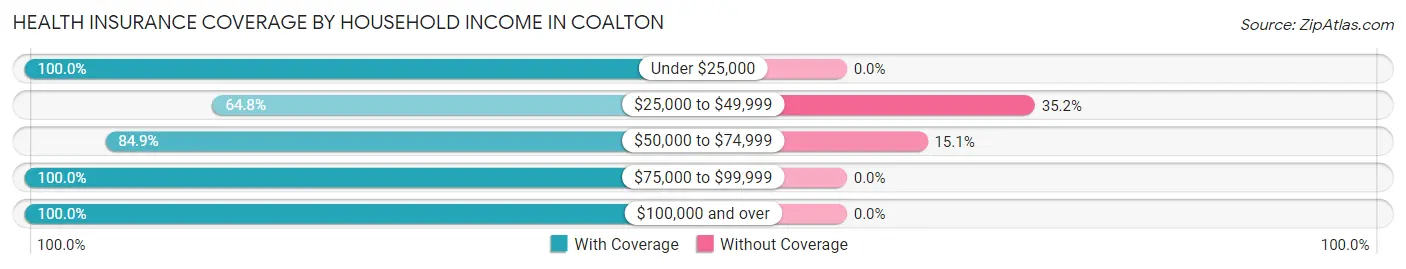
| Household Income | With Coverage | Without Coverage |
| Under $25,000 | 115 (100.0%) | 0 (0.0%) |
| $25,000 to $49,999 | 103 (64.8%) | 56 (35.2%) |
| $50,000 to $74,999 | 73 (84.9%) | 13 (15.1%) |
| $75,000 to $99,999 | 17 (100.0%) | 0 (0.0%) |
| $100,000 and over | 26 (100.0%) | 0 (0.0%) |
Public vs Private Health Insurance Coverage by Age in Coalton
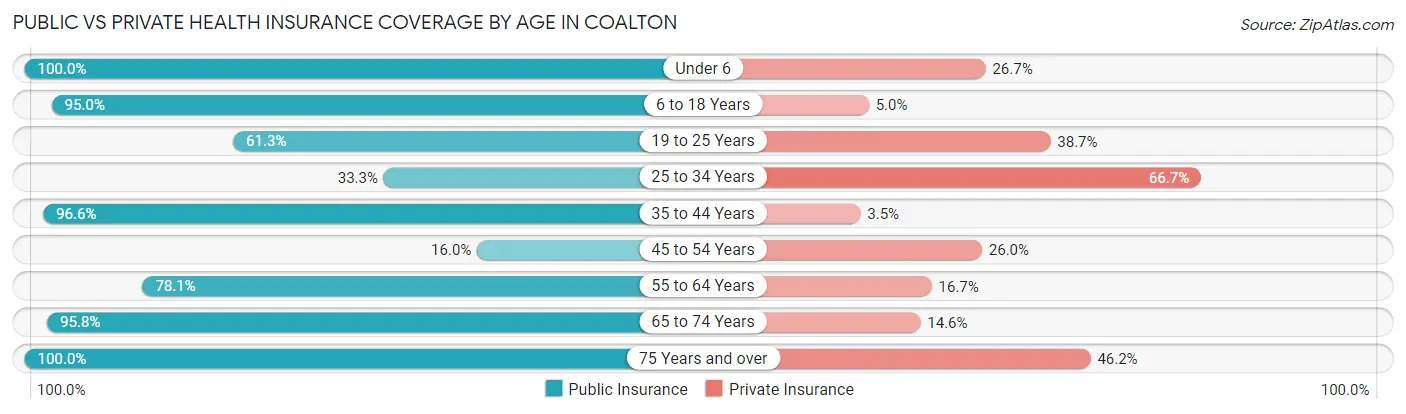
| Age Bracket | Public Insurance | Private Insurance |
| Under 6 | 15 (100.0%) | 4 (26.7%) |
| 6 to 18 Years | 38 (95.0%) | 2 (5.0%) |
| 19 to 25 Years | 19 (61.3%) | 12 (38.7%) |
| 25 to 34 Years | 6 (33.3%) | 12 (66.7%) |
| 35 to 44 Years | 28 (96.6%) | 1 (3.5%) |
| 45 to 54 Years | 16 (16.0%) | 26 (26.0%) |
| 55 to 64 Years | 75 (78.1%) | 16 (16.7%) |
| 65 to 74 Years | 46 (95.8%) | 7 (14.6%) |
| 75 Years and over | 26 (100.0%) | 12 (46.2%) |
| Total | 269 (66.7%) | 92 (22.8%) |
Disability Status by Sex by Age in Coalton
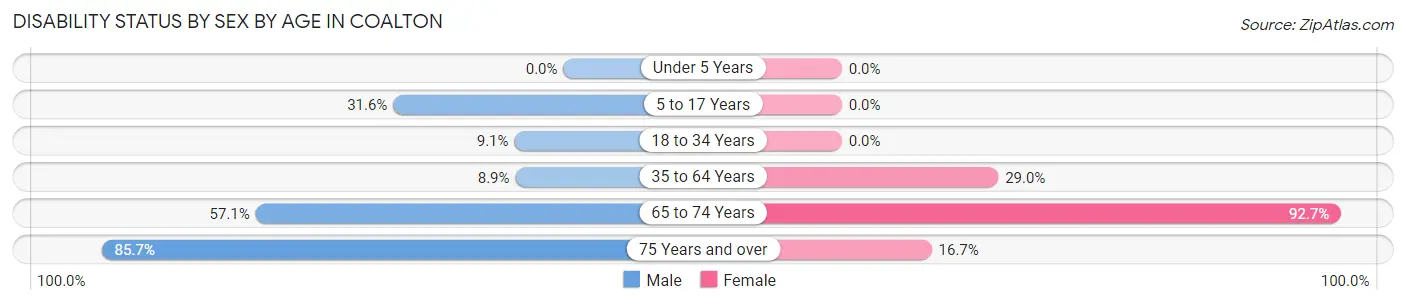
| Age Bracket | Male | Female |
| Under 5 Years | 0 (0.0%) | 0 (0.0%) |
| 5 to 17 Years | 6 (31.6%) | 0 (0.0%) |
| 18 to 34 Years | 2 (9.1%) | 0 (0.0%) |
| 35 to 64 Years | 9 (8.9%) | 36 (29.0%) |
| 65 to 74 Years | 4 (57.1%) | 38 (92.7%) |
| 75 Years and over | 12 (85.7%) | 2 (16.7%) |
Disability Class by Sex by Age in Coalton
Disability Class: Hearing Difficulty
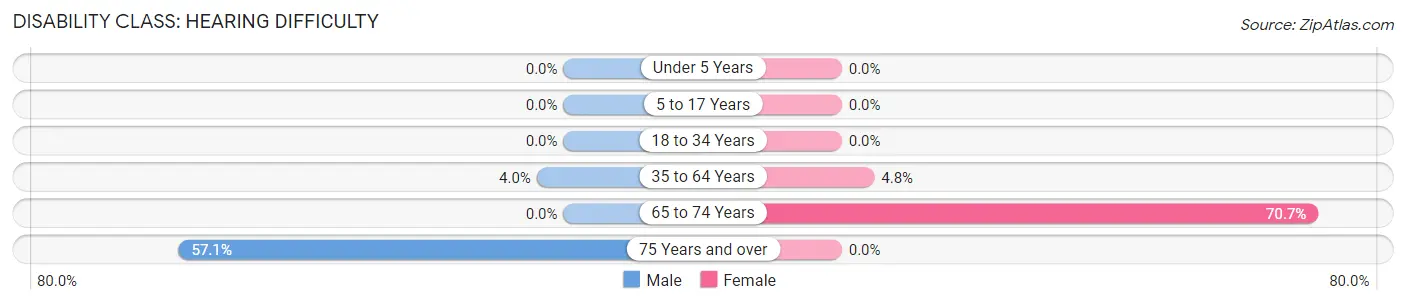
| Age Bracket | Male | Female |
| Under 5 Years | 0 (0.0%) | 0 (0.0%) |
| 5 to 17 Years | 0 (0.0%) | 0 (0.0%) |
| 18 to 34 Years | 0 (0.0%) | 0 (0.0%) |
| 35 to 64 Years | 4 (4.0%) | 6 (4.8%) |
| 65 to 74 Years | 0 (0.0%) | 29 (70.7%) |
| 75 Years and over | 8 (57.1%) | 0 (0.0%) |
Disability Class: Vision Difficulty
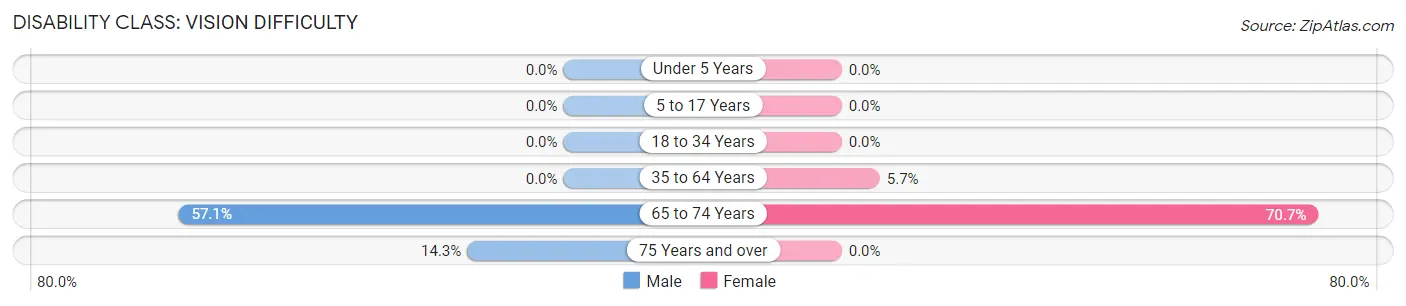
| Age Bracket | Male | Female |
| Under 5 Years | 0 (0.0%) | 0 (0.0%) |
| 5 to 17 Years | 0 (0.0%) | 0 (0.0%) |
| 18 to 34 Years | 0 (0.0%) | 0 (0.0%) |
| 35 to 64 Years | 0 (0.0%) | 7 (5.7%) |
| 65 to 74 Years | 4 (57.1%) | 29 (70.7%) |
| 75 Years and over | 2 (14.3%) | 0 (0.0%) |
Disability Class: Cognitive Difficulty
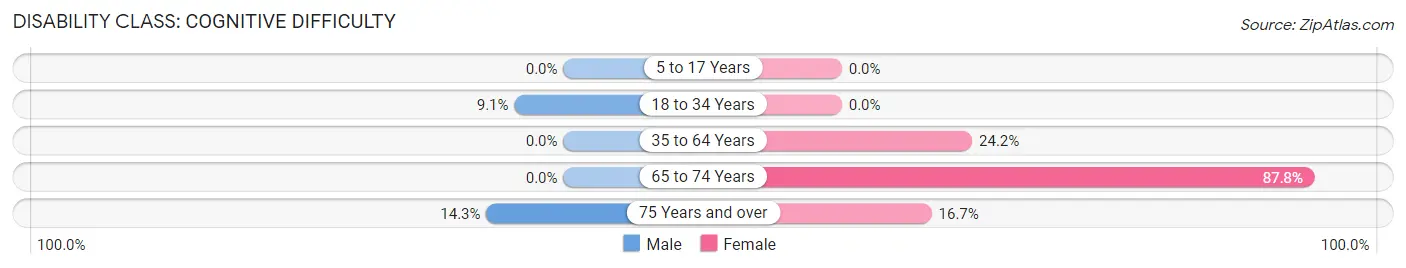
| Age Bracket | Male | Female |
| 5 to 17 Years | 0 (0.0%) | 0 (0.0%) |
| 18 to 34 Years | 2 (9.1%) | 0 (0.0%) |
| 35 to 64 Years | 0 (0.0%) | 30 (24.2%) |
| 65 to 74 Years | 0 (0.0%) | 36 (87.8%) |
| 75 Years and over | 2 (14.3%) | 2 (16.7%) |
Disability Class: Ambulatory Difficulty
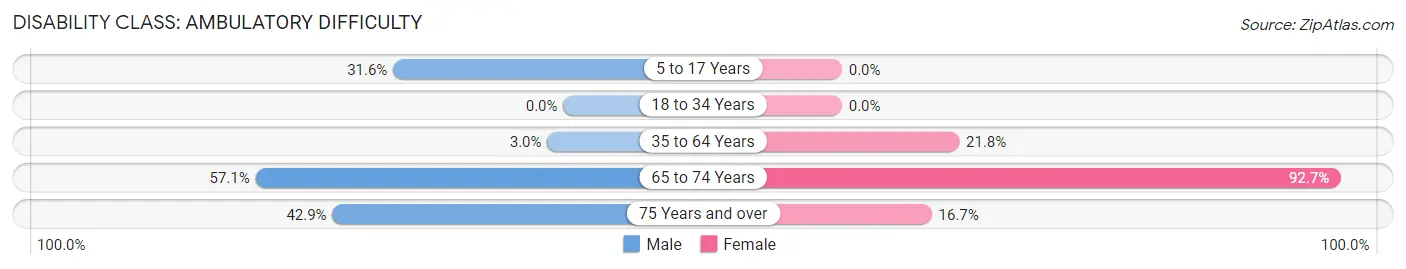
| Age Bracket | Male | Female |
| 5 to 17 Years | 6 (31.6%) | 0 (0.0%) |
| 18 to 34 Years | 0 (0.0%) | 0 (0.0%) |
| 35 to 64 Years | 3 (3.0%) | 27 (21.8%) |
| 65 to 74 Years | 4 (57.1%) | 38 (92.7%) |
| 75 Years and over | 6 (42.9%) | 2 (16.7%) |
Disability Class: Self-Care Difficulty
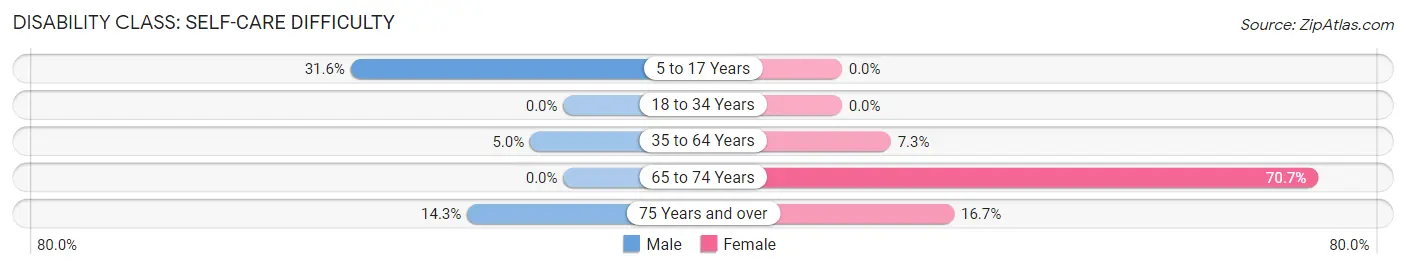
| Age Bracket | Male | Female |
| 5 to 17 Years | 6 (31.6%) | 0 (0.0%) |
| 18 to 34 Years | 0 (0.0%) | 0 (0.0%) |
| 35 to 64 Years | 5 (5.0%) | 9 (7.3%) |
| 65 to 74 Years | 0 (0.0%) | 29 (70.7%) |
| 75 Years and over | 2 (14.3%) | 2 (16.7%) |
Technology Access in Coalton
Computing Device Access in Coalton
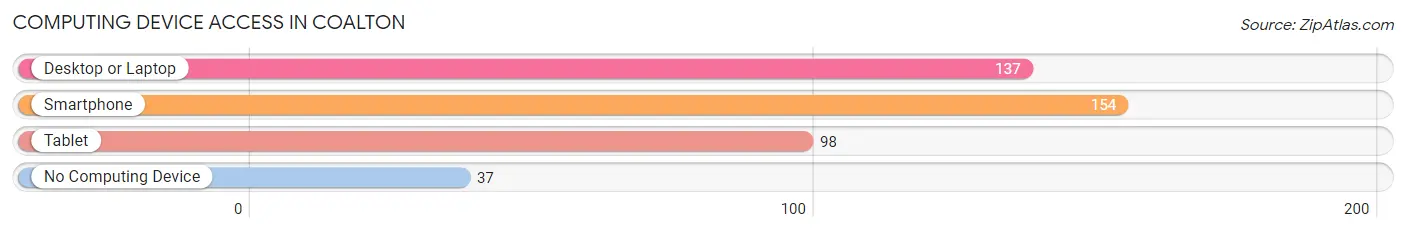
| Device Type | # Households | % Households |
| Desktop or Laptop | 137 | 65.5% |
| Smartphone | 154 | 73.7% |
| Tablet | 98 | 46.9% |
| No Computing Device | 37 | 17.7% |
| Total | 209 | 100.0% |
Internet Access in Coalton
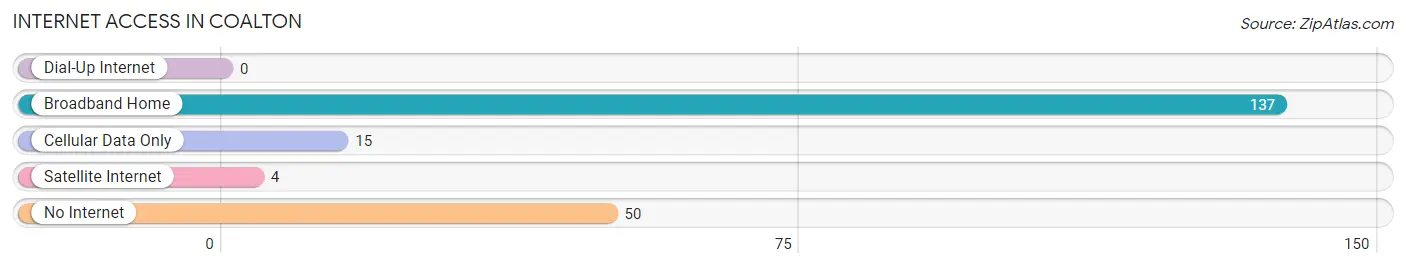
| Internet Type | # Households | % Households |
| Dial-Up Internet | 0 | 0.0% |
| Broadband Home | 137 | 65.5% |
| Cellular Data Only | 15 | 7.2% |
| Satellite Internet | 4 | 1.9% |
| No Internet | 50 | 23.9% |
| Total | 209 | 100.0% |
Coalton Summary
Coalton, Ohio is a small village located in Jackson County, Ohio. It is situated in the Appalachian foothills of the Appalachian Mountains, and is part of the Appalachian Plateau. The village is located along the Ohio River, and is bordered by the towns of Wellston, Oak Hill, and Jackson. The population of Coalton was 1,093 at the 2010 census.
History
Coalton was founded in 1837 by a group of settlers from the nearby town of Wellston. The town was named after the abundance of coal in the area, and the first coal mine was opened in 1838. The coal industry was the main source of income for the town, and it was the largest coal-producing town in the area. The coal industry declined in the late 19th century, and the town began to decline as well.
In the early 20th century, the town began to experience a revival as the coal industry began to pick up again. The town was incorporated in 1921, and the population began to grow. The town was also home to a number of businesses, including a hotel, a bank, a movie theater, and a number of stores.
Geography
Coalton is located at 39°25'45" North, 82°17'45" West (39.429167, -82.295833). The village is situated in the Appalachian foothills of the Appalachian Mountains, and is part of the Appalachian Plateau. The village is located along the Ohio River, and is bordered by the towns of Wellston, Oak Hill, and Jackson.
The village has a total area of 0.6 square miles (1.6 km2), all of which is land. The village is located in a hilly area, and the terrain is mostly wooded. The village is located in a humid continental climate zone, with hot summers and cold winters.
Economy
The economy of Coalton is largely based on the coal industry. The town is home to a number of coal mines, and the coal industry is the main source of income for the town. The town is also home to a number of businesses, including a hotel, a bank, a movie theater, and a number of stores.
Demographics
As of the 2010 census, the population of Coalton was 1,093. The racial makeup of the village was 97.3% White, 0.7% African American, 0.2% Native American, 0.2% Asian, 0.1% from other races, and 1.5% from two or more races. Hispanic or Latino of any race were 0.7% of the population.
The median income for a household in the village was $30,000, and the median income for a family was $35,000. The per capita income for the village was $14,000. About 17.3% of families and 19.2% of the population were below the poverty line, including 25.3% of those under age 18 and 11.3% of those age 65 or over.
Common Questions
What is Per Capita Income in Coalton?
Per Capita income in Coalton is $20,478.
What is the Median Household income in Coalton?
Median Household Income in Coalton is $42,966.
What is Income or Wage Gap in Coalton?
Income or Wage Gap in Coalton is 53.8%.
Women in Coalton earn 46.2 cents for every dollar earned by a man.
What is Inequality or Gini Index in Coalton?
Inequality or Gini Index in Coalton is 0.39.
What is the Total Population of Coalton?
Total Population of Coalton is 403.
What is the Total Male Population of Coalton?
Total Male Population of Coalton is 172.
What is the Total Female Population of Coalton?
Total Female Population of Coalton is 231.
What is the Ratio of Males per 100 Females in Coalton?
There are 74.46 Males per 100 Females in Coalton.
What is the Ratio of Females per 100 Males in Coalton?
There are 134.30 Females per 100 Males in Coalton.
What is the Median Population Age in Coalton?
Median Population Age in Coalton is 53.5 Years.
What is the Average Family Size in Coalton
Average Family Size in Coalton is 3.1 People.
What is the Average Household Size in Coalton
Average Household Size in Coalton is 1.9 People.
How Large is the Labor Force in Coalton?
There are 184 People in the Labor Forcein in Coalton.
What is the Percentage of People in the Labor Force in Coalton?
50.8% of People are in the Labor Force in Coalton.
What is the Unemployment Rate in Coalton?
Unemployment Rate in Coalton is 36.4%.