Killbuck, OH Map & Demographics
Killbuck Map
Killbuck Overview
$33,774
PER CAPITA INCOME
$85,577
AVG FAMILY INCOME
$65,750
AVG HOUSEHOLD INCOME
50.3%
WAGE / INCOME GAP [ % ]
49.7¢/ $1
WAGE / INCOME GAP [ $ ]
0.36
INEQUALITY / GINI INDEX
936
TOTAL POPULATION
423
MALE POPULATION
513
FEMALE POPULATION
82.46
MALES / 100 FEMALES
121.28
FEMALES / 100 MALES
44.2
MEDIAN AGE
2.8
AVG FAMILY SIZE
2.3
AVG HOUSEHOLD SIZE
577
LABOR FORCE [ PEOPLE ]
70.6%
PERCENT IN LABOR FORCE
10.2%
UNEMPLOYMENT RATE
Killbuck Zip Codes
Income in Killbuck
Income Overview in Killbuck
Per Capita Income in Killbuck is $33,774, while median incomes of families and households are $85,577 and $65,750 respectively.
| Characteristic | Number | Measure |
| Per Capita Income | 936 | $33,774 |
| Median Family Income | 282 | $85,577 |
| Mean Family Income | 282 | $79,402 |
| Median Household Income | 406 | $65,750 |
| Mean Household Income | 406 | $66,191 |
| Income Deficit | 282 | $0 |
| Wage / Income Gap (%) | 936 | 50.33% |
| Wage / Income Gap ($) | 936 | 49.67¢ per $1 |
| Gini / Inequality Index | 936 | 0.36 |
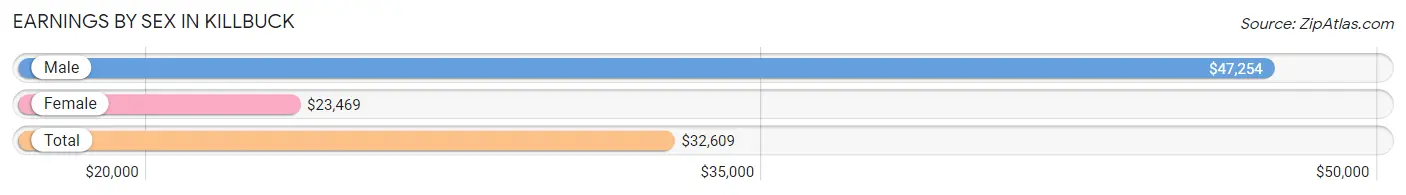
Earnings by Sex in Killbuck
Average Earnings in Killbuck are $32,609, $47,254 for men and $23,469 for women, a difference of 50.3%.
| Sex | Number | Average Earnings |
| Male | 306 (48.6%) | $47,254 |
| Female | 324 (51.4%) | $23,469 |
| Total | 630 (100.0%) | $32,609 |
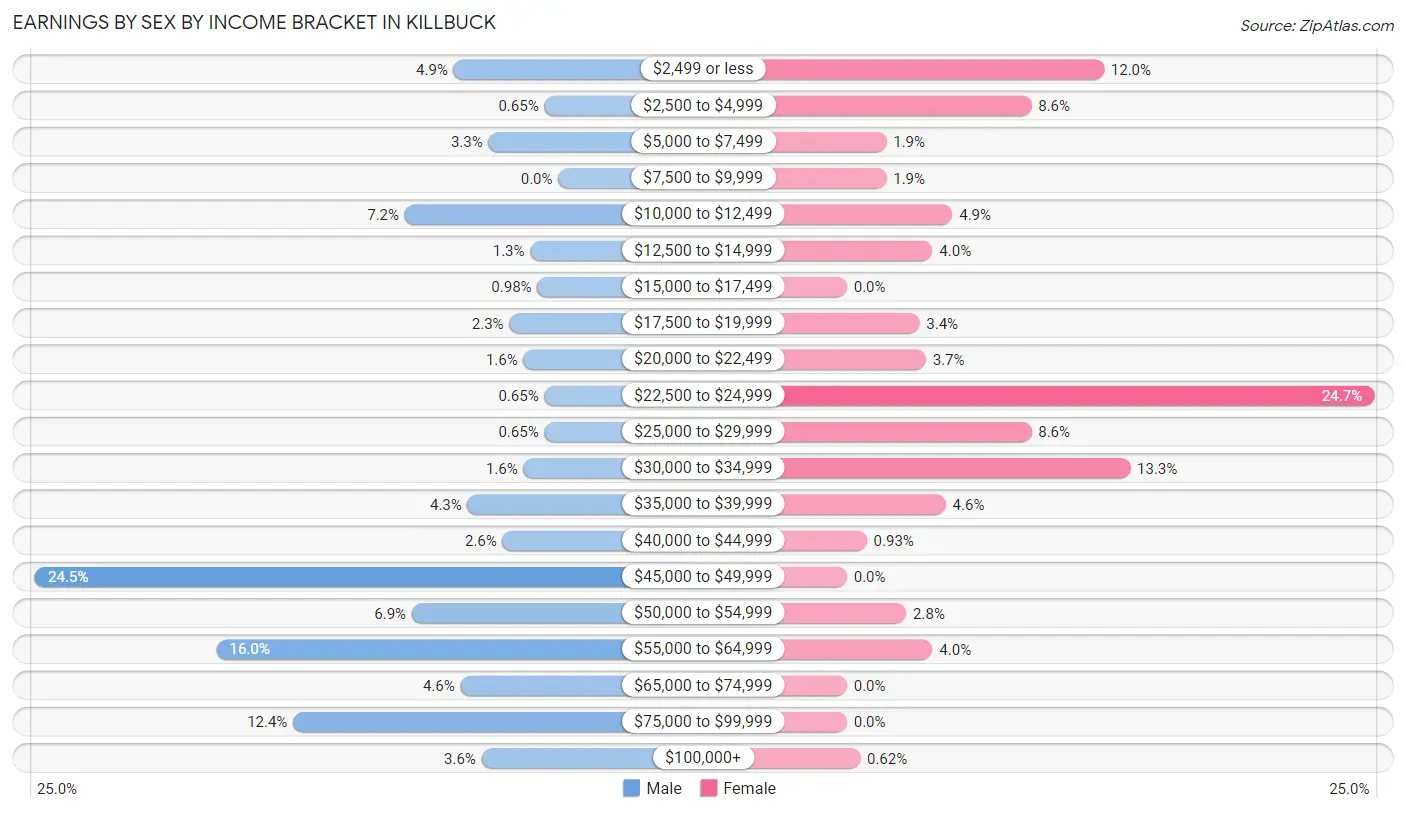
Earnings by Sex by Income Bracket in Killbuck
The most common earnings brackets in Killbuck are $45,000 to $49,999 for men (75 | 24.5%) and $22,500 to $24,999 for women (80 | 24.7%).
| Income | Male | Female |
| $2,499 or less | 15 (4.9%) | 39 (12.0%) |
| $2,500 to $4,999 | 2 (0.6%) | 28 (8.6%) |
| $5,000 to $7,499 | 10 (3.3%) | 6 (1.8%) |
| $7,500 to $9,999 | 0 (0.0%) | 6 (1.8%) |
| $10,000 to $12,499 | 22 (7.2%) | 16 (4.9%) |
| $12,500 to $14,999 | 4 (1.3%) | 13 (4.0%) |
| $15,000 to $17,499 | 3 (1.0%) | 0 (0.0%) |
| $17,500 to $19,999 | 7 (2.3%) | 11 (3.4%) |
| $20,000 to $22,499 | 5 (1.6%) | 12 (3.7%) |
| $22,500 to $24,999 | 2 (0.6%) | 80 (24.7%) |
| $25,000 to $29,999 | 2 (0.6%) | 28 (8.6%) |
| $30,000 to $34,999 | 5 (1.6%) | 43 (13.3%) |
| $35,000 to $39,999 | 13 (4.3%) | 15 (4.6%) |
| $40,000 to $44,999 | 8 (2.6%) | 3 (0.9%) |
| $45,000 to $49,999 | 75 (24.5%) | 0 (0.0%) |
| $50,000 to $54,999 | 21 (6.9%) | 9 (2.8%) |
| $55,000 to $64,999 | 49 (16.0%) | 13 (4.0%) |
| $65,000 to $74,999 | 14 (4.6%) | 0 (0.0%) |
| $75,000 to $99,999 | 38 (12.4%) | 0 (0.0%) |
| $100,000+ | 11 (3.6%) | 2 (0.6%) |
| Total | 306 (100.0%) | 324 (100.0%) |
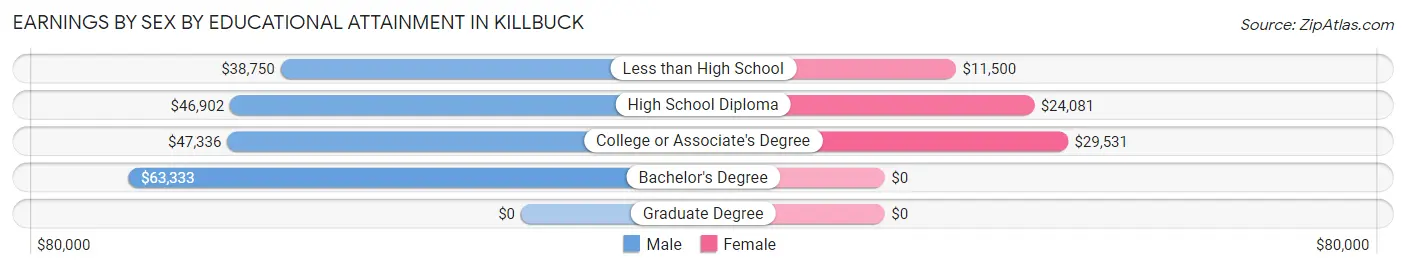
Earnings by Sex by Educational Attainment in Killbuck
Average earnings in Killbuck are $47,377 for men and $24,188 for women, a difference of 48.9%. Men with an educational attainment of bachelor's degree enjoy the highest average annual earnings of $63,333, while those with less than high school education earn the least with $38,750. Women with an educational attainment of college or associate's degree earn the most with the average annual earnings of $29,531, while those with less than high school education have the smallest earnings of $11,500.
| Educational Attainment | Male Income | Female Income |
| Less than High School | $38,750 | $11,500 |
| High School Diploma | $46,902 | $24,081 |
| College or Associate's Degree | $47,336 | $29,531 |
| Bachelor's Degree | $63,333 | $0 |
| Graduate Degree | - | - |
| Total | $47,377 | $24,188 |
Family Income in Killbuck
Family Income Brackets in Killbuck
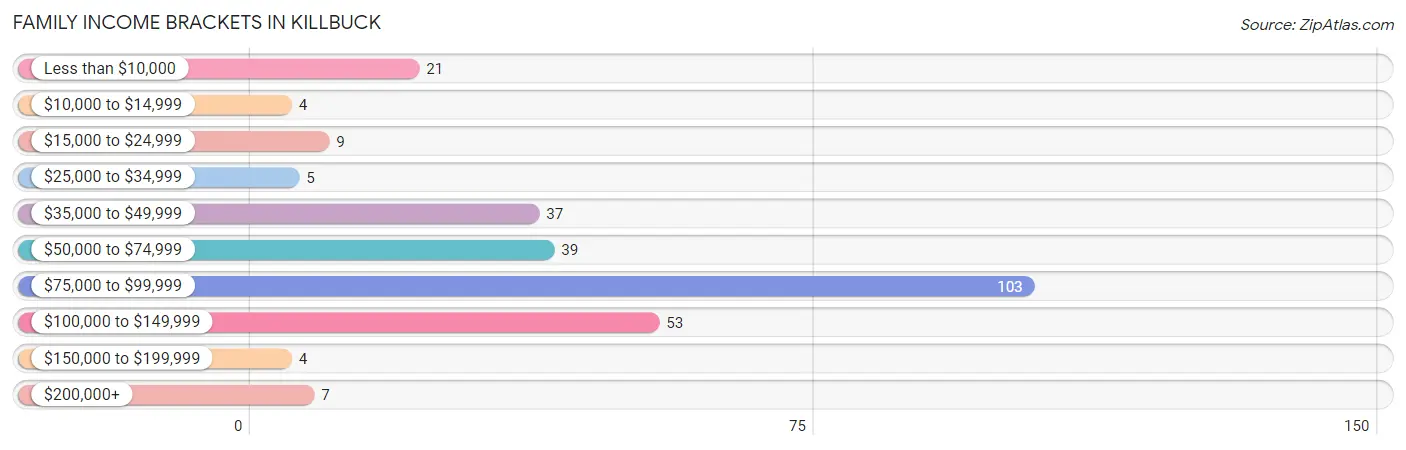
According to the Killbuck family income data, there are 103 families falling into the $75,000 to $99,999 income range, which is the most common income bracket and makes up 36.5% of all families. Conversely, the $10,000 to $14,999 income bracket is the least frequent group with only 4 families (1.4%) belonging to this category.
| Income Bracket | # Families | % Families |
| Less than $10,000 | 21 | 7.4% |
| $10,000 to $14,999 | 4 | 1.4% |
| $15,000 to $24,999 | 9 | 3.2% |
| $25,000 to $34,999 | 5 | 1.8% |
| $35,000 to $49,999 | 37 | 13.1% |
| $50,000 to $74,999 | 39 | 13.8% |
| $75,000 to $99,999 | 103 | 36.5% |
| $100,000 to $149,999 | 53 | 18.8% |
| $150,000 to $199,999 | 4 | 1.4% |
| $200,000+ | 7 | 2.5% |
Family Income by Famaliy Size in Killbuck
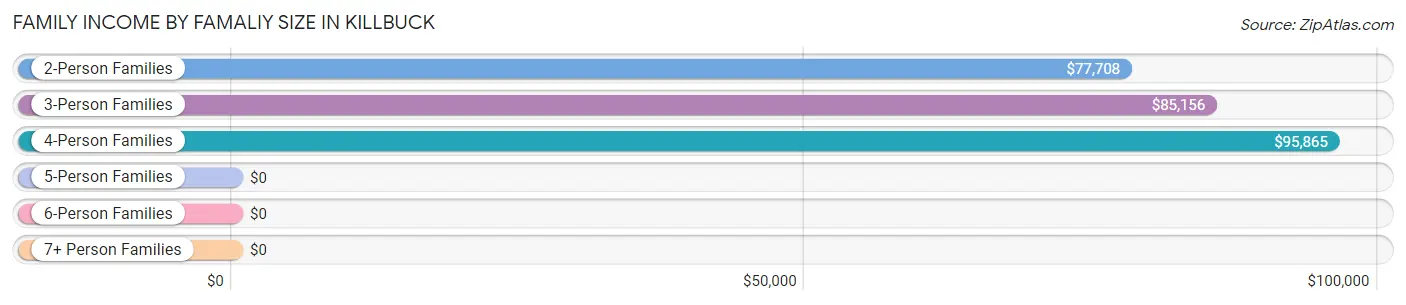
4-person families (37 | 13.1%) account for the highest median family income in Killbuck with $95,865 per family, while 2-person families (178 | 63.1%) have the highest median income of $38,854 per family member.
| Income Bracket | # Families | Median Income |
| 2-Person Families | 178 (63.1%) | $77,708 |
| 3-Person Families | 51 (18.1%) | $85,156 |
| 4-Person Families | 37 (13.1%) | $95,865 |
| 5-Person Families | 8 (2.8%) | $0 |
| 6-Person Families | 4 (1.4%) | $0 |
| 7+ Person Families | 4 (1.4%) | $0 |
| Total | 282 (100.0%) | $85,577 |
Family Income by Number of Earners in Killbuck
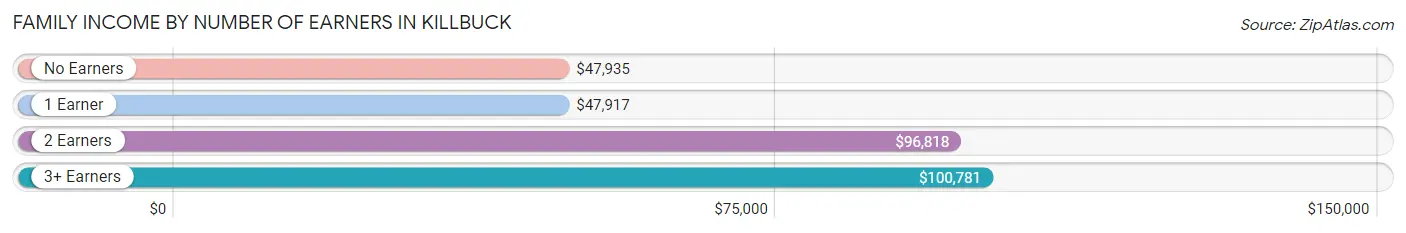
The median family income in Killbuck is $85,577, with families comprising 3+ earners (39) having the highest median family income of $100,781, while families with 1 earner (27) have the lowest median family income of $47,917, accounting for 13.8% and 9.6% of families, respectively.
| Number of Earners | # Families | Median Income |
| No Earners | 46 (16.3%) | $47,935 |
| 1 Earner | 27 (9.6%) | $47,917 |
| 2 Earners | 170 (60.3%) | $96,818 |
| 3+ Earners | 39 (13.8%) | $100,781 |
| Total | 282 (100.0%) | $85,577 |
Household Income in Killbuck
Household Income Brackets in Killbuck
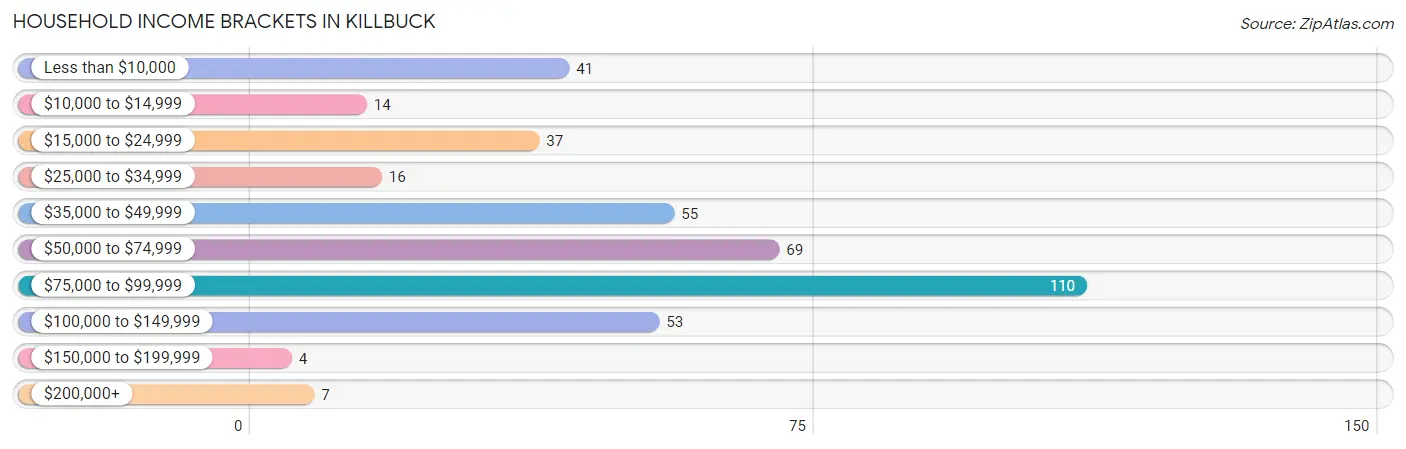
With 110 households falling in the category, the $75,000 to $99,999 income range is the most frequent in Killbuck, accounting for 27.1% of all households. In contrast, only 4 households (1.0%) fall into the $150,000 to $199,999 income bracket, making it the least populous group.
| Income Bracket | # Households | % Households |
| Less than $10,000 | 41 | 10.1% |
| $10,000 to $14,999 | 14 | 3.4% |
| $15,000 to $24,999 | 37 | 9.1% |
| $25,000 to $34,999 | 16 | 3.9% |
| $35,000 to $49,999 | 55 | 13.5% |
| $50,000 to $74,999 | 69 | 17.0% |
| $75,000 to $99,999 | 110 | 27.1% |
| $100,000 to $149,999 | 53 | 13.1% |
| $150,000 to $199,999 | 4 | 1.0% |
| $200,000+ | 7 | 1.7% |
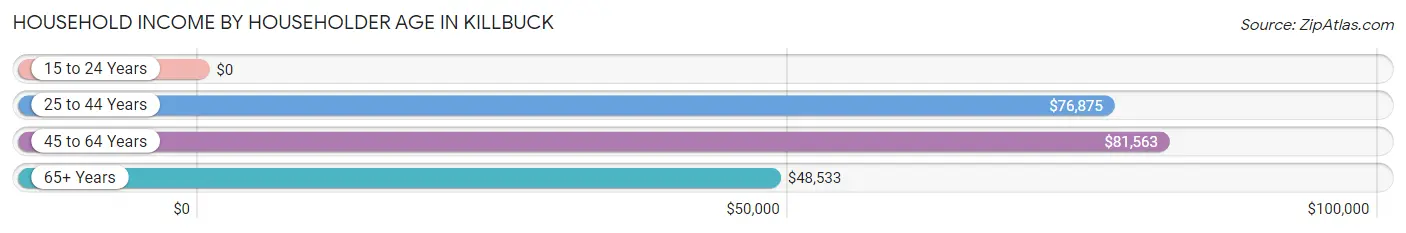
Household Income by Householder Age in Killbuck
The median household income in Killbuck is $65,750, with the highest median household income of $81,563 found in the 45 to 64 years age bracket for the primary householder. A total of 87 households (21.4%) fall into this category. Meanwhile, the 15 to 24 years age bracket for the primary householder has the lowest median household income of $0, with 21 households (5.2%) in this group.
| Income Bracket | # Households | Median Income |
| 15 to 24 Years | 21 (5.2%) | $0 |
| 25 to 44 Years | 131 (32.3%) | $76,875 |
| 45 to 64 Years | 87 (21.4%) | $81,563 |
| 65+ Years | 167 (41.1%) | $48,533 |
| Total | 406 (100.0%) | $65,750 |
Poverty in Killbuck
Income Below Poverty by Sex and Age in Killbuck
With 10.9% poverty level for males and 18.9% for females among the residents of Killbuck, under 5 year old males and 25 to 34 year old females are the most vulnerable to poverty, with 15 males (41.7%) and 36 females (40.5%) in their respective age groups living below the poverty level.
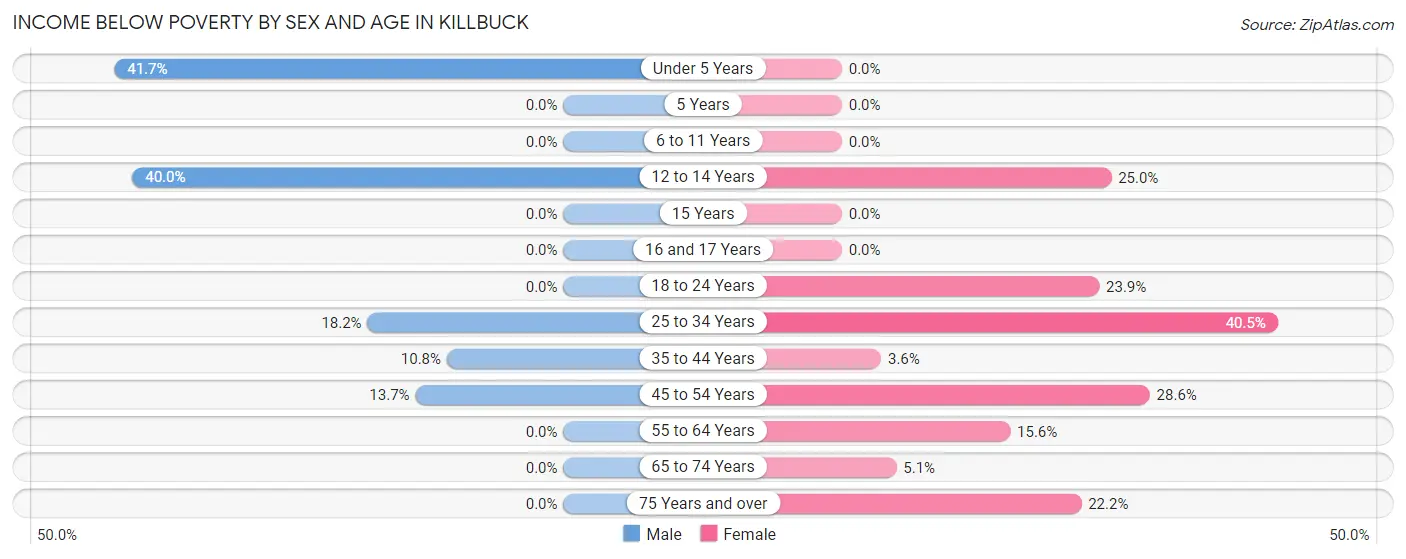
| Age Bracket | Male | Female |
| Under 5 Years | 15 (41.7%) | 0 (0.0%) |
| 5 Years | 0 (0.0%) | 0 (0.0%) |
| 6 to 11 Years | 0 (0.0%) | 0 (0.0%) |
| 12 to 14 Years | 2 (40.0%) | 5 (25.0%) |
| 15 Years | 0 (0.0%) | 0 (0.0%) |
| 16 and 17 Years | 0 (0.0%) | 0 (0.0%) |
| 18 to 24 Years | 0 (0.0%) | 16 (23.9%) |
| 25 to 34 Years | 14 (18.2%) | 36 (40.5%) |
| 35 to 44 Years | 8 (10.8%) | 2 (3.6%) |
| 45 to 54 Years | 7 (13.7%) | 8 (28.6%) |
| 55 to 64 Years | 0 (0.0%) | 10 (15.6%) |
| 65 to 74 Years | 0 (0.0%) | 4 (5.1%) |
| 75 Years and over | 0 (0.0%) | 16 (22.2%) |
| Total | 46 (10.9%) | 97 (18.9%) |
Income Above Poverty by Sex and Age in Killbuck
According to the poverty statistics in Killbuck, males aged 6 to 11 years and females aged under 5 years are the age groups that are most secure financially, with 100.0% of males and 100.0% of females in these age groups living above the poverty line.
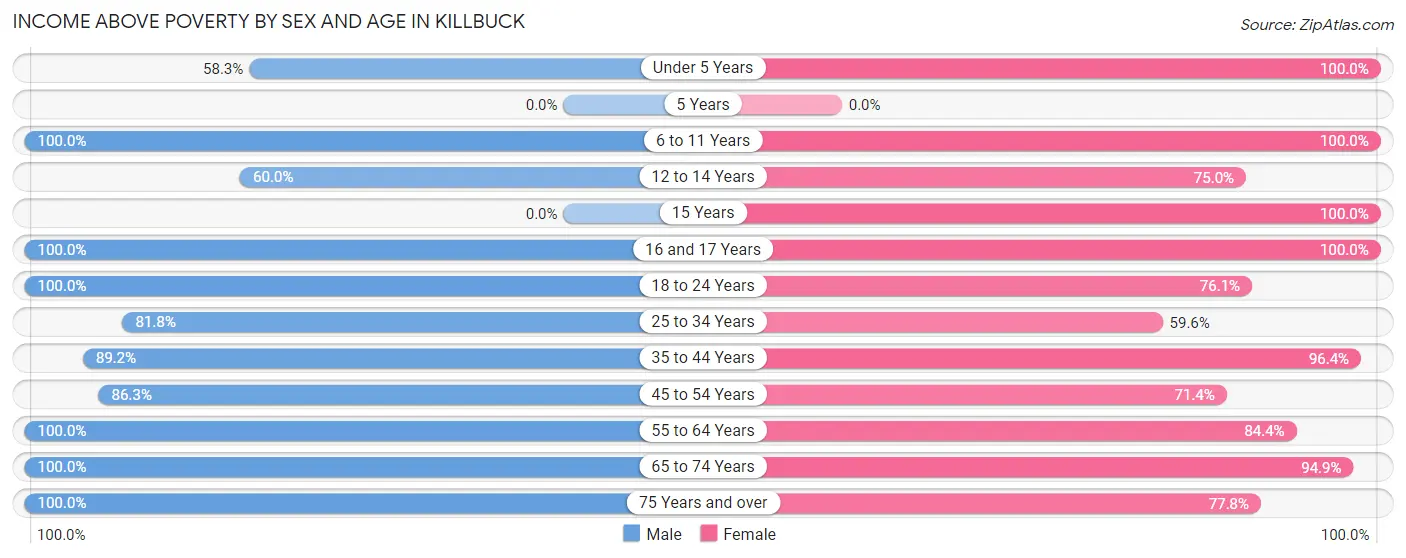
| Age Bracket | Male | Female |
| Under 5 Years | 21 (58.3%) | 5 (100.0%) |
| 5 Years | 0 (0.0%) | 0 (0.0%) |
| 6 to 11 Years | 23 (100.0%) | 27 (100.0%) |
| 12 to 14 Years | 3 (60.0%) | 15 (75.0%) |
| 15 Years | 0 (0.0%) | 3 (100.0%) |
| 16 and 17 Years | 4 (100.0%) | 4 (100.0%) |
| 18 to 24 Years | 10 (100.0%) | 51 (76.1%) |
| 25 to 34 Years | 63 (81.8%) | 53 (59.6%) |
| 35 to 44 Years | 66 (89.2%) | 53 (96.4%) |
| 45 to 54 Years | 44 (86.3%) | 20 (71.4%) |
| 55 to 64 Years | 38 (100.0%) | 54 (84.4%) |
| 65 to 74 Years | 89 (100.0%) | 75 (94.9%) |
| 75 Years and over | 16 (100.0%) | 56 (77.8%) |
| Total | 377 (89.1%) | 416 (81.1%) |
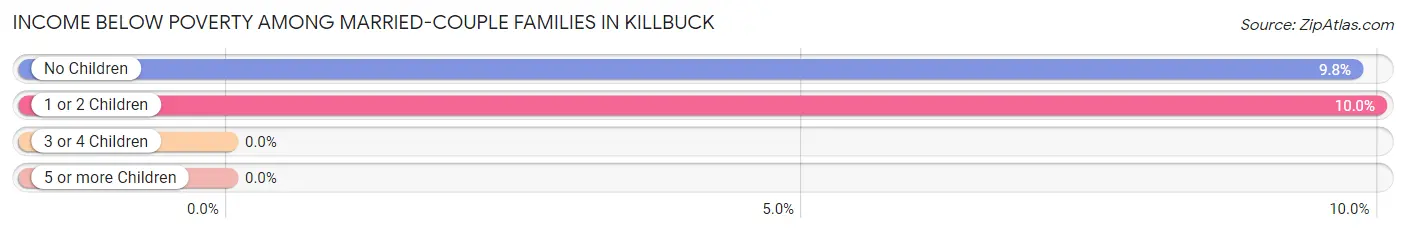
Income Below Poverty Among Married-Couple Families in Killbuck
The poverty statistics for married-couple families in Killbuck show that 9.3% or 23 of the total 248 families live below the poverty line. Families with 1 or 2 children have the highest poverty rate of 10.0%, comprising of 4 families. On the other hand, families with 3 or 4 children have the lowest poverty rate of 0.0%, which includes 0 families.
| Children | Above Poverty | Below Poverty |
| No Children | 175 (90.2%) | 19 (9.8%) |
| 1 or 2 Children | 36 (90.0%) | 4 (10.0%) |
| 3 or 4 Children | 14 (100.0%) | 0 (0.0%) |
| 5 or more Children | 0 (0.0%) | 0 (0.0%) |
| Total | 225 (90.7%) | 23 (9.3%) |
Income Below Poverty Among Single-Parent Households in Killbuck
According to the poverty data in Killbuck, 50.0% or 4 single-father households and 26.9% or 7 single-mother households are living below the poverty line. Among single-father households, those with 1 or 2 children have the highest poverty rate, with 4 households (50.0%) experiencing poverty. Likewise, among single-mother households, those with 3 or 4 children have the highest poverty rate, with 2 households (100.0%) falling below the poverty line.
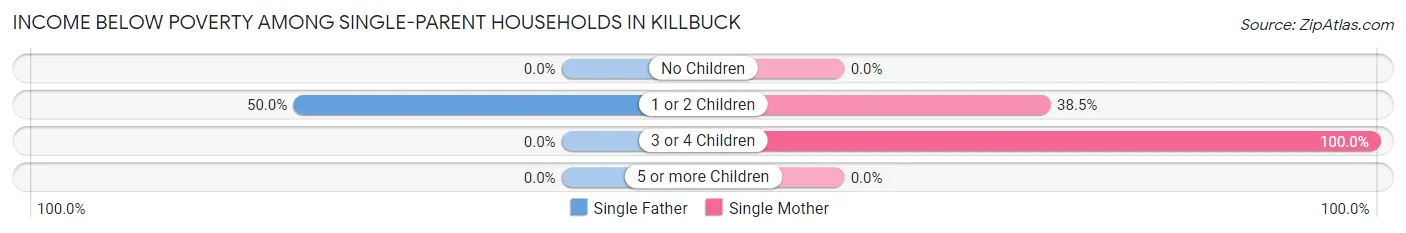
| Children | Single Father | Single Mother |
| No Children | 0 (0.0%) | 0 (0.0%) |
| 1 or 2 Children | 4 (50.0%) | 5 (38.5%) |
| 3 or 4 Children | 0 (0.0%) | 2 (100.0%) |
| 5 or more Children | 0 (0.0%) | 0 (0.0%) |
| Total | 4 (50.0%) | 7 (26.9%) |
Income Below Poverty Among Married-Couple vs Single-Parent Households in Killbuck
The poverty data for Killbuck shows that 23 of the married-couple family households (9.3%) and 11 of the single-parent households (32.4%) are living below the poverty level. Within the married-couple family households, those with 1 or 2 children have the highest poverty rate, with 4 households (10.0%) falling below the poverty line. Among the single-parent households, those with 3 or 4 children have the highest poverty rate, with 2 household (100.0%) living below poverty.
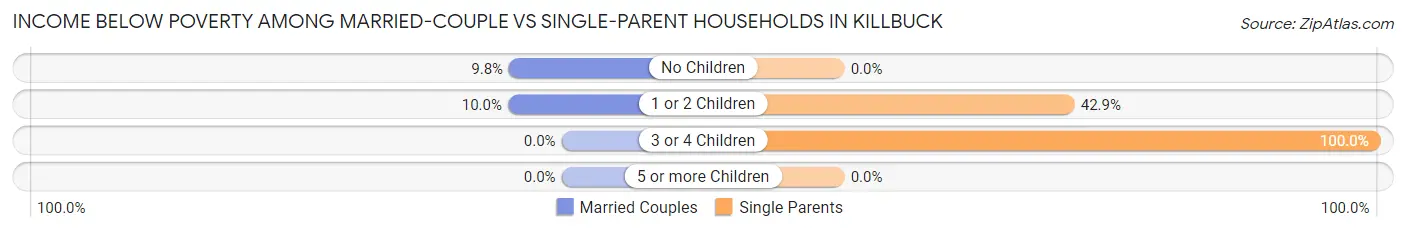
| Children | Married-Couple Families | Single-Parent Households |
| No Children | 19 (9.8%) | 0 (0.0%) |
| 1 or 2 Children | 4 (10.0%) | 9 (42.9%) |
| 3 or 4 Children | 0 (0.0%) | 2 (100.0%) |
| 5 or more Children | 0 (0.0%) | 0 (0.0%) |
| Total | 23 (9.3%) | 11 (32.4%) |
Race in Killbuck
The most populous races in Killbuck are White / Caucasian (889 | 95.0%), and Two or more Races (47 | 5.0%).
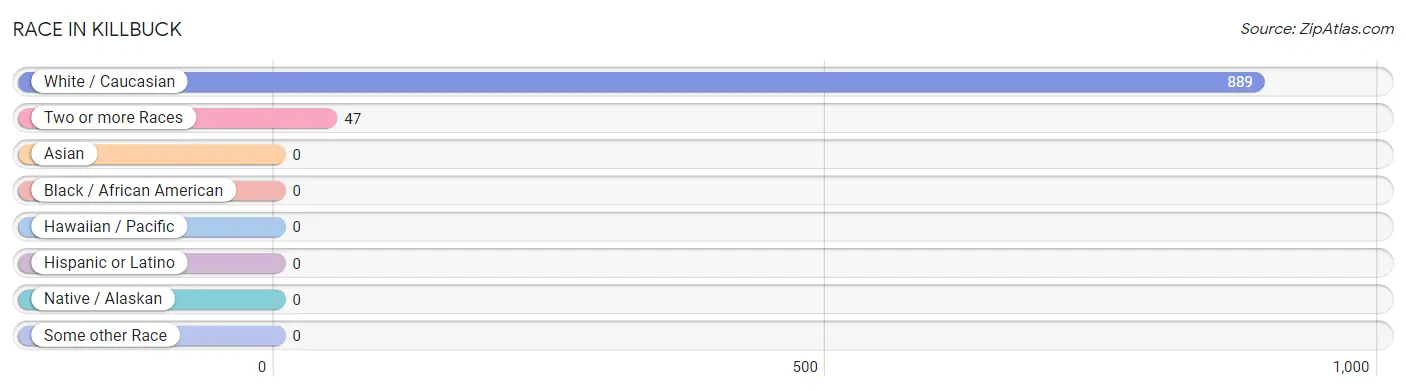
| Race | # Population | % Population |
| Asian | 0 | 0.0% |
| Black / African American | 0 | 0.0% |
| Hawaiian / Pacific | 0 | 0.0% |
| Hispanic or Latino | 0 | 0.0% |
| Native / Alaskan | 0 | 0.0% |
| White / Caucasian | 889 | 95.0% |
| Two or more Races | 47 | 5.0% |
| Some other Race | 0 | 0.0% |
| Total | 936 | 100.0% |
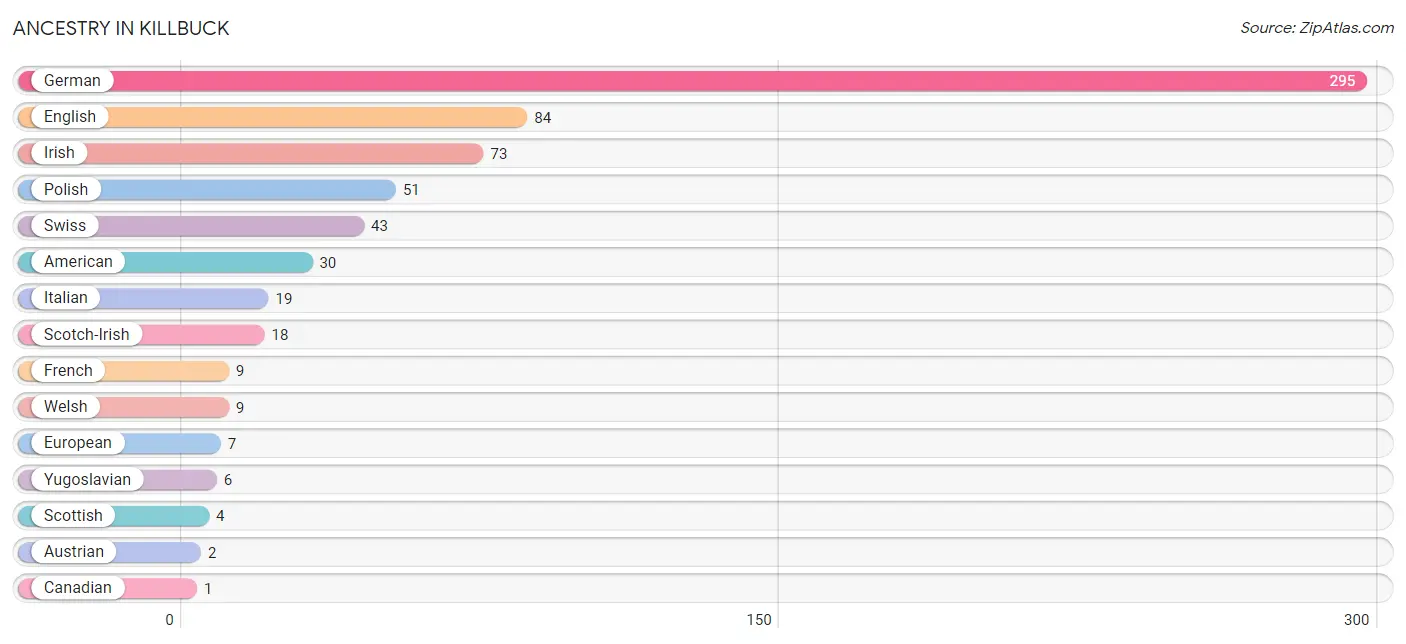
Ancestry in Killbuck
The most populous ancestries reported in Killbuck are German (295 | 31.5%), English (84 | 9.0%), Irish (73 | 7.8%), Polish (51 | 5.4%), and Swiss (43 | 4.6%), together accounting for 58.3% of all Killbuck residents.
| Ancestry | # Population | % Population |
| American | 30 | 3.2% |
| Austrian | 2 | 0.2% |
| Canadian | 1 | 0.1% |
| English | 84 | 9.0% |
| European | 7 | 0.7% |
| French | 9 | 1.0% |
| German | 295 | 31.5% |
| Irish | 73 | 7.8% |
| Italian | 19 | 2.0% |
| Polish | 51 | 5.4% |
| Scotch-Irish | 18 | 1.9% |
| Scottish | 4 | 0.4% |
| Swiss | 43 | 4.6% |
| Welsh | 9 | 1.0% |
| Yugoslavian | 6 | 0.6% | View All 15 Rows |
Immigrants in Killbuck
The most numerous immigrant groups reported in Killbuck came from Europe (2 | 0.2%), and Northern Europe (2 | 0.2%), together accounting for 0.4% of all Killbuck residents.
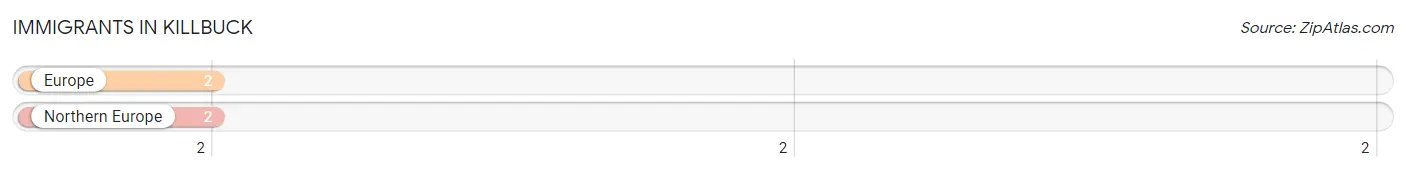
| Immigration Origin | # Population | % Population |
| Europe | 2 | 0.2% |
| Northern Europe | 2 | 0.2% | View All 2 Rows |
Sex and Age in Killbuck
Sex and Age in Killbuck
The most populous age groups in Killbuck are 70 to 74 Years (67 | 15.8%) for men and 65 to 69 Years (61 | 11.9%) for women.
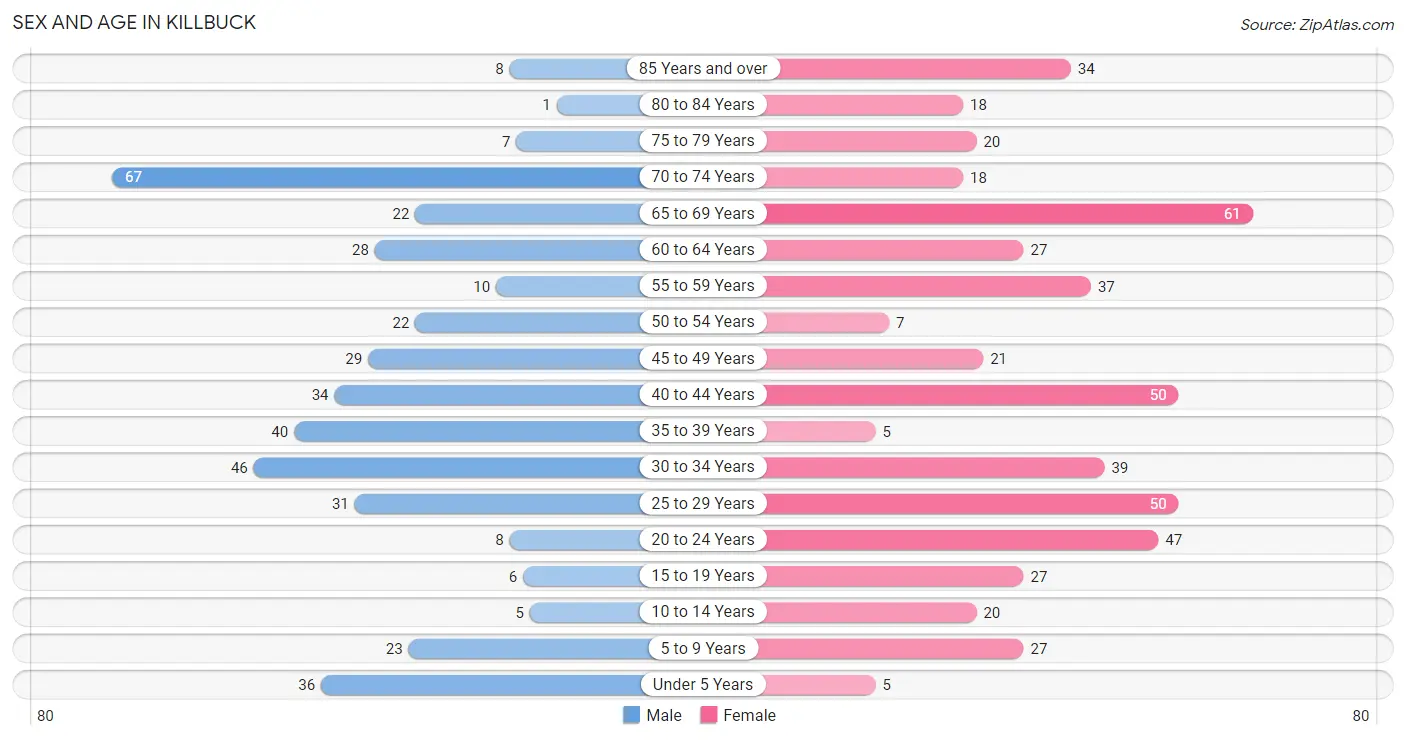
| Age Bracket | Male | Female |
| Under 5 Years | 36 (8.5%) | 5 (1.0%) |
| 5 to 9 Years | 23 (5.4%) | 27 (5.3%) |
| 10 to 14 Years | 5 (1.2%) | 20 (3.9%) |
| 15 to 19 Years | 6 (1.4%) | 27 (5.3%) |
| 20 to 24 Years | 8 (1.9%) | 47 (9.2%) |
| 25 to 29 Years | 31 (7.3%) | 50 (9.8%) |
| 30 to 34 Years | 46 (10.9%) | 39 (7.6%) |
| 35 to 39 Years | 40 (9.5%) | 5 (1.0%) |
| 40 to 44 Years | 34 (8.0%) | 50 (9.8%) |
| 45 to 49 Years | 29 (6.9%) | 21 (4.1%) |
| 50 to 54 Years | 22 (5.2%) | 7 (1.4%) |
| 55 to 59 Years | 10 (2.4%) | 37 (7.2%) |
| 60 to 64 Years | 28 (6.6%) | 27 (5.3%) |
| 65 to 69 Years | 22 (5.2%) | 61 (11.9%) |
| 70 to 74 Years | 67 (15.8%) | 18 (3.5%) |
| 75 to 79 Years | 7 (1.7%) | 20 (3.9%) |
| 80 to 84 Years | 1 (0.2%) | 18 (3.5%) |
| 85 Years and over | 8 (1.9%) | 34 (6.6%) |
| Total | 423 (100.0%) | 513 (100.0%) |
Families and Households in Killbuck
Median Family Size in Killbuck
The median family size in Killbuck is 2.80 persons per family, with single female/mother families (26 | 9.2%) accounting for the largest median family size of 3 persons per family. On the other hand, single male/father families (8 | 2.8%) represent the smallest median family size with 2.38 persons per family.
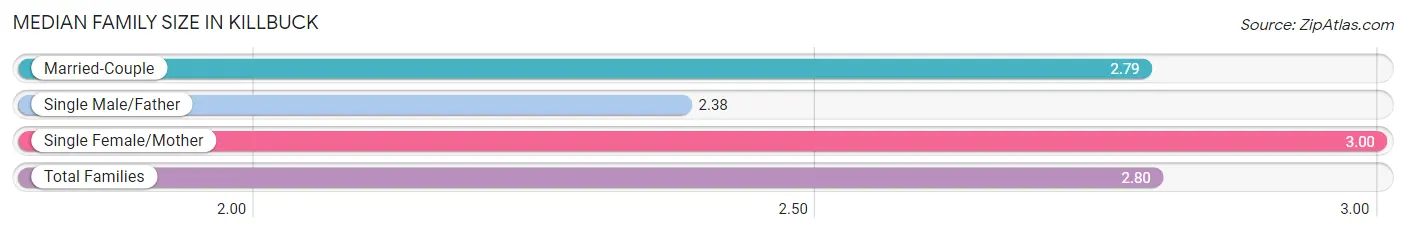
| Family Type | # Families | Family Size |
| Married-Couple | 248 (87.9%) | 2.79 |
| Single Male/Father | 8 (2.8%) | 2.38 |
| Single Female/Mother | 26 (9.2%) | 3.00 |
| Total Families | 282 (100.0%) | 2.80 |
Median Household Size in Killbuck
The median household size in Killbuck is 2.31 persons per household, with single female/mother households (26 | 6.4%) accounting for the largest median household size of 3.12 persons per household. non-family households (124 | 30.5%) represent the smallest median household size with 1.12 persons per household.
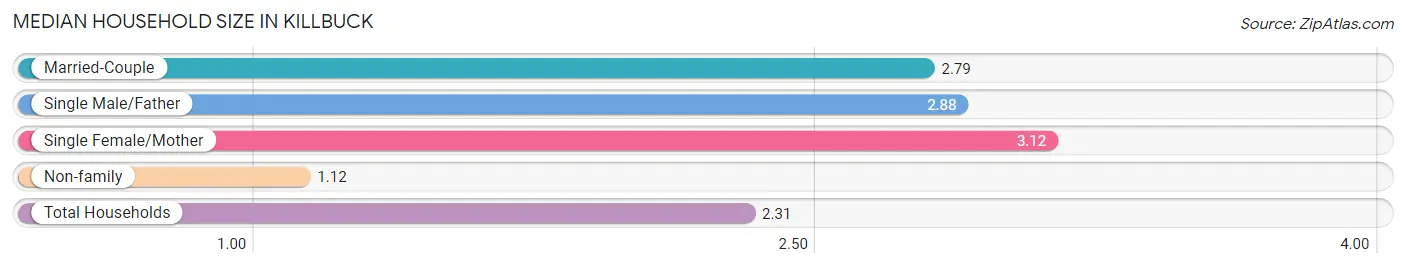
| Household Type | # Households | Household Size |
| Married-Couple | 248 (61.1%) | 2.79 |
| Single Male/Father | 8 (2.0%) | 2.88 |
| Single Female/Mother | 26 (6.4%) | 3.12 |
| Non-family | 124 (30.5%) | 1.12 |
| Total Households | 406 (100.0%) | 2.31 |
Household Size by Marriage Status in Killbuck
Out of a total of 406 households in Killbuck, 282 (69.5%) are family households, while 124 (30.5%) are nonfamily households. The most numerous type of family households are 2-person households, comprising 178, and the most common type of nonfamily households are 1-person households, comprising 109.
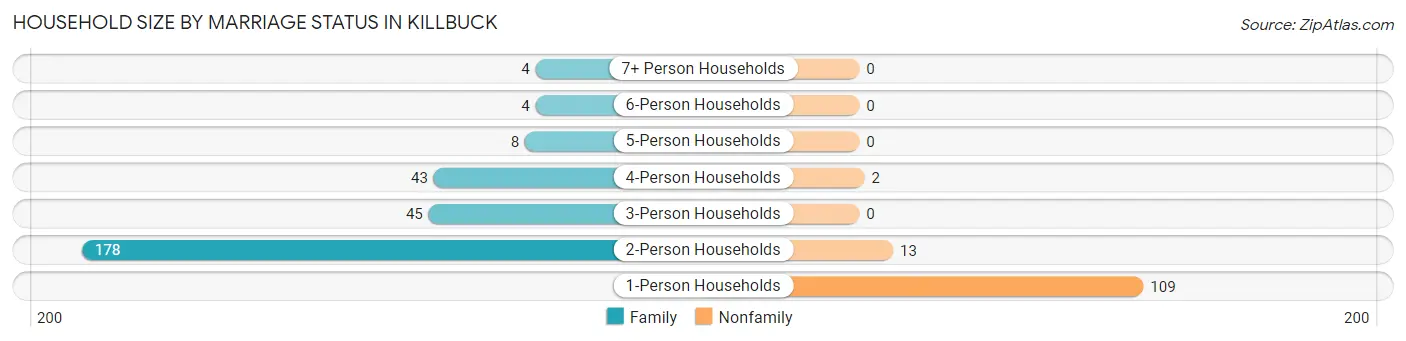
| Household Size | Family Households | Nonfamily Households |
| 1-Person Households | - | 109 (26.9%) |
| 2-Person Households | 178 (43.8%) | 13 (3.2%) |
| 3-Person Households | 45 (11.1%) | 0 (0.0%) |
| 4-Person Households | 43 (10.6%) | 2 (0.5%) |
| 5-Person Households | 8 (2.0%) | 0 (0.0%) |
| 6-Person Households | 4 (1.0%) | 0 (0.0%) |
| 7+ Person Households | 4 (1.0%) | 0 (0.0%) |
| Total | 282 (69.5%) | 124 (30.5%) |
Female Fertility in Killbuck
Fertility by Age in Killbuck
Average fertility rate in Killbuck is 54.0 births per 1,000 women. Women in the age bracket of 20 to 34 years have the highest fertility rate with 96.0 births per 1,000 women. Women in the age bracket of 20 to 34 years acount for 100.0% of all women with births.
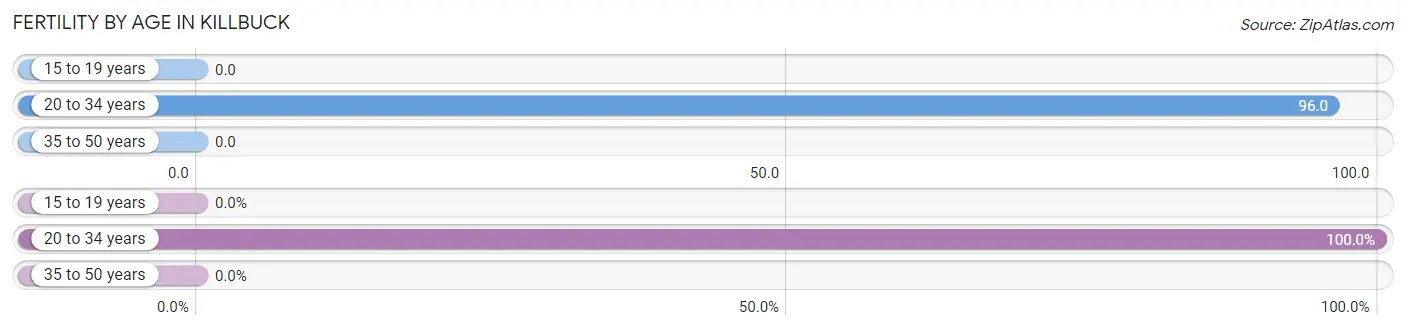
| Age Bracket | Women with Births | Births / 1,000 Women |
| 15 to 19 years | 0 (0.0%) | 0.0 |
| 20 to 34 years | 13 (100.0%) | 96.0 |
| 35 to 50 years | 0 (0.0%) | 0.0 |
| Total | 13 (100.0%) | 54.0 |
Fertility by Age by Marriage Status in Killbuck
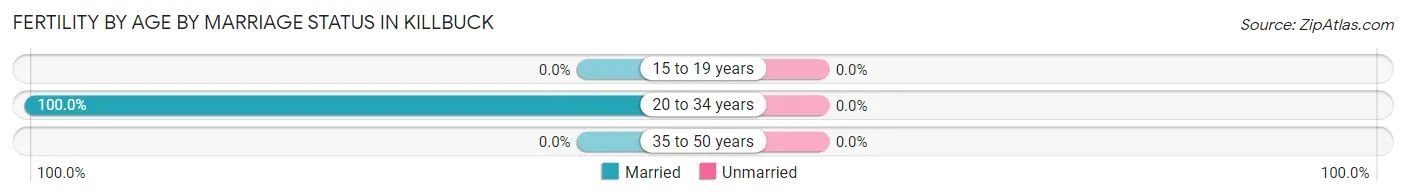
| Age Bracket | Married | Unmarried |
| 15 to 19 years | 0 (0.0%) | 0 (0.0%) |
| 20 to 34 years | 13 (100.0%) | 0 (0.0%) |
| 35 to 50 years | 0 (0.0%) | 0 (0.0%) |
| Total | 13 (100.0%) | 0 (0.0%) |
Fertility by Education in Killbuck
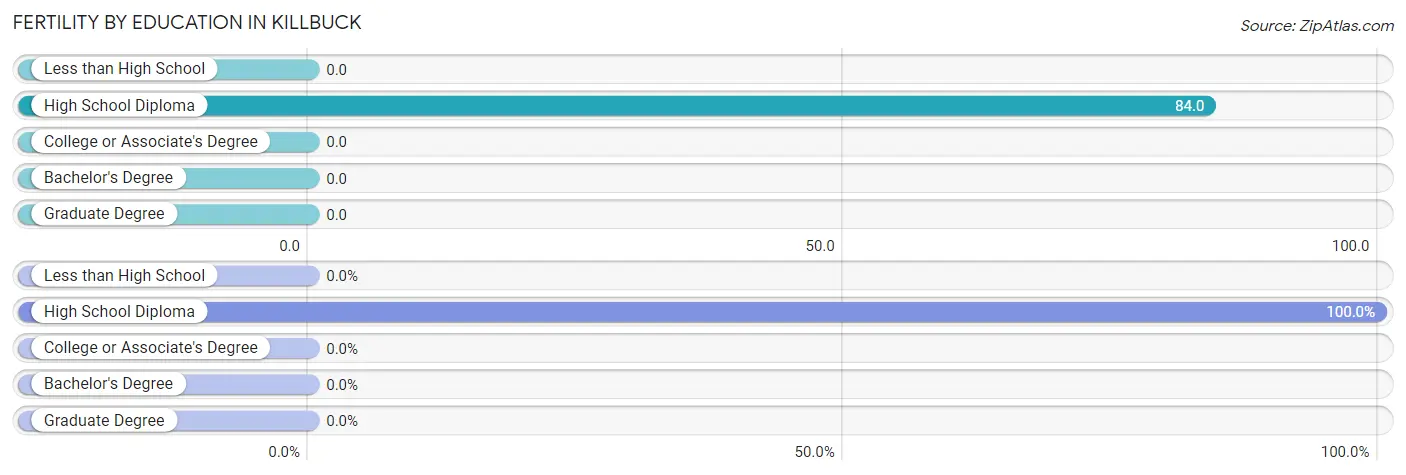
| Educational Attainment | Women with Births | Births / 1,000 Women |
| Less than High School | 0 (0.0%) | 0.0 |
| High School Diploma | 13 (100.0%) | 84.0 |
| College or Associate's Degree | 0 (0.0%) | 0.0 |
| Bachelor's Degree | 0 (0.0%) | 0.0 |
| Graduate Degree | 0 (0.0%) | 0.0 |
| Total | 13 (100.0%) | 54.0 |
Fertility by Education by Marriage Status in Killbuck
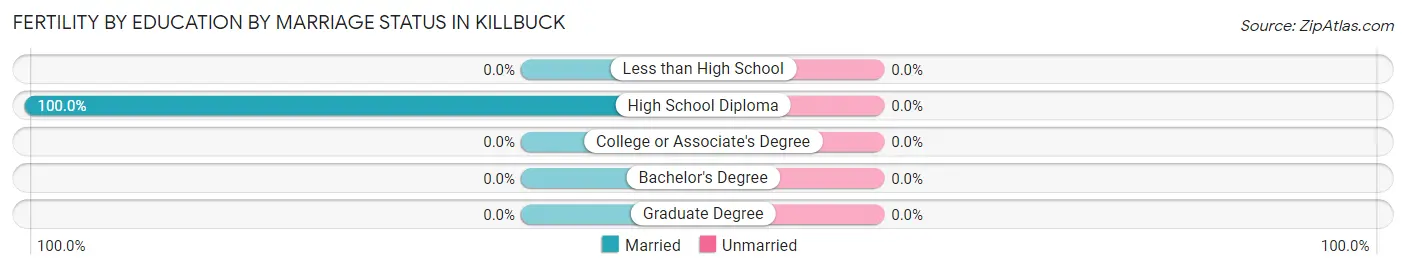
| Educational Attainment | Married | Unmarried |
| Less than High School | 0 (0.0%) | 0 (0.0%) |
| High School Diploma | 13 (100.0%) | 0 (0.0%) |
| College or Associate's Degree | 0 (0.0%) | 0 (0.0%) |
| Bachelor's Degree | 0 (0.0%) | 0 (0.0%) |
| Graduate Degree | 0 (0.0%) | 0 (0.0%) |
| Total | 13 (100.0%) | 0 (0.0%) |
Employment Characteristics in Killbuck
Employment by Class of Employer in Killbuck
Among the 500 employed individuals in Killbuck, private company employees (360 | 72.0%), self-employed (not incorporated) (68 | 13.6%), and local government employees (44 | 8.8%) make up the most common classes of employment.
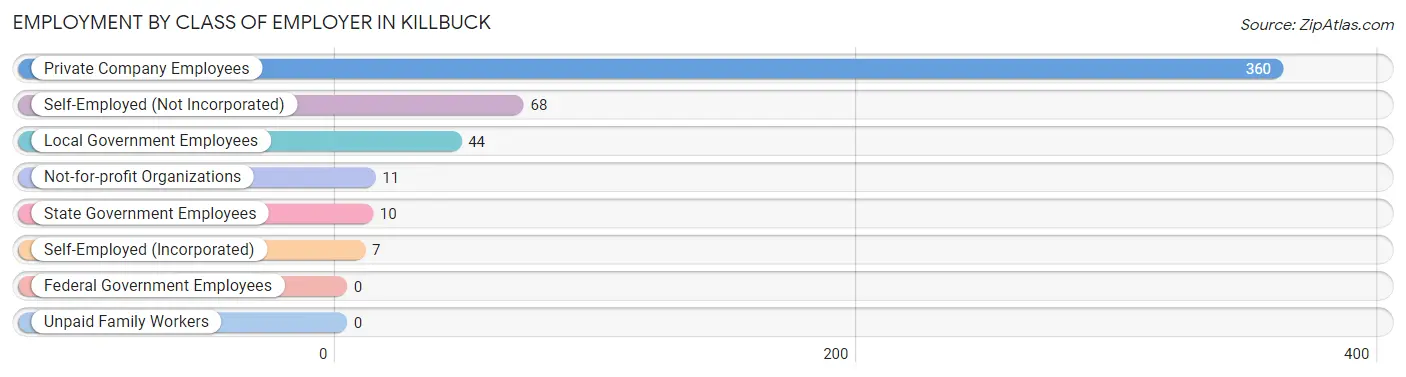
| Employer Class | # Employees | % Employees |
| Private Company Employees | 360 | 72.0% |
| Self-Employed (Incorporated) | 7 | 1.4% |
| Self-Employed (Not Incorporated) | 68 | 13.6% |
| Not-for-profit Organizations | 11 | 2.2% |
| Local Government Employees | 44 | 8.8% |
| State Government Employees | 10 | 2.0% |
| Federal Government Employees | 0 | 0.0% |
| Unpaid Family Workers | 0 | 0.0% |
| Total | 500 | 100.0% |
Employment Status by Age in Killbuck
According to the labor force statistics for Killbuck, out of the total population over 16 years of age (817), 70.6% or 577 individuals are in the labor force, with 10.2% or 59 of them unemployed. The age group with the highest labor force participation rate is 30 to 34 years, with 100.0% or 85 individuals in the labor force. Within the labor force, the 35 to 44 years age range has the highest percentage of unemployed individuals, with 29.4% or 37 of them being unemployed.
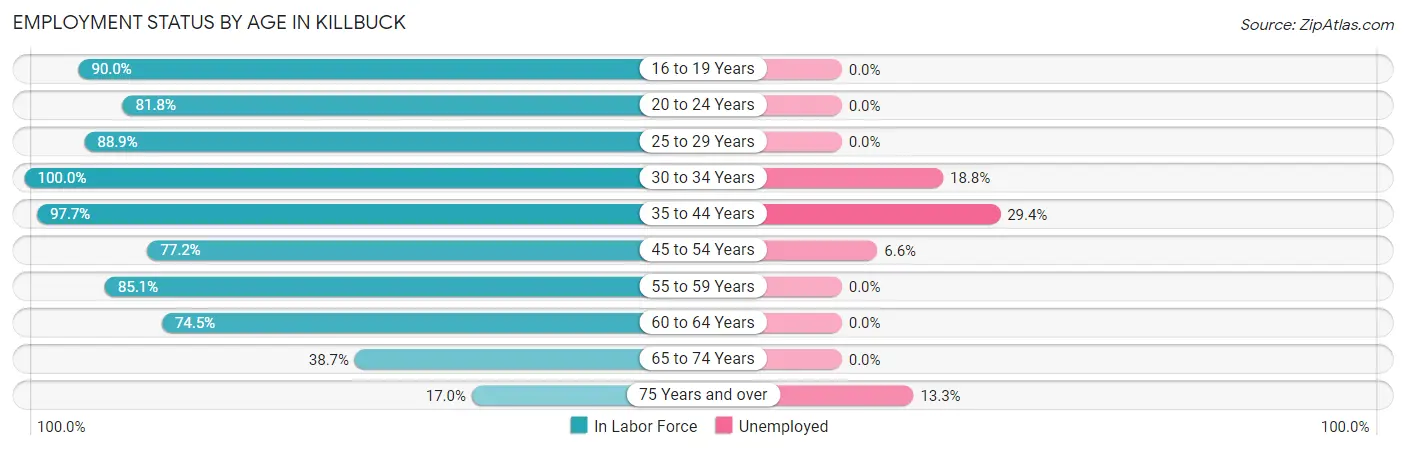
| Age Bracket | In Labor Force | Unemployed |
| 16 to 19 Years | 27 (90.0%) | 0 (0.0%) |
| 20 to 24 Years | 45 (81.8%) | 0 (0.0%) |
| 25 to 29 Years | 72 (88.9%) | 0 (0.0%) |
| 30 to 34 Years | 85 (100.0%) | 16 (18.8%) |
| 35 to 44 Years | 126 (97.7%) | 37 (29.4%) |
| 45 to 54 Years | 61 (77.2%) | 4 (6.6%) |
| 55 to 59 Years | 40 (85.1%) | 0 (0.0%) |
| 60 to 64 Years | 41 (74.5%) | 0 (0.0%) |
| 65 to 74 Years | 65 (38.7%) | 0 (0.0%) |
| 75 Years and over | 15 (17.0%) | 2 (13.3%) |
| Total | 577 (70.6%) | 59 (10.2%) |
Employment Status by Educational Attainment in Killbuck
According to labor force statistics for Killbuck, 89.3% of individuals (425) out of the total population between 25 and 64 years of age (476) are in the labor force, with 13.4% or 57 of them being unemployed. The group with the highest labor force participation rate are those with the educational attainment of bachelor's degree or higher, with 100.0% or 21 individuals in the labor force. Within the labor force, individuals with less than high school education have the highest percentage of unemployment, with 15.8% or 3 of them being unemployed.
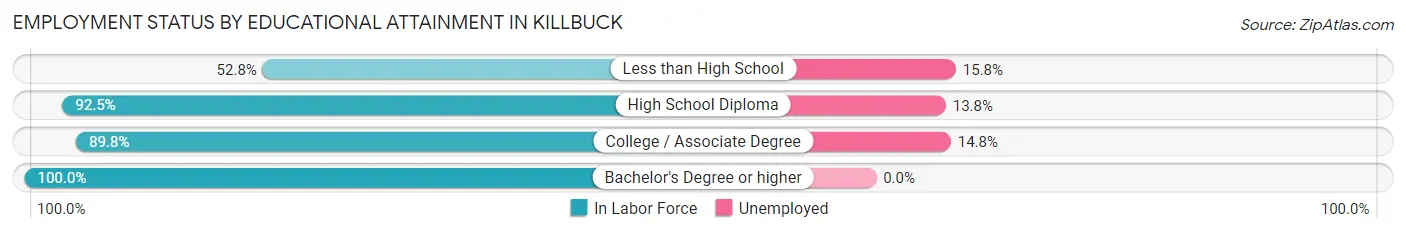
| Educational Attainment | In Labor Force | Unemployed |
| Less than High School | 19 (52.8%) | 6 (15.8%) |
| High School Diploma | 297 (92.5%) | 44 (13.8%) |
| College / Associate Degree | 88 (89.8%) | 15 (14.8%) |
| Bachelor's Degree or higher | 21 (100.0%) | 0 (0.0%) |
| Total | 425 (89.3%) | 64 (13.4%) |
Employment Occupations by Sex in Killbuck
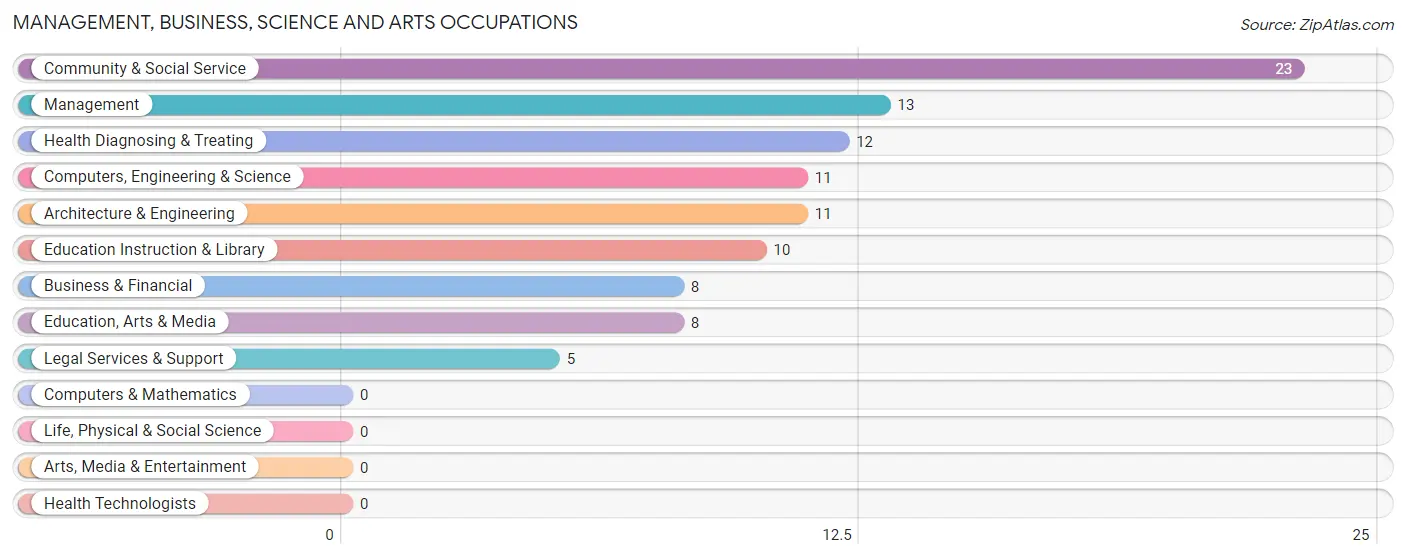
Management, Business, Science and Arts Occupations
The most common Management, Business, Science and Arts occupations in Killbuck are Community & Social Service (23 | 4.4%), Management (13 | 2.5%), Health Diagnosing & Treating (12 | 2.3%), Computers, Engineering & Science (11 | 2.1%), and Architecture & Engineering (11 | 2.1%).
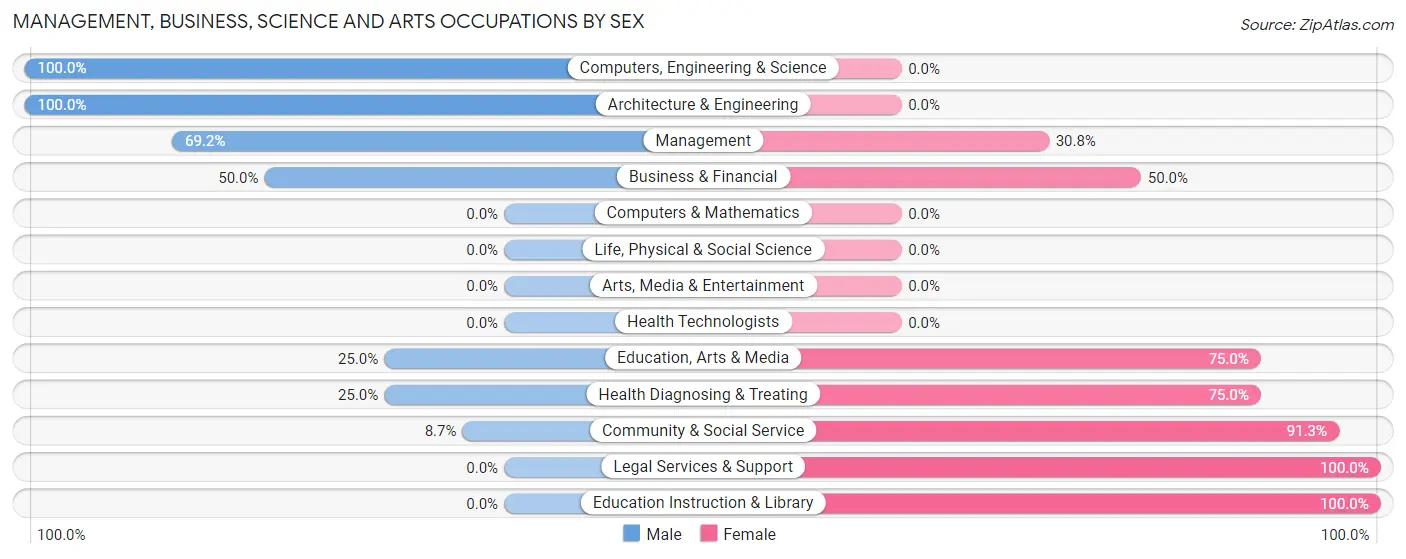
Management, Business, Science and Arts Occupations by Sex
Within the Management, Business, Science and Arts occupations in Killbuck, the most male-oriented occupations are Computers, Engineering & Science (100.0%), Architecture & Engineering (100.0%), and Management (69.2%), while the most female-oriented occupations are Legal Services & Support (100.0%), Education Instruction & Library (100.0%), and Community & Social Service (91.3%).
| Occupation | Male | Female |
| Management | 9 (69.2%) | 4 (30.8%) |
| Business & Financial | 4 (50.0%) | 4 (50.0%) |
| Computers, Engineering & Science | 11 (100.0%) | 0 (0.0%) |
| Computers & Mathematics | 0 (0.0%) | 0 (0.0%) |
| Architecture & Engineering | 11 (100.0%) | 0 (0.0%) |
| Life, Physical & Social Science | 0 (0.0%) | 0 (0.0%) |
| Community & Social Service | 2 (8.7%) | 21 (91.3%) |
| Education, Arts & Media | 2 (25.0%) | 6 (75.0%) |
| Legal Services & Support | 0 (0.0%) | 5 (100.0%) |
| Education Instruction & Library | 0 (0.0%) | 10 (100.0%) |
| Arts, Media & Entertainment | 0 (0.0%) | 0 (0.0%) |
| Health Diagnosing & Treating | 3 (25.0%) | 9 (75.0%) |
| Health Technologists | 0 (0.0%) | 0 (0.0%) |
| Total (Category) | 29 (43.3%) | 38 (56.7%) |
| Total (Overall) | 206 (39.8%) | 312 (60.2%) |
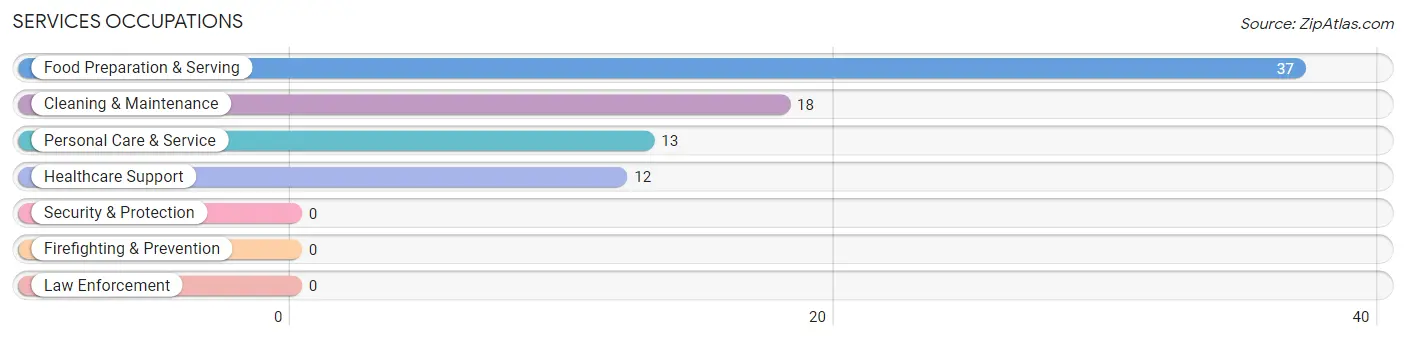
Services Occupations
The most common Services occupations in Killbuck are Food Preparation & Serving (37 | 7.1%), Cleaning & Maintenance (18 | 3.5%), Personal Care & Service (13 | 2.5%), and Healthcare Support (12 | 2.3%).
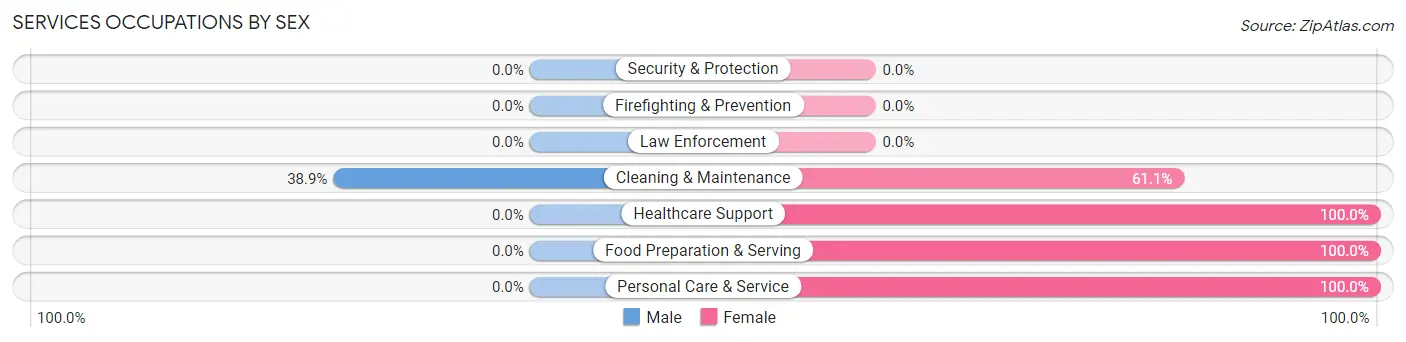
Services Occupations by Sex
| Occupation | Male | Female |
| Healthcare Support | 0 (0.0%) | 12 (100.0%) |
| Security & Protection | 0 (0.0%) | 0 (0.0%) |
| Firefighting & Prevention | 0 (0.0%) | 0 (0.0%) |
| Law Enforcement | 0 (0.0%) | 0 (0.0%) |
| Food Preparation & Serving | 0 (0.0%) | 37 (100.0%) |
| Cleaning & Maintenance | 7 (38.9%) | 11 (61.1%) |
| Personal Care & Service | 0 (0.0%) | 13 (100.0%) |
| Total (Category) | 7 (8.7%) | 73 (91.2%) |
| Total (Overall) | 206 (39.8%) | 312 (60.2%) |
Sales and Office Occupations
The most common Sales and Office occupations in Killbuck are Office & Administration (89 | 17.2%), and Sales & Related (72 | 13.9%).
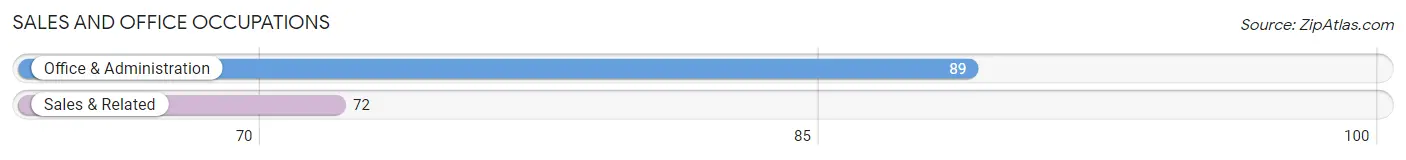
Sales and Office Occupations by Sex

| Occupation | Male | Female |
| Sales & Related | 20 (27.8%) | 52 (72.2%) |
| Office & Administration | 7 (7.9%) | 82 (92.1%) |
| Total (Category) | 27 (16.8%) | 134 (83.2%) |
| Total (Overall) | 206 (39.8%) | 312 (60.2%) |
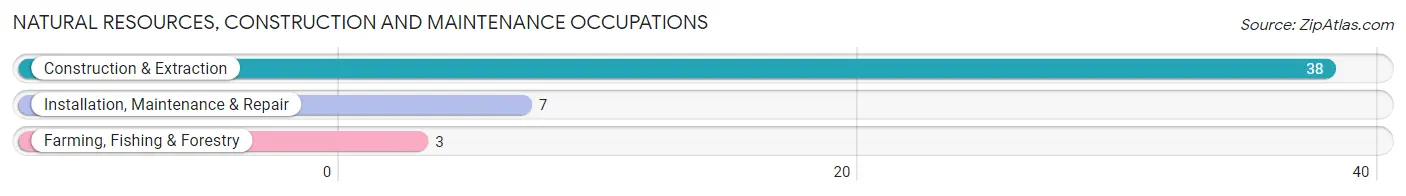
Natural Resources, Construction and Maintenance Occupations
The most common Natural Resources, Construction and Maintenance occupations in Killbuck are Construction & Extraction (38 | 7.3%), Installation, Maintenance & Repair (7 | 1.3%), and Farming, Fishing & Forestry (3 | 0.6%).
Natural Resources, Construction and Maintenance Occupations by Sex
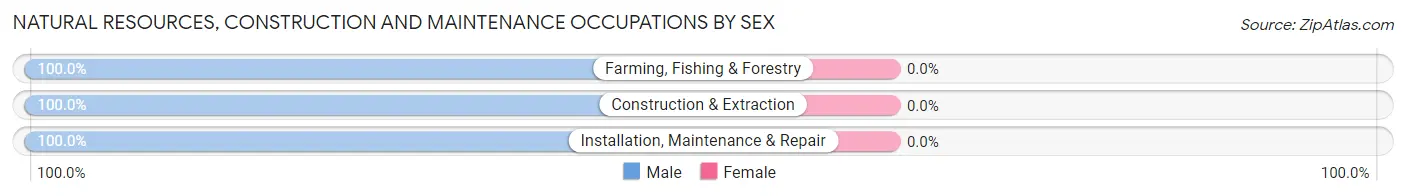
| Occupation | Male | Female |
| Farming, Fishing & Forestry | 3 (100.0%) | 0 (0.0%) |
| Construction & Extraction | 38 (100.0%) | 0 (0.0%) |
| Installation, Maintenance & Repair | 7 (100.0%) | 0 (0.0%) |
| Total (Category) | 48 (100.0%) | 0 (0.0%) |
| Total (Overall) | 206 (39.8%) | 312 (60.2%) |
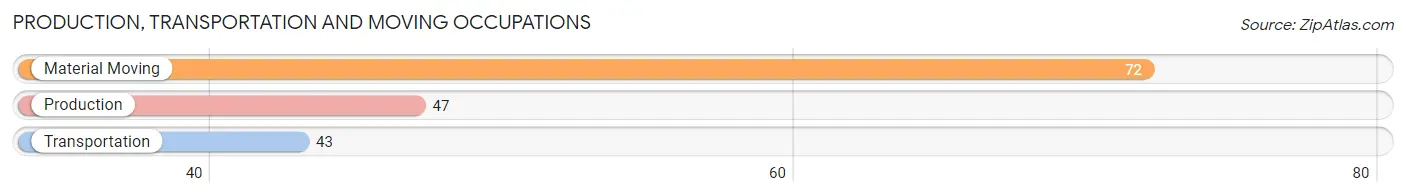
Production, Transportation and Moving Occupations
The most common Production, Transportation and Moving occupations in Killbuck are Material Moving (72 | 13.9%), Production (47 | 9.1%), and Transportation (43 | 8.3%).
Production, Transportation and Moving Occupations by Sex
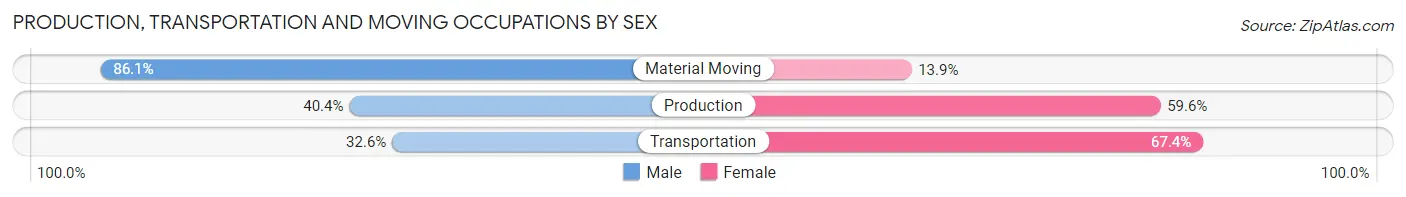
| Occupation | Male | Female |
| Production | 19 (40.4%) | 28 (59.6%) |
| Transportation | 14 (32.6%) | 29 (67.4%) |
| Material Moving | 62 (86.1%) | 10 (13.9%) |
| Total (Category) | 95 (58.6%) | 67 (41.4%) |
| Total (Overall) | 206 (39.8%) | 312 (60.2%) |
Employment Industries by Sex in Killbuck
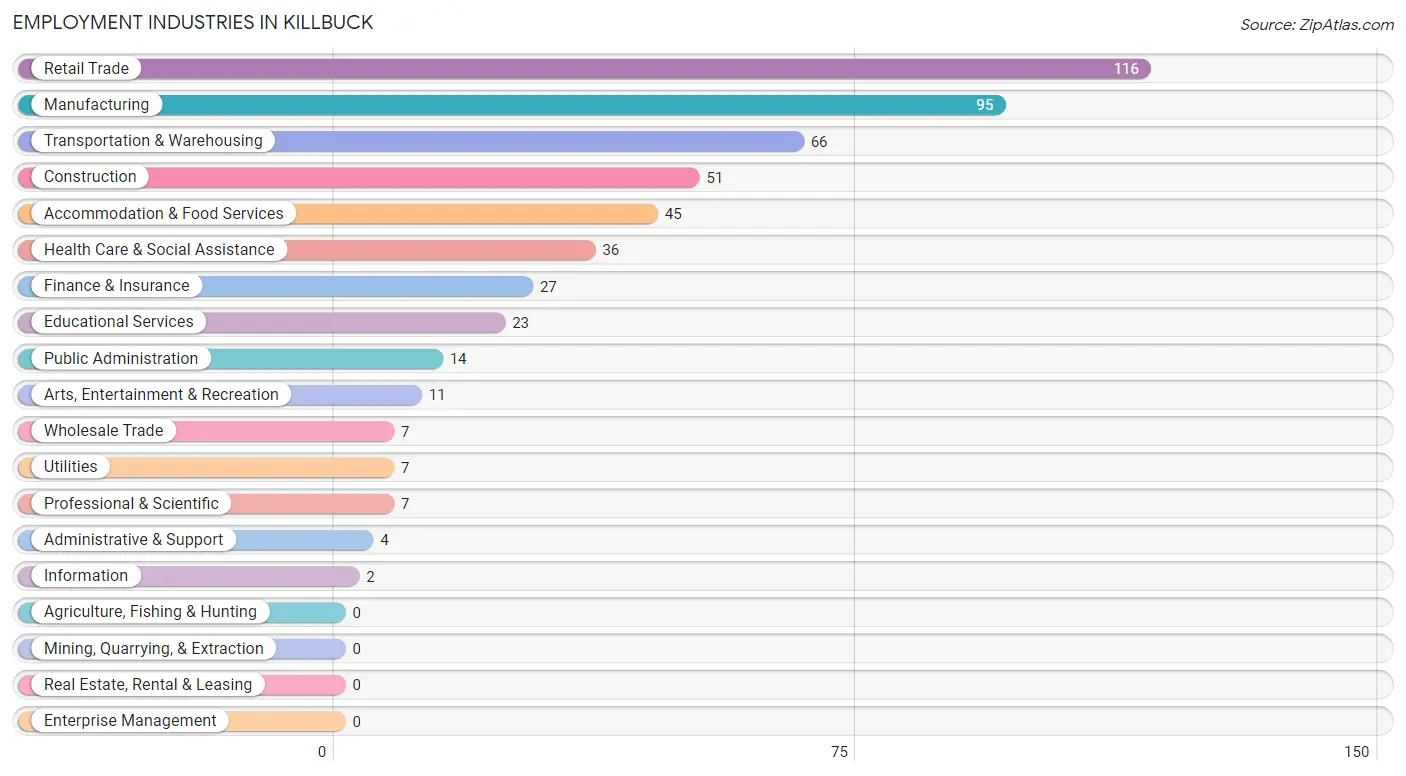
Employment Industries in Killbuck
The major employment industries in Killbuck include Retail Trade (116 | 22.4%), Manufacturing (95 | 18.3%), Transportation & Warehousing (66 | 12.7%), Construction (51 | 9.9%), and Accommodation & Food Services (45 | 8.7%).
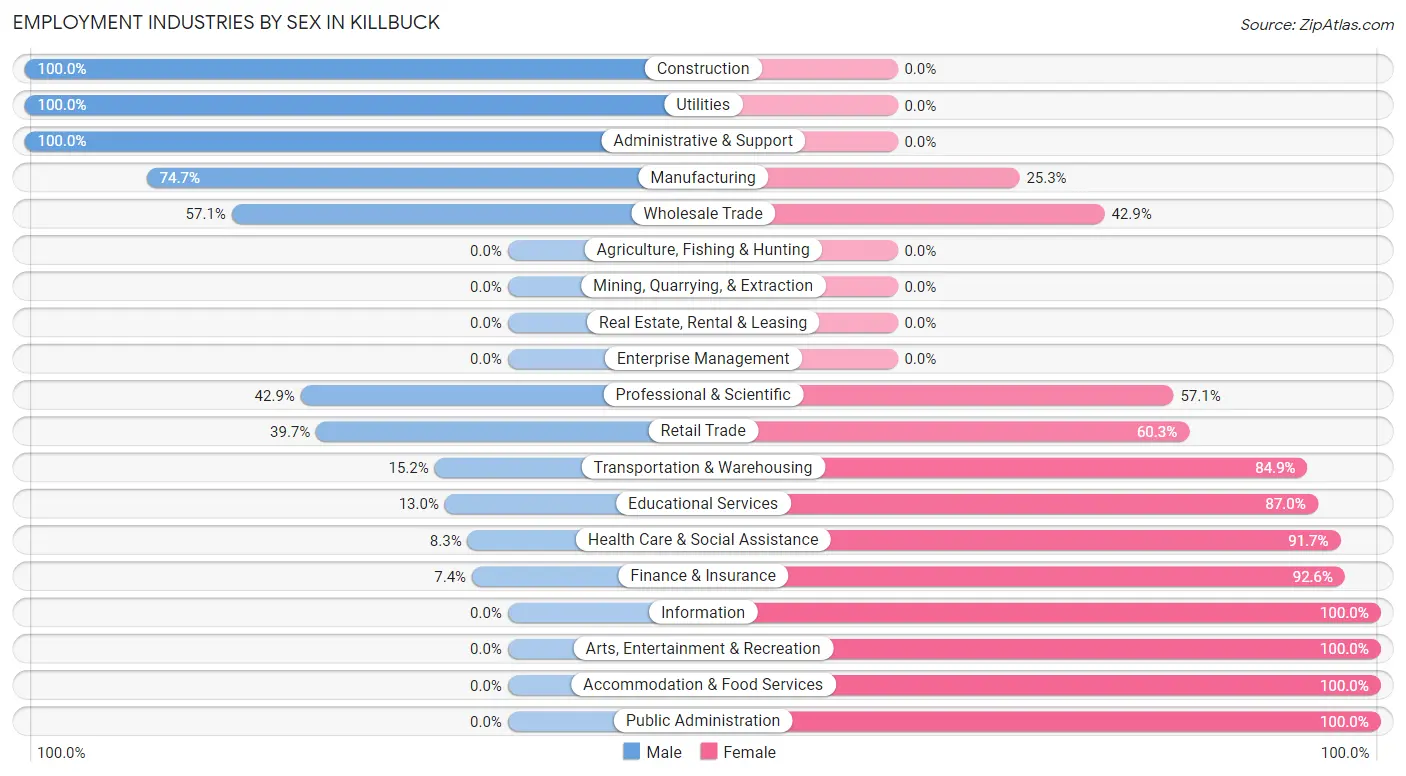
Employment Industries by Sex in Killbuck
The Killbuck industries that see more men than women are Construction (100.0%), Utilities (100.0%), and Administrative & Support (100.0%), whereas the industries that tend to have a higher number of women are Information (100.0%), Arts, Entertainment & Recreation (100.0%), and Accommodation & Food Services (100.0%).
| Industry | Male | Female |
| Agriculture, Fishing & Hunting | 0 (0.0%) | 0 (0.0%) |
| Mining, Quarrying, & Extraction | 0 (0.0%) | 0 (0.0%) |
| Construction | 51 (100.0%) | 0 (0.0%) |
| Manufacturing | 71 (74.7%) | 24 (25.3%) |
| Wholesale Trade | 4 (57.1%) | 3 (42.9%) |
| Retail Trade | 46 (39.7%) | 70 (60.3%) |
| Transportation & Warehousing | 10 (15.1%) | 56 (84.9%) |
| Utilities | 7 (100.0%) | 0 (0.0%) |
| Information | 0 (0.0%) | 2 (100.0%) |
| Finance & Insurance | 2 (7.4%) | 25 (92.6%) |
| Real Estate, Rental & Leasing | 0 (0.0%) | 0 (0.0%) |
| Professional & Scientific | 3 (42.9%) | 4 (57.1%) |
| Enterprise Management | 0 (0.0%) | 0 (0.0%) |
| Administrative & Support | 4 (100.0%) | 0 (0.0%) |
| Educational Services | 3 (13.0%) | 20 (87.0%) |
| Health Care & Social Assistance | 3 (8.3%) | 33 (91.7%) |
| Arts, Entertainment & Recreation | 0 (0.0%) | 11 (100.0%) |
| Accommodation & Food Services | 0 (0.0%) | 45 (100.0%) |
| Public Administration | 0 (0.0%) | 14 (100.0%) |
| Total | 206 (39.8%) | 312 (60.2%) |
Education in Killbuck
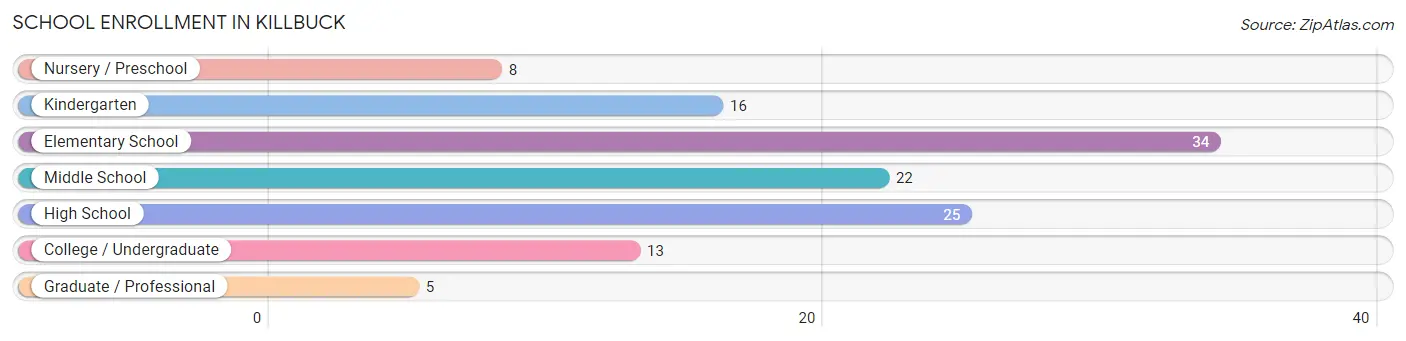
School Enrollment in Killbuck
The most common levels of schooling among the 123 students in Killbuck are elementary school (34 | 27.6%), high school (25 | 20.3%), and middle school (22 | 17.9%).
| School Level | # Students | % Students |
| Nursery / Preschool | 8 | 6.5% |
| Kindergarten | 16 | 13.0% |
| Elementary School | 34 | 27.6% |
| Middle School | 22 | 17.9% |
| High School | 25 | 20.3% |
| College / Undergraduate | 13 | 10.6% |
| Graduate / Professional | 5 | 4.1% |
| Total | 123 | 100.0% |
School Enrollment by Age by Funding Source in Killbuck
Out of a total of 123 students who are enrolled in schools in Killbuck, 19 (15.4%) attend a private institution, while the remaining 104 (84.6%) are enrolled in public schools. The age group of 20 to 24 year olds has the highest likelihood of being enrolled in private schools, with 4 (26.7% in the age bracket) enrolled. Conversely, the age group of 3 to 4 year olds has the lowest likelihood of being enrolled in a private school, with 8 (100.0% in the age bracket) attending a public institution.
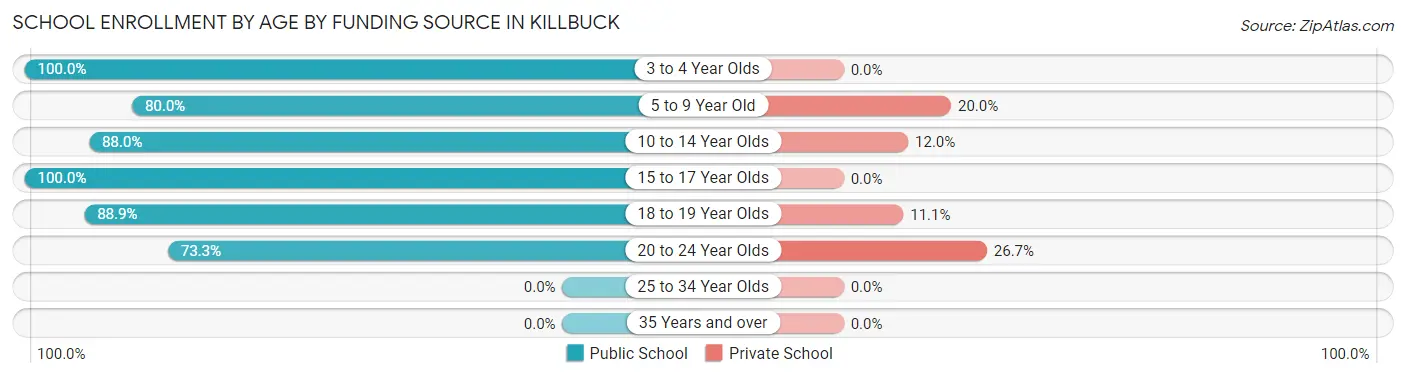
| Age Bracket | Public School | Private School |
| 3 to 4 Year Olds | 8 (100.0%) | 0 (0.0%) |
| 5 to 9 Year Old | 40 (80.0%) | 10 (20.0%) |
| 10 to 14 Year Olds | 22 (88.0%) | 3 (12.0%) |
| 15 to 17 Year Olds | 7 (100.0%) | 0 (0.0%) |
| 18 to 19 Year Olds | 16 (88.9%) | 2 (11.1%) |
| 20 to 24 Year Olds | 11 (73.3%) | 4 (26.7%) |
| 25 to 34 Year Olds | 0 (0.0%) | 0 (0.0%) |
| 35 Years and over | 0 (0.0%) | 0 (0.0%) |
| Total | 104 (84.6%) | 19 (15.4%) |
Educational Attainment by Field of Study in Killbuck
Liberal arts & history (6 | 25.0%), business (5 | 20.8%), education (5 | 20.8%), engineering (3 | 12.5%), and science & technology (3 | 12.5%) are the most common fields of study among 24 individuals in Killbuck who have obtained a bachelor's degree or higher.
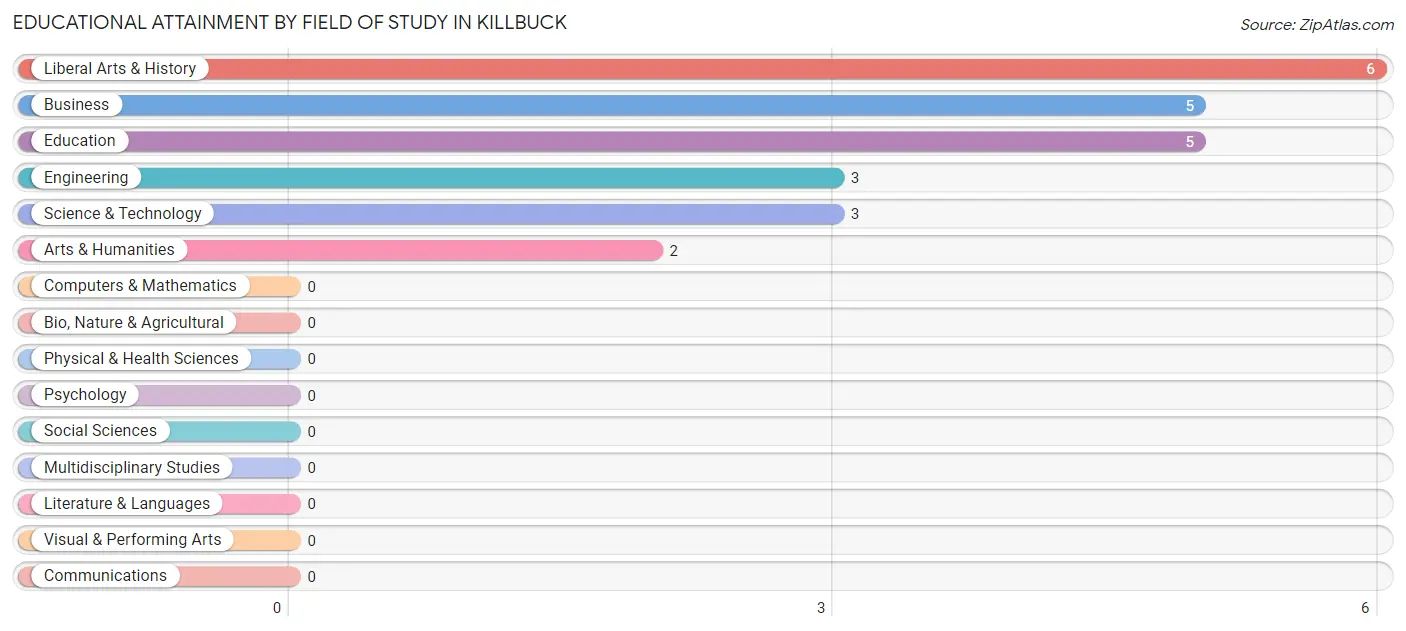
| Field of Study | # Graduates | % Graduates |
| Computers & Mathematics | 0 | 0.0% |
| Bio, Nature & Agricultural | 0 | 0.0% |
| Physical & Health Sciences | 0 | 0.0% |
| Psychology | 0 | 0.0% |
| Social Sciences | 0 | 0.0% |
| Engineering | 3 | 12.5% |
| Multidisciplinary Studies | 0 | 0.0% |
| Science & Technology | 3 | 12.5% |
| Business | 5 | 20.8% |
| Education | 5 | 20.8% |
| Literature & Languages | 0 | 0.0% |
| Liberal Arts & History | 6 | 25.0% |
| Visual & Performing Arts | 0 | 0.0% |
| Communications | 0 | 0.0% |
| Arts & Humanities | 2 | 8.3% |
| Total | 24 | 100.0% |
Transportation & Commute in Killbuck
Vehicle Availability by Sex in Killbuck
The most prevalent vehicle ownership categories in Killbuck are males with 2 vehicles (74, accounting for 39.4%) and females with 2 vehicles (106, making up 23.7%).
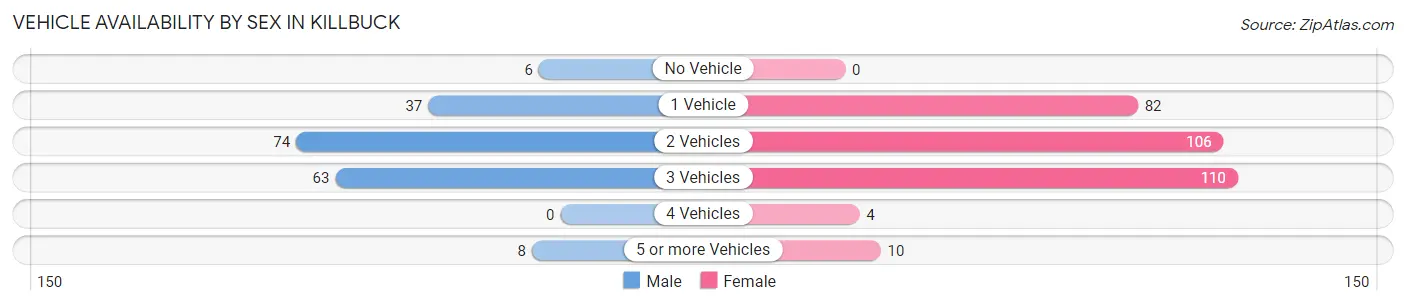
| Vehicles Available | Male | Female |
| No Vehicle | 6 (3.2%) | 0 (0.0%) |
| 1 Vehicle | 37 (19.7%) | 82 (26.3%) |
| 2 Vehicles | 74 (39.4%) | 106 (34.0%) |
| 3 Vehicles | 63 (33.5%) | 110 (35.3%) |
| 4 Vehicles | 0 (0.0%) | 4 (1.3%) |
| 5 or more Vehicles | 8 (4.3%) | 10 (3.2%) |
| Total | 188 (100.0%) | 312 (100.0%) |
Commute Time in Killbuck
The most frequently occuring commute durations in Killbuck are 15 to 19 minutes (148 commuters, 31.8%), 10 to 14 minutes (59 commuters, 12.7%), and 20 to 24 minutes (58 commuters, 12.4%).
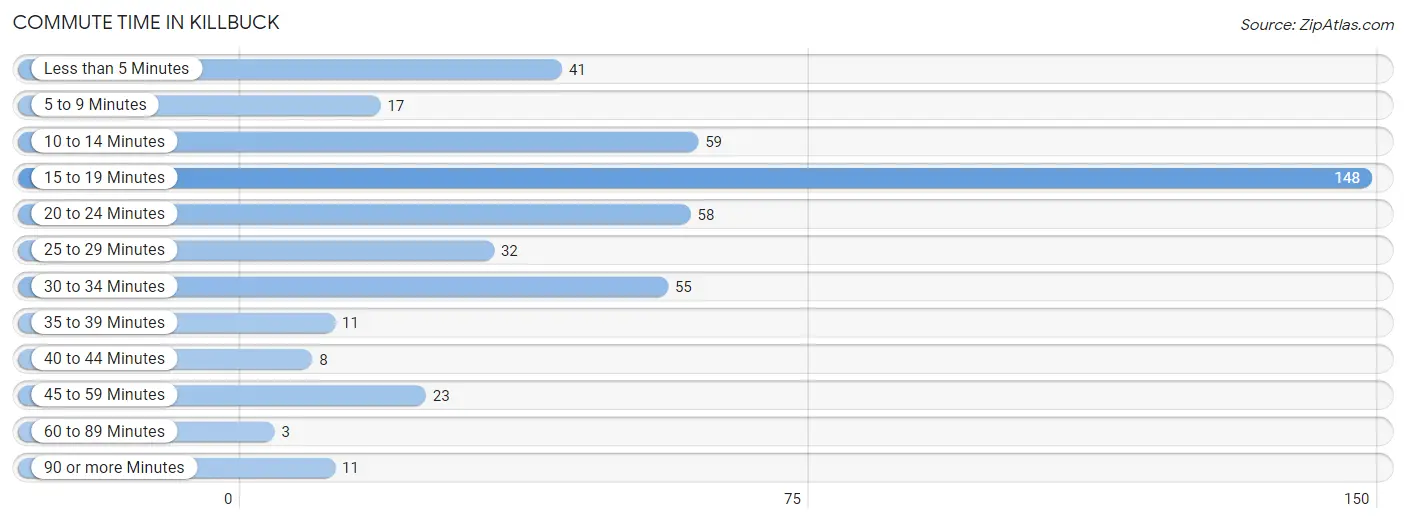
| Commute Time | # Commuters | % Commuters |
| Less than 5 Minutes | 41 | 8.8% |
| 5 to 9 Minutes | 17 | 3.6% |
| 10 to 14 Minutes | 59 | 12.7% |
| 15 to 19 Minutes | 148 | 31.8% |
| 20 to 24 Minutes | 58 | 12.4% |
| 25 to 29 Minutes | 32 | 6.9% |
| 30 to 34 Minutes | 55 | 11.8% |
| 35 to 39 Minutes | 11 | 2.4% |
| 40 to 44 Minutes | 8 | 1.7% |
| 45 to 59 Minutes | 23 | 4.9% |
| 60 to 89 Minutes | 3 | 0.6% |
| 90 or more Minutes | 11 | 2.4% |
Commute Time by Sex in Killbuck
The most common commute times in Killbuck are 30 to 34 minutes (44 commuters, 23.4%) for males and 15 to 19 minutes (133 commuters, 47.8%) for females.
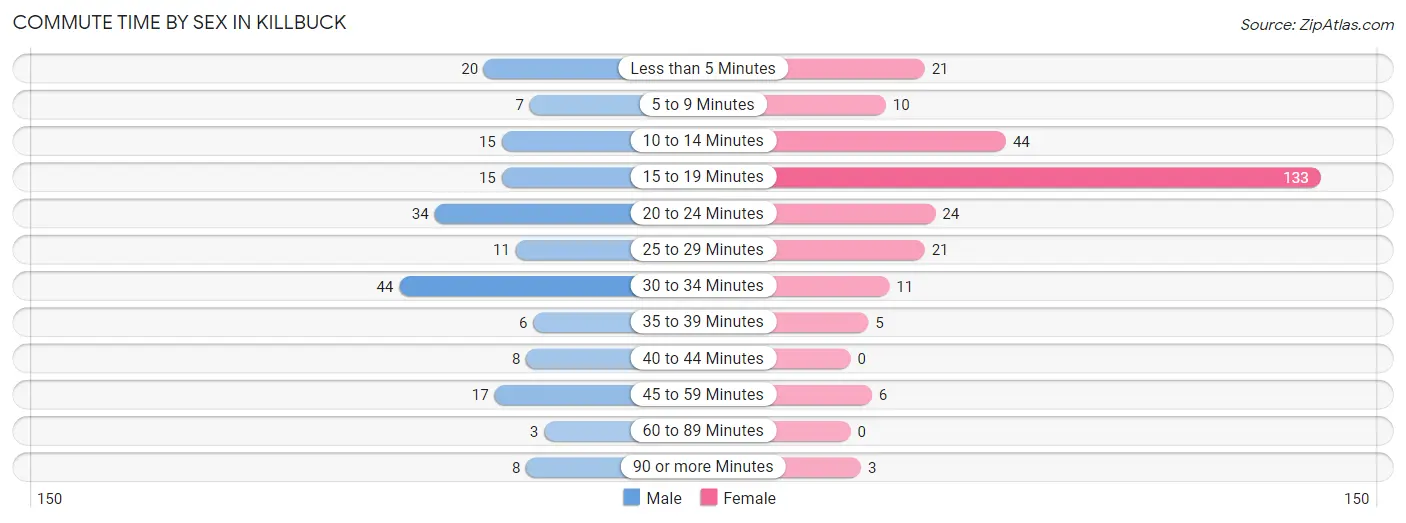
| Commute Time | Male | Female |
| Less than 5 Minutes | 20 (10.6%) | 21 (7.5%) |
| 5 to 9 Minutes | 7 (3.7%) | 10 (3.6%) |
| 10 to 14 Minutes | 15 (8.0%) | 44 (15.8%) |
| 15 to 19 Minutes | 15 (8.0%) | 133 (47.8%) |
| 20 to 24 Minutes | 34 (18.1%) | 24 (8.6%) |
| 25 to 29 Minutes | 11 (5.9%) | 21 (7.5%) |
| 30 to 34 Minutes | 44 (23.4%) | 11 (4.0%) |
| 35 to 39 Minutes | 6 (3.2%) | 5 (1.8%) |
| 40 to 44 Minutes | 8 (4.3%) | 0 (0.0%) |
| 45 to 59 Minutes | 17 (9.0%) | 6 (2.2%) |
| 60 to 89 Minutes | 3 (1.6%) | 0 (0.0%) |
| 90 or more Minutes | 8 (4.3%) | 3 (1.1%) |
Time of Departure to Work by Sex in Killbuck
The most frequent times of departure to work in Killbuck are 5:30 AM to 5:59 AM (38, 20.2%) for males and 7:30 AM to 7:59 AM (64, 23.0%) for females.
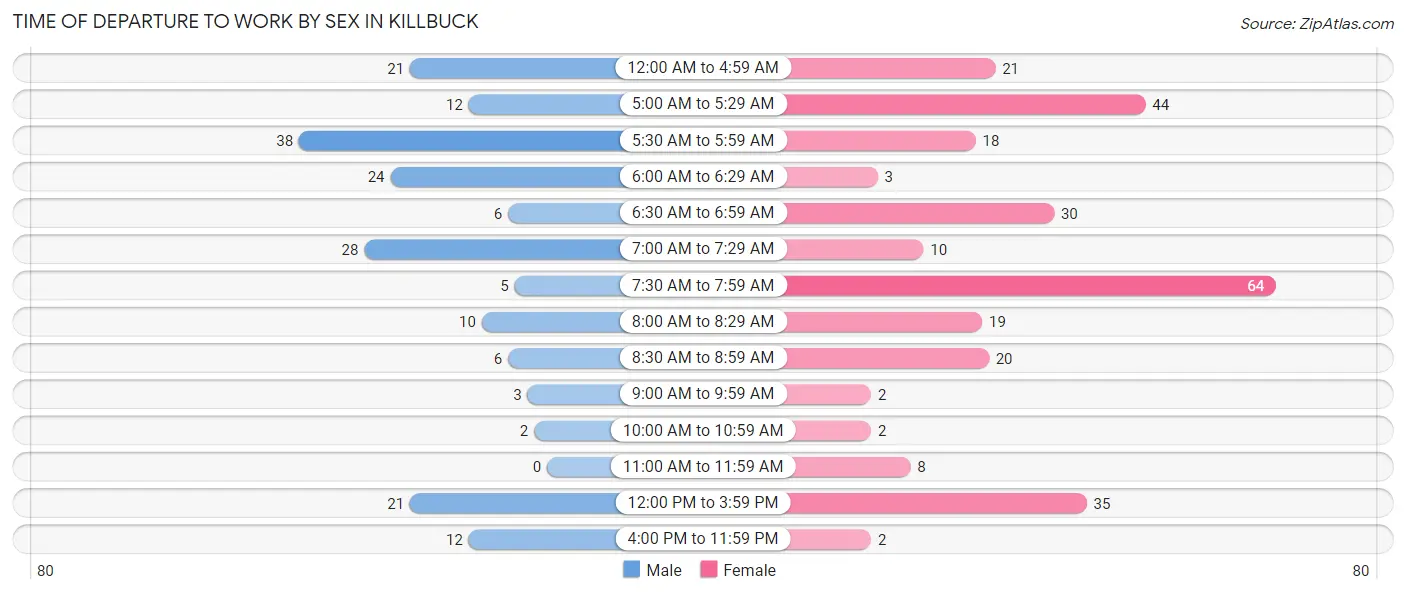
| Time of Departure | Male | Female |
| 12:00 AM to 4:59 AM | 21 (11.2%) | 21 (7.5%) |
| 5:00 AM to 5:29 AM | 12 (6.4%) | 44 (15.8%) |
| 5:30 AM to 5:59 AM | 38 (20.2%) | 18 (6.5%) |
| 6:00 AM to 6:29 AM | 24 (12.8%) | 3 (1.1%) |
| 6:30 AM to 6:59 AM | 6 (3.2%) | 30 (10.8%) |
| 7:00 AM to 7:29 AM | 28 (14.9%) | 10 (3.6%) |
| 7:30 AM to 7:59 AM | 5 (2.7%) | 64 (23.0%) |
| 8:00 AM to 8:29 AM | 10 (5.3%) | 19 (6.8%) |
| 8:30 AM to 8:59 AM | 6 (3.2%) | 20 (7.2%) |
| 9:00 AM to 9:59 AM | 3 (1.6%) | 2 (0.7%) |
| 10:00 AM to 10:59 AM | 2 (1.1%) | 2 (0.7%) |
| 11:00 AM to 11:59 AM | 0 (0.0%) | 8 (2.9%) |
| 12:00 PM to 3:59 PM | 21 (11.2%) | 35 (12.6%) |
| 4:00 PM to 11:59 PM | 12 (6.4%) | 2 (0.7%) |
| Total | 188 (100.0%) | 278 (100.0%) |
Housing Occupancy in Killbuck
Occupancy by Ownership in Killbuck
Of the total 406 dwellings in Killbuck, owner-occupied units account for 322 (79.3%), while renter-occupied units make up 84 (20.7%).
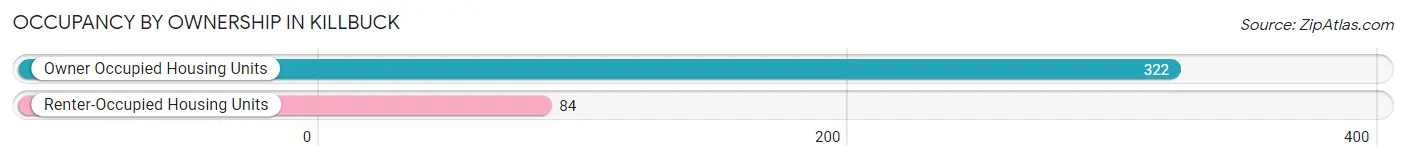
| Occupancy | # Housing Units | % Housing Units |
| Owner Occupied Housing Units | 322 | 79.3% |
| Renter-Occupied Housing Units | 84 | 20.7% |
| Total Occupied Housing Units | 406 | 100.0% |
Occupancy by Household Size in Killbuck
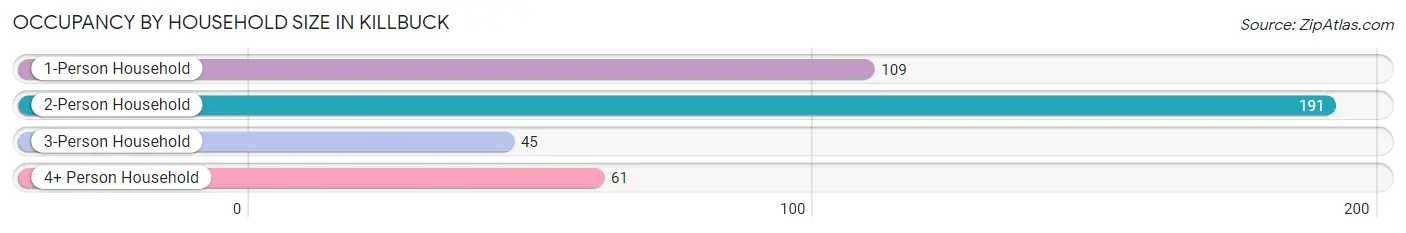
| Household Size | # Housing Units | % Housing Units |
| 1-Person Household | 109 | 26.9% |
| 2-Person Household | 191 | 47.0% |
| 3-Person Household | 45 | 11.1% |
| 4+ Person Household | 61 | 15.0% |
| Total Housing Units | 406 | 100.0% |
Occupancy by Ownership by Household Size in Killbuck
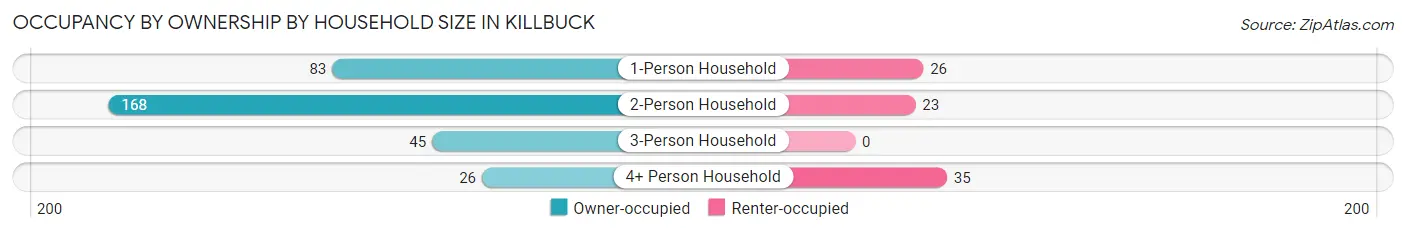
| Household Size | Owner-occupied | Renter-occupied |
| 1-Person Household | 83 (76.1%) | 26 (23.8%) |
| 2-Person Household | 168 (88.0%) | 23 (12.0%) |
| 3-Person Household | 45 (100.0%) | 0 (0.0%) |
| 4+ Person Household | 26 (42.6%) | 35 (57.4%) |
| Total Housing Units | 322 (79.3%) | 84 (20.7%) |
Occupancy by Educational Attainment in Killbuck
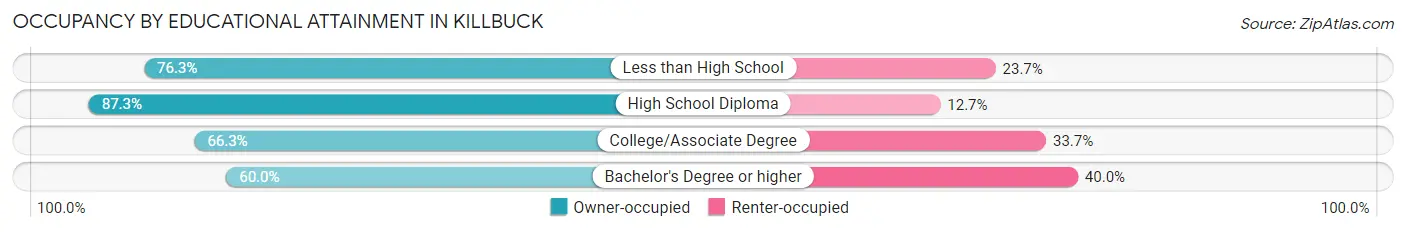
| Household Size | Owner-occupied | Renter-occupied |
| Less than High School | 58 (76.3%) | 18 (23.7%) |
| High School Diploma | 192 (87.3%) | 28 (12.7%) |
| College/Associate Degree | 63 (66.3%) | 32 (33.7%) |
| Bachelor's Degree or higher | 9 (60.0%) | 6 (40.0%) |
Occupancy by Age of Householder in Killbuck
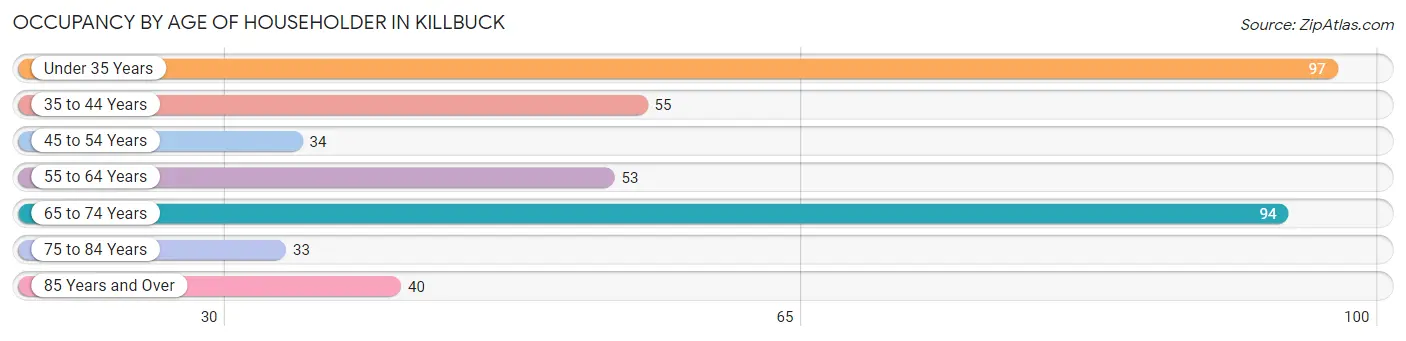
| Age Bracket | # Households | % Households |
| Under 35 Years | 97 | 23.9% |
| 35 to 44 Years | 55 | 13.6% |
| 45 to 54 Years | 34 | 8.4% |
| 55 to 64 Years | 53 | 13.1% |
| 65 to 74 Years | 94 | 23.2% |
| 75 to 84 Years | 33 | 8.1% |
| 85 Years and Over | 40 | 9.9% |
| Total | 406 | 100.0% |
Housing Finances in Killbuck
Median Income by Occupancy in Killbuck
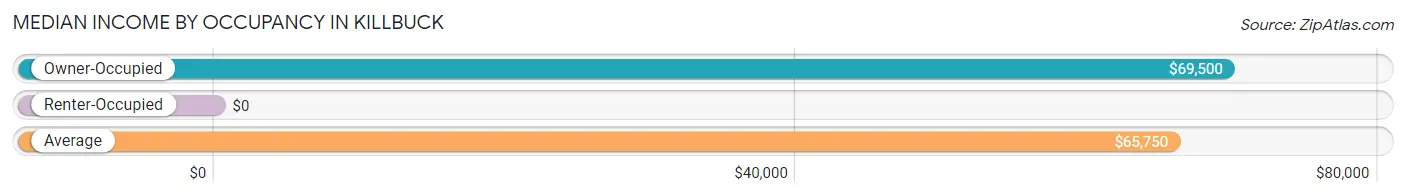
| Occupancy Type | # Households | Median Income |
| Owner-Occupied | 322 (79.3%) | $69,500 |
| Renter-Occupied | 84 (20.7%) | $0 |
| Average | 406 (100.0%) | $65,750 |
Occupancy by Householder Income Bracket in Killbuck
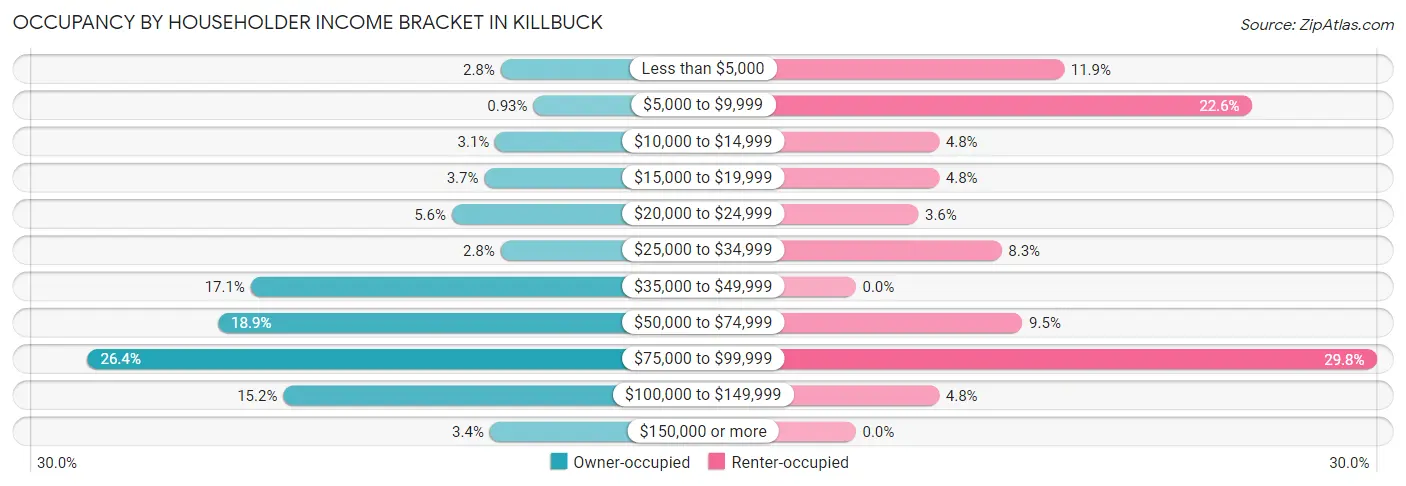
| Income Bracket | Owner-occupied | Renter-occupied |
| Less than $5,000 | 9 (2.8%) | 10 (11.9%) |
| $5,000 to $9,999 | 3 (0.9%) | 19 (22.6%) |
| $10,000 to $14,999 | 10 (3.1%) | 4 (4.8%) |
| $15,000 to $19,999 | 12 (3.7%) | 4 (4.8%) |
| $20,000 to $24,999 | 18 (5.6%) | 3 (3.6%) |
| $25,000 to $34,999 | 9 (2.8%) | 7 (8.3%) |
| $35,000 to $49,999 | 55 (17.1%) | 0 (0.0%) |
| $50,000 to $74,999 | 61 (18.9%) | 8 (9.5%) |
| $75,000 to $99,999 | 85 (26.4%) | 25 (29.8%) |
| $100,000 to $149,999 | 49 (15.2%) | 4 (4.8%) |
| $150,000 or more | 11 (3.4%) | 0 (0.0%) |
| Total | 322 (100.0%) | 84 (100.0%) |
Monthly Housing Cost Tiers in Killbuck
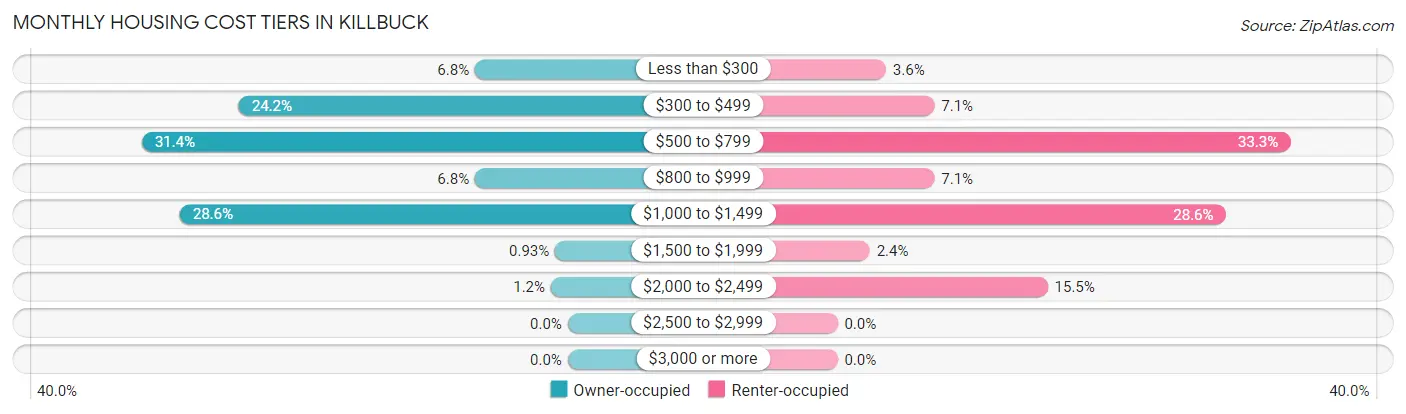
| Monthly Cost | Owner-occupied | Renter-occupied |
| Less than $300 | 22 (6.8%) | 3 (3.6%) |
| $300 to $499 | 78 (24.2%) | 6 (7.1%) |
| $500 to $799 | 101 (31.4%) | 28 (33.3%) |
| $800 to $999 | 22 (6.8%) | 6 (7.1%) |
| $1,000 to $1,499 | 92 (28.6%) | 24 (28.6%) |
| $1,500 to $1,999 | 3 (0.9%) | 2 (2.4%) |
| $2,000 to $2,499 | 4 (1.2%) | 13 (15.5%) |
| $2,500 to $2,999 | 0 (0.0%) | 0 (0.0%) |
| $3,000 or more | 0 (0.0%) | 0 (0.0%) |
| Total | 322 (100.0%) | 84 (100.0%) |
Physical Housing Characteristics in Killbuck
Housing Structures in Killbuck
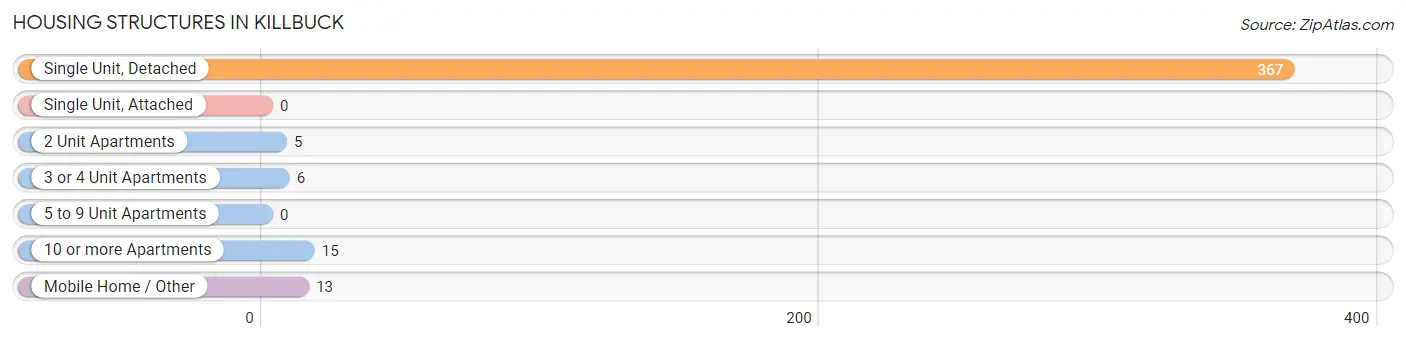
| Structure Type | # Housing Units | % Housing Units |
| Single Unit, Detached | 367 | 90.4% |
| Single Unit, Attached | 0 | 0.0% |
| 2 Unit Apartments | 5 | 1.2% |
| 3 or 4 Unit Apartments | 6 | 1.5% |
| 5 to 9 Unit Apartments | 0 | 0.0% |
| 10 or more Apartments | 15 | 3.7% |
| Mobile Home / Other | 13 | 3.2% |
| Total | 406 | 100.0% |
Housing Structures by Occupancy in Killbuck
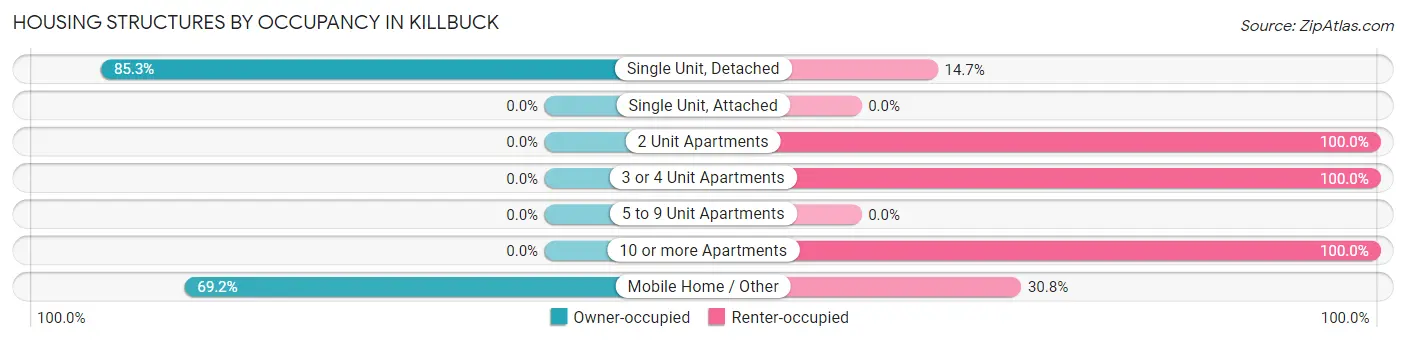
| Structure Type | Owner-occupied | Renter-occupied |
| Single Unit, Detached | 313 (85.3%) | 54 (14.7%) |
| Single Unit, Attached | 0 (0.0%) | 0 (0.0%) |
| 2 Unit Apartments | 0 (0.0%) | 5 (100.0%) |
| 3 or 4 Unit Apartments | 0 (0.0%) | 6 (100.0%) |
| 5 to 9 Unit Apartments | 0 (0.0%) | 0 (0.0%) |
| 10 or more Apartments | 0 (0.0%) | 15 (100.0%) |
| Mobile Home / Other | 9 (69.2%) | 4 (30.8%) |
| Total | 322 (79.3%) | 84 (20.7%) |
Housing Structures by Number of Rooms in Killbuck
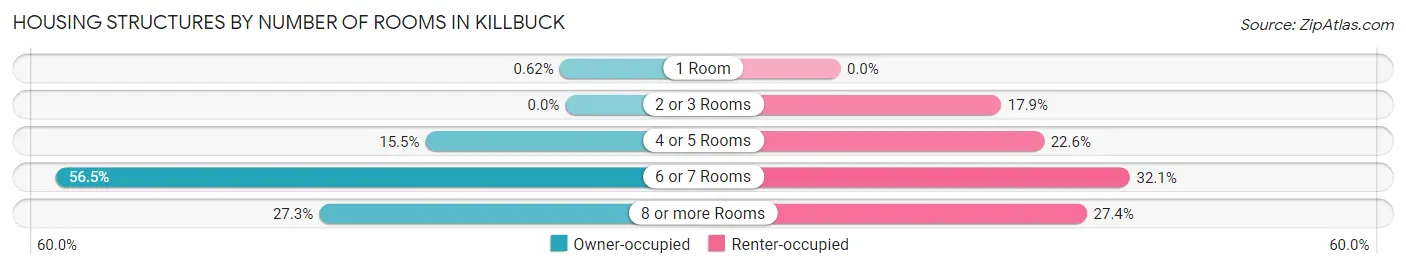
| Number of Rooms | Owner-occupied | Renter-occupied |
| 1 Room | 2 (0.6%) | 0 (0.0%) |
| 2 or 3 Rooms | 0 (0.0%) | 15 (17.9%) |
| 4 or 5 Rooms | 50 (15.5%) | 19 (22.6%) |
| 6 or 7 Rooms | 182 (56.5%) | 27 (32.1%) |
| 8 or more Rooms | 88 (27.3%) | 23 (27.4%) |
| Total | 322 (100.0%) | 84 (100.0%) |
Housing Structure by Heating Type in Killbuck
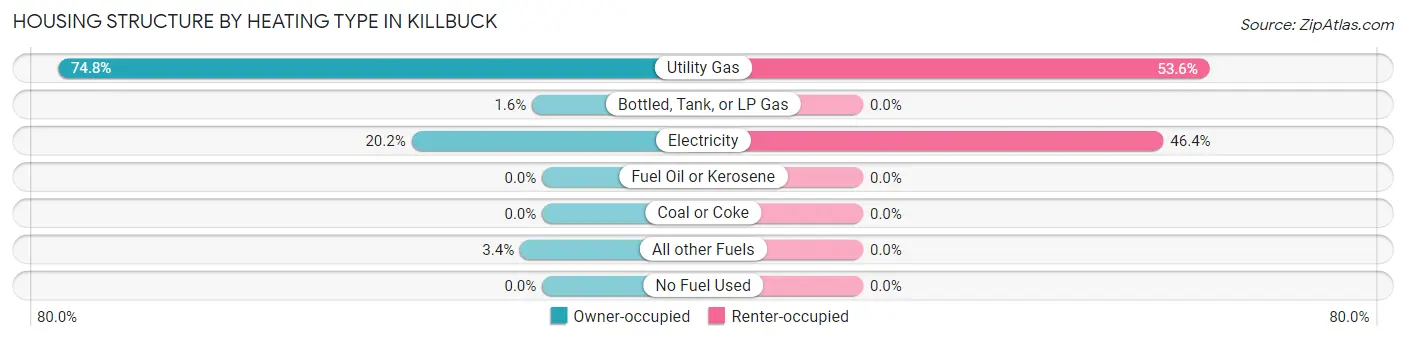
| Heating Type | Owner-occupied | Renter-occupied |
| Utility Gas | 241 (74.8%) | 45 (53.6%) |
| Bottled, Tank, or LP Gas | 5 (1.5%) | 0 (0.0%) |
| Electricity | 65 (20.2%) | 39 (46.4%) |
| Fuel Oil or Kerosene | 0 (0.0%) | 0 (0.0%) |
| Coal or Coke | 0 (0.0%) | 0 (0.0%) |
| All other Fuels | 11 (3.4%) | 0 (0.0%) |
| No Fuel Used | 0 (0.0%) | 0 (0.0%) |
| Total | 322 (100.0%) | 84 (100.0%) |
Household Vehicle Usage in Killbuck

| Vehicles per Household | Owner-occupied | Renter-occupied |
| No Vehicle | 0 (0.0%) | 6 (7.1%) |
| 1 Vehicle | 105 (32.6%) | 41 (48.8%) |
| 2 Vehicles | 138 (42.9%) | 19 (22.6%) |
| 3 or more Vehicles | 79 (24.5%) | 18 (21.4%) |
| Total | 322 (100.0%) | 84 (100.0%) |
Real Estate & Mortgages in Killbuck
Real Estate and Mortgage Overview in Killbuck
| Characteristic | Without Mortgage | With Mortgage |
| Housing Units | 161 | 161 |
| Median Property Value | $145,500 | $119,000 |
| Median Household Income | $49,398 | $9 |
| Monthly Housing Costs | $399 | $0 |
| Real Estate Taxes | $1,391 | $7 |
Property Value by Mortgage Status in Killbuck
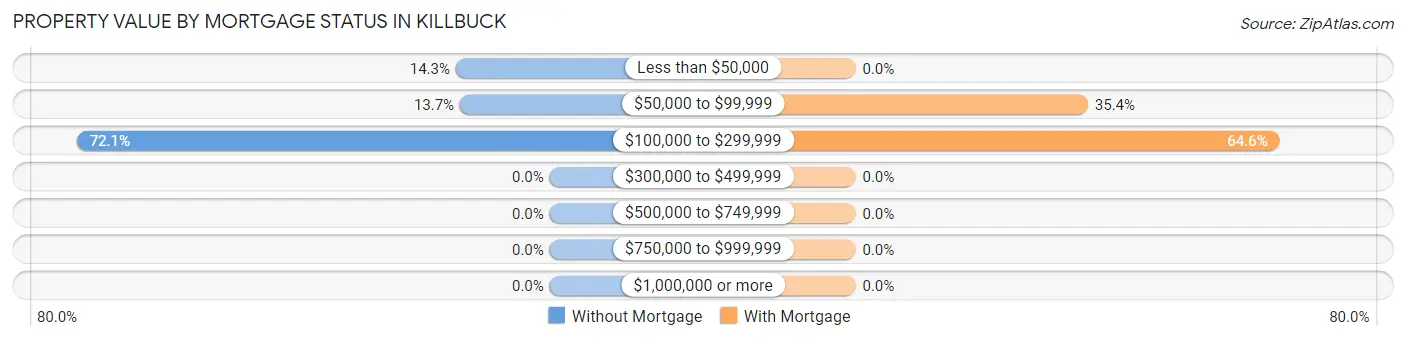
| Property Value | Without Mortgage | With Mortgage |
| Less than $50,000 | 23 (14.3%) | 0 (0.0%) |
| $50,000 to $99,999 | 22 (13.7%) | 57 (35.4%) |
| $100,000 to $299,999 | 116 (72.1%) | 104 (64.6%) |
| $300,000 to $499,999 | 0 (0.0%) | 0 (0.0%) |
| $500,000 to $749,999 | 0 (0.0%) | 0 (0.0%) |
| $750,000 to $999,999 | 0 (0.0%) | 0 (0.0%) |
| $1,000,000 or more | 0 (0.0%) | 0 (0.0%) |
| Total | 161 (100.0%) | 161 (100.0%) |
Household Income by Mortgage Status in Killbuck
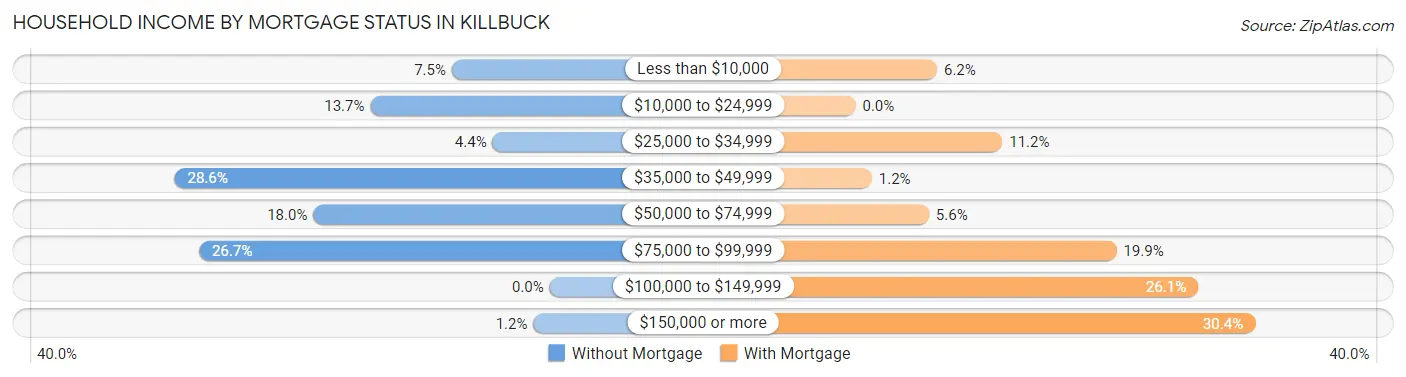
| Household Income | Without Mortgage | With Mortgage |
| Less than $10,000 | 12 (7.4%) | 10 (6.2%) |
| $10,000 to $24,999 | 22 (13.7%) | 0 (0.0%) |
| $25,000 to $34,999 | 7 (4.3%) | 18 (11.2%) |
| $35,000 to $49,999 | 46 (28.6%) | 2 (1.2%) |
| $50,000 to $74,999 | 29 (18.0%) | 9 (5.6%) |
| $75,000 to $99,999 | 43 (26.7%) | 32 (19.9%) |
| $100,000 to $149,999 | 0 (0.0%) | 42 (26.1%) |
| $150,000 or more | 2 (1.2%) | 49 (30.4%) |
| Total | 161 (100.0%) | 161 (100.0%) |
Property Value to Household Income Ratio in Killbuck
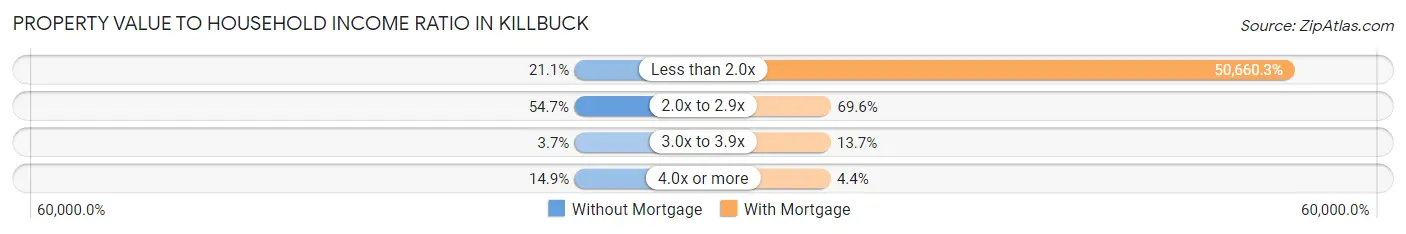
| Value-to-Income Ratio | Without Mortgage | With Mortgage |
| Less than 2.0x | 34 (21.1%) | 81,563 (50,660.3%) |
| 2.0x to 2.9x | 88 (54.7%) | 112 (69.6%) |
| 3.0x to 3.9x | 6 (3.7%) | 22 (13.7%) |
| 4.0x or more | 24 (14.9%) | 7 (4.3%) |
| Total | 161 (100.0%) | 161 (100.0%) |
Real Estate Taxes by Mortgage Status in Killbuck
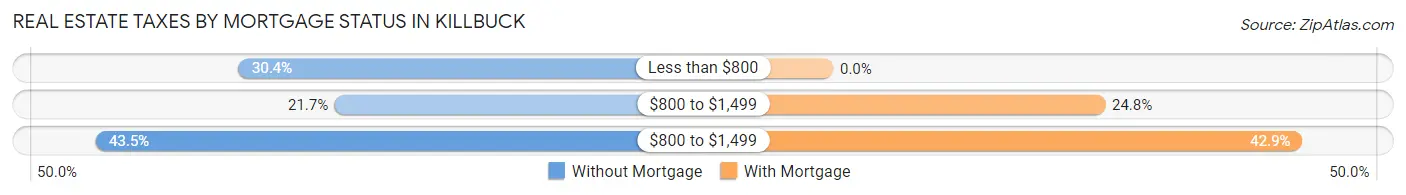
| Property Taxes | Without Mortgage | With Mortgage |
| Less than $800 | 49 (30.4%) | 0 (0.0%) |
| $800 to $1,499 | 35 (21.7%) | 40 (24.8%) |
| $800 to $1,499 | 70 (43.5%) | 69 (42.9%) |
| Total | 161 (100.0%) | 161 (100.0%) |
Health & Disability in Killbuck
Health Insurance Coverage by Age in Killbuck
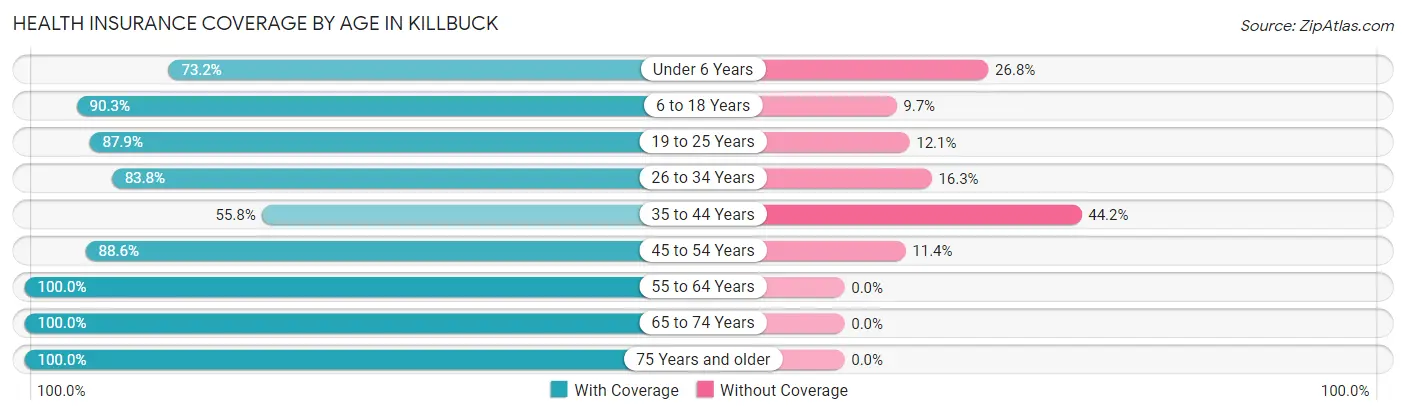
| Age Bracket | With Coverage | Without Coverage |
| Under 6 Years | 30 (73.2%) | 11 (26.8%) |
| 6 to 18 Years | 93 (90.3%) | 10 (9.7%) |
| 19 to 25 Years | 58 (87.9%) | 8 (12.1%) |
| 26 to 34 Years | 134 (83.8%) | 26 (16.3%) |
| 35 to 44 Years | 72 (55.8%) | 57 (44.2%) |
| 45 to 54 Years | 70 (88.6%) | 9 (11.4%) |
| 55 to 64 Years | 102 (100.0%) | 0 (0.0%) |
| 65 to 74 Years | 168 (100.0%) | 0 (0.0%) |
| 75 Years and older | 88 (100.0%) | 0 (0.0%) |
| Total | 815 (87.1%) | 121 (12.9%) |
Health Insurance Coverage by Citizenship Status in Killbuck
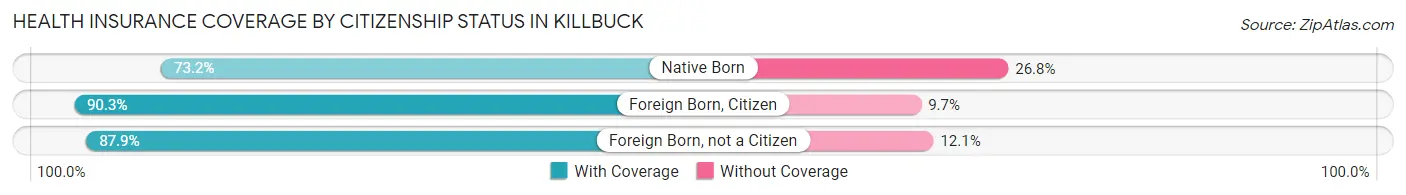
| Citizenship Status | With Coverage | Without Coverage |
| Native Born | 30 (73.2%) | 11 (26.8%) |
| Foreign Born, Citizen | 93 (90.3%) | 10 (9.7%) |
| Foreign Born, not a Citizen | 58 (87.9%) | 8 (12.1%) |
Health Insurance Coverage by Household Income in Killbuck
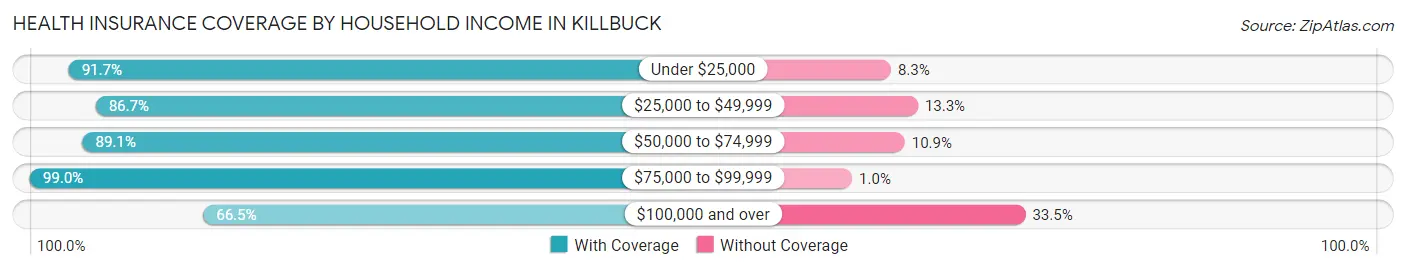
| Household Income | With Coverage | Without Coverage |
| Under $25,000 | 155 (91.7%) | 14 (8.3%) |
| $25,000 to $49,999 | 91 (86.7%) | 14 (13.3%) |
| $50,000 to $74,999 | 123 (89.1%) | 15 (10.9%) |
| $75,000 to $99,999 | 297 (99.0%) | 3 (1.0%) |
| $100,000 and over | 149 (66.5%) | 75 (33.5%) |
Public vs Private Health Insurance Coverage by Age in Killbuck
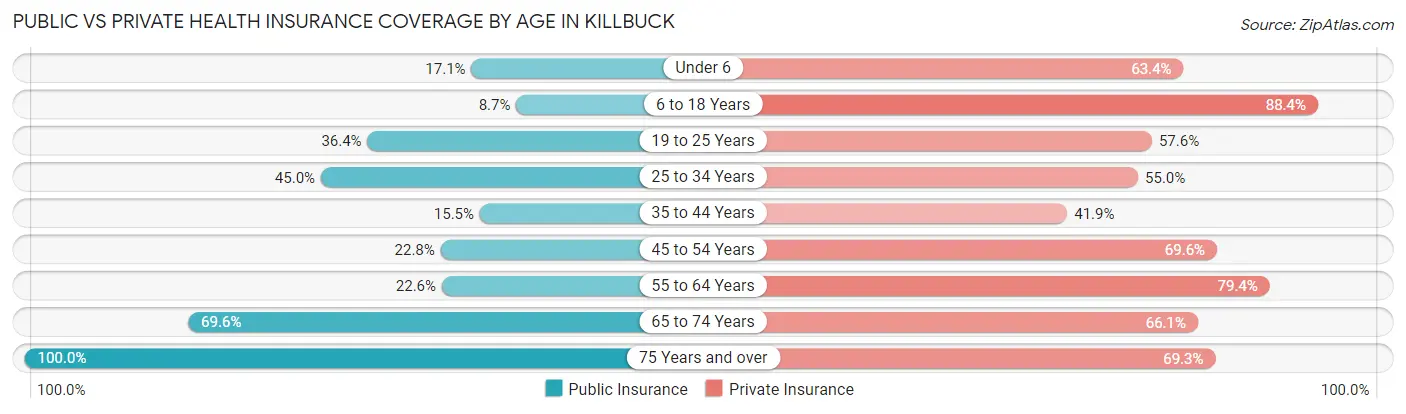
| Age Bracket | Public Insurance | Private Insurance |
| Under 6 | 7 (17.1%) | 26 (63.4%) |
| 6 to 18 Years | 9 (8.7%) | 91 (88.3%) |
| 19 to 25 Years | 24 (36.4%) | 38 (57.6%) |
| 25 to 34 Years | 72 (45.0%) | 88 (55.0%) |
| 35 to 44 Years | 20 (15.5%) | 54 (41.9%) |
| 45 to 54 Years | 18 (22.8%) | 55 (69.6%) |
| 55 to 64 Years | 23 (22.6%) | 81 (79.4%) |
| 65 to 74 Years | 117 (69.6%) | 111 (66.1%) |
| 75 Years and over | 88 (100.0%) | 61 (69.3%) |
| Total | 378 (40.4%) | 605 (64.6%) |
Disability Status by Sex by Age in Killbuck
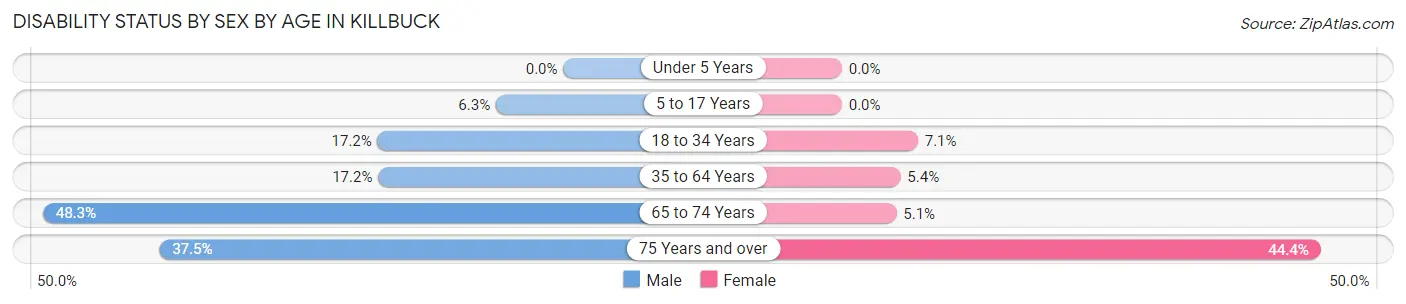
| Age Bracket | Male | Female |
| Under 5 Years | 0 (0.0%) | 0 (0.0%) |
| 5 to 17 Years | 2 (6.2%) | 0 (0.0%) |
| 18 to 34 Years | 15 (17.2%) | 11 (7.0%) |
| 35 to 64 Years | 28 (17.2%) | 8 (5.4%) |
| 65 to 74 Years | 43 (48.3%) | 4 (5.1%) |
| 75 Years and over | 6 (37.5%) | 32 (44.4%) |
Disability Class by Sex by Age in Killbuck
Disability Class: Hearing Difficulty
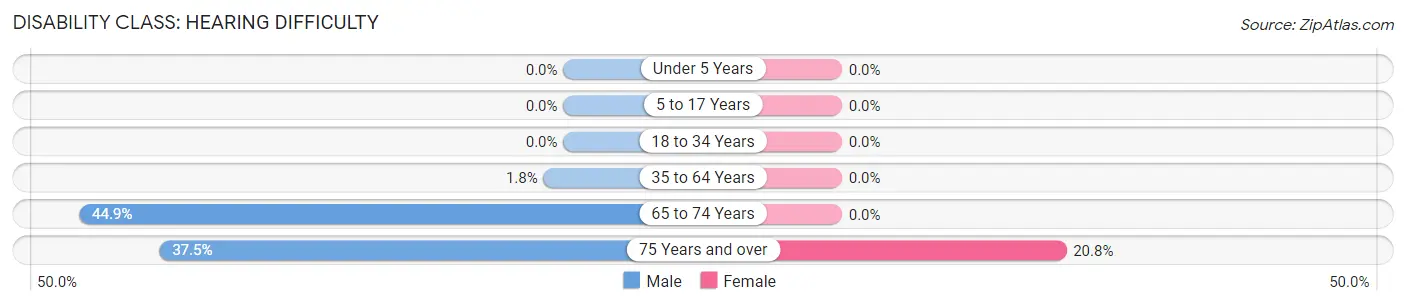
| Age Bracket | Male | Female |
| Under 5 Years | 0 (0.0%) | 0 (0.0%) |
| 5 to 17 Years | 0 (0.0%) | 0 (0.0%) |
| 18 to 34 Years | 0 (0.0%) | 0 (0.0%) |
| 35 to 64 Years | 3 (1.8%) | 0 (0.0%) |
| 65 to 74 Years | 40 (44.9%) | 0 (0.0%) |
| 75 Years and over | 6 (37.5%) | 15 (20.8%) |
Disability Class: Vision Difficulty
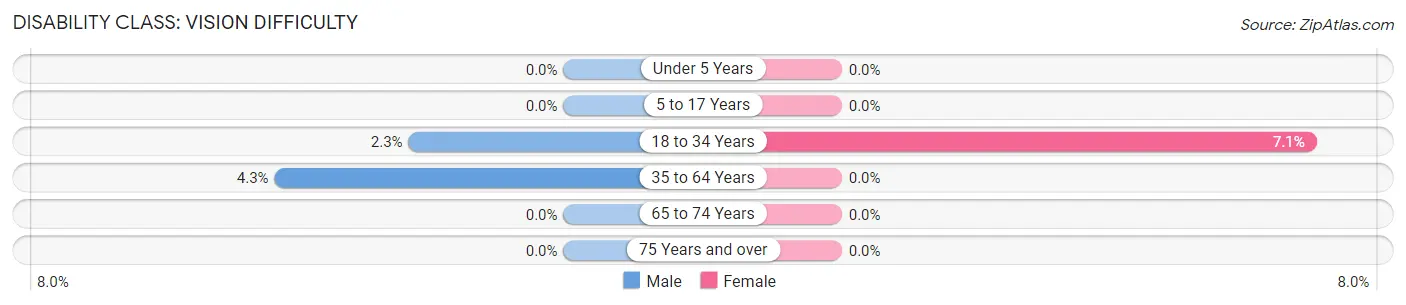
| Age Bracket | Male | Female |
| Under 5 Years | 0 (0.0%) | 0 (0.0%) |
| 5 to 17 Years | 0 (0.0%) | 0 (0.0%) |
| 18 to 34 Years | 2 (2.3%) | 11 (7.0%) |
| 35 to 64 Years | 7 (4.3%) | 0 (0.0%) |
| 65 to 74 Years | 0 (0.0%) | 0 (0.0%) |
| 75 Years and over | 0 (0.0%) | 0 (0.0%) |
Disability Class: Cognitive Difficulty
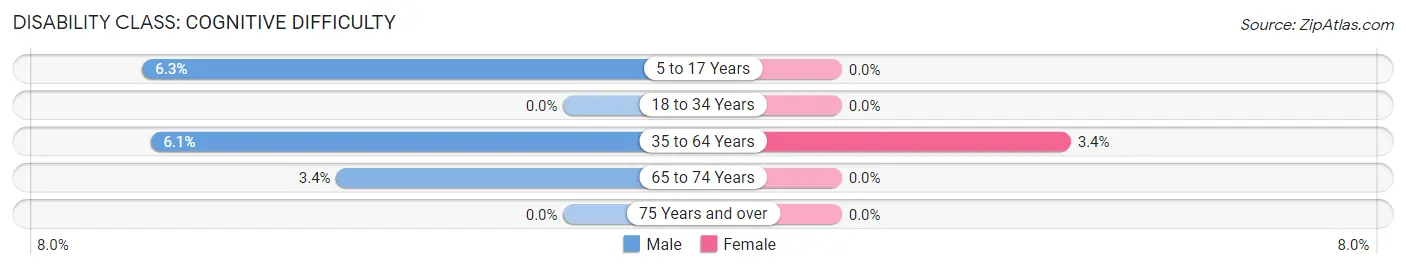
| Age Bracket | Male | Female |
| 5 to 17 Years | 2 (6.2%) | 0 (0.0%) |
| 18 to 34 Years | 0 (0.0%) | 0 (0.0%) |
| 35 to 64 Years | 10 (6.1%) | 5 (3.4%) |
| 65 to 74 Years | 3 (3.4%) | 0 (0.0%) |
| 75 Years and over | 0 (0.0%) | 0 (0.0%) |
Disability Class: Ambulatory Difficulty
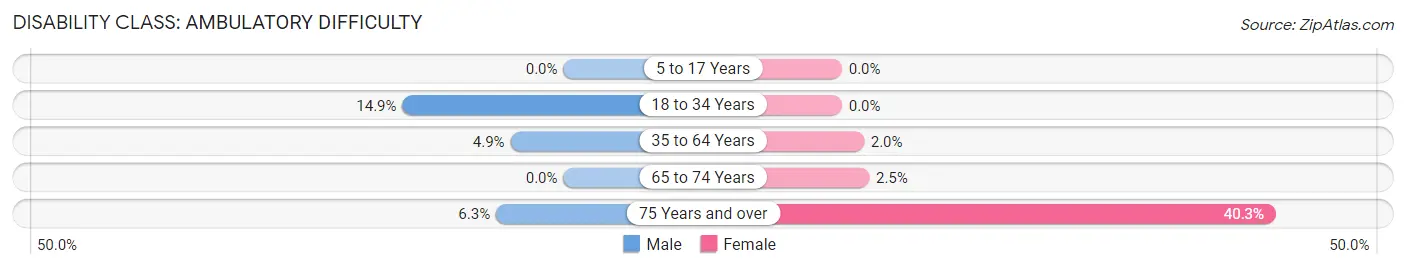
| Age Bracket | Male | Female |
| 5 to 17 Years | 0 (0.0%) | 0 (0.0%) |
| 18 to 34 Years | 13 (14.9%) | 0 (0.0%) |
| 35 to 64 Years | 8 (4.9%) | 3 (2.0%) |
| 65 to 74 Years | 0 (0.0%) | 2 (2.5%) |
| 75 Years and over | 1 (6.2%) | 29 (40.3%) |
Disability Class: Self-Care Difficulty
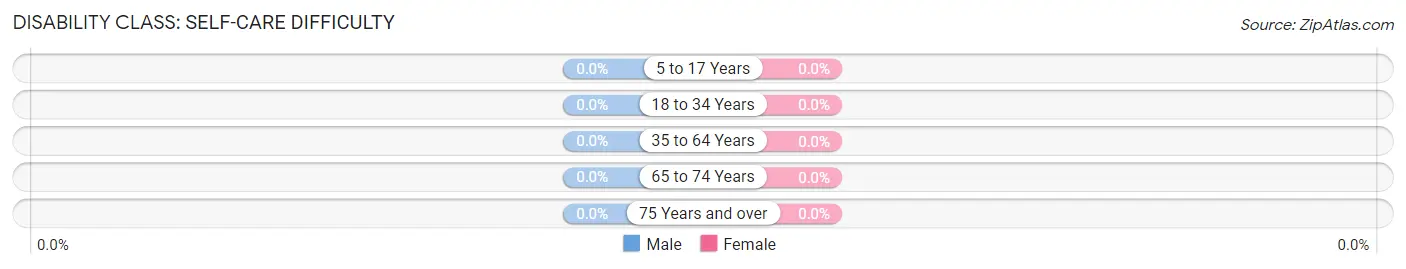
| Age Bracket | Male | Female |
| 5 to 17 Years | 0 (0.0%) | 0 (0.0%) |
| 18 to 34 Years | 0 (0.0%) | 0 (0.0%) |
| 35 to 64 Years | 0 (0.0%) | 0 (0.0%) |
| 65 to 74 Years | 0 (0.0%) | 0 (0.0%) |
| 75 Years and over | 0 (0.0%) | 0 (0.0%) |
Technology Access in Killbuck
Computing Device Access in Killbuck
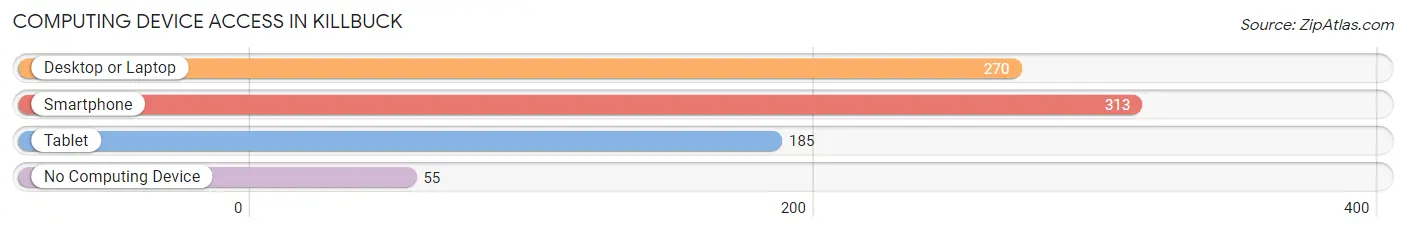
| Device Type | # Households | % Households |
| Desktop or Laptop | 270 | 66.5% |
| Smartphone | 313 | 77.1% |
| Tablet | 185 | 45.6% |
| No Computing Device | 55 | 13.6% |
| Total | 406 | 100.0% |
Internet Access in Killbuck
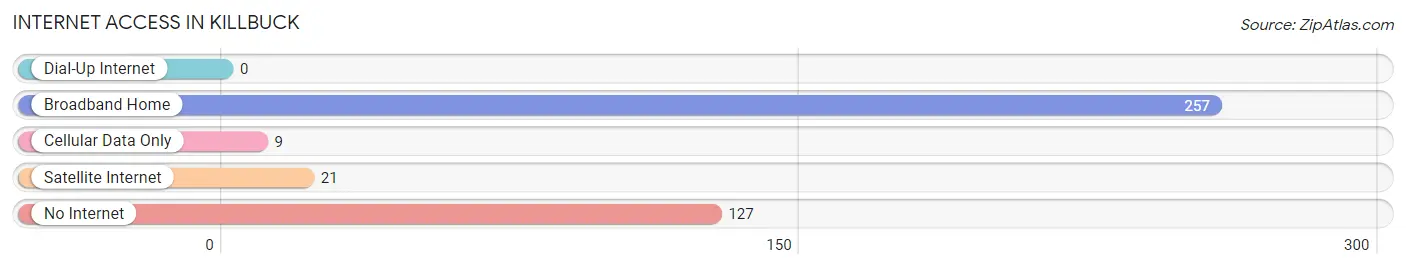
| Internet Type | # Households | % Households |
| Dial-Up Internet | 0 | 0.0% |
| Broadband Home | 257 | 63.3% |
| Cellular Data Only | 9 | 2.2% |
| Satellite Internet | 21 | 5.2% |
| No Internet | 127 | 31.3% |
| Total | 406 | 100.0% |
Killbuck Summary
History
The small village of Killbuck, Ohio is located in Holmes County, in the heart of Amish Country. The village was founded in 1817 by a group of settlers from Pennsylvania, and was originally known as Killbuck Settlement. The name was derived from the nearby Killbuck Creek, which was named after a Native American chief who lived in the area.
The village was originally a farming community, and the settlers grew a variety of crops, including wheat, corn, and oats. The village also had a sawmill, a gristmill, and a blacksmith shop. In 1820, the first school was built in Killbuck, and the village soon became a center of education and culture.
In the late 1800s, the village began to grow and prosper. The railroad came to Killbuck in 1881, and the village became a popular stop for travelers. The railroad also brought new businesses to the area, including a hotel, a general store, and a post office.
In the early 1900s, Killbuck became a popular tourist destination. The village was known for its beautiful scenery, and visitors came to enjoy the peaceful atmosphere and the nearby Amish Country. The village also had a thriving business district, with several stores, restaurants, and other businesses.
Geography
Killbuck is located in the rolling hills of Holmes County, Ohio. The village is situated on the banks of Killbuck Creek, which flows through the center of the village. The village is surrounded by farmland, and the nearby Amish Country is a popular tourist destination.
The village is located about 25 miles south of Wooster, Ohio, and about 50 miles south of Cleveland. The nearest major city is Akron, which is about 40 miles away.
Economy
The economy of Killbuck is largely based on agriculture and tourism. The village is surrounded by farmland, and the nearby Amish Country is a popular tourist destination. The village also has several small businesses, including restaurants, stores, and other services.
The village is home to several Amish-owned businesses, including a furniture store, a bakery, and a quilt shop. The village also has a small manufacturing plant, which produces a variety of products.
Demographics
As of the 2010 census, the population of Killbuck was 1,093. The village is predominantly white, with a small minority population. The median household income is $37,500, and the median home value is $90,000.
The village is home to a large Amish population, and the Amish culture is an important part of the village's identity. The village also has a strong sense of community, and the residents take pride in their small-town way of life.
Common Questions
What is Per Capita Income in Killbuck?
Per Capita income in Killbuck is $33,774.
What is the Median Family Income in Killbuck?
Median Family Income in Killbuck is $85,577.
What is the Median Household income in Killbuck?
Median Household Income in Killbuck is $65,750.
What is Income or Wage Gap in Killbuck?
Income or Wage Gap in Killbuck is 50.3%.
Women in Killbuck earn 49.7 cents for every dollar earned by a man.
What is Inequality or Gini Index in Killbuck?
Inequality or Gini Index in Killbuck is 0.36.
What is the Total Population of Killbuck?
Total Population of Killbuck is 936.
What is the Total Male Population of Killbuck?
Total Male Population of Killbuck is 423.
What is the Total Female Population of Killbuck?
Total Female Population of Killbuck is 513.
What is the Ratio of Males per 100 Females in Killbuck?
There are 82.46 Males per 100 Females in Killbuck.
What is the Ratio of Females per 100 Males in Killbuck?
There are 121.28 Females per 100 Males in Killbuck.
What is the Median Population Age in Killbuck?
Median Population Age in Killbuck is 44.2 Years.
What is the Average Family Size in Killbuck
Average Family Size in Killbuck is 2.8 People.
What is the Average Household Size in Killbuck
Average Household Size in Killbuck is 2.3 People.
How Large is the Labor Force in Killbuck?
There are 577 People in the Labor Forcein in Killbuck.
What is the Percentage of People in the Labor Force in Killbuck?
70.6% of People are in the Labor Force in Killbuck.
What is the Unemployment Rate in Killbuck?
Unemployment Rate in Killbuck is 10.2%.