Dundee, OH Map & Demographics
Dundee Map
Dundee Overview
$59,830
PER CAPITA INCOME
$118,610
AVG HOUSEHOLD INCOME
0.05
INEQUALITY / GINI INDEX
414
TOTAL POPULATION
194
MALE POPULATION
220
FEMALE POPULATION
88.18
MALES / 100 FEMALES
113.40
FEMALES / 100 MALES
57.9
MEDIAN AGE
1.8
AVG FAMILY SIZE
1.8
AVG HOUSEHOLD SIZE
414
LABOR FORCE [ PEOPLE ]
100.0%
PERCENT IN LABOR FORCE
41.3%
UNEMPLOYMENT RATE
Dundee Zip Codes
Dundee Area Codes
Income in Dundee
Income Overview in Dundee
| Characteristic | Number | Measure |
| Per Capita Income | 414 | $59,830 |
| Median Family Income | 221 | $0 |
| Mean Family Income | 221 | $0 |
| Median Household Income | 229 | $118,610 |
| Mean Household Income | 229 | $113,522 |
| Income Deficit | 221 | $0 |
| Wage / Income Gap (%) | 414 | 0.00% |
| Wage / Income Gap ($) | 414 | 100.00¢ per $1 |
| Gini / Inequality Index | 414 | 0.05 |
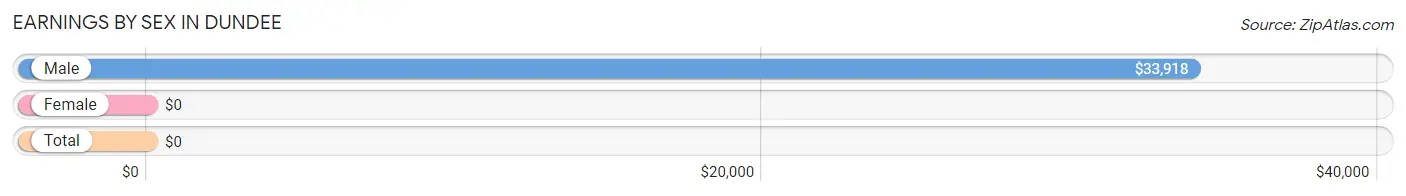
Earnings by Sex in Dundee
| Sex | Number | Average Earnings |
| Male | 194 (46.9%) | $33,918 |
| Female | 220 (53.1%) | $0 |
| Total | 414 (100.0%) | $0 |
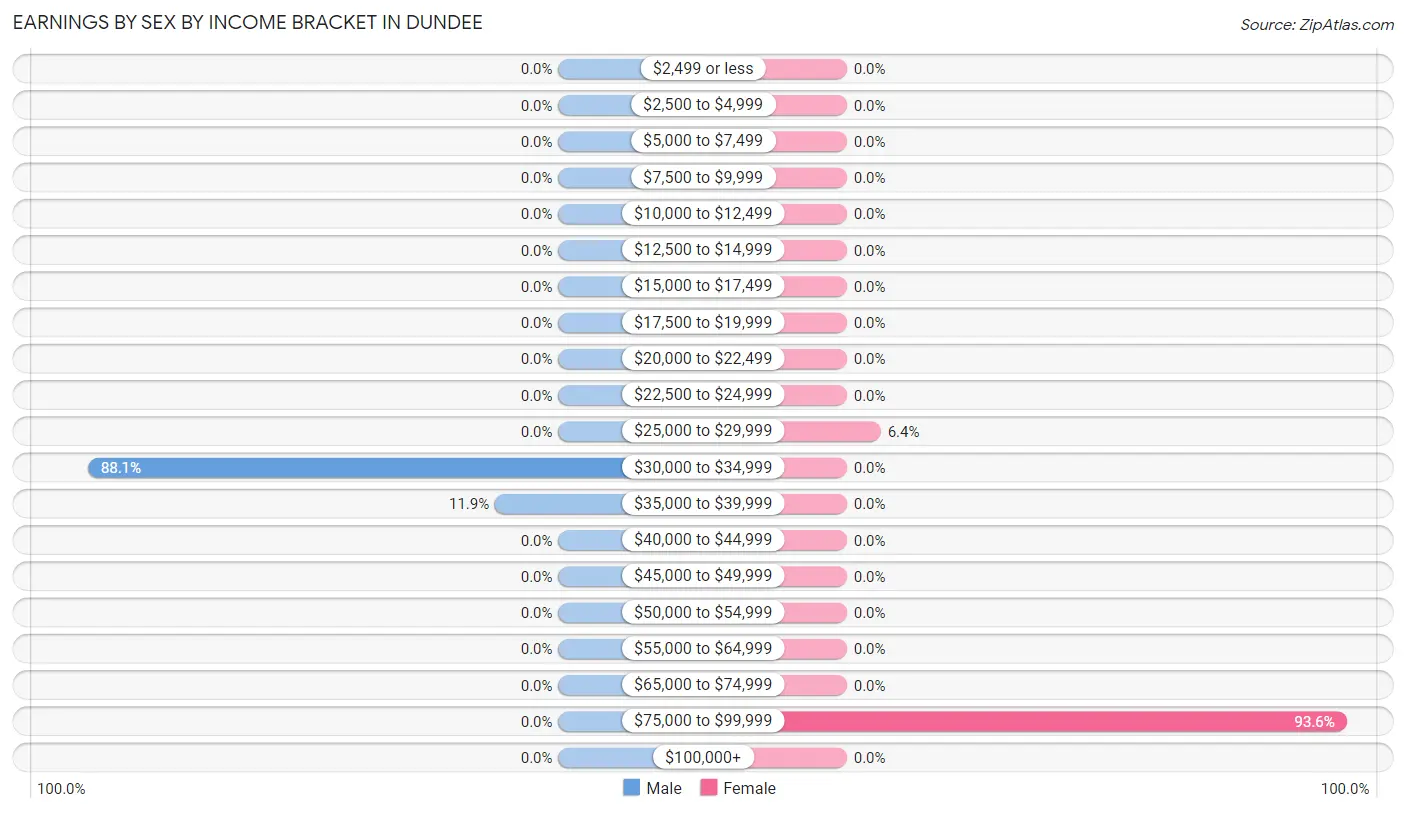
Earnings by Sex by Income Bracket in Dundee
The most common earnings brackets in Dundee are $30,000 to $34,999 for men (171 | 88.1%) and $75,000 to $99,999 for women (206 | 93.6%).
| Income | Male | Female |
| $2,499 or less | 0 (0.0%) | 0 (0.0%) |
| $2,500 to $4,999 | 0 (0.0%) | 0 (0.0%) |
| $5,000 to $7,499 | 0 (0.0%) | 0 (0.0%) |
| $7,500 to $9,999 | 0 (0.0%) | 0 (0.0%) |
| $10,000 to $12,499 | 0 (0.0%) | 0 (0.0%) |
| $12,500 to $14,999 | 0 (0.0%) | 0 (0.0%) |
| $15,000 to $17,499 | 0 (0.0%) | 0 (0.0%) |
| $17,500 to $19,999 | 0 (0.0%) | 0 (0.0%) |
| $20,000 to $22,499 | 0 (0.0%) | 0 (0.0%) |
| $22,500 to $24,999 | 0 (0.0%) | 0 (0.0%) |
| $25,000 to $29,999 | 0 (0.0%) | 14 (6.4%) |
| $30,000 to $34,999 | 171 (88.1%) | 0 (0.0%) |
| $35,000 to $39,999 | 23 (11.9%) | 0 (0.0%) |
| $40,000 to $44,999 | 0 (0.0%) | 0 (0.0%) |
| $45,000 to $49,999 | 0 (0.0%) | 0 (0.0%) |
| $50,000 to $54,999 | 0 (0.0%) | 0 (0.0%) |
| $55,000 to $64,999 | 0 (0.0%) | 0 (0.0%) |
| $65,000 to $74,999 | 0 (0.0%) | 0 (0.0%) |
| $75,000 to $99,999 | 0 (0.0%) | 206 (93.6%) |
| $100,000+ | 0 (0.0%) | 0 (0.0%) |
| Total | 194 (100.0%) | 220 (100.0%) |
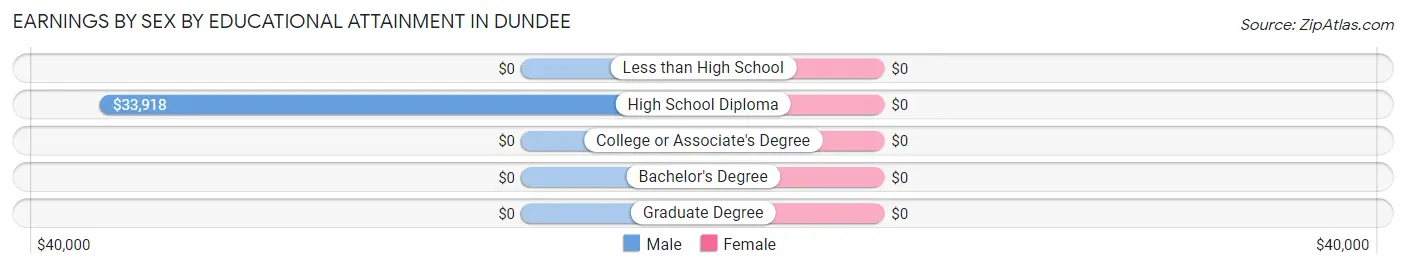
Earnings by Sex by Educational Attainment in Dundee
| Educational Attainment | Male Income | Female Income |
| Less than High School | - | - |
| High School Diploma | $33,918 | $0 |
| College or Associate's Degree | - | - |
| Bachelor's Degree | - | - |
| Graduate Degree | - | - |
| Total | $33,918 | $0 |
Family Income in Dundee
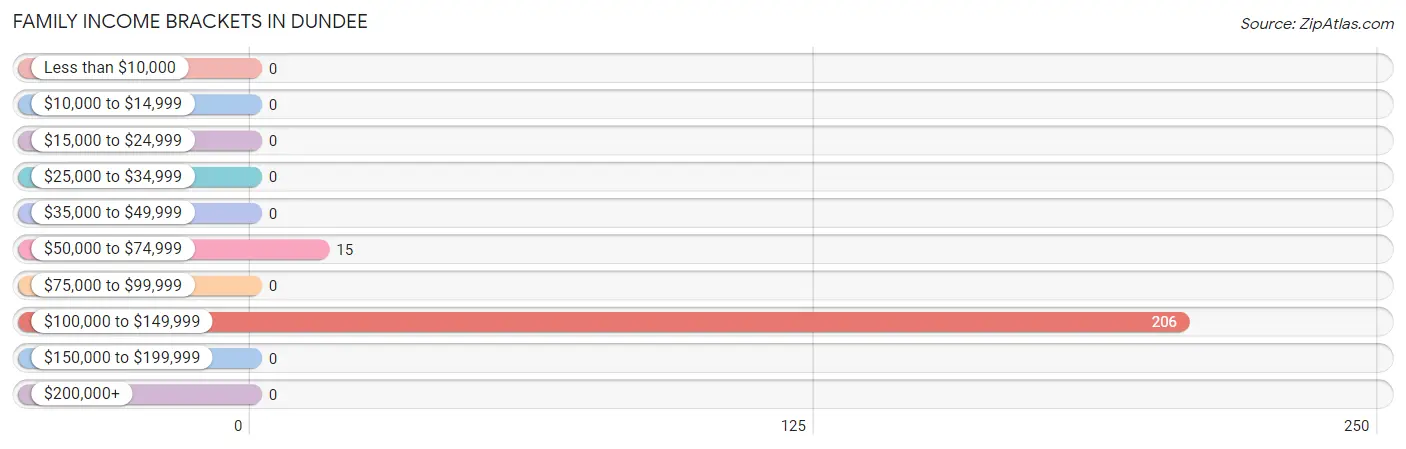
Family Income Brackets in Dundee
According to the Dundee family income data, there are 206 families falling into the $100,000 to $149,999 income range, which is the most common income bracket and makes up 93.2% of all families.
| Income Bracket | # Families | % Families |
| Less than $10,000 | 0 | 0.0% |
| $10,000 to $14,999 | 0 | 0.0% |
| $15,000 to $24,999 | 0 | 0.0% |
| $25,000 to $34,999 | 0 | 0.0% |
| $35,000 to $49,999 | 0 | 0.0% |
| $50,000 to $74,999 | 15 | 6.8% |
| $75,000 to $99,999 | 0 | 0.0% |
| $100,000 to $149,999 | 206 | 93.2% |
| $150,000 to $199,999 | 0 | 0.0% |
| $200,000+ | 0 | 0.0% |
Family Income by Famaliy Size in Dundee
| Income Bracket | # Families | Median Income |
| 2-Person Families | 221 (100.0%) | $0 |
| 3-Person Families | 0 (0.0%) | $0 |
| 4-Person Families | 0 (0.0%) | $0 |
| 5-Person Families | 0 (0.0%) | $0 |
| 6-Person Families | 0 (0.0%) | $0 |
| 7+ Person Families | 0 (0.0%) | $0 |
| Total | 221 (100.0%) | $0 |
Family Income by Number of Earners in Dundee
| Number of Earners | # Families | Median Income |
| No Earners | 0 (0.0%) | $0 |
| 1 Earner | 0 (0.0%) | $0 |
| 2 Earners | 221 (100.0%) | $0 |
| 3+ Earners | 0 (0.0%) | $0 |
| Total | 221 (100.0%) | $0 |
Household Income in Dundee
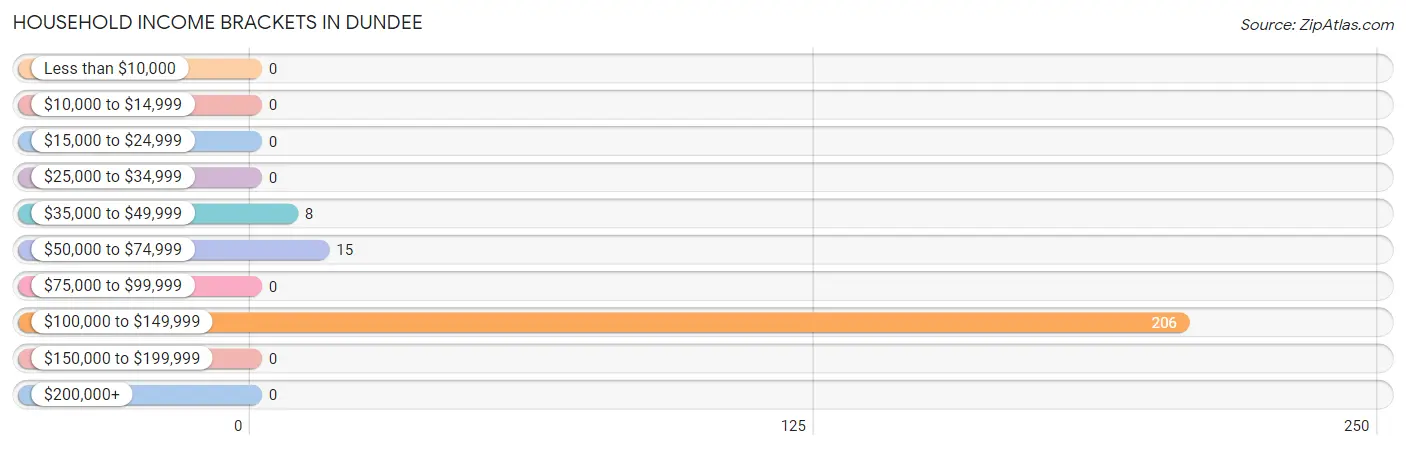
Household Income Brackets in Dundee
With 206 households falling in the category, the $100,000 to $149,999 income range is the most frequent in Dundee, accounting for 90.0% of all households.
| Income Bracket | # Households | % Households |
| Less than $10,000 | 0 | 0.0% |
| $10,000 to $14,999 | 0 | 0.0% |
| $15,000 to $24,999 | 0 | 0.0% |
| $25,000 to $34,999 | 0 | 0.0% |
| $35,000 to $49,999 | 8 | 3.5% |
| $50,000 to $74,999 | 15 | 6.6% |
| $75,000 to $99,999 | 0 | 0.0% |
| $100,000 to $149,999 | 206 | 90.0% |
| $150,000 to $199,999 | 0 | 0.0% |
| $200,000+ | 0 | 0.0% |
Household Income by Householder Age in Dundee
The median household income in Dundee is $118,610, with the highest median household income of $118,610 found in the 45 to 64 years age bracket for the primary householder. A total of 229 households (100.0%) fall into this category.
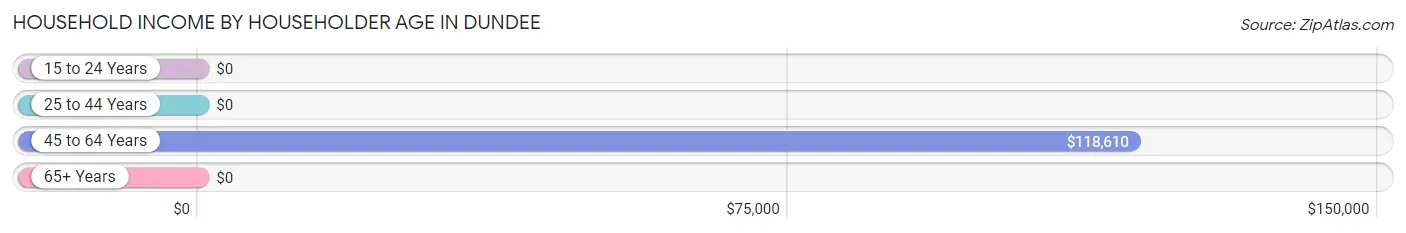
| Income Bracket | # Households | Median Income |
| 15 to 24 Years | 0 (0.0%) | $0 |
| 25 to 44 Years | 0 (0.0%) | $0 |
| 45 to 64 Years | 229 (100.0%) | $118,610 |
| 65+ Years | 0 (0.0%) | $0 |
| Total | 229 (100.0%) | $118,610 |
Poverty in Dundee
Income Below Poverty by Sex and Age in Dundee
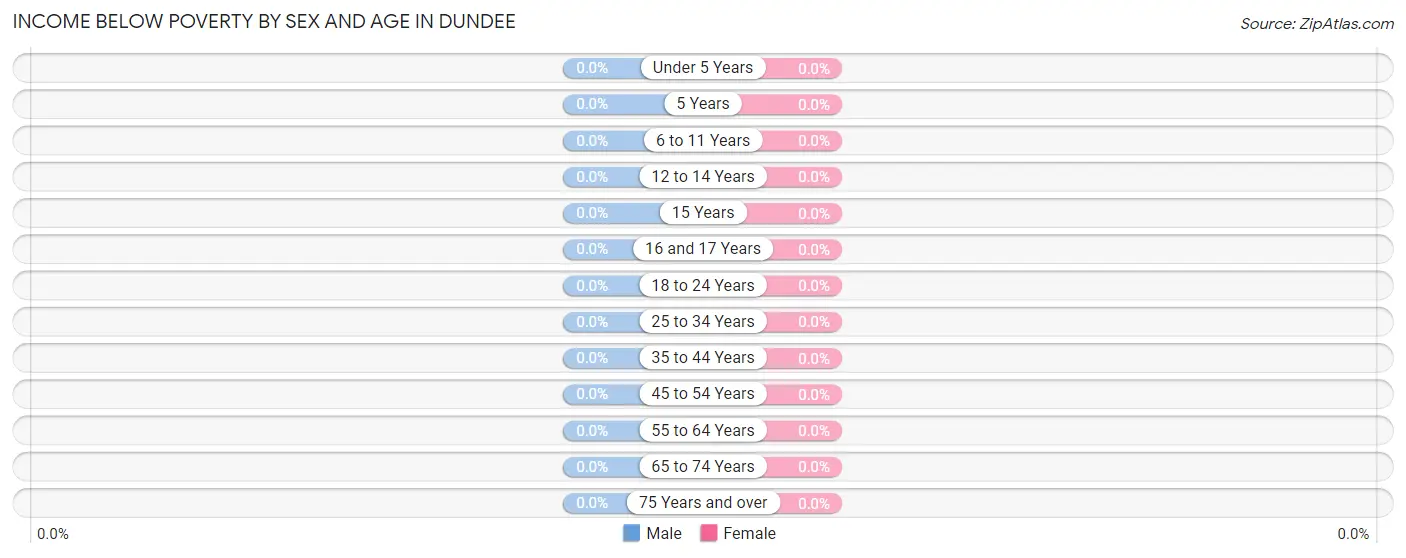
| Age Bracket | Male | Female |
| Under 5 Years | 0 (0.0%) | 0 (0.0%) |
| 5 Years | 0 (0.0%) | 0 (0.0%) |
| 6 to 11 Years | 0 (0.0%) | 0 (0.0%) |
| 12 to 14 Years | 0 (0.0%) | 0 (0.0%) |
| 15 Years | 0 (0.0%) | 0 (0.0%) |
| 16 and 17 Years | 0 (0.0%) | 0 (0.0%) |
| 18 to 24 Years | 0 (0.0%) | 0 (0.0%) |
| 25 to 34 Years | 0 (0.0%) | 0 (0.0%) |
| 35 to 44 Years | 0 (0.0%) | 0 (0.0%) |
| 45 to 54 Years | 0 (0.0%) | 0 (0.0%) |
| 55 to 64 Years | 0 (0.0%) | 0 (0.0%) |
| 65 to 74 Years | 0 (0.0%) | 0 (0.0%) |
| 75 Years and over | 0 (0.0%) | 0 (0.0%) |
| Total | 0 (0.0%) | 0 (0.0%) |
Income Above Poverty by Sex and Age in Dundee
According to the poverty statistics in Dundee, males aged 45 to 54 years and females aged 55 to 64 years are the age groups that are most secure financially, with 100.0% of males and 100.0% of females in these age groups living above the poverty line.
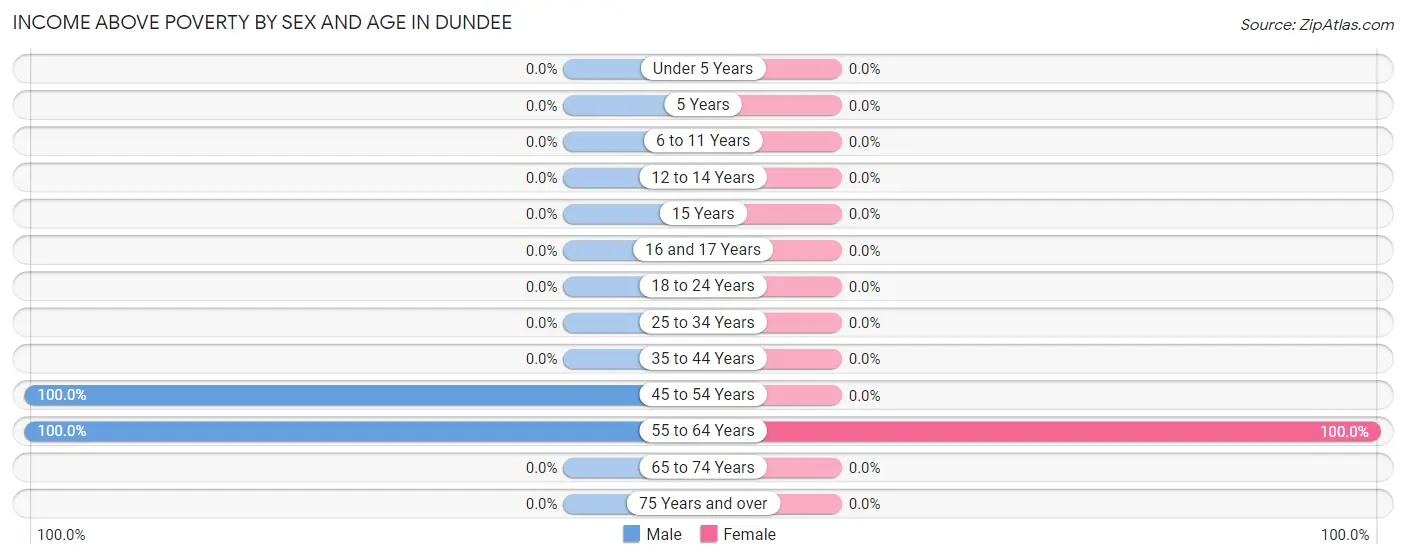
| Age Bracket | Male | Female |
| Under 5 Years | 0 (0.0%) | 0 (0.0%) |
| 5 Years | 0 (0.0%) | 0 (0.0%) |
| 6 to 11 Years | 0 (0.0%) | 0 (0.0%) |
| 12 to 14 Years | 0 (0.0%) | 0 (0.0%) |
| 15 Years | 0 (0.0%) | 0 (0.0%) |
| 16 and 17 Years | 0 (0.0%) | 0 (0.0%) |
| 18 to 24 Years | 0 (0.0%) | 0 (0.0%) |
| 25 to 34 Years | 0 (0.0%) | 0 (0.0%) |
| 35 to 44 Years | 0 (0.0%) | 0 (0.0%) |
| 45 to 54 Years | 8 (100.0%) | 0 (0.0%) |
| 55 to 64 Years | 186 (100.0%) | 220 (100.0%) |
| 65 to 74 Years | 0 (0.0%) | 0 (0.0%) |
| 75 Years and over | 0 (0.0%) | 0 (0.0%) |
| Total | 194 (100.0%) | 220 (100.0%) |
Income Below Poverty Among Married-Couple Families in Dundee
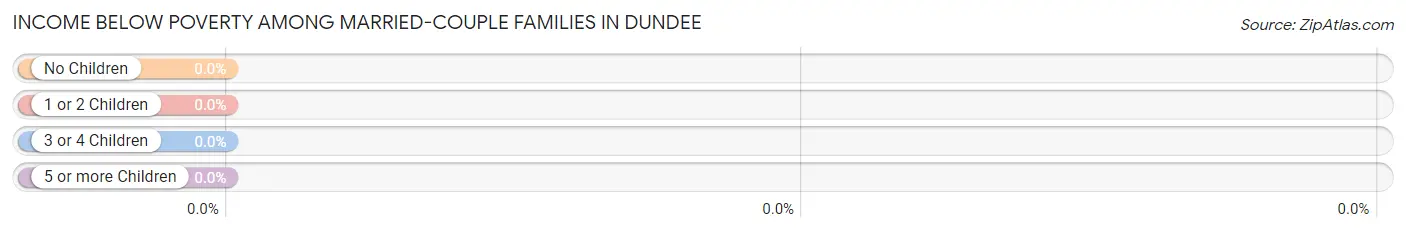
| Children | Above Poverty | Below Poverty |
| No Children | 221 (100.0%) | 0 (0.0%) |
| 1 or 2 Children | 0 (0.0%) | 0 (0.0%) |
| 3 or 4 Children | 0 (0.0%) | 0 (0.0%) |
| 5 or more Children | 0 (0.0%) | 0 (0.0%) |
| Total | 221 (100.0%) | 0 (0.0%) |
Income Below Poverty Among Single-Parent Households in Dundee
| Children | Single Father | Single Mother |
| No Children | 0 (0.0%) | 0 (0.0%) |
| 1 or 2 Children | 0 (0.0%) | 0 (0.0%) |
| 3 or 4 Children | 0 (0.0%) | 0 (0.0%) |
| 5 or more Children | 0 (0.0%) | 0 (0.0%) |
| Total | 0 (0.0%) | 0 (0.0%) |
Income Below Poverty Among Married-Couple vs Single-Parent Households in Dundee
| Children | Married-Couple Families | Single-Parent Households |
| No Children | 0 (0.0%) | 0 (0.0%) |
| 1 or 2 Children | 0 (0.0%) | 0 (0.0%) |
| 3 or 4 Children | 0 (0.0%) | 0 (0.0%) |
| 5 or more Children | 0 (0.0%) | 0 (0.0%) |
| Total | 0 (0.0%) | 0 (0.0%) |
Race in Dundee
The most populous races in Dundee are , and White / Caucasian (414 | 100.0%).
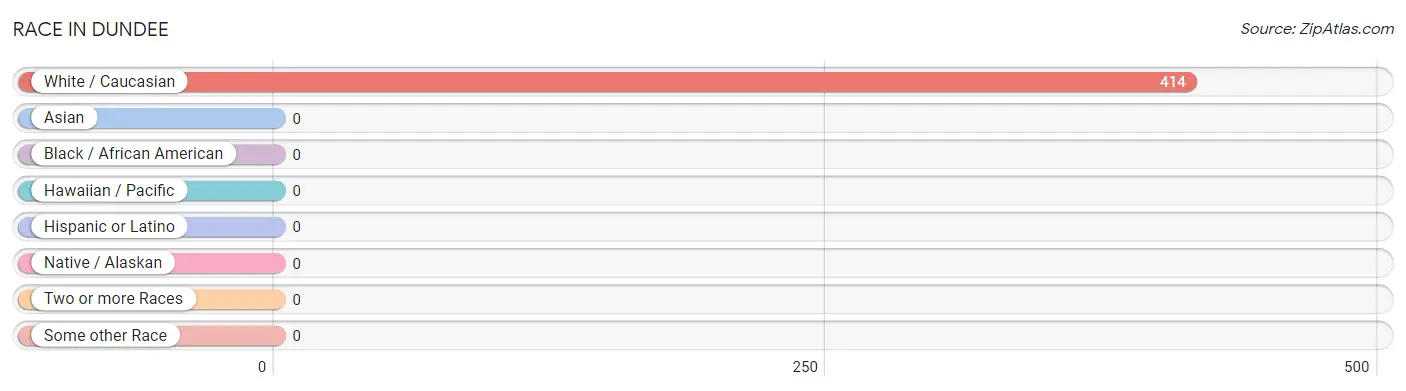
| Race | # Population | % Population |
| Asian | 0 | 0.0% |
| Black / African American | 0 | 0.0% |
| Hawaiian / Pacific | 0 | 0.0% |
| Hispanic or Latino | 0 | 0.0% |
| Native / Alaskan | 0 | 0.0% |
| White / Caucasian | 414 | 100.0% |
| Two or more Races | 0 | 0.0% |
| Some other Race | 0 | 0.0% |
| Total | 414 | 100.0% |
Ancestry in Dundee
The most populous ancestries reported in Dundee are German (179 | 43.2%), and American (29 | 7.0%), together accounting for 50.2% of all Dundee residents.
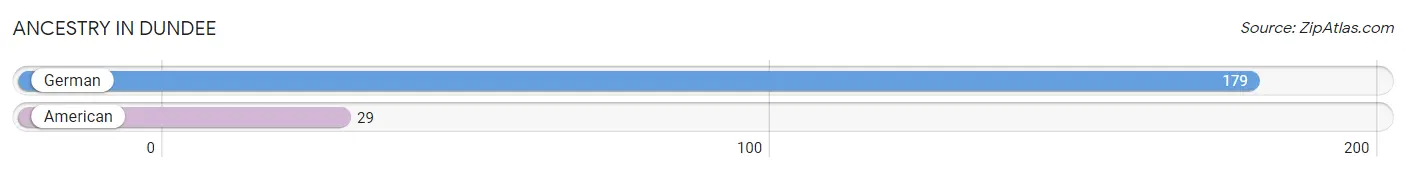
| Ancestry | # Population | % Population |
| American | 29 | 7.0% |
| German | 179 | 43.2% | View All 2 Rows |
Immigrants in Dundee

| Immigration Origin | # Population | % Population | View All 0 Rows |
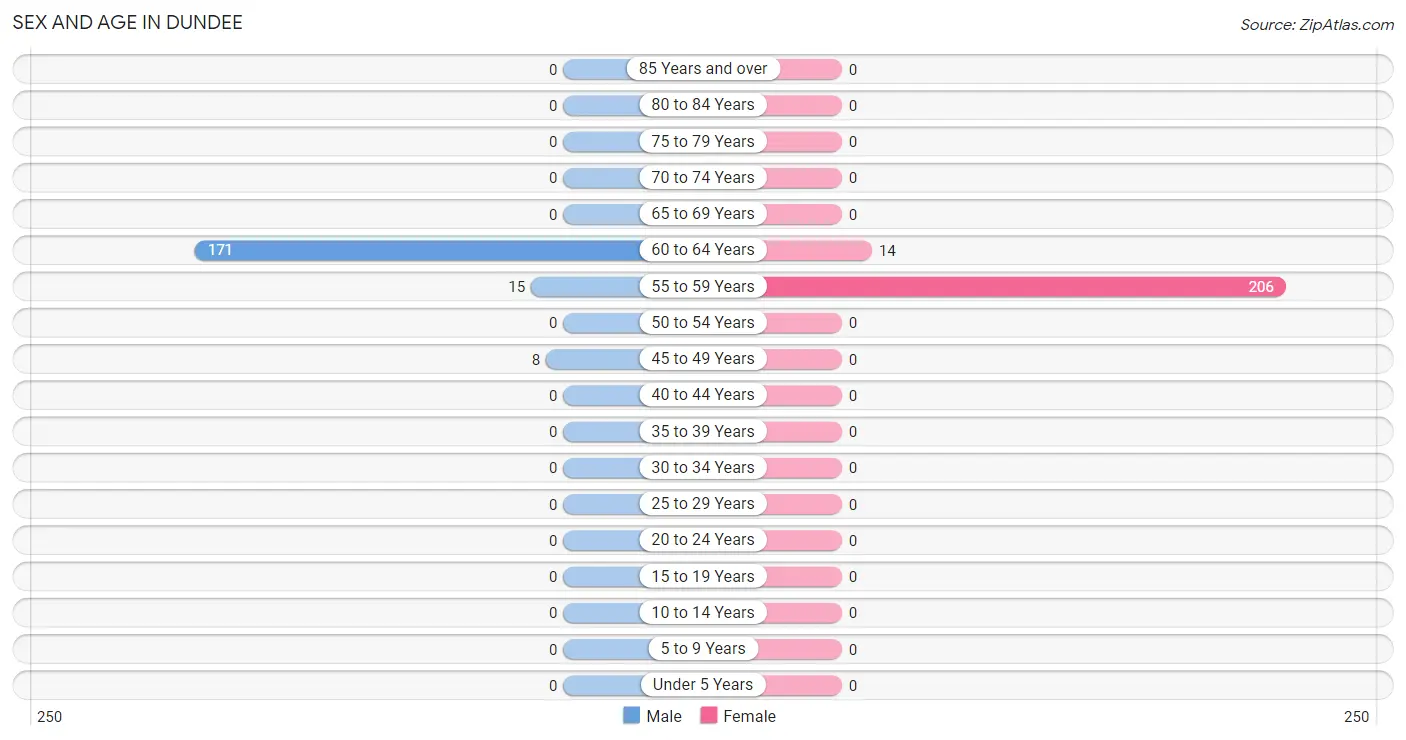
Sex and Age in Dundee
Sex and Age in Dundee
The most populous age groups in Dundee are 60 to 64 Years (171 | 88.1%) for men and 55 to 59 Years (206 | 93.6%) for women.
| Age Bracket | Male | Female |
| Under 5 Years | 0 (0.0%) | 0 (0.0%) |
| 5 to 9 Years | 0 (0.0%) | 0 (0.0%) |
| 10 to 14 Years | 0 (0.0%) | 0 (0.0%) |
| 15 to 19 Years | 0 (0.0%) | 0 (0.0%) |
| 20 to 24 Years | 0 (0.0%) | 0 (0.0%) |
| 25 to 29 Years | 0 (0.0%) | 0 (0.0%) |
| 30 to 34 Years | 0 (0.0%) | 0 (0.0%) |
| 35 to 39 Years | 0 (0.0%) | 0 (0.0%) |
| 40 to 44 Years | 0 (0.0%) | 0 (0.0%) |
| 45 to 49 Years | 8 (4.1%) | 0 (0.0%) |
| 50 to 54 Years | 0 (0.0%) | 0 (0.0%) |
| 55 to 59 Years | 15 (7.7%) | 206 (93.6%) |
| 60 to 64 Years | 171 (88.1%) | 14 (6.4%) |
| 65 to 69 Years | 0 (0.0%) | 0 (0.0%) |
| 70 to 74 Years | 0 (0.0%) | 0 (0.0%) |
| 75 to 79 Years | 0 (0.0%) | 0 (0.0%) |
| 80 to 84 Years | 0 (0.0%) | 0 (0.0%) |
| 85 Years and over | 0 (0.0%) | 0 (0.0%) |
| Total | 194 (100.0%) | 220 (100.0%) |
Families and Households in Dundee
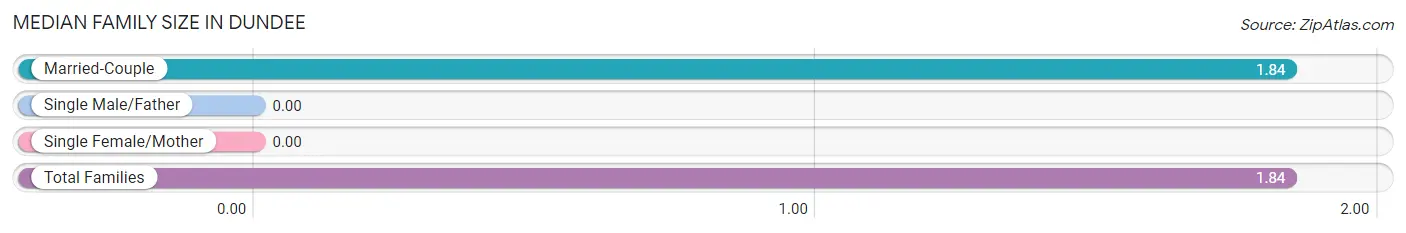
Median Family Size in Dundee
| Family Type | # Families | Family Size |
| Married-Couple | 221 (100.0%) | 1.84 |
| Single Male/Father | 0 (0.0%) | - |
| Single Female/Mother | 0 (0.0%) | - |
| Total Families | 221 (100.0%) | 1.84 |
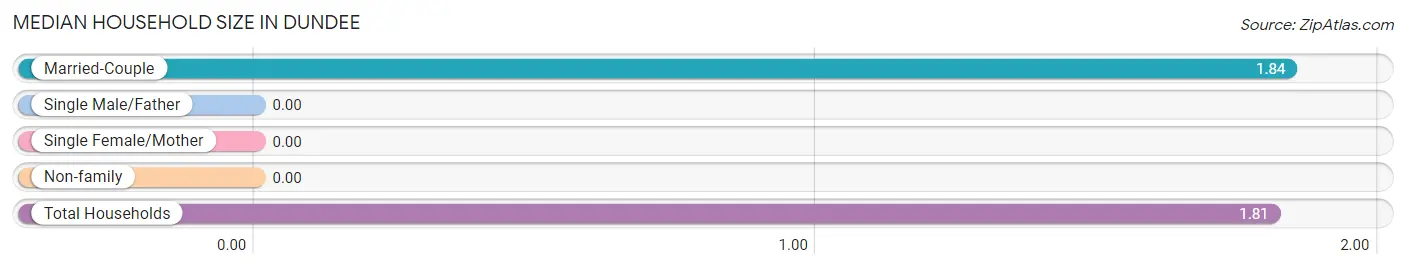
Median Household Size in Dundee
| Household Type | # Households | Household Size |
| Married-Couple | 221 (96.5%) | 1.84 |
| Single Male/Father | 0 (0.0%) | - |
| Single Female/Mother | 0 (0.0%) | - |
| Non-family | 8 (3.5%) | - |
| Total Households | 229 (100.0%) | 1.81 |
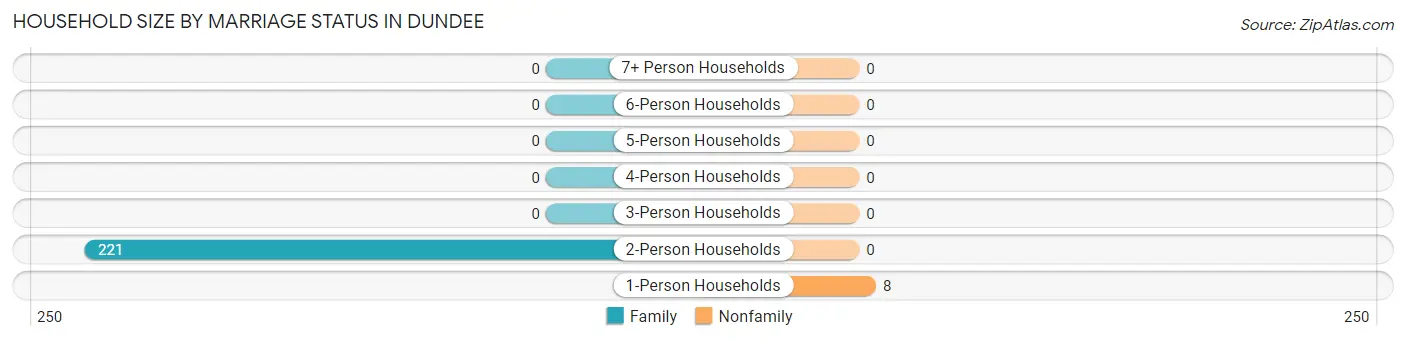
Household Size by Marriage Status in Dundee
Out of a total of 229 households in Dundee, 221 (96.5%) are family households, while 8 (3.5%) are nonfamily households. The most numerous type of family households are 2-person households, comprising 221, and the most common type of nonfamily households are 1-person households, comprising 8.
| Household Size | Family Households | Nonfamily Households |
| 1-Person Households | - | 8 (3.5%) |
| 2-Person Households | 221 (96.5%) | 0 (0.0%) |
| 3-Person Households | 0 (0.0%) | 0 (0.0%) |
| 4-Person Households | 0 (0.0%) | 0 (0.0%) |
| 5-Person Households | 0 (0.0%) | 0 (0.0%) |
| 6-Person Households | 0 (0.0%) | 0 (0.0%) |
| 7+ Person Households | 0 (0.0%) | 0 (0.0%) |
| Total | 221 (96.5%) | 8 (3.5%) |
Female Fertility in Dundee
Fertility by Age in Dundee
| Age Bracket | Women with Births | Births / 1,000 Women |
| 15 to 19 years | 0 (0.0%) | 0.0 |
| 20 to 34 years | 0 (0.0%) | 0.0 |
| 35 to 50 years | 0 (0.0%) | 0.0 |
| Total | 0 (0.0%) | 0.0 |
Fertility by Age by Marriage Status in Dundee
| Age Bracket | Married | Unmarried |
| 15 to 19 years | 0 (0.0%) | 0 (0.0%) |
| 20 to 34 years | 0 (0.0%) | 0 (0.0%) |
| 35 to 50 years | 0 (0.0%) | 0 (0.0%) |
| Total | 0 (0.0%) | 0 (0.0%) |
Fertility by Education in Dundee
| Educational Attainment | Women with Births | Births / 1,000 Women |
| Less than High School | 0 (0.0%) | 0.0 |
| High School Diploma | 0 (0.0%) | 0.0 |
| College or Associate's Degree | 0 (0.0%) | 0.0 |
| Bachelor's Degree | 0 (0.0%) | 0.0 |
| Graduate Degree | 0 (0.0%) | 0.0 |
| Total | 0 (0.0%) | 0.0 |
Fertility by Education by Marriage Status in Dundee
| Educational Attainment | Married | Unmarried |
| Less than High School | 0 (0.0%) | 0 (0.0%) |
| High School Diploma | 0 (0.0%) | 0 (0.0%) |
| College or Associate's Degree | 0 (0.0%) | 0 (0.0%) |
| Bachelor's Degree | 0 (0.0%) | 0 (0.0%) |
| Graduate Degree | 0 (0.0%) | 0 (0.0%) |
| Total | 0 (0.0%) | 0 (0.0%) |
Employment Characteristics in Dundee
Employment by Class of Employer in Dundee
Among the 243 employed individuals in Dundee, , and private company employees (243 | 100.0%) make up the most common classes of employment.
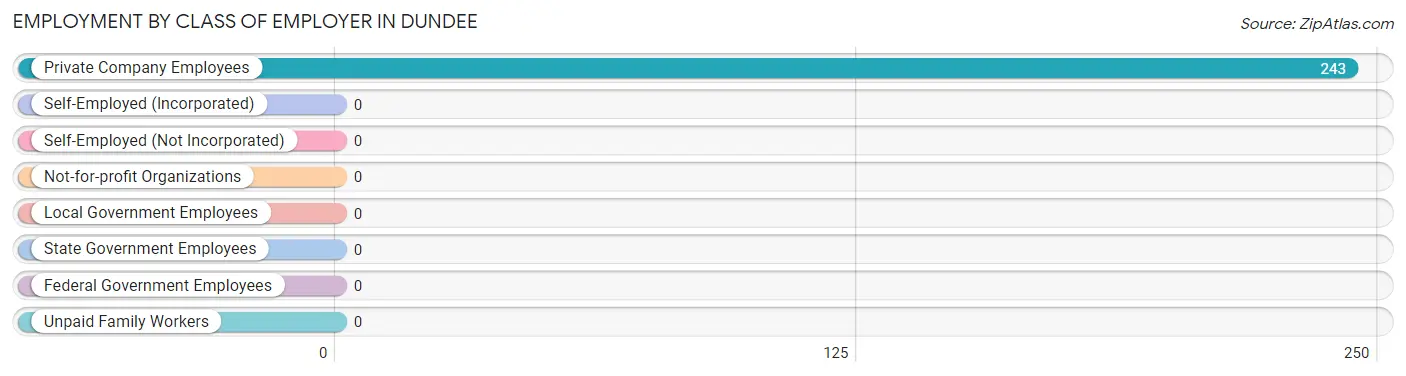
| Employer Class | # Employees | % Employees |
| Private Company Employees | 243 | 100.0% |
| Self-Employed (Incorporated) | 0 | 0.0% |
| Self-Employed (Not Incorporated) | 0 | 0.0% |
| Not-for-profit Organizations | 0 | 0.0% |
| Local Government Employees | 0 | 0.0% |
| State Government Employees | 0 | 0.0% |
| Federal Government Employees | 0 | 0.0% |
| Unpaid Family Workers | 0 | 0.0% |
| Total | 243 | 100.0% |
Employment Status by Age in Dundee
According to the labor force statistics for Dundee, out of the total population over 16 years of age (414), 100.0% or 414 individuals are in the labor force, with 41.3% or 171 of them unemployed. The age group with the highest labor force participation rate is 45 to 54 years, with 100.0% or 8 individuals in the labor force. Within the labor force, the 60 to 64 years age range has the highest percentage of unemployed individuals, with 92.4% or 171 of them being unemployed.
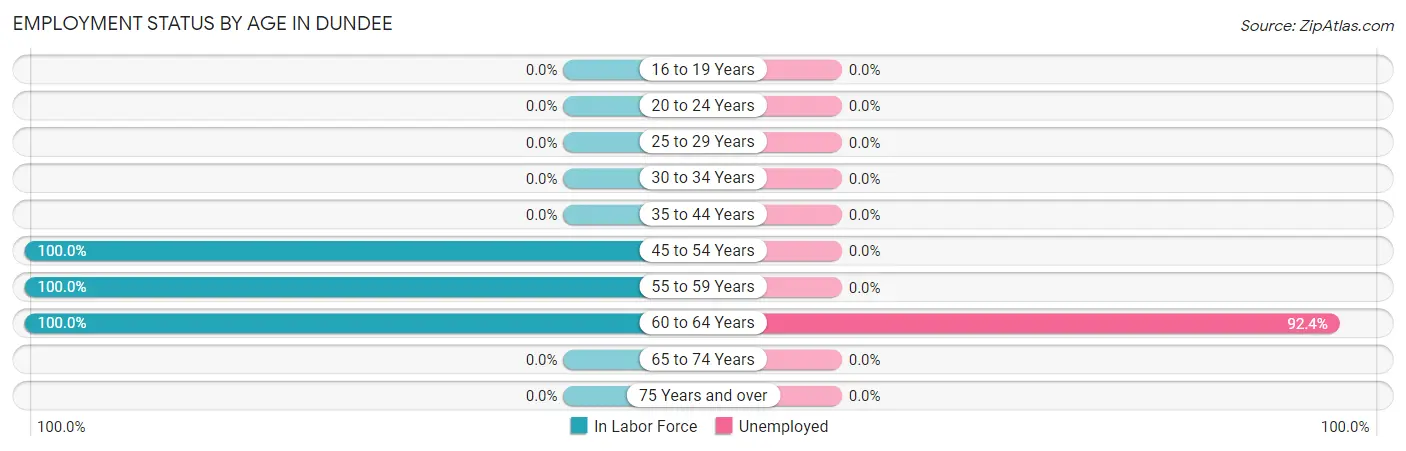
| Age Bracket | In Labor Force | Unemployed |
| 16 to 19 Years | 0 (0.0%) | 0 (0.0%) |
| 20 to 24 Years | 0 (0.0%) | 0 (0.0%) |
| 25 to 29 Years | 0 (0.0%) | 0 (0.0%) |
| 30 to 34 Years | 0 (0.0%) | 0 (0.0%) |
| 35 to 44 Years | 0 (0.0%) | 0 (0.0%) |
| 45 to 54 Years | 8 (100.0%) | 0 (0.0%) |
| 55 to 59 Years | 221 (100.0%) | 0 (0.0%) |
| 60 to 64 Years | 185 (100.0%) | 171 (92.4%) |
| 65 to 74 Years | 0 (0.0%) | 0 (0.0%) |
| 75 Years and over | 0 (0.0%) | 0 (0.0%) |
| Total | 414 (100.0%) | 171 (41.3%) |
Employment Status by Educational Attainment in Dundee
According to labor force statistics for Dundee, 100.0% of individuals (414) out of the total population between 25 and 64 years of age (414) are in the labor force, with 41.3% or 171 of them being unemployed. The group with the highest labor force participation rate are those with the educational attainment of high school diploma, with 100.0% or 414 individuals in the labor force. Within the labor force, individuals with high school diploma education have the highest percentage of unemployment, with 41.3% or 171 of them being unemployed.
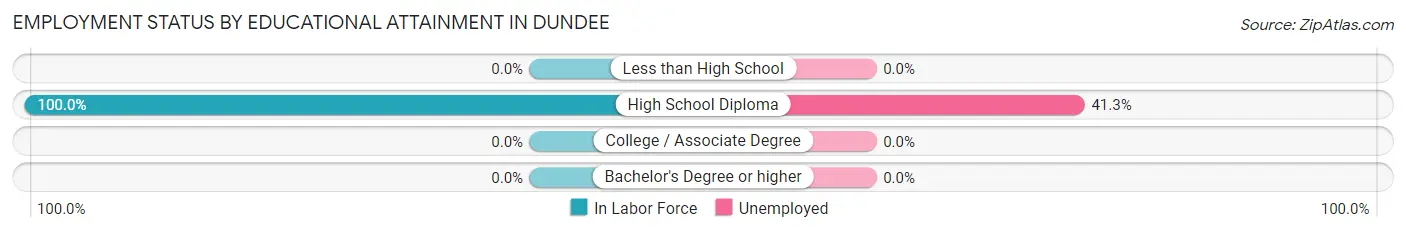
| Educational Attainment | In Labor Force | Unemployed |
| Less than High School | 0 (0.0%) | 0 (0.0%) |
| High School Diploma | 414 (100.0%) | 171 (41.3%) |
| College / Associate Degree | 0 (0.0%) | 0 (0.0%) |
| Bachelor's Degree or higher | 0 (0.0%) | 0 (0.0%) |
| Total | 414 (100.0%) | 171 (41.3%) |
Employment Occupations by Sex in Dundee
Management, Business, Science and Arts Occupations
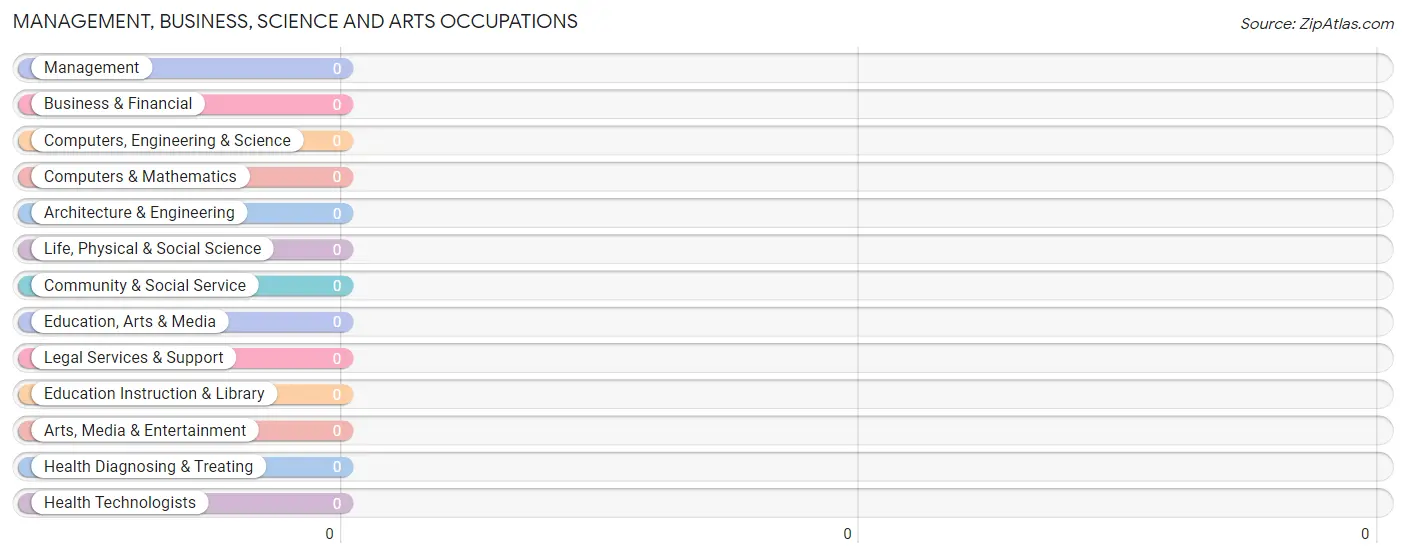
Management, Business, Science and Arts Occupations by Sex
| Occupation | Male | Female |
| Management | 0 (0.0%) | 0 (0.0%) |
| Business & Financial | 0 (0.0%) | 0 (0.0%) |
| Computers, Engineering & Science | 0 (0.0%) | 0 (0.0%) |
| Computers & Mathematics | 0 (0.0%) | 0 (0.0%) |
| Architecture & Engineering | 0 (0.0%) | 0 (0.0%) |
| Life, Physical & Social Science | 0 (0.0%) | 0 (0.0%) |
| Community & Social Service | 0 (0.0%) | 0 (0.0%) |
| Education, Arts & Media | 0 (0.0%) | 0 (0.0%) |
| Legal Services & Support | 0 (0.0%) | 0 (0.0%) |
| Education Instruction & Library | 0 (0.0%) | 0 (0.0%) |
| Arts, Media & Entertainment | 0 (0.0%) | 0 (0.0%) |
| Health Diagnosing & Treating | 0 (0.0%) | 0 (0.0%) |
| Health Technologists | 0 (0.0%) | 0 (0.0%) |
| Total (Category) | 0 (0.0%) | 0 (0.0%) |
| Total (Overall) | 23 (9.5%) | 220 (90.5%) |
Services Occupations
Services Occupations by Sex
| Occupation | Male | Female |
| Healthcare Support | 0 (0.0%) | 0 (0.0%) |
| Security & Protection | 0 (0.0%) | 0 (0.0%) |
| Firefighting & Prevention | 0 (0.0%) | 0 (0.0%) |
| Law Enforcement | 0 (0.0%) | 0 (0.0%) |
| Food Preparation & Serving | 0 (0.0%) | 0 (0.0%) |
| Cleaning & Maintenance | 0 (0.0%) | 0 (0.0%) |
| Personal Care & Service | 0 (0.0%) | 0 (0.0%) |
| Total (Category) | 0 (0.0%) | 0 (0.0%) |
| Total (Overall) | 23 (9.5%) | 220 (90.5%) |
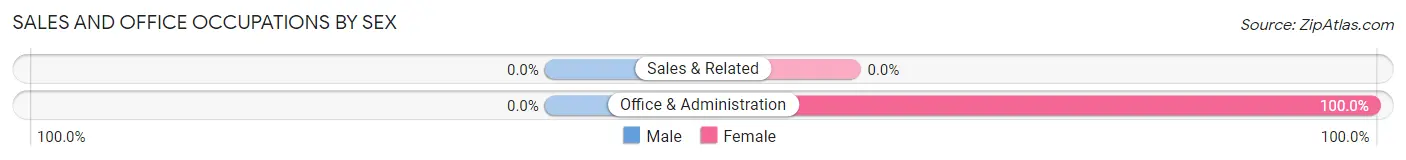
Sales and Office Occupations
The most common Sales and Office occupations in Dundee are , and Office & Administration (14 | 5.8%).
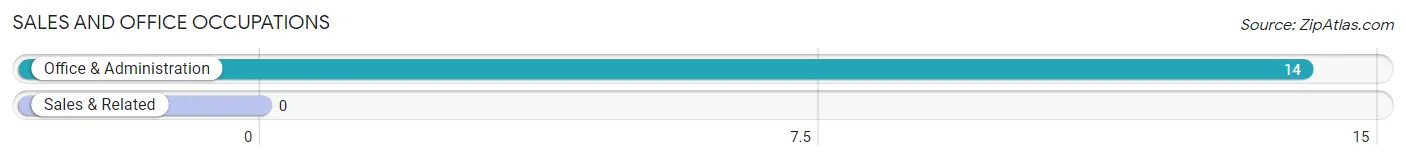
Sales and Office Occupations by Sex
| Occupation | Male | Female |
| Sales & Related | 0 (0.0%) | 0 (0.0%) |
| Office & Administration | 0 (0.0%) | 14 (100.0%) |
| Total (Category) | 0 (0.0%) | 14 (100.0%) |
| Total (Overall) | 23 (9.5%) | 220 (90.5%) |
Natural Resources, Construction and Maintenance Occupations
Natural Resources, Construction and Maintenance Occupations by Sex
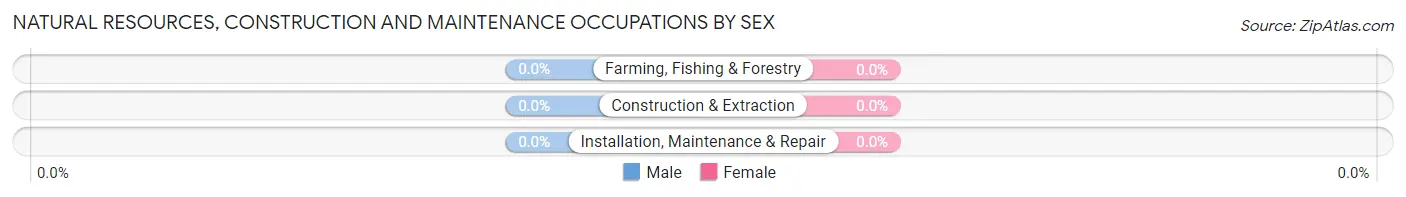
| Occupation | Male | Female |
| Farming, Fishing & Forestry | 0 (0.0%) | 0 (0.0%) |
| Construction & Extraction | 0 (0.0%) | 0 (0.0%) |
| Installation, Maintenance & Repair | 0 (0.0%) | 0 (0.0%) |
| Total (Category) | 0 (0.0%) | 0 (0.0%) |
| Total (Overall) | 23 (9.5%) | 220 (90.5%) |
Production, Transportation and Moving Occupations
The most common Production, Transportation and Moving occupations in Dundee are Production (206 | 84.8%), Material Moving (15 | 6.2%), and Transportation (8 | 3.3%).
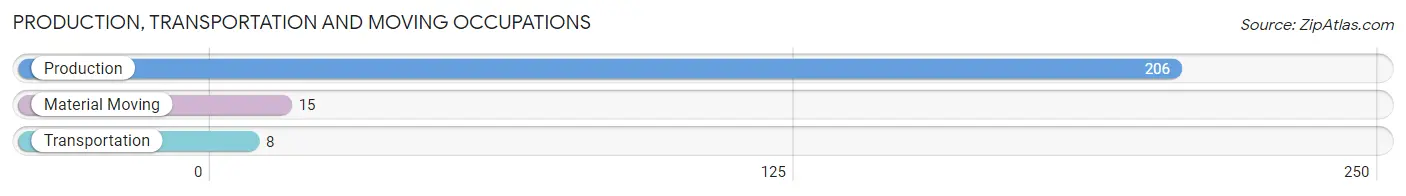
Production, Transportation and Moving Occupations by Sex
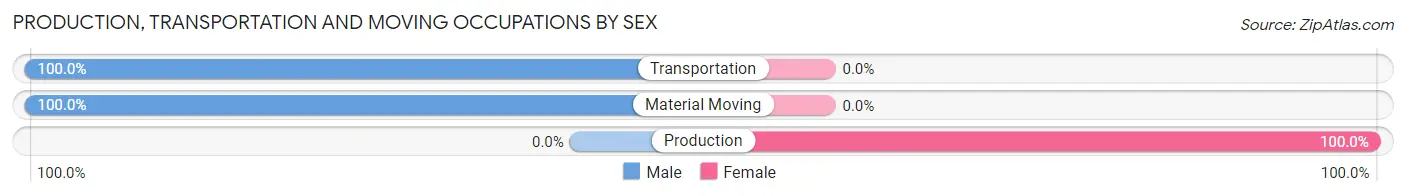
| Occupation | Male | Female |
| Production | 0 (0.0%) | 206 (100.0%) |
| Transportation | 8 (100.0%) | 0 (0.0%) |
| Material Moving | 15 (100.0%) | 0 (0.0%) |
| Total (Category) | 23 (10.0%) | 206 (90.0%) |
| Total (Overall) | 23 (9.5%) | 220 (90.5%) |
Employment Industries by Sex in Dundee
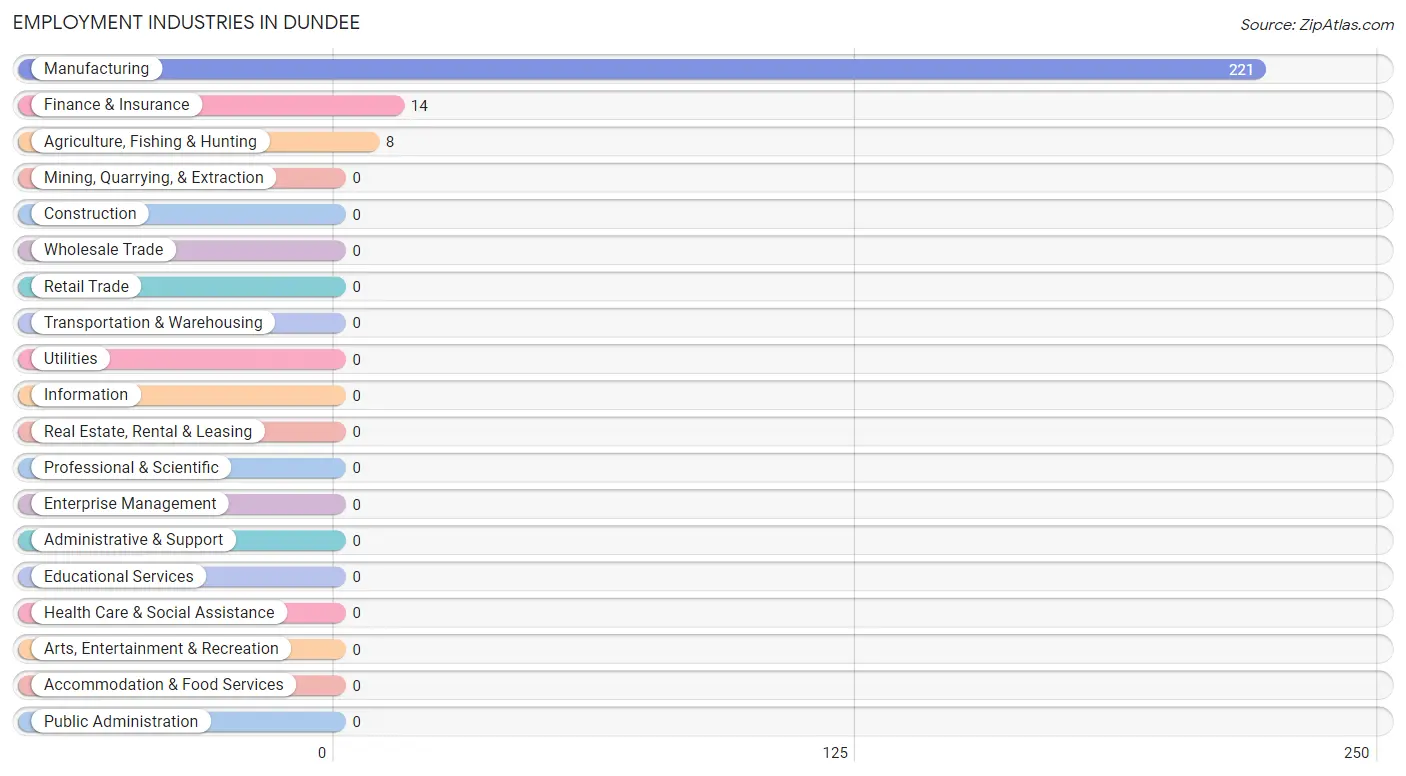
Employment Industries in Dundee
The major employment industries in Dundee include Manufacturing (221 | 90.9%), Finance & Insurance (14 | 5.8%), and Agriculture, Fishing & Hunting (8 | 3.3%).
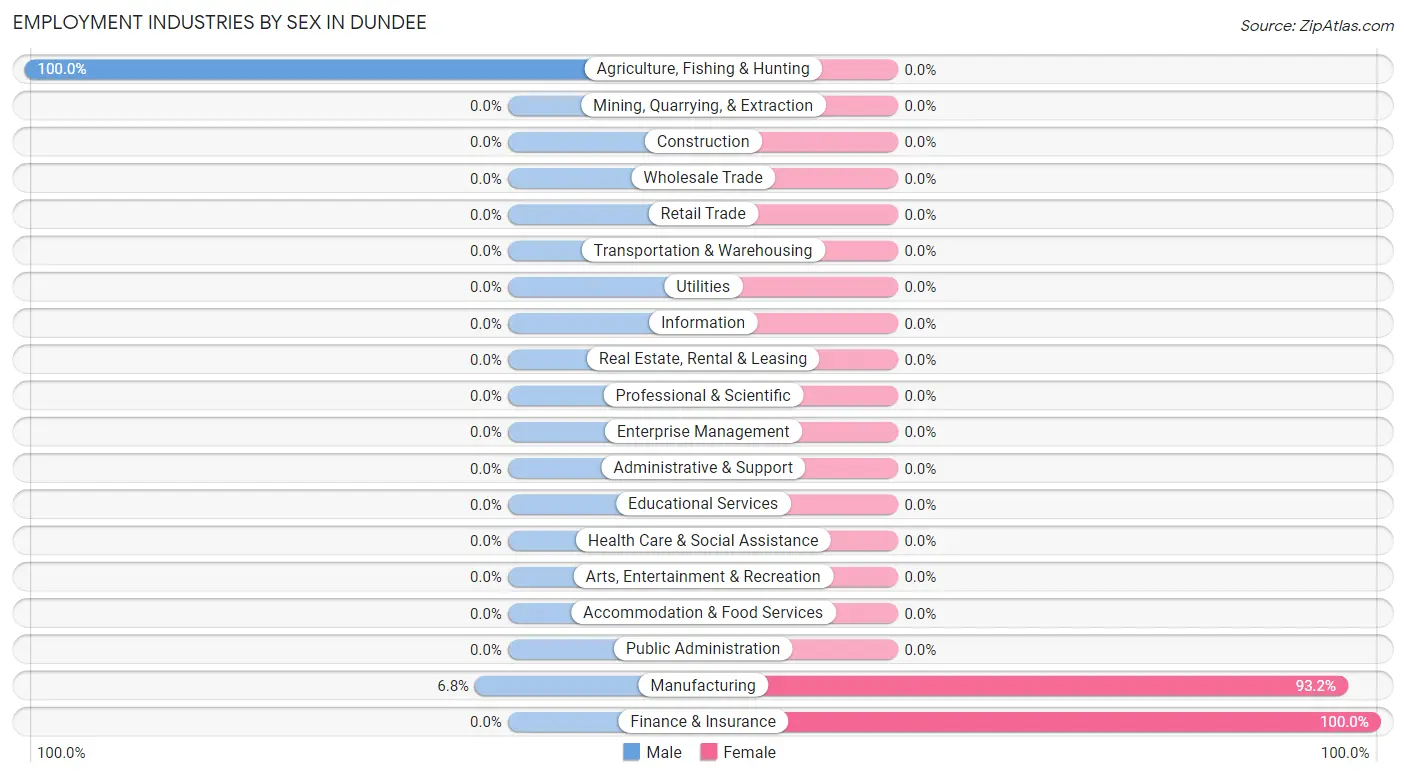
Employment Industries by Sex in Dundee
The Dundee industries that see more men than women are Agriculture, Fishing & Hunting (100.0%), and Manufacturing (6.8%), whereas the industries that tend to have a higher number of women are Finance & Insurance (100.0%), and Manufacturing (93.2%).
| Industry | Male | Female |
| Agriculture, Fishing & Hunting | 8 (100.0%) | 0 (0.0%) |
| Mining, Quarrying, & Extraction | 0 (0.0%) | 0 (0.0%) |
| Construction | 0 (0.0%) | 0 (0.0%) |
| Manufacturing | 15 (6.8%) | 206 (93.2%) |
| Wholesale Trade | 0 (0.0%) | 0 (0.0%) |
| Retail Trade | 0 (0.0%) | 0 (0.0%) |
| Transportation & Warehousing | 0 (0.0%) | 0 (0.0%) |
| Utilities | 0 (0.0%) | 0 (0.0%) |
| Information | 0 (0.0%) | 0 (0.0%) |
| Finance & Insurance | 0 (0.0%) | 14 (100.0%) |
| Real Estate, Rental & Leasing | 0 (0.0%) | 0 (0.0%) |
| Professional & Scientific | 0 (0.0%) | 0 (0.0%) |
| Enterprise Management | 0 (0.0%) | 0 (0.0%) |
| Administrative & Support | 0 (0.0%) | 0 (0.0%) |
| Educational Services | 0 (0.0%) | 0 (0.0%) |
| Health Care & Social Assistance | 0 (0.0%) | 0 (0.0%) |
| Arts, Entertainment & Recreation | 0 (0.0%) | 0 (0.0%) |
| Accommodation & Food Services | 0 (0.0%) | 0 (0.0%) |
| Public Administration | 0 (0.0%) | 0 (0.0%) |
| Total | 23 (9.5%) | 220 (90.5%) |
Education in Dundee
School Enrollment in Dundee
| School Level | # Students | % Students |
| Nursery / Preschool | 0 | 0.0% |
| Kindergarten | 0 | 0.0% |
| Elementary School | 0 | 0.0% |
| Middle School | 0 | 0.0% |
| High School | 0 | 0.0% |
| College / Undergraduate | 0 | 0.0% |
| Graduate / Professional | 0 | 0.0% |
| Total | 0 | 0.0% |
School Enrollment by Age by Funding Source in Dundee
| Age Bracket | Public School | Private School |
| 3 to 4 Year Olds | 0 (0.0%) | 0 (0.0%) |
| 5 to 9 Year Old | 0 (0.0%) | 0 (0.0%) |
| 10 to 14 Year Olds | 0 (0.0%) | 0 (0.0%) |
| 15 to 17 Year Olds | 0 (0.0%) | 0 (0.0%) |
| 18 to 19 Year Olds | 0 (0.0%) | 0 (0.0%) |
| 20 to 24 Year Olds | 0 (0.0%) | 0 (0.0%) |
| 25 to 34 Year Olds | 0 (0.0%) | 0 (0.0%) |
| 35 Years and over | 0 (0.0%) | 0 (0.0%) |
| Total | 0 (0.0%) | 0 (0.0%) |
Educational Attainment by Field of Study in Dundee
| Field of Study | # Graduates | % Graduates |
| Computers & Mathematics | 0 | 0.0% |
| Bio, Nature & Agricultural | 0 | 0.0% |
| Physical & Health Sciences | 0 | 0.0% |
| Psychology | 0 | 0.0% |
| Social Sciences | 0 | 0.0% |
| Engineering | 0 | 0.0% |
| Multidisciplinary Studies | 0 | 0.0% |
| Science & Technology | 0 | 0.0% |
| Business | 0 | 0.0% |
| Education | 0 | 0.0% |
| Literature & Languages | 0 | 0.0% |
| Liberal Arts & History | 0 | 0.0% |
| Visual & Performing Arts | 0 | 0.0% |
| Communications | 0 | 0.0% |
| Arts & Humanities | 0 | 0.0% |
| Total | 0 | 0.0% |
Transportation & Commute in Dundee
Vehicle Availability by Sex in Dundee
The most prevalent vehicle ownership categories in Dundee are males with 2 vehicles (15, accounting for 65.2%) and females with 2 vehicles (220, making up 6.8%).
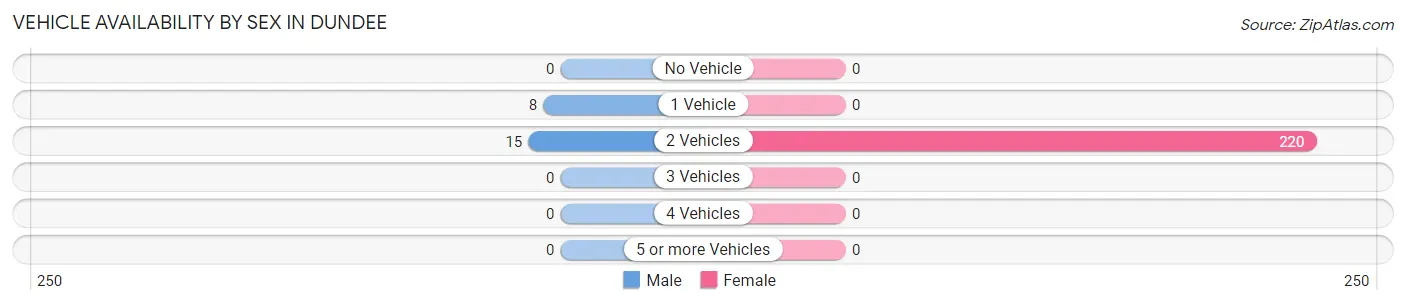
| Vehicles Available | Male | Female |
| No Vehicle | 0 (0.0%) | 0 (0.0%) |
| 1 Vehicle | 8 (34.8%) | 0 (0.0%) |
| 2 Vehicles | 15 (65.2%) | 220 (100.0%) |
| 3 Vehicles | 0 (0.0%) | 0 (0.0%) |
| 4 Vehicles | 0 (0.0%) | 0 (0.0%) |
| 5 or more Vehicles | 0 (0.0%) | 0 (0.0%) |
| Total | 23 (100.0%) | 220 (100.0%) |
Commute Time in Dundee
The most frequently occuring commute durations in Dundee are 15 to 19 minutes (206 commuters, 84.8%), 20 to 24 minutes (37 commuters, 15.2%), and less than 5 minutes (0 commuters, 0.0%).
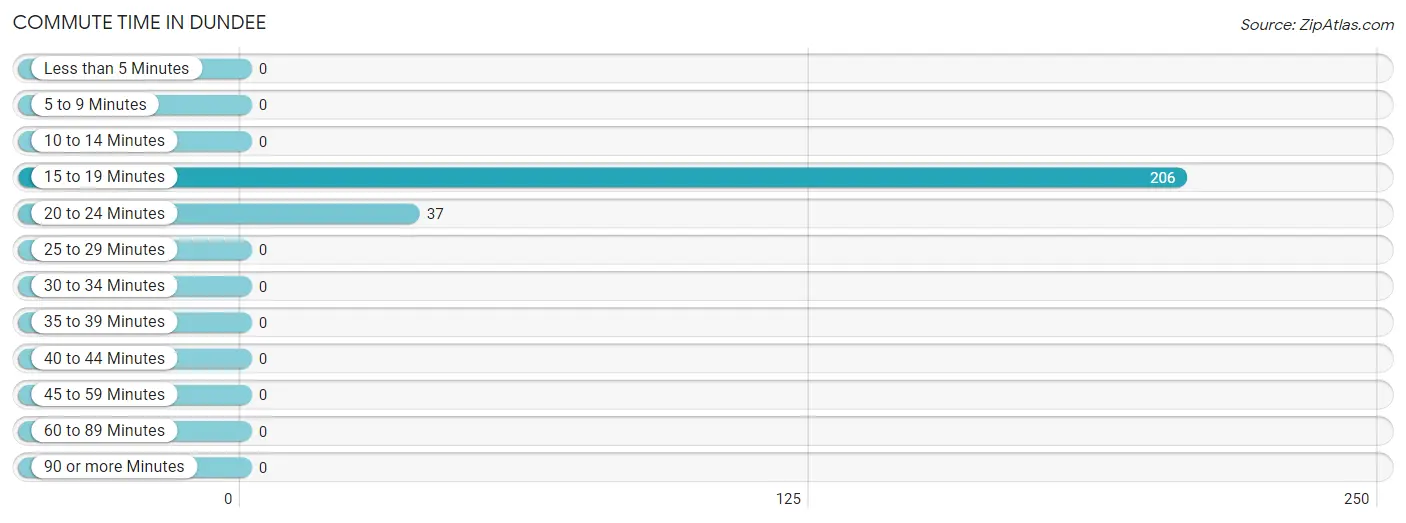
| Commute Time | # Commuters | % Commuters |
| Less than 5 Minutes | 0 | 0.0% |
| 5 to 9 Minutes | 0 | 0.0% |
| 10 to 14 Minutes | 0 | 0.0% |
| 15 to 19 Minutes | 206 | 84.8% |
| 20 to 24 Minutes | 37 | 15.2% |
| 25 to 29 Minutes | 0 | 0.0% |
| 30 to 34 Minutes | 0 | 0.0% |
| 35 to 39 Minutes | 0 | 0.0% |
| 40 to 44 Minutes | 0 | 0.0% |
| 45 to 59 Minutes | 0 | 0.0% |
| 60 to 89 Minutes | 0 | 0.0% |
| 90 or more Minutes | 0 | 0.0% |
Commute Time by Sex in Dundee
The most common commute times in Dundee are 20 to 24 minutes (23 commuters, 100.0%) for males and 15 to 19 minutes (206 commuters, 93.6%) for females.
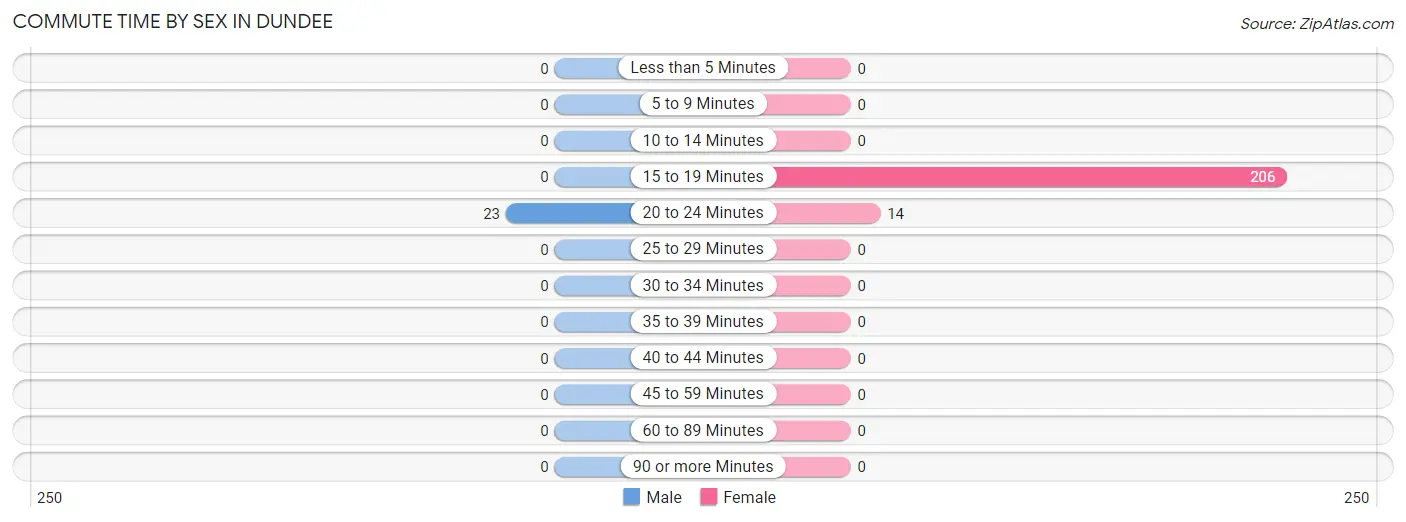
| Commute Time | Male | Female |
| Less than 5 Minutes | 0 (0.0%) | 0 (0.0%) |
| 5 to 9 Minutes | 0 (0.0%) | 0 (0.0%) |
| 10 to 14 Minutes | 0 (0.0%) | 0 (0.0%) |
| 15 to 19 Minutes | 0 (0.0%) | 206 (93.6%) |
| 20 to 24 Minutes | 23 (100.0%) | 14 (6.4%) |
| 25 to 29 Minutes | 0 (0.0%) | 0 (0.0%) |
| 30 to 34 Minutes | 0 (0.0%) | 0 (0.0%) |
| 35 to 39 Minutes | 0 (0.0%) | 0 (0.0%) |
| 40 to 44 Minutes | 0 (0.0%) | 0 (0.0%) |
| 45 to 59 Minutes | 0 (0.0%) | 0 (0.0%) |
| 60 to 89 Minutes | 0 (0.0%) | 0 (0.0%) |
| 90 or more Minutes | 0 (0.0%) | 0 (0.0%) |
Time of Departure to Work by Sex in Dundee
The most frequent times of departure to work in Dundee are 5:30 AM to 5:59 AM (23, 100.0%) for males and 6:30 AM to 6:59 AM (206, 93.6%) for females.
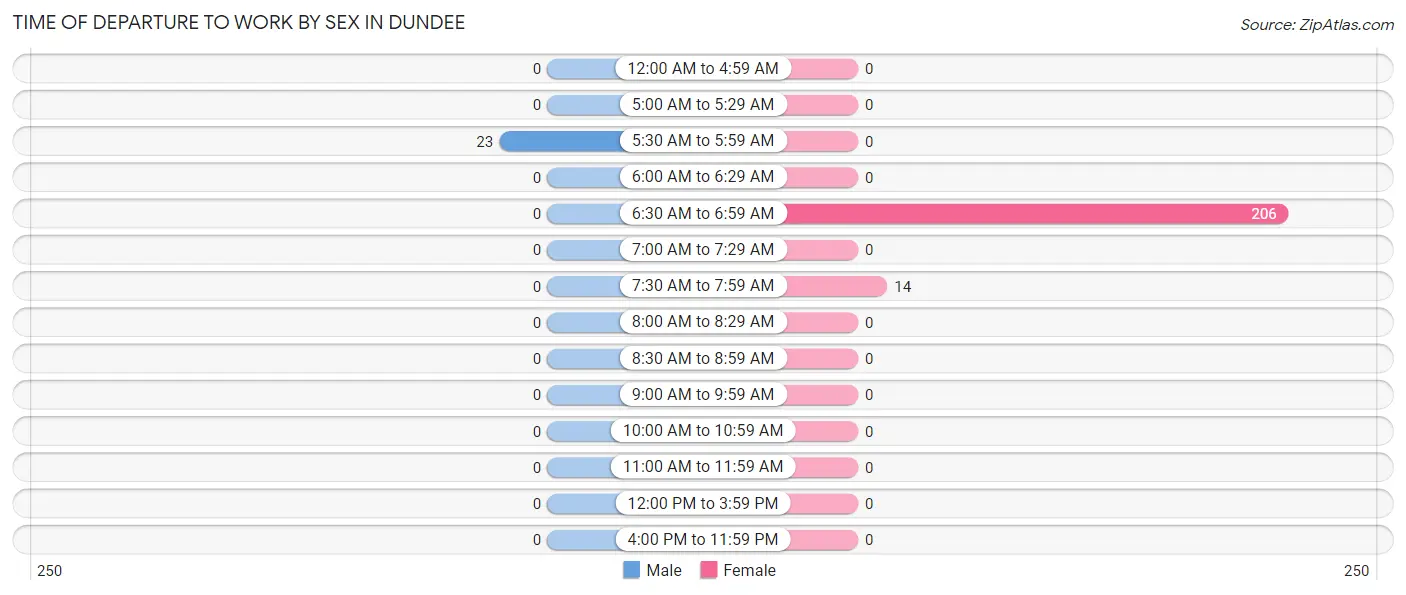
| Time of Departure | Male | Female |
| 12:00 AM to 4:59 AM | 0 (0.0%) | 0 (0.0%) |
| 5:00 AM to 5:29 AM | 0 (0.0%) | 0 (0.0%) |
| 5:30 AM to 5:59 AM | 23 (100.0%) | 0 (0.0%) |
| 6:00 AM to 6:29 AM | 0 (0.0%) | 0 (0.0%) |
| 6:30 AM to 6:59 AM | 0 (0.0%) | 206 (93.6%) |
| 7:00 AM to 7:29 AM | 0 (0.0%) | 0 (0.0%) |
| 7:30 AM to 7:59 AM | 0 (0.0%) | 14 (6.4%) |
| 8:00 AM to 8:29 AM | 0 (0.0%) | 0 (0.0%) |
| 8:30 AM to 8:59 AM | 0 (0.0%) | 0 (0.0%) |
| 9:00 AM to 9:59 AM | 0 (0.0%) | 0 (0.0%) |
| 10:00 AM to 10:59 AM | 0 (0.0%) | 0 (0.0%) |
| 11:00 AM to 11:59 AM | 0 (0.0%) | 0 (0.0%) |
| 12:00 PM to 3:59 PM | 0 (0.0%) | 0 (0.0%) |
| 4:00 PM to 11:59 PM | 0 (0.0%) | 0 (0.0%) |
| Total | 23 (100.0%) | 220 (100.0%) |
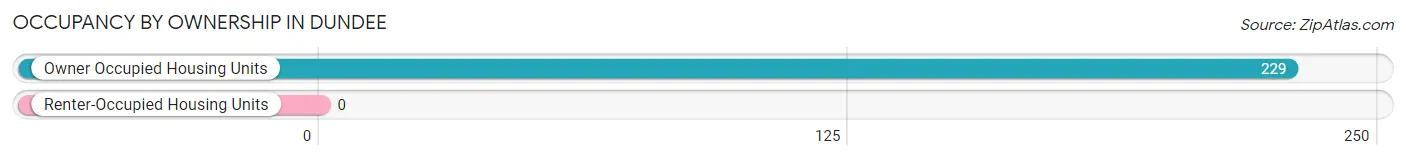
Housing Occupancy in Dundee
Occupancy by Ownership in Dundee
Of the total 229 dwellings in Dundee, owner-occupied units account for 229 (100.0%), while renter-occupied units make up 0 (0.0%).
| Occupancy | # Housing Units | % Housing Units |
| Owner Occupied Housing Units | 229 | 100.0% |
| Renter-Occupied Housing Units | 0 | 0.0% |
| Total Occupied Housing Units | 229 | 100.0% |
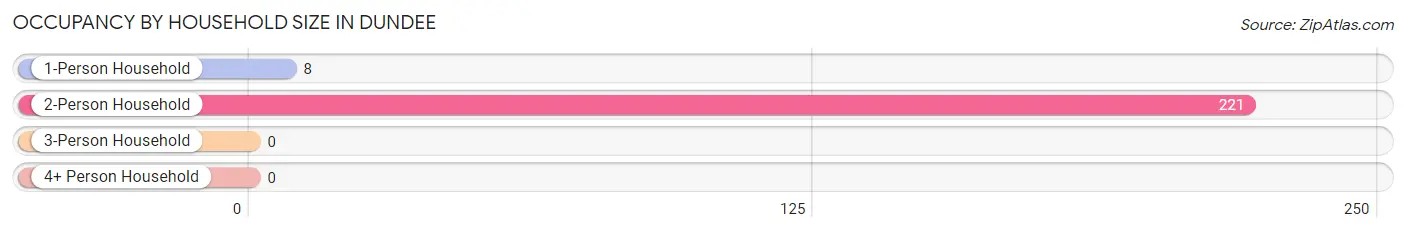
Occupancy by Household Size in Dundee
| Household Size | # Housing Units | % Housing Units |
| 1-Person Household | 8 | 3.5% |
| 2-Person Household | 221 | 96.5% |
| 3-Person Household | 0 | 0.0% |
| 4+ Person Household | 0 | 0.0% |
| Total Housing Units | 229 | 100.0% |
Occupancy by Ownership by Household Size in Dundee
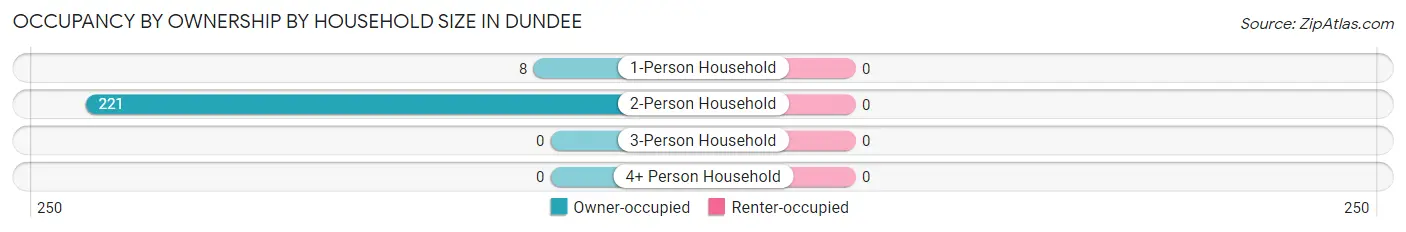
| Household Size | Owner-occupied | Renter-occupied |
| 1-Person Household | 8 (100.0%) | 0 (0.0%) |
| 2-Person Household | 221 (100.0%) | 0 (0.0%) |
| 3-Person Household | 0 (0.0%) | 0 (0.0%) |
| 4+ Person Household | 0 (0.0%) | 0 (0.0%) |
| Total Housing Units | 229 (100.0%) | 0 (0.0%) |
Occupancy by Educational Attainment in Dundee
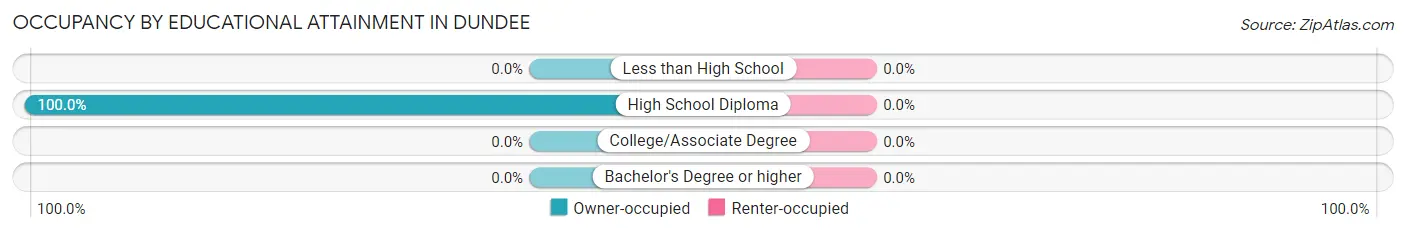
| Household Size | Owner-occupied | Renter-occupied |
| Less than High School | 0 (0.0%) | 0 (0.0%) |
| High School Diploma | 229 (100.0%) | 0 (0.0%) |
| College/Associate Degree | 0 (0.0%) | 0 (0.0%) |
| Bachelor's Degree or higher | 0 (0.0%) | 0 (0.0%) |
Occupancy by Age of Householder in Dundee
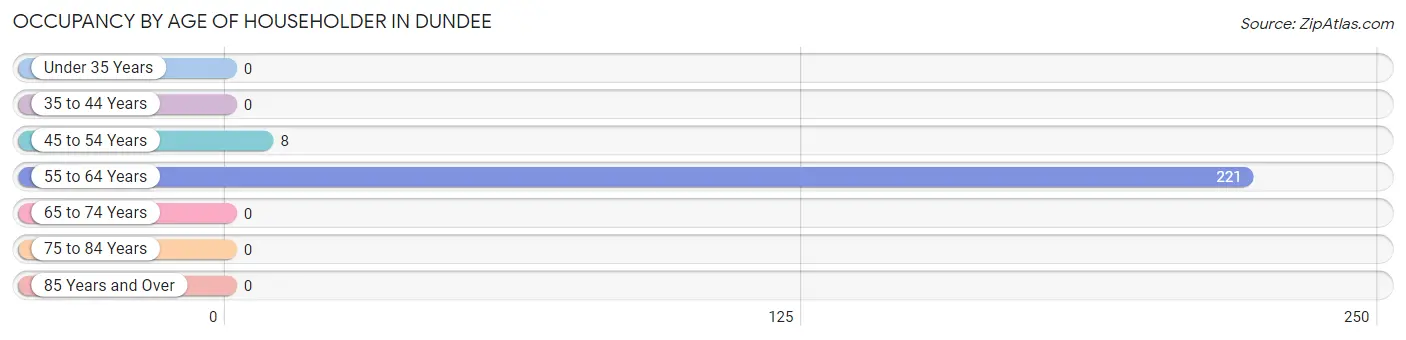
| Age Bracket | # Households | % Households |
| Under 35 Years | 0 | 0.0% |
| 35 to 44 Years | 0 | 0.0% |
| 45 to 54 Years | 8 | 3.5% |
| 55 to 64 Years | 221 | 96.5% |
| 65 to 74 Years | 0 | 0.0% |
| 75 to 84 Years | 0 | 0.0% |
| 85 Years and Over | 0 | 0.0% |
| Total | 229 | 100.0% |
Housing Finances in Dundee
Median Income by Occupancy in Dundee
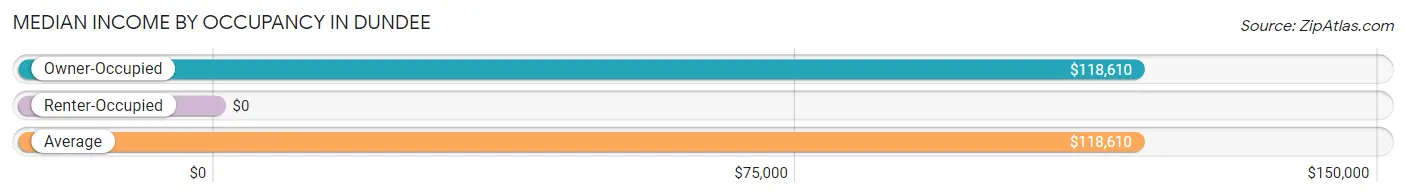
| Occupancy Type | # Households | Median Income |
| Owner-Occupied | 229 (100.0%) | $118,610 |
| Renter-Occupied | 0 (0.0%) | $0 |
| Average | 229 (100.0%) | $118,610 |
Occupancy by Householder Income Bracket in Dundee
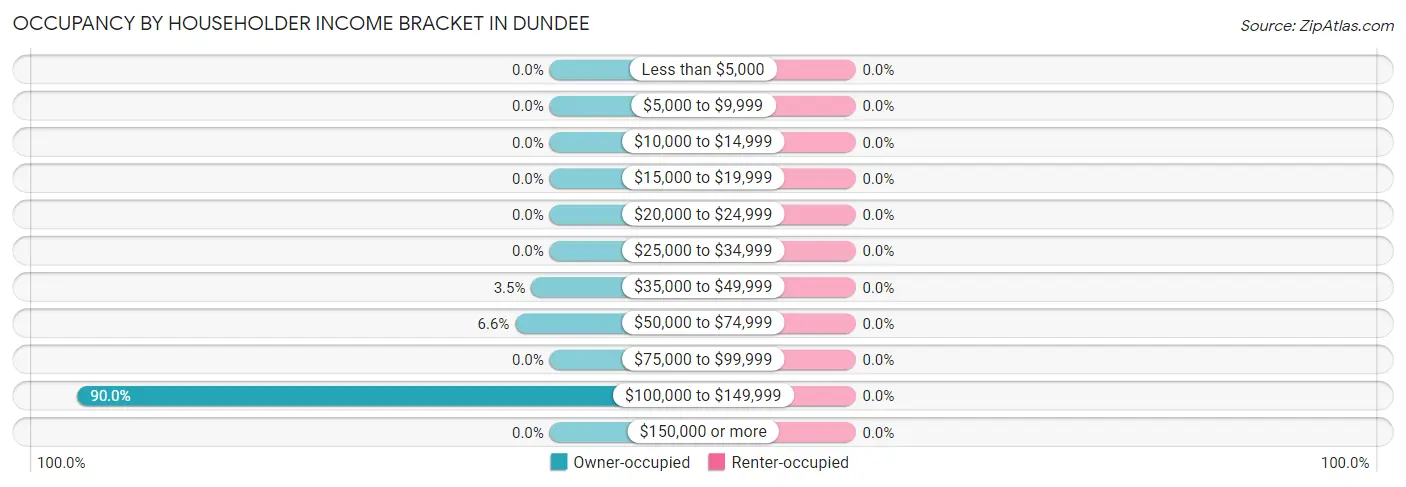
| Income Bracket | Owner-occupied | Renter-occupied |
| Less than $5,000 | 0 (0.0%) | 0 (0.0%) |
| $5,000 to $9,999 | 0 (0.0%) | 0 (0.0%) |
| $10,000 to $14,999 | 0 (0.0%) | 0 (0.0%) |
| $15,000 to $19,999 | 0 (0.0%) | 0 (0.0%) |
| $20,000 to $24,999 | 0 (0.0%) | 0 (0.0%) |
| $25,000 to $34,999 | 0 (0.0%) | 0 (0.0%) |
| $35,000 to $49,999 | 8 (3.5%) | 0 (0.0%) |
| $50,000 to $74,999 | 15 (6.6%) | 0 (0.0%) |
| $75,000 to $99,999 | 0 (0.0%) | 0 (0.0%) |
| $100,000 to $149,999 | 206 (90.0%) | 0 (0.0%) |
| $150,000 or more | 0 (0.0%) | 0 (0.0%) |
| Total | 229 (100.0%) | 0 (0.0%) |
Monthly Housing Cost Tiers in Dundee
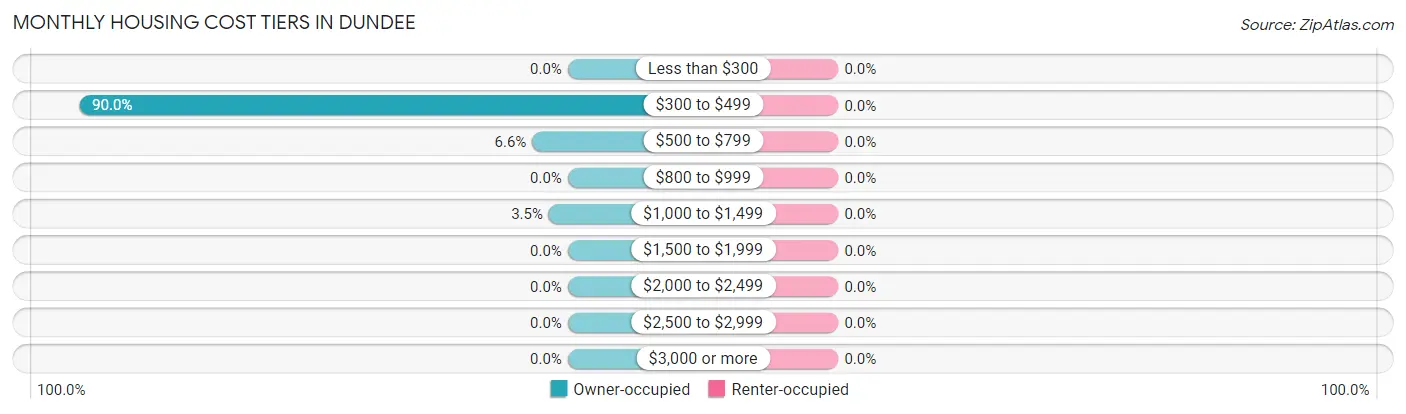
| Monthly Cost | Owner-occupied | Renter-occupied |
| Less than $300 | 0 (0.0%) | 0 (0.0%) |
| $300 to $499 | 206 (90.0%) | 0 (0.0%) |
| $500 to $799 | 15 (6.6%) | 0 (0.0%) |
| $800 to $999 | 0 (0.0%) | 0 (0.0%) |
| $1,000 to $1,499 | 8 (3.5%) | 0 (0.0%) |
| $1,500 to $1,999 | 0 (0.0%) | 0 (0.0%) |
| $2,000 to $2,499 | 0 (0.0%) | 0 (0.0%) |
| $2,500 to $2,999 | 0 (0.0%) | 0 (0.0%) |
| $3,000 or more | 0 (0.0%) | 0 (0.0%) |
| Total | 229 (100.0%) | 0 (0.0%) |
Physical Housing Characteristics in Dundee
Housing Structures in Dundee
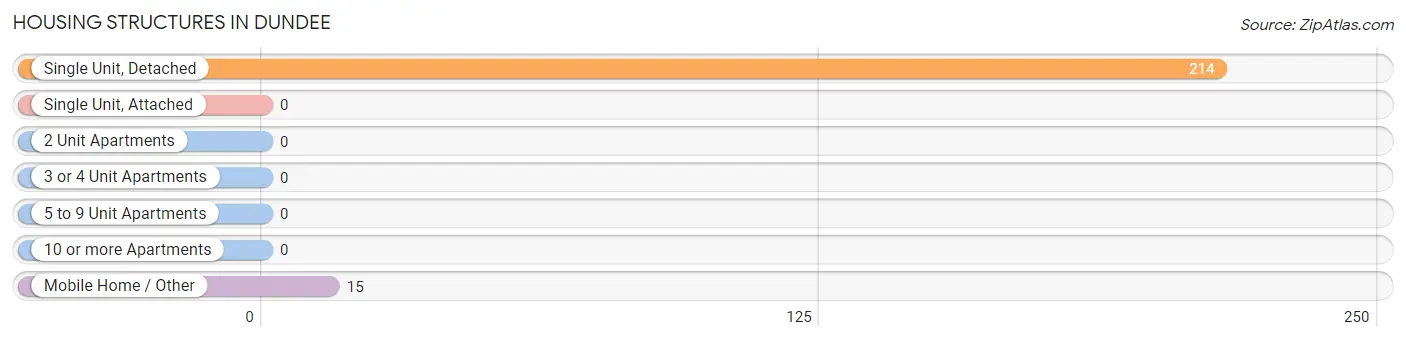
| Structure Type | # Housing Units | % Housing Units |
| Single Unit, Detached | 214 | 93.4% |
| Single Unit, Attached | 0 | 0.0% |
| 2 Unit Apartments | 0 | 0.0% |
| 3 or 4 Unit Apartments | 0 | 0.0% |
| 5 to 9 Unit Apartments | 0 | 0.0% |
| 10 or more Apartments | 0 | 0.0% |
| Mobile Home / Other | 15 | 6.6% |
| Total | 229 | 100.0% |
Housing Structures by Occupancy in Dundee
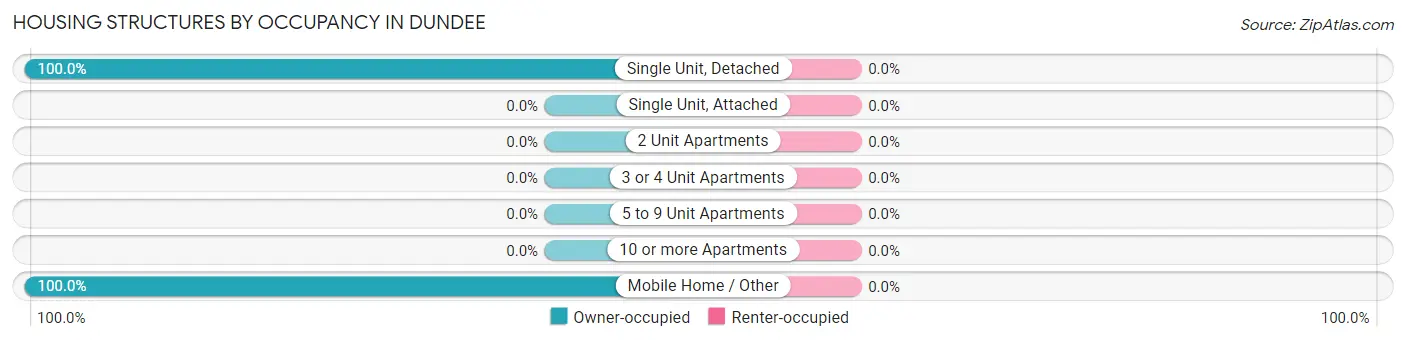
| Structure Type | Owner-occupied | Renter-occupied |
| Single Unit, Detached | 214 (100.0%) | 0 (0.0%) |
| Single Unit, Attached | 0 (0.0%) | 0 (0.0%) |
| 2 Unit Apartments | 0 (0.0%) | 0 (0.0%) |
| 3 or 4 Unit Apartments | 0 (0.0%) | 0 (0.0%) |
| 5 to 9 Unit Apartments | 0 (0.0%) | 0 (0.0%) |
| 10 or more Apartments | 0 (0.0%) | 0 (0.0%) |
| Mobile Home / Other | 15 (100.0%) | 0 (0.0%) |
| Total | 229 (100.0%) | 0 (0.0%) |
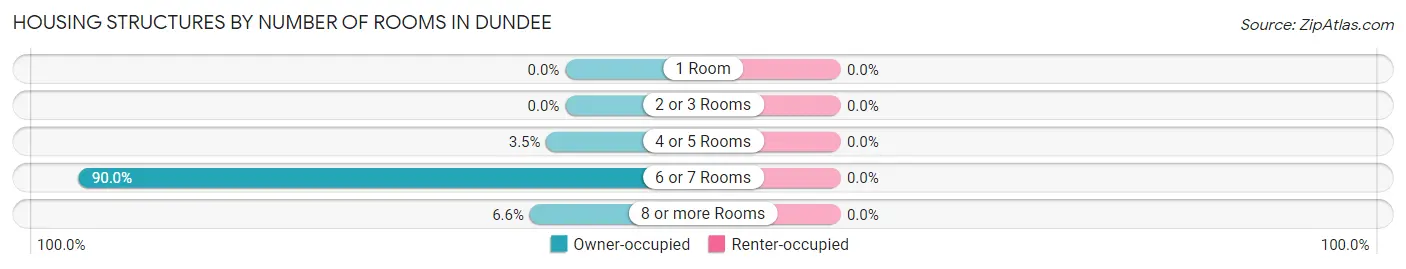
Housing Structures by Number of Rooms in Dundee
| Number of Rooms | Owner-occupied | Renter-occupied |
| 1 Room | 0 (0.0%) | 0 (0.0%) |
| 2 or 3 Rooms | 0 (0.0%) | 0 (0.0%) |
| 4 or 5 Rooms | 8 (3.5%) | 0 (0.0%) |
| 6 or 7 Rooms | 206 (90.0%) | 0 (0.0%) |
| 8 or more Rooms | 15 (6.6%) | 0 (0.0%) |
| Total | 229 (100.0%) | 0 (0.0%) |
Housing Structure by Heating Type in Dundee
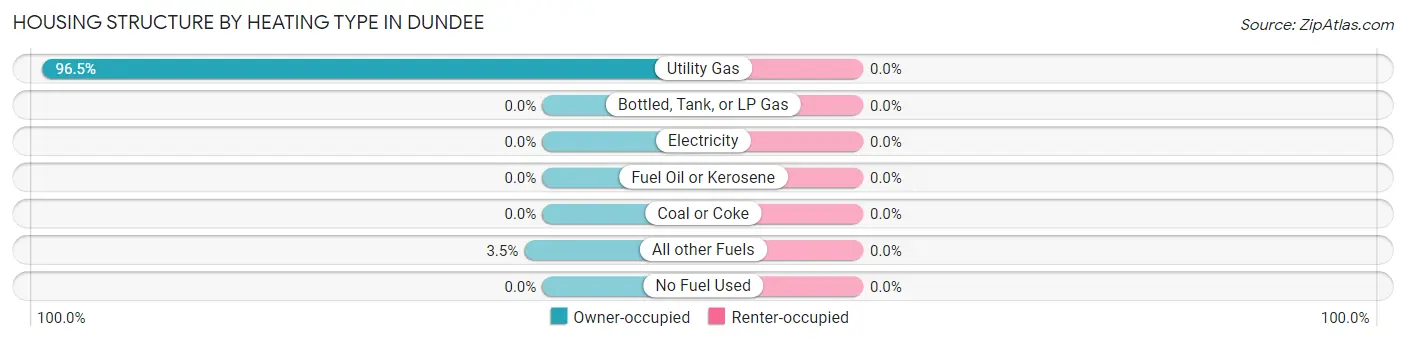
| Heating Type | Owner-occupied | Renter-occupied |
| Utility Gas | 221 (96.5%) | 0 (0.0%) |
| Bottled, Tank, or LP Gas | 0 (0.0%) | 0 (0.0%) |
| Electricity | 0 (0.0%) | 0 (0.0%) |
| Fuel Oil or Kerosene | 0 (0.0%) | 0 (0.0%) |
| Coal or Coke | 0 (0.0%) | 0 (0.0%) |
| All other Fuels | 8 (3.5%) | 0 (0.0%) |
| No Fuel Used | 0 (0.0%) | 0 (0.0%) |
| Total | 229 (100.0%) | 0 (0.0%) |
Household Vehicle Usage in Dundee
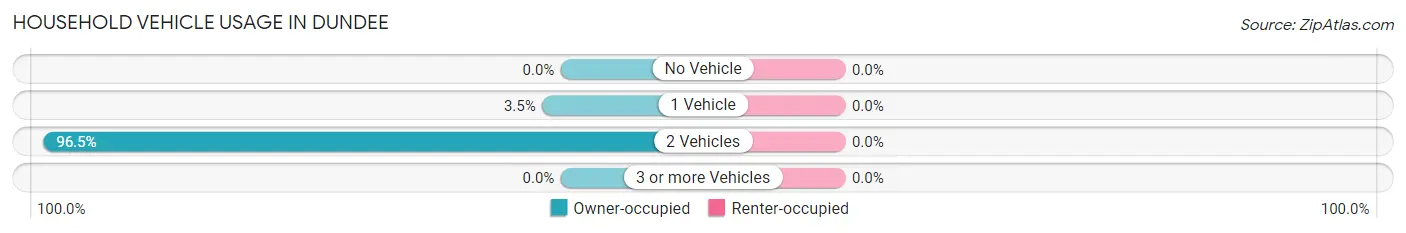
| Vehicles per Household | Owner-occupied | Renter-occupied |
| No Vehicle | 0 (0.0%) | 0 (0.0%) |
| 1 Vehicle | 8 (3.5%) | 0 (0.0%) |
| 2 Vehicles | 221 (96.5%) | 0 (0.0%) |
| 3 or more Vehicles | 0 (0.0%) | 0 (0.0%) |
| Total | 229 (100.0%) | 0 (0.0%) |
Real Estate & Mortgages in Dundee
Real Estate and Mortgage Overview in Dundee
| Characteristic | Without Mortgage | With Mortgage |
| Housing Units | 221 | 8 |
| Median Property Value | - | - |
| Median Household Income | - | - |
| Monthly Housing Costs | - | - |
| Real Estate Taxes | - | - |
Property Value by Mortgage Status in Dundee
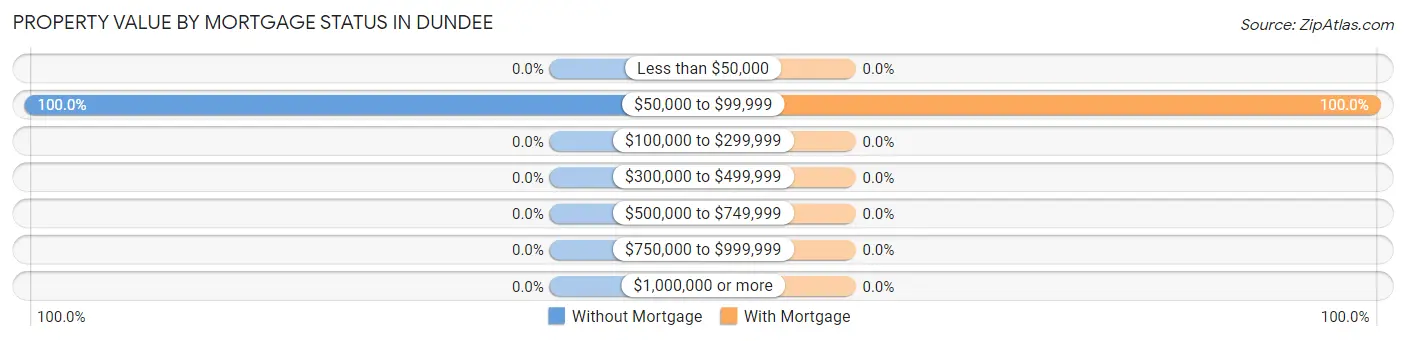
| Property Value | Without Mortgage | With Mortgage |
| Less than $50,000 | 0 (0.0%) | 0 (0.0%) |
| $50,000 to $99,999 | 221 (100.0%) | 8 (100.0%) |
| $100,000 to $299,999 | 0 (0.0%) | 0 (0.0%) |
| $300,000 to $499,999 | 0 (0.0%) | 0 (0.0%) |
| $500,000 to $749,999 | 0 (0.0%) | 0 (0.0%) |
| $750,000 to $999,999 | 0 (0.0%) | 0 (0.0%) |
| $1,000,000 or more | 0 (0.0%) | 0 (0.0%) |
| Total | 221 (100.0%) | 8 (100.0%) |
Household Income by Mortgage Status in Dundee
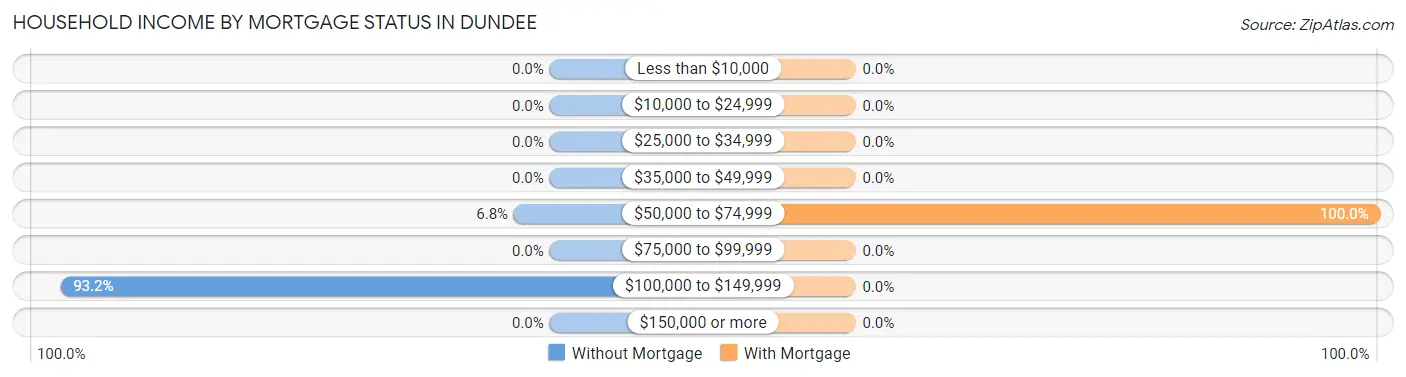
| Household Income | Without Mortgage | With Mortgage |
| Less than $10,000 | 0 (0.0%) | 0 (0.0%) |
| $10,000 to $24,999 | 0 (0.0%) | 0 (0.0%) |
| $25,000 to $34,999 | 0 (0.0%) | 0 (0.0%) |
| $35,000 to $49,999 | 0 (0.0%) | 0 (0.0%) |
| $50,000 to $74,999 | 15 (6.8%) | 8 (100.0%) |
| $75,000 to $99,999 | 0 (0.0%) | 0 (0.0%) |
| $100,000 to $149,999 | 206 (93.2%) | 0 (0.0%) |
| $150,000 or more | 0 (0.0%) | 0 (0.0%) |
| Total | 221 (100.0%) | 8 (100.0%) |
Property Value to Household Income Ratio in Dundee
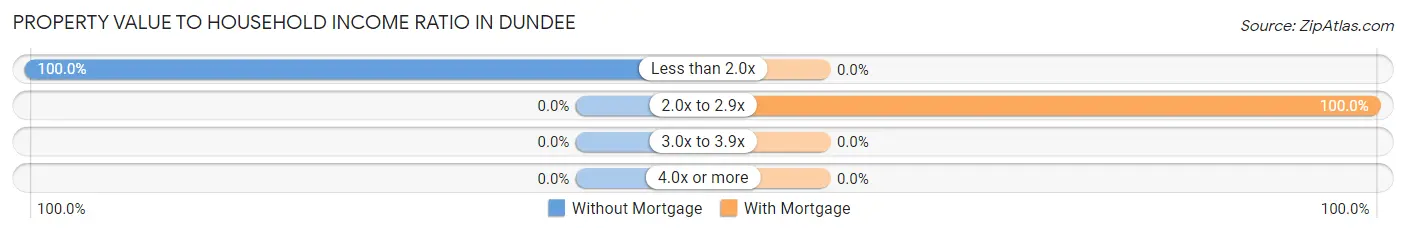
| Value-to-Income Ratio | Without Mortgage | With Mortgage |
| Less than 2.0x | 221 (100.0%) | 0 (0.0%) |
| 2.0x to 2.9x | 0 (0.0%) | 8 (100.0%) |
| 3.0x to 3.9x | 0 (0.0%) | 0 (0.0%) |
| 4.0x or more | 0 (0.0%) | 0 (0.0%) |
| Total | 221 (100.0%) | 8 (100.0%) |
Real Estate Taxes by Mortgage Status in Dundee
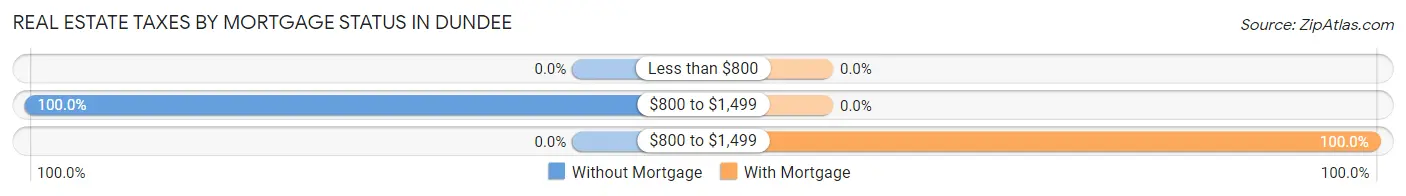
| Property Taxes | Without Mortgage | With Mortgage |
| Less than $800 | 0 (0.0%) | 0 (0.0%) |
| $800 to $1,499 | 221 (100.0%) | 0 (0.0%) |
| $800 to $1,499 | 0 (0.0%) | 8 (100.0%) |
| Total | 221 (100.0%) | 8 (100.0%) |
Health & Disability in Dundee
Health Insurance Coverage by Age in Dundee
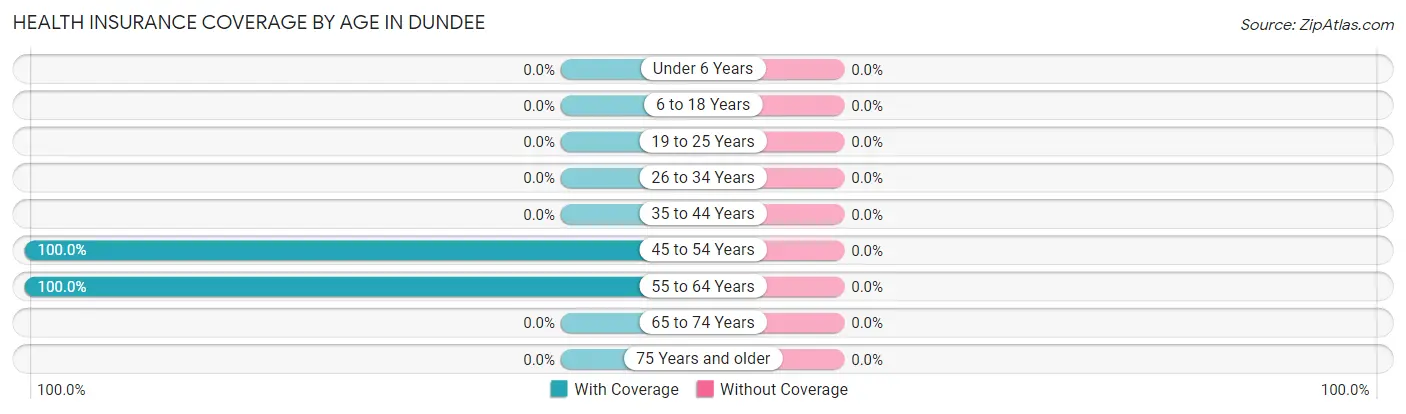
| Age Bracket | With Coverage | Without Coverage |
| Under 6 Years | 0 (0.0%) | 0 (0.0%) |
| 6 to 18 Years | 0 (0.0%) | 0 (0.0%) |
| 19 to 25 Years | 0 (0.0%) | 0 (0.0%) |
| 26 to 34 Years | 0 (0.0%) | 0 (0.0%) |
| 35 to 44 Years | 0 (0.0%) | 0 (0.0%) |
| 45 to 54 Years | 8 (100.0%) | 0 (0.0%) |
| 55 to 64 Years | 406 (100.0%) | 0 (0.0%) |
| 65 to 74 Years | 0 (0.0%) | 0 (0.0%) |
| 75 Years and older | 0 (0.0%) | 0 (0.0%) |
| Total | 414 (100.0%) | 0 (0.0%) |
Health Insurance Coverage by Citizenship Status in Dundee
| Citizenship Status | With Coverage | Without Coverage |
| Native Born | 0 (0.0%) | 0 (0.0%) |
| Foreign Born, Citizen | 0 (0.0%) | 0 (0.0%) |
| Foreign Born, not a Citizen | 0 (0.0%) | 0 (0.0%) |
Health Insurance Coverage by Household Income in Dundee
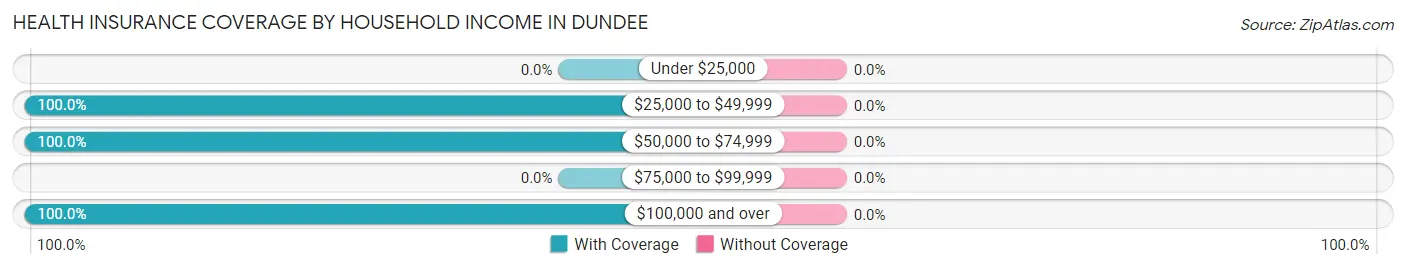
| Household Income | With Coverage | Without Coverage |
| Under $25,000 | 0 (0.0%) | 0 (0.0%) |
| $25,000 to $49,999 | 8 (100.0%) | 0 (0.0%) |
| $50,000 to $74,999 | 29 (100.0%) | 0 (0.0%) |
| $75,000 to $99,999 | 0 (0.0%) | 0 (0.0%) |
| $100,000 and over | 377 (100.0%) | 0 (0.0%) |
Public vs Private Health Insurance Coverage by Age in Dundee
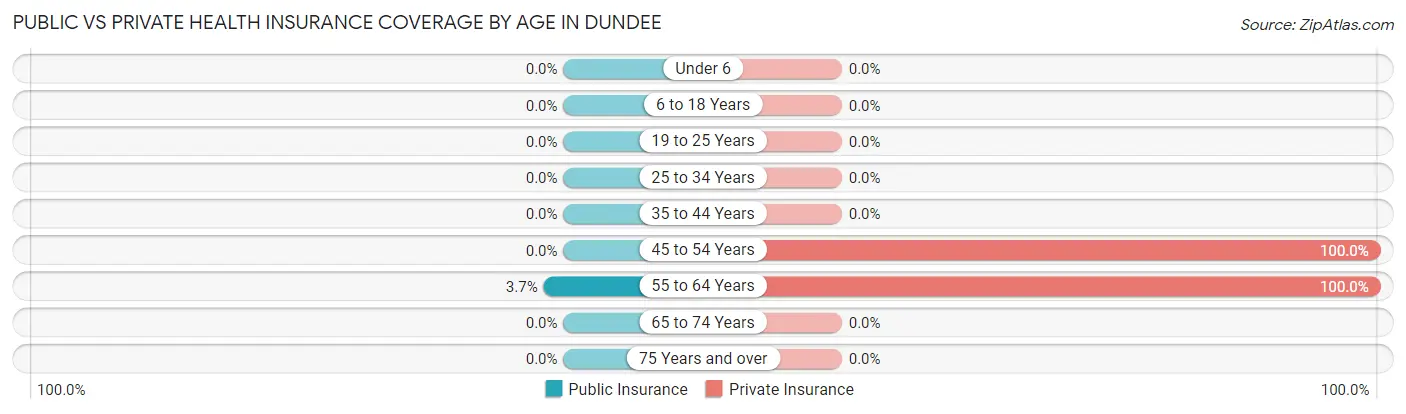
| Age Bracket | Public Insurance | Private Insurance |
| Under 6 | 0 (0.0%) | 0 (0.0%) |
| 6 to 18 Years | 0 (0.0%) | 0 (0.0%) |
| 19 to 25 Years | 0 (0.0%) | 0 (0.0%) |
| 25 to 34 Years | 0 (0.0%) | 0 (0.0%) |
| 35 to 44 Years | 0 (0.0%) | 0 (0.0%) |
| 45 to 54 Years | 0 (0.0%) | 8 (100.0%) |
| 55 to 64 Years | 15 (3.7%) | 406 (100.0%) |
| 65 to 74 Years | 0 (0.0%) | 0 (0.0%) |
| 75 Years and over | 0 (0.0%) | 0 (0.0%) |
| Total | 15 (3.6%) | 414 (100.0%) |
Disability Status by Sex by Age in Dundee
| Age Bracket | Male | Female |
| Under 5 Years | 0 (0.0%) | 0 (0.0%) |
| 5 to 17 Years | 0 (0.0%) | 0 (0.0%) |
| 18 to 34 Years | 0 (0.0%) | 0 (0.0%) |
| 35 to 64 Years | 0 (0.0%) | 0 (0.0%) |
| 65 to 74 Years | 0 (0.0%) | 0 (0.0%) |
| 75 Years and over | 0 (0.0%) | 0 (0.0%) |
Disability Class by Sex by Age in Dundee
Disability Class: Hearing Difficulty
| Age Bracket | Male | Female |
| Under 5 Years | 0 (0.0%) | 0 (0.0%) |
| 5 to 17 Years | 0 (0.0%) | 0 (0.0%) |
| 18 to 34 Years | 0 (0.0%) | 0 (0.0%) |
| 35 to 64 Years | 0 (0.0%) | 0 (0.0%) |
| 65 to 74 Years | 0 (0.0%) | 0 (0.0%) |
| 75 Years and over | 0 (0.0%) | 0 (0.0%) |
Disability Class: Vision Difficulty
| Age Bracket | Male | Female |
| Under 5 Years | 0 (0.0%) | 0 (0.0%) |
| 5 to 17 Years | 0 (0.0%) | 0 (0.0%) |
| 18 to 34 Years | 0 (0.0%) | 0 (0.0%) |
| 35 to 64 Years | 0 (0.0%) | 0 (0.0%) |
| 65 to 74 Years | 0 (0.0%) | 0 (0.0%) |
| 75 Years and over | 0 (0.0%) | 0 (0.0%) |
Disability Class: Cognitive Difficulty
| Age Bracket | Male | Female |
| 5 to 17 Years | 0 (0.0%) | 0 (0.0%) |
| 18 to 34 Years | 0 (0.0%) | 0 (0.0%) |
| 35 to 64 Years | 0 (0.0%) | 0 (0.0%) |
| 65 to 74 Years | 0 (0.0%) | 0 (0.0%) |
| 75 Years and over | 0 (0.0%) | 0 (0.0%) |
Disability Class: Ambulatory Difficulty
| Age Bracket | Male | Female |
| 5 to 17 Years | 0 (0.0%) | 0 (0.0%) |
| 18 to 34 Years | 0 (0.0%) | 0 (0.0%) |
| 35 to 64 Years | 0 (0.0%) | 0 (0.0%) |
| 65 to 74 Years | 0 (0.0%) | 0 (0.0%) |
| 75 Years and over | 0 (0.0%) | 0 (0.0%) |
Disability Class: Self-Care Difficulty
| Age Bracket | Male | Female |
| 5 to 17 Years | 0 (0.0%) | 0 (0.0%) |
| 18 to 34 Years | 0 (0.0%) | 0 (0.0%) |
| 35 to 64 Years | 0 (0.0%) | 0 (0.0%) |
| 65 to 74 Years | 0 (0.0%) | 0 (0.0%) |
| 75 Years and over | 0 (0.0%) | 0 (0.0%) |
Technology Access in Dundee
Computing Device Access in Dundee
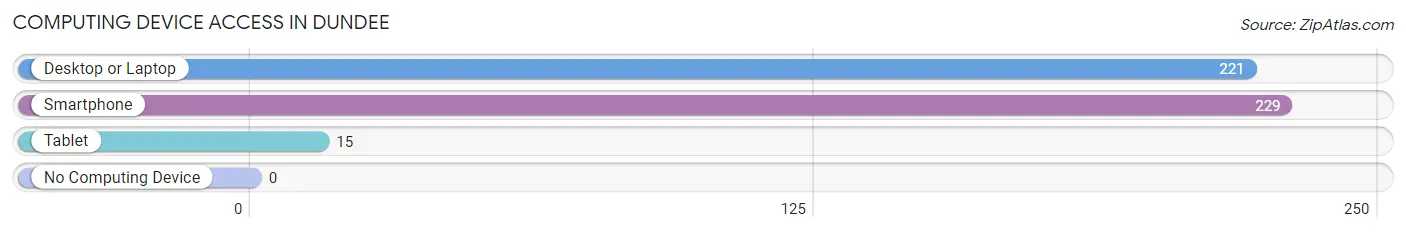
| Device Type | # Households | % Households |
| Desktop or Laptop | 221 | 96.5% |
| Smartphone | 229 | 100.0% |
| Tablet | 15 | 6.6% |
| No Computing Device | 0 | 0.0% |
| Total | 229 | 100.0% |
Internet Access in Dundee
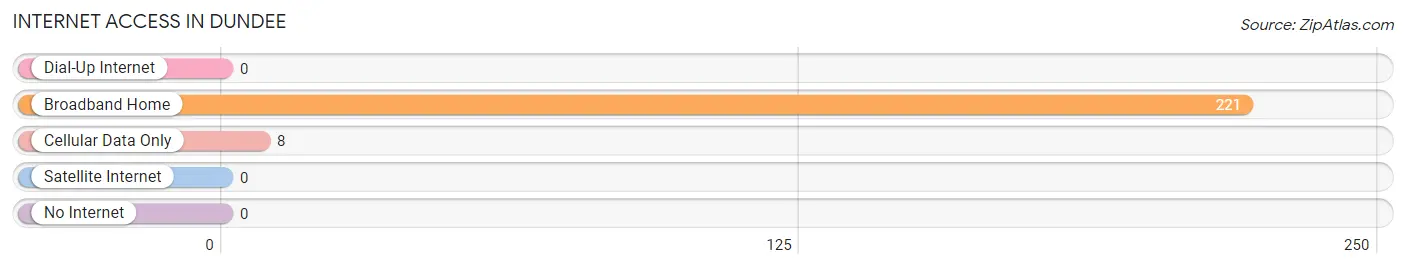
| Internet Type | # Households | % Households |
| Dial-Up Internet | 0 | 0.0% |
| Broadband Home | 221 | 96.5% |
| Cellular Data Only | 8 | 3.5% |
| Satellite Internet | 0 | 0.0% |
| No Internet | 0 | 0.0% |
| Total | 229 | 100.0% |
Dundee Summary
Dundee, Ohio is a small village located in the northwest corner of Tuscarawas County, Ohio. It is situated on the banks of the Tuscarawas River, and is part of the larger New Philadelphia-Dover metropolitan area. The village has a population of approximately 1,000 people, and is home to a variety of businesses, including a grocery store, a hardware store, a bank, and a post office.
History
Dundee was founded in 1817 by a group of settlers from Pennsylvania. The village was named after the Scottish city of Dundee, and was originally known as “Dundee Settlement.” The first settlers were primarily of German and Swiss descent, and the village was largely agricultural in nature. The village was incorporated in 1837, and the first post office was established in 1845.
In the late 19th century, the village began to grow and develop. The railroad arrived in 1881, and the village was connected to the larger cities of New Philadelphia and Dover. This allowed for the growth of industry and commerce in the area, and the village began to expand. By the early 20th century, Dundee had become a thriving community, with a variety of businesses and services.
Geography
Dundee is located in the northwest corner of Tuscarawas County, Ohio. It is situated on the banks of the Tuscarawas River, and is part of the larger New Philadelphia-Dover metropolitan area. The village is located approximately 25 miles south of Canton, Ohio, and is approximately 50 miles east of Akron, Ohio.
The village is situated on a flat plain, and is surrounded by rolling hills and farmland. The climate is generally mild, with hot summers and cold winters. The average annual temperature is approximately 50 degrees Fahrenheit.
Economy
Dundee’s economy is largely based on agriculture and small businesses. The village is home to a variety of businesses, including a grocery store, a hardware store, a bank, and a post office. The village also has a number of small manufacturing businesses, including a furniture factory and a metal fabrication plant.
The village is also home to a number of tourist attractions, including the historic Dundee Canal, the historic Dundee Cemetery, and the historic Dundee Church. The village is also home to a number of festivals and events, including the annual Dundee Days Festival and the annual Dundee Harvest Festival.
Demographics
As of the 2010 census, the population of Dundee was 1,000 people. The racial makeup of the village was 97.2% White, 0.7% African American, 0.2% Native American, 0.2% Asian, 0.2% from other races, and 1.7% from two or more races. Hispanic or Latino of any race were 0.7% of the population.
The median income for a household in the village was $37,500, and the median income for a family was $45,000. The per capita income for the village was $18,000. About 8.3% of families and 10.2% of the population were below the poverty line, including 13.3% of those under age 18 and 8.3% of those age 65 or over.
Common Questions
What is Per Capita Income in Dundee?
Per Capita income in Dundee is $59,830.
What is the Median Household income in Dundee?
Median Household Income in Dundee is $118,610.
What is Inequality or Gini Index in Dundee?
Inequality or Gini Index in Dundee is 0.05.
What is the Total Population of Dundee?
Total Population of Dundee is 414.
What is the Total Male Population of Dundee?
Total Male Population of Dundee is 194.
What is the Total Female Population of Dundee?
Total Female Population of Dundee is 220.
What is the Ratio of Males per 100 Females in Dundee?
There are 88.18 Males per 100 Females in Dundee.
What is the Ratio of Females per 100 Males in Dundee?
There are 113.40 Females per 100 Males in Dundee.
What is the Median Population Age in Dundee?
Median Population Age in Dundee is 57.9 Years.
What is the Average Family Size in Dundee
Average Family Size in Dundee is 1.8 People.
What is the Average Household Size in Dundee
Average Household Size in Dundee is 1.8 People.
How Large is the Labor Force in Dundee?
There are 414 People in the Labor Forcein in Dundee.
What is the Percentage of People in the Labor Force in Dundee?
100.0% of People are in the Labor Force in Dundee.
What is the Unemployment Rate in Dundee?
Unemployment Rate in Dundee is 41.3%.