Matamoras, OH Map & Demographics
Matamoras Map
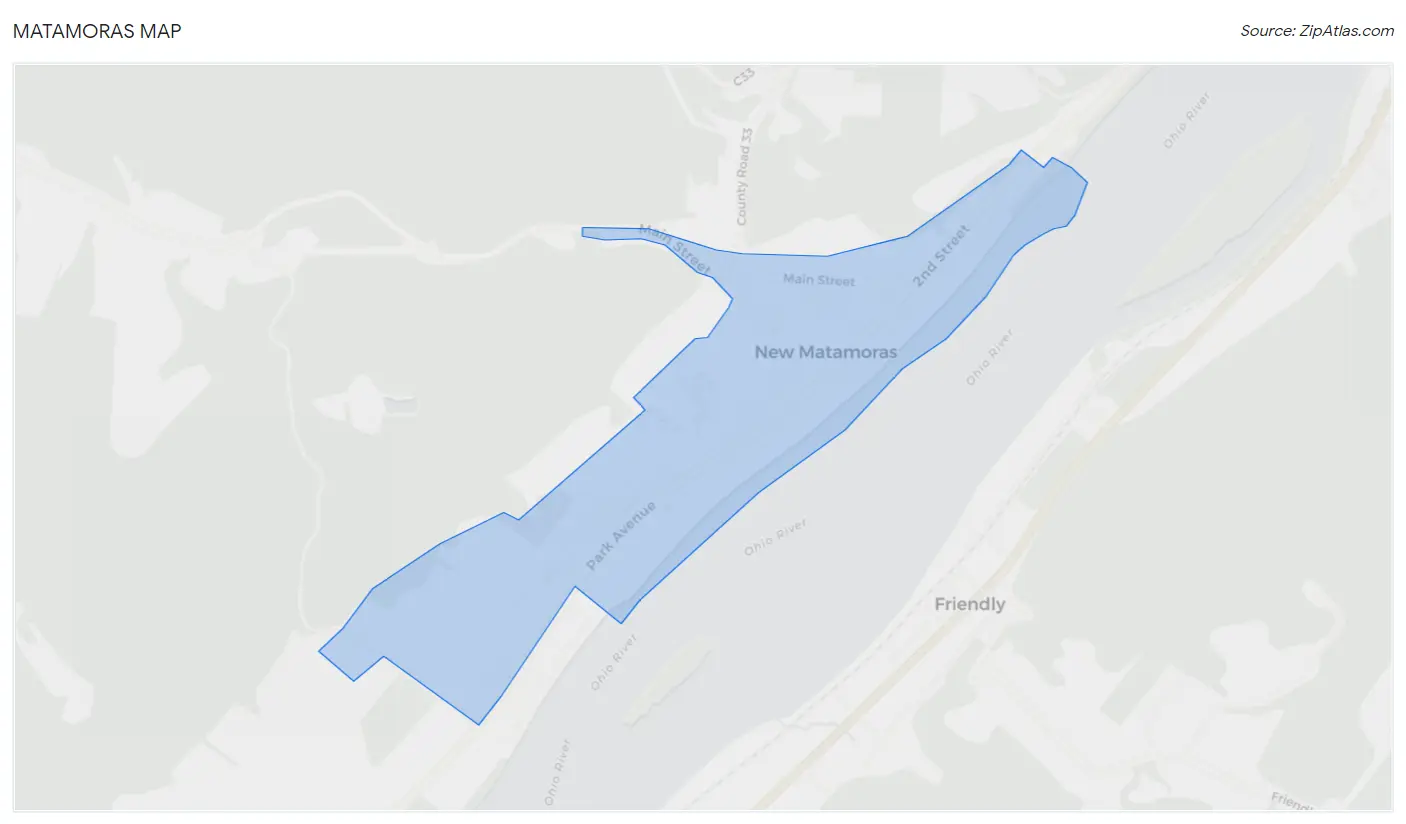
Matamoras Overview
$17,058
PER CAPITA INCOME
$21,125
AVG HOUSEHOLD INCOME
23.1%
WAGE / INCOME GAP [ % ]
76.9¢/ $1
WAGE / INCOME GAP [ $ ]
$18,082
FAMILY INCOME DEFICIT
0.54
INEQUALITY / GINI INDEX
1,154
TOTAL POPULATION
536
MALE POPULATION
618
FEMALE POPULATION
86.73
MALES / 100 FEMALES
115.30
FEMALES / 100 MALES
31.1
MEDIAN AGE
3.9
AVG FAMILY SIZE
2.5
AVG HOUSEHOLD SIZE
334
LABOR FORCE [ PEOPLE ]
45.0%
PERCENT IN LABOR FORCE
17.1%
UNEMPLOYMENT RATE
Matamoras Area Codes
Income in Matamoras
Income Overview in Matamoras
| Characteristic | Number | Measure |
| Per Capita Income | 1,154 | $17,058 |
| Median Family Income | 231 | $0 |
| Mean Family Income | 231 | $53,132 |
| Median Household Income | 453 | $21,125 |
| Mean Household Income | 453 | $42,057 |
| Income Deficit | 231 | $18,082 |
| Wage / Income Gap (%) | 1,154 | 23.05% |
| Wage / Income Gap ($) | 1,154 | 76.95¢ per $1 |
| Gini / Inequality Index | 1,154 | 0.54 |
Earnings by Sex in Matamoras
Average Earnings in Matamoras are $38,125, $43,050 for men and $33,125 for women, a difference of 23.1%.
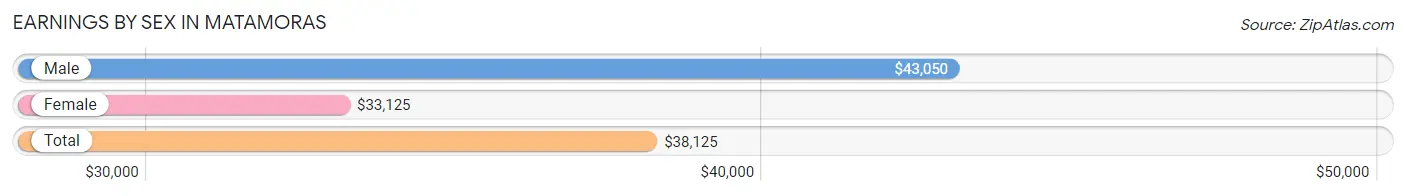
| Sex | Number | Average Earnings |
| Male | 199 (57.7%) | $43,050 |
| Female | 146 (42.3%) | $33,125 |
| Total | 345 (100.0%) | $38,125 |
Earnings by Sex by Income Bracket in Matamoras
The most common earnings brackets in Matamoras are $12,500 to $14,999 for men (51 | 25.6%) and $40,000 to $44,999 for women (28 | 19.2%).
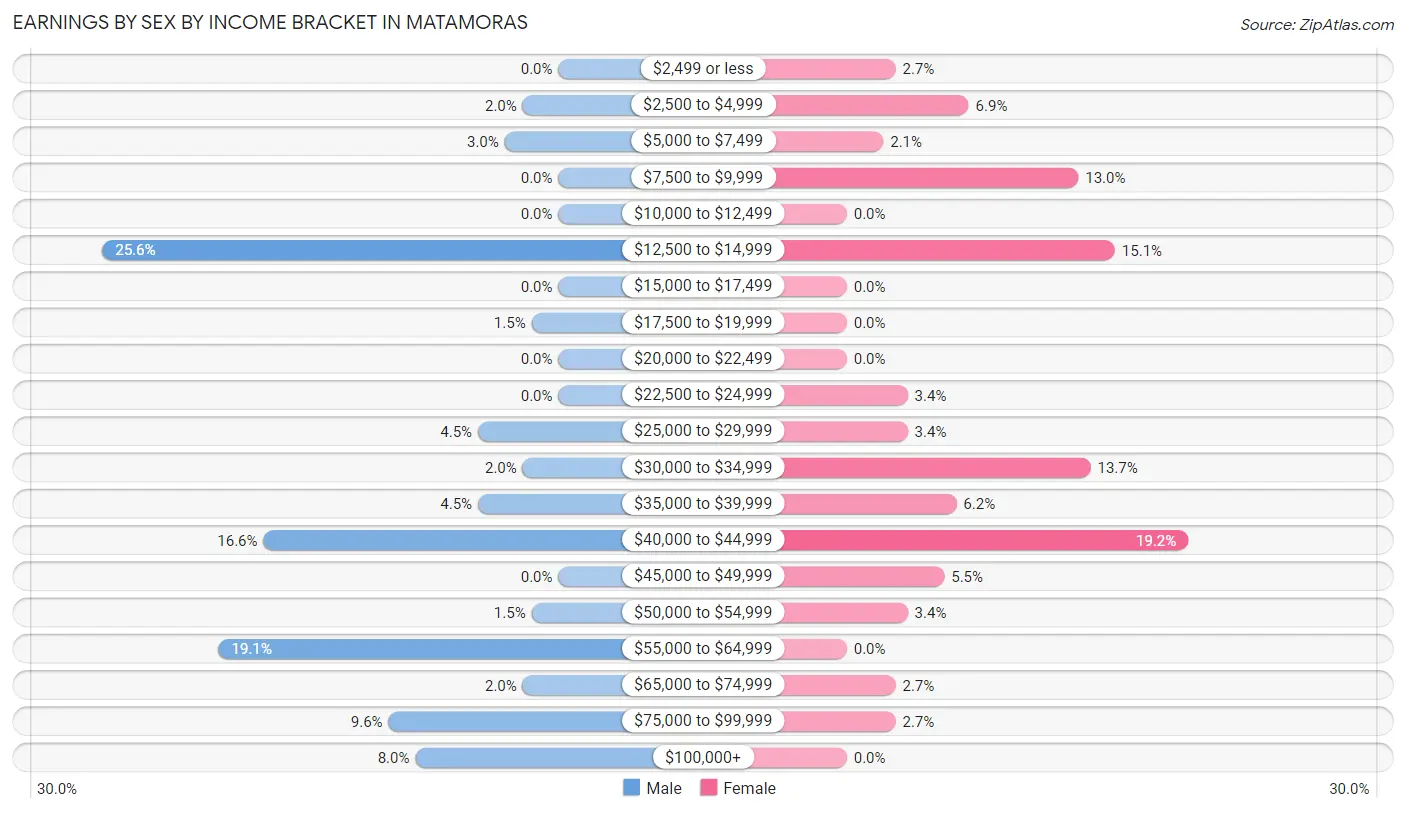
| Income | Male | Female |
| $2,499 or less | 0 (0.0%) | 4 (2.7%) |
| $2,500 to $4,999 | 4 (2.0%) | 10 (6.9%) |
| $5,000 to $7,499 | 6 (3.0%) | 3 (2.1%) |
| $7,500 to $9,999 | 0 (0.0%) | 19 (13.0%) |
| $10,000 to $12,499 | 0 (0.0%) | 0 (0.0%) |
| $12,500 to $14,999 | 51 (25.6%) | 22 (15.1%) |
| $15,000 to $17,499 | 0 (0.0%) | 0 (0.0%) |
| $17,500 to $19,999 | 3 (1.5%) | 0 (0.0%) |
| $20,000 to $22,499 | 0 (0.0%) | 0 (0.0%) |
| $22,500 to $24,999 | 0 (0.0%) | 5 (3.4%) |
| $25,000 to $29,999 | 9 (4.5%) | 5 (3.4%) |
| $30,000 to $34,999 | 4 (2.0%) | 20 (13.7%) |
| $35,000 to $39,999 | 9 (4.5%) | 9 (6.2%) |
| $40,000 to $44,999 | 33 (16.6%) | 28 (19.2%) |
| $45,000 to $49,999 | 0 (0.0%) | 8 (5.5%) |
| $50,000 to $54,999 | 3 (1.5%) | 5 (3.4%) |
| $55,000 to $64,999 | 38 (19.1%) | 0 (0.0%) |
| $65,000 to $74,999 | 4 (2.0%) | 4 (2.7%) |
| $75,000 to $99,999 | 19 (9.6%) | 4 (2.7%) |
| $100,000+ | 16 (8.0%) | 0 (0.0%) |
| Total | 199 (100.0%) | 146 (100.0%) |
Earnings by Sex by Educational Attainment in Matamoras
Average earnings in Matamoras are $42,750 for men and $34,563 for women, a difference of 19.2%. Men with an educational attainment of college or associate's degree enjoy the highest average annual earnings of $43,523, while those with college or associate's degree education earn the least with $43,523. Women with an educational attainment of high school diploma earn the most with the average annual earnings of $44,583, while those with college or associate's degree education have the smallest earnings of $34,297.
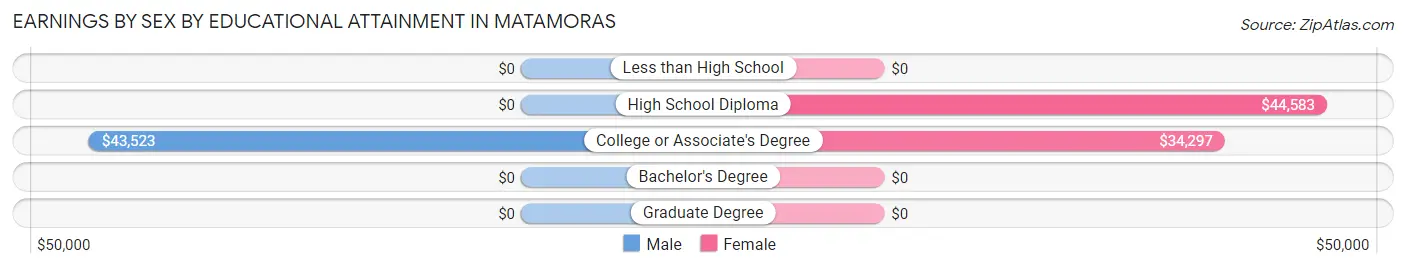
| Educational Attainment | Male Income | Female Income |
| Less than High School | - | - |
| High School Diploma | - | - |
| College or Associate's Degree | $43,523 | $34,297 |
| Bachelor's Degree | - | - |
| Graduate Degree | - | - |
| Total | $42,750 | $34,563 |
Family Income in Matamoras
Family Income Brackets in Matamoras
According to the Matamoras family income data, there are 75 families falling into the $10,000 to $14,999 income range, which is the most common income bracket and makes up 32.5% of all families.
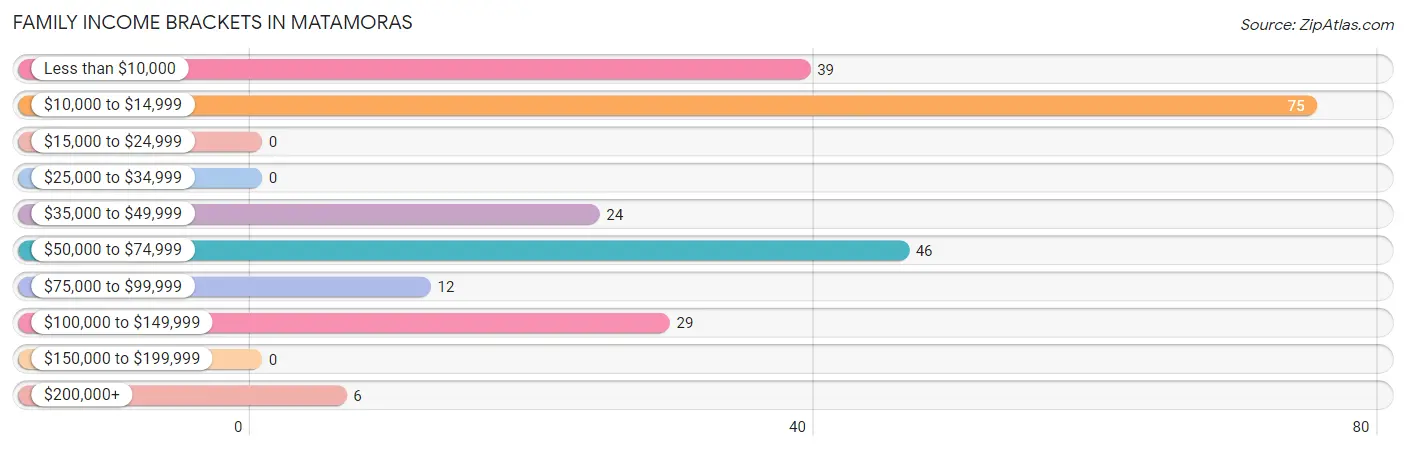
| Income Bracket | # Families | % Families |
| Less than $10,000 | 39 | 16.9% |
| $10,000 to $14,999 | 75 | 32.5% |
| $15,000 to $24,999 | 0 | 0.0% |
| $25,000 to $34,999 | 0 | 0.0% |
| $35,000 to $49,999 | 24 | 10.4% |
| $50,000 to $74,999 | 46 | 19.9% |
| $75,000 to $99,999 | 12 | 5.2% |
| $100,000 to $149,999 | 29 | 12.6% |
| $150,000 to $199,999 | 0 | 0.0% |
| $200,000+ | 6 | 2.6% |
Family Income by Famaliy Size in Matamoras
2-person families (54 | 23.4%) account for the highest median family income in Matamoras with $63,333 per family, while 2-person families (54 | 23.4%) have the highest median income of $31,666 per family member.
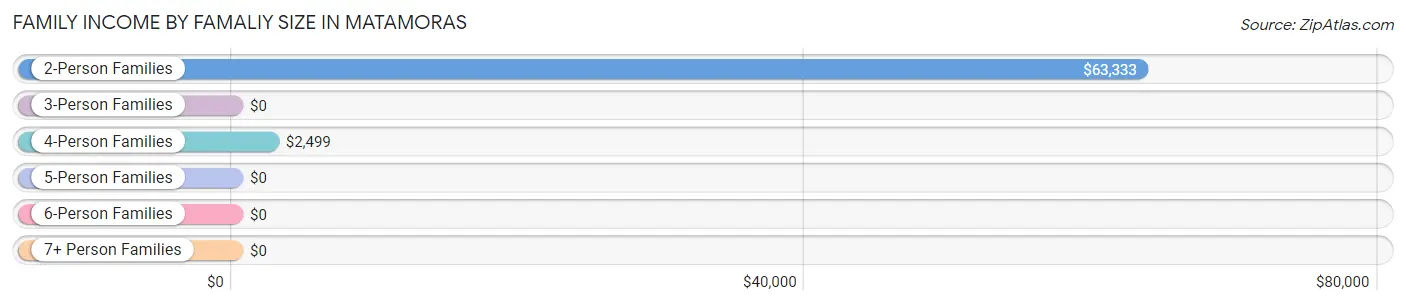
| Income Bracket | # Families | Median Income |
| 2-Person Families | 54 (23.4%) | $63,333 |
| 3-Person Families | 55 (23.8%) | $0 |
| 4-Person Families | 22 (9.5%) | $2,499 |
| 5-Person Families | 78 (33.8%) | $0 |
| 6-Person Families | 6 (2.6%) | $0 |
| 7+ Person Families | 16 (6.9%) | $0 |
| Total | 231 (100.0%) | $0 |
Family Income by Number of Earners in Matamoras
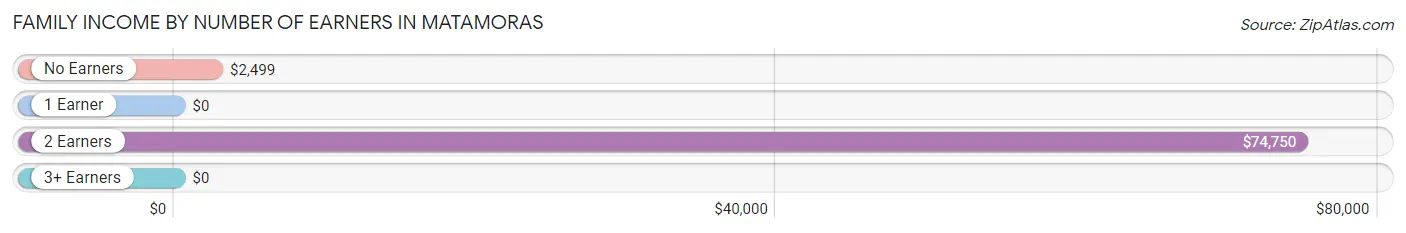
| Number of Earners | # Families | Median Income |
| No Earners | 35 (15.1%) | $2,499 |
| 1 Earner | 168 (72.7%) | $0 |
| 2 Earners | 18 (7.8%) | $74,750 |
| 3+ Earners | 10 (4.3%) | $0 |
| Total | 231 (100.0%) | $0 |
Household Income in Matamoras
Household Income Brackets in Matamoras
With 130 households falling in the category, the $10,000 to $14,999 income range is the most frequent in Matamoras, accounting for 28.7% of all households.
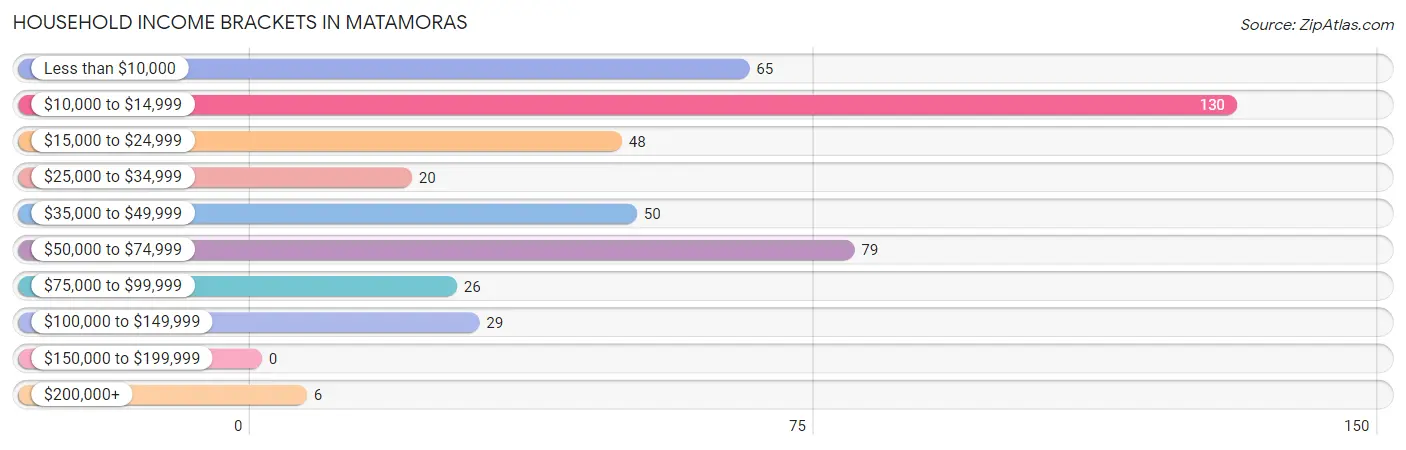
| Income Bracket | # Households | % Households |
| Less than $10,000 | 65 | 14.3% |
| $10,000 to $14,999 | 130 | 28.7% |
| $15,000 to $24,999 | 48 | 10.6% |
| $25,000 to $34,999 | 20 | 4.4% |
| $35,000 to $49,999 | 50 | 11.0% |
| $50,000 to $74,999 | 79 | 17.4% |
| $75,000 to $99,999 | 26 | 5.7% |
| $100,000 to $149,999 | 29 | 6.4% |
| $150,000 to $199,999 | 0 | 0.0% |
| $200,000+ | 6 | 1.3% |
Household Income by Householder Age in Matamoras
The median household income in Matamoras is $21,125, with the highest median household income of $33,250 found in the 45 to 64 years age bracket for the primary householder. A total of 190 households (41.9%) fall into this category. Meanwhile, the 15 to 24 years age bracket for the primary householder has the lowest median household income of $0, with 17 households (3.7%) in this group.
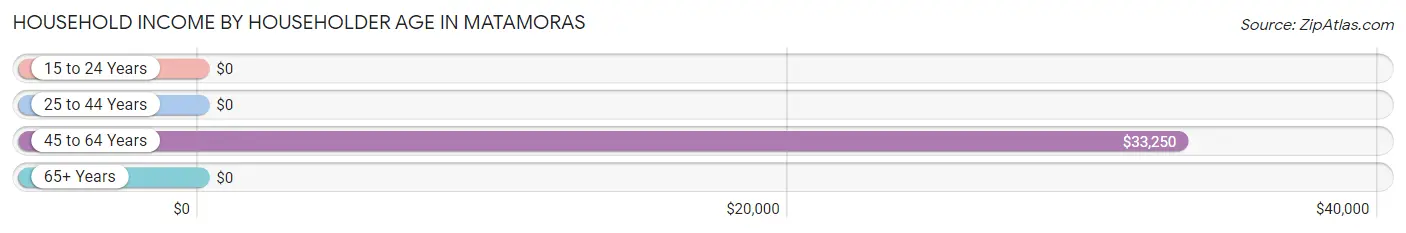
| Income Bracket | # Households | Median Income |
| 15 to 24 Years | 17 (3.7%) | $0 |
| 25 to 44 Years | 158 (34.9%) | $0 |
| 45 to 64 Years | 190 (41.9%) | $33,250 |
| 65+ Years | 88 (19.4%) | $0 |
| Total | 453 (100.0%) | $21,125 |
Poverty in Matamoras
Income Below Poverty by Sex and Age in Matamoras
With 43.5% poverty level for males and 46.0% for females among the residents of Matamoras, 5 year old males and 18 to 24 year old females are the most vulnerable to poverty, with 19 males (100.0%) and 43 females (100.0%) in their respective age groups living below the poverty level.
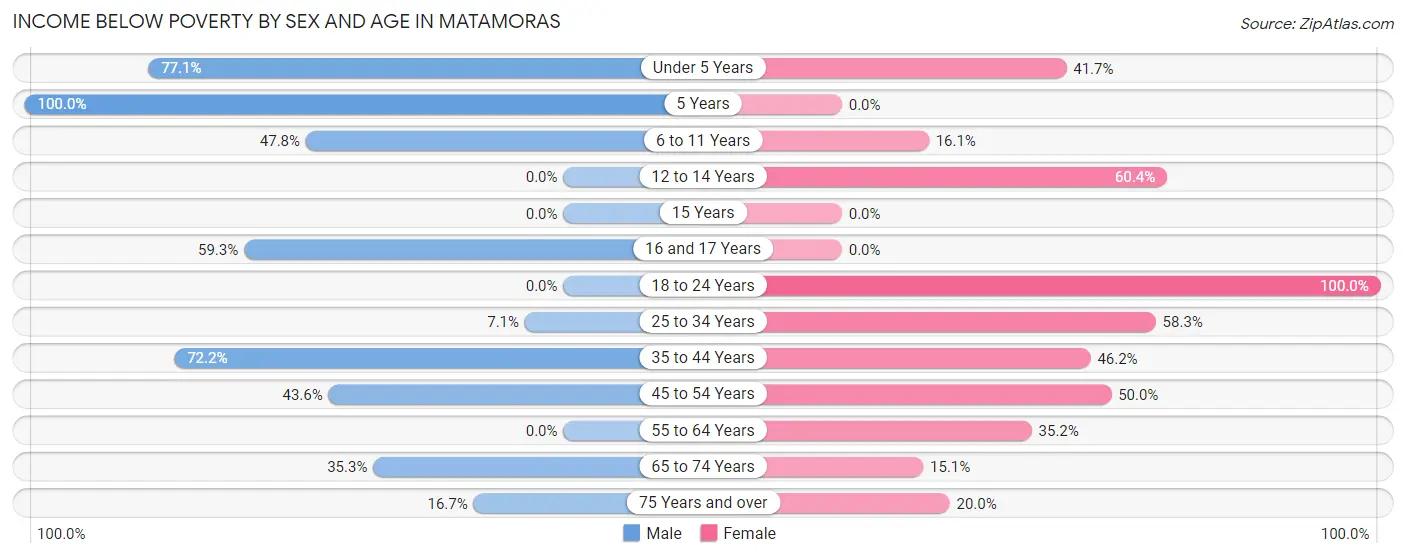
| Age Bracket | Male | Female |
| Under 5 Years | 47 (77.0%) | 5 (41.7%) |
| 5 Years | 19 (100.0%) | 0 (0.0%) |
| 6 to 11 Years | 54 (47.8%) | 10 (16.1%) |
| 12 to 14 Years | 0 (0.0%) | 64 (60.4%) |
| 15 Years | 0 (0.0%) | 0 (0.0%) |
| 16 and 17 Years | 16 (59.3%) | 0 (0.0%) |
| 18 to 24 Years | 0 (0.0%) | 43 (100.0%) |
| 25 to 34 Years | 4 (7.1%) | 67 (58.3%) |
| 35 to 44 Years | 65 (72.2%) | 12 (46.2%) |
| 45 to 54 Years | 17 (43.6%) | 33 (50.0%) |
| 55 to 64 Years | 0 (0.0%) | 31 (35.2%) |
| 65 to 74 Years | 6 (35.3%) | 8 (15.1%) |
| 75 Years and over | 5 (16.7%) | 6 (20.0%) |
| Total | 233 (43.5%) | 279 (46.0%) |
Income Above Poverty by Sex and Age in Matamoras
According to the poverty statistics in Matamoras, males aged 12 to 14 years and females aged 15 years are the age groups that are most secure financially, with 100.0% of males and 100.0% of females in these age groups living above the poverty line.
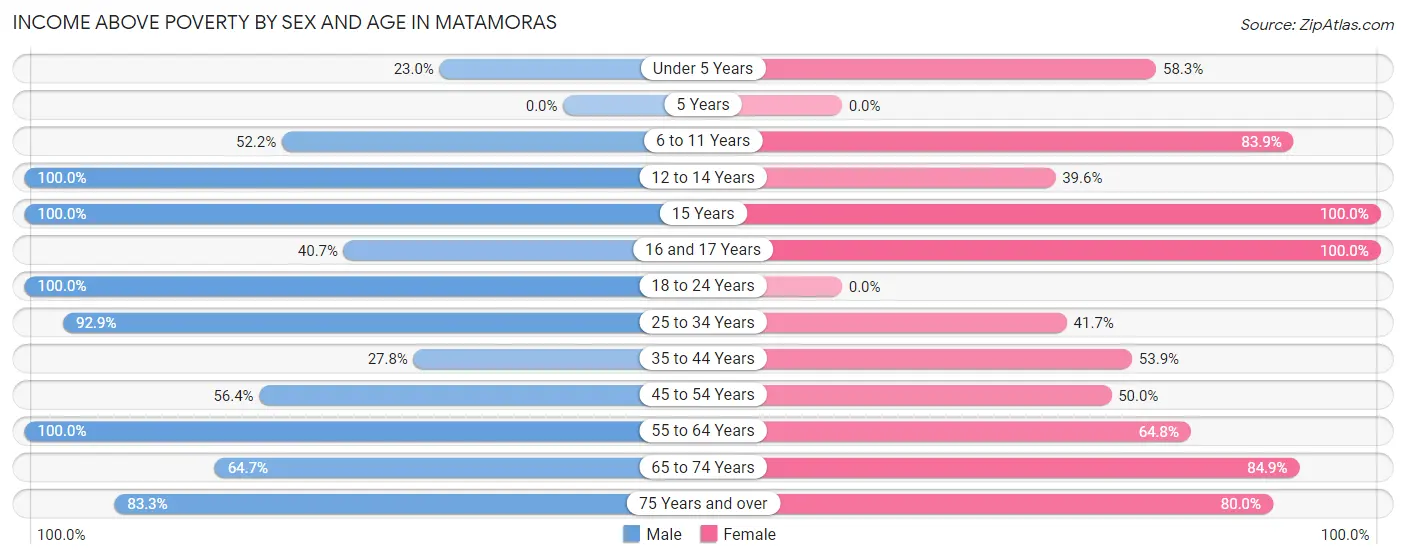
| Age Bracket | Male | Female |
| Under 5 Years | 14 (23.0%) | 7 (58.3%) |
| 5 Years | 0 (0.0%) | 0 (0.0%) |
| 6 to 11 Years | 59 (52.2%) | 52 (83.9%) |
| 12 to 14 Years | 9 (100.0%) | 42 (39.6%) |
| 15 Years | 15 (100.0%) | 4 (100.0%) |
| 16 and 17 Years | 11 (40.7%) | 2 (100.0%) |
| 18 to 24 Years | 18 (100.0%) | 0 (0.0%) |
| 25 to 34 Years | 52 (92.9%) | 48 (41.7%) |
| 35 to 44 Years | 25 (27.8%) | 14 (53.8%) |
| 45 to 54 Years | 22 (56.4%) | 33 (50.0%) |
| 55 to 64 Years | 42 (100.0%) | 57 (64.8%) |
| 65 to 74 Years | 11 (64.7%) | 45 (84.9%) |
| 75 Years and over | 25 (83.3%) | 24 (80.0%) |
| Total | 303 (56.5%) | 328 (54.0%) |
Income Below Poverty Among Married-Couple Families in Matamoras
The poverty statistics for married-couple families in Matamoras show that 46.0% or 63 of the total 137 families live below the poverty line. Families with 3 or 4 children have the highest poverty rate of 87.3%, comprising of 55 families. On the other hand, families with 5 or more children have the lowest poverty rate of 0.0%, which includes 0 families.
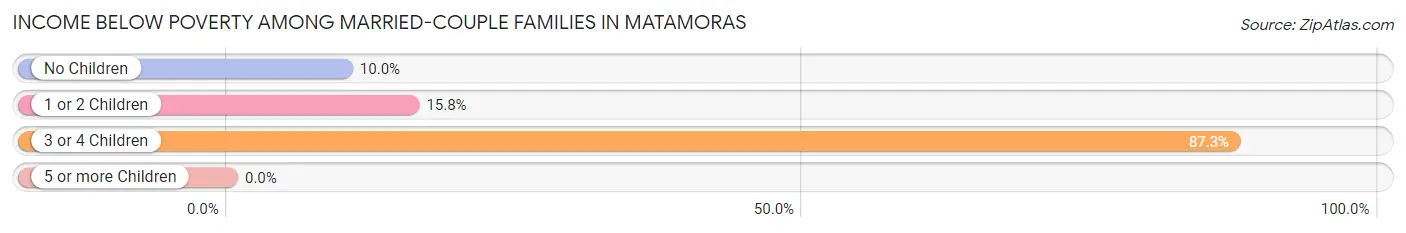
| Children | Above Poverty | Below Poverty |
| No Children | 18 (90.0%) | 2 (10.0%) |
| 1 or 2 Children | 32 (84.2%) | 6 (15.8%) |
| 3 or 4 Children | 8 (12.7%) | 55 (87.3%) |
| 5 or more Children | 16 (100.0%) | 0 (0.0%) |
| Total | 74 (54.0%) | 63 (46.0%) |
Income Below Poverty Among Single-Parent Households in Matamoras
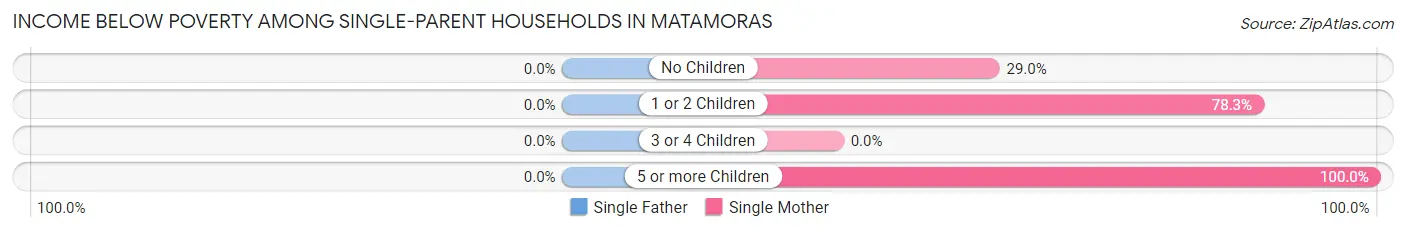
| Children | Single Father | Single Mother |
| No Children | 0 (0.0%) | 9 (29.0%) |
| 1 or 2 Children | 0 (0.0%) | 36 (78.3%) |
| 3 or 4 Children | 0 (0.0%) | 0 (0.0%) |
| 5 or more Children | 0 (0.0%) | 6 (100.0%) |
| Total | 0 (0.0%) | 51 (56.0%) |
Income Below Poverty Among Married-Couple vs Single-Parent Households in Matamoras
The poverty data for Matamoras shows that 63 of the married-couple family households (46.0%) and 51 of the single-parent households (54.3%) are living below the poverty level. Within the married-couple family households, those with 3 or 4 children have the highest poverty rate, with 55 households (87.3%) falling below the poverty line. Among the single-parent households, those with 5 or more children have the highest poverty rate, with 6 household (100.0%) living below poverty.
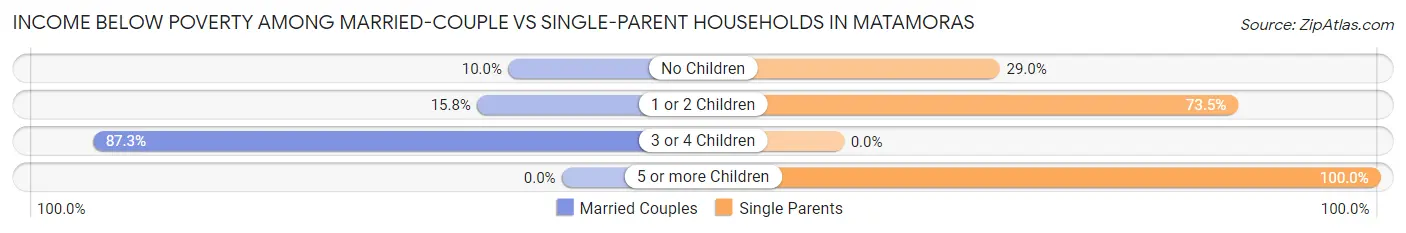
| Children | Married-Couple Families | Single-Parent Households |
| No Children | 2 (10.0%) | 9 (29.0%) |
| 1 or 2 Children | 6 (15.8%) | 36 (73.5%) |
| 3 or 4 Children | 55 (87.3%) | 0 (0.0%) |
| 5 or more Children | 0 (0.0%) | 6 (100.0%) |
| Total | 63 (46.0%) | 51 (54.3%) |
Race in Matamoras
The most populous races in Matamoras are White / Caucasian (1,107 | 95.9%), Two or more Races (25 | 2.2%), and Asian (17 | 1.5%).
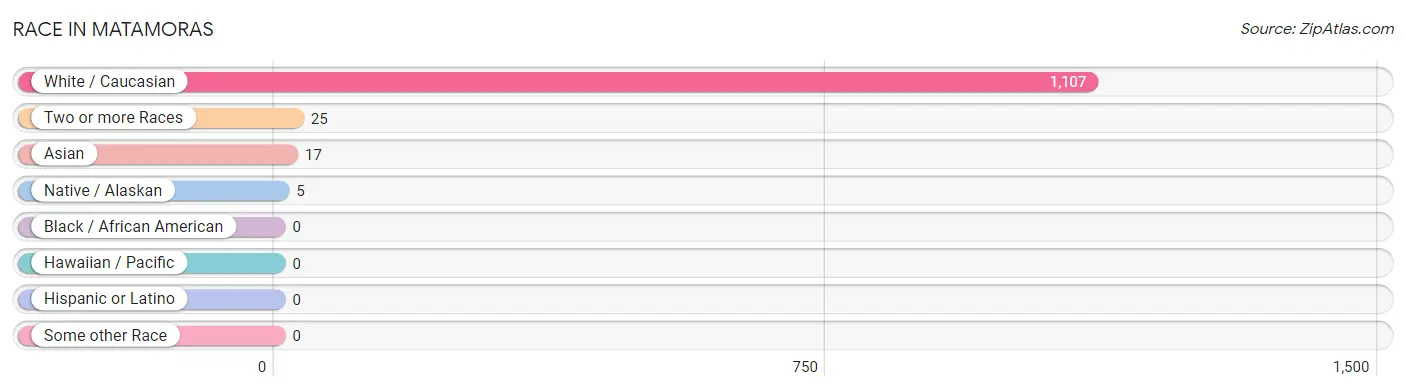
| Race | # Population | % Population |
| Asian | 17 | 1.5% |
| Black / African American | 0 | 0.0% |
| Hawaiian / Pacific | 0 | 0.0% |
| Hispanic or Latino | 0 | 0.0% |
| Native / Alaskan | 5 | 0.4% |
| White / Caucasian | 1,107 | 95.9% |
| Two or more Races | 25 | 2.2% |
| Some other Race | 0 | 0.0% |
| Total | 1,154 | 100.0% |
Ancestry in Matamoras
The most populous ancestries reported in Matamoras are German (133 | 11.5%), Irish (71 | 6.1%), English (39 | 3.4%), American (32 | 2.8%), and Italian (22 | 1.9%), together accounting for 25.7% of all Matamoras residents.
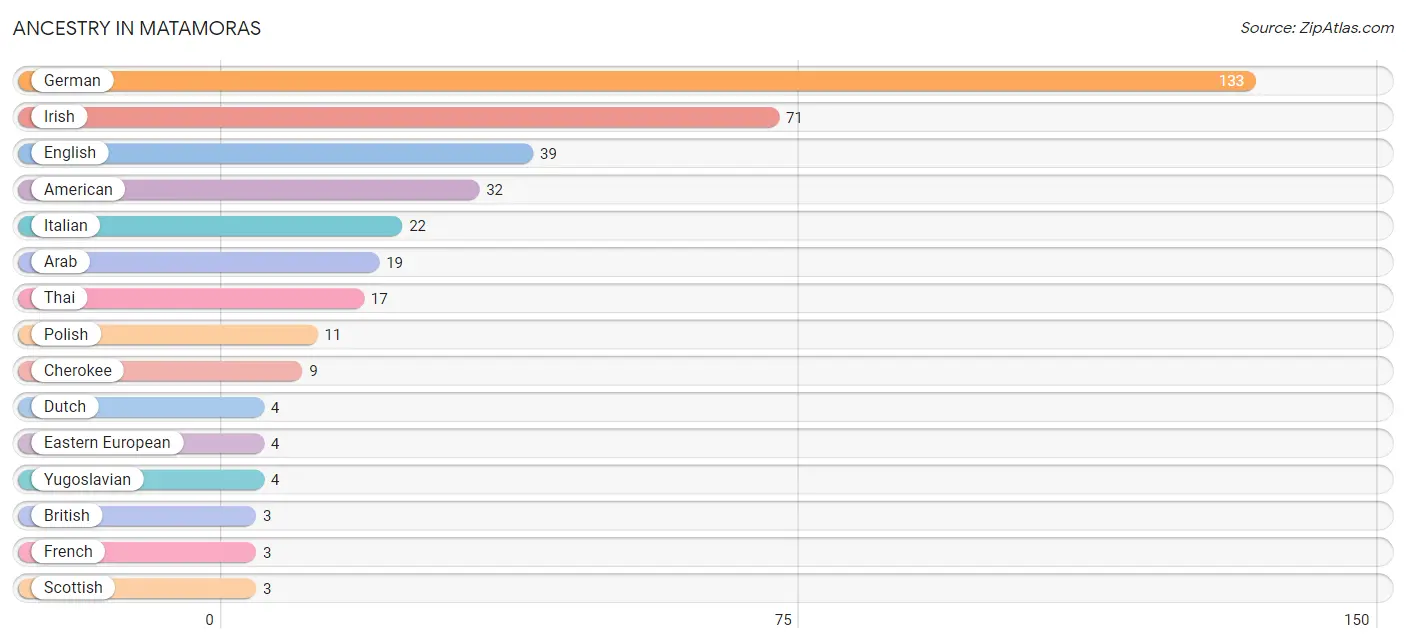
| Ancestry | # Population | % Population |
| African | 2 | 0.2% |
| American | 32 | 2.8% |
| Arab | 19 | 1.7% |
| British | 3 | 0.3% |
| Cherokee | 9 | 0.8% |
| Dutch | 4 | 0.4% |
| Eastern European | 4 | 0.4% |
| English | 39 | 3.4% |
| French | 3 | 0.3% |
| German | 133 | 11.5% |
| Irish | 71 | 6.1% |
| Italian | 22 | 1.9% |
| Polish | 11 | 0.9% |
| Scotch-Irish | 2 | 0.2% |
| Scottish | 3 | 0.3% |
| Subsaharan African | 2 | 0.2% |
| Thai | 17 | 1.5% |
| Welsh | 3 | 0.3% |
| Yugoslavian | 4 | 0.4% | View All 19 Rows |
Immigrants in Matamoras
The most numerous immigrant groups reported in Matamoras came from Asia (30 | 2.6%), Saudi Arabia (19 | 1.7%), Western Asia (19 | 1.7%), India (11 | 0.9%), and South Central Asia (11 | 0.9%), together accounting for 7.8% of all Matamoras residents.
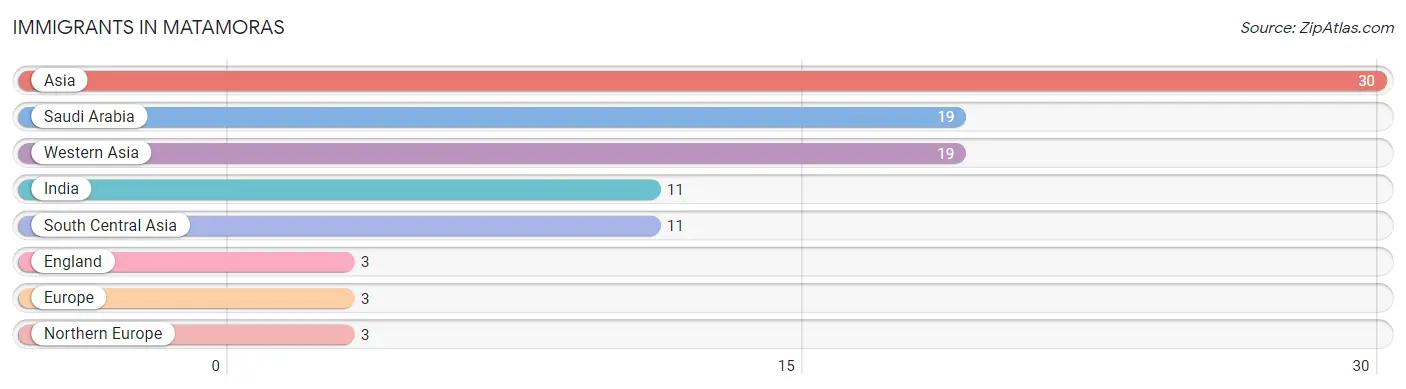
| Immigration Origin | # Population | % Population |
| Asia | 30 | 2.6% |
| England | 3 | 0.3% |
| Europe | 3 | 0.3% |
| India | 11 | 0.9% |
| Northern Europe | 3 | 0.3% |
| Saudi Arabia | 19 | 1.7% |
| South Central Asia | 11 | 0.9% |
| Western Asia | 19 | 1.7% | View All 8 Rows |
Sex and Age in Matamoras
Sex and Age in Matamoras
The most populous age groups in Matamoras are 5 to 9 Years (111 | 20.7%) for men and 10 to 14 Years (136 | 22.0%) for women.
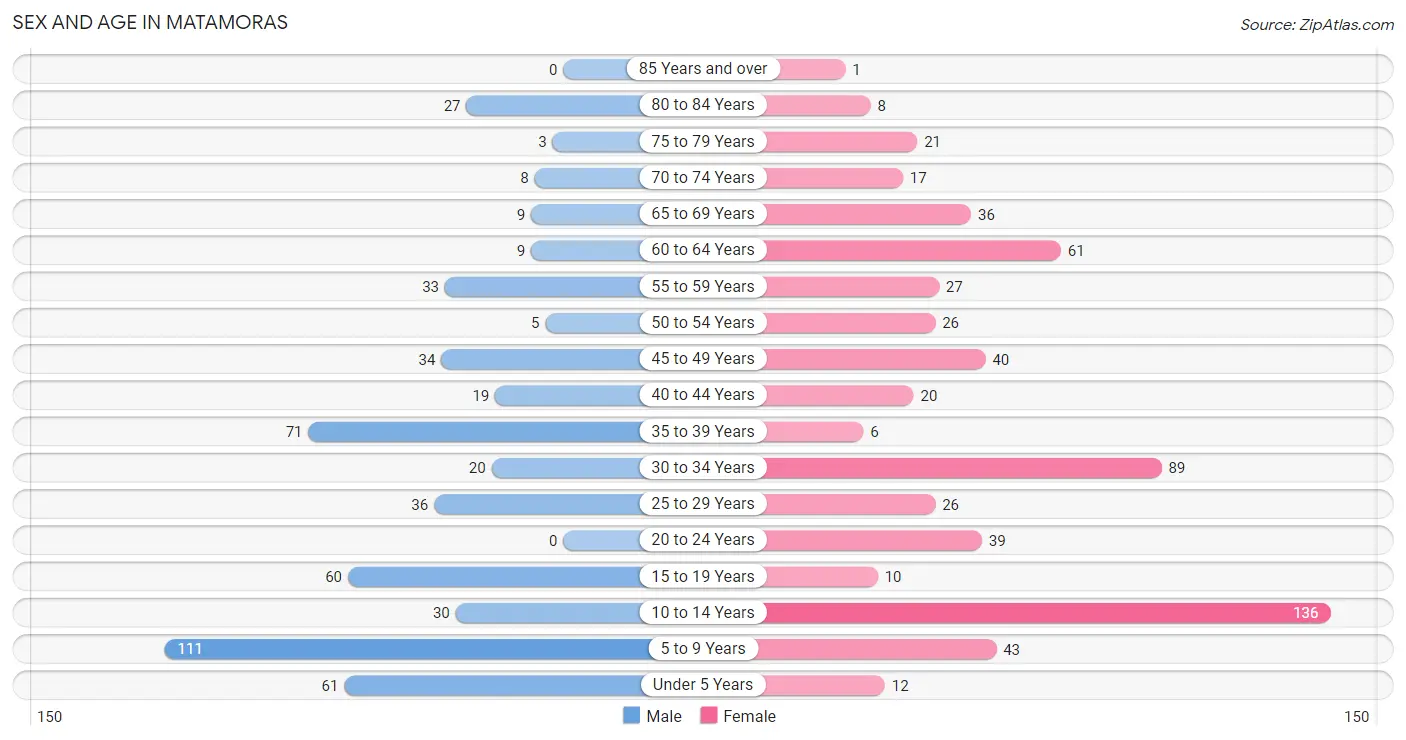
| Age Bracket | Male | Female |
| Under 5 Years | 61 (11.4%) | 12 (1.9%) |
| 5 to 9 Years | 111 (20.7%) | 43 (7.0%) |
| 10 to 14 Years | 30 (5.6%) | 136 (22.0%) |
| 15 to 19 Years | 60 (11.2%) | 10 (1.6%) |
| 20 to 24 Years | 0 (0.0%) | 39 (6.3%) |
| 25 to 29 Years | 36 (6.7%) | 26 (4.2%) |
| 30 to 34 Years | 20 (3.7%) | 89 (14.4%) |
| 35 to 39 Years | 71 (13.3%) | 6 (1.0%) |
| 40 to 44 Years | 19 (3.5%) | 20 (3.2%) |
| 45 to 49 Years | 34 (6.3%) | 40 (6.5%) |
| 50 to 54 Years | 5 (0.9%) | 26 (4.2%) |
| 55 to 59 Years | 33 (6.2%) | 27 (4.4%) |
| 60 to 64 Years | 9 (1.7%) | 61 (9.9%) |
| 65 to 69 Years | 9 (1.7%) | 36 (5.8%) |
| 70 to 74 Years | 8 (1.5%) | 17 (2.8%) |
| 75 to 79 Years | 3 (0.6%) | 21 (3.4%) |
| 80 to 84 Years | 27 (5.0%) | 8 (1.3%) |
| 85 Years and over | 0 (0.0%) | 1 (0.2%) |
| Total | 536 (100.0%) | 618 (100.0%) |
Families and Households in Matamoras
Median Family Size in Matamoras
The median family size in Matamoras is 3.85 persons per family, with married-couple families (137 | 59.3%) accounting for the largest median family size of 4.33 persons per family. On the other hand, single male/father families (3 | 1.3%) represent the smallest median family size with 1.67 persons per family.
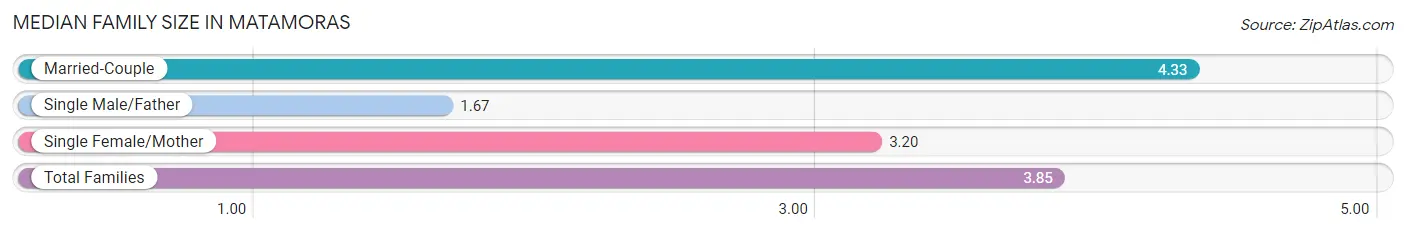
| Family Type | # Families | Family Size |
| Married-Couple | 137 (59.3%) | 4.33 |
| Single Male/Father | 3 (1.3%) | 1.67 |
| Single Female/Mother | 91 (39.4%) | 3.20 |
| Total Families | 231 (100.0%) | 3.85 |
Median Household Size in Matamoras
The median household size in Matamoras is 2.55 persons per household, with married-couple households (137 | 30.2%) accounting for the largest median household size of 4.33 persons per household. non-family households (222 | 49.0%) represent the smallest median household size with 1.14 persons per household.
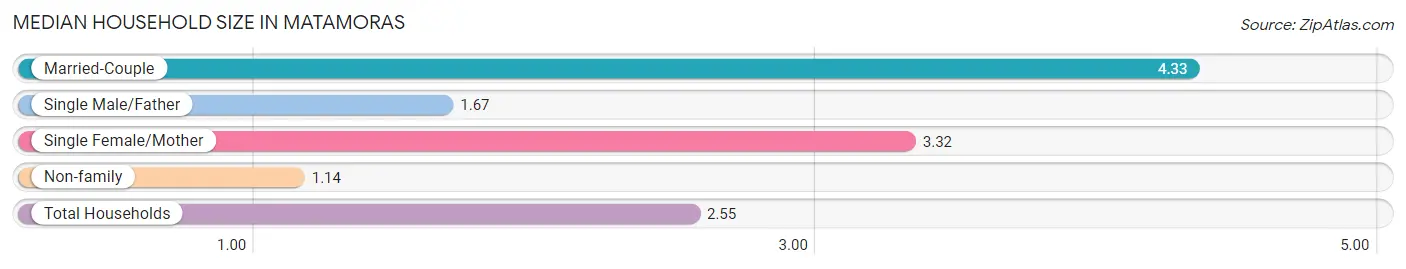
| Household Type | # Households | Household Size |
| Married-Couple | 137 (30.2%) | 4.33 |
| Single Male/Father | 3 (0.7%) | 1.67 |
| Single Female/Mother | 91 (20.1%) | 3.32 |
| Non-family | 222 (49.0%) | 1.14 |
| Total Households | 453 (100.0%) | 2.55 |
Household Size by Marriage Status in Matamoras
Out of a total of 453 households in Matamoras, 231 (51.0%) are family households, while 222 (49.0%) are nonfamily households. The most numerous type of family households are 5-person households, comprising 78, and the most common type of nonfamily households are 1-person households, comprising 201.
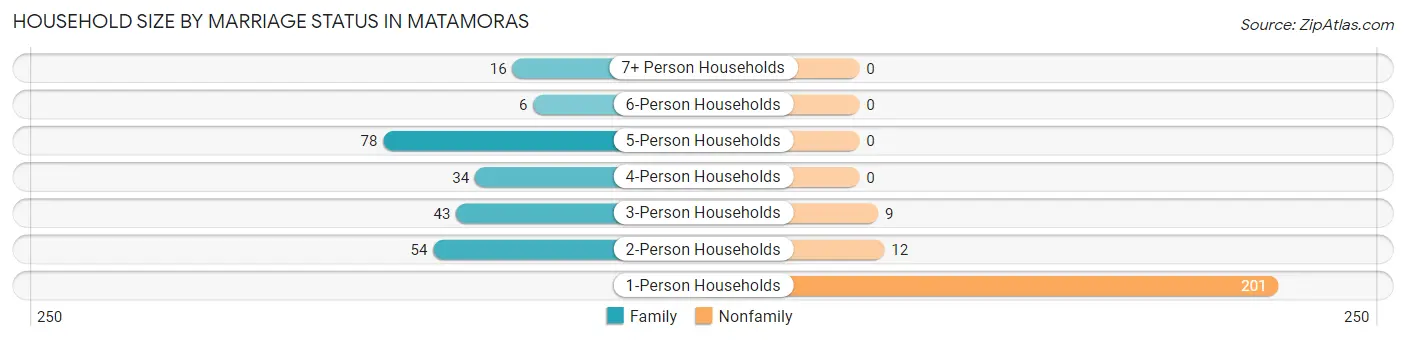
| Household Size | Family Households | Nonfamily Households |
| 1-Person Households | - | 201 (44.4%) |
| 2-Person Households | 54 (11.9%) | 12 (2.6%) |
| 3-Person Households | 43 (9.5%) | 9 (2.0%) |
| 4-Person Households | 34 (7.5%) | 0 (0.0%) |
| 5-Person Households | 78 (17.2%) | 0 (0.0%) |
| 6-Person Households | 6 (1.3%) | 0 (0.0%) |
| 7+ Person Households | 16 (3.5%) | 0 (0.0%) |
| Total | 231 (51.0%) | 222 (49.0%) |
Female Fertility in Matamoras
Fertility by Age in Matamoras
Average fertility rate in Matamoras is 17.0 births per 1,000 women. Women in the age bracket of 20 to 34 years have the highest fertility rate with 26.0 births per 1,000 women. Women in the age bracket of 20 to 34 years acount for 100.0% of all women with births.
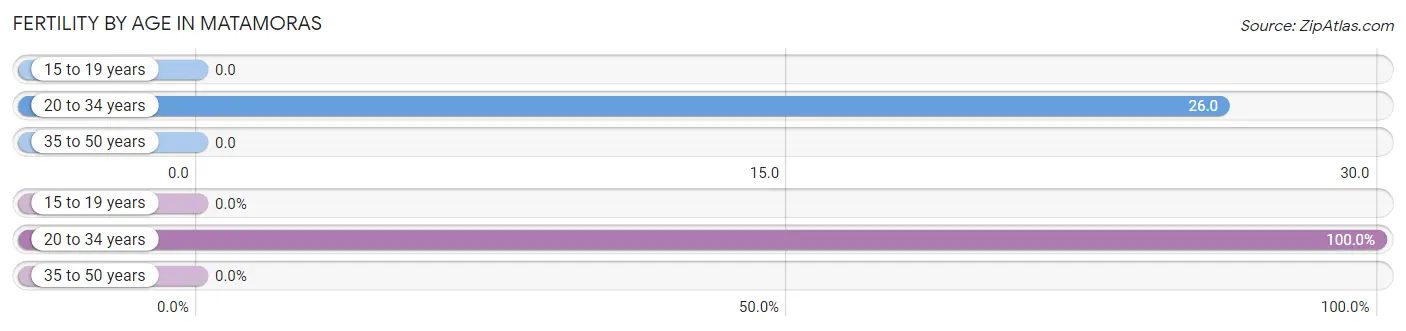
| Age Bracket | Women with Births | Births / 1,000 Women |
| 15 to 19 years | 0 (0.0%) | 0.0 |
| 20 to 34 years | 4 (100.0%) | 26.0 |
| 35 to 50 years | 0 (0.0%) | 0.0 |
| Total | 4 (100.0%) | 17.0 |
Fertility by Age by Marriage Status in Matamoras
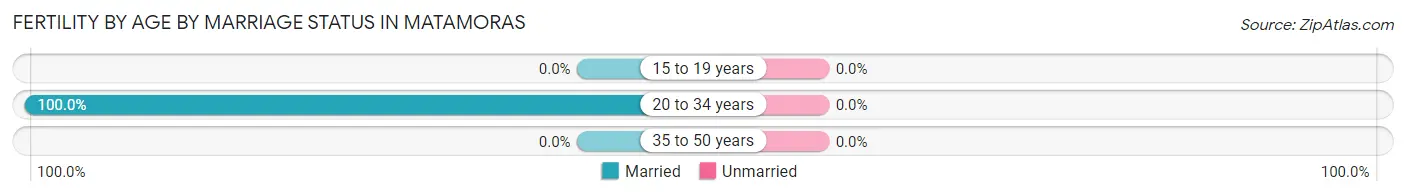
| Age Bracket | Married | Unmarried |
| 15 to 19 years | 0 (0.0%) | 0 (0.0%) |
| 20 to 34 years | 4 (100.0%) | 0 (0.0%) |
| 35 to 50 years | 0 (0.0%) | 0 (0.0%) |
| Total | 4 (100.0%) | 0 (0.0%) |
Fertility by Education in Matamoras
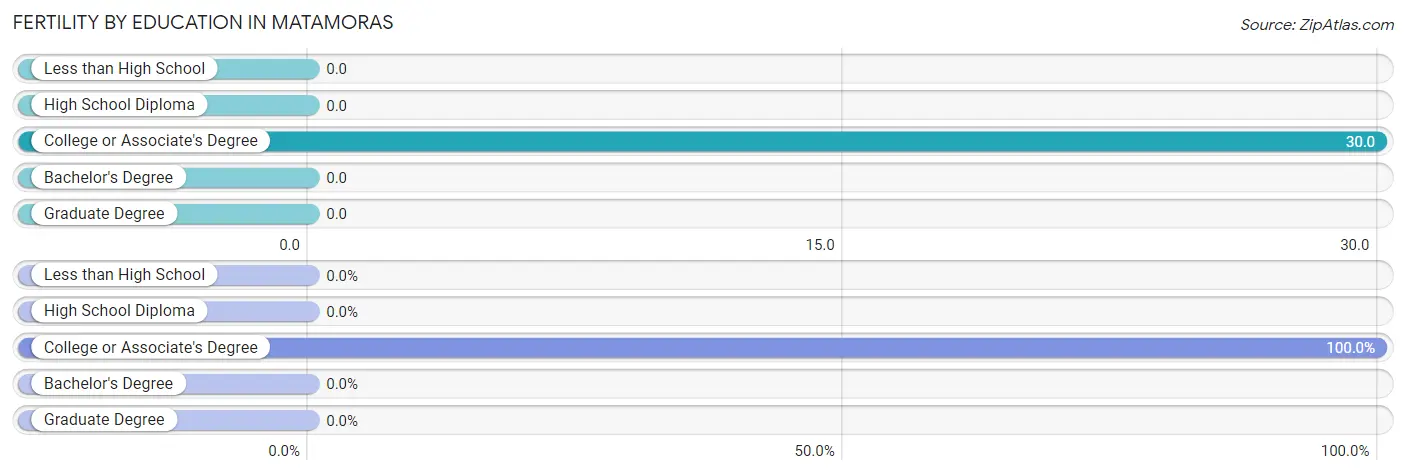
| Educational Attainment | Women with Births | Births / 1,000 Women |
| Less than High School | 0 (0.0%) | 0.0 |
| High School Diploma | 0 (0.0%) | 0.0 |
| College or Associate's Degree | 4 (100.0%) | 30.0 |
| Bachelor's Degree | 0 (0.0%) | 0.0 |
| Graduate Degree | 0 (0.0%) | 0.0 |
| Total | 4 (100.0%) | 17.0 |
Fertility by Education by Marriage Status in Matamoras
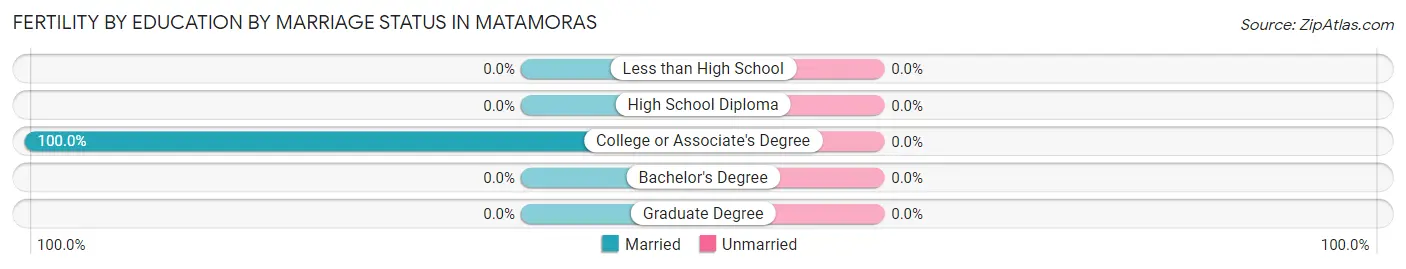
| Educational Attainment | Married | Unmarried |
| Less than High School | 0 (0.0%) | 0 (0.0%) |
| High School Diploma | 0 (0.0%) | 0 (0.0%) |
| College or Associate's Degree | 4 (100.0%) | 0 (0.0%) |
| Bachelor's Degree | 0 (0.0%) | 0 (0.0%) |
| Graduate Degree | 0 (0.0%) | 0 (0.0%) |
| Total | 4 (100.0%) | 0 (0.0%) |
Employment Characteristics in Matamoras
Employment by Class of Employer in Matamoras
Among the 264 employed individuals in Matamoras, private company employees (159 | 60.2%), not-for-profit organizations (27 | 10.2%), and local government employees (25 | 9.5%) make up the most common classes of employment.
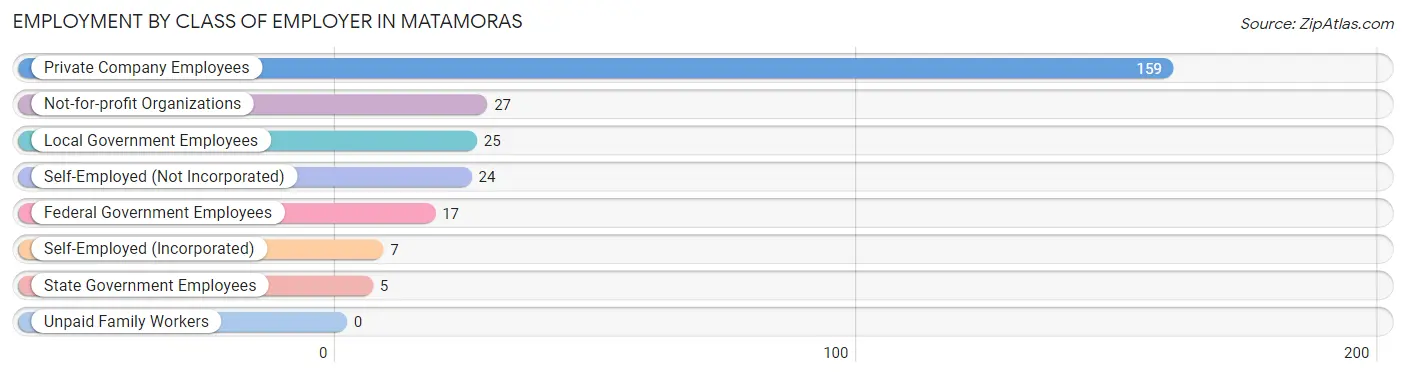
| Employer Class | # Employees | % Employees |
| Private Company Employees | 159 | 60.2% |
| Self-Employed (Incorporated) | 7 | 2.6% |
| Self-Employed (Not Incorporated) | 24 | 9.1% |
| Not-for-profit Organizations | 27 | 10.2% |
| Local Government Employees | 25 | 9.5% |
| State Government Employees | 5 | 1.9% |
| Federal Government Employees | 17 | 6.4% |
| Unpaid Family Workers | 0 | 0.0% |
| Total | 264 | 100.0% |
Employment Status by Age in Matamoras
According to the labor force statistics for Matamoras, out of the total population over 16 years of age (742), 45.0% or 334 individuals are in the labor force, with 17.1% or 57 of them unemployed. The age group with the highest labor force participation rate is 35 to 44 years, with 87.9% or 102 individuals in the labor force. Within the labor force, the 35 to 44 years age range has the highest percentage of unemployed individuals, with 45.1% or 46 of them being unemployed.
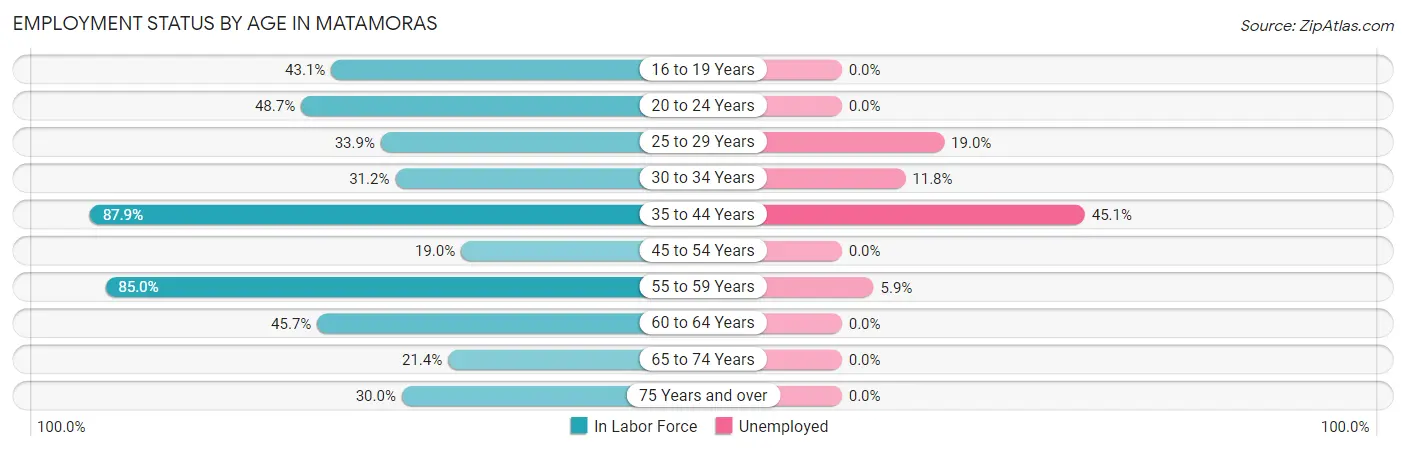
| Age Bracket | In Labor Force | Unemployed |
| 16 to 19 Years | 22 (43.1%) | 0 (0.0%) |
| 20 to 24 Years | 19 (48.7%) | 0 (0.0%) |
| 25 to 29 Years | 21 (33.9%) | 4 (19.0%) |
| 30 to 34 Years | 34 (31.2%) | 4 (11.8%) |
| 35 to 44 Years | 102 (87.9%) | 46 (45.1%) |
| 45 to 54 Years | 20 (19.0%) | 0 (0.0%) |
| 55 to 59 Years | 51 (85.0%) | 3 (5.9%) |
| 60 to 64 Years | 32 (45.7%) | 0 (0.0%) |
| 65 to 74 Years | 15 (21.4%) | 0 (0.0%) |
| 75 Years and over | 18 (30.0%) | 0 (0.0%) |
| Total | 334 (45.0%) | 57 (17.1%) |
Employment Status by Educational Attainment in Matamoras
According to labor force statistics for Matamoras, 49.8% of individuals (260) out of the total population between 25 and 64 years of age (522) are in the labor force, with 21.9% or 57 of them being unemployed. The group with the highest labor force participation rate are those with the educational attainment of bachelor's degree or higher, with 84.2% or 16 individuals in the labor force. Within the labor force, individuals with high school diploma education have the highest percentage of unemployment, with 34.5% or 40 of them being unemployed.
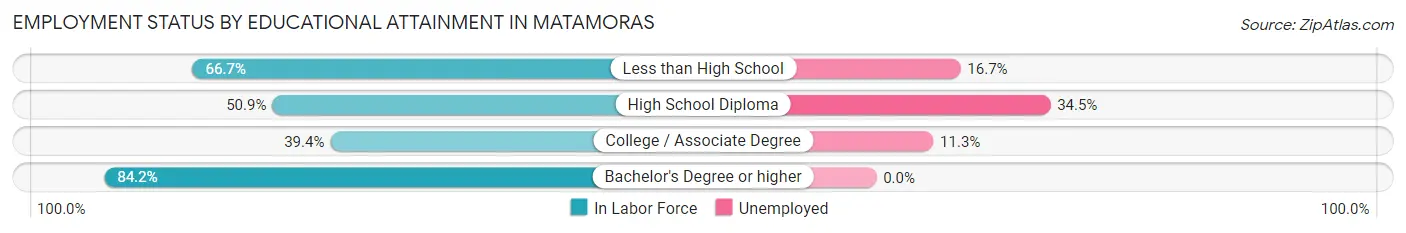
| Educational Attainment | In Labor Force | Unemployed |
| Less than High School | 48 (66.7%) | 12 (16.7%) |
| High School Diploma | 116 (50.9%) | 79 (34.5%) |
| College / Associate Degree | 80 (39.4%) | 23 (11.3%) |
| Bachelor's Degree or higher | 16 (84.2%) | 0 (0.0%) |
| Total | 260 (49.8%) | 114 (21.9%) |
Employment Occupations by Sex in Matamoras
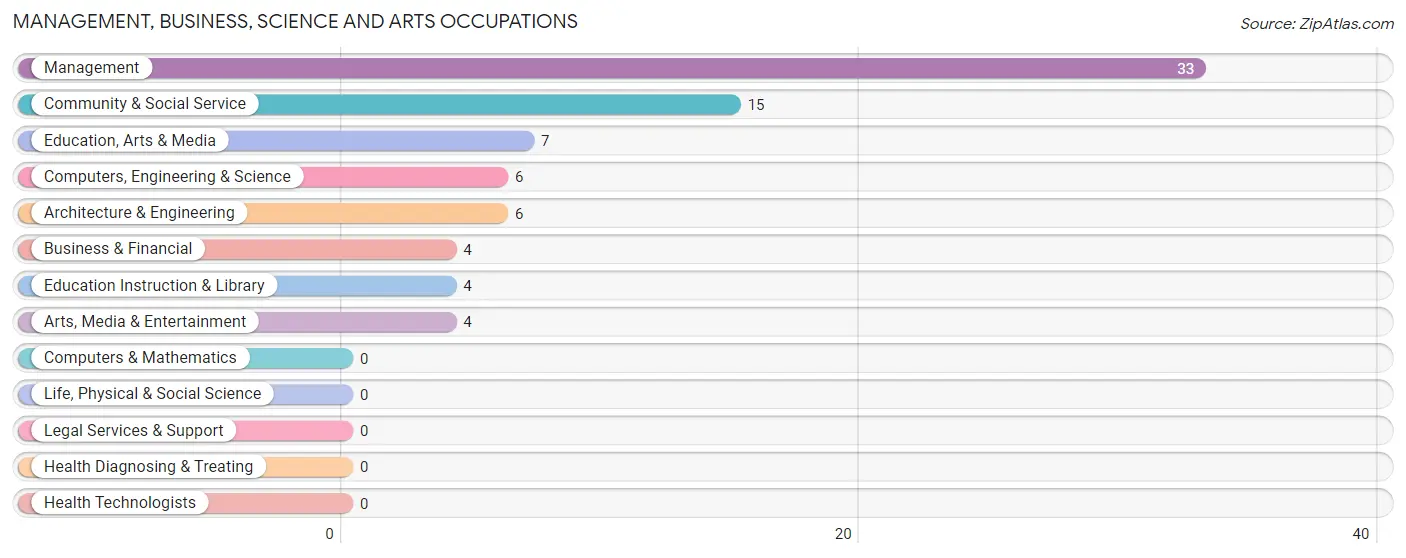
Management, Business, Science and Arts Occupations
The most common Management, Business, Science and Arts occupations in Matamoras are Management (33 | 11.9%), Community & Social Service (15 | 5.4%), Education, Arts & Media (7 | 2.5%), Computers, Engineering & Science (6 | 2.2%), and Architecture & Engineering (6 | 2.2%).
Management, Business, Science and Arts Occupations by Sex
Within the Management, Business, Science and Arts occupations in Matamoras, the most male-oriented occupations are Computers, Engineering & Science (100.0%), Architecture & Engineering (100.0%), and Management (72.7%), while the most female-oriented occupations are Business & Financial (100.0%), Community & Social Service (100.0%), and Education, Arts & Media (100.0%).
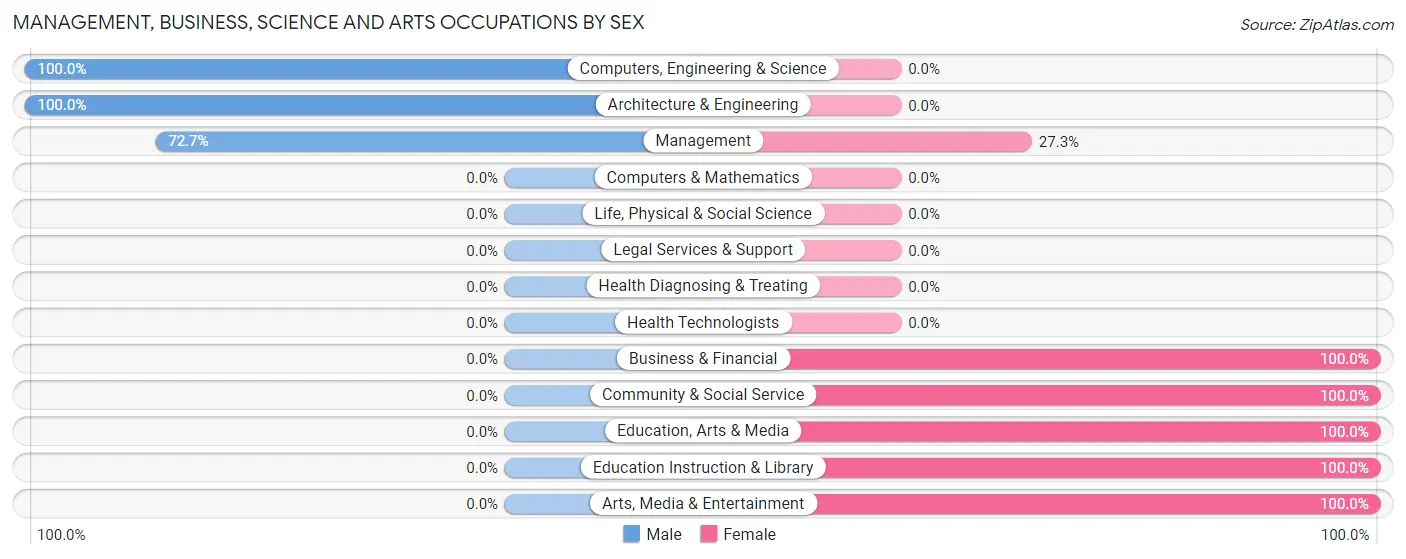
| Occupation | Male | Female |
| Management | 24 (72.7%) | 9 (27.3%) |
| Business & Financial | 0 (0.0%) | 4 (100.0%) |
| Computers, Engineering & Science | 6 (100.0%) | 0 (0.0%) |
| Computers & Mathematics | 0 (0.0%) | 0 (0.0%) |
| Architecture & Engineering | 6 (100.0%) | 0 (0.0%) |
| Life, Physical & Social Science | 0 (0.0%) | 0 (0.0%) |
| Community & Social Service | 0 (0.0%) | 15 (100.0%) |
| Education, Arts & Media | 0 (0.0%) | 7 (100.0%) |
| Legal Services & Support | 0 (0.0%) | 0 (0.0%) |
| Education Instruction & Library | 0 (0.0%) | 4 (100.0%) |
| Arts, Media & Entertainment | 0 (0.0%) | 4 (100.0%) |
| Health Diagnosing & Treating | 0 (0.0%) | 0 (0.0%) |
| Health Technologists | 0 (0.0%) | 0 (0.0%) |
| Total (Category) | 30 (51.7%) | 28 (48.3%) |
| Total (Overall) | 159 (57.4%) | 118 (42.6%) |
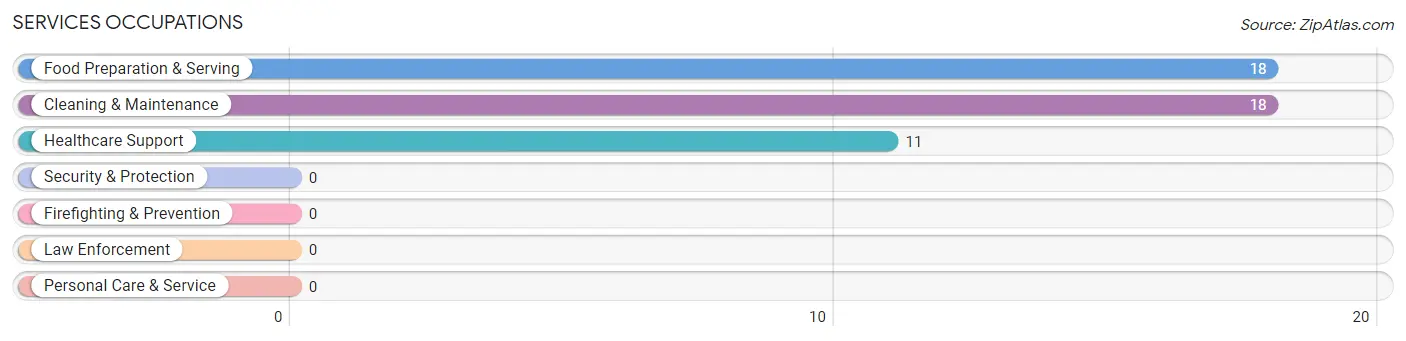
Services Occupations
The most common Services occupations in Matamoras are Food Preparation & Serving (18 | 6.5%), Cleaning & Maintenance (18 | 6.5%), and Healthcare Support (11 | 4.0%).
Services Occupations by Sex
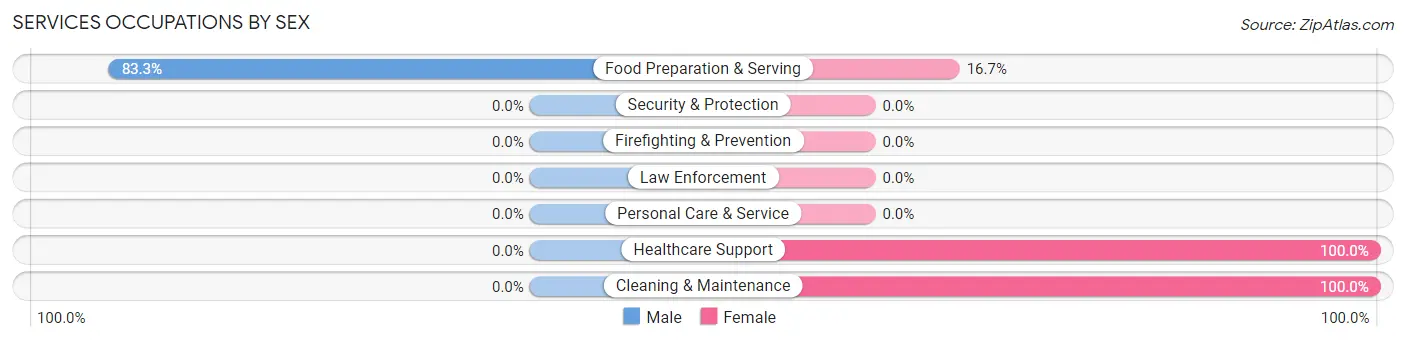
| Occupation | Male | Female |
| Healthcare Support | 0 (0.0%) | 11 (100.0%) |
| Security & Protection | 0 (0.0%) | 0 (0.0%) |
| Firefighting & Prevention | 0 (0.0%) | 0 (0.0%) |
| Law Enforcement | 0 (0.0%) | 0 (0.0%) |
| Food Preparation & Serving | 15 (83.3%) | 3 (16.7%) |
| Cleaning & Maintenance | 0 (0.0%) | 18 (100.0%) |
| Personal Care & Service | 0 (0.0%) | 0 (0.0%) |
| Total (Category) | 15 (31.9%) | 32 (68.1%) |
| Total (Overall) | 159 (57.4%) | 118 (42.6%) |
Sales and Office Occupations
The most common Sales and Office occupations in Matamoras are Office & Administration (51 | 18.4%), and Sales & Related (17 | 6.1%).
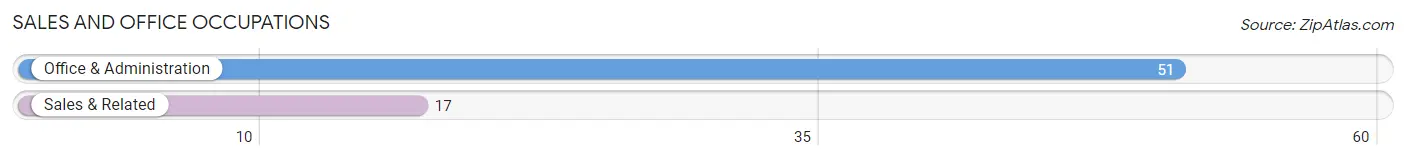
Sales and Office Occupations by Sex
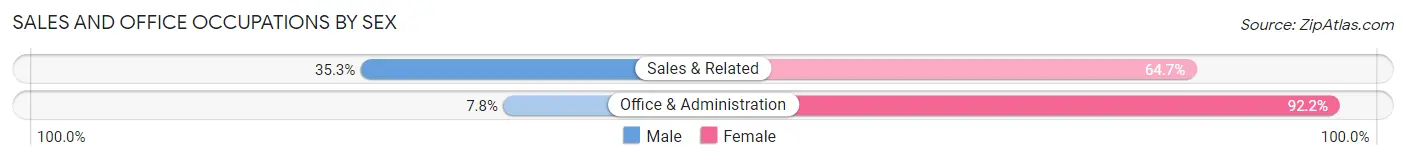
| Occupation | Male | Female |
| Sales & Related | 6 (35.3%) | 11 (64.7%) |
| Office & Administration | 4 (7.8%) | 47 (92.2%) |
| Total (Category) | 10 (14.7%) | 58 (85.3%) |
| Total (Overall) | 159 (57.4%) | 118 (42.6%) |
Natural Resources, Construction and Maintenance Occupations
The most common Natural Resources, Construction and Maintenance occupations in Matamoras are Construction & Extraction (15 | 5.4%), and Installation, Maintenance & Repair (6 | 2.2%).
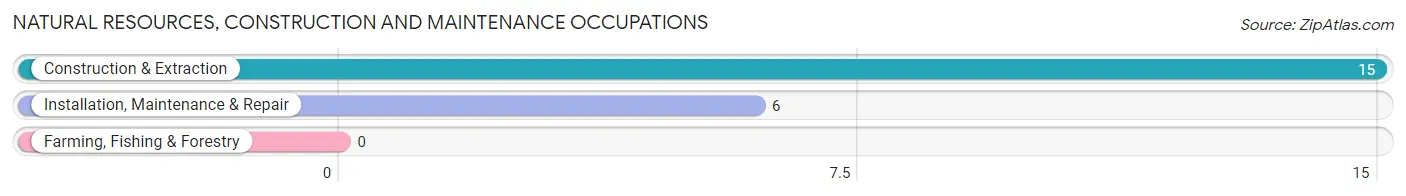
Natural Resources, Construction and Maintenance Occupations by Sex
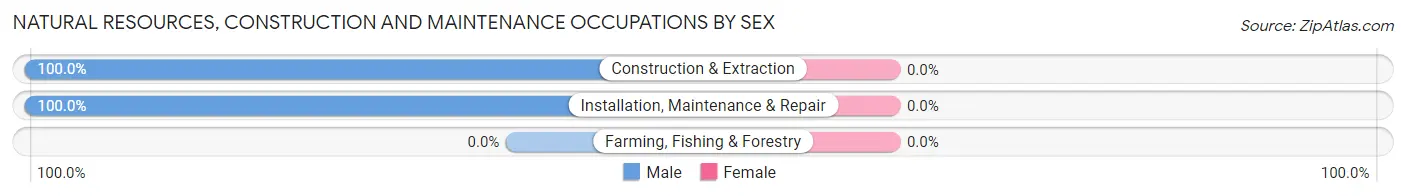
| Occupation | Male | Female |
| Farming, Fishing & Forestry | 0 (0.0%) | 0 (0.0%) |
| Construction & Extraction | 15 (100.0%) | 0 (0.0%) |
| Installation, Maintenance & Repair | 6 (100.0%) | 0 (0.0%) |
| Total (Category) | 21 (100.0%) | 0 (0.0%) |
| Total (Overall) | 159 (57.4%) | 118 (42.6%) |
Production, Transportation and Moving Occupations
The most common Production, Transportation and Moving occupations in Matamoras are Production (49 | 17.7%), Material Moving (18 | 6.5%), and Transportation (16 | 5.8%).
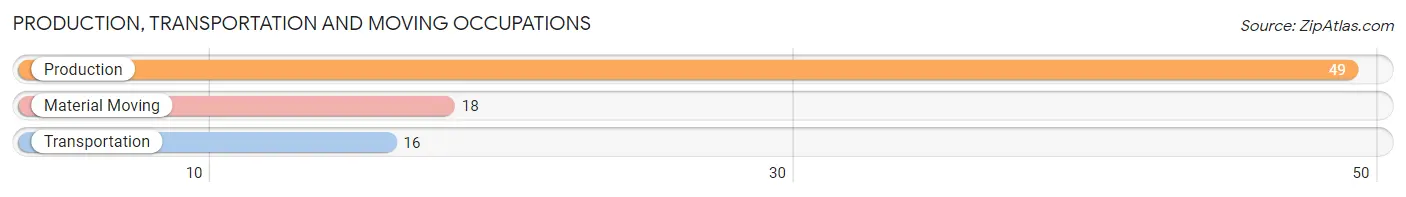
Production, Transportation and Moving Occupations by Sex
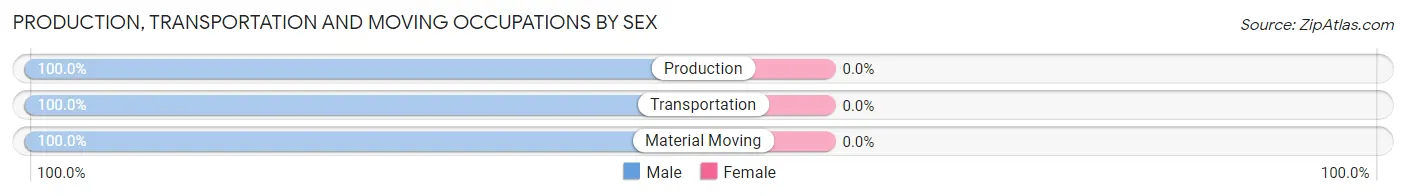
| Occupation | Male | Female |
| Production | 49 (100.0%) | 0 (0.0%) |
| Transportation | 16 (100.0%) | 0 (0.0%) |
| Material Moving | 18 (100.0%) | 0 (0.0%) |
| Total (Category) | 83 (100.0%) | 0 (0.0%) |
| Total (Overall) | 159 (57.4%) | 118 (42.6%) |
Employment Industries by Sex in Matamoras
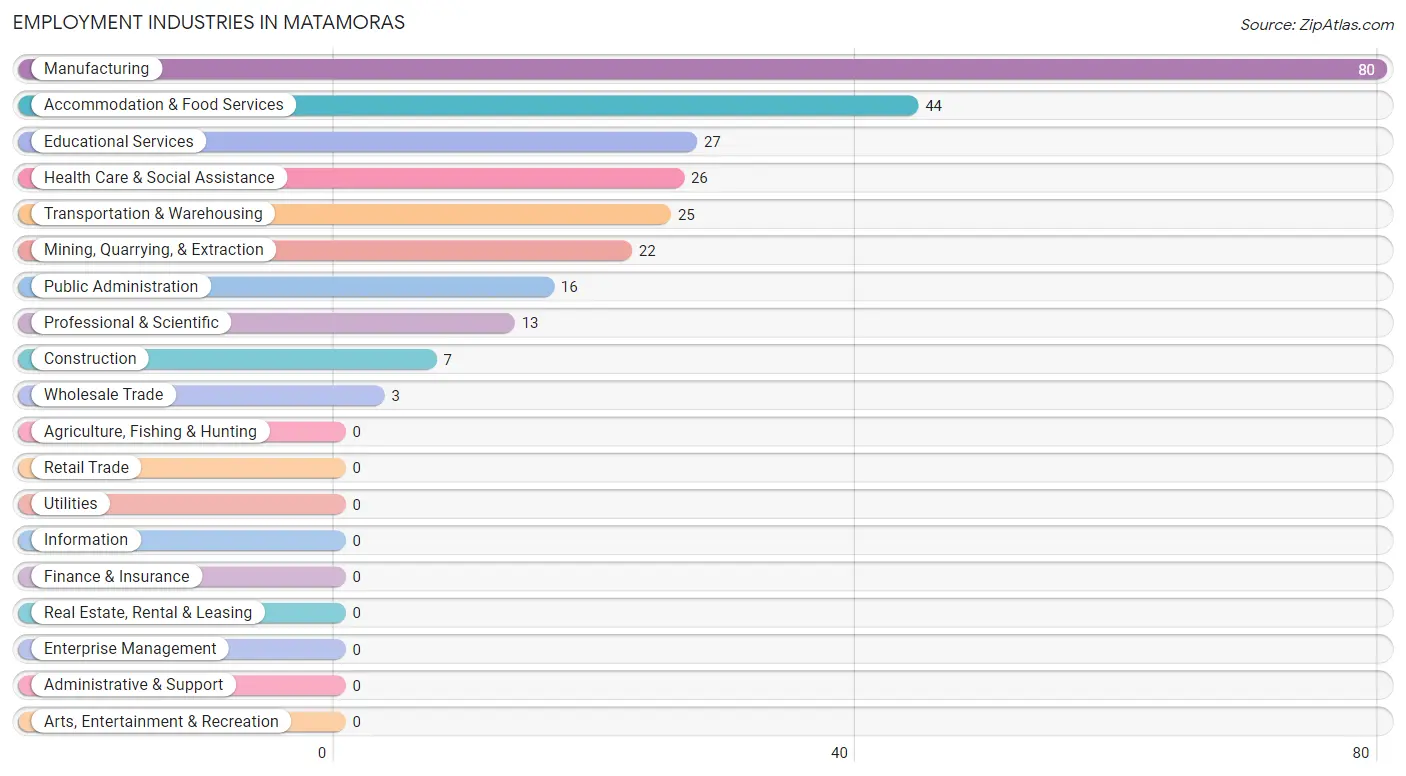
Employment Industries in Matamoras
The major employment industries in Matamoras include Manufacturing (80 | 28.9%), Accommodation & Food Services (44 | 15.9%), Educational Services (27 | 9.8%), Health Care & Social Assistance (26 | 9.4%), and Transportation & Warehousing (25 | 9.0%).
Employment Industries by Sex in Matamoras
The Matamoras industries that see more men than women are Construction (100.0%), Manufacturing (100.0%), and Wholesale Trade (100.0%), whereas the industries that tend to have a higher number of women are Educational Services (100.0%), Health Care & Social Assistance (100.0%), and Public Administration (75.0%).
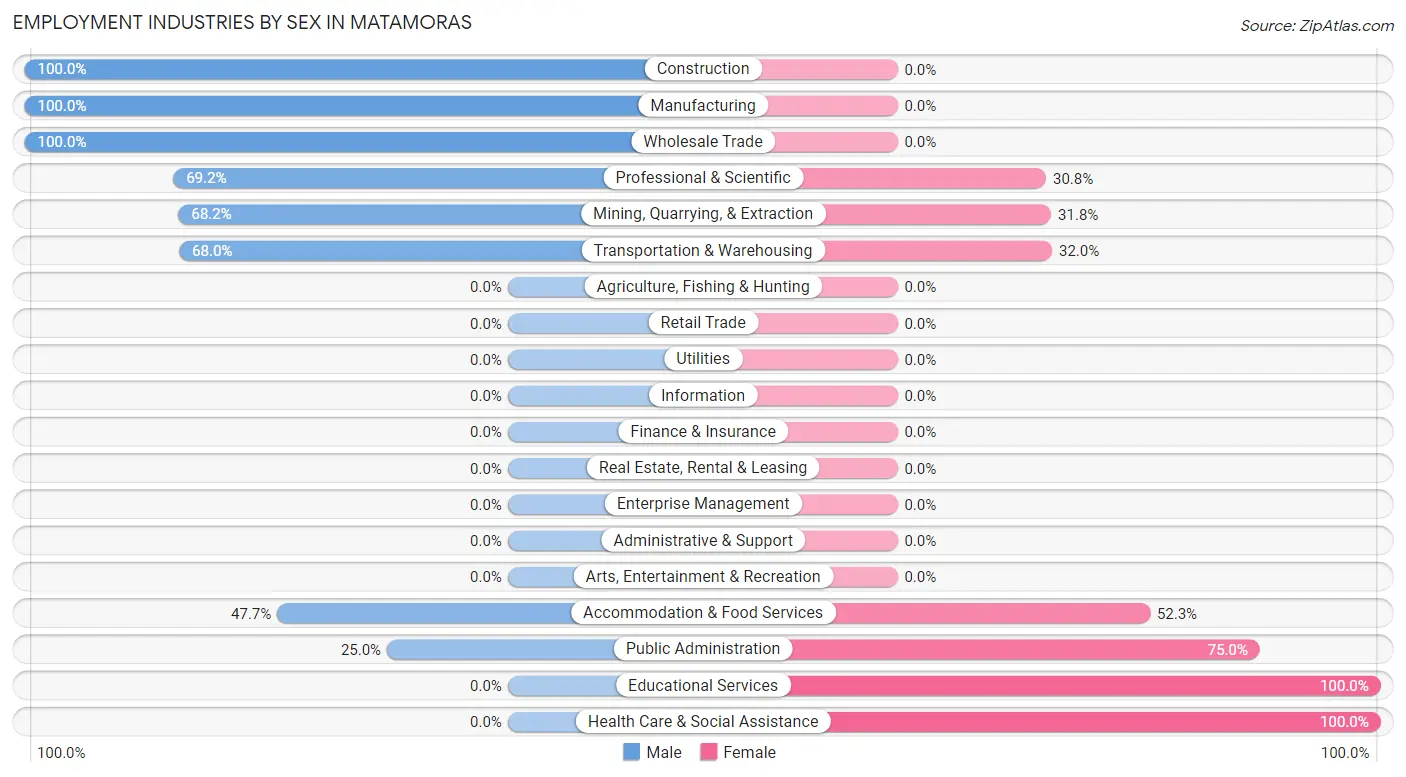
| Industry | Male | Female |
| Agriculture, Fishing & Hunting | 0 (0.0%) | 0 (0.0%) |
| Mining, Quarrying, & Extraction | 15 (68.2%) | 7 (31.8%) |
| Construction | 7 (100.0%) | 0 (0.0%) |
| Manufacturing | 80 (100.0%) | 0 (0.0%) |
| Wholesale Trade | 3 (100.0%) | 0 (0.0%) |
| Retail Trade | 0 (0.0%) | 0 (0.0%) |
| Transportation & Warehousing | 17 (68.0%) | 8 (32.0%) |
| Utilities | 0 (0.0%) | 0 (0.0%) |
| Information | 0 (0.0%) | 0 (0.0%) |
| Finance & Insurance | 0 (0.0%) | 0 (0.0%) |
| Real Estate, Rental & Leasing | 0 (0.0%) | 0 (0.0%) |
| Professional & Scientific | 9 (69.2%) | 4 (30.8%) |
| Enterprise Management | 0 (0.0%) | 0 (0.0%) |
| Administrative & Support | 0 (0.0%) | 0 (0.0%) |
| Educational Services | 0 (0.0%) | 27 (100.0%) |
| Health Care & Social Assistance | 0 (0.0%) | 26 (100.0%) |
| Arts, Entertainment & Recreation | 0 (0.0%) | 0 (0.0%) |
| Accommodation & Food Services | 21 (47.7%) | 23 (52.3%) |
| Public Administration | 4 (25.0%) | 12 (75.0%) |
| Total | 159 (57.4%) | 118 (42.6%) |
Education in Matamoras
School Enrollment in Matamoras
The most common levels of schooling among the 384 students in Matamoras are middle school (145 | 37.8%), elementary school (127 | 33.1%), and high school (60 | 15.6%).
| School Level | # Students | % Students |
| Nursery / Preschool | 18 | 4.7% |
| Kindergarten | 28 | 7.3% |
| Elementary School | 127 | 33.1% |
| Middle School | 145 | 37.8% |
| High School | 60 | 15.6% |
| College / Undergraduate | 6 | 1.6% |
| Graduate / Professional | 0 | 0.0% |
| Total | 384 | 100.0% |
School Enrollment by Age by Funding Source in Matamoras
Out of a total of 384 students who are enrolled in schools in Matamoras, 5 (1.3%) attend a private institution, while the remaining 379 (98.7%) are enrolled in public schools. The age group of 5 to 9 year old has the highest likelihood of being enrolled in private schools, with 5 (3.3% in the age bracket) enrolled. Conversely, the age group of 3 to 4 year olds has the lowest likelihood of being enrolled in a private school, with 4 (100.0% in the age bracket) attending a public institution.
| Age Bracket | Public School | Private School |
| 3 to 4 Year Olds | 4 (100.0%) | 0 (0.0%) |
| 5 to 9 Year Old | 149 (96.8%) | 5 (3.3%) |
| 10 to 14 Year Olds | 166 (100.0%) | 0 (0.0%) |
| 15 to 17 Year Olds | 48 (100.0%) | 0 (0.0%) |
| 18 to 19 Year Olds | 6 (100.0%) | 0 (0.0%) |
| 20 to 24 Year Olds | 0 (0.0%) | 0 (0.0%) |
| 25 to 34 Year Olds | 6 (100.0%) | 0 (0.0%) |
| 35 Years and over | 0 (0.0%) | 0 (0.0%) |
| Total | 379 (98.7%) | 5 (1.3%) |
Educational Attainment by Field of Study in Matamoras
Education (15 | 48.4%), engineering (6 | 19.4%), business (5 | 16.1%), science & technology (3 | 9.7%), and social sciences (2 | 6.5%) are the most common fields of study among 31 individuals in Matamoras who have obtained a bachelor's degree or higher.
| Field of Study | # Graduates | % Graduates |
| Computers & Mathematics | 0 | 0.0% |
| Bio, Nature & Agricultural | 0 | 0.0% |
| Physical & Health Sciences | 0 | 0.0% |
| Psychology | 0 | 0.0% |
| Social Sciences | 2 | 6.5% |
| Engineering | 6 | 19.4% |
| Multidisciplinary Studies | 0 | 0.0% |
| Science & Technology | 3 | 9.7% |
| Business | 5 | 16.1% |
| Education | 15 | 48.4% |
| Literature & Languages | 0 | 0.0% |
| Liberal Arts & History | 0 | 0.0% |
| Visual & Performing Arts | 0 | 0.0% |
| Communications | 0 | 0.0% |
| Arts & Humanities | 0 | 0.0% |
| Total | 31 | 100.0% |
Transportation & Commute in Matamoras
Vehicle Availability by Sex in Matamoras
The most prevalent vehicle ownership categories in Matamoras are males with 3 vehicles (40, accounting for 26.7%) and females with 3 vehicles (14, making up 35.1%).
| Vehicles Available | Male | Female |
| No Vehicle | 0 (0.0%) | 11 (9.7%) |
| 1 Vehicle | 38 (25.3%) | 30 (26.3%) |
| 2 Vehicles | 37 (24.7%) | 45 (39.5%) |
| 3 Vehicles | 40 (26.7%) | 14 (12.3%) |
| 4 Vehicles | 17 (11.3%) | 5 (4.4%) |
| 5 or more Vehicles | 18 (12.0%) | 9 (7.9%) |
| Total | 150 (100.0%) | 114 (100.0%) |
Commute Time in Matamoras
The most frequently occuring commute durations in Matamoras are 45 to 59 minutes (65 commuters, 26.5%), 20 to 24 minutes (36 commuters, 14.7%), and less than 5 minutes (26 commuters, 10.6%).
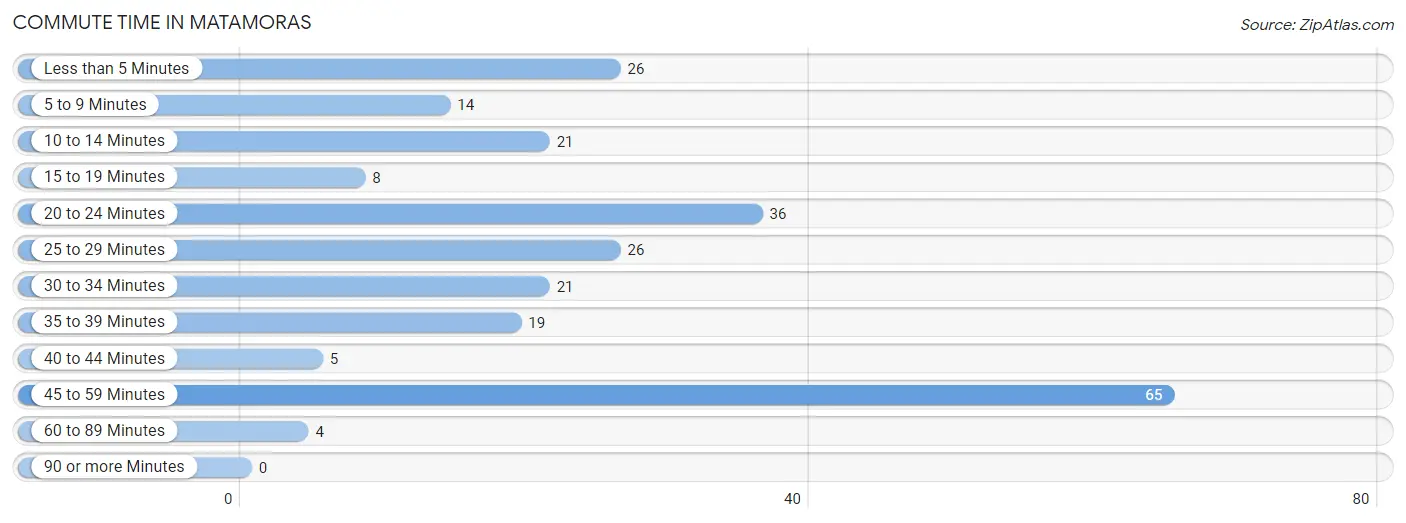
| Commute Time | # Commuters | % Commuters |
| Less than 5 Minutes | 26 | 10.6% |
| 5 to 9 Minutes | 14 | 5.7% |
| 10 to 14 Minutes | 21 | 8.6% |
| 15 to 19 Minutes | 8 | 3.3% |
| 20 to 24 Minutes | 36 | 14.7% |
| 25 to 29 Minutes | 26 | 10.6% |
| 30 to 34 Minutes | 21 | 8.6% |
| 35 to 39 Minutes | 19 | 7.8% |
| 40 to 44 Minutes | 5 | 2.0% |
| 45 to 59 Minutes | 65 | 26.5% |
| 60 to 89 Minutes | 4 | 1.6% |
| 90 or more Minutes | 0 | 0.0% |
Commute Time by Sex in Matamoras
The most common commute times in Matamoras are 45 to 59 minutes (48 commuters, 35.6%) for males and 10 to 14 minutes (21 commuters, 19.1%) for females.
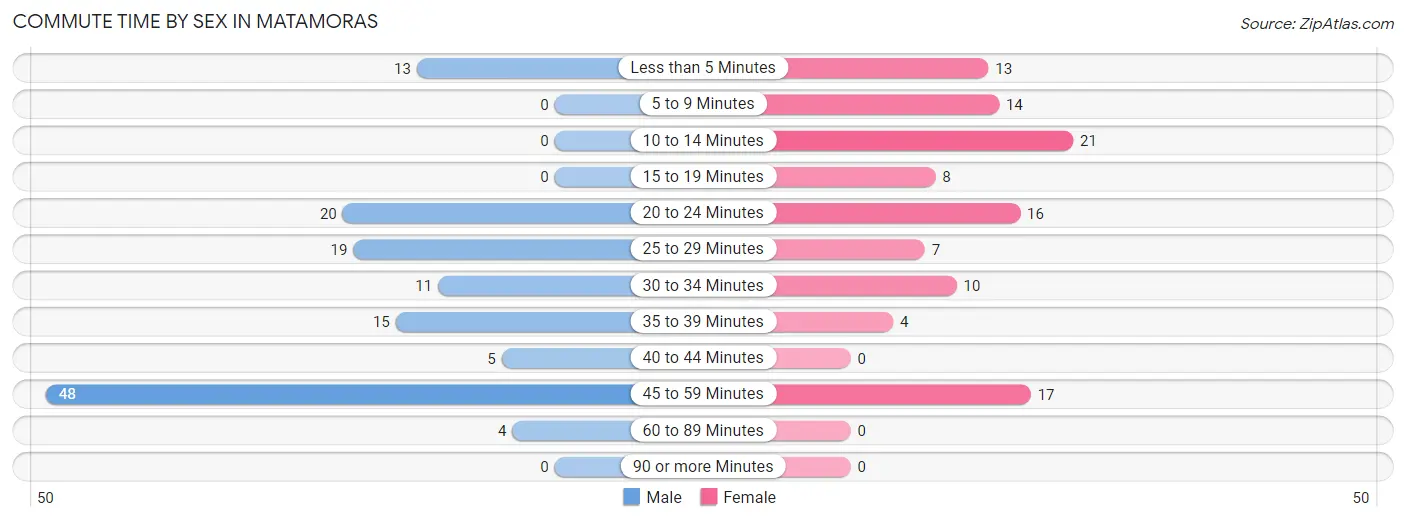
| Commute Time | Male | Female |
| Less than 5 Minutes | 13 (9.6%) | 13 (11.8%) |
| 5 to 9 Minutes | 0 (0.0%) | 14 (12.7%) |
| 10 to 14 Minutes | 0 (0.0%) | 21 (19.1%) |
| 15 to 19 Minutes | 0 (0.0%) | 8 (7.3%) |
| 20 to 24 Minutes | 20 (14.8%) | 16 (14.5%) |
| 25 to 29 Minutes | 19 (14.1%) | 7 (6.4%) |
| 30 to 34 Minutes | 11 (8.2%) | 10 (9.1%) |
| 35 to 39 Minutes | 15 (11.1%) | 4 (3.6%) |
| 40 to 44 Minutes | 5 (3.7%) | 0 (0.0%) |
| 45 to 59 Minutes | 48 (35.6%) | 17 (15.4%) |
| 60 to 89 Minutes | 4 (3.0%) | 0 (0.0%) |
| 90 or more Minutes | 0 (0.0%) | 0 (0.0%) |
Time of Departure to Work by Sex in Matamoras
The most frequent times of departure to work in Matamoras are 6:00 AM to 6:29 AM (39, 28.9%) for males and 12:00 PM to 3:59 PM (25, 22.7%) for females.
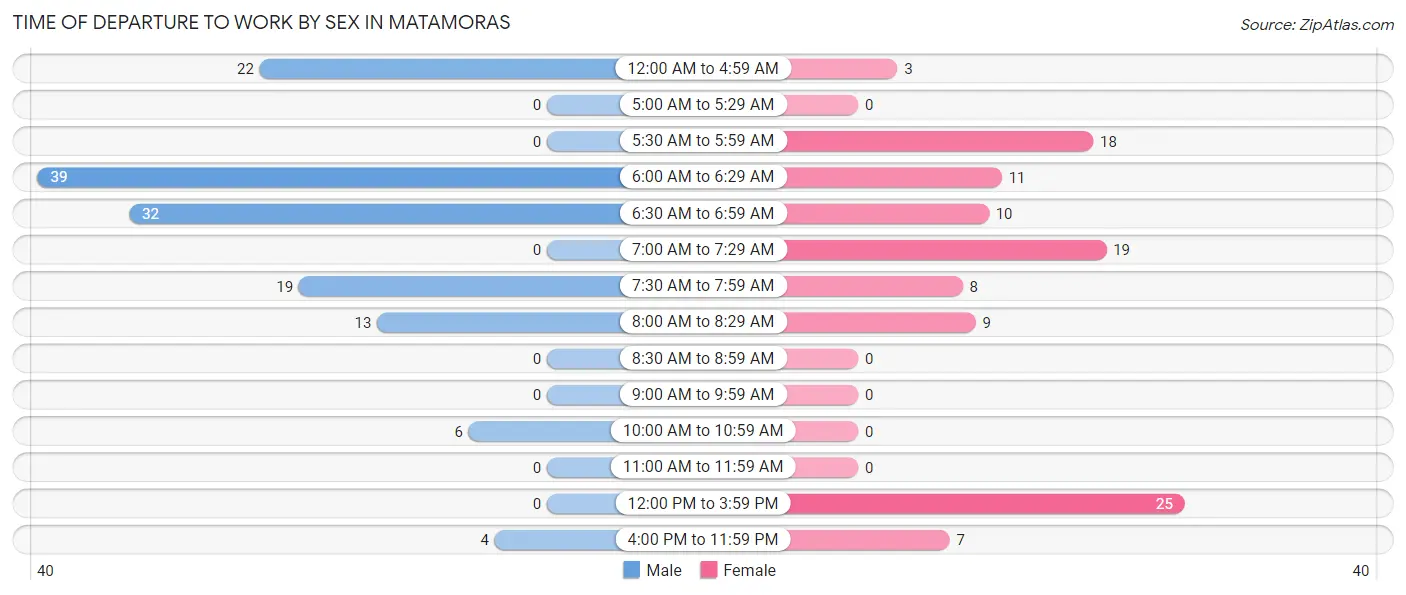
| Time of Departure | Male | Female |
| 12:00 AM to 4:59 AM | 22 (16.3%) | 3 (2.7%) |
| 5:00 AM to 5:29 AM | 0 (0.0%) | 0 (0.0%) |
| 5:30 AM to 5:59 AM | 0 (0.0%) | 18 (16.4%) |
| 6:00 AM to 6:29 AM | 39 (28.9%) | 11 (10.0%) |
| 6:30 AM to 6:59 AM | 32 (23.7%) | 10 (9.1%) |
| 7:00 AM to 7:29 AM | 0 (0.0%) | 19 (17.3%) |
| 7:30 AM to 7:59 AM | 19 (14.1%) | 8 (7.3%) |
| 8:00 AM to 8:29 AM | 13 (9.6%) | 9 (8.2%) |
| 8:30 AM to 8:59 AM | 0 (0.0%) | 0 (0.0%) |
| 9:00 AM to 9:59 AM | 0 (0.0%) | 0 (0.0%) |
| 10:00 AM to 10:59 AM | 6 (4.4%) | 0 (0.0%) |
| 11:00 AM to 11:59 AM | 0 (0.0%) | 0 (0.0%) |
| 12:00 PM to 3:59 PM | 0 (0.0%) | 25 (22.7%) |
| 4:00 PM to 11:59 PM | 4 (3.0%) | 7 (6.4%) |
| Total | 135 (100.0%) | 110 (100.0%) |
Housing Occupancy in Matamoras
Occupancy by Ownership in Matamoras
Of the total 453 dwellings in Matamoras, owner-occupied units account for 168 (37.1%), while renter-occupied units make up 285 (62.9%).
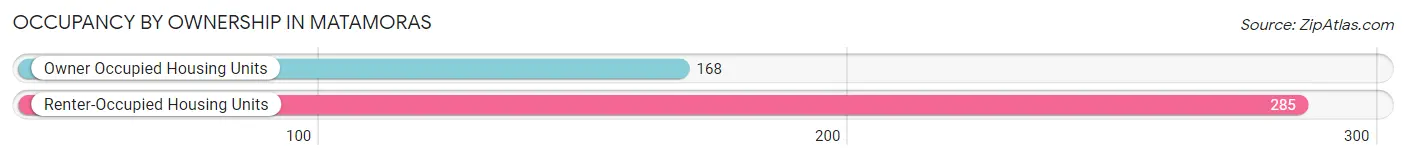
| Occupancy | # Housing Units | % Housing Units |
| Owner Occupied Housing Units | 168 | 37.1% |
| Renter-Occupied Housing Units | 285 | 62.9% |
| Total Occupied Housing Units | 453 | 100.0% |
Occupancy by Household Size in Matamoras
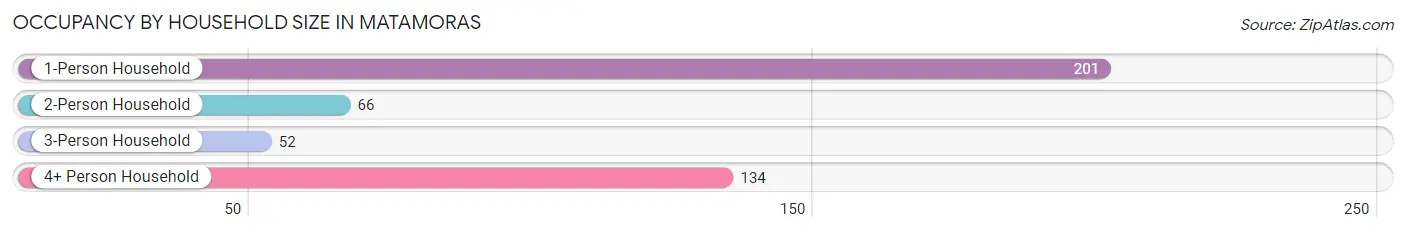
| Household Size | # Housing Units | % Housing Units |
| 1-Person Household | 201 | 44.4% |
| 2-Person Household | 66 | 14.6% |
| 3-Person Household | 52 | 11.5% |
| 4+ Person Household | 134 | 29.6% |
| Total Housing Units | 453 | 100.0% |
Occupancy by Ownership by Household Size in Matamoras
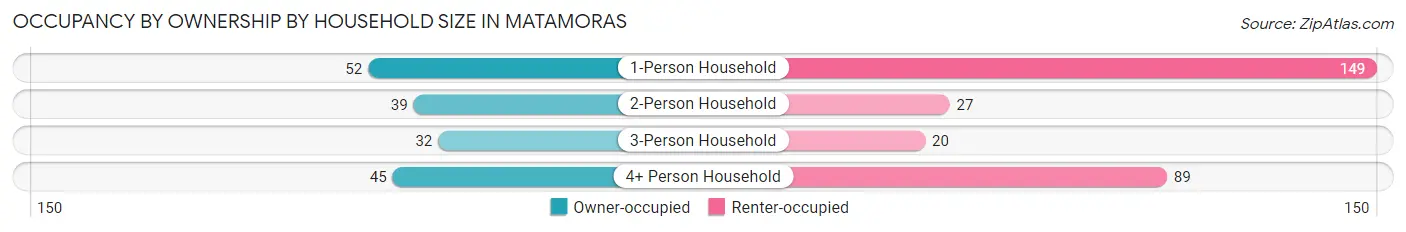
| Household Size | Owner-occupied | Renter-occupied |
| 1-Person Household | 52 (25.9%) | 149 (74.1%) |
| 2-Person Household | 39 (59.1%) | 27 (40.9%) |
| 3-Person Household | 32 (61.5%) | 20 (38.5%) |
| 4+ Person Household | 45 (33.6%) | 89 (66.4%) |
| Total Housing Units | 168 (37.1%) | 285 (62.9%) |
Occupancy by Educational Attainment in Matamoras
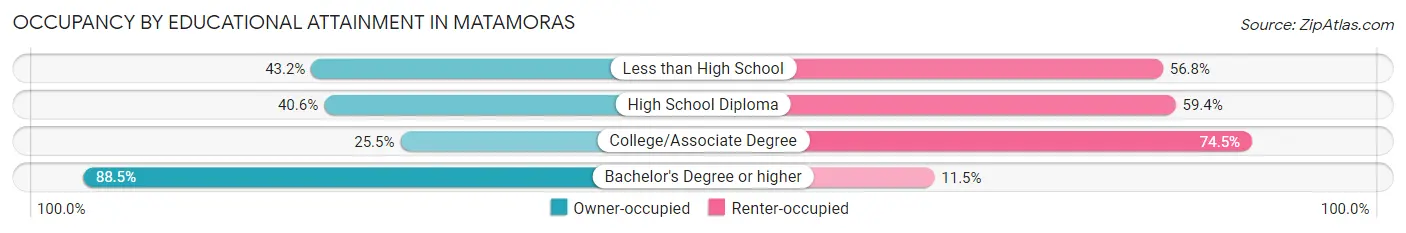
| Household Size | Owner-occupied | Renter-occupied |
| Less than High School | 19 (43.2%) | 25 (56.8%) |
| High School Diploma | 76 (40.6%) | 111 (59.4%) |
| College/Associate Degree | 50 (25.5%) | 146 (74.5%) |
| Bachelor's Degree or higher | 23 (88.5%) | 3 (11.5%) |
Occupancy by Age of Householder in Matamoras
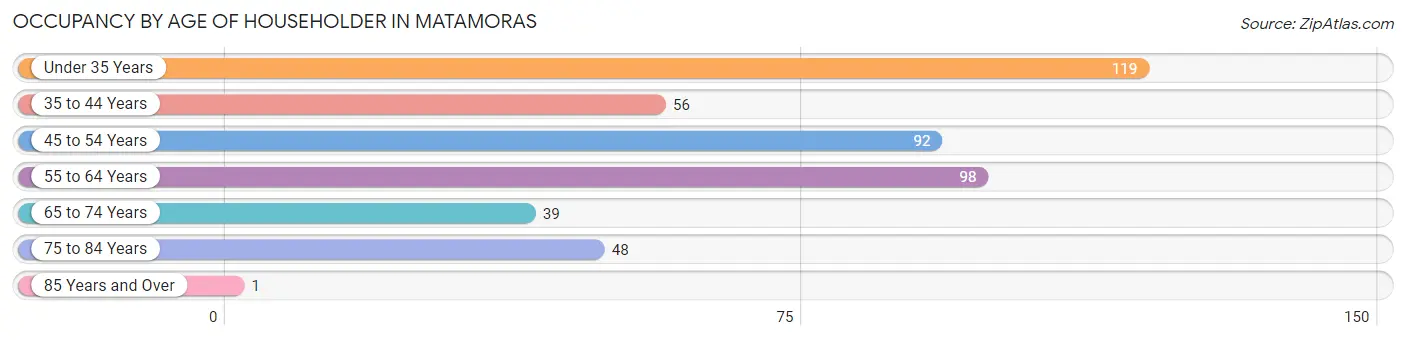
| Age Bracket | # Households | % Households |
| Under 35 Years | 119 | 26.3% |
| 35 to 44 Years | 56 | 12.4% |
| 45 to 54 Years | 92 | 20.3% |
| 55 to 64 Years | 98 | 21.6% |
| 65 to 74 Years | 39 | 8.6% |
| 75 to 84 Years | 48 | 10.6% |
| 85 Years and Over | 1 | 0.2% |
| Total | 453 | 100.0% |
Housing Finances in Matamoras
Median Income by Occupancy in Matamoras
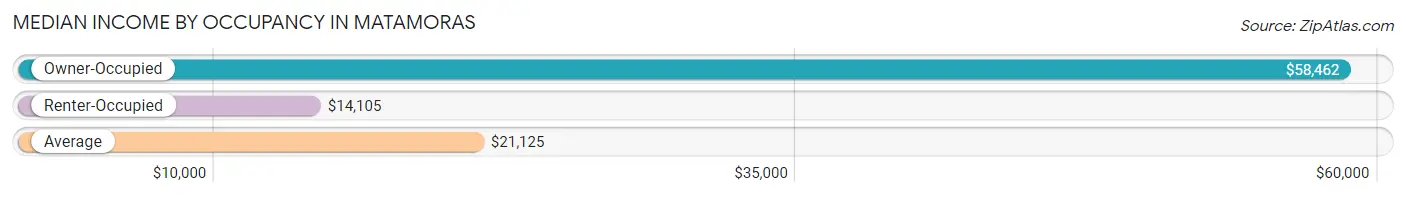
| Occupancy Type | # Households | Median Income |
| Owner-Occupied | 168 (37.1%) | $58,462 |
| Renter-Occupied | 285 (62.9%) | $14,105 |
| Average | 453 (100.0%) | $21,125 |
Occupancy by Householder Income Bracket in Matamoras
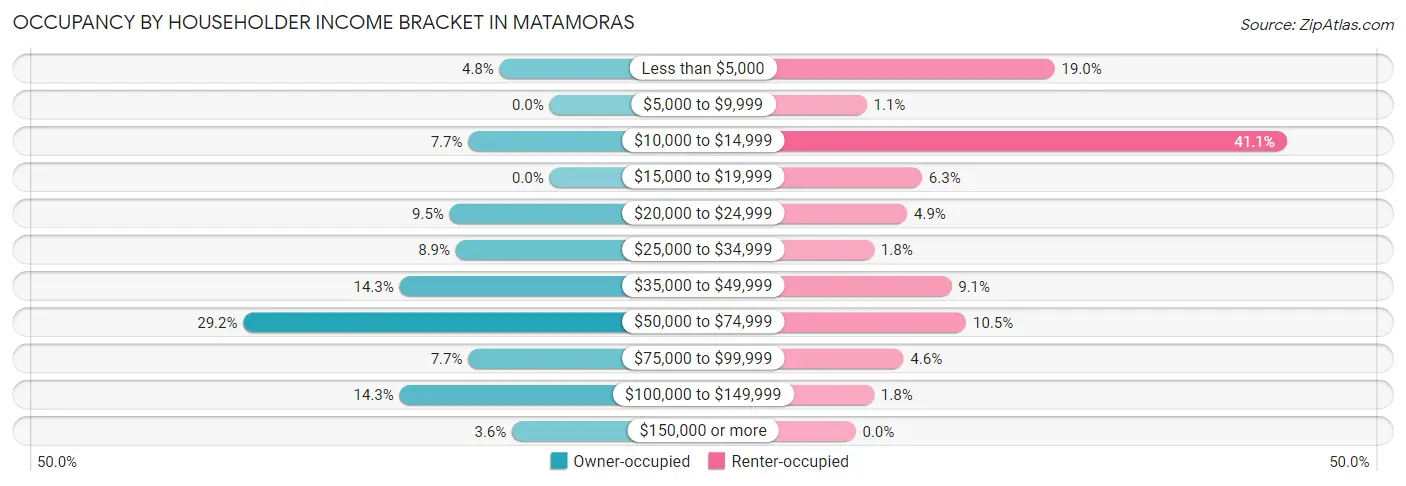
| Income Bracket | Owner-occupied | Renter-occupied |
| Less than $5,000 | 8 (4.8%) | 54 (19.0%) |
| $5,000 to $9,999 | 0 (0.0%) | 3 (1.1%) |
| $10,000 to $14,999 | 13 (7.7%) | 117 (41.0%) |
| $15,000 to $19,999 | 0 (0.0%) | 18 (6.3%) |
| $20,000 to $24,999 | 16 (9.5%) | 14 (4.9%) |
| $25,000 to $34,999 | 15 (8.9%) | 5 (1.8%) |
| $35,000 to $49,999 | 24 (14.3%) | 26 (9.1%) |
| $50,000 to $74,999 | 49 (29.2%) | 30 (10.5%) |
| $75,000 to $99,999 | 13 (7.7%) | 13 (4.6%) |
| $100,000 to $149,999 | 24 (14.3%) | 5 (1.8%) |
| $150,000 or more | 6 (3.6%) | 0 (0.0%) |
| Total | 168 (100.0%) | 285 (100.0%) |
Monthly Housing Cost Tiers in Matamoras
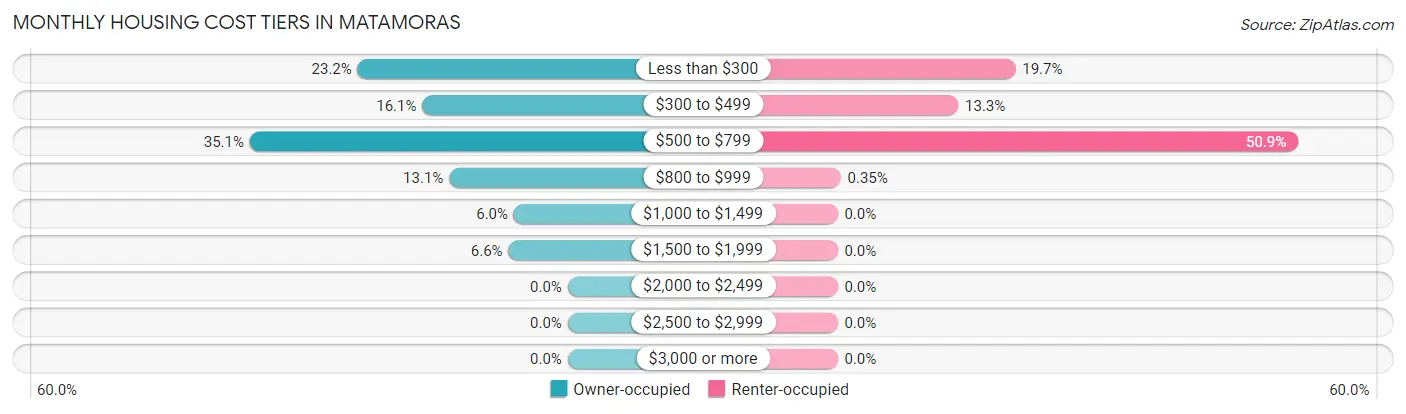
| Monthly Cost | Owner-occupied | Renter-occupied |
| Less than $300 | 39 (23.2%) | 56 (19.7%) |
| $300 to $499 | 27 (16.1%) | 38 (13.3%) |
| $500 to $799 | 59 (35.1%) | 145 (50.9%) |
| $800 to $999 | 22 (13.1%) | 1 (0.4%) |
| $1,000 to $1,499 | 10 (5.9%) | 0 (0.0%) |
| $1,500 to $1,999 | 11 (6.6%) | 0 (0.0%) |
| $2,000 to $2,499 | 0 (0.0%) | 0 (0.0%) |
| $2,500 to $2,999 | 0 (0.0%) | 0 (0.0%) |
| $3,000 or more | 0 (0.0%) | 0 (0.0%) |
| Total | 168 (100.0%) | 285 (100.0%) |
Physical Housing Characteristics in Matamoras
Housing Structures in Matamoras
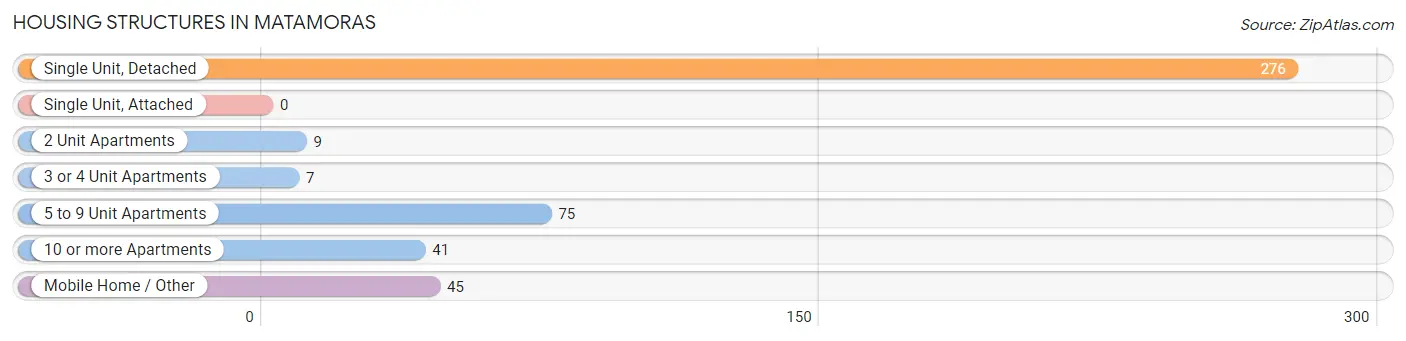
| Structure Type | # Housing Units | % Housing Units |
| Single Unit, Detached | 276 | 60.9% |
| Single Unit, Attached | 0 | 0.0% |
| 2 Unit Apartments | 9 | 2.0% |
| 3 or 4 Unit Apartments | 7 | 1.5% |
| 5 to 9 Unit Apartments | 75 | 16.6% |
| 10 or more Apartments | 41 | 9.0% |
| Mobile Home / Other | 45 | 9.9% |
| Total | 453 | 100.0% |
Housing Structures by Occupancy in Matamoras
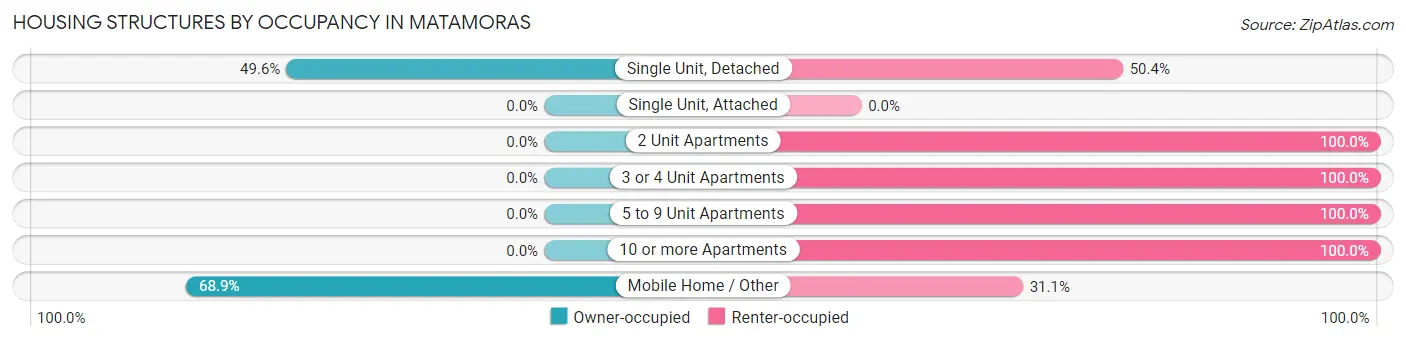
| Structure Type | Owner-occupied | Renter-occupied |
| Single Unit, Detached | 137 (49.6%) | 139 (50.4%) |
| Single Unit, Attached | 0 (0.0%) | 0 (0.0%) |
| 2 Unit Apartments | 0 (0.0%) | 9 (100.0%) |
| 3 or 4 Unit Apartments | 0 (0.0%) | 7 (100.0%) |
| 5 to 9 Unit Apartments | 0 (0.0%) | 75 (100.0%) |
| 10 or more Apartments | 0 (0.0%) | 41 (100.0%) |
| Mobile Home / Other | 31 (68.9%) | 14 (31.1%) |
| Total | 168 (37.1%) | 285 (62.9%) |
Housing Structures by Number of Rooms in Matamoras
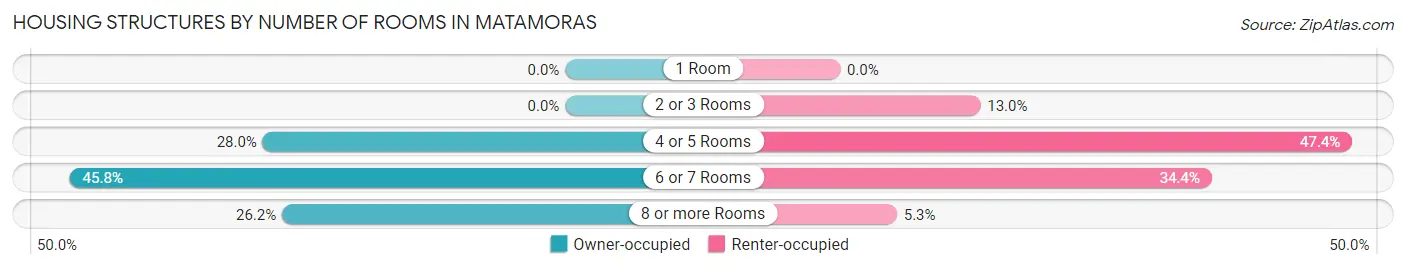
| Number of Rooms | Owner-occupied | Renter-occupied |
| 1 Room | 0 (0.0%) | 0 (0.0%) |
| 2 or 3 Rooms | 0 (0.0%) | 37 (13.0%) |
| 4 or 5 Rooms | 47 (28.0%) | 135 (47.4%) |
| 6 or 7 Rooms | 77 (45.8%) | 98 (34.4%) |
| 8 or more Rooms | 44 (26.2%) | 15 (5.3%) |
| Total | 168 (100.0%) | 285 (100.0%) |
Housing Structure by Heating Type in Matamoras
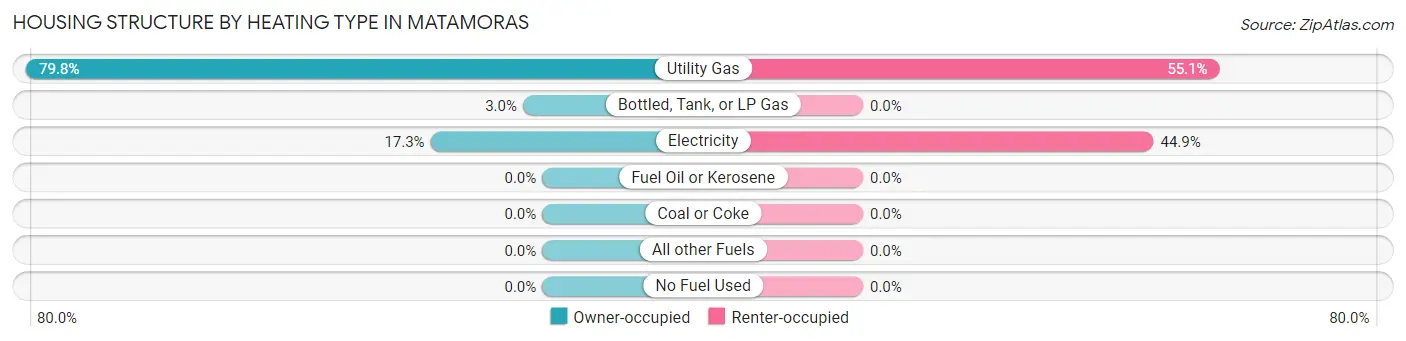
| Heating Type | Owner-occupied | Renter-occupied |
| Utility Gas | 134 (79.8%) | 157 (55.1%) |
| Bottled, Tank, or LP Gas | 5 (3.0%) | 0 (0.0%) |
| Electricity | 29 (17.3%) | 128 (44.9%) |
| Fuel Oil or Kerosene | 0 (0.0%) | 0 (0.0%) |
| Coal or Coke | 0 (0.0%) | 0 (0.0%) |
| All other Fuels | 0 (0.0%) | 0 (0.0%) |
| No Fuel Used | 0 (0.0%) | 0 (0.0%) |
| Total | 168 (100.0%) | 285 (100.0%) |
Household Vehicle Usage in Matamoras
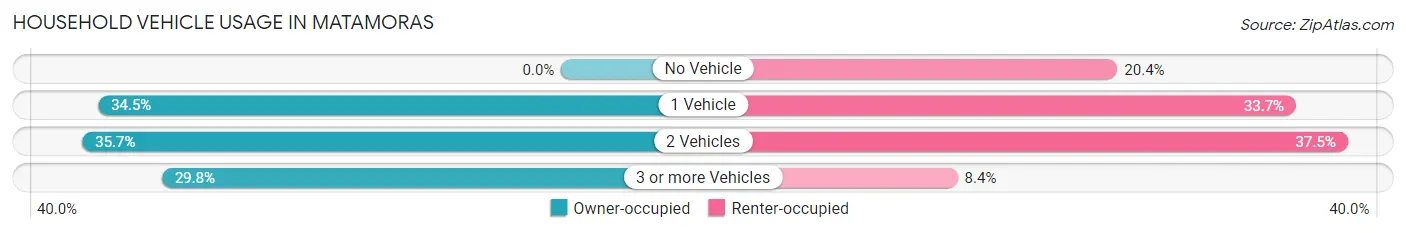
| Vehicles per Household | Owner-occupied | Renter-occupied |
| No Vehicle | 0 (0.0%) | 58 (20.3%) |
| 1 Vehicle | 58 (34.5%) | 96 (33.7%) |
| 2 Vehicles | 60 (35.7%) | 107 (37.5%) |
| 3 or more Vehicles | 50 (29.8%) | 24 (8.4%) |
| Total | 168 (100.0%) | 285 (100.0%) |
Real Estate & Mortgages in Matamoras
Real Estate and Mortgage Overview in Matamoras
| Characteristic | Without Mortgage | With Mortgage |
| Housing Units | 94 | 74 |
| Median Property Value | $112,500 | $92,900 |
| Median Household Income | $36,667 | $6 |
| Monthly Housing Costs | $407 | $0 |
| Real Estate Taxes | $944 | $0 |
Property Value by Mortgage Status in Matamoras
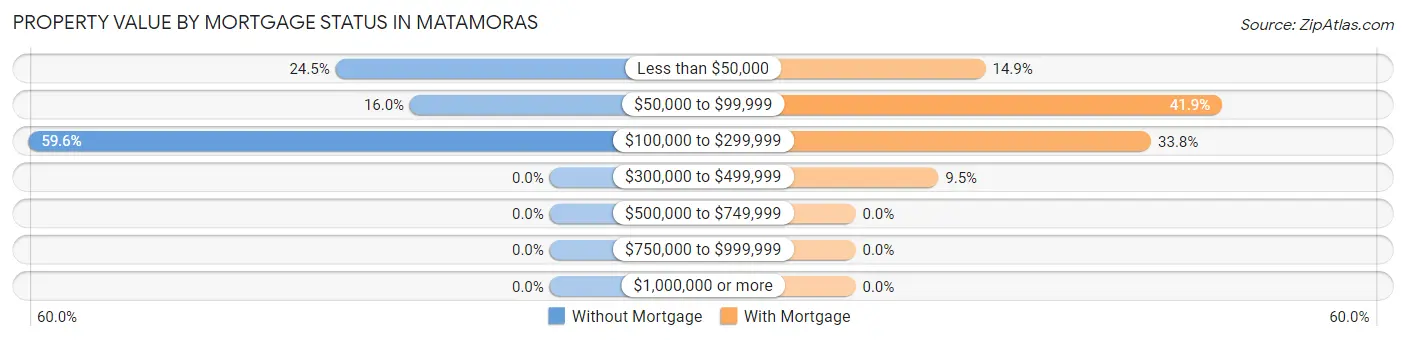
| Property Value | Without Mortgage | With Mortgage |
| Less than $50,000 | 23 (24.5%) | 11 (14.9%) |
| $50,000 to $99,999 | 15 (16.0%) | 31 (41.9%) |
| $100,000 to $299,999 | 56 (59.6%) | 25 (33.8%) |
| $300,000 to $499,999 | 0 (0.0%) | 7 (9.5%) |
| $500,000 to $749,999 | 0 (0.0%) | 0 (0.0%) |
| $750,000 to $999,999 | 0 (0.0%) | 0 (0.0%) |
| $1,000,000 or more | 0 (0.0%) | 0 (0.0%) |
| Total | 94 (100.0%) | 74 (100.0%) |
Household Income by Mortgage Status in Matamoras
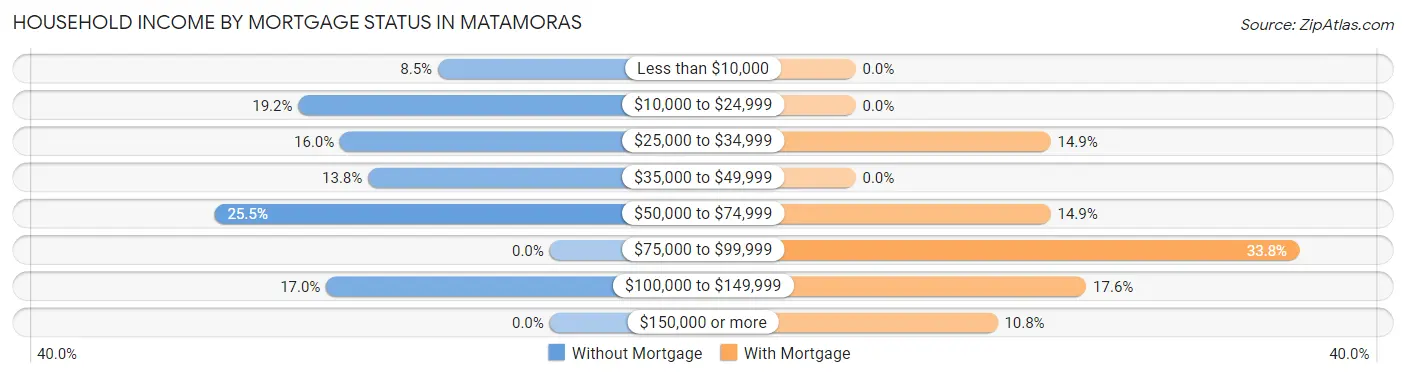
| Household Income | Without Mortgage | With Mortgage |
| Less than $10,000 | 8 (8.5%) | 0 (0.0%) |
| $10,000 to $24,999 | 18 (19.2%) | 0 (0.0%) |
| $25,000 to $34,999 | 15 (16.0%) | 11 (14.9%) |
| $35,000 to $49,999 | 13 (13.8%) | 0 (0.0%) |
| $50,000 to $74,999 | 24 (25.5%) | 11 (14.9%) |
| $75,000 to $99,999 | 0 (0.0%) | 25 (33.8%) |
| $100,000 to $149,999 | 16 (17.0%) | 13 (17.6%) |
| $150,000 or more | 0 (0.0%) | 8 (10.8%) |
| Total | 94 (100.0%) | 74 (100.0%) |
Property Value to Household Income Ratio in Matamoras
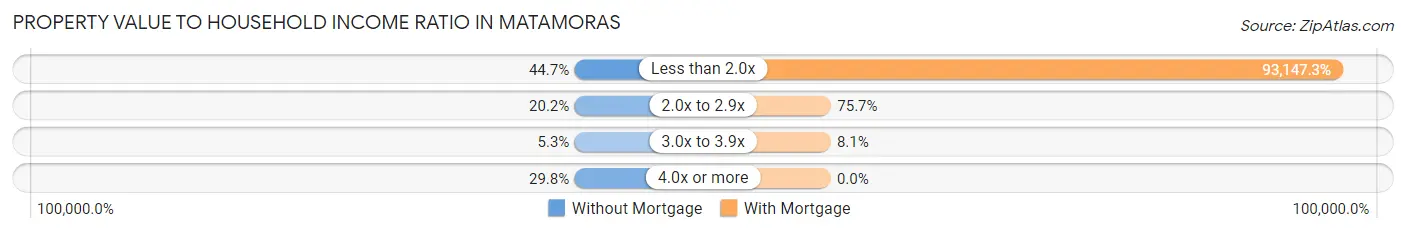
| Value-to-Income Ratio | Without Mortgage | With Mortgage |
| Less than 2.0x | 42 (44.7%) | 68,929 (93,147.3%) |
| 2.0x to 2.9x | 19 (20.2%) | 56 (75.7%) |
| 3.0x to 3.9x | 5 (5.3%) | 6 (8.1%) |
| 4.0x or more | 28 (29.8%) | 0 (0.0%) |
| Total | 94 (100.0%) | 74 (100.0%) |
Real Estate Taxes by Mortgage Status in Matamoras
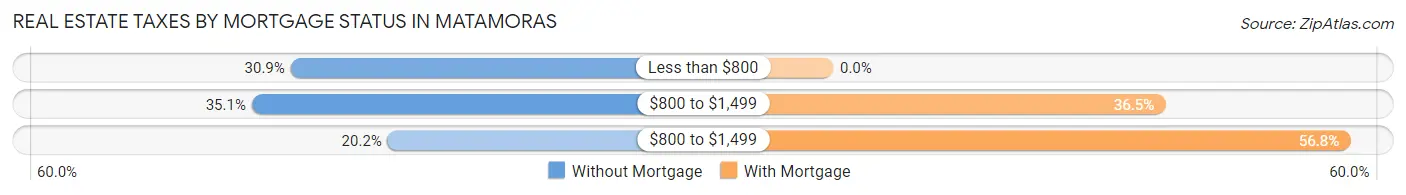
| Property Taxes | Without Mortgage | With Mortgage |
| Less than $800 | 29 (30.8%) | 0 (0.0%) |
| $800 to $1,499 | 33 (35.1%) | 27 (36.5%) |
| $800 to $1,499 | 19 (20.2%) | 42 (56.8%) |
| Total | 94 (100.0%) | 74 (100.0%) |
Health & Disability in Matamoras
Health Insurance Coverage by Age in Matamoras
| Age Bracket | With Coverage | Without Coverage |
| Under 6 Years | 92 (100.0%) | 0 (0.0%) |
| 6 to 18 Years | 329 (92.7%) | 26 (7.3%) |
| 19 to 25 Years | 64 (100.0%) | 0 (0.0%) |
| 26 to 34 Years | 143 (88.3%) | 19 (11.7%) |
| 35 to 44 Years | 105 (90.5%) | 11 (9.5%) |
| 45 to 54 Years | 101 (96.2%) | 4 (3.8%) |
| 55 to 64 Years | 121 (93.1%) | 9 (6.9%) |
| 65 to 74 Years | 70 (100.0%) | 0 (0.0%) |
| 75 Years and older | 60 (100.0%) | 0 (0.0%) |
| Total | 1,085 (94.0%) | 69 (6.0%) |
Health Insurance Coverage by Citizenship Status in Matamoras
| Citizenship Status | With Coverage | Without Coverage |
| Native Born | 92 (100.0%) | 0 (0.0%) |
| Foreign Born, Citizen | 329 (92.7%) | 26 (7.3%) |
| Foreign Born, not a Citizen | 64 (100.0%) | 0 (0.0%) |
Health Insurance Coverage by Household Income in Matamoras
| Household Income | With Coverage | Without Coverage |
| Under $25,000 | 515 (94.2%) | 32 (5.9%) |
| $25,000 to $49,999 | 124 (100.0%) | 0 (0.0%) |
| $50,000 to $74,999 | 188 (95.4%) | 9 (4.6%) |
| $75,000 to $99,999 | 52 (85.3%) | 9 (14.7%) |
| $100,000 and over | 206 (91.6%) | 19 (8.4%) |
Public vs Private Health Insurance Coverage by Age in Matamoras
| Age Bracket | Public Insurance | Private Insurance |
| Under 6 | 81 (88.0%) | 11 (12.0%) |
| 6 to 18 Years | 186 (52.4%) | 143 (40.3%) |
| 19 to 25 Years | 51 (79.7%) | 13 (20.3%) |
| 25 to 34 Years | 103 (63.6%) | 40 (24.7%) |
| 35 to 44 Years | 69 (59.5%) | 36 (31.0%) |
| 45 to 54 Years | 80 (76.2%) | 21 (20.0%) |
| 55 to 64 Years | 28 (21.5%) | 93 (71.5%) |
| 65 to 74 Years | 55 (78.6%) | 43 (61.4%) |
| 75 Years and over | 60 (100.0%) | 41 (68.3%) |
| Total | 713 (61.8%) | 441 (38.2%) |
Disability Status by Sex by Age in Matamoras
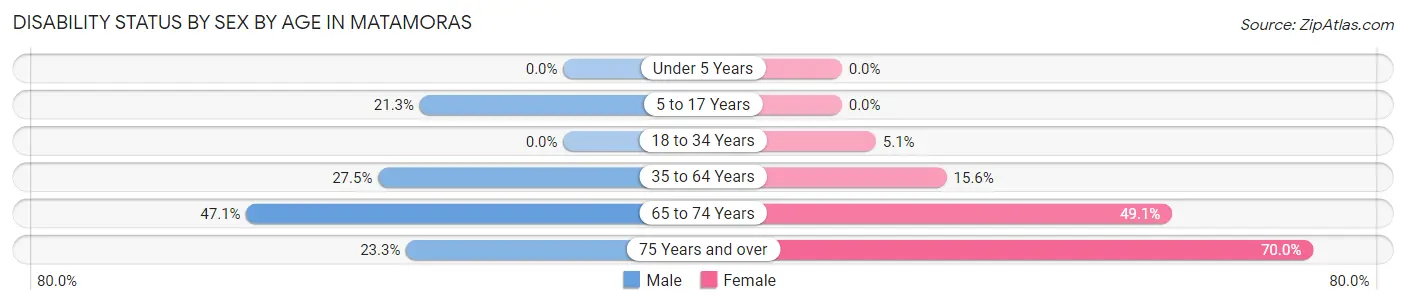
| Age Bracket | Male | Female |
| Under 5 Years | 0 (0.0%) | 0 (0.0%) |
| 5 to 17 Years | 39 (21.3%) | 0 (0.0%) |
| 18 to 34 Years | 0 (0.0%) | 8 (5.1%) |
| 35 to 64 Years | 47 (27.5%) | 28 (15.6%) |
| 65 to 74 Years | 8 (47.1%) | 26 (49.1%) |
| 75 Years and over | 7 (23.3%) | 21 (70.0%) |
Disability Class by Sex by Age in Matamoras
Disability Class: Hearing Difficulty
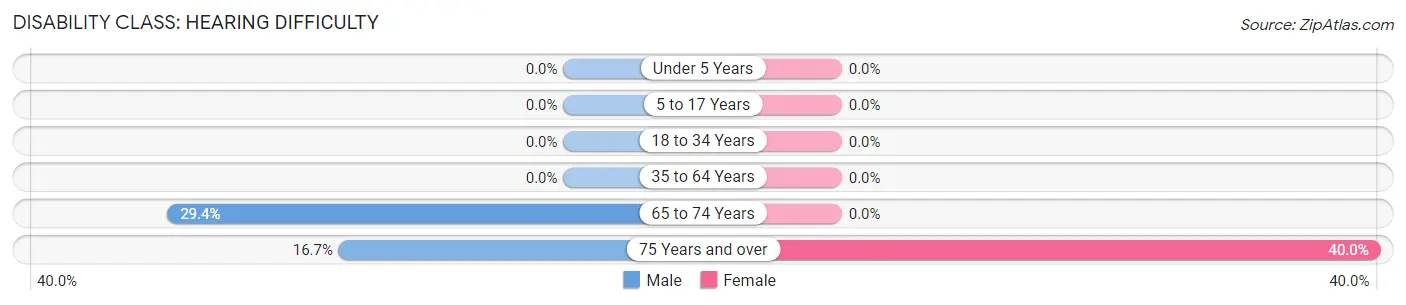
| Age Bracket | Male | Female |
| Under 5 Years | 0 (0.0%) | 0 (0.0%) |
| 5 to 17 Years | 0 (0.0%) | 0 (0.0%) |
| 18 to 34 Years | 0 (0.0%) | 0 (0.0%) |
| 35 to 64 Years | 0 (0.0%) | 0 (0.0%) |
| 65 to 74 Years | 5 (29.4%) | 0 (0.0%) |
| 75 Years and over | 5 (16.7%) | 12 (40.0%) |
Disability Class: Vision Difficulty
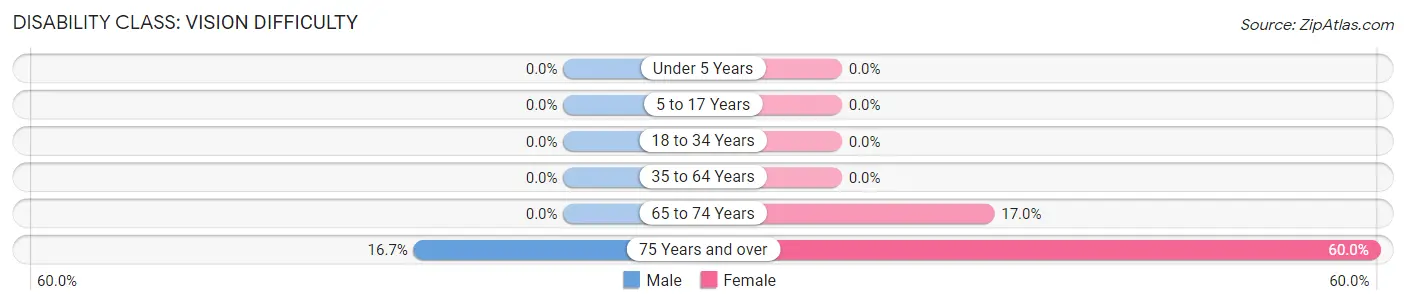
| Age Bracket | Male | Female |
| Under 5 Years | 0 (0.0%) | 0 (0.0%) |
| 5 to 17 Years | 0 (0.0%) | 0 (0.0%) |
| 18 to 34 Years | 0 (0.0%) | 0 (0.0%) |
| 35 to 64 Years | 0 (0.0%) | 0 (0.0%) |
| 65 to 74 Years | 0 (0.0%) | 9 (17.0%) |
| 75 Years and over | 5 (16.7%) | 18 (60.0%) |
Disability Class: Cognitive Difficulty
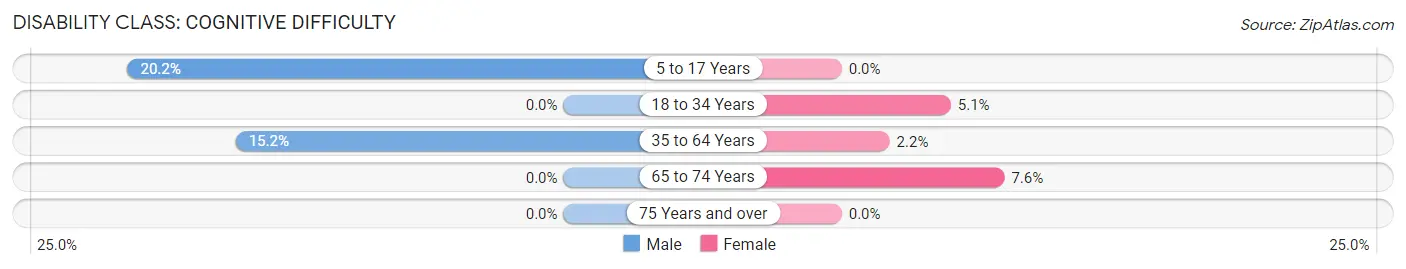
| Age Bracket | Male | Female |
| 5 to 17 Years | 37 (20.2%) | 0 (0.0%) |
| 18 to 34 Years | 0 (0.0%) | 8 (5.1%) |
| 35 to 64 Years | 26 (15.2%) | 4 (2.2%) |
| 65 to 74 Years | 0 (0.0%) | 4 (7.5%) |
| 75 Years and over | 0 (0.0%) | 0 (0.0%) |
Disability Class: Ambulatory Difficulty
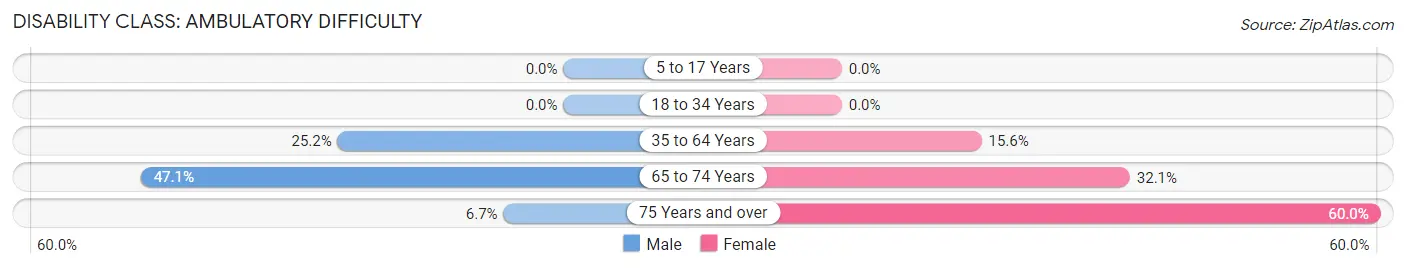
| Age Bracket | Male | Female |
| 5 to 17 Years | 0 (0.0%) | 0 (0.0%) |
| 18 to 34 Years | 0 (0.0%) | 0 (0.0%) |
| 35 to 64 Years | 43 (25.2%) | 28 (15.6%) |
| 65 to 74 Years | 8 (47.1%) | 17 (32.1%) |
| 75 Years and over | 2 (6.7%) | 18 (60.0%) |
Disability Class: Self-Care Difficulty
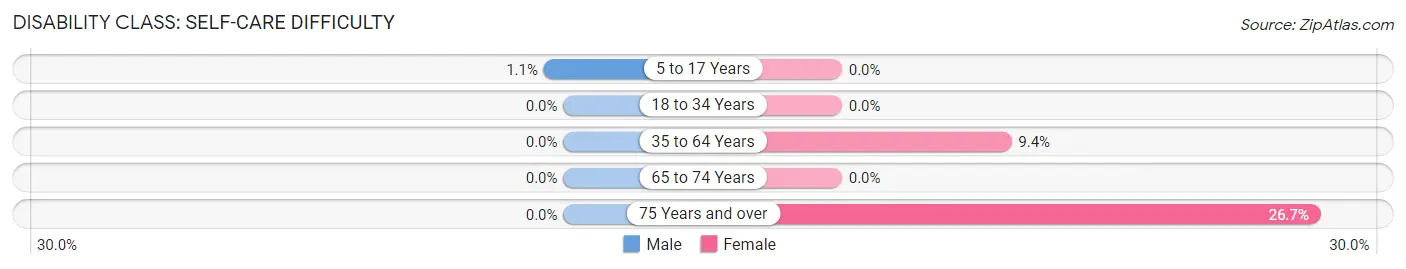
| Age Bracket | Male | Female |
| 5 to 17 Years | 2 (1.1%) | 0 (0.0%) |
| 18 to 34 Years | 0 (0.0%) | 0 (0.0%) |
| 35 to 64 Years | 0 (0.0%) | 17 (9.4%) |
| 65 to 74 Years | 0 (0.0%) | 0 (0.0%) |
| 75 Years and over | 0 (0.0%) | 8 (26.7%) |
Technology Access in Matamoras
Computing Device Access in Matamoras
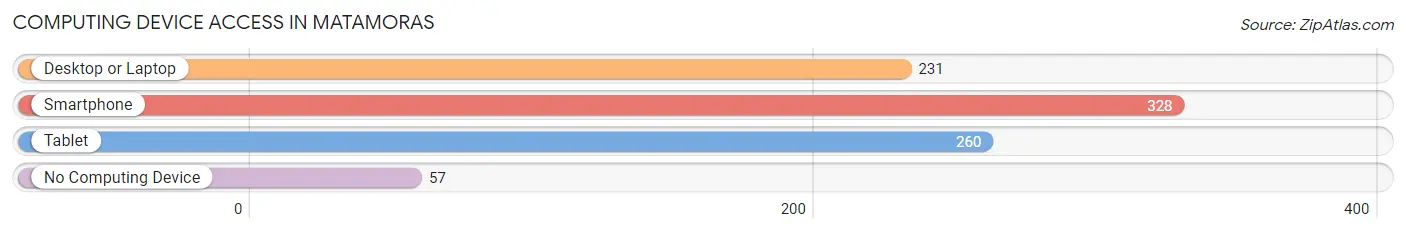
| Device Type | # Households | % Households |
| Desktop or Laptop | 231 | 51.0% |
| Smartphone | 328 | 72.4% |
| Tablet | 260 | 57.4% |
| No Computing Device | 57 | 12.6% |
| Total | 453 | 100.0% |
Internet Access in Matamoras
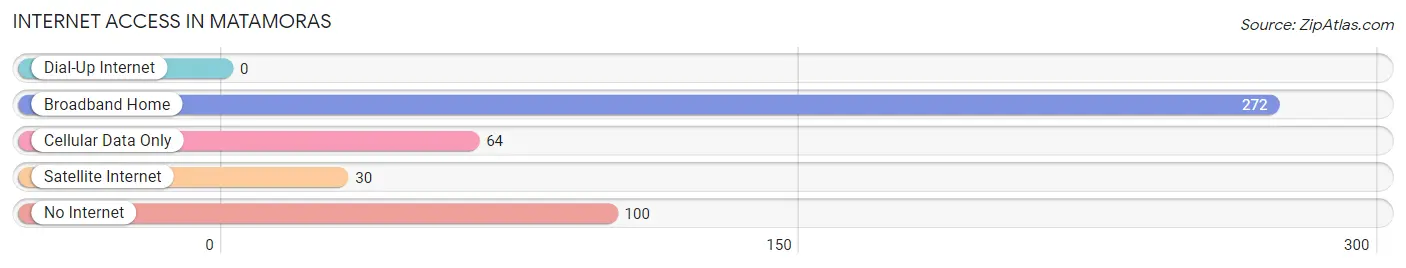
| Internet Type | # Households | % Households |
| Dial-Up Internet | 0 | 0.0% |
| Broadband Home | 272 | 60.0% |
| Cellular Data Only | 64 | 14.1% |
| Satellite Internet | 30 | 6.6% |
| No Internet | 100 | 22.1% |
| Total | 453 | 100.0% |
Matamoras Summary
Matamoras, Ohio is a small village located in the southeastern corner of Washington County, Ohio. It is situated along the Ohio River, just south of the city of Marietta. The village has a population of approximately 1,000 people and is part of the Marietta-Belpre Metropolitan Statistical Area.
History
Matamoras was founded in 1817 by a group of settlers from Pennsylvania. The village was named after the Battle of Matamoros, which was fought during the Mexican-American War. The village was originally a farming community, but it soon became a center for the lumber industry. The village was incorporated in 1837 and was home to several sawmills and gristmills.
In the late 19th century, Matamoras became a popular tourist destination. The village was home to several resorts, including the Matamoras Hotel, which was built in 1891. The hotel was a popular destination for visitors from all over the country.
In the early 20th century, Matamoras was home to several manufacturing companies, including the Matamoras Manufacturing Company, which produced furniture and other wood products. The village also had a thriving coal mining industry.
Geography
Matamoras is located in the southeastern corner of Washington County, Ohio. It is situated along the Ohio River, just south of the city of Marietta. The village is located in a rural area and is surrounded by rolling hills and farmland. The village is located approximately 30 miles south of the city of Columbus.
Economy
Matamoras is a small village with a population of approximately 1,000 people. The village is home to several small businesses, including a grocery store, a hardware store, and a few restaurants. The village also has a few manufacturing companies, including a furniture manufacturer and a coal mining company.
Demographics
As of the 2010 census, the population of Matamoras was 1,000 people. The racial makeup of the village was 97.2% White, 0.7% African American, 0.2% Native American, 0.2% Asian, 0.2% from other races, and 1.7% from two or more races. Hispanic or Latino of any race were 0.7% of the population.
The median income for a household in Matamoras was $37,500, and the median income for a family was $41,250. The per capita income for the village was $17,845. About 11.2% of families and 13.2% of the population were below the poverty line, including 16.7% of those under age 18 and 8.3% of those age 65 or over.
Common Questions
What is Per Capita Income in Matamoras?
Per Capita income in Matamoras is $17,058.
What is the Median Household income in Matamoras?
Median Household Income in Matamoras is $21,125.
What is Income or Wage Gap in Matamoras?
Income or Wage Gap in Matamoras is 23.1%.
Women in Matamoras earn 76.9 cents for every dollar earned by a man.
What is Family Income Deficit in Matamoras?
Family Income Deficit in Matamoras is $18,082.
Families that are below poverty line in Matamoras earn $18,082 less on average than the poverty threshold level.
What is Inequality or Gini Index in Matamoras?
Inequality or Gini Index in Matamoras is 0.54.
What is the Total Population of Matamoras?
Total Population of Matamoras is 1,154.
What is the Total Male Population of Matamoras?
Total Male Population of Matamoras is 536.
What is the Total Female Population of Matamoras?
Total Female Population of Matamoras is 618.
What is the Ratio of Males per 100 Females in Matamoras?
There are 86.73 Males per 100 Females in Matamoras.
What is the Ratio of Females per 100 Males in Matamoras?
There are 115.30 Females per 100 Males in Matamoras.
What is the Median Population Age in Matamoras?
Median Population Age in Matamoras is 31.1 Years.
What is the Average Family Size in Matamoras
Average Family Size in Matamoras is 3.9 People.
What is the Average Household Size in Matamoras
Average Household Size in Matamoras is 2.5 People.
How Large is the Labor Force in Matamoras?
There are 334 People in the Labor Forcein in Matamoras.
What is the Percentage of People in the Labor Force in Matamoras?
45.0% of People are in the Labor Force in Matamoras.
What is the Unemployment Rate in Matamoras?
Unemployment Rate in Matamoras is 17.1%.