Jewett, OH Map & Demographics
Jewett Map
Jewett Overview
$40,232
PER CAPITA INCOME
$55,000
AVG FAMILY INCOME
$53,068
AVG HOUSEHOLD INCOME
33.8%
WAGE / INCOME GAP [ % ]
66.2¢/ $1
WAGE / INCOME GAP [ $ ]
0.59
INEQUALITY / GINI INDEX
518
TOTAL POPULATION
284
MALE POPULATION
234
FEMALE POPULATION
121.37
MALES / 100 FEMALES
82.39
FEMALES / 100 MALES
39.5
MEDIAN AGE
3.0
AVG FAMILY SIZE
2.4
AVG HOUSEHOLD SIZE
220
LABOR FORCE [ PEOPLE ]
52.8%
PERCENT IN LABOR FORCE
10.5%
UNEMPLOYMENT RATE
Jewett Zip Codes
Jewett Area Codes
Income in Jewett
Income Overview in Jewett
Per Capita Income in Jewett is $40,232, while median incomes of families and households are $55,000 and $53,068 respectively.
| Characteristic | Number | Measure |
| Per Capita Income | 518 | $40,232 |
| Median Family Income | 132 | $55,000 |
| Mean Family Income | 132 | $62,823 |
| Median Household Income | 220 | $53,068 |
| Mean Household Income | 220 | $93,342 |
| Income Deficit | 132 | $0 |
| Wage / Income Gap (%) | 518 | 33.79% |
| Wage / Income Gap ($) | 518 | 66.21¢ per $1 |
| Gini / Inequality Index | 518 | 0.59 |
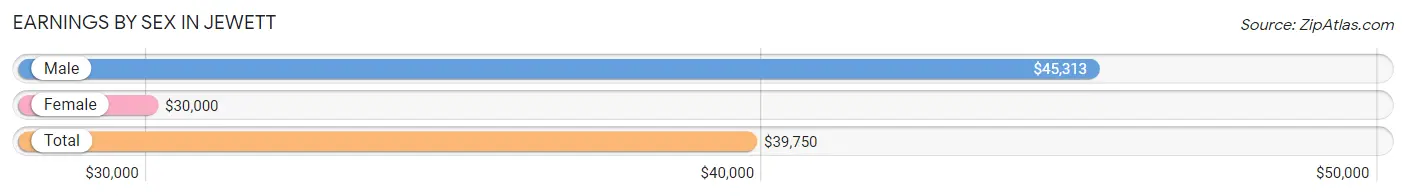
Earnings by Sex in Jewett
Average Earnings in Jewett are $39,750, $45,313 for men and $30,000 for women, a difference of 33.8%.
| Sex | Number | Average Earnings |
| Male | 129 (57.9%) | $45,313 |
| Female | 94 (42.1%) | $30,000 |
| Total | 223 (100.0%) | $39,750 |
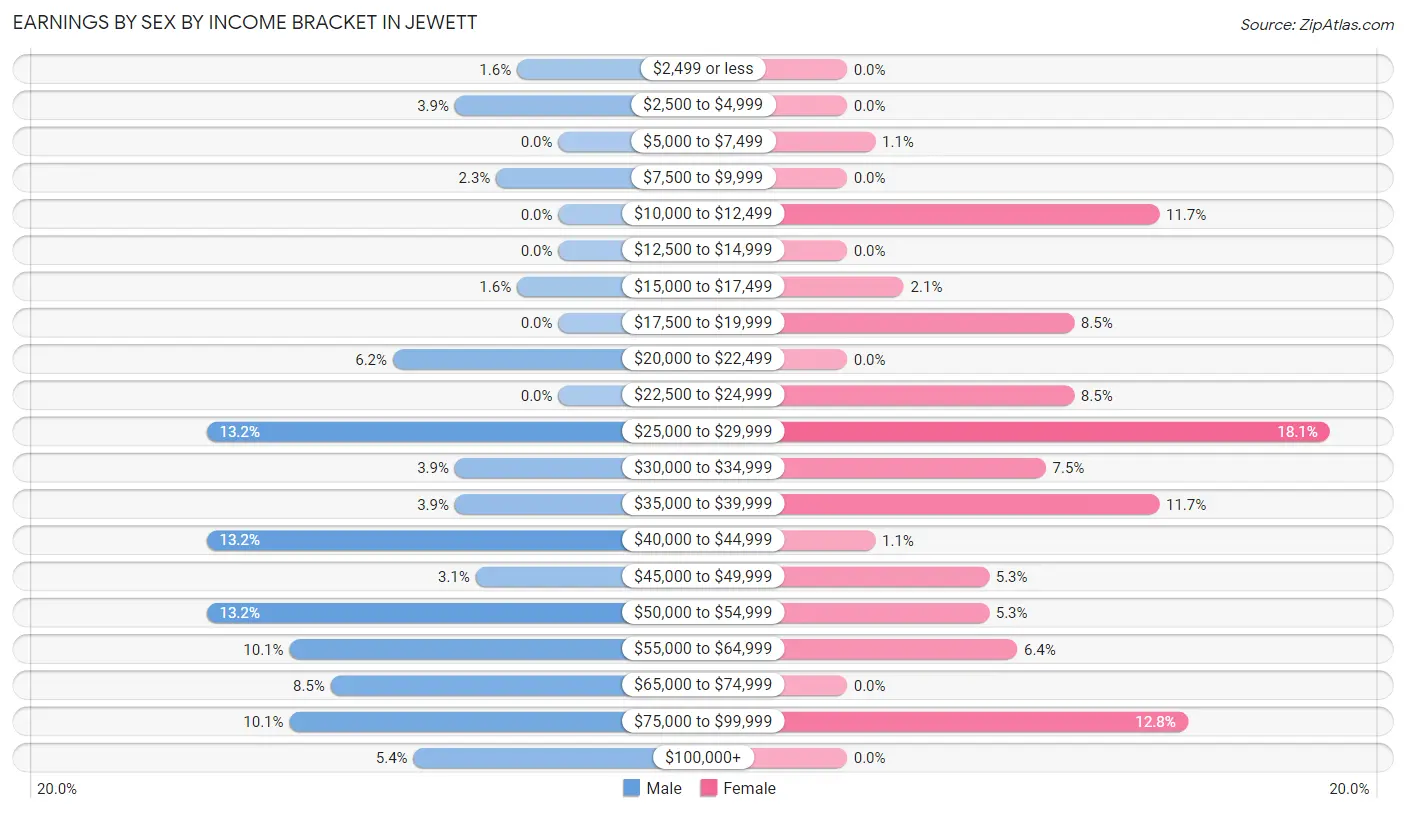
Earnings by Sex by Income Bracket in Jewett
The most common earnings brackets in Jewett are $25,000 to $29,999 for men (17 | 13.2%) and $25,000 to $29,999 for women (17 | 18.1%).
| Income | Male | Female |
| $2,499 or less | 2 (1.5%) | 0 (0.0%) |
| $2,500 to $4,999 | 5 (3.9%) | 0 (0.0%) |
| $5,000 to $7,499 | 0 (0.0%) | 1 (1.1%) |
| $7,500 to $9,999 | 3 (2.3%) | 0 (0.0%) |
| $10,000 to $12,499 | 0 (0.0%) | 11 (11.7%) |
| $12,500 to $14,999 | 0 (0.0%) | 0 (0.0%) |
| $15,000 to $17,499 | 2 (1.5%) | 2 (2.1%) |
| $17,500 to $19,999 | 0 (0.0%) | 8 (8.5%) |
| $20,000 to $22,499 | 8 (6.2%) | 0 (0.0%) |
| $22,500 to $24,999 | 0 (0.0%) | 8 (8.5%) |
| $25,000 to $29,999 | 17 (13.2%) | 17 (18.1%) |
| $30,000 to $34,999 | 5 (3.9%) | 7 (7.4%) |
| $35,000 to $39,999 | 5 (3.9%) | 11 (11.7%) |
| $40,000 to $44,999 | 17 (13.2%) | 1 (1.1%) |
| $45,000 to $49,999 | 4 (3.1%) | 5 (5.3%) |
| $50,000 to $54,999 | 17 (13.2%) | 5 (5.3%) |
| $55,000 to $64,999 | 13 (10.1%) | 6 (6.4%) |
| $65,000 to $74,999 | 11 (8.5%) | 0 (0.0%) |
| $75,000 to $99,999 | 13 (10.1%) | 12 (12.8%) |
| $100,000+ | 7 (5.4%) | 0 (0.0%) |
| Total | 129 (100.0%) | 94 (100.0%) |
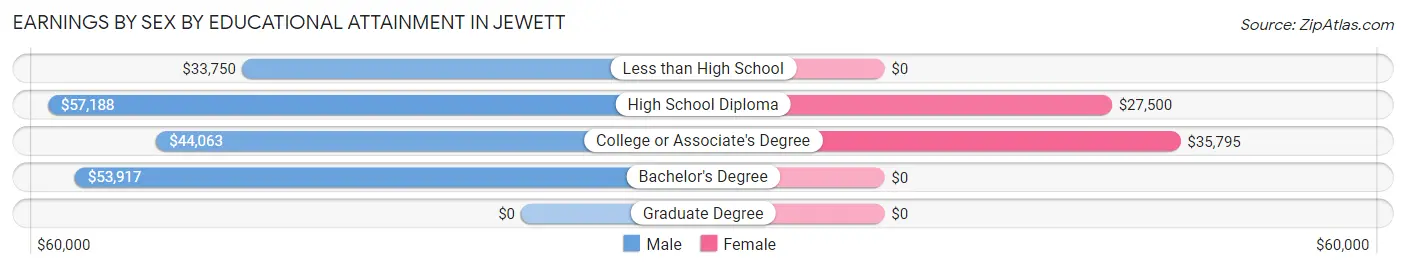
Earnings by Sex by Educational Attainment in Jewett
Average earnings in Jewett are $53,235 for men and $31,563 for women, a difference of 40.7%. Men with an educational attainment of high school diploma enjoy the highest average annual earnings of $57,188, while those with less than high school education earn the least with $33,750. Women with an educational attainment of college or associate's degree earn the most with the average annual earnings of $35,795, while those with high school diploma education have the smallest earnings of $27,500.
| Educational Attainment | Male Income | Female Income |
| Less than High School | $33,750 | $0 |
| High School Diploma | $57,188 | $27,500 |
| College or Associate's Degree | $44,063 | $35,795 |
| Bachelor's Degree | $53,917 | $0 |
| Graduate Degree | - | - |
| Total | $53,235 | $31,563 |
Family Income in Jewett
Family Income Brackets in Jewett
According to the Jewett family income data, there are 32 families falling into the $75,000 to $99,999 income range, which is the most common income bracket and makes up 24.2% of all families.
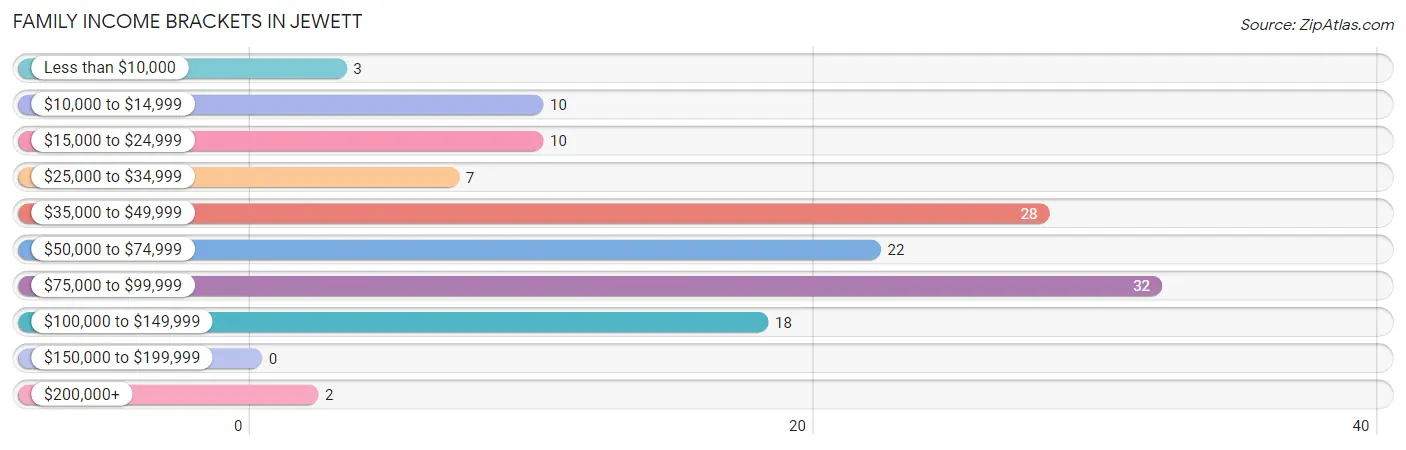
| Income Bracket | # Families | % Families |
| Less than $10,000 | 3 | 2.3% |
| $10,000 to $14,999 | 10 | 7.6% |
| $15,000 to $24,999 | 10 | 7.6% |
| $25,000 to $34,999 | 7 | 5.3% |
| $35,000 to $49,999 | 28 | 21.2% |
| $50,000 to $74,999 | 22 | 16.7% |
| $75,000 to $99,999 | 32 | 24.2% |
| $100,000 to $149,999 | 18 | 13.6% |
| $150,000 to $199,999 | 0 | 0.0% |
| $200,000+ | 2 | 1.5% |
Family Income by Famaliy Size in Jewett
4-person families (42 | 31.8%) account for the highest median family income in Jewett with $76,250 per family, while 2-person families (77 | 58.3%) have the highest median income of $26,696 per family member.
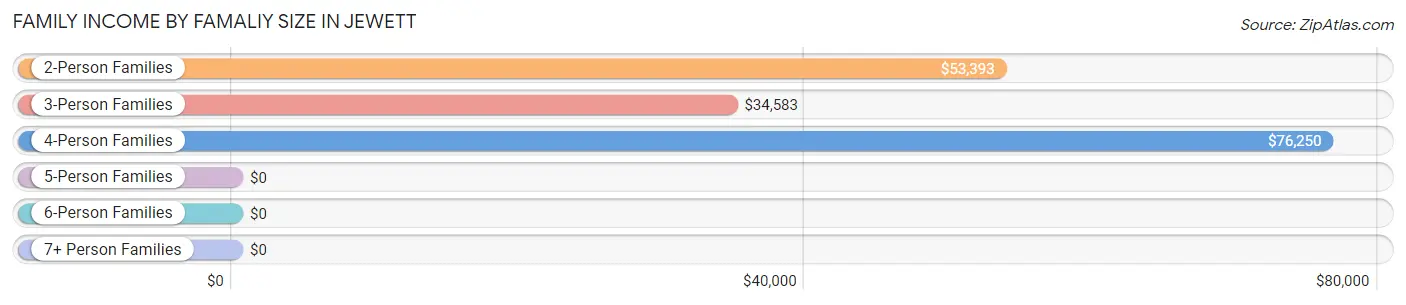
| Income Bracket | # Families | Median Income |
| 2-Person Families | 77 (58.3%) | $53,393 |
| 3-Person Families | 9 (6.8%) | $34,583 |
| 4-Person Families | 42 (31.8%) | $76,250 |
| 5-Person Families | 4 (3.0%) | $0 |
| 6-Person Families | 0 (0.0%) | $0 |
| 7+ Person Families | 0 (0.0%) | $0 |
| Total | 132 (100.0%) | $55,000 |
Family Income by Number of Earners in Jewett
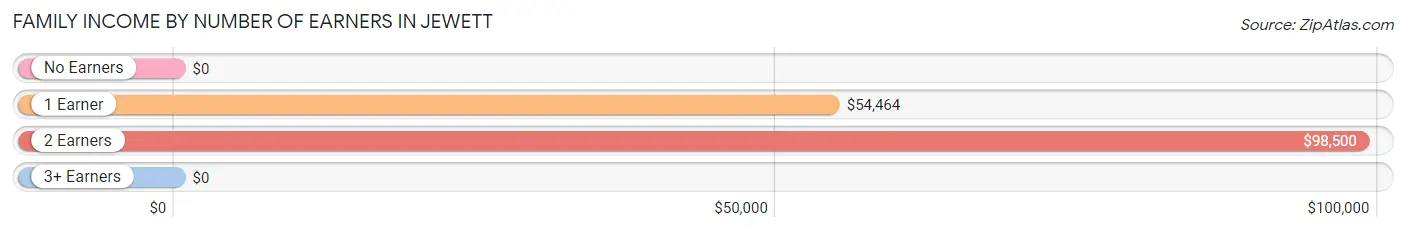
| Number of Earners | # Families | Median Income |
| No Earners | 25 (18.9%) | $0 |
| 1 Earner | 63 (47.7%) | $54,464 |
| 2 Earners | 40 (30.3%) | $98,500 |
| 3+ Earners | 4 (3.0%) | $0 |
| Total | 132 (100.0%) | $55,000 |
Household Income in Jewett
Household Income Brackets in Jewett
With 51 households falling in the category, the $50,000 to $74,999 income range is the most frequent in Jewett, accounting for 23.2% of all households. In contrast, only 1 households (0.4%) fall into the $150,000 to $199,999 income bracket, making it the least populous group.
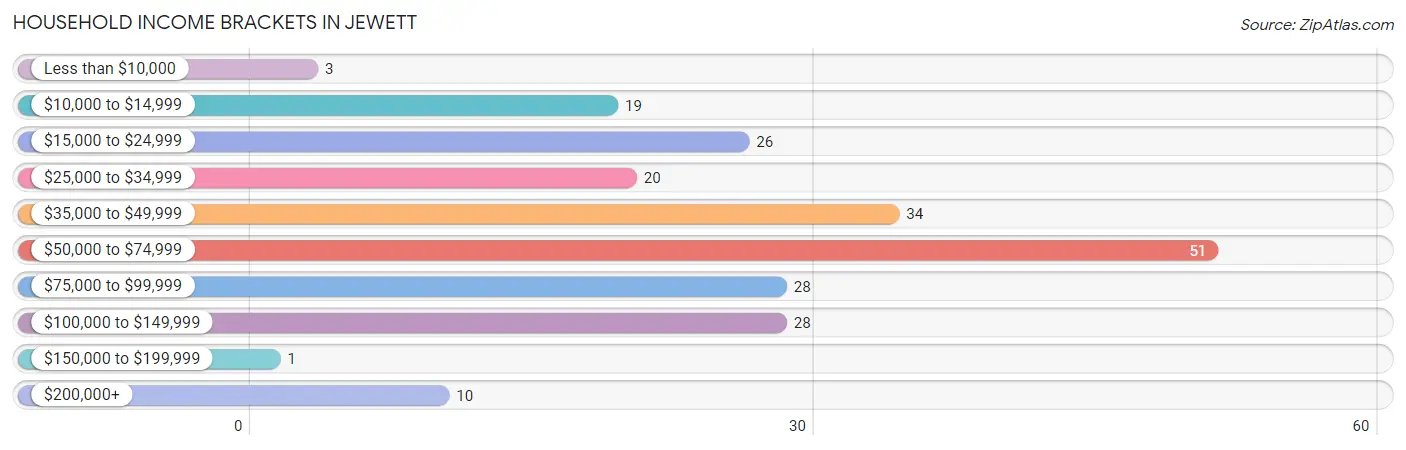
| Income Bracket | # Households | % Households |
| Less than $10,000 | 3 | 1.4% |
| $10,000 to $14,999 | 19 | 8.6% |
| $15,000 to $24,999 | 26 | 11.8% |
| $25,000 to $34,999 | 20 | 9.1% |
| $35,000 to $49,999 | 34 | 15.5% |
| $50,000 to $74,999 | 51 | 23.2% |
| $75,000 to $99,999 | 28 | 12.7% |
| $100,000 to $149,999 | 28 | 12.7% |
| $150,000 to $199,999 | 1 | 0.5% |
| $200,000+ | 10 | 4.5% |
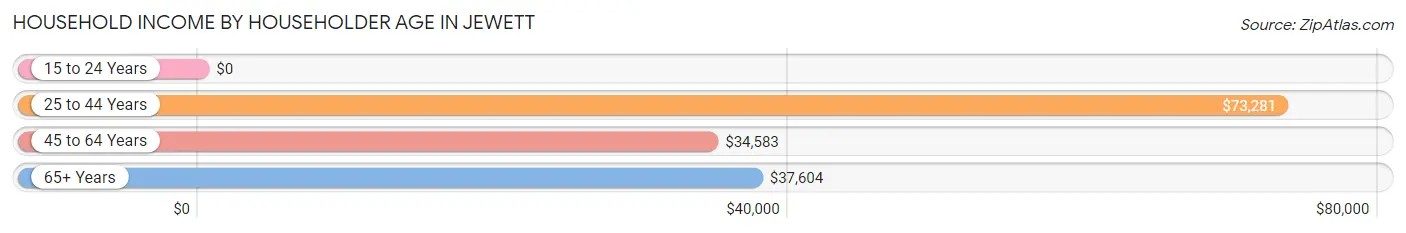
Household Income by Householder Age in Jewett
The median household income in Jewett is $53,068, with the highest median household income of $73,281 found in the 25 to 44 years age bracket for the primary householder. A total of 95 households (43.2%) fall into this category. Meanwhile, the 15 to 24 years age bracket for the primary householder has the lowest median household income of $0, with 5 households (2.3%) in this group.
| Income Bracket | # Households | Median Income |
| 15 to 24 Years | 5 (2.3%) | $0 |
| 25 to 44 Years | 95 (43.2%) | $73,281 |
| 45 to 64 Years | 75 (34.1%) | $34,583 |
| 65+ Years | 45 (20.4%) | $37,604 |
| Total | 220 (100.0%) | $53,068 |
Poverty in Jewett
Income Below Poverty by Sex and Age in Jewett
With 15.9% poverty level for males and 19.7% for females among the residents of Jewett, 12 to 14 year old males and under 5 year old females are the most vulnerable to poverty, with 12 males (54.5%) and 3 females (75.0%) in their respective age groups living below the poverty level.
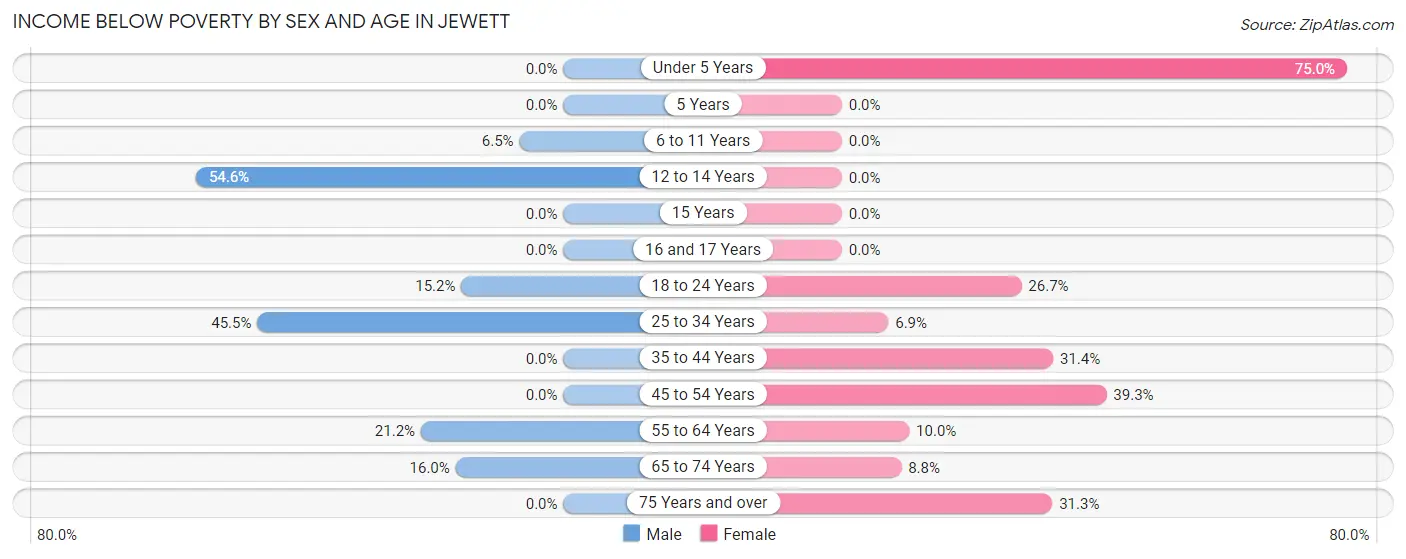
| Age Bracket | Male | Female |
| Under 5 Years | 0 (0.0%) | 3 (75.0%) |
| 5 Years | 0 (0.0%) | 0 (0.0%) |
| 6 to 11 Years | 3 (6.5%) | 0 (0.0%) |
| 12 to 14 Years | 12 (54.5%) | 0 (0.0%) |
| 15 Years | 0 (0.0%) | 0 (0.0%) |
| 16 and 17 Years | 0 (0.0%) | 0 (0.0%) |
| 18 to 24 Years | 5 (15.1%) | 4 (26.7%) |
| 25 to 34 Years | 10 (45.5%) | 2 (6.9%) |
| 35 to 44 Years | 0 (0.0%) | 16 (31.4%) |
| 45 to 54 Years | 0 (0.0%) | 11 (39.3%) |
| 55 to 64 Years | 11 (21.1%) | 2 (10.0%) |
| 65 to 74 Years | 4 (16.0%) | 3 (8.8%) |
| 75 Years and over | 0 (0.0%) | 5 (31.2%) |
| Total | 45 (15.9%) | 46 (19.7%) |
Income Above Poverty by Sex and Age in Jewett
According to the poverty statistics in Jewett, males aged under 5 years and females aged 6 to 11 years are the age groups that are most secure financially, with 100.0% of males and 100.0% of females in these age groups living above the poverty line.
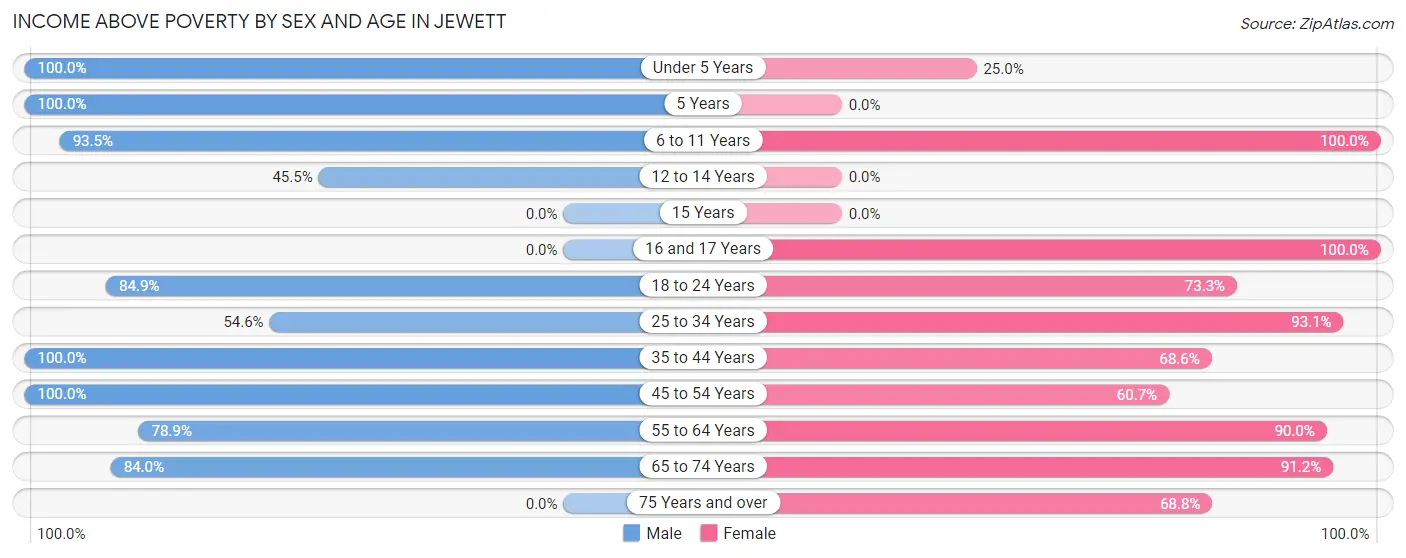
| Age Bracket | Male | Female |
| Under 5 Years | 2 (100.0%) | 1 (25.0%) |
| 5 Years | 2 (100.0%) | 0 (0.0%) |
| 6 to 11 Years | 43 (93.5%) | 25 (100.0%) |
| 12 to 14 Years | 10 (45.5%) | 0 (0.0%) |
| 15 Years | 0 (0.0%) | 0 (0.0%) |
| 16 and 17 Years | 0 (0.0%) | 12 (100.0%) |
| 18 to 24 Years | 28 (84.9%) | 11 (73.3%) |
| 25 to 34 Years | 12 (54.5%) | 27 (93.1%) |
| 35 to 44 Years | 66 (100.0%) | 35 (68.6%) |
| 45 to 54 Years | 14 (100.0%) | 17 (60.7%) |
| 55 to 64 Years | 41 (78.8%) | 18 (90.0%) |
| 65 to 74 Years | 21 (84.0%) | 31 (91.2%) |
| 75 Years and over | 0 (0.0%) | 11 (68.8%) |
| Total | 239 (84.2%) | 188 (80.3%) |
Income Below Poverty Among Married-Couple Families in Jewett
The poverty statistics for married-couple families in Jewett show that 11.9% or 10 of the total 84 families live below the poverty line. Families with no children have the highest poverty rate of 16.1%, comprising of 10 families. On the other hand, families with 1 or 2 children have the lowest poverty rate of 0.0%, which includes 0 families.
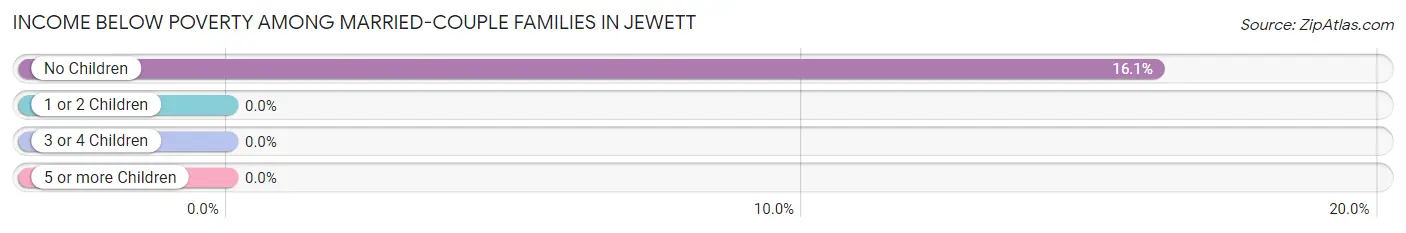
| Children | Above Poverty | Below Poverty |
| No Children | 52 (83.9%) | 10 (16.1%) |
| 1 or 2 Children | 18 (100.0%) | 0 (0.0%) |
| 3 or 4 Children | 4 (100.0%) | 0 (0.0%) |
| 5 or more Children | 0 (0.0%) | 0 (0.0%) |
| Total | 74 (88.1%) | 10 (11.9%) |
Income Below Poverty Among Single-Parent Households in Jewett
According to the poverty data in Jewett, 13.6% or 3 single-father households and 11.5% or 3 single-mother households are living below the poverty line. Among single-father households, those with 1 or 2 children have the highest poverty rate, with 3 households (30.0%) experiencing poverty. Likewise, among single-mother households, those with 1 or 2 children have the highest poverty rate, with 3 households (13.0%) falling below the poverty line.
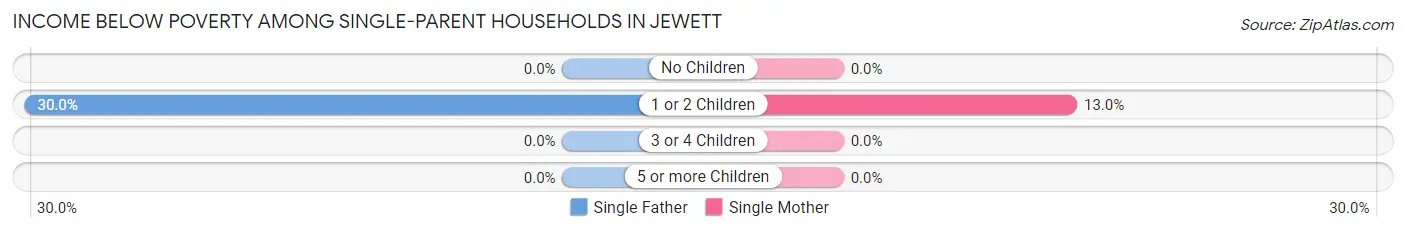
| Children | Single Father | Single Mother |
| No Children | 0 (0.0%) | 0 (0.0%) |
| 1 or 2 Children | 3 (30.0%) | 3 (13.0%) |
| 3 or 4 Children | 0 (0.0%) | 0 (0.0%) |
| 5 or more Children | 0 (0.0%) | 0 (0.0%) |
| Total | 3 (13.6%) | 3 (11.5%) |
Income Below Poverty Among Married-Couple vs Single-Parent Households in Jewett
The poverty data for Jewett shows that 10 of the married-couple family households (11.9%) and 6 of the single-parent households (12.5%) are living below the poverty level. Within the married-couple family households, those with no children have the highest poverty rate, with 10 households (16.1%) falling below the poverty line. Among the single-parent households, those with 1 or 2 children have the highest poverty rate, with 6 household (18.2%) living below poverty.
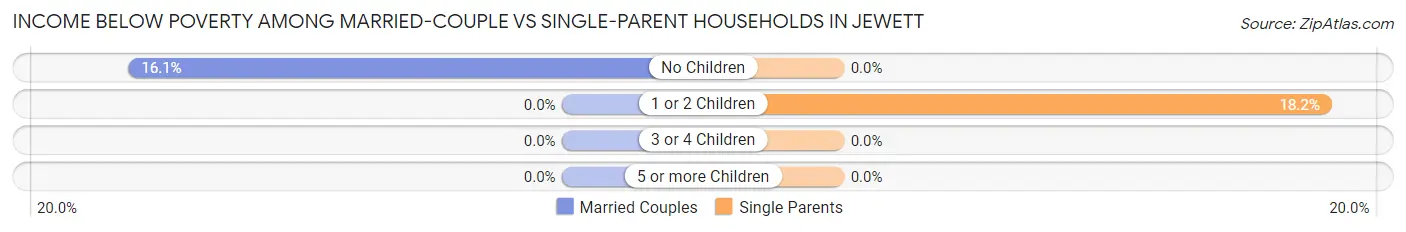
| Children | Married-Couple Families | Single-Parent Households |
| No Children | 10 (16.1%) | 0 (0.0%) |
| 1 or 2 Children | 0 (0.0%) | 6 (18.2%) |
| 3 or 4 Children | 0 (0.0%) | 0 (0.0%) |
| 5 or more Children | 0 (0.0%) | 0 (0.0%) |
| Total | 10 (11.9%) | 6 (12.5%) |
Race in Jewett
The most populous races in Jewett are White / Caucasian (495 | 95.6%), Hispanic or Latino (27 | 5.2%), and Some other Race (12 | 2.3%).
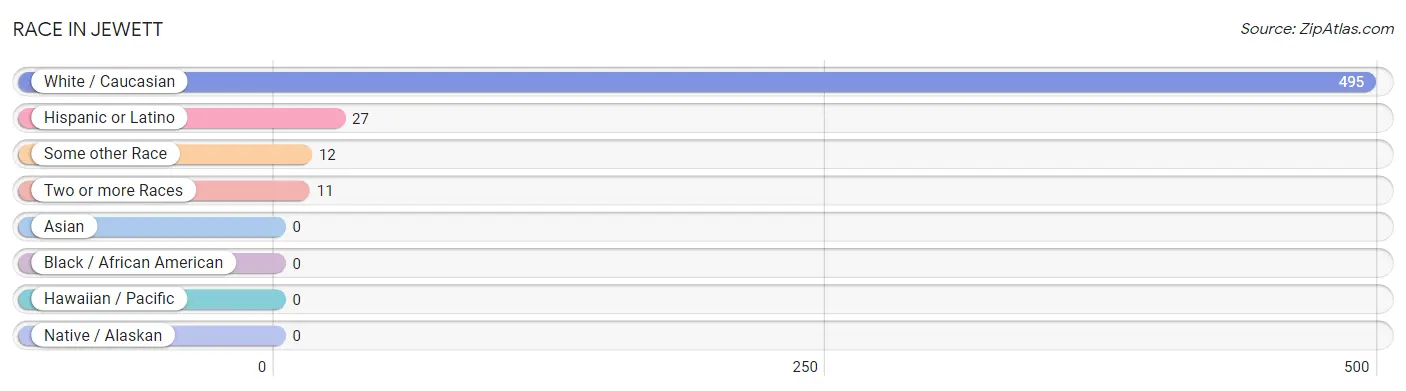
| Race | # Population | % Population |
| Asian | 0 | 0.0% |
| Black / African American | 0 | 0.0% |
| Hawaiian / Pacific | 0 | 0.0% |
| Hispanic or Latino | 27 | 5.2% |
| Native / Alaskan | 0 | 0.0% |
| White / Caucasian | 495 | 95.6% |
| Two or more Races | 11 | 2.1% |
| Some other Race | 12 | 2.3% |
| Total | 518 | 100.0% |
Ancestry in Jewett
The most populous ancestries reported in Jewett are English (83 | 16.0%), Polish (62 | 12.0%), German (51 | 9.9%), Irish (49 | 9.5%), and Italian (19 | 3.7%), together accounting for 51.0% of all Jewett residents.
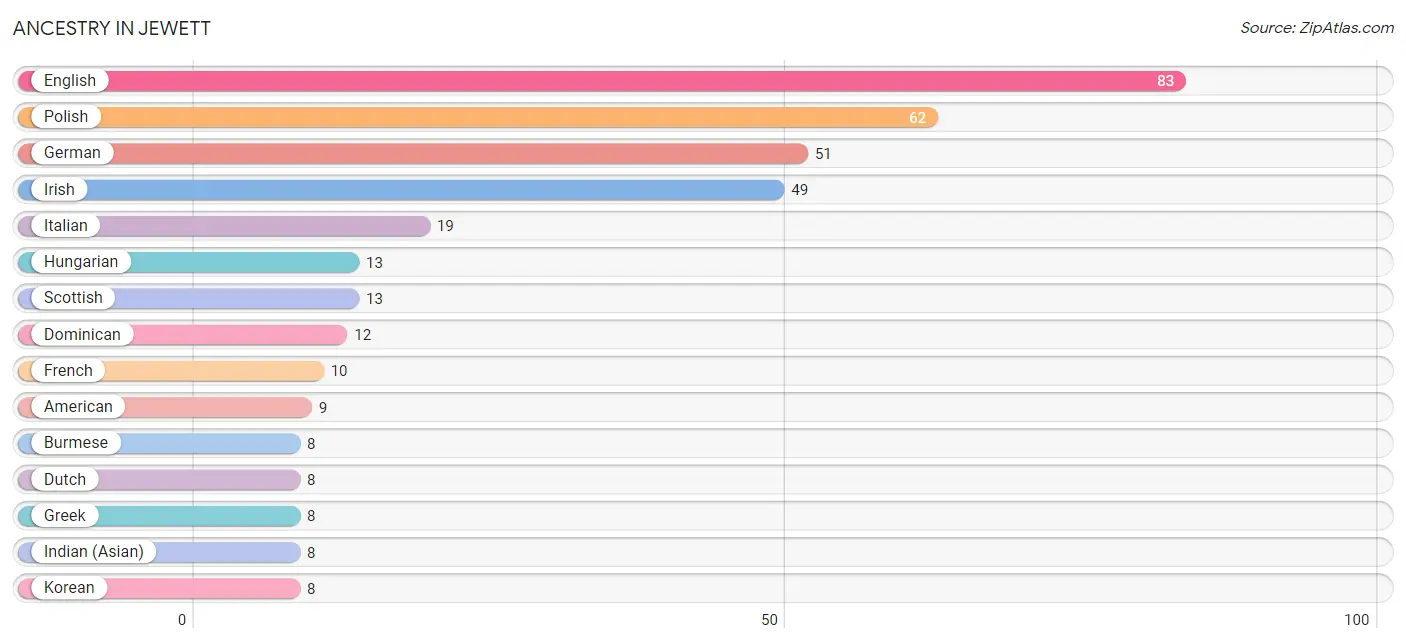
| Ancestry | # Population | % Population |
| American | 9 | 1.7% |
| Burmese | 8 | 1.5% |
| Czech | 4 | 0.8% |
| Dominican | 12 | 2.3% |
| Dutch | 8 | 1.5% |
| English | 83 | 16.0% |
| European | 3 | 0.6% |
| French | 10 | 1.9% |
| German | 51 | 9.9% |
| Greek | 8 | 1.5% |
| Hungarian | 13 | 2.5% |
| Indian (Asian) | 8 | 1.5% |
| Irish | 49 | 9.5% |
| Italian | 19 | 3.7% |
| Korean | 8 | 1.5% |
| Native Hawaiian | 8 | 1.5% |
| Norwegian | 3 | 0.6% |
| Pennsylvania German | 3 | 0.6% |
| Polish | 62 | 12.0% |
| Puerto Rican | 7 | 1.3% |
| Samoan | 8 | 1.5% |
| Scottish | 13 | 2.5% |
| Slovak | 2 | 0.4% |
| Sri Lankan | 8 | 1.5% |
| Thai | 8 | 1.5% | View All 25 Rows |
Immigrants in Jewett

| Immigration Origin | # Population | % Population | View All 0 Rows |
Sex and Age in Jewett
Sex and Age in Jewett
The most populous age groups in Jewett are 5 to 9 Years (41 | 14.4%) for men and 65 to 69 Years (32 | 13.7%) for women.
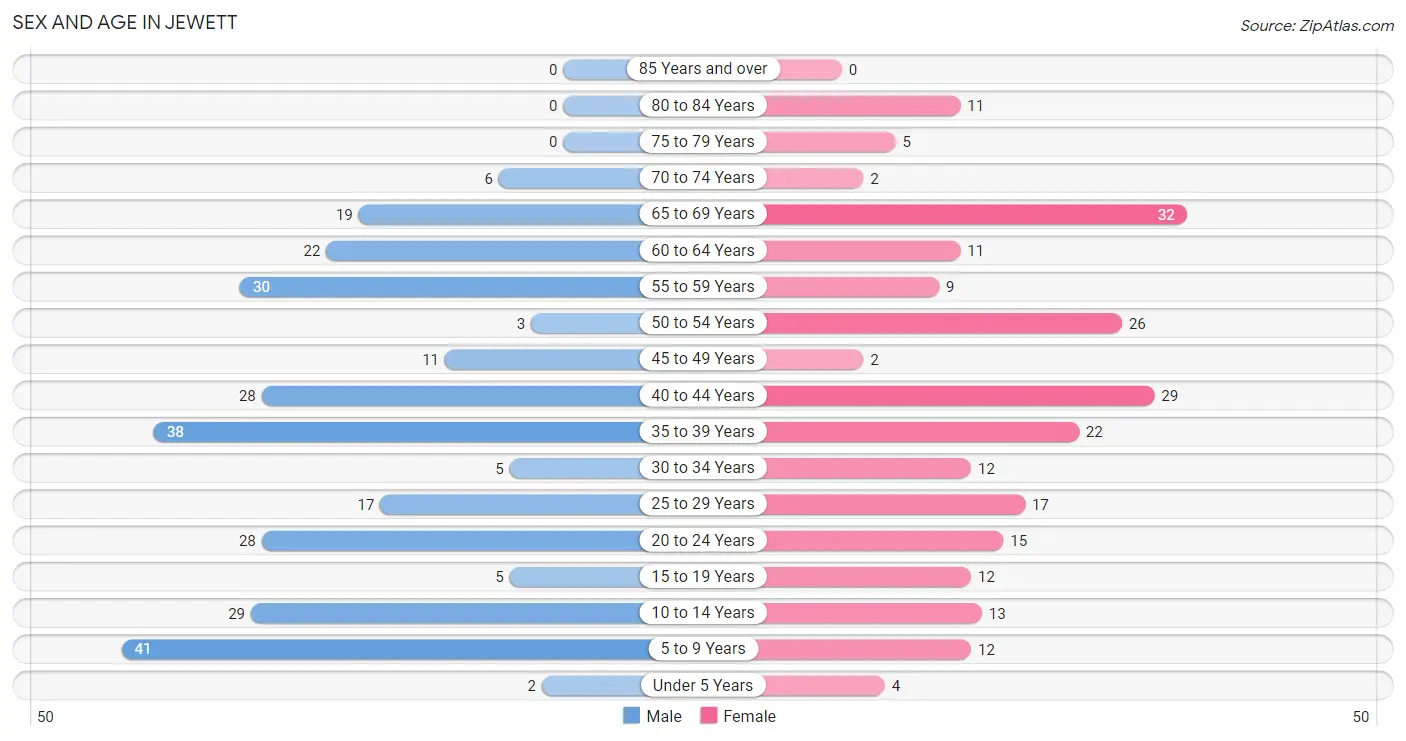
| Age Bracket | Male | Female |
| Under 5 Years | 2 (0.7%) | 4 (1.7%) |
| 5 to 9 Years | 41 (14.4%) | 12 (5.1%) |
| 10 to 14 Years | 29 (10.2%) | 13 (5.6%) |
| 15 to 19 Years | 5 (1.8%) | 12 (5.1%) |
| 20 to 24 Years | 28 (9.9%) | 15 (6.4%) |
| 25 to 29 Years | 17 (6.0%) | 17 (7.3%) |
| 30 to 34 Years | 5 (1.8%) | 12 (5.1%) |
| 35 to 39 Years | 38 (13.4%) | 22 (9.4%) |
| 40 to 44 Years | 28 (9.9%) | 29 (12.4%) |
| 45 to 49 Years | 11 (3.9%) | 2 (0.9%) |
| 50 to 54 Years | 3 (1.1%) | 26 (11.1%) |
| 55 to 59 Years | 30 (10.6%) | 9 (3.8%) |
| 60 to 64 Years | 22 (7.7%) | 11 (4.7%) |
| 65 to 69 Years | 19 (6.7%) | 32 (13.7%) |
| 70 to 74 Years | 6 (2.1%) | 2 (0.9%) |
| 75 to 79 Years | 0 (0.0%) | 5 (2.1%) |
| 80 to 84 Years | 0 (0.0%) | 11 (4.7%) |
| 85 Years and over | 0 (0.0%) | 0 (0.0%) |
| Total | 284 (100.0%) | 234 (100.0%) |
Families and Households in Jewett
Median Family Size in Jewett
The median family size in Jewett is 2.98 persons per family, with single female/mother families (26 | 19.7%) accounting for the largest median family size of 3.69 persons per family. On the other hand, married-couple families (84 | 63.6%) represent the smallest median family size with 2.75 persons per family.
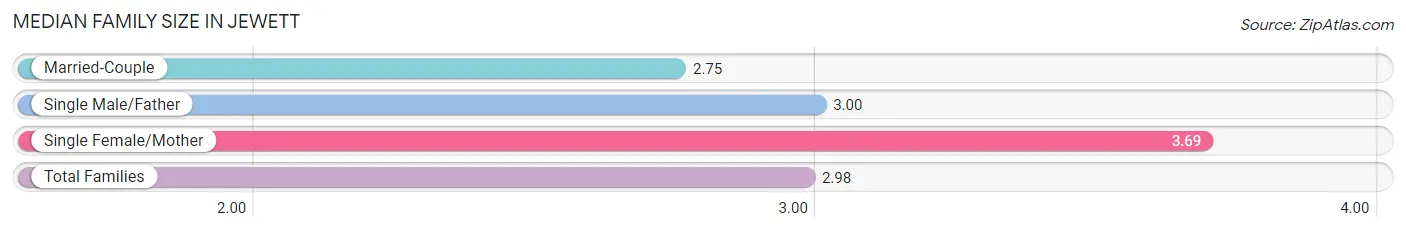
| Family Type | # Families | Family Size |
| Married-Couple | 84 (63.6%) | 2.75 |
| Single Male/Father | 22 (16.7%) | 3.00 |
| Single Female/Mother | 26 (19.7%) | 3.69 |
| Total Families | 132 (100.0%) | 2.98 |
Median Household Size in Jewett
The median household size in Jewett is 2.35 persons per household, with single female/mother households (26 | 11.8%) accounting for the largest median household size of 4.08 persons per household. non-family households (88 | 40.0%) represent the smallest median household size with 1.10 persons per household.
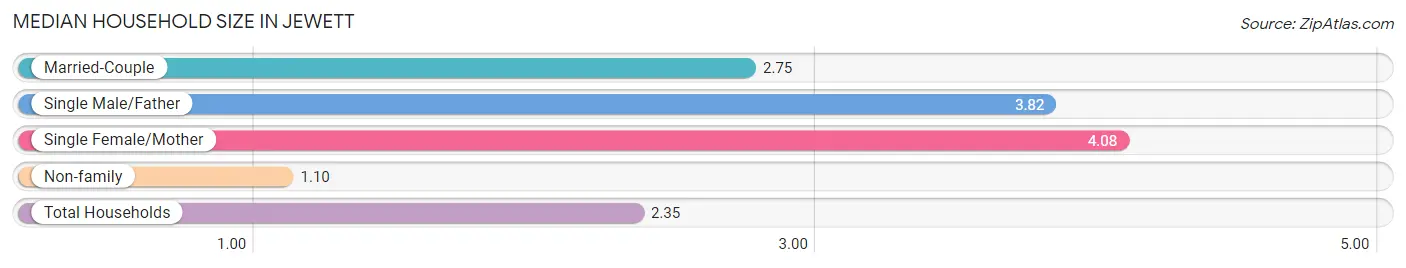
| Household Type | # Households | Household Size |
| Married-Couple | 84 (38.2%) | 2.75 |
| Single Male/Father | 22 (10.0%) | 3.82 |
| Single Female/Mother | 26 (11.8%) | 4.08 |
| Non-family | 88 (40.0%) | 1.10 |
| Total Households | 220 (100.0%) | 2.35 |
Household Size by Marriage Status in Jewett
Out of a total of 220 households in Jewett, 132 (60.0%) are family households, while 88 (40.0%) are nonfamily households. The most numerous type of family households are 2-person households, comprising 59, and the most common type of nonfamily households are 1-person households, comprising 77.
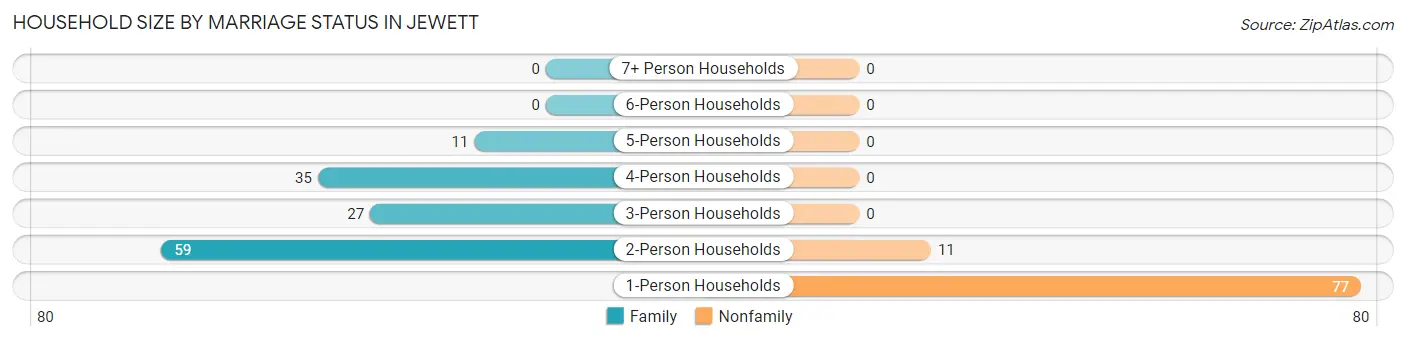
| Household Size | Family Households | Nonfamily Households |
| 1-Person Households | - | 77 (35.0%) |
| 2-Person Households | 59 (26.8%) | 11 (5.0%) |
| 3-Person Households | 27 (12.3%) | 0 (0.0%) |
| 4-Person Households | 35 (15.9%) | 0 (0.0%) |
| 5-Person Households | 11 (5.0%) | 0 (0.0%) |
| 6-Person Households | 0 (0.0%) | 0 (0.0%) |
| 7+ Person Households | 0 (0.0%) | 0 (0.0%) |
| Total | 132 (60.0%) | 88 (40.0%) |
Female Fertility in Jewett
Fertility by Age in Jewett
Average fertility rate in Jewett is 55.0 births per 1,000 women. Women in the age bracket of 20 to 34 years have the highest fertility rate with 136.0 births per 1,000 women. Women in the age bracket of 20 to 34 years acount for 100.0% of all women with births.
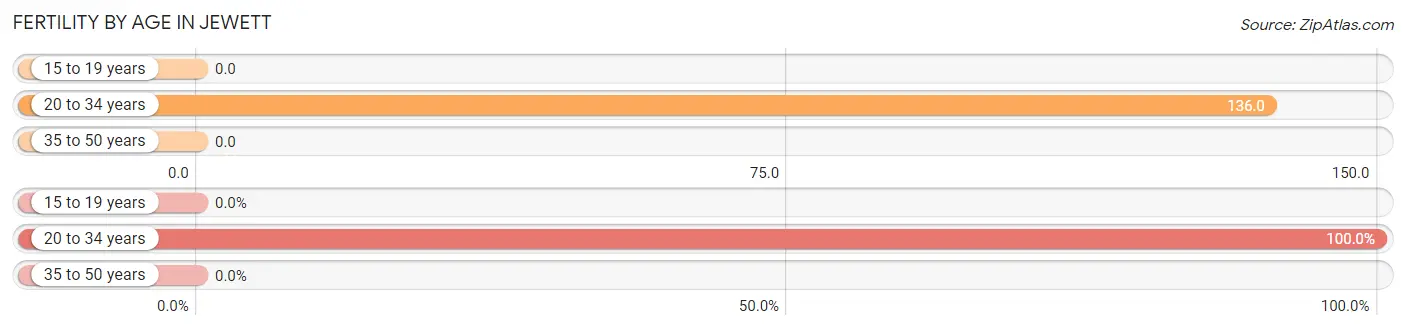
| Age Bracket | Women with Births | Births / 1,000 Women |
| 15 to 19 years | 0 (0.0%) | 0.0 |
| 20 to 34 years | 6 (100.0%) | 136.0 |
| 35 to 50 years | 0 (0.0%) | 0.0 |
| Total | 6 (100.0%) | 55.0 |
Fertility by Age by Marriage Status in Jewett
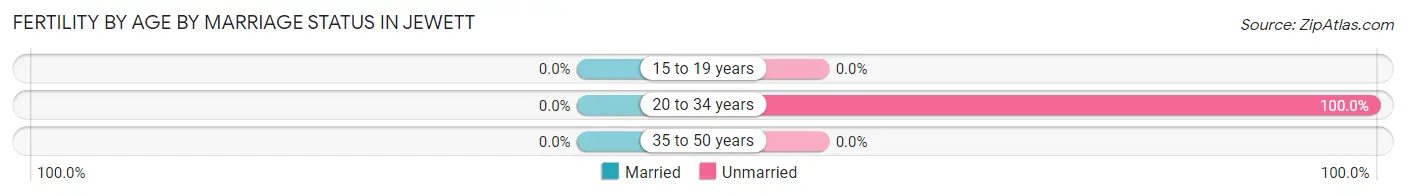
| Age Bracket | Married | Unmarried |
| 15 to 19 years | 0 (0.0%) | 0 (0.0%) |
| 20 to 34 years | 0 (0.0%) | 6 (100.0%) |
| 35 to 50 years | 0 (0.0%) | 0 (0.0%) |
| Total | 0 (0.0%) | 6 (100.0%) |
Fertility by Education in Jewett
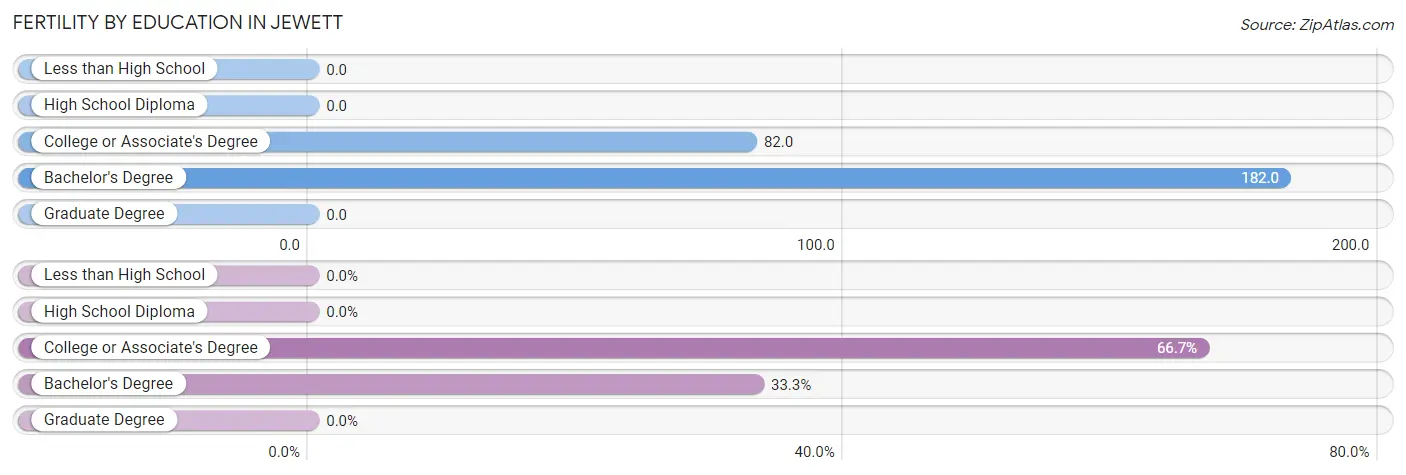
| Educational Attainment | Women with Births | Births / 1,000 Women |
| Less than High School | 0 (0.0%) | 0.0 |
| High School Diploma | 0 (0.0%) | 0.0 |
| College or Associate's Degree | 4 (66.7%) | 82.0 |
| Bachelor's Degree | 2 (33.3%) | 182.0 |
| Graduate Degree | 0 (0.0%) | 0.0 |
| Total | 6 (100.0%) | 55.0 |
Fertility by Education by Marriage Status in Jewett
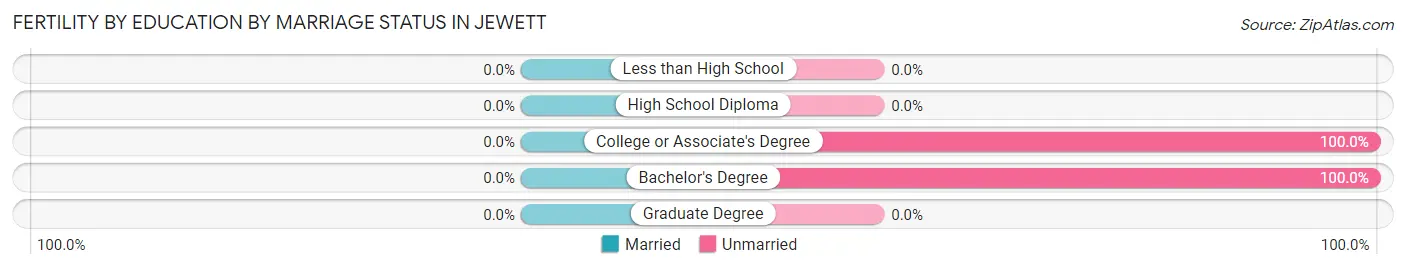
| Educational Attainment | Married | Unmarried |
| Less than High School | 0 (0.0%) | 0 (0.0%) |
| High School Diploma | 0 (0.0%) | 0 (0.0%) |
| College or Associate's Degree | 0 (0.0%) | 4 (100.0%) |
| Bachelor's Degree | 0 (0.0%) | 2 (100.0%) |
| Graduate Degree | 0 (0.0%) | 0 (0.0%) |
| Total | 0 (0.0%) | 6 (100.0%) |
Employment Characteristics in Jewett
Employment by Class of Employer in Jewett
Among the 197 employed individuals in Jewett, private company employees (162 | 82.2%), local government employees (14 | 7.1%), and not-for-profit organizations (8 | 4.1%) make up the most common classes of employment.
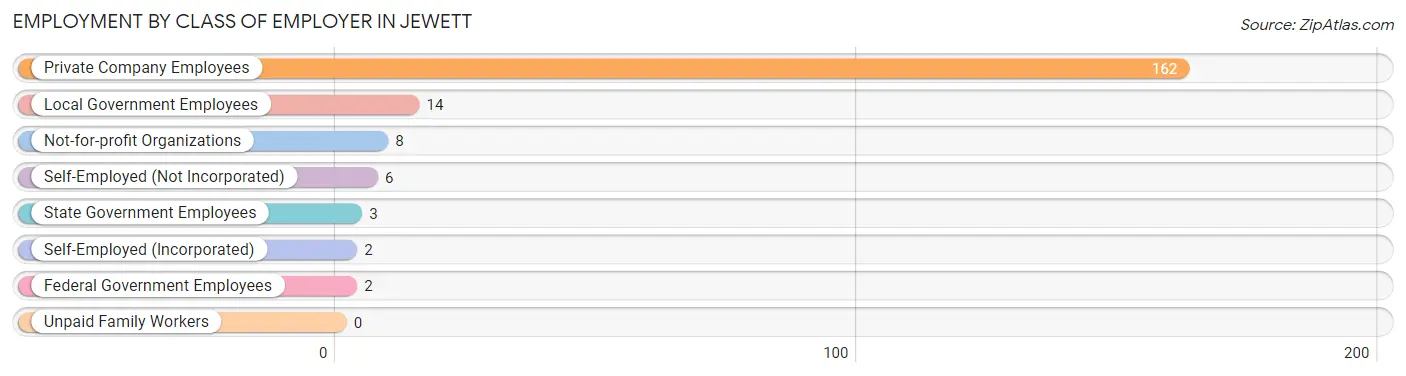
| Employer Class | # Employees | % Employees |
| Private Company Employees | 162 | 82.2% |
| Self-Employed (Incorporated) | 2 | 1.0% |
| Self-Employed (Not Incorporated) | 6 | 3.0% |
| Not-for-profit Organizations | 8 | 4.1% |
| Local Government Employees | 14 | 7.1% |
| State Government Employees | 3 | 1.5% |
| Federal Government Employees | 2 | 1.0% |
| Unpaid Family Workers | 0 | 0.0% |
| Total | 197 | 100.0% |
Employment Status by Age in Jewett
According to the labor force statistics for Jewett, out of the total population over 16 years of age (417), 52.8% or 220 individuals are in the labor force, with 10.5% or 23 of them unemployed. The age group with the highest labor force participation rate is 35 to 44 years, with 86.3% or 101 individuals in the labor force. Within the labor force, the 65 to 74 years age range has the highest percentage of unemployed individuals, with 20.0% or 2 of them being unemployed.
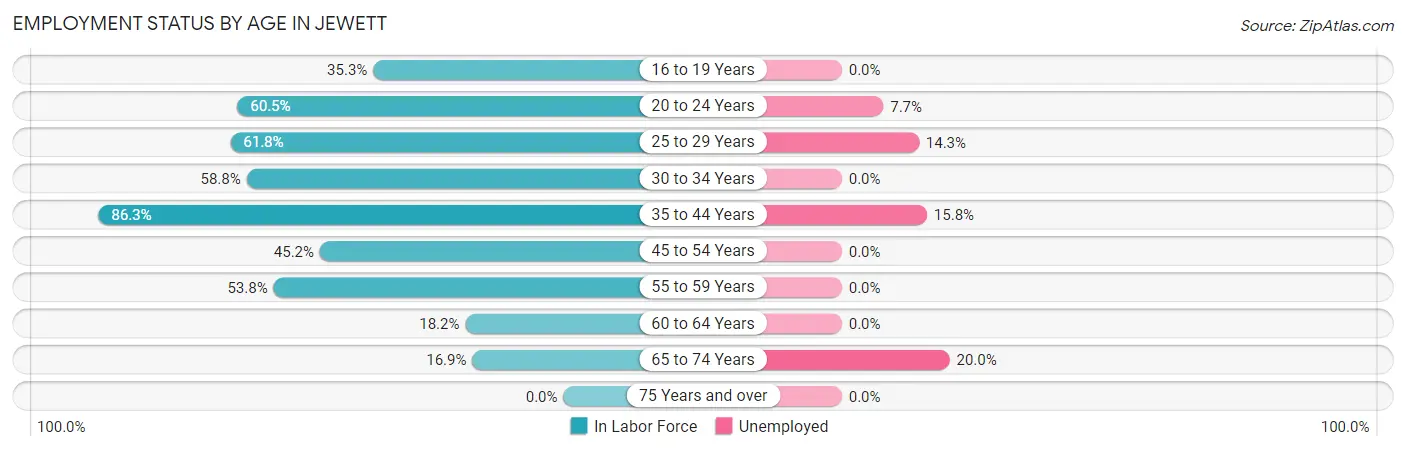
| Age Bracket | In Labor Force | Unemployed |
| 16 to 19 Years | 6 (35.3%) | 0 (0.0%) |
| 20 to 24 Years | 26 (60.5%) | 2 (7.7%) |
| 25 to 29 Years | 21 (61.8%) | 3 (14.3%) |
| 30 to 34 Years | 10 (58.8%) | 0 (0.0%) |
| 35 to 44 Years | 101 (86.3%) | 16 (15.8%) |
| 45 to 54 Years | 19 (45.2%) | 0 (0.0%) |
| 55 to 59 Years | 21 (53.8%) | 0 (0.0%) |
| 60 to 64 Years | 6 (18.2%) | 0 (0.0%) |
| 65 to 74 Years | 10 (16.9%) | 2 (20.0%) |
| 75 Years and over | 0 (0.0%) | 0 (0.0%) |
| Total | 220 (52.8%) | 23 (10.5%) |
Employment Status by Educational Attainment in Jewett
According to labor force statistics for Jewett, 63.1% of individuals (178) out of the total population between 25 and 64 years of age (282) are in the labor force, with 10.7% or 19 of them being unemployed. The group with the highest labor force participation rate are those with the educational attainment of bachelor's degree or higher, with 85.3% or 29 individuals in the labor force. Within the labor force, individuals with less than high school education have the highest percentage of unemployment, with 50.0% or 5 of them being unemployed.
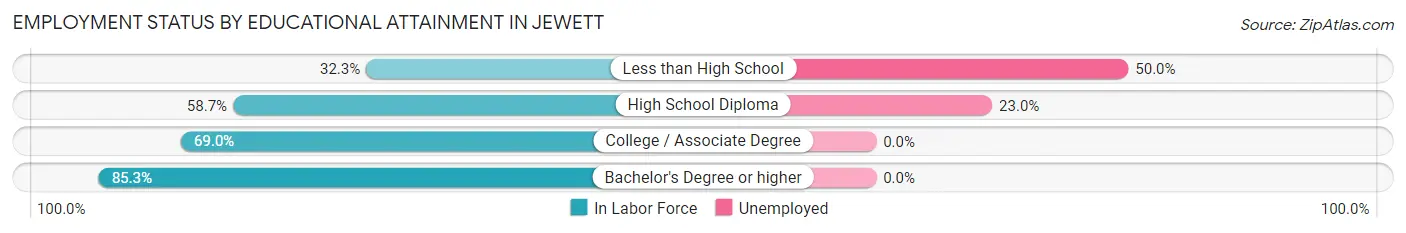
| Educational Attainment | In Labor Force | Unemployed |
| Less than High School | 10 (32.3%) | 16 (50.0%) |
| High School Diploma | 61 (58.7%) | 24 (23.0%) |
| College / Associate Degree | 78 (69.0%) | 0 (0.0%) |
| Bachelor's Degree or higher | 29 (85.3%) | 0 (0.0%) |
| Total | 178 (63.1%) | 30 (10.7%) |
Employment Occupations by Sex in Jewett
Management, Business, Science and Arts Occupations
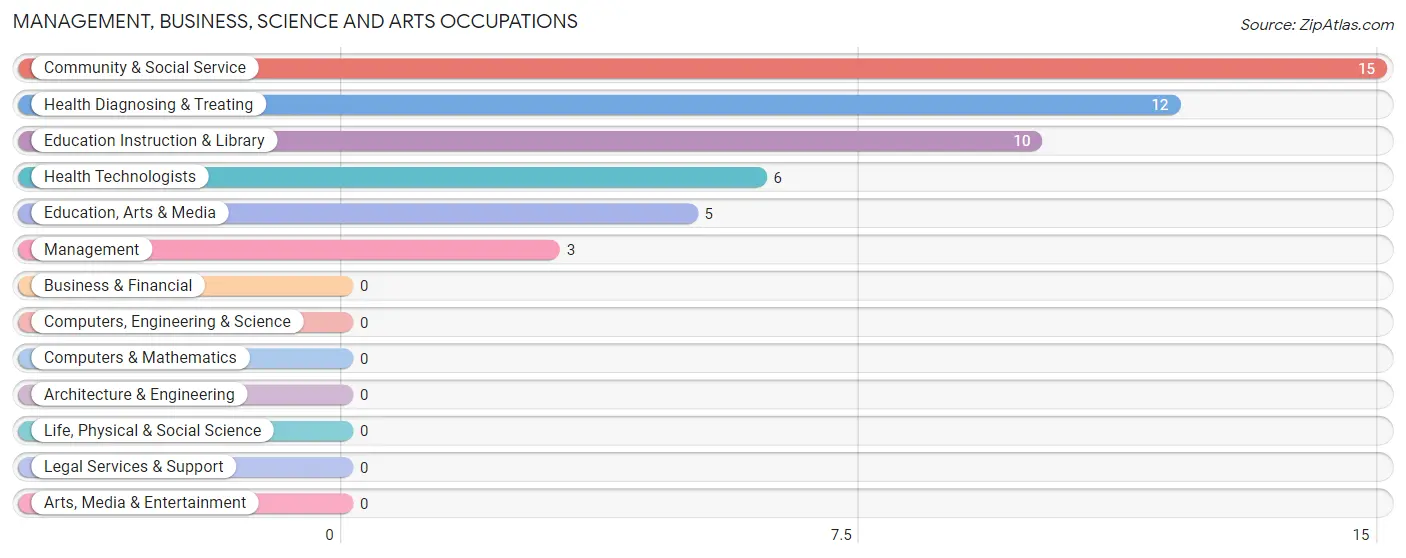
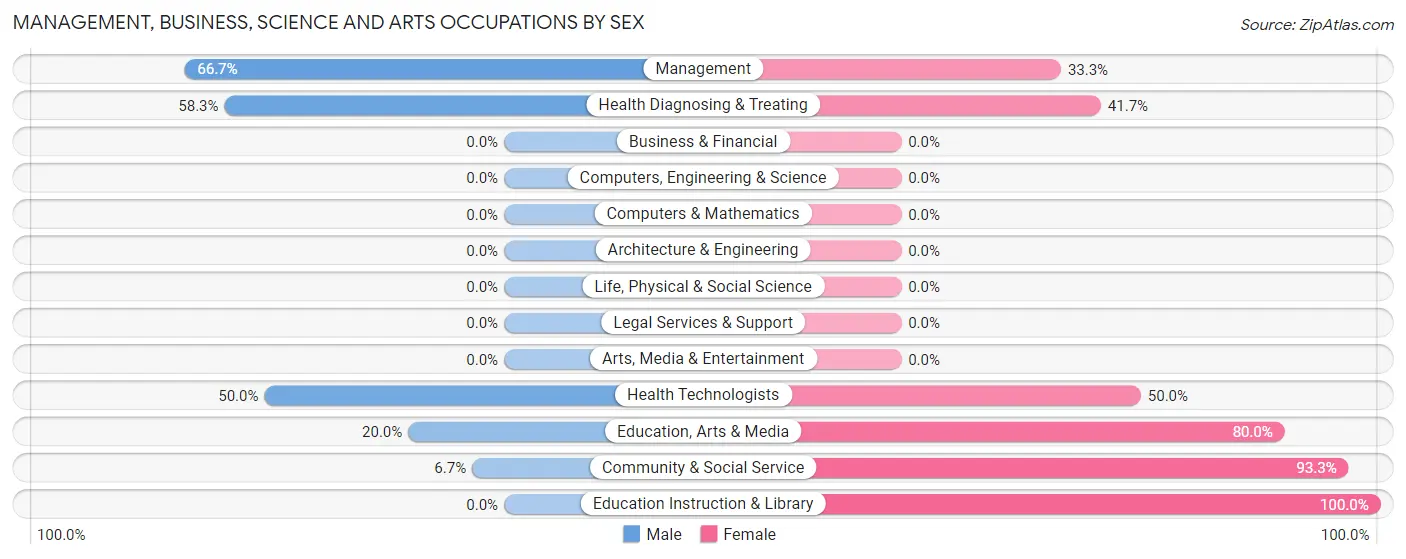
The most common Management, Business, Science and Arts occupations in Jewett are Community & Social Service (15 | 7.6%), Health Diagnosing & Treating (12 | 6.1%), Education Instruction & Library (10 | 5.1%), Health Technologists (6 | 3.0%), and Education, Arts & Media (5 | 2.5%).
Management, Business, Science and Arts Occupations by Sex
Within the Management, Business, Science and Arts occupations in Jewett, the most male-oriented occupations are Management (66.7%), Health Diagnosing & Treating (58.3%), and Health Technologists (50.0%), while the most female-oriented occupations are Education Instruction & Library (100.0%), Community & Social Service (93.3%), and Education, Arts & Media (80.0%).
| Occupation | Male | Female |
| Management | 2 (66.7%) | 1 (33.3%) |
| Business & Financial | 0 (0.0%) | 0 (0.0%) |
| Computers, Engineering & Science | 0 (0.0%) | 0 (0.0%) |
| Computers & Mathematics | 0 (0.0%) | 0 (0.0%) |
| Architecture & Engineering | 0 (0.0%) | 0 (0.0%) |
| Life, Physical & Social Science | 0 (0.0%) | 0 (0.0%) |
| Community & Social Service | 1 (6.7%) | 14 (93.3%) |
| Education, Arts & Media | 1 (20.0%) | 4 (80.0%) |
| Legal Services & Support | 0 (0.0%) | 0 (0.0%) |
| Education Instruction & Library | 0 (0.0%) | 10 (100.0%) |
| Arts, Media & Entertainment | 0 (0.0%) | 0 (0.0%) |
| Health Diagnosing & Treating | 7 (58.3%) | 5 (41.7%) |
| Health Technologists | 3 (50.0%) | 3 (50.0%) |
| Total (Category) | 10 (33.3%) | 20 (66.7%) |
| Total (Overall) | 109 (55.3%) | 88 (44.7%) |
Services Occupations
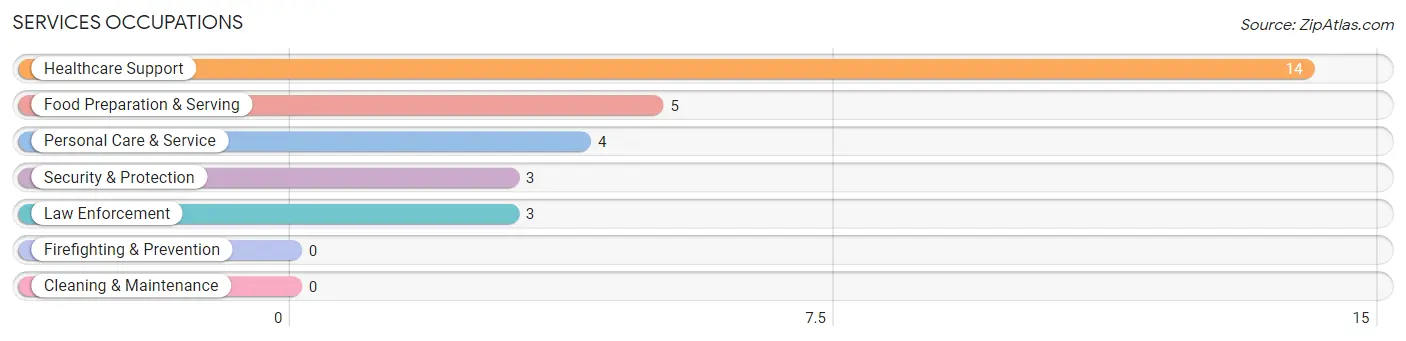
The most common Services occupations in Jewett are Healthcare Support (14 | 7.1%), Food Preparation & Serving (5 | 2.5%), Personal Care & Service (4 | 2.0%), Security & Protection (3 | 1.5%), and Law Enforcement (3 | 1.5%).
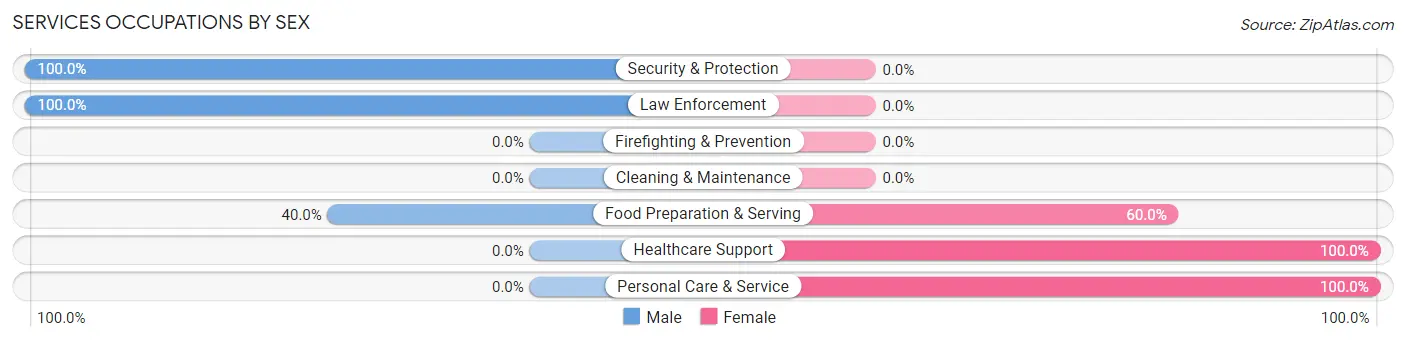
Services Occupations by Sex
Within the Services occupations in Jewett, the most male-oriented occupations are Security & Protection (100.0%), Law Enforcement (100.0%), and Food Preparation & Serving (40.0%), while the most female-oriented occupations are Healthcare Support (100.0%), Personal Care & Service (100.0%), and Food Preparation & Serving (60.0%).
| Occupation | Male | Female |
| Healthcare Support | 0 (0.0%) | 14 (100.0%) |
| Security & Protection | 3 (100.0%) | 0 (0.0%) |
| Firefighting & Prevention | 0 (0.0%) | 0 (0.0%) |
| Law Enforcement | 3 (100.0%) | 0 (0.0%) |
| Food Preparation & Serving | 2 (40.0%) | 3 (60.0%) |
| Cleaning & Maintenance | 0 (0.0%) | 0 (0.0%) |
| Personal Care & Service | 0 (0.0%) | 4 (100.0%) |
| Total (Category) | 5 (19.2%) | 21 (80.8%) |
| Total (Overall) | 109 (55.3%) | 88 (44.7%) |
Sales and Office Occupations
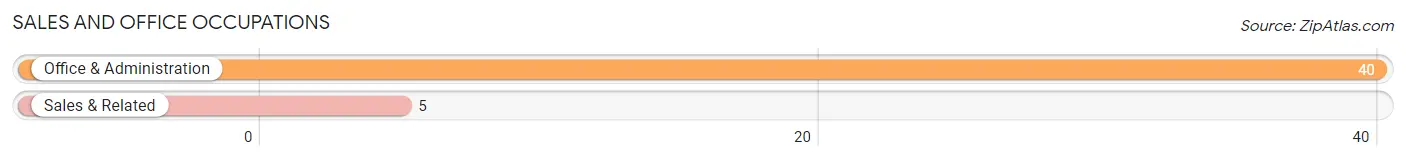
The most common Sales and Office occupations in Jewett are Office & Administration (40 | 20.3%), and Sales & Related (5 | 2.5%).
Sales and Office Occupations by Sex
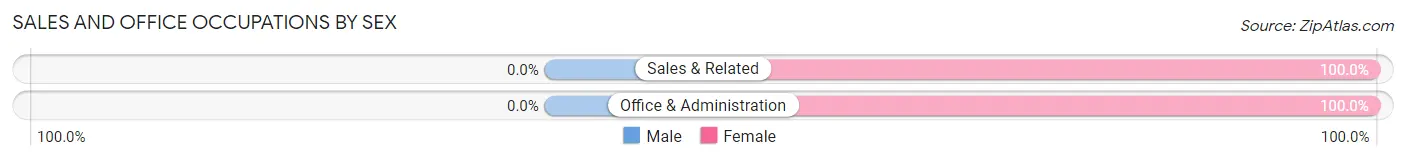
| Occupation | Male | Female |
| Sales & Related | 0 (0.0%) | 5 (100.0%) |
| Office & Administration | 0 (0.0%) | 40 (100.0%) |
| Total (Category) | 0 (0.0%) | 45 (100.0%) |
| Total (Overall) | 109 (55.3%) | 88 (44.7%) |
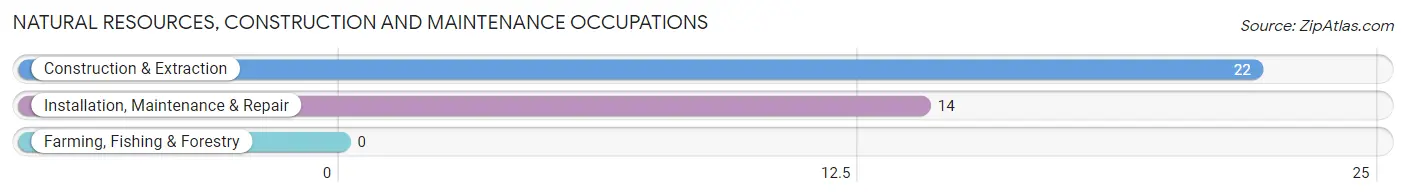
Natural Resources, Construction and Maintenance Occupations
The most common Natural Resources, Construction and Maintenance occupations in Jewett are Construction & Extraction (22 | 11.2%), and Installation, Maintenance & Repair (14 | 7.1%).
Natural Resources, Construction and Maintenance Occupations by Sex
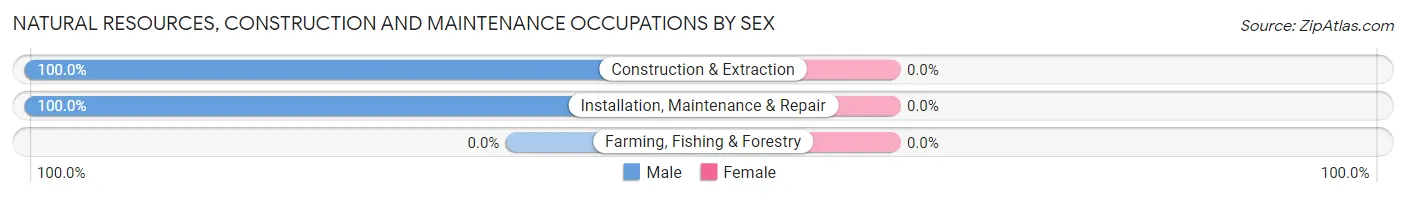
| Occupation | Male | Female |
| Farming, Fishing & Forestry | 0 (0.0%) | 0 (0.0%) |
| Construction & Extraction | 22 (100.0%) | 0 (0.0%) |
| Installation, Maintenance & Repair | 14 (100.0%) | 0 (0.0%) |
| Total (Category) | 36 (100.0%) | 0 (0.0%) |
| Total (Overall) | 109 (55.3%) | 88 (44.7%) |
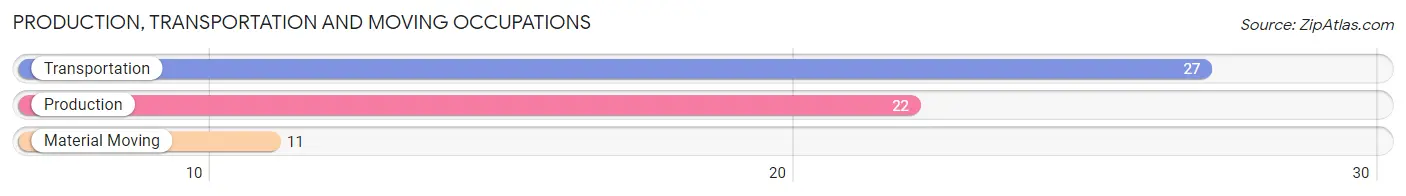
Production, Transportation and Moving Occupations
The most common Production, Transportation and Moving occupations in Jewett are Transportation (27 | 13.7%), Production (22 | 11.2%), and Material Moving (11 | 5.6%).
Production, Transportation and Moving Occupations by Sex
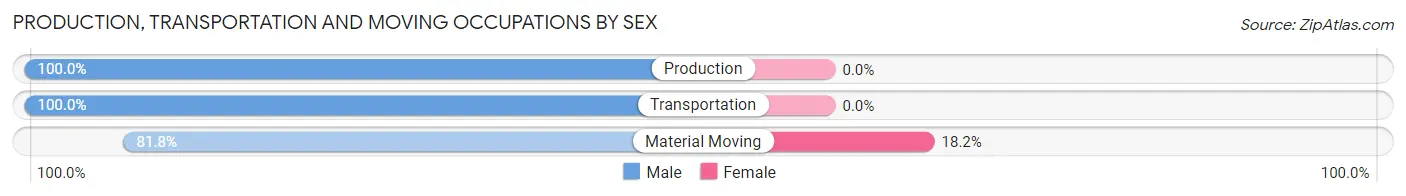
| Occupation | Male | Female |
| Production | 22 (100.0%) | 0 (0.0%) |
| Transportation | 27 (100.0%) | 0 (0.0%) |
| Material Moving | 9 (81.8%) | 2 (18.2%) |
| Total (Category) | 58 (96.7%) | 2 (3.3%) |
| Total (Overall) | 109 (55.3%) | 88 (44.7%) |
Employment Industries by Sex in Jewett
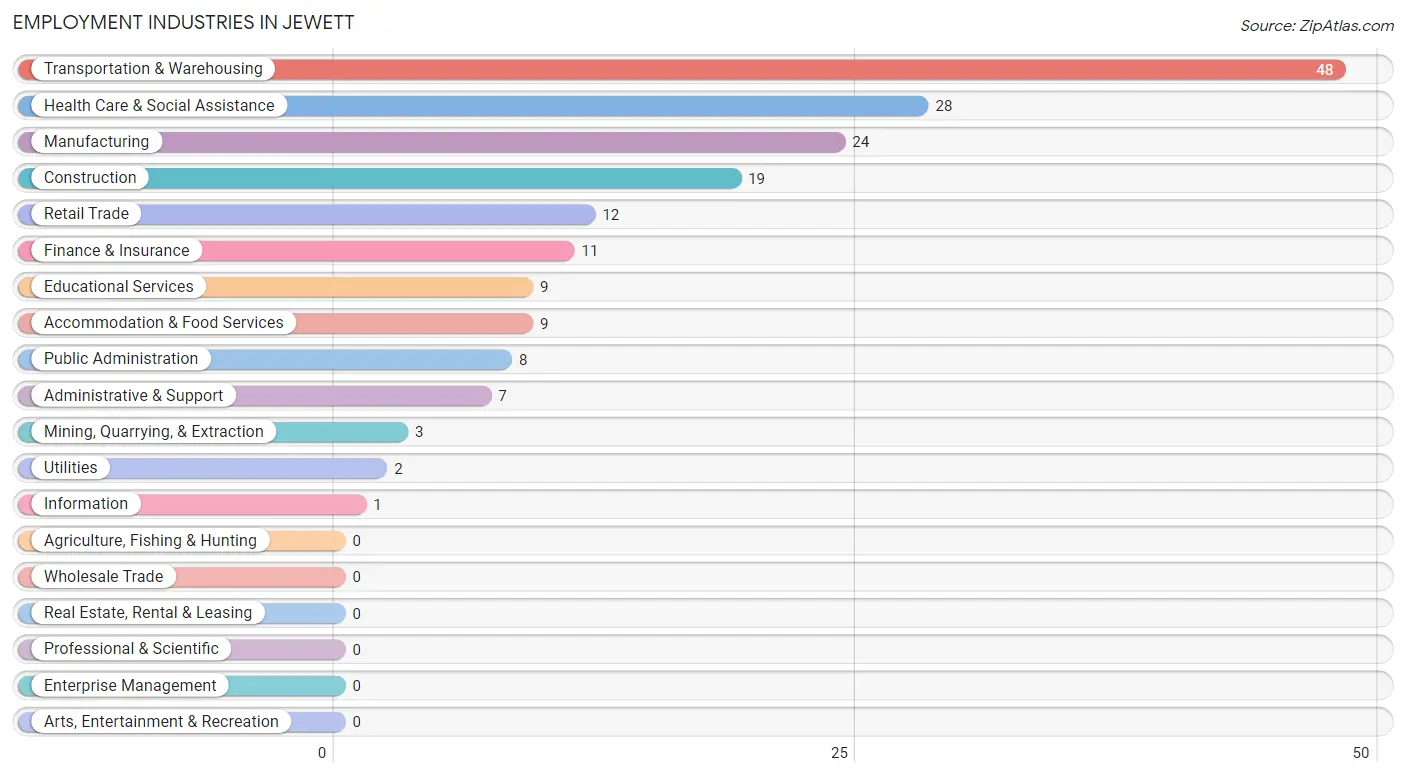
Employment Industries in Jewett
The major employment industries in Jewett include Transportation & Warehousing (48 | 24.4%), Health Care & Social Assistance (28 | 14.2%), Manufacturing (24 | 12.2%), Construction (19 | 9.6%), and Retail Trade (12 | 6.1%).
Employment Industries by Sex in Jewett
The Jewett industries that see more men than women are Mining, Quarrying, & Extraction (100.0%), Construction (100.0%), and Manufacturing (100.0%), whereas the industries that tend to have a higher number of women are Information (100.0%), Finance & Insurance (100.0%), and Educational Services (100.0%).
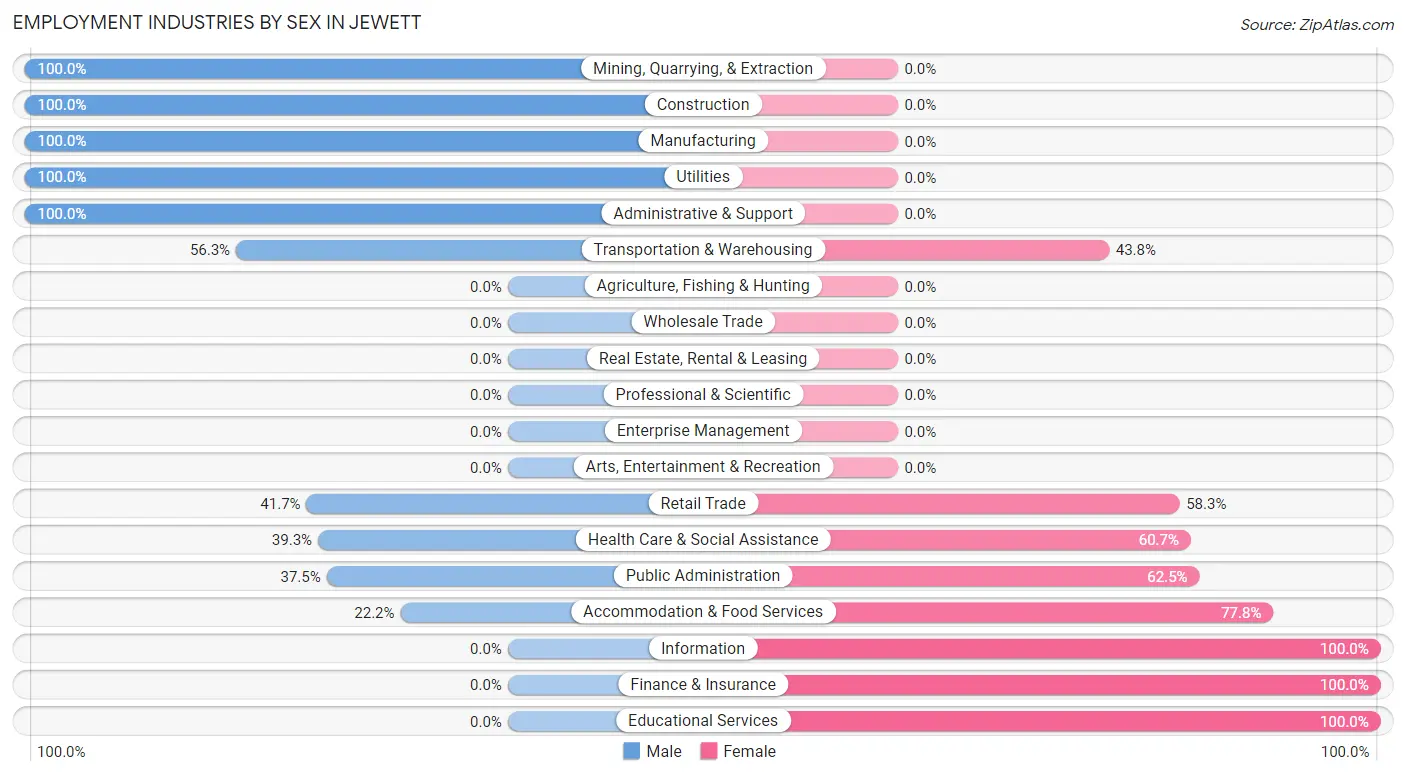
| Industry | Male | Female |
| Agriculture, Fishing & Hunting | 0 (0.0%) | 0 (0.0%) |
| Mining, Quarrying, & Extraction | 3 (100.0%) | 0 (0.0%) |
| Construction | 19 (100.0%) | 0 (0.0%) |
| Manufacturing | 24 (100.0%) | 0 (0.0%) |
| Wholesale Trade | 0 (0.0%) | 0 (0.0%) |
| Retail Trade | 5 (41.7%) | 7 (58.3%) |
| Transportation & Warehousing | 27 (56.2%) | 21 (43.8%) |
| Utilities | 2 (100.0%) | 0 (0.0%) |
| Information | 0 (0.0%) | 1 (100.0%) |
| Finance & Insurance | 0 (0.0%) | 11 (100.0%) |
| Real Estate, Rental & Leasing | 0 (0.0%) | 0 (0.0%) |
| Professional & Scientific | 0 (0.0%) | 0 (0.0%) |
| Enterprise Management | 0 (0.0%) | 0 (0.0%) |
| Administrative & Support | 7 (100.0%) | 0 (0.0%) |
| Educational Services | 0 (0.0%) | 9 (100.0%) |
| Health Care & Social Assistance | 11 (39.3%) | 17 (60.7%) |
| Arts, Entertainment & Recreation | 0 (0.0%) | 0 (0.0%) |
| Accommodation & Food Services | 2 (22.2%) | 7 (77.8%) |
| Public Administration | 3 (37.5%) | 5 (62.5%) |
| Total | 109 (55.3%) | 88 (44.7%) |
Education in Jewett
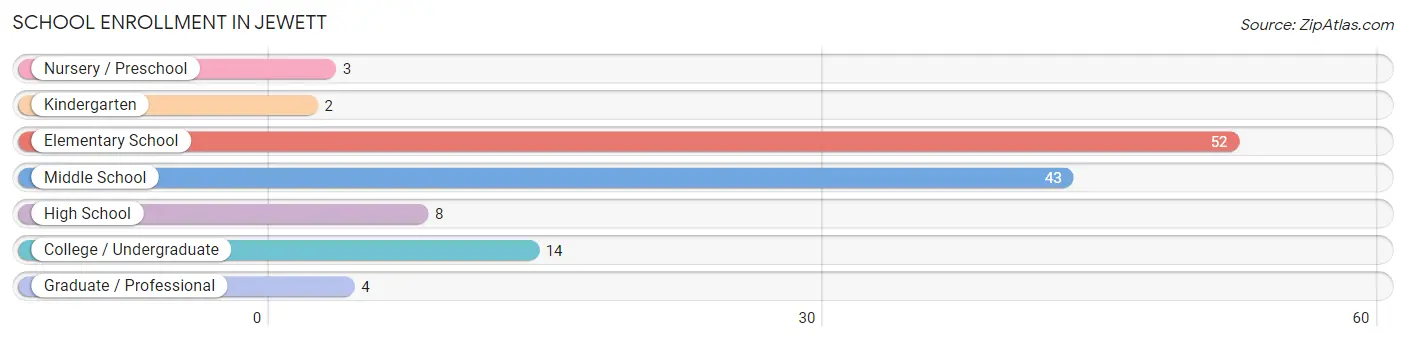
School Enrollment in Jewett
The most common levels of schooling among the 126 students in Jewett are elementary school (52 | 41.3%), middle school (43 | 34.1%), and college / undergraduate (14 | 11.1%).
| School Level | # Students | % Students |
| Nursery / Preschool | 3 | 2.4% |
| Kindergarten | 2 | 1.6% |
| Elementary School | 52 | 41.3% |
| Middle School | 43 | 34.1% |
| High School | 8 | 6.4% |
| College / Undergraduate | 14 | 11.1% |
| Graduate / Professional | 4 | 3.2% |
| Total | 126 | 100.0% |
School Enrollment by Age by Funding Source in Jewett
Out of a total of 126 students who are enrolled in schools in Jewett, 16 (12.7%) attend a private institution, while the remaining 110 (87.3%) are enrolled in public schools. The age group of 20 to 24 year olds has the highest likelihood of being enrolled in private schools, with 4 (50.0% in the age bracket) enrolled. Conversely, the age group of 3 to 4 year olds has the lowest likelihood of being enrolled in a private school, with 1 (100.0% in the age bracket) attending a public institution.
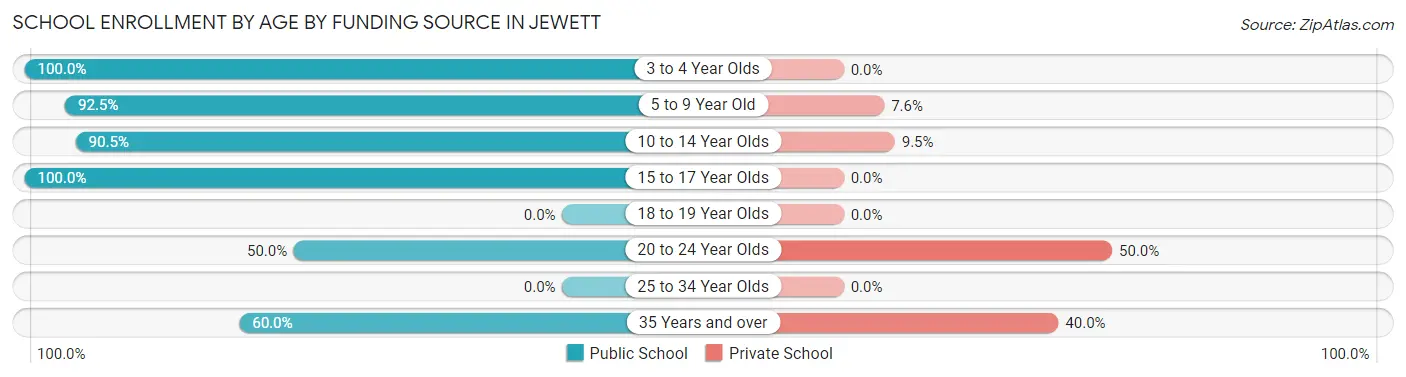
| Age Bracket | Public School | Private School |
| 3 to 4 Year Olds | 1 (100.0%) | 0 (0.0%) |
| 5 to 9 Year Old | 49 (92.4%) | 4 (7.5%) |
| 10 to 14 Year Olds | 38 (90.5%) | 4 (9.5%) |
| 15 to 17 Year Olds | 12 (100.0%) | 0 (0.0%) |
| 18 to 19 Year Olds | 0 (0.0%) | 0 (0.0%) |
| 20 to 24 Year Olds | 4 (50.0%) | 4 (50.0%) |
| 25 to 34 Year Olds | 0 (0.0%) | 0 (0.0%) |
| 35 Years and over | 6 (60.0%) | 4 (40.0%) |
| Total | 110 (87.3%) | 16 (12.7%) |
Educational Attainment by Field of Study in Jewett
Science & technology (16 | 33.3%), social sciences (15 | 31.2%), education (7 | 14.6%), business (6 | 12.5%), and engineering (4 | 8.3%) are the most common fields of study among 48 individuals in Jewett who have obtained a bachelor's degree or higher.
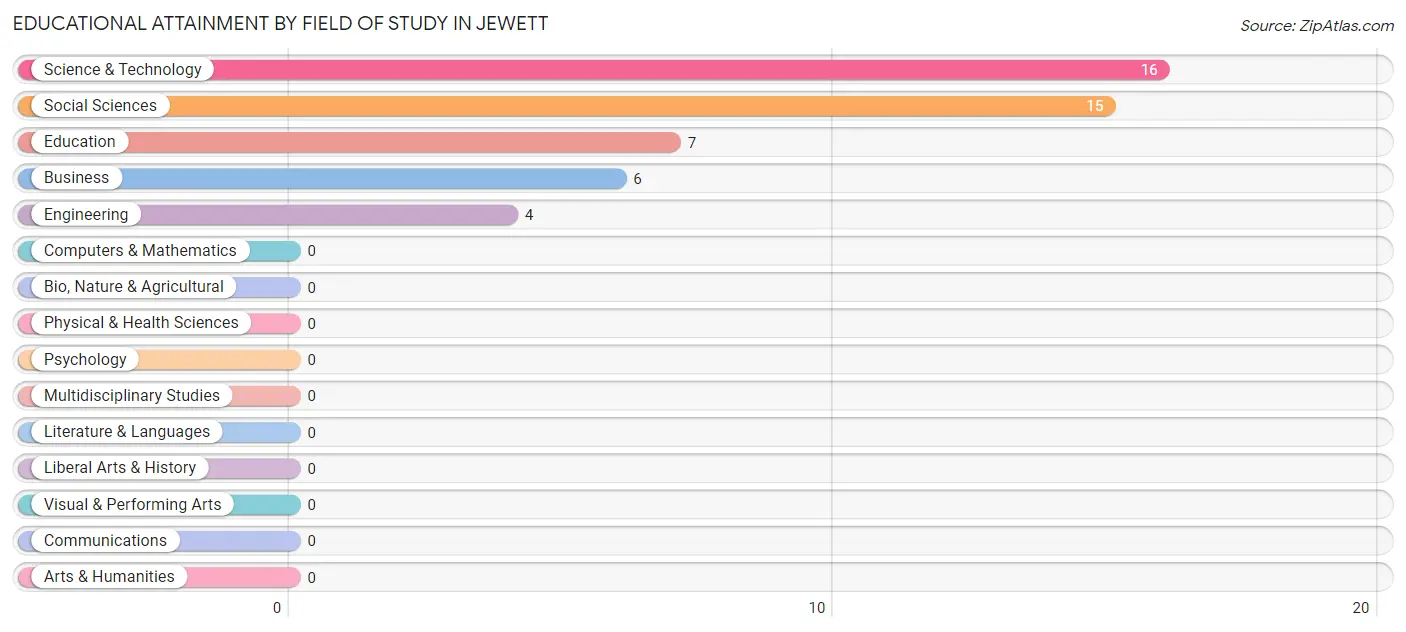
| Field of Study | # Graduates | % Graduates |
| Computers & Mathematics | 0 | 0.0% |
| Bio, Nature & Agricultural | 0 | 0.0% |
| Physical & Health Sciences | 0 | 0.0% |
| Psychology | 0 | 0.0% |
| Social Sciences | 15 | 31.2% |
| Engineering | 4 | 8.3% |
| Multidisciplinary Studies | 0 | 0.0% |
| Science & Technology | 16 | 33.3% |
| Business | 6 | 12.5% |
| Education | 7 | 14.6% |
| Literature & Languages | 0 | 0.0% |
| Liberal Arts & History | 0 | 0.0% |
| Visual & Performing Arts | 0 | 0.0% |
| Communications | 0 | 0.0% |
| Arts & Humanities | 0 | 0.0% |
| Total | 48 | 100.0% |
Transportation & Commute in Jewett
Vehicle Availability by Sex in Jewett
The most prevalent vehicle ownership categories in Jewett are males with 2 vehicles (54, accounting for 49.5%) and females with 2 vehicles (30, making up 61.4%).
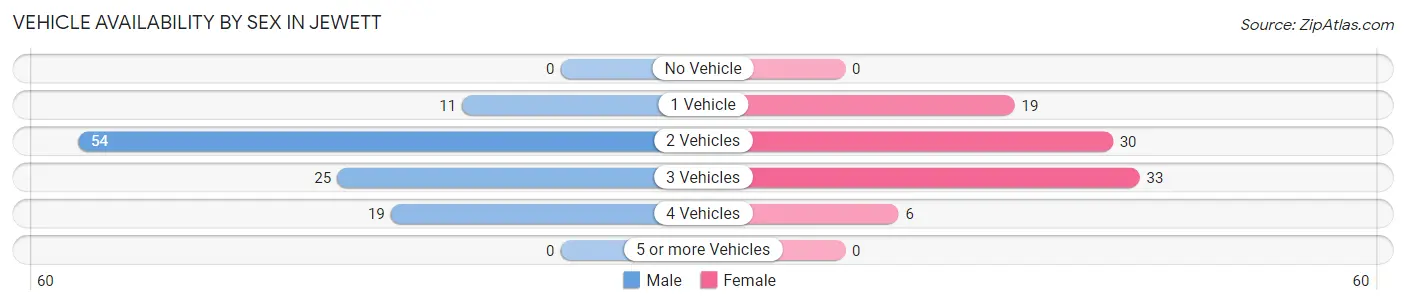
| Vehicles Available | Male | Female |
| No Vehicle | 0 (0.0%) | 0 (0.0%) |
| 1 Vehicle | 11 (10.1%) | 19 (21.6%) |
| 2 Vehicles | 54 (49.5%) | 30 (34.1%) |
| 3 Vehicles | 25 (22.9%) | 33 (37.5%) |
| 4 Vehicles | 19 (17.4%) | 6 (6.8%) |
| 5 or more Vehicles | 0 (0.0%) | 0 (0.0%) |
| Total | 109 (100.0%) | 88 (100.0%) |
Commute Time in Jewett
The most frequently occuring commute durations in Jewett are 15 to 19 minutes (37 commuters, 20.1%), 45 to 59 minutes (33 commuters, 17.9%), and 60 to 89 minutes (20 commuters, 10.9%).
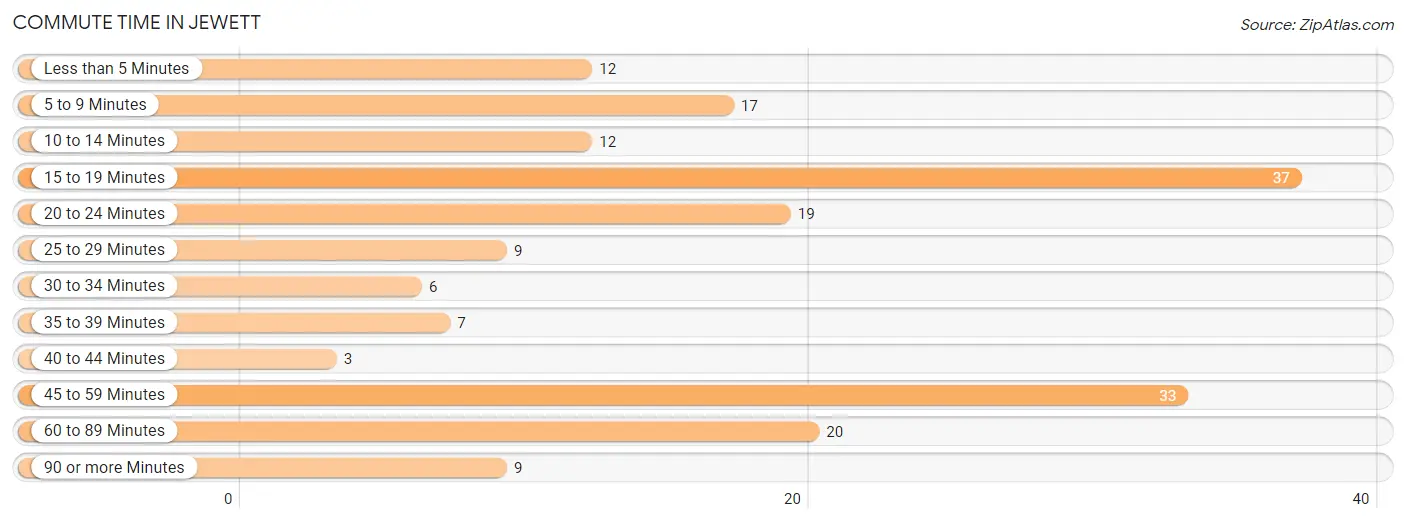
| Commute Time | # Commuters | % Commuters |
| Less than 5 Minutes | 12 | 6.5% |
| 5 to 9 Minutes | 17 | 9.2% |
| 10 to 14 Minutes | 12 | 6.5% |
| 15 to 19 Minutes | 37 | 20.1% |
| 20 to 24 Minutes | 19 | 10.3% |
| 25 to 29 Minutes | 9 | 4.9% |
| 30 to 34 Minutes | 6 | 3.3% |
| 35 to 39 Minutes | 7 | 3.8% |
| 40 to 44 Minutes | 3 | 1.6% |
| 45 to 59 Minutes | 33 | 17.9% |
| 60 to 89 Minutes | 20 | 10.9% |
| 90 or more Minutes | 9 | 4.9% |
Commute Time by Sex in Jewett
The most common commute times in Jewett are 45 to 59 minutes (28 commuters, 25.7%) for males and 15 to 19 minutes (21 commuters, 28.0%) for females.
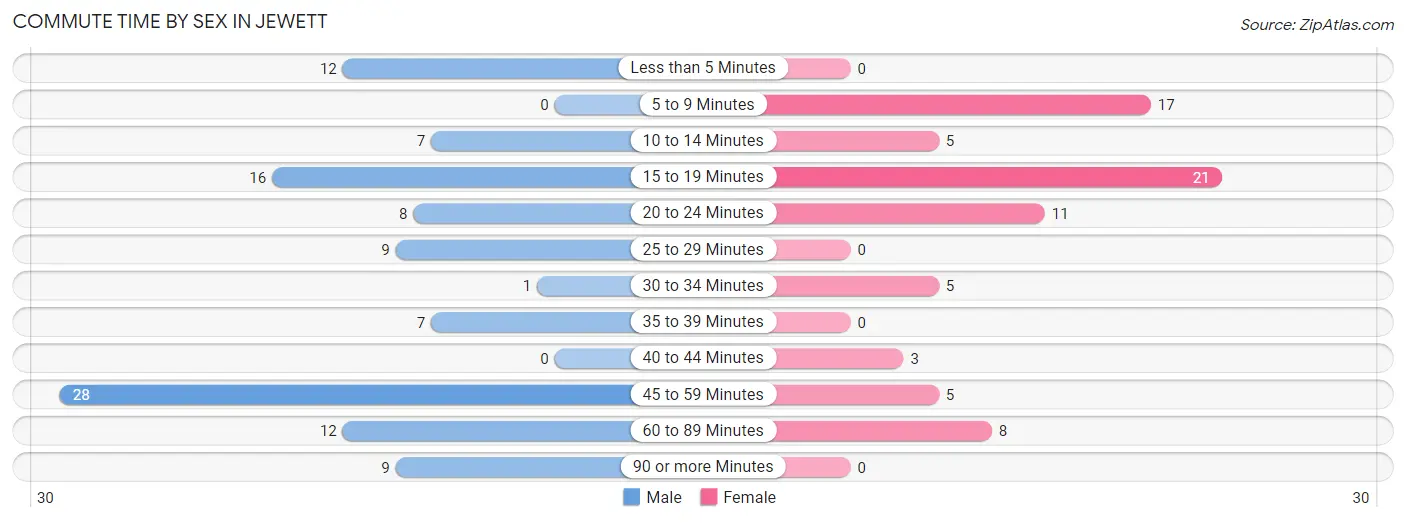
| Commute Time | Male | Female |
| Less than 5 Minutes | 12 (11.0%) | 0 (0.0%) |
| 5 to 9 Minutes | 0 (0.0%) | 17 (22.7%) |
| 10 to 14 Minutes | 7 (6.4%) | 5 (6.7%) |
| 15 to 19 Minutes | 16 (14.7%) | 21 (28.0%) |
| 20 to 24 Minutes | 8 (7.3%) | 11 (14.7%) |
| 25 to 29 Minutes | 9 (8.3%) | 0 (0.0%) |
| 30 to 34 Minutes | 1 (0.9%) | 5 (6.7%) |
| 35 to 39 Minutes | 7 (6.4%) | 0 (0.0%) |
| 40 to 44 Minutes | 0 (0.0%) | 3 (4.0%) |
| 45 to 59 Minutes | 28 (25.7%) | 5 (6.7%) |
| 60 to 89 Minutes | 12 (11.0%) | 8 (10.7%) |
| 90 or more Minutes | 9 (8.3%) | 0 (0.0%) |
Time of Departure to Work by Sex in Jewett
The most frequent times of departure to work in Jewett are 6:30 AM to 6:59 AM (20, 18.3%) for males and 7:30 AM to 7:59 AM (20, 26.7%) for females.
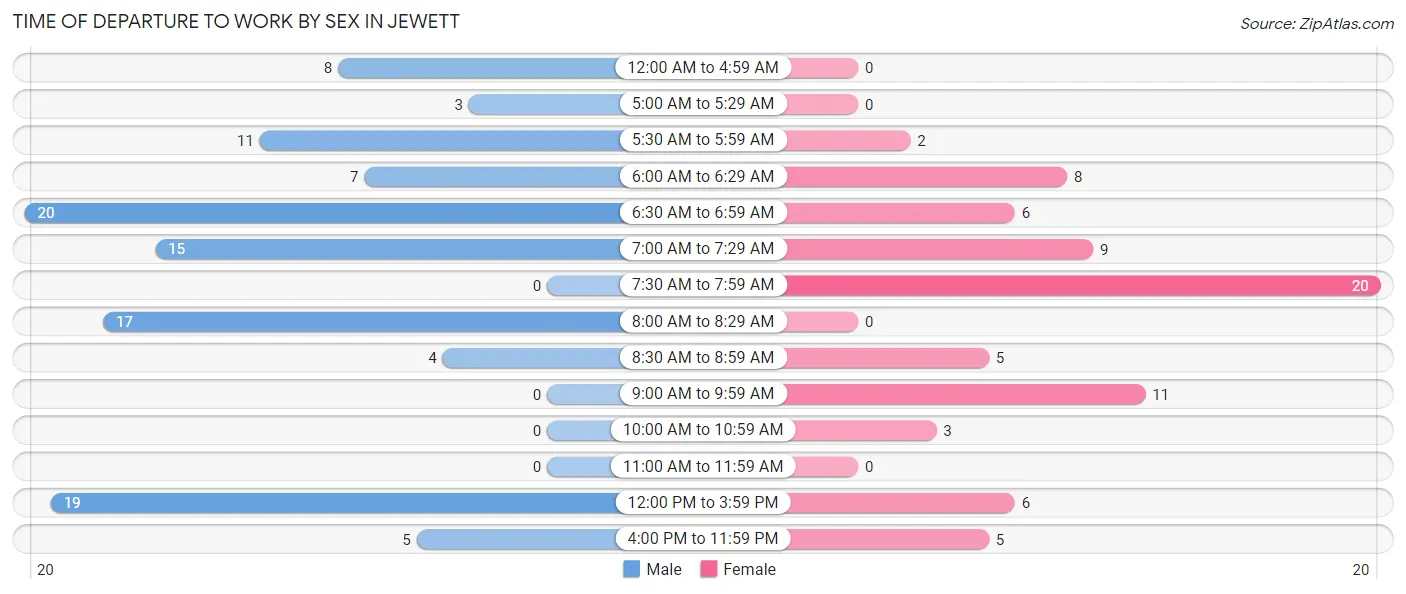
| Time of Departure | Male | Female |
| 12:00 AM to 4:59 AM | 8 (7.3%) | 0 (0.0%) |
| 5:00 AM to 5:29 AM | 3 (2.8%) | 0 (0.0%) |
| 5:30 AM to 5:59 AM | 11 (10.1%) | 2 (2.7%) |
| 6:00 AM to 6:29 AM | 7 (6.4%) | 8 (10.7%) |
| 6:30 AM to 6:59 AM | 20 (18.3%) | 6 (8.0%) |
| 7:00 AM to 7:29 AM | 15 (13.8%) | 9 (12.0%) |
| 7:30 AM to 7:59 AM | 0 (0.0%) | 20 (26.7%) |
| 8:00 AM to 8:29 AM | 17 (15.6%) | 0 (0.0%) |
| 8:30 AM to 8:59 AM | 4 (3.7%) | 5 (6.7%) |
| 9:00 AM to 9:59 AM | 0 (0.0%) | 11 (14.7%) |
| 10:00 AM to 10:59 AM | 0 (0.0%) | 3 (4.0%) |
| 11:00 AM to 11:59 AM | 0 (0.0%) | 0 (0.0%) |
| 12:00 PM to 3:59 PM | 19 (17.4%) | 6 (8.0%) |
| 4:00 PM to 11:59 PM | 5 (4.6%) | 5 (6.7%) |
| Total | 109 (100.0%) | 75 (100.0%) |
Housing Occupancy in Jewett
Occupancy by Ownership in Jewett
Of the total 220 dwellings in Jewett, owner-occupied units account for 159 (72.3%), while renter-occupied units make up 61 (27.7%).
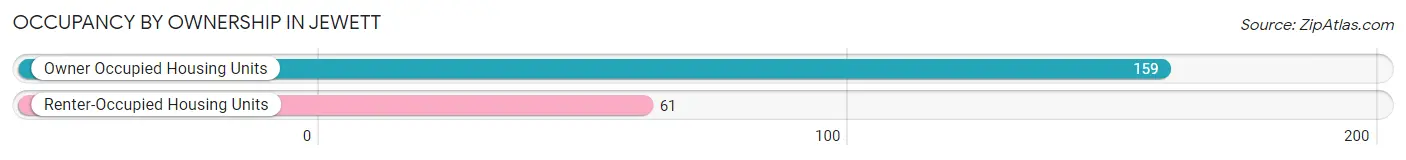
| Occupancy | # Housing Units | % Housing Units |
| Owner Occupied Housing Units | 159 | 72.3% |
| Renter-Occupied Housing Units | 61 | 27.7% |
| Total Occupied Housing Units | 220 | 100.0% |
Occupancy by Household Size in Jewett
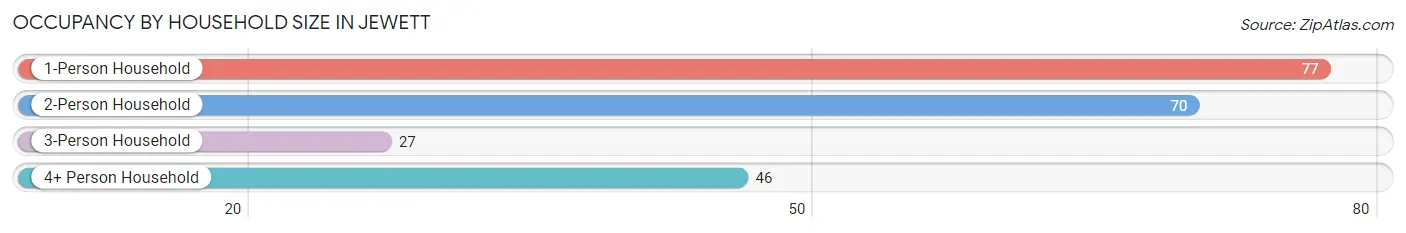
| Household Size | # Housing Units | % Housing Units |
| 1-Person Household | 77 | 35.0% |
| 2-Person Household | 70 | 31.8% |
| 3-Person Household | 27 | 12.3% |
| 4+ Person Household | 46 | 20.9% |
| Total Housing Units | 220 | 100.0% |
Occupancy by Ownership by Household Size in Jewett
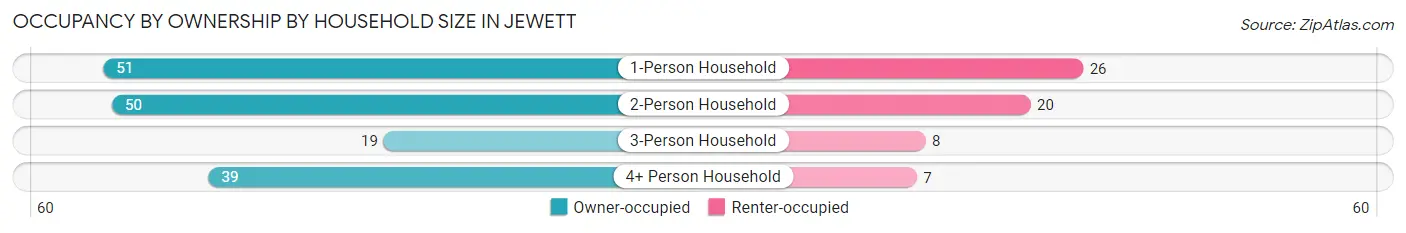
| Household Size | Owner-occupied | Renter-occupied |
| 1-Person Household | 51 (66.2%) | 26 (33.8%) |
| 2-Person Household | 50 (71.4%) | 20 (28.6%) |
| 3-Person Household | 19 (70.4%) | 8 (29.6%) |
| 4+ Person Household | 39 (84.8%) | 7 (15.2%) |
| Total Housing Units | 159 (72.3%) | 61 (27.7%) |
Occupancy by Educational Attainment in Jewett
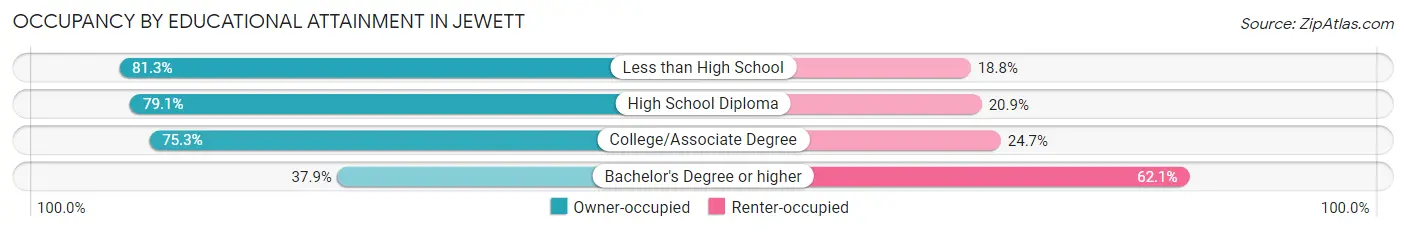
| Household Size | Owner-occupied | Renter-occupied |
| Less than High School | 13 (81.2%) | 3 (18.8%) |
| High School Diploma | 68 (79.1%) | 18 (20.9%) |
| College/Associate Degree | 67 (75.3%) | 22 (24.7%) |
| Bachelor's Degree or higher | 11 (37.9%) | 18 (62.1%) |
Occupancy by Age of Householder in Jewett
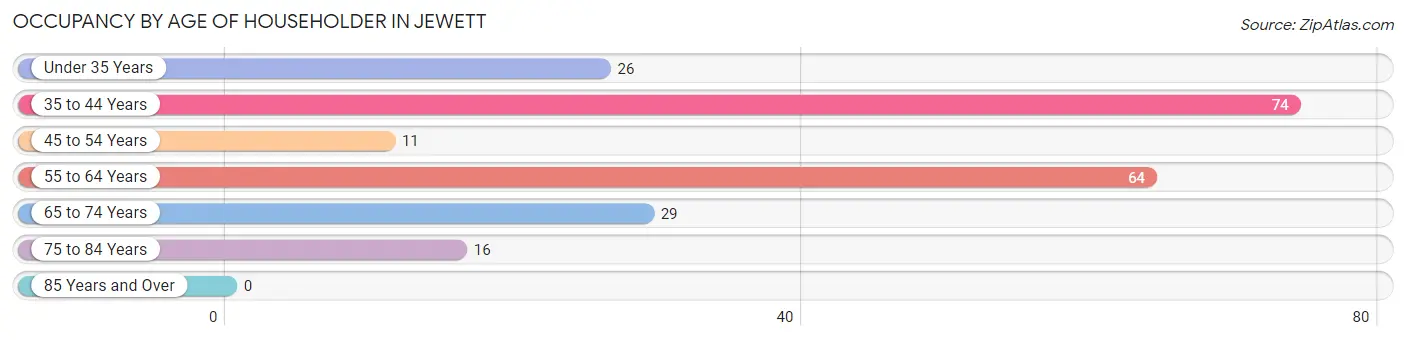
| Age Bracket | # Households | % Households |
| Under 35 Years | 26 | 11.8% |
| 35 to 44 Years | 74 | 33.6% |
| 45 to 54 Years | 11 | 5.0% |
| 55 to 64 Years | 64 | 29.1% |
| 65 to 74 Years | 29 | 13.2% |
| 75 to 84 Years | 16 | 7.3% |
| 85 Years and Over | 0 | 0.0% |
| Total | 220 | 100.0% |
Housing Finances in Jewett
Median Income by Occupancy in Jewett
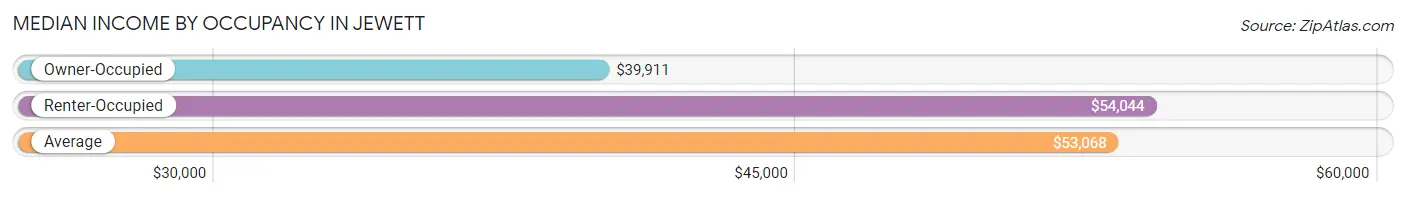
| Occupancy Type | # Households | Median Income |
| Owner-Occupied | 159 (72.3%) | $39,911 |
| Renter-Occupied | 61 (27.7%) | $54,044 |
| Average | 220 (100.0%) | $53,068 |
Occupancy by Householder Income Bracket in Jewett
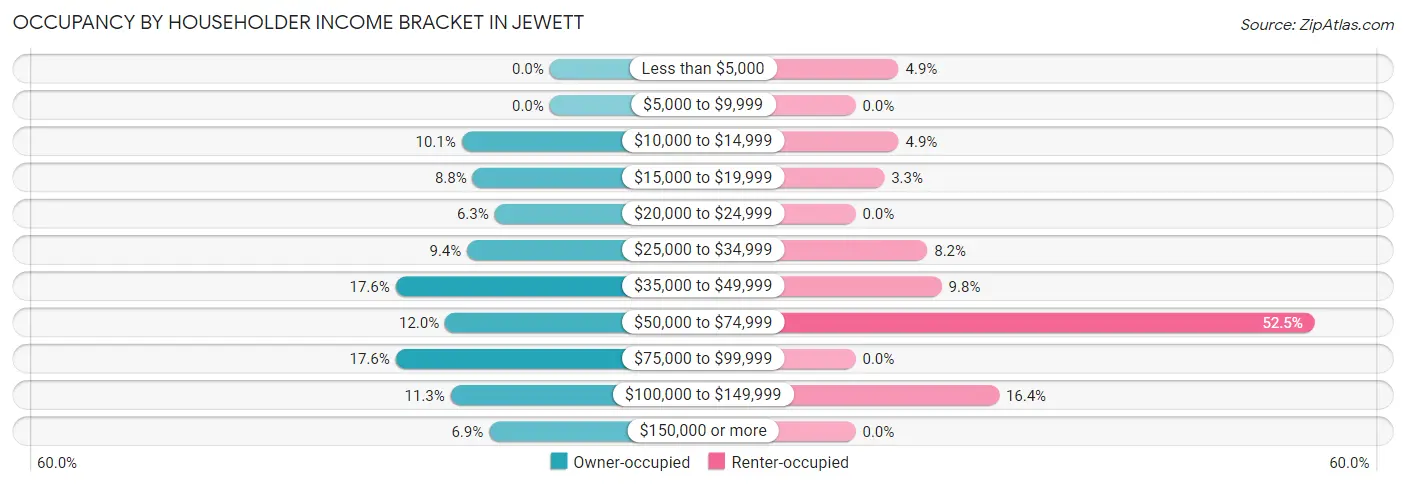
| Income Bracket | Owner-occupied | Renter-occupied |
| Less than $5,000 | 0 (0.0%) | 3 (4.9%) |
| $5,000 to $9,999 | 0 (0.0%) | 0 (0.0%) |
| $10,000 to $14,999 | 16 (10.1%) | 3 (4.9%) |
| $15,000 to $19,999 | 14 (8.8%) | 2 (3.3%) |
| $20,000 to $24,999 | 10 (6.3%) | 0 (0.0%) |
| $25,000 to $34,999 | 15 (9.4%) | 5 (8.2%) |
| $35,000 to $49,999 | 28 (17.6%) | 6 (9.8%) |
| $50,000 to $74,999 | 19 (11.9%) | 32 (52.5%) |
| $75,000 to $99,999 | 28 (17.6%) | 0 (0.0%) |
| $100,000 to $149,999 | 18 (11.3%) | 10 (16.4%) |
| $150,000 or more | 11 (6.9%) | 0 (0.0%) |
| Total | 159 (100.0%) | 61 (100.0%) |
Monthly Housing Cost Tiers in Jewett
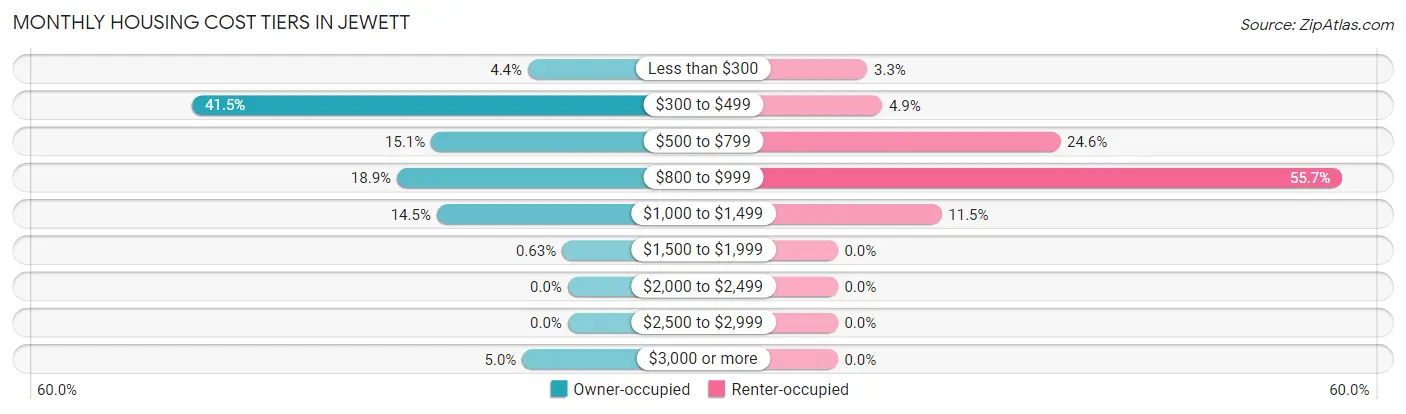
| Monthly Cost | Owner-occupied | Renter-occupied |
| Less than $300 | 7 (4.4%) | 2 (3.3%) |
| $300 to $499 | 66 (41.5%) | 3 (4.9%) |
| $500 to $799 | 24 (15.1%) | 15 (24.6%) |
| $800 to $999 | 30 (18.9%) | 34 (55.7%) |
| $1,000 to $1,499 | 23 (14.5%) | 7 (11.5%) |
| $1,500 to $1,999 | 1 (0.6%) | 0 (0.0%) |
| $2,000 to $2,499 | 0 (0.0%) | 0 (0.0%) |
| $2,500 to $2,999 | 0 (0.0%) | 0 (0.0%) |
| $3,000 or more | 8 (5.0%) | 0 (0.0%) |
| Total | 159 (100.0%) | 61 (100.0%) |
Physical Housing Characteristics in Jewett
Housing Structures in Jewett
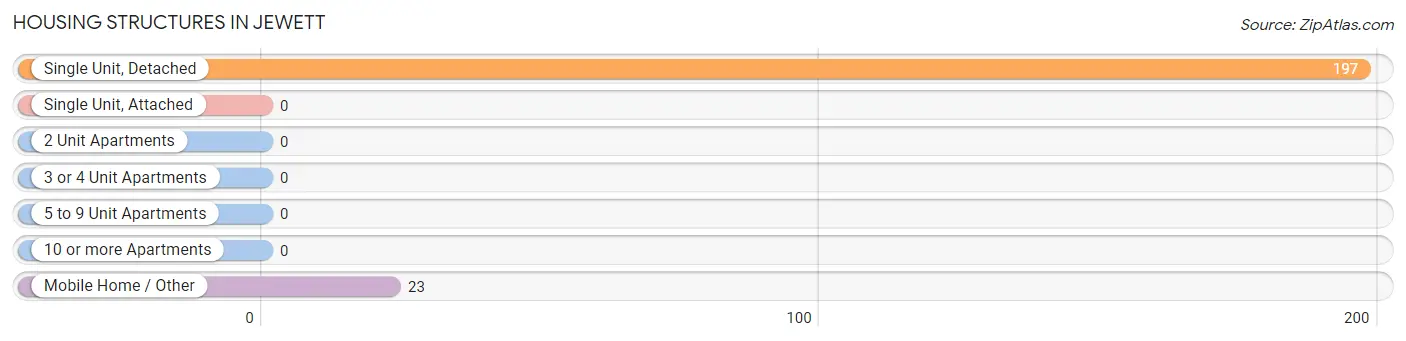
| Structure Type | # Housing Units | % Housing Units |
| Single Unit, Detached | 197 | 89.5% |
| Single Unit, Attached | 0 | 0.0% |
| 2 Unit Apartments | 0 | 0.0% |
| 3 or 4 Unit Apartments | 0 | 0.0% |
| 5 to 9 Unit Apartments | 0 | 0.0% |
| 10 or more Apartments | 0 | 0.0% |
| Mobile Home / Other | 23 | 10.4% |
| Total | 220 | 100.0% |
Housing Structures by Occupancy in Jewett
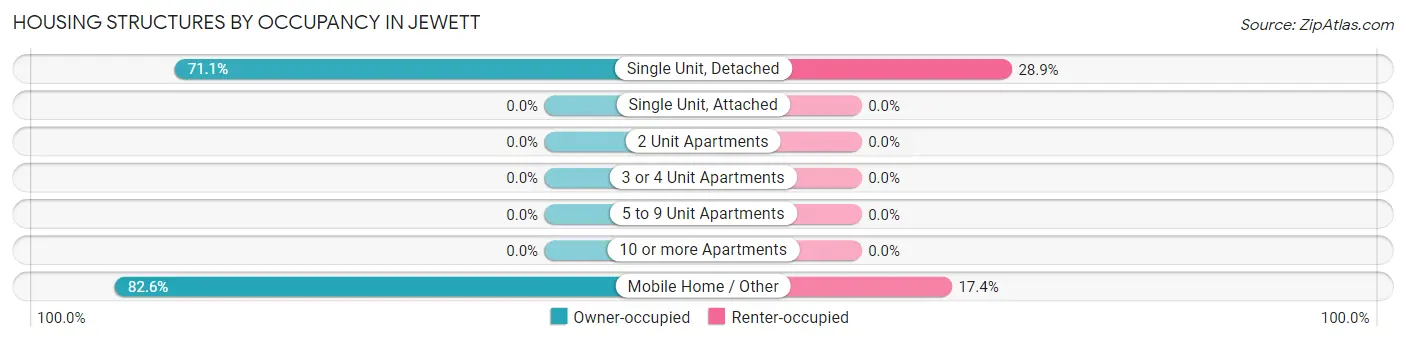
| Structure Type | Owner-occupied | Renter-occupied |
| Single Unit, Detached | 140 (71.1%) | 57 (28.9%) |
| Single Unit, Attached | 0 (0.0%) | 0 (0.0%) |
| 2 Unit Apartments | 0 (0.0%) | 0 (0.0%) |
| 3 or 4 Unit Apartments | 0 (0.0%) | 0 (0.0%) |
| 5 to 9 Unit Apartments | 0 (0.0%) | 0 (0.0%) |
| 10 or more Apartments | 0 (0.0%) | 0 (0.0%) |
| Mobile Home / Other | 19 (82.6%) | 4 (17.4%) |
| Total | 159 (72.3%) | 61 (27.7%) |
Housing Structures by Number of Rooms in Jewett
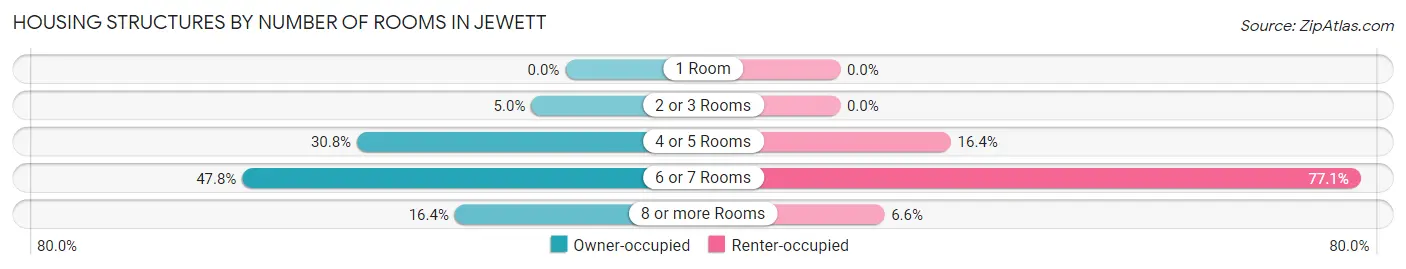
| Number of Rooms | Owner-occupied | Renter-occupied |
| 1 Room | 0 (0.0%) | 0 (0.0%) |
| 2 or 3 Rooms | 8 (5.0%) | 0 (0.0%) |
| 4 or 5 Rooms | 49 (30.8%) | 10 (16.4%) |
| 6 or 7 Rooms | 76 (47.8%) | 47 (77.0%) |
| 8 or more Rooms | 26 (16.4%) | 4 (6.6%) |
| Total | 159 (100.0%) | 61 (100.0%) |
Housing Structure by Heating Type in Jewett
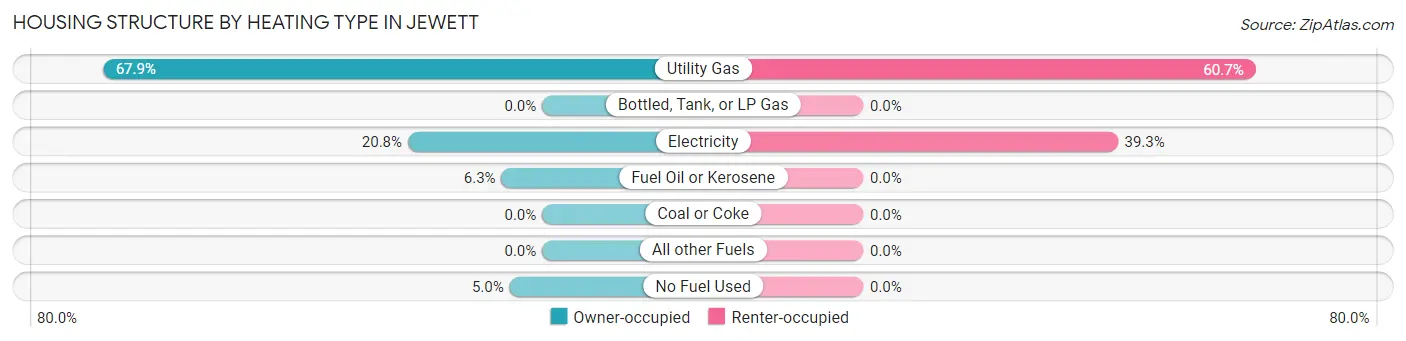
| Heating Type | Owner-occupied | Renter-occupied |
| Utility Gas | 108 (67.9%) | 37 (60.7%) |
| Bottled, Tank, or LP Gas | 0 (0.0%) | 0 (0.0%) |
| Electricity | 33 (20.7%) | 24 (39.3%) |
| Fuel Oil or Kerosene | 10 (6.3%) | 0 (0.0%) |
| Coal or Coke | 0 (0.0%) | 0 (0.0%) |
| All other Fuels | 0 (0.0%) | 0 (0.0%) |
| No Fuel Used | 8 (5.0%) | 0 (0.0%) |
| Total | 159 (100.0%) | 61 (100.0%) |
Household Vehicle Usage in Jewett
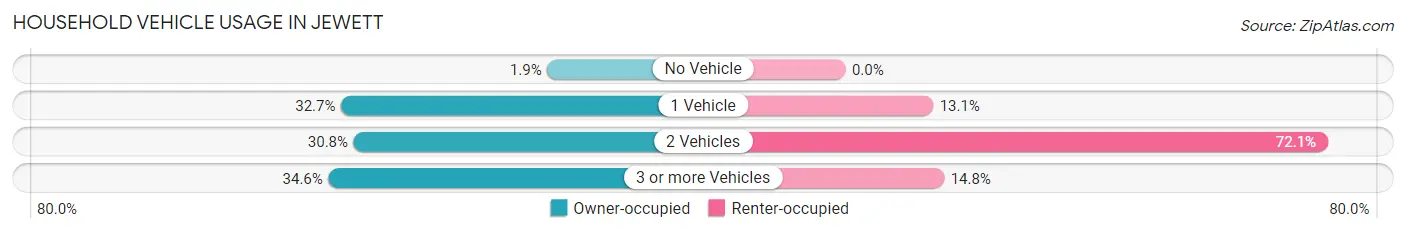
| Vehicles per Household | Owner-occupied | Renter-occupied |
| No Vehicle | 3 (1.9%) | 0 (0.0%) |
| 1 Vehicle | 52 (32.7%) | 8 (13.1%) |
| 2 Vehicles | 49 (30.8%) | 44 (72.1%) |
| 3 or more Vehicles | 55 (34.6%) | 9 (14.7%) |
| Total | 159 (100.0%) | 61 (100.0%) |
Real Estate & Mortgages in Jewett
Real Estate and Mortgage Overview in Jewett
| Characteristic | Without Mortgage | With Mortgage |
| Housing Units | 101 | 58 |
| Median Property Value | $75,900 | $88,900 |
| Median Household Income | $35,341 | $3 |
| Monthly Housing Costs | $344 | $0 |
| Real Estate Taxes | $750 | $2 |
Property Value by Mortgage Status in Jewett
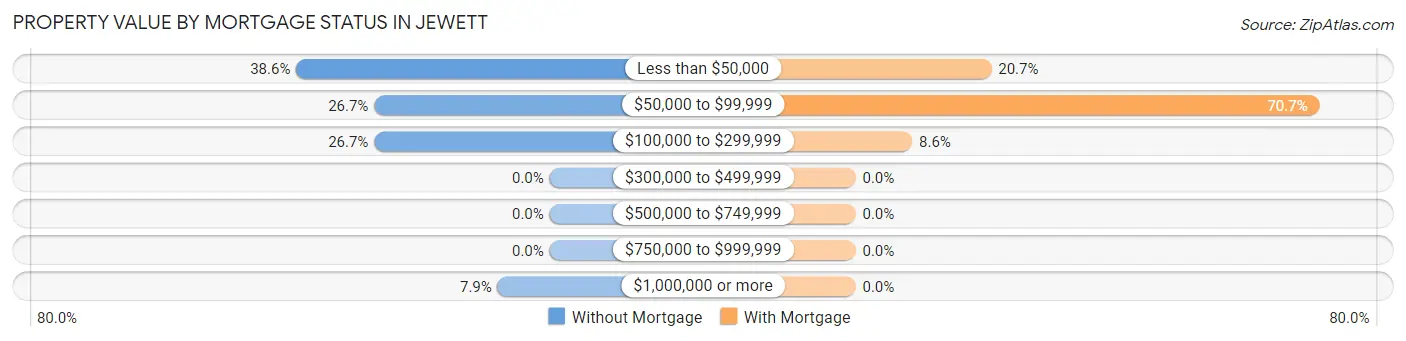
| Property Value | Without Mortgage | With Mortgage |
| Less than $50,000 | 39 (38.6%) | 12 (20.7%) |
| $50,000 to $99,999 | 27 (26.7%) | 41 (70.7%) |
| $100,000 to $299,999 | 27 (26.7%) | 5 (8.6%) |
| $300,000 to $499,999 | 0 (0.0%) | 0 (0.0%) |
| $500,000 to $749,999 | 0 (0.0%) | 0 (0.0%) |
| $750,000 to $999,999 | 0 (0.0%) | 0 (0.0%) |
| $1,000,000 or more | 8 (7.9%) | 0 (0.0%) |
| Total | 101 (100.0%) | 58 (100.0%) |
Household Income by Mortgage Status in Jewett
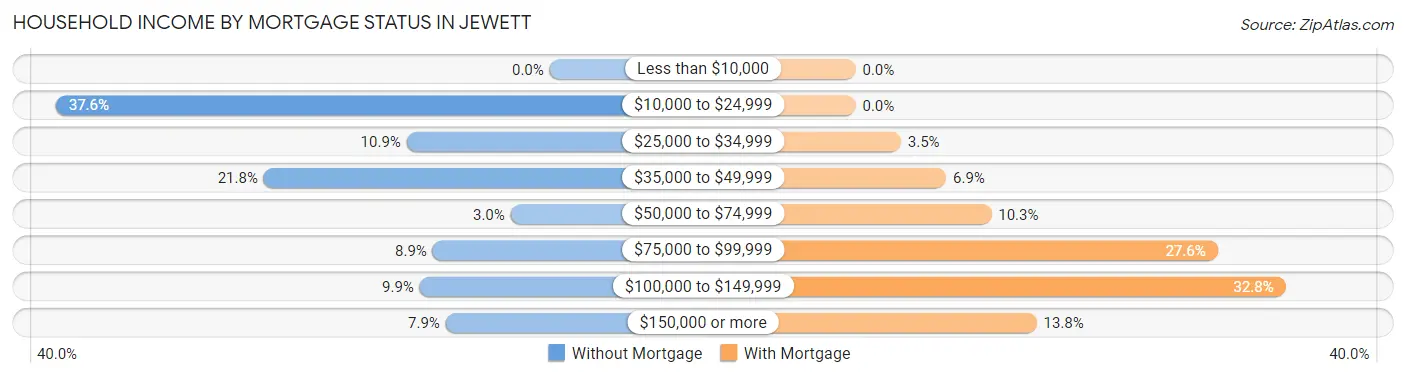
| Household Income | Without Mortgage | With Mortgage |
| Less than $10,000 | 0 (0.0%) | 0 (0.0%) |
| $10,000 to $24,999 | 38 (37.6%) | 0 (0.0%) |
| $25,000 to $34,999 | 11 (10.9%) | 2 (3.5%) |
| $35,000 to $49,999 | 22 (21.8%) | 4 (6.9%) |
| $50,000 to $74,999 | 3 (3.0%) | 6 (10.3%) |
| $75,000 to $99,999 | 9 (8.9%) | 16 (27.6%) |
| $100,000 to $149,999 | 10 (9.9%) | 19 (32.8%) |
| $150,000 or more | 8 (7.9%) | 8 (13.8%) |
| Total | 101 (100.0%) | 58 (100.0%) |
Property Value to Household Income Ratio in Jewett
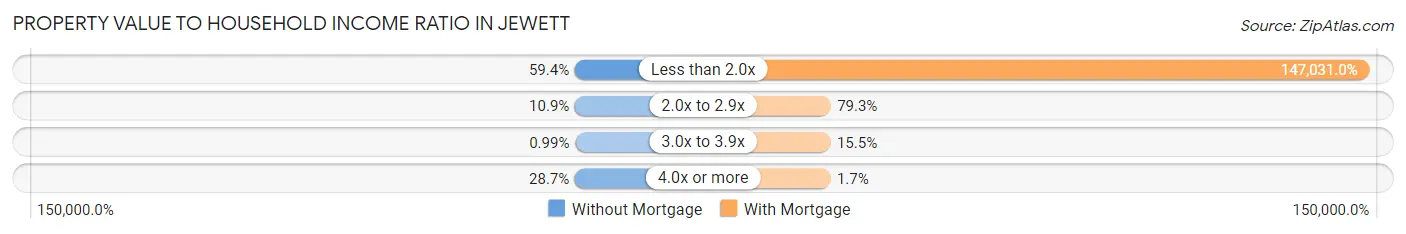
| Value-to-Income Ratio | Without Mortgage | With Mortgage |
| Less than 2.0x | 60 (59.4%) | 85,278 (147,031.0%) |
| 2.0x to 2.9x | 11 (10.9%) | 46 (79.3%) |
| 3.0x to 3.9x | 1 (1.0%) | 9 (15.5%) |
| 4.0x or more | 29 (28.7%) | 1 (1.7%) |
| Total | 101 (100.0%) | 58 (100.0%) |
Real Estate Taxes by Mortgage Status in Jewett
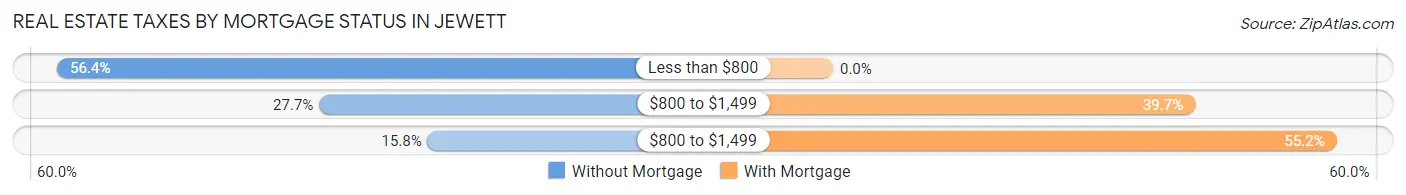
| Property Taxes | Without Mortgage | With Mortgage |
| Less than $800 | 57 (56.4%) | 0 (0.0%) |
| $800 to $1,499 | 28 (27.7%) | 23 (39.7%) |
| $800 to $1,499 | 16 (15.8%) | 32 (55.2%) |
| Total | 101 (100.0%) | 58 (100.0%) |
Health & Disability in Jewett
Health Insurance Coverage by Age in Jewett
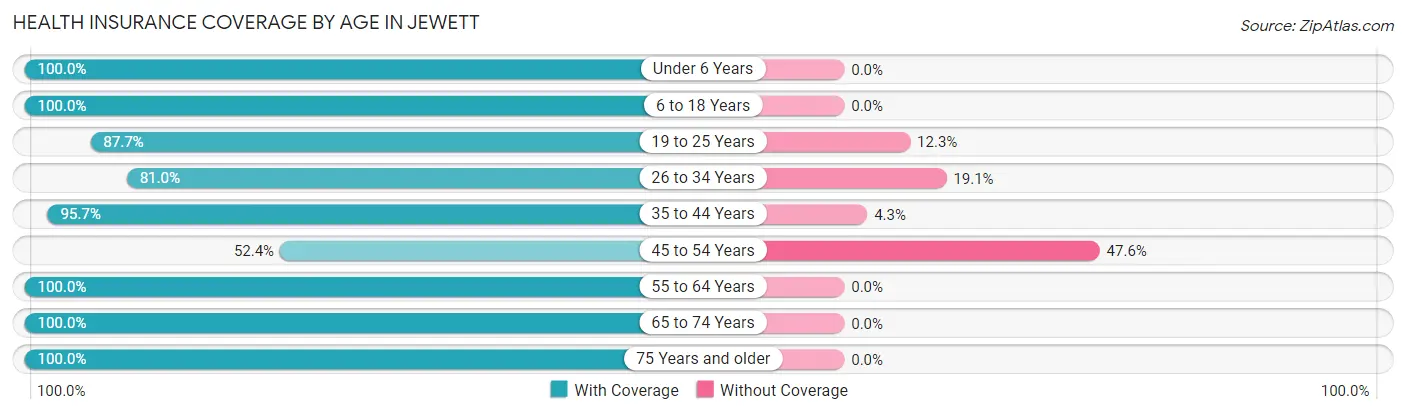
| Age Bracket | With Coverage | Without Coverage |
| Under 6 Years | 8 (100.0%) | 0 (0.0%) |
| 6 to 18 Years | 105 (100.0%) | 0 (0.0%) |
| 19 to 25 Years | 50 (87.7%) | 7 (12.3%) |
| 26 to 34 Years | 34 (80.9%) | 8 (19.1%) |
| 35 to 44 Years | 112 (95.7%) | 5 (4.3%) |
| 45 to 54 Years | 22 (52.4%) | 20 (47.6%) |
| 55 to 64 Years | 72 (100.0%) | 0 (0.0%) |
| 65 to 74 Years | 59 (100.0%) | 0 (0.0%) |
| 75 Years and older | 16 (100.0%) | 0 (0.0%) |
| Total | 478 (92.3%) | 40 (7.7%) |
Health Insurance Coverage by Citizenship Status in Jewett
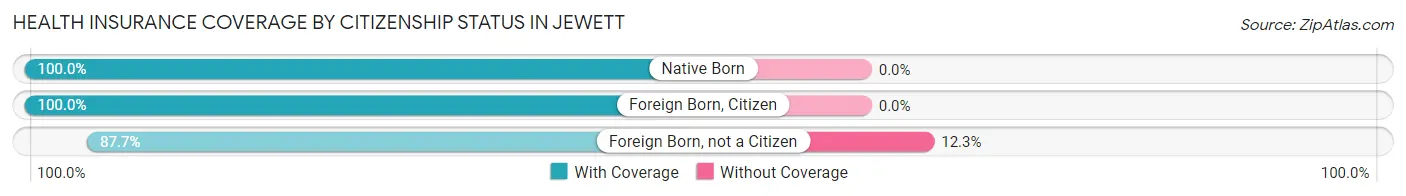
| Citizenship Status | With Coverage | Without Coverage |
| Native Born | 8 (100.0%) | 0 (0.0%) |
| Foreign Born, Citizen | 105 (100.0%) | 0 (0.0%) |
| Foreign Born, not a Citizen | 50 (87.7%) | 7 (12.3%) |
Health Insurance Coverage by Household Income in Jewett
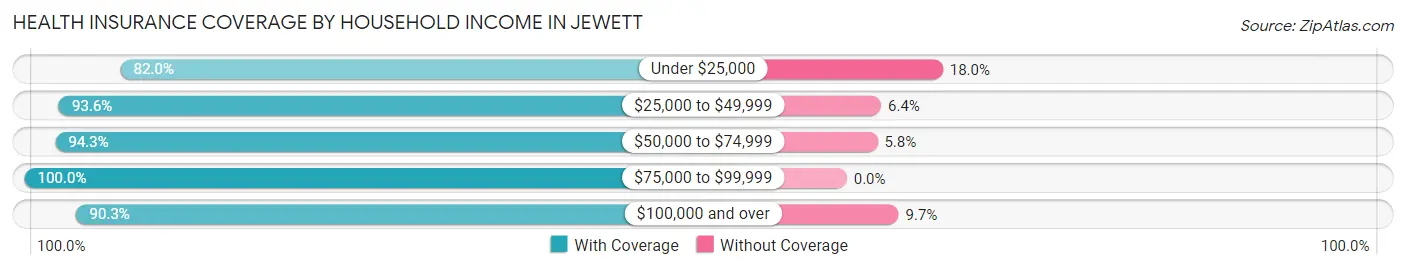
| Household Income | With Coverage | Without Coverage |
| Under $25,000 | 73 (82.0%) | 16 (18.0%) |
| $25,000 to $49,999 | 131 (93.6%) | 9 (6.4%) |
| $50,000 to $74,999 | 82 (94.3%) | 5 (5.8%) |
| $75,000 to $99,999 | 99 (100.0%) | 0 (0.0%) |
| $100,000 and over | 93 (90.3%) | 10 (9.7%) |
Public vs Private Health Insurance Coverage by Age in Jewett
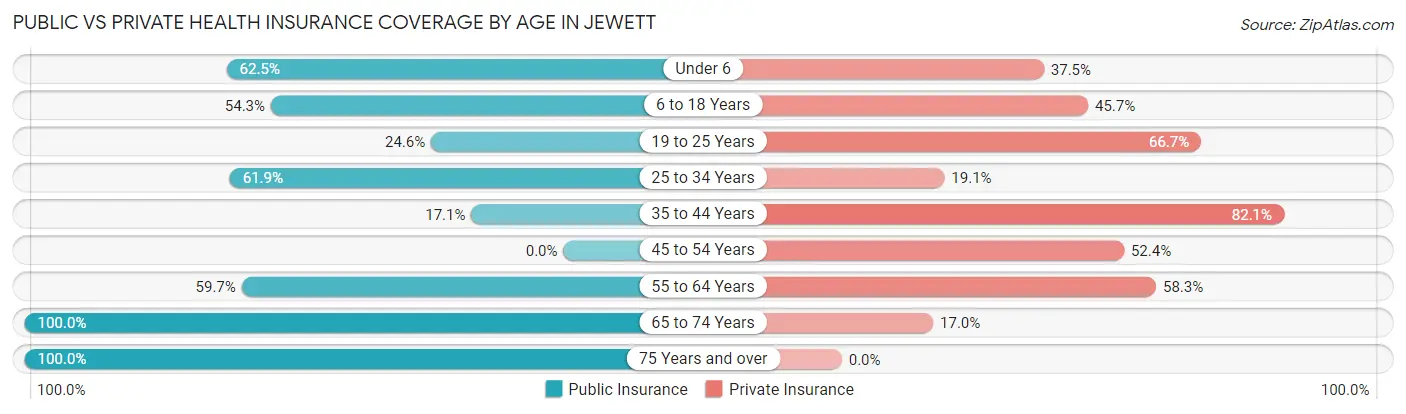
| Age Bracket | Public Insurance | Private Insurance |
| Under 6 | 5 (62.5%) | 3 (37.5%) |
| 6 to 18 Years | 57 (54.3%) | 48 (45.7%) |
| 19 to 25 Years | 14 (24.6%) | 38 (66.7%) |
| 25 to 34 Years | 26 (61.9%) | 8 (19.1%) |
| 35 to 44 Years | 20 (17.1%) | 96 (82.1%) |
| 45 to 54 Years | 0 (0.0%) | 22 (52.4%) |
| 55 to 64 Years | 43 (59.7%) | 42 (58.3%) |
| 65 to 74 Years | 59 (100.0%) | 10 (17.0%) |
| 75 Years and over | 16 (100.0%) | 0 (0.0%) |
| Total | 240 (46.3%) | 267 (51.5%) |
Disability Status by Sex by Age in Jewett
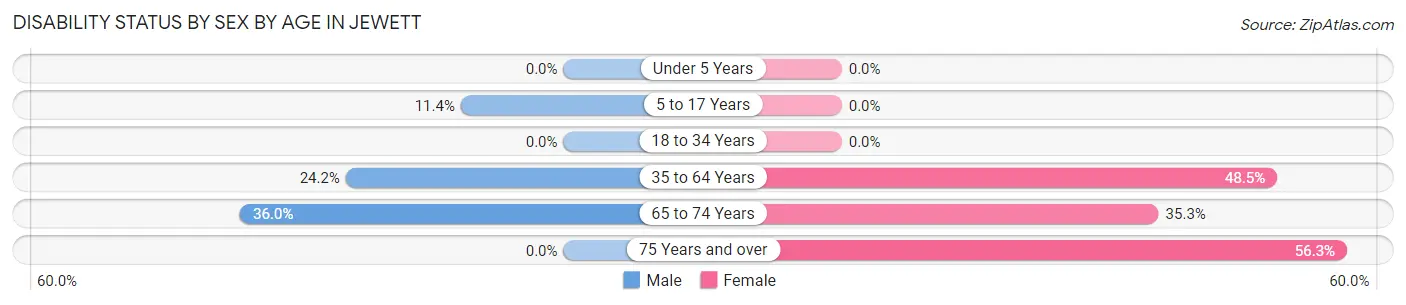
| Age Bracket | Male | Female |
| Under 5 Years | 0 (0.0%) | 0 (0.0%) |
| 5 to 17 Years | 8 (11.4%) | 0 (0.0%) |
| 18 to 34 Years | 0 (0.0%) | 0 (0.0%) |
| 35 to 64 Years | 32 (24.2%) | 48 (48.5%) |
| 65 to 74 Years | 9 (36.0%) | 12 (35.3%) |
| 75 Years and over | 0 (0.0%) | 9 (56.2%) |
Disability Class by Sex by Age in Jewett
Disability Class: Hearing Difficulty
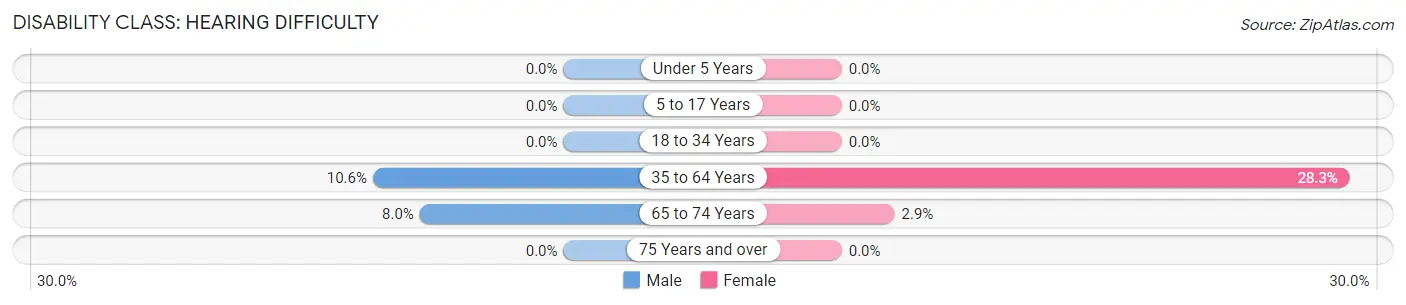
| Age Bracket | Male | Female |
| Under 5 Years | 0 (0.0%) | 0 (0.0%) |
| 5 to 17 Years | 0 (0.0%) | 0 (0.0%) |
| 18 to 34 Years | 0 (0.0%) | 0 (0.0%) |
| 35 to 64 Years | 14 (10.6%) | 28 (28.3%) |
| 65 to 74 Years | 2 (8.0%) | 1 (2.9%) |
| 75 Years and over | 0 (0.0%) | 0 (0.0%) |
Disability Class: Vision Difficulty
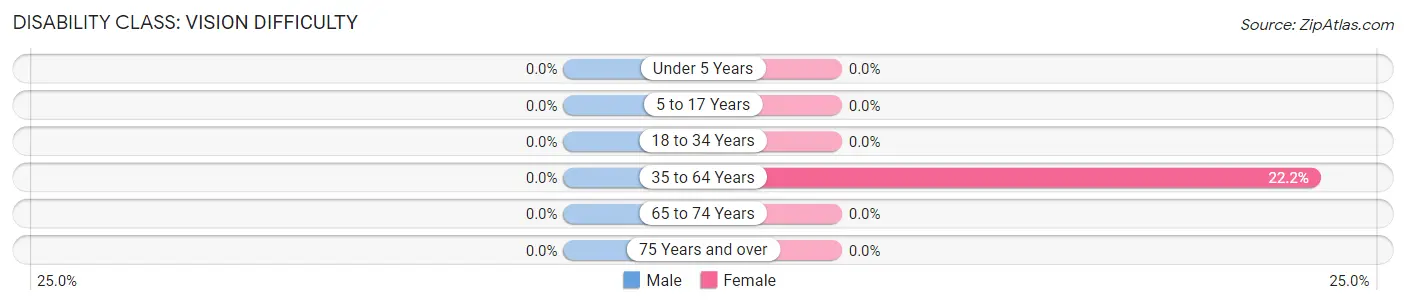
| Age Bracket | Male | Female |
| Under 5 Years | 0 (0.0%) | 0 (0.0%) |
| 5 to 17 Years | 0 (0.0%) | 0 (0.0%) |
| 18 to 34 Years | 0 (0.0%) | 0 (0.0%) |
| 35 to 64 Years | 0 (0.0%) | 22 (22.2%) |
| 65 to 74 Years | 0 (0.0%) | 0 (0.0%) |
| 75 Years and over | 0 (0.0%) | 0 (0.0%) |
Disability Class: Cognitive Difficulty
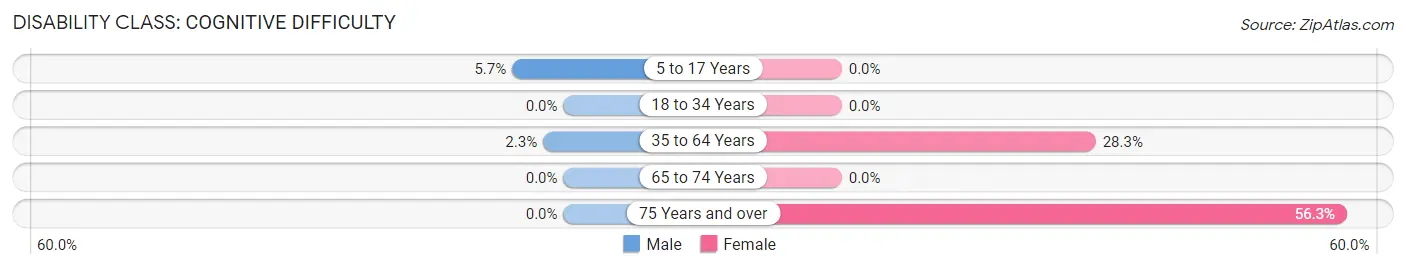
| Age Bracket | Male | Female |
| 5 to 17 Years | 4 (5.7%) | 0 (0.0%) |
| 18 to 34 Years | 0 (0.0%) | 0 (0.0%) |
| 35 to 64 Years | 3 (2.3%) | 28 (28.3%) |
| 65 to 74 Years | 0 (0.0%) | 0 (0.0%) |
| 75 Years and over | 0 (0.0%) | 9 (56.2%) |
Disability Class: Ambulatory Difficulty
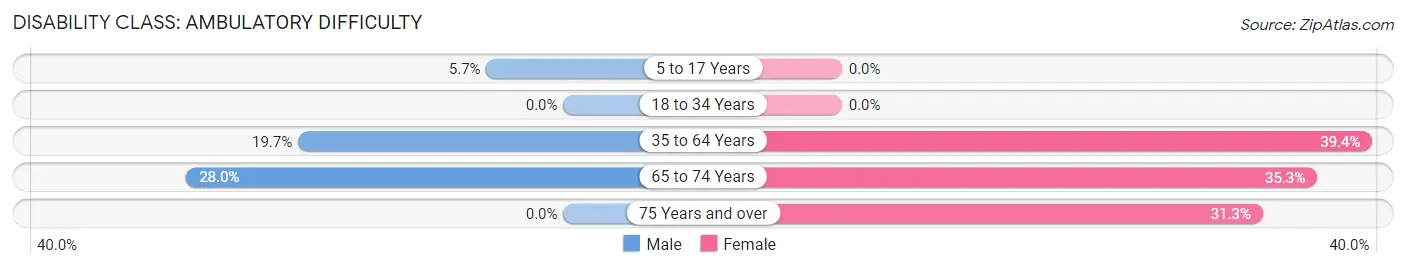
| Age Bracket | Male | Female |
| 5 to 17 Years | 4 (5.7%) | 0 (0.0%) |
| 18 to 34 Years | 0 (0.0%) | 0 (0.0%) |
| 35 to 64 Years | 26 (19.7%) | 39 (39.4%) |
| 65 to 74 Years | 7 (28.0%) | 12 (35.3%) |
| 75 Years and over | 0 (0.0%) | 5 (31.2%) |
Disability Class: Self-Care Difficulty

| Age Bracket | Male | Female |
| 5 to 17 Years | 4 (5.7%) | 0 (0.0%) |
| 18 to 34 Years | 0 (0.0%) | 0 (0.0%) |
| 35 to 64 Years | 6 (4.5%) | 25 (25.3%) |
| 65 to 74 Years | 7 (28.0%) | 0 (0.0%) |
| 75 Years and over | 0 (0.0%) | 0 (0.0%) |
Technology Access in Jewett
Computing Device Access in Jewett
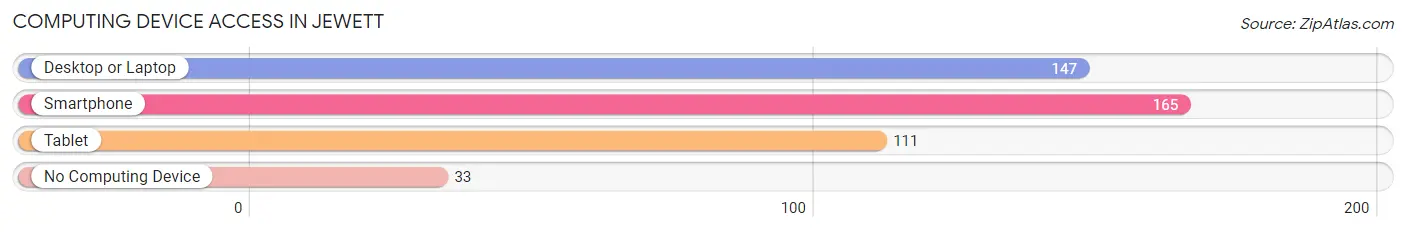
| Device Type | # Households | % Households |
| Desktop or Laptop | 147 | 66.8% |
| Smartphone | 165 | 75.0% |
| Tablet | 111 | 50.4% |
| No Computing Device | 33 | 15.0% |
| Total | 220 | 100.0% |
Internet Access in Jewett
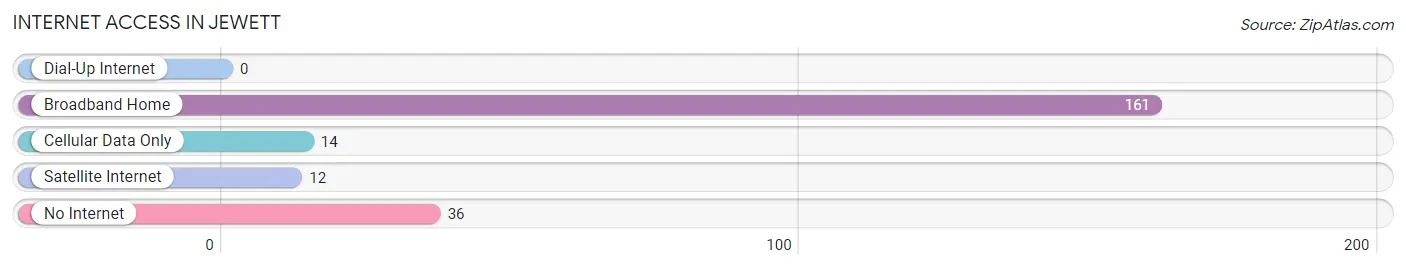
| Internet Type | # Households | % Households |
| Dial-Up Internet | 0 | 0.0% |
| Broadband Home | 161 | 73.2% |
| Cellular Data Only | 14 | 6.4% |
| Satellite Internet | 12 | 5.4% |
| No Internet | 36 | 16.4% |
| Total | 220 | 100.0% |
Jewett Summary
History
The small town of Jewett, Ohio is located in Harrison County, Ohio. It is situated on the banks of the Stillwater River, and is part of the larger Harrison County area. The town was founded in 1817 by a group of settlers from Pennsylvania, and was originally known as “Jewett’s Settlement”. The town was named after the first settler, John Jewett, who was a Revolutionary War veteran.
The town was originally a farming community, and the main crops grown were wheat, corn, and oats. The town also had a few small businesses, such as a blacksmith shop, a general store, and a sawmill. The town grew slowly over the years, and by the late 1800s, it had a population of around 500 people.
In the early 1900s, the town began to experience a period of growth. The population increased to around 1,000 people, and the town began to develop more businesses. The town also had a railroad station, which allowed for the transportation of goods and people.
The town continued to grow throughout the 20th century, and by the year 2000, the population had reached 1,845 people. The town is still primarily a farming community, but it also has a few small businesses, such as a grocery store, a hardware store, and a few restaurants.
Geography
Jewett is located in Harrison County, Ohio, and is situated on the banks of the Stillwater River. The town is located in the Appalachian Plateau region of Ohio, and is surrounded by rolling hills and forests. The town is located about 30 miles east of the city of Canton, and is about an hour’s drive from the larger cities of Cleveland and Akron.
The town has a total area of 1.2 square miles, and the elevation is 890 feet above sea level. The climate in the area is classified as humid continental, and the average temperature in the summer is around 75 degrees Fahrenheit, and in the winter it is around 35 degrees Fahrenheit.
Economy
The economy of Jewett is primarily based on agriculture. The town is home to several farms, and the main crops grown are wheat, corn, and oats. The town also has a few small businesses, such as a grocery store, a hardware store, and a few restaurants.
The town is also home to a few manufacturing companies, such as a furniture factory and a plastics factory. The town is also home to a few small businesses, such as a gas station, a barber shop, and a few other small shops.
Demographics
As of the year 2000, the population of Jewett was 1,845 people. The racial makeup of the town was 97.3% White, 0.7% African American, 0.2% Native American, 0.2% Asian, 0.2% from other races, and 1.6% from two or more races. Hispanic or Latino of any race were 0.7% of the population.
The median income for a household in the town was $30,938, and the median income for a family was $37,500. The per capita income for the town was $15,945. About 11.2% of families and 14.2% of the population were below the poverty line, including 17.2% of those under age 18 and 8.3% of those age 65 or over.
Common Questions
What is Per Capita Income in Jewett?
Per Capita income in Jewett is $40,232.
What is the Median Family Income in Jewett?
Median Family Income in Jewett is $55,000.
What is the Median Household income in Jewett?
Median Household Income in Jewett is $53,068.
What is Income or Wage Gap in Jewett?
Income or Wage Gap in Jewett is 33.8%.
Women in Jewett earn 66.2 cents for every dollar earned by a man.
What is Inequality or Gini Index in Jewett?
Inequality or Gini Index in Jewett is 0.59.
What is the Total Population of Jewett?
Total Population of Jewett is 518.
What is the Total Male Population of Jewett?
Total Male Population of Jewett is 284.
What is the Total Female Population of Jewett?
Total Female Population of Jewett is 234.
What is the Ratio of Males per 100 Females in Jewett?
There are 121.37 Males per 100 Females in Jewett.
What is the Ratio of Females per 100 Males in Jewett?
There are 82.39 Females per 100 Males in Jewett.
What is the Median Population Age in Jewett?
Median Population Age in Jewett is 39.5 Years.
What is the Average Family Size in Jewett
Average Family Size in Jewett is 3.0 People.
What is the Average Household Size in Jewett
Average Household Size in Jewett is 2.4 People.
How Large is the Labor Force in Jewett?
There are 220 People in the Labor Forcein in Jewett.
What is the Percentage of People in the Labor Force in Jewett?
52.8% of People are in the Labor Force in Jewett.
What is the Unemployment Rate in Jewett?
Unemployment Rate in Jewett is 10.5%.