South Webster, OH Map & Demographics
South Webster Map
South Webster Overview
$31,143
PER CAPITA INCOME
$54,792
AVG FAMILY INCOME
$42,232
AVG HOUSEHOLD INCOME
45.5%
WAGE / INCOME GAP [ % ]
54.5¢/ $1
WAGE / INCOME GAP [ $ ]
0.52
INEQUALITY / GINI INDEX
736
TOTAL POPULATION
376
MALE POPULATION
360
FEMALE POPULATION
104.44
MALES / 100 FEMALES
95.74
FEMALES / 100 MALES
52.4
MEDIAN AGE
2.8
AVG FAMILY SIZE
2.2
AVG HOUSEHOLD SIZE
235
LABOR FORCE [ PEOPLE ]
40.0%
PERCENT IN LABOR FORCE
6.8%
UNEMPLOYMENT RATE
South Webster Zip Codes
South Webster Area Codes
Income in South Webster
Income Overview in South Webster
Per Capita Income in South Webster is $31,143, while median incomes of families and households are $54,792 and $42,232 respectively.
| Characteristic | Number | Measure |
| Per Capita Income | 736 | $31,143 |
| Median Family Income | 210 | $54,792 |
| Mean Family Income | 210 | $88,924 |
| Median Household Income | 341 | $42,232 |
| Mean Household Income | 341 | $65,552 |
| Income Deficit | 210 | $0 |
| Wage / Income Gap (%) | 736 | 45.54% |
| Wage / Income Gap ($) | 736 | 54.46¢ per $1 |
| Gini / Inequality Index | 736 | 0.52 |
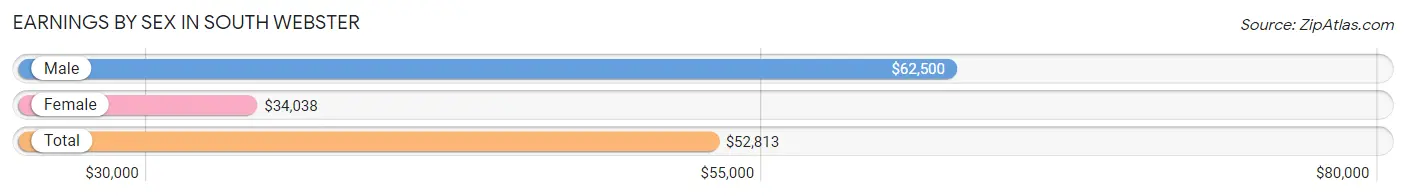
Earnings by Sex in South Webster
Average Earnings in South Webster are $52,813, $62,500 for men and $34,038 for women, a difference of 45.5%.
| Sex | Number | Average Earnings |
| Male | 112 (45.9%) | $62,500 |
| Female | 132 (54.1%) | $34,038 |
| Total | 244 (100.0%) | $52,813 |
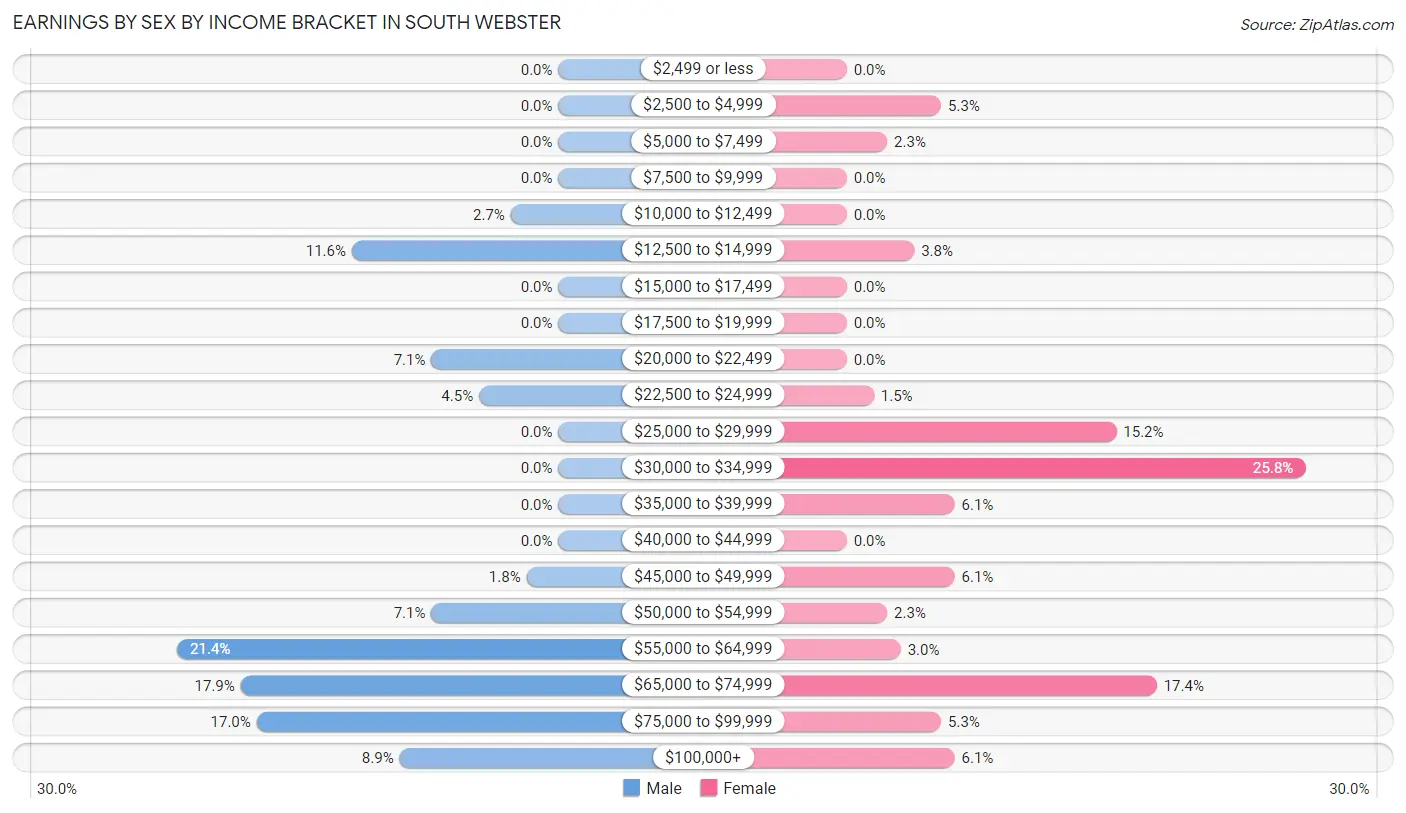
Earnings by Sex by Income Bracket in South Webster
The most common earnings brackets in South Webster are $55,000 to $64,999 for men (24 | 21.4%) and $30,000 to $34,999 for women (34 | 25.8%).
| Income | Male | Female |
| $2,499 or less | 0 (0.0%) | 0 (0.0%) |
| $2,500 to $4,999 | 0 (0.0%) | 7 (5.3%) |
| $5,000 to $7,499 | 0 (0.0%) | 3 (2.3%) |
| $7,500 to $9,999 | 0 (0.0%) | 0 (0.0%) |
| $10,000 to $12,499 | 3 (2.7%) | 0 (0.0%) |
| $12,500 to $14,999 | 13 (11.6%) | 5 (3.8%) |
| $15,000 to $17,499 | 0 (0.0%) | 0 (0.0%) |
| $17,500 to $19,999 | 0 (0.0%) | 0 (0.0%) |
| $20,000 to $22,499 | 8 (7.1%) | 0 (0.0%) |
| $22,500 to $24,999 | 5 (4.5%) | 2 (1.5%) |
| $25,000 to $29,999 | 0 (0.0%) | 20 (15.1%) |
| $30,000 to $34,999 | 0 (0.0%) | 34 (25.8%) |
| $35,000 to $39,999 | 0 (0.0%) | 8 (6.1%) |
| $40,000 to $44,999 | 0 (0.0%) | 0 (0.0%) |
| $45,000 to $49,999 | 2 (1.8%) | 8 (6.1%) |
| $50,000 to $54,999 | 8 (7.1%) | 3 (2.3%) |
| $55,000 to $64,999 | 24 (21.4%) | 4 (3.0%) |
| $65,000 to $74,999 | 20 (17.9%) | 23 (17.4%) |
| $75,000 to $99,999 | 19 (17.0%) | 7 (5.3%) |
| $100,000+ | 10 (8.9%) | 8 (6.1%) |
| Total | 112 (100.0%) | 132 (100.0%) |
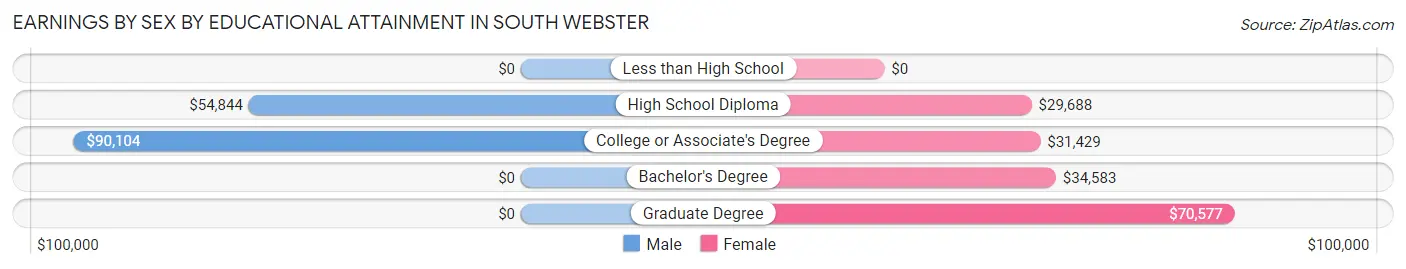
Earnings by Sex by Educational Attainment in South Webster
Average earnings in South Webster are $63,929 for men and $33,942 for women, a difference of 46.9%. Men with an educational attainment of college or associate's degree enjoy the highest average annual earnings of $90,104, while those with high school diploma education earn the least with $54,844. Women with an educational attainment of graduate degree earn the most with the average annual earnings of $70,577, while those with high school diploma education have the smallest earnings of $29,688.
| Educational Attainment | Male Income | Female Income |
| Less than High School | - | - |
| High School Diploma | $54,844 | $29,688 |
| College or Associate's Degree | $90,104 | $31,429 |
| Bachelor's Degree | - | - |
| Graduate Degree | - | - |
| Total | $63,929 | $33,942 |
Family Income in South Webster
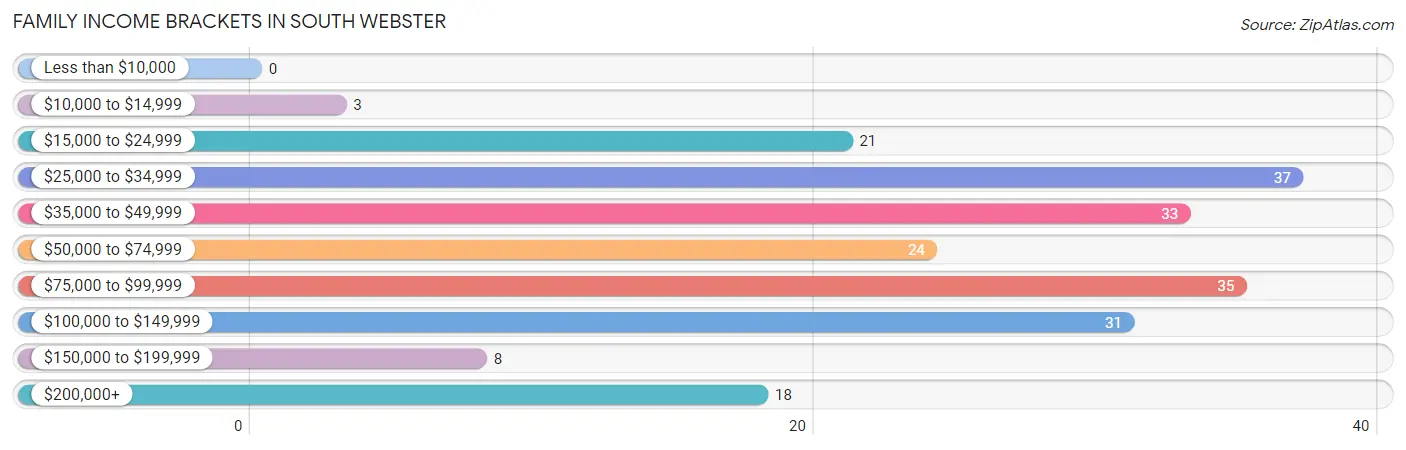
Family Income Brackets in South Webster
According to the South Webster family income data, there are 37 families falling into the $25,000 to $34,999 income range, which is the most common income bracket and makes up 17.6% of all families.
| Income Bracket | # Families | % Families |
| Less than $10,000 | 0 | 0.0% |
| $10,000 to $14,999 | 3 | 1.4% |
| $15,000 to $24,999 | 21 | 10.0% |
| $25,000 to $34,999 | 37 | 17.6% |
| $35,000 to $49,999 | 33 | 15.7% |
| $50,000 to $74,999 | 24 | 11.4% |
| $75,000 to $99,999 | 35 | 16.7% |
| $100,000 to $149,999 | 31 | 14.8% |
| $150,000 to $199,999 | 8 | 3.8% |
| $200,000+ | 18 | 8.6% |
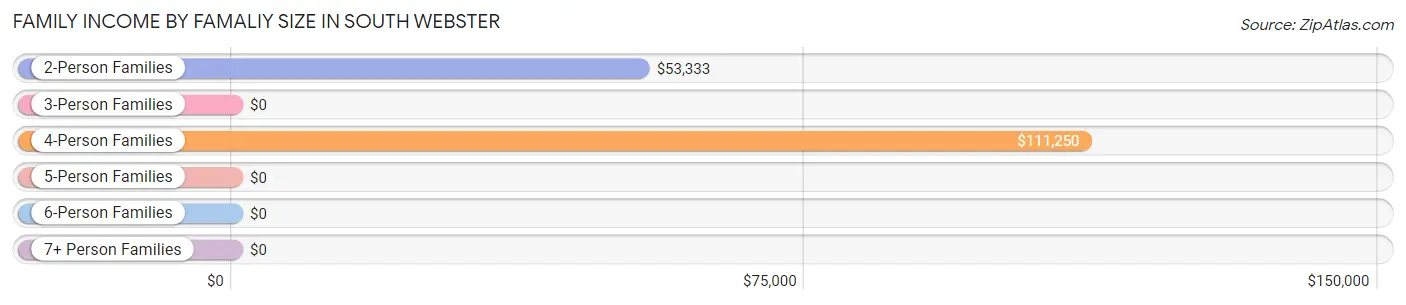
Family Income by Famaliy Size in South Webster
4-person families (25 | 11.9%) account for the highest median family income in South Webster with $111,250 per family, while 4-person families (25 | 11.9%) have the highest median income of $27,812 per family member.
| Income Bracket | # Families | Median Income |
| 2-Person Families | 116 (55.2%) | $53,333 |
| 3-Person Families | 52 (24.8%) | $0 |
| 4-Person Families | 25 (11.9%) | $111,250 |
| 5-Person Families | 9 (4.3%) | $0 |
| 6-Person Families | 0 (0.0%) | $0 |
| 7+ Person Families | 8 (3.8%) | $0 |
| Total | 210 (100.0%) | $54,792 |
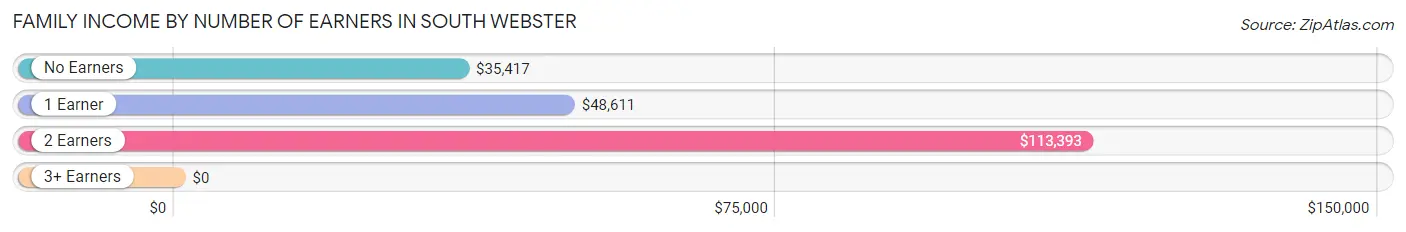
Family Income by Number of Earners in South Webster
| Number of Earners | # Families | Median Income |
| No Earners | 67 (31.9%) | $35,417 |
| 1 Earner | 64 (30.5%) | $48,611 |
| 2 Earners | 79 (37.6%) | $113,393 |
| 3+ Earners | 0 (0.0%) | $0 |
| Total | 210 (100.0%) | $54,792 |
Household Income in South Webster
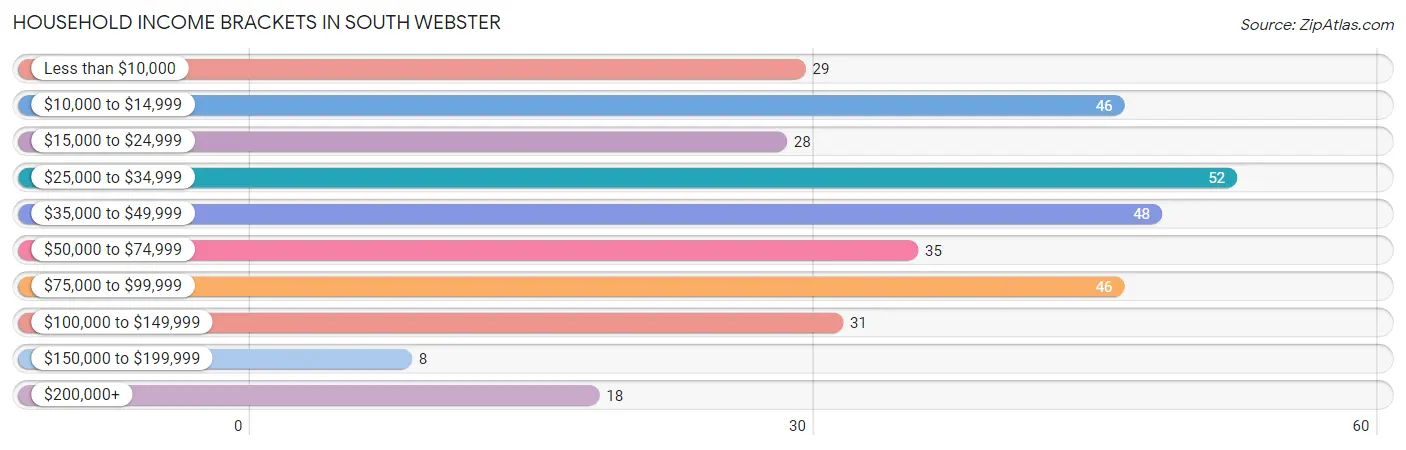
Household Income Brackets in South Webster
With 52 households falling in the category, the $25,000 to $34,999 income range is the most frequent in South Webster, accounting for 15.2% of all households. In contrast, only 8 households (2.4%) fall into the $150,000 to $199,999 income bracket, making it the least populous group.
| Income Bracket | # Households | % Households |
| Less than $10,000 | 29 | 8.5% |
| $10,000 to $14,999 | 46 | 13.5% |
| $15,000 to $24,999 | 28 | 8.2% |
| $25,000 to $34,999 | 52 | 15.2% |
| $35,000 to $49,999 | 48 | 14.1% |
| $50,000 to $74,999 | 35 | 10.3% |
| $75,000 to $99,999 | 46 | 13.5% |
| $100,000 to $149,999 | 31 | 9.1% |
| $150,000 to $199,999 | 8 | 2.3% |
| $200,000+ | 18 | 5.3% |
Household Income by Householder Age in South Webster
The median household income in South Webster is $42,232, with the highest median household income of $43,125 found in the 45 to 64 years age bracket for the primary householder. A total of 115 households (33.7%) fall into this category. Meanwhile, the 15 to 24 years age bracket for the primary householder has the lowest median household income of $0, with 8 households (2.4%) in this group.
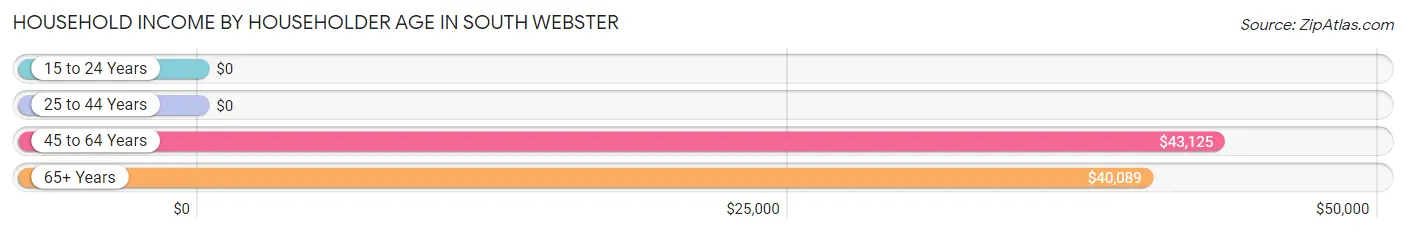
| Income Bracket | # Households | Median Income |
| 15 to 24 Years | 8 (2.4%) | $0 |
| 25 to 44 Years | 63 (18.5%) | $0 |
| 45 to 64 Years | 115 (33.7%) | $43,125 |
| 65+ Years | 155 (45.5%) | $40,089 |
| Total | 341 (100.0%) | $42,232 |
Poverty in South Webster
Income Below Poverty by Sex and Age in South Webster
With 9.6% poverty level for males and 16.1% for females among the residents of South Webster, 55 to 64 year old males and under 5 year old females are the most vulnerable to poverty, with 16 males (40.0%) and 9 females (81.8%) in their respective age groups living below the poverty level.
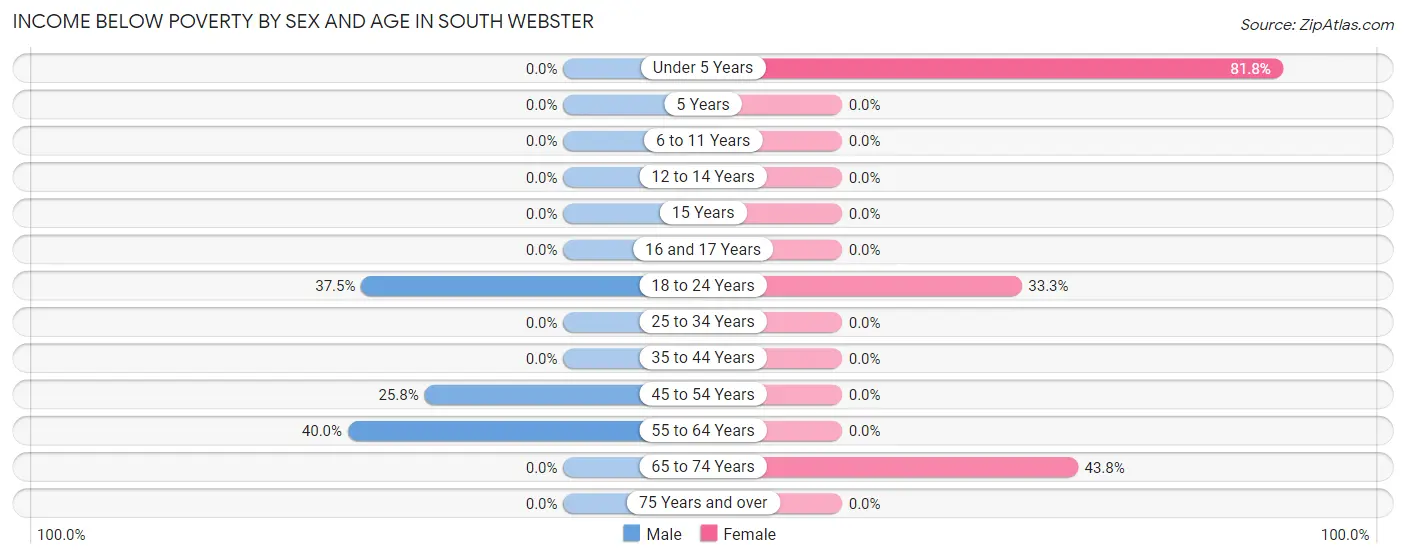
| Age Bracket | Male | Female |
| Under 5 Years | 0 (0.0%) | 9 (81.8%) |
| 5 Years | 0 (0.0%) | 0 (0.0%) |
| 6 to 11 Years | 0 (0.0%) | 0 (0.0%) |
| 12 to 14 Years | 0 (0.0%) | 0 (0.0%) |
| 15 Years | 0 (0.0%) | 0 (0.0%) |
| 16 and 17 Years | 0 (0.0%) | 0 (0.0%) |
| 18 to 24 Years | 3 (37.5%) | 7 (33.3%) |
| 25 to 34 Years | 0 (0.0%) | 0 (0.0%) |
| 35 to 44 Years | 0 (0.0%) | 0 (0.0%) |
| 45 to 54 Years | 17 (25.8%) | 0 (0.0%) |
| 55 to 64 Years | 16 (40.0%) | 0 (0.0%) |
| 65 to 74 Years | 0 (0.0%) | 42 (43.8%) |
| 75 Years and over | 0 (0.0%) | 0 (0.0%) |
| Total | 36 (9.6%) | 58 (16.1%) |
Income Above Poverty by Sex and Age in South Webster
According to the poverty statistics in South Webster, males aged under 5 years and females aged 6 to 11 years are the age groups that are most secure financially, with 100.0% of males and 100.0% of females in these age groups living above the poverty line.
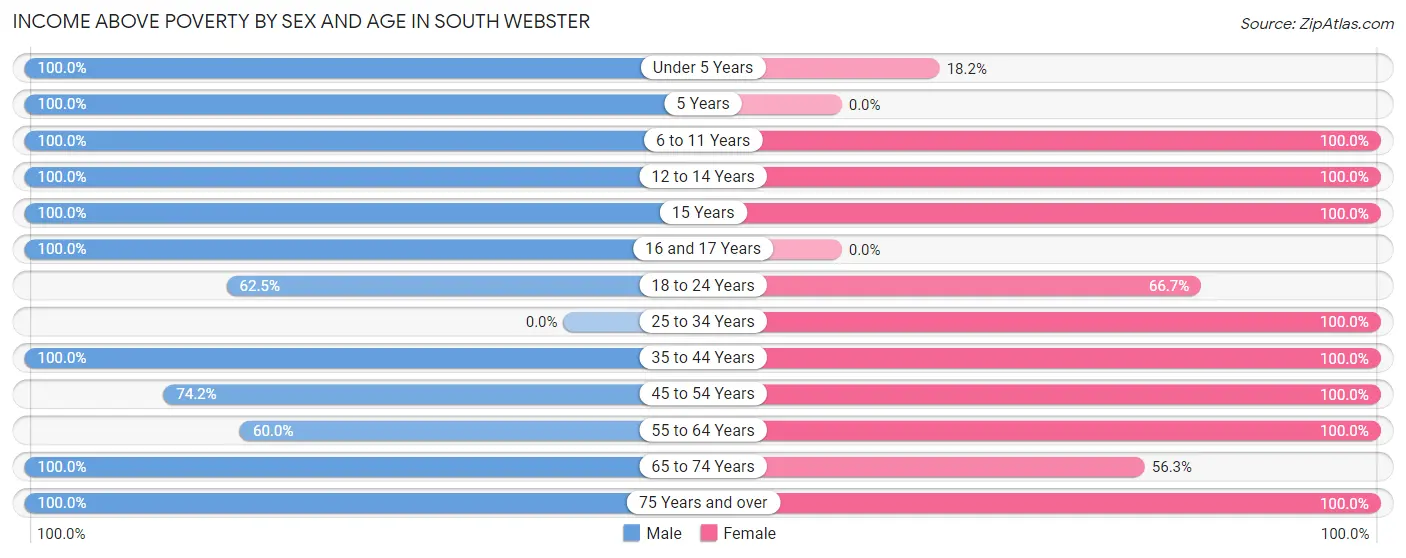
| Age Bracket | Male | Female |
| Under 5 Years | 21 (100.0%) | 2 (18.2%) |
| 5 Years | 4 (100.0%) | 0 (0.0%) |
| 6 to 11 Years | 24 (100.0%) | 39 (100.0%) |
| 12 to 14 Years | 3 (100.0%) | 23 (100.0%) |
| 15 Years | 12 (100.0%) | 12 (100.0%) |
| 16 and 17 Years | 22 (100.0%) | 0 (0.0%) |
| 18 to 24 Years | 5 (62.5%) | 14 (66.7%) |
| 25 to 34 Years | 0 (0.0%) | 11 (100.0%) |
| 35 to 44 Years | 64 (100.0%) | 32 (100.0%) |
| 45 to 54 Years | 49 (74.2%) | 51 (100.0%) |
| 55 to 64 Years | 24 (60.0%) | 27 (100.0%) |
| 65 to 74 Years | 48 (100.0%) | 54 (56.2%) |
| 75 Years and over | 64 (100.0%) | 37 (100.0%) |
| Total | 340 (90.4%) | 302 (83.9%) |
Income Below Poverty Among Married-Couple Families in South Webster
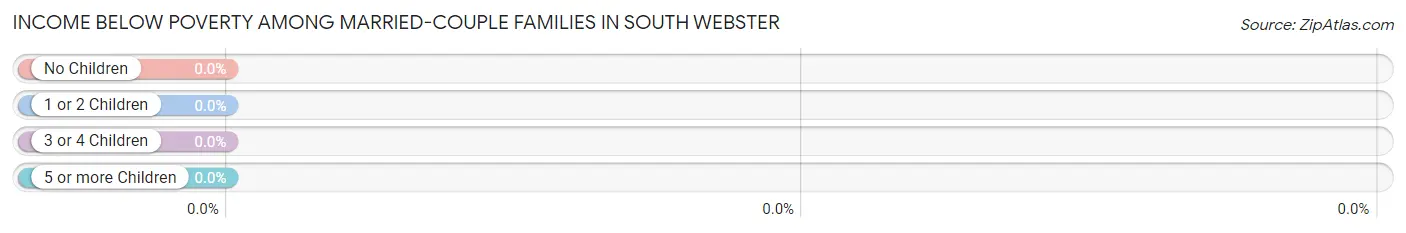
| Children | Above Poverty | Below Poverty |
| No Children | 87 (100.0%) | 0 (0.0%) |
| 1 or 2 Children | 59 (100.0%) | 0 (0.0%) |
| 3 or 4 Children | 0 (0.0%) | 0 (0.0%) |
| 5 or more Children | 8 (100.0%) | 0 (0.0%) |
| Total | 154 (100.0%) | 0 (0.0%) |
Income Below Poverty Among Single-Parent Households in South Webster
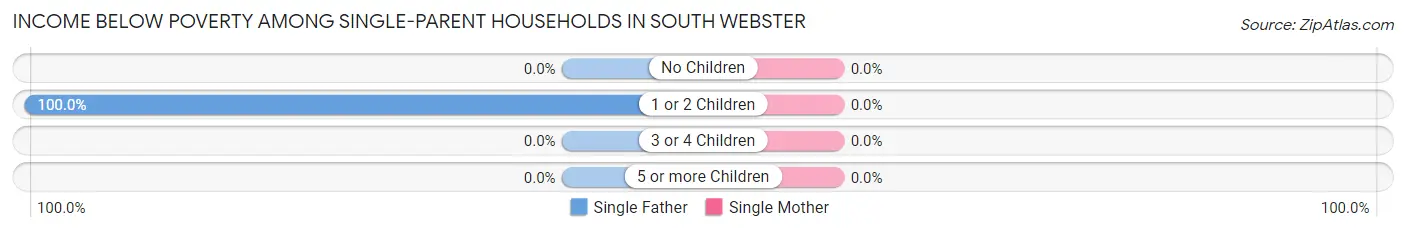
| Children | Single Father | Single Mother |
| No Children | 0 (0.0%) | 0 (0.0%) |
| 1 or 2 Children | 3 (100.0%) | 0 (0.0%) |
| 3 or 4 Children | 0 (0.0%) | 0 (0.0%) |
| 5 or more Children | 0 (0.0%) | 0 (0.0%) |
| Total | 3 (11.1%) | 0 (0.0%) |
Income Below Poverty Among Married-Couple vs Single-Parent Households in South Webster
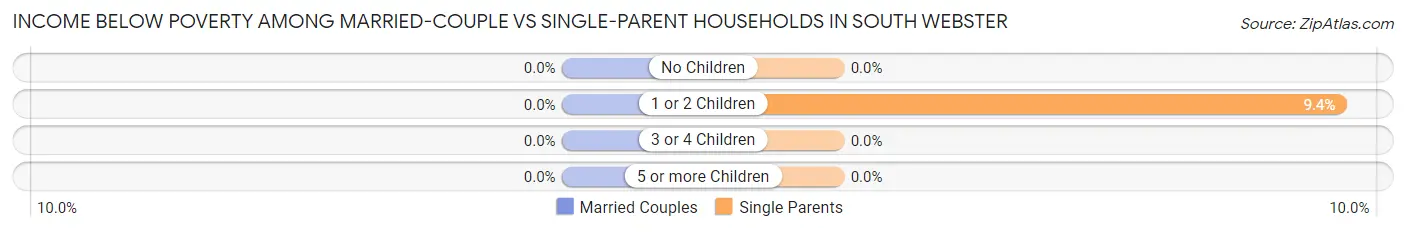
| Children | Married-Couple Families | Single-Parent Households |
| No Children | 0 (0.0%) | 0 (0.0%) |
| 1 or 2 Children | 0 (0.0%) | 3 (9.4%) |
| 3 or 4 Children | 0 (0.0%) | 0 (0.0%) |
| 5 or more Children | 0 (0.0%) | 0 (0.0%) |
| Total | 0 (0.0%) | 3 (5.4%) |
Race in South Webster
The most populous races in South Webster are White / Caucasian (698 | 94.8%), Two or more Races (35 | 4.8%), and Hispanic or Latino (26 | 3.5%).
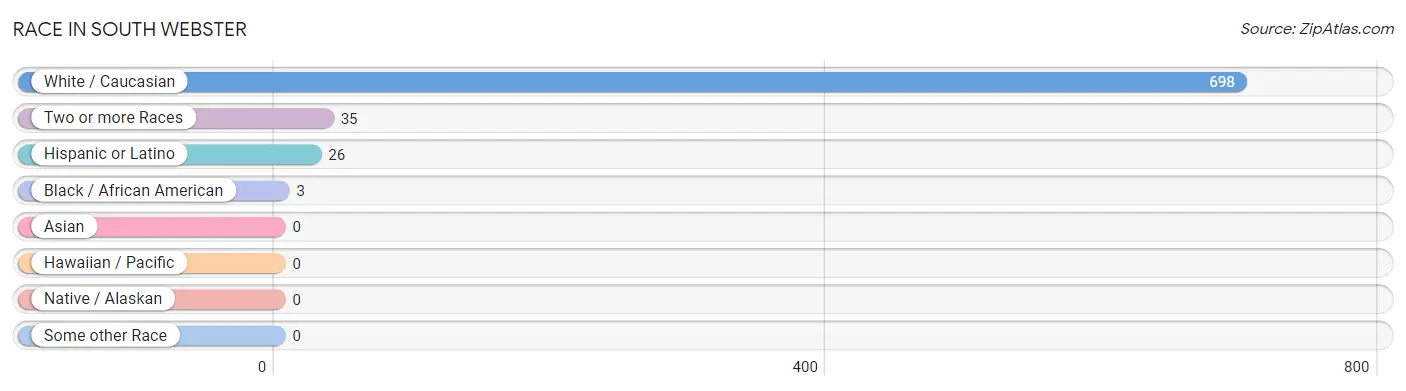
| Race | # Population | % Population |
| Asian | 0 | 0.0% |
| Black / African American | 3 | 0.4% |
| Hawaiian / Pacific | 0 | 0.0% |
| Hispanic or Latino | 26 | 3.5% |
| Native / Alaskan | 0 | 0.0% |
| White / Caucasian | 698 | 94.8% |
| Two or more Races | 35 | 4.8% |
| Some other Race | 0 | 0.0% |
| Total | 736 | 100.0% |
Ancestry in South Webster
The most populous ancestries reported in South Webster are Irish (66 | 9.0%), German (62 | 8.4%), English (42 | 5.7%), European (29 | 3.9%), and Scottish (27 | 3.7%), together accounting for 30.7% of all South Webster residents.
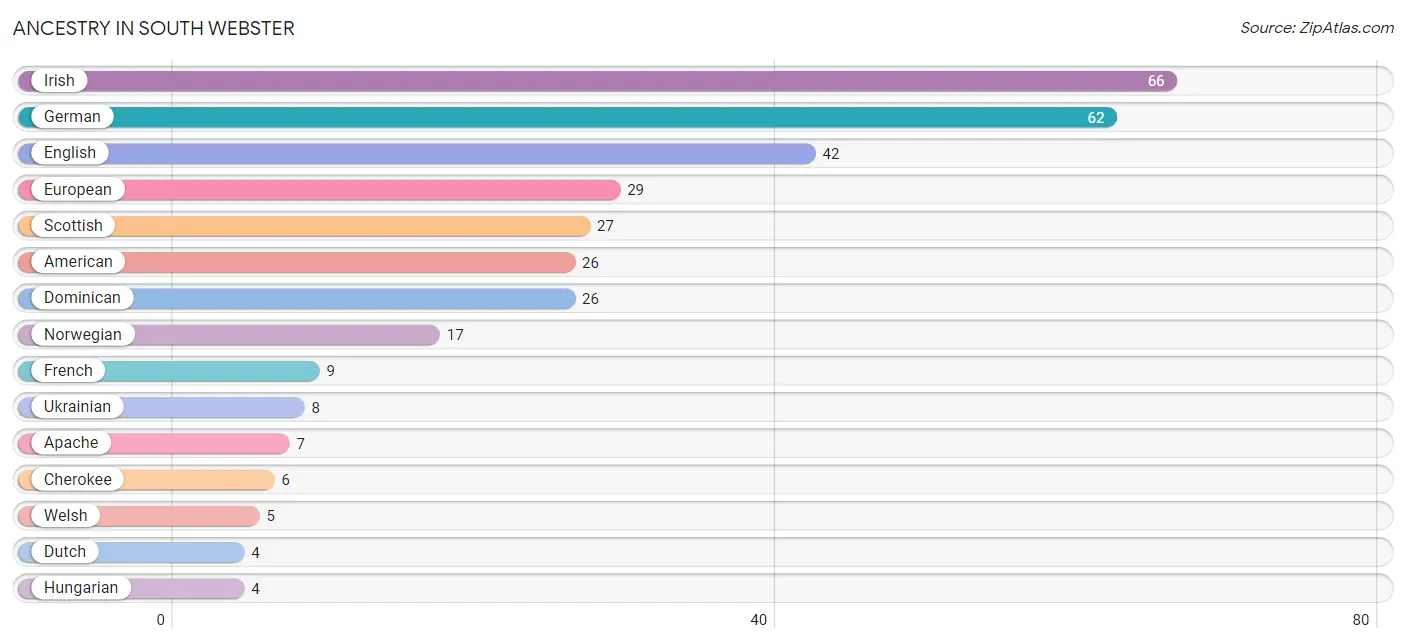
| Ancestry | # Population | % Population |
| American | 26 | 3.5% |
| Apache | 7 | 0.9% |
| Cherokee | 6 | 0.8% |
| Dominican | 26 | 3.5% |
| Dutch | 4 | 0.5% |
| English | 42 | 5.7% |
| European | 29 | 3.9% |
| French | 9 | 1.2% |
| German | 62 | 8.4% |
| Hungarian | 4 | 0.5% |
| Irish | 66 | 9.0% |
| Norwegian | 17 | 2.3% |
| Russian | 4 | 0.5% |
| Scottish | 27 | 3.7% |
| Swiss | 4 | 0.5% |
| Ukrainian | 8 | 1.1% |
| Welsh | 5 | 0.7% | View All 17 Rows |
Immigrants in South Webster
The most numerous immigrant groups reported in South Webster came from , and Canada (4 | 0.5%), together accounting for 0.5% of all South Webster residents.

| Immigration Origin | # Population | % Population |
| Canada | 4 | 0.5% | View All 1 Rows |
Sex and Age in South Webster
Sex and Age in South Webster
The most populous age groups in South Webster are 50 to 54 Years (40 | 10.6%) for men and 65 to 69 Years (57 | 15.8%) for women.
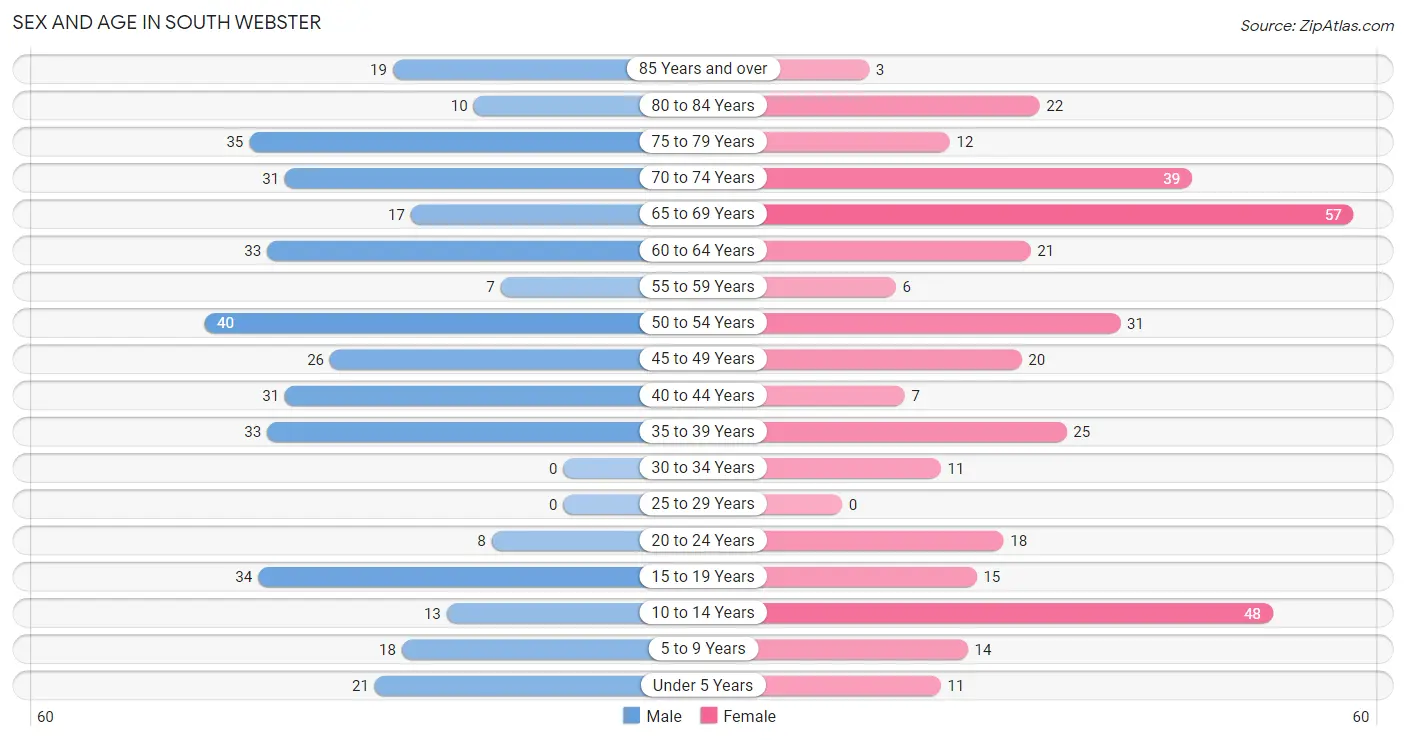
| Age Bracket | Male | Female |
| Under 5 Years | 21 (5.6%) | 11 (3.1%) |
| 5 to 9 Years | 18 (4.8%) | 14 (3.9%) |
| 10 to 14 Years | 13 (3.5%) | 48 (13.3%) |
| 15 to 19 Years | 34 (9.0%) | 15 (4.2%) |
| 20 to 24 Years | 8 (2.1%) | 18 (5.0%) |
| 25 to 29 Years | 0 (0.0%) | 0 (0.0%) |
| 30 to 34 Years | 0 (0.0%) | 11 (3.1%) |
| 35 to 39 Years | 33 (8.8%) | 25 (6.9%) |
| 40 to 44 Years | 31 (8.2%) | 7 (1.9%) |
| 45 to 49 Years | 26 (6.9%) | 20 (5.6%) |
| 50 to 54 Years | 40 (10.6%) | 31 (8.6%) |
| 55 to 59 Years | 7 (1.9%) | 6 (1.7%) |
| 60 to 64 Years | 33 (8.8%) | 21 (5.8%) |
| 65 to 69 Years | 17 (4.5%) | 57 (15.8%) |
| 70 to 74 Years | 31 (8.2%) | 39 (10.8%) |
| 75 to 79 Years | 35 (9.3%) | 12 (3.3%) |
| 80 to 84 Years | 10 (2.7%) | 22 (6.1%) |
| 85 Years and over | 19 (5.1%) | 3 (0.8%) |
| Total | 376 (100.0%) | 360 (100.0%) |
Families and Households in South Webster
Median Family Size in South Webster
The median family size in South Webster is 2.83 persons per family, with married-couple families (154 | 73.3%) accounting for the largest median family size of 2.9 persons per family. On the other hand, single female/mother families (29 | 13.8%) represent the smallest median family size with 2.45 persons per family.
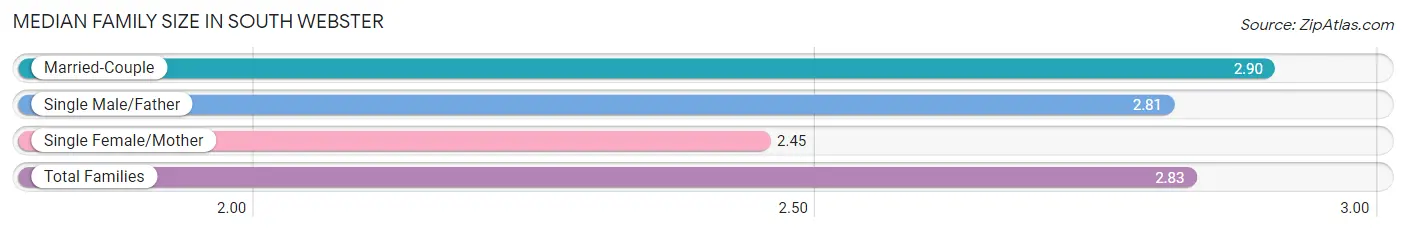
| Family Type | # Families | Family Size |
| Married-Couple | 154 (73.3%) | 2.90 |
| Single Male/Father | 27 (12.9%) | 2.81 |
| Single Female/Mother | 29 (13.8%) | 2.45 |
| Total Families | 210 (100.0%) | 2.83 |
Median Household Size in South Webster
The median household size in South Webster is 2.16 persons per household, with single male/father households (27 | 7.9%) accounting for the largest median household size of 3.07 persons per household. non-family households (131 | 38.4%) represent the smallest median household size with 1.03 persons per household.
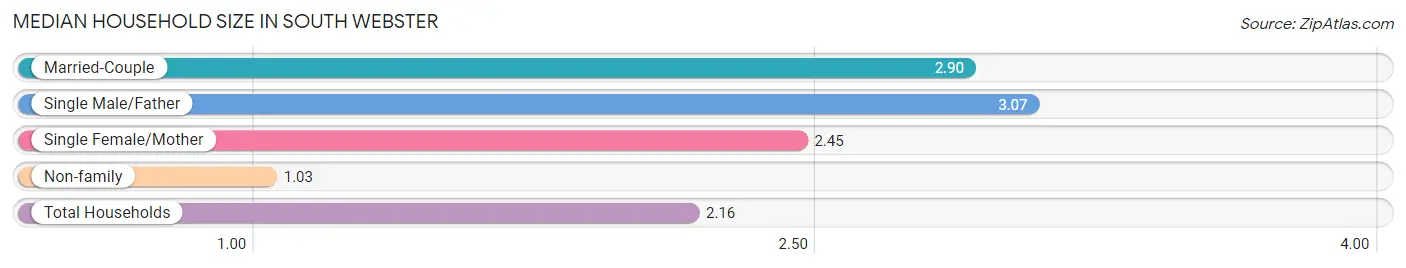
| Household Type | # Households | Household Size |
| Married-Couple | 154 (45.2%) | 2.90 |
| Single Male/Father | 27 (7.9%) | 3.07 |
| Single Female/Mother | 29 (8.5%) | 2.45 |
| Non-family | 131 (38.4%) | 1.03 |
| Total Households | 341 (100.0%) | 2.16 |
Household Size by Marriage Status in South Webster
Out of a total of 341 households in South Webster, 210 (61.6%) are family households, while 131 (38.4%) are nonfamily households. The most numerous type of family households are 2-person households, comprising 113, and the most common type of nonfamily households are 1-person households, comprising 128.
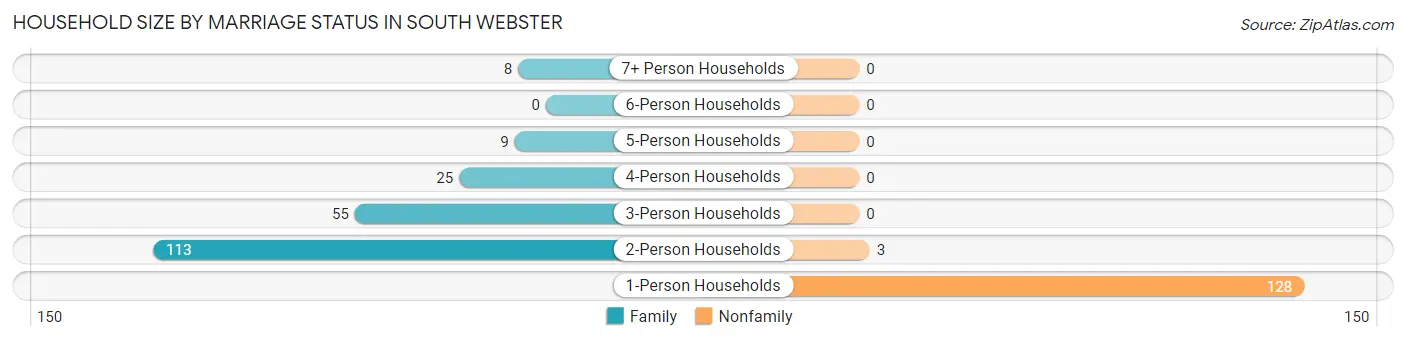
| Household Size | Family Households | Nonfamily Households |
| 1-Person Households | - | 128 (37.5%) |
| 2-Person Households | 113 (33.1%) | 3 (0.9%) |
| 3-Person Households | 55 (16.1%) | 0 (0.0%) |
| 4-Person Households | 25 (7.3%) | 0 (0.0%) |
| 5-Person Households | 9 (2.6%) | 0 (0.0%) |
| 6-Person Households | 0 (0.0%) | 0 (0.0%) |
| 7+ Person Households | 8 (2.4%) | 0 (0.0%) |
| Total | 210 (61.6%) | 131 (38.4%) |
Female Fertility in South Webster
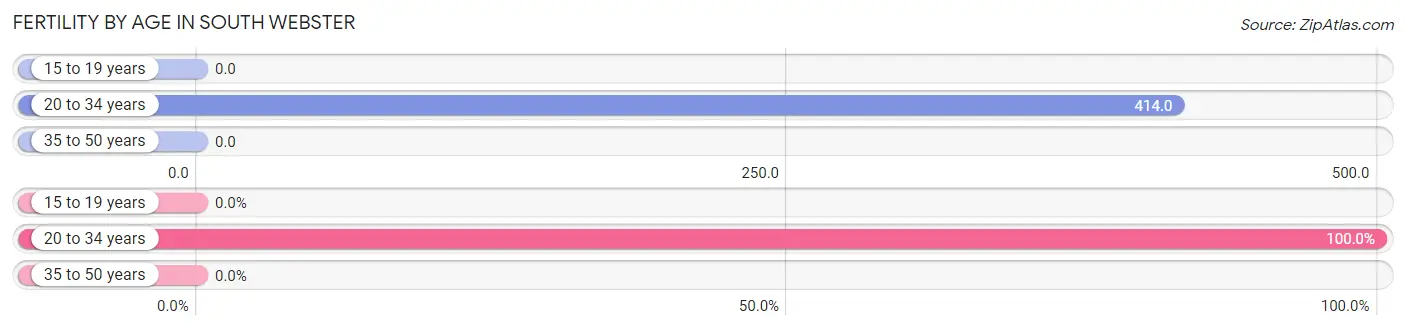
Fertility by Age in South Webster
Average fertility rate in South Webster is 113.0 births per 1,000 women. Women in the age bracket of 20 to 34 years have the highest fertility rate with 414.0 births per 1,000 women. Women in the age bracket of 20 to 34 years acount for 100.0% of all women with births.
| Age Bracket | Women with Births | Births / 1,000 Women |
| 15 to 19 years | 0 (0.0%) | 0.0 |
| 20 to 34 years | 12 (100.0%) | 414.0 |
| 35 to 50 years | 0 (0.0%) | 0.0 |
| Total | 12 (100.0%) | 113.0 |
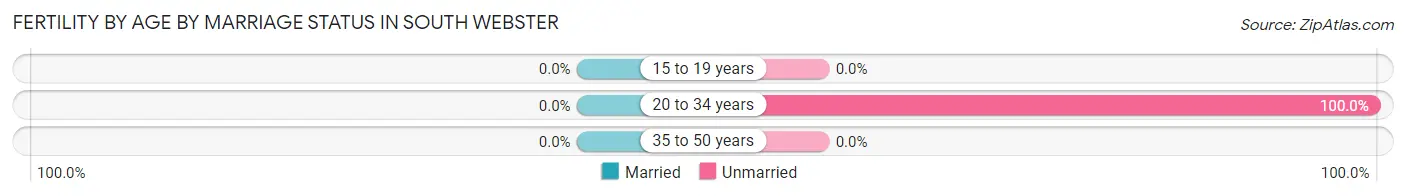
Fertility by Age by Marriage Status in South Webster
| Age Bracket | Married | Unmarried |
| 15 to 19 years | 0 (0.0%) | 0 (0.0%) |
| 20 to 34 years | 0 (0.0%) | 12 (100.0%) |
| 35 to 50 years | 0 (0.0%) | 0 (0.0%) |
| Total | 0 (0.0%) | 12 (100.0%) |
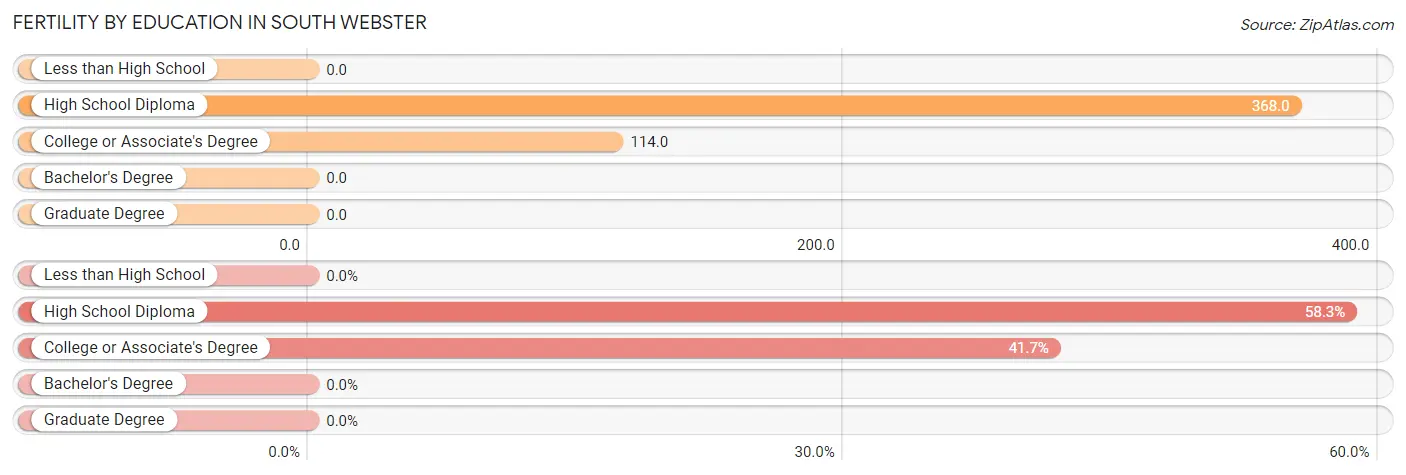
Fertility by Education in South Webster
| Educational Attainment | Women with Births | Births / 1,000 Women |
| Less than High School | 0 (0.0%) | 0.0 |
| High School Diploma | 7 (58.3%) | 368.0 |
| College or Associate's Degree | 5 (41.7%) | 114.0 |
| Bachelor's Degree | 0 (0.0%) | 0.0 |
| Graduate Degree | 0 (0.0%) | 0.0 |
| Total | 12 (100.0%) | 113.0 |
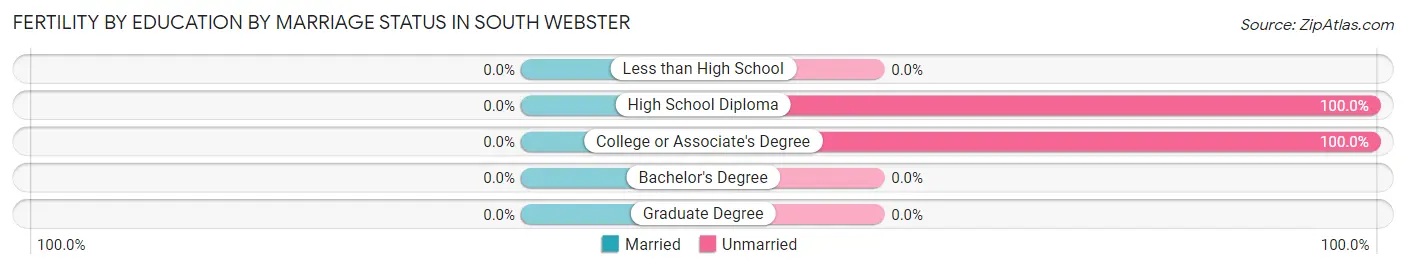
Fertility by Education by Marriage Status in South Webster
| Educational Attainment | Married | Unmarried |
| Less than High School | 0 (0.0%) | 0 (0.0%) |
| High School Diploma | 0 (0.0%) | 7 (100.0%) |
| College or Associate's Degree | 0 (0.0%) | 5 (100.0%) |
| Bachelor's Degree | 0 (0.0%) | 0 (0.0%) |
| Graduate Degree | 0 (0.0%) | 0 (0.0%) |
| Total | 0 (0.0%) | 12 (100.0%) |
Employment Characteristics in South Webster
Employment by Class of Employer in South Webster
Among the 219 employed individuals in South Webster, private company employees (126 | 57.5%), not-for-profit organizations (33 | 15.1%), and local government employees (26 | 11.9%) make up the most common classes of employment.
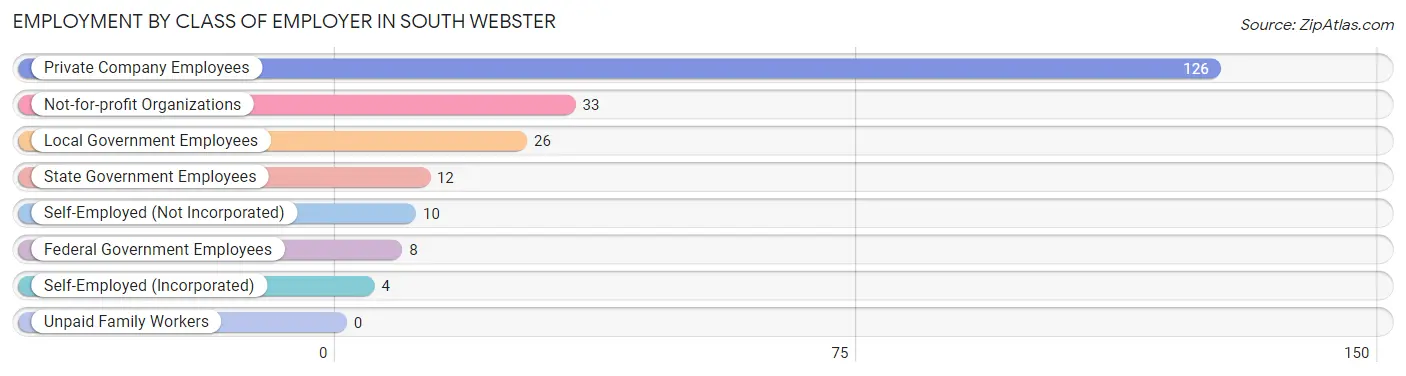
| Employer Class | # Employees | % Employees |
| Private Company Employees | 126 | 57.5% |
| Self-Employed (Incorporated) | 4 | 1.8% |
| Self-Employed (Not Incorporated) | 10 | 4.6% |
| Not-for-profit Organizations | 33 | 15.1% |
| Local Government Employees | 26 | 11.9% |
| State Government Employees | 12 | 5.5% |
| Federal Government Employees | 8 | 3.6% |
| Unpaid Family Workers | 0 | 0.0% |
| Total | 219 | 100.0% |
Employment Status by Age in South Webster
According to the labor force statistics for South Webster, out of the total population over 16 years of age (587), 40.0% or 235 individuals are in the labor force, with 6.8% or 16 of them unemployed. The age group with the highest labor force participation rate is 30 to 34 years, with 100.0% or 11 individuals in the labor force. Within the labor force, the 20 to 24 years age range has the highest percentage of unemployed individuals, with 15.8% or 3 of them being unemployed.
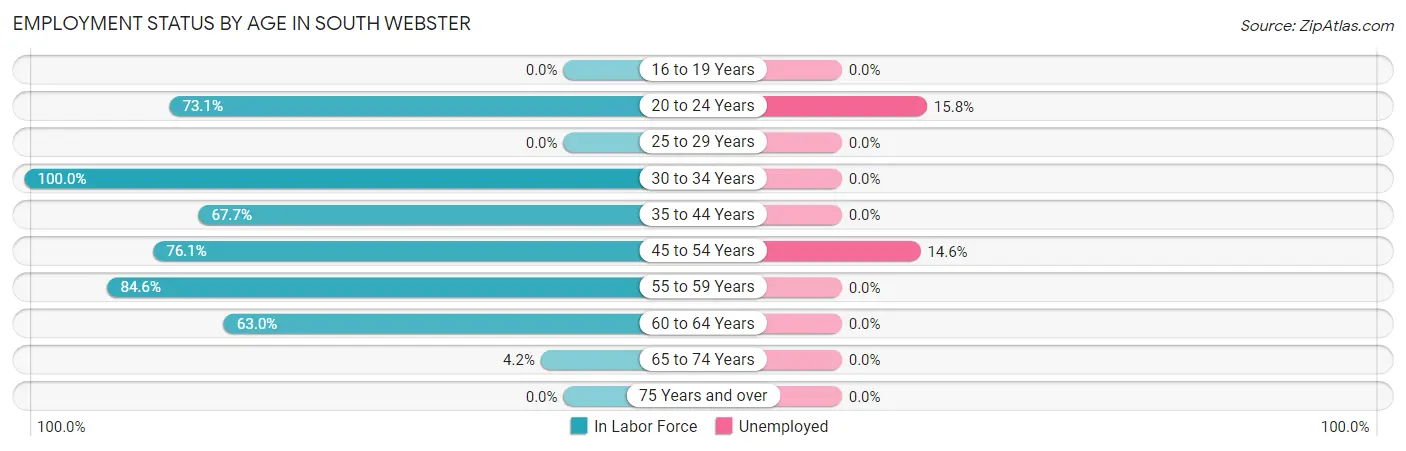
| Age Bracket | In Labor Force | Unemployed |
| 16 to 19 Years | 0 (0.0%) | 0 (0.0%) |
| 20 to 24 Years | 19 (73.1%) | 3 (15.8%) |
| 25 to 29 Years | 0 (0.0%) | 0 (0.0%) |
| 30 to 34 Years | 11 (100.0%) | 0 (0.0%) |
| 35 to 44 Years | 65 (67.7%) | 0 (0.0%) |
| 45 to 54 Years | 89 (76.1%) | 13 (14.6%) |
| 55 to 59 Years | 11 (84.6%) | 0 (0.0%) |
| 60 to 64 Years | 34 (63.0%) | 0 (0.0%) |
| 65 to 74 Years | 6 (4.2%) | 0 (0.0%) |
| 75 Years and over | 0 (0.0%) | 0 (0.0%) |
| Total | 235 (40.0%) | 16 (6.8%) |
Employment Status by Educational Attainment in South Webster
According to labor force statistics for South Webster, 72.2% of individuals (210) out of the total population between 25 and 64 years of age (291) are in the labor force, with 6.2% or 13 of them being unemployed. The group with the highest labor force participation rate are those with the educational attainment of bachelor's degree or higher, with 100.0% or 67 individuals in the labor force. Within the labor force, individuals with high school diploma education have the highest percentage of unemployment, with 22.8% or 13 of them being unemployed.
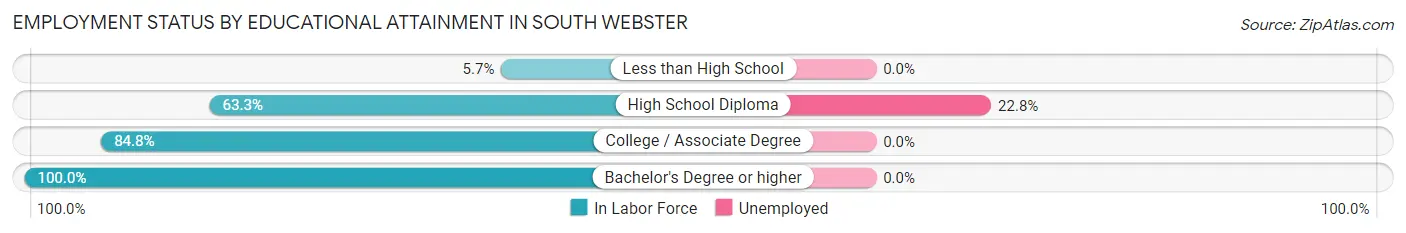
| Educational Attainment | In Labor Force | Unemployed |
| Less than High School | 2 (5.7%) | 0 (0.0%) |
| High School Diploma | 57 (63.3%) | 21 (22.8%) |
| College / Associate Degree | 84 (84.8%) | 0 (0.0%) |
| Bachelor's Degree or higher | 67 (100.0%) | 0 (0.0%) |
| Total | 210 (72.2%) | 18 (6.2%) |
Employment Occupations by Sex in South Webster
Management, Business, Science and Arts Occupations
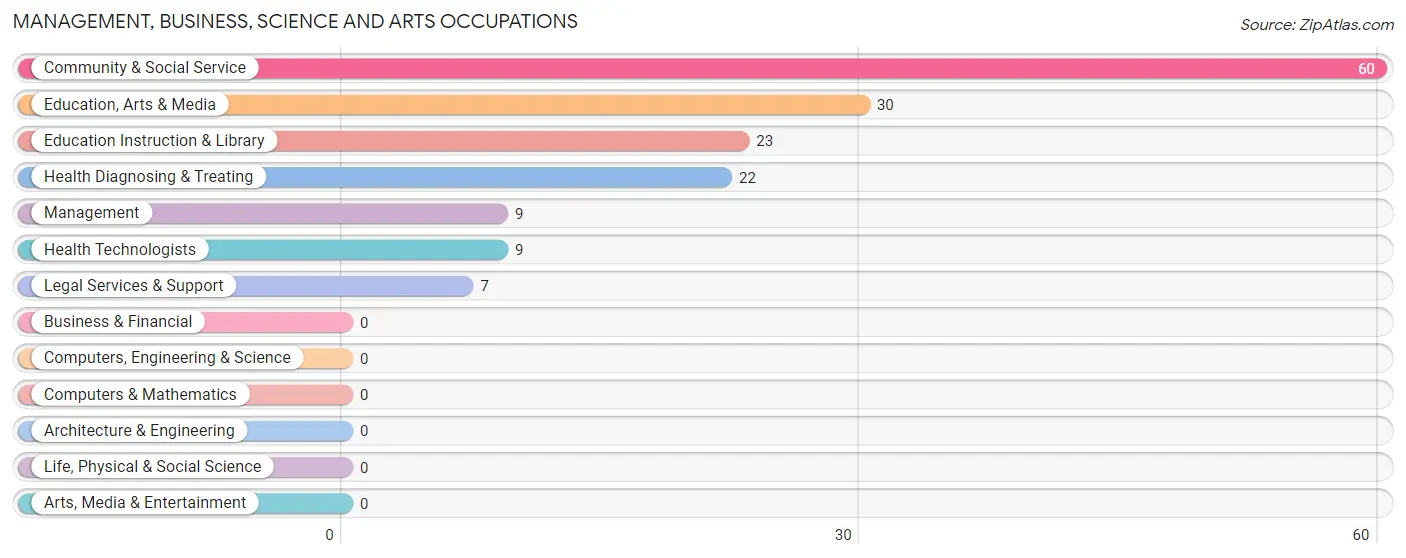
The most common Management, Business, Science and Arts occupations in South Webster are Community & Social Service (60 | 27.4%), Education, Arts & Media (30 | 13.7%), Education Instruction & Library (23 | 10.5%), Health Diagnosing & Treating (22 | 10.1%), and Management (9 | 4.1%).
Management, Business, Science and Arts Occupations by Sex
Within the Management, Business, Science and Arts occupations in South Webster, the most male-oriented occupations are Legal Services & Support (100.0%), Education, Arts & Media (60.0%), and Community & Social Service (55.0%), while the most female-oriented occupations are Health Diagnosing & Treating (100.0%), Health Technologists (100.0%), and Management (66.7%).
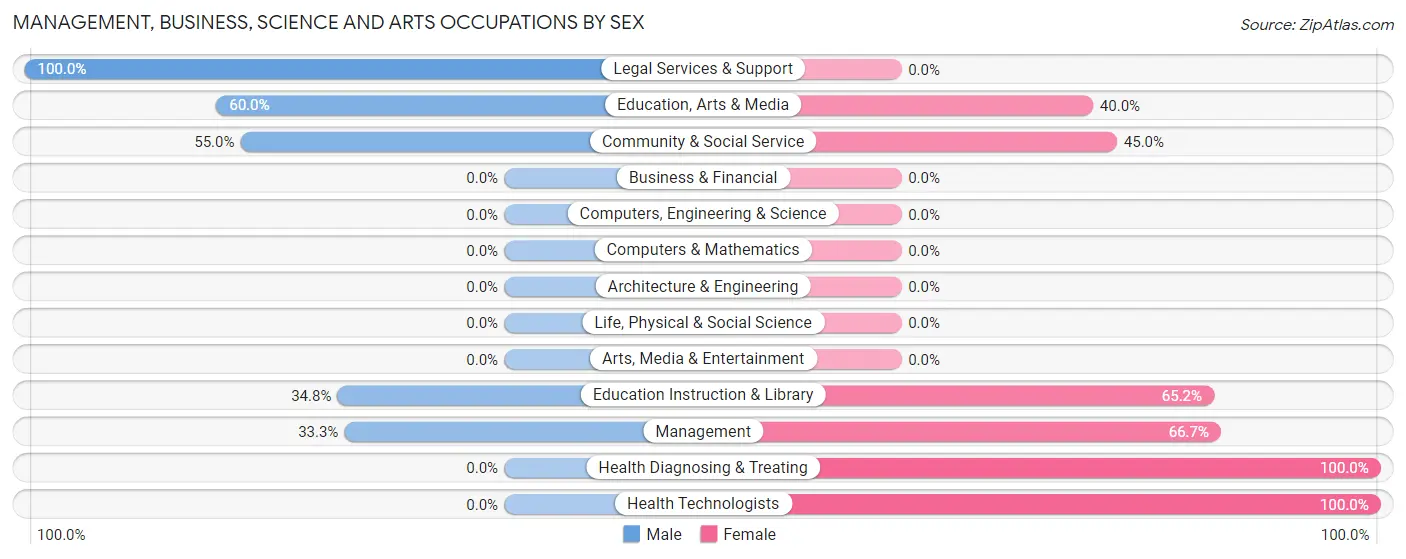
| Occupation | Male | Female |
| Management | 3 (33.3%) | 6 (66.7%) |
| Business & Financial | 0 (0.0%) | 0 (0.0%) |
| Computers, Engineering & Science | 0 (0.0%) | 0 (0.0%) |
| Computers & Mathematics | 0 (0.0%) | 0 (0.0%) |
| Architecture & Engineering | 0 (0.0%) | 0 (0.0%) |
| Life, Physical & Social Science | 0 (0.0%) | 0 (0.0%) |
| Community & Social Service | 33 (55.0%) | 27 (45.0%) |
| Education, Arts & Media | 18 (60.0%) | 12 (40.0%) |
| Legal Services & Support | 7 (100.0%) | 0 (0.0%) |
| Education Instruction & Library | 8 (34.8%) | 15 (65.2%) |
| Arts, Media & Entertainment | 0 (0.0%) | 0 (0.0%) |
| Health Diagnosing & Treating | 0 (0.0%) | 22 (100.0%) |
| Health Technologists | 0 (0.0%) | 9 (100.0%) |
| Total (Category) | 36 (39.6%) | 55 (60.4%) |
| Total (Overall) | 96 (43.8%) | 123 (56.2%) |
Services Occupations
The most common Services occupations in South Webster are Food Preparation & Serving (4 | 1.8%), Security & Protection (3 | 1.4%), and Firefighting & Prevention (3 | 1.4%).
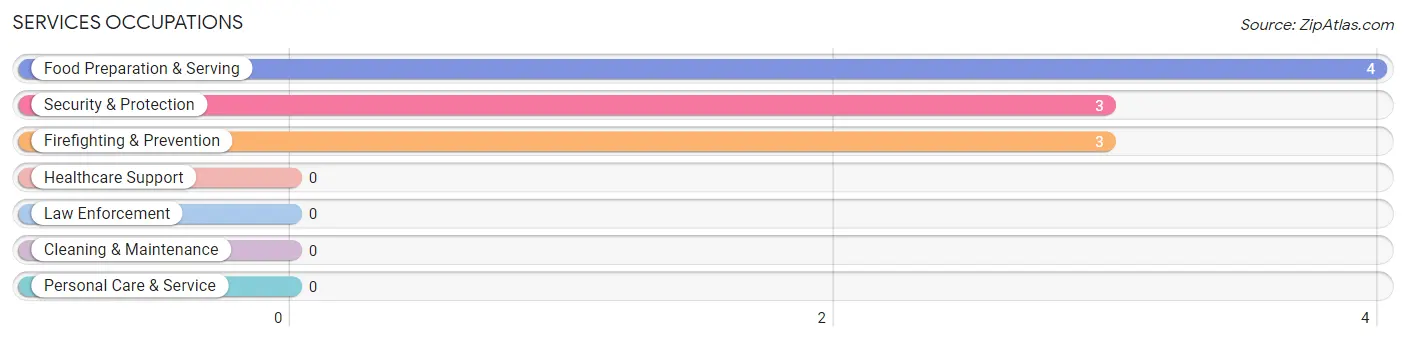
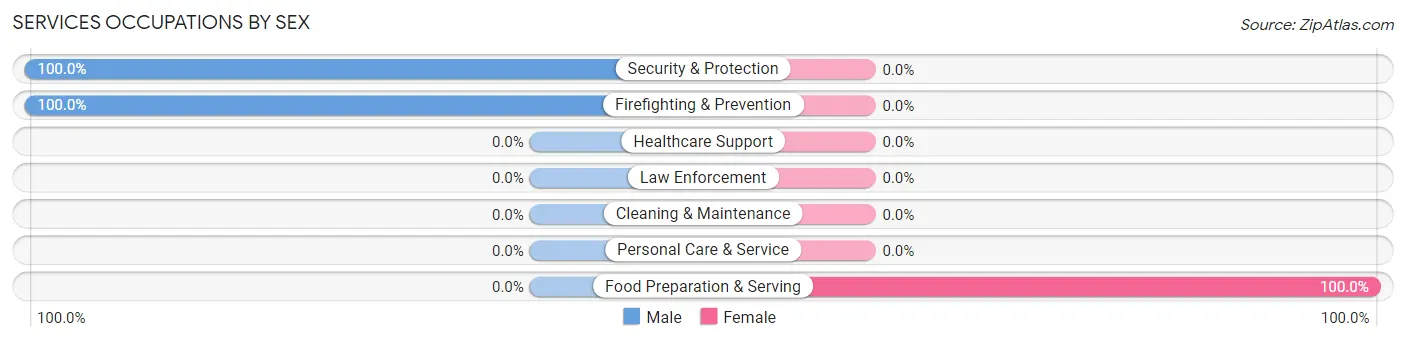
Services Occupations by Sex
| Occupation | Male | Female |
| Healthcare Support | 0 (0.0%) | 0 (0.0%) |
| Security & Protection | 3 (100.0%) | 0 (0.0%) |
| Firefighting & Prevention | 3 (100.0%) | 0 (0.0%) |
| Law Enforcement | 0 (0.0%) | 0 (0.0%) |
| Food Preparation & Serving | 0 (0.0%) | 4 (100.0%) |
| Cleaning & Maintenance | 0 (0.0%) | 0 (0.0%) |
| Personal Care & Service | 0 (0.0%) | 0 (0.0%) |
| Total (Category) | 3 (42.9%) | 4 (57.1%) |
| Total (Overall) | 96 (43.8%) | 123 (56.2%) |
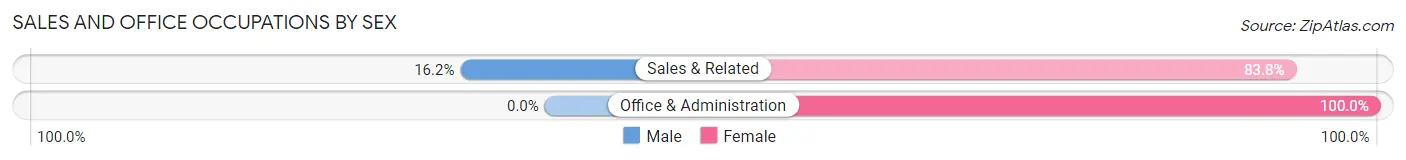
Sales and Office Occupations
The most common Sales and Office occupations in South Webster are Sales & Related (37 | 16.9%), and Office & Administration (33 | 15.1%).
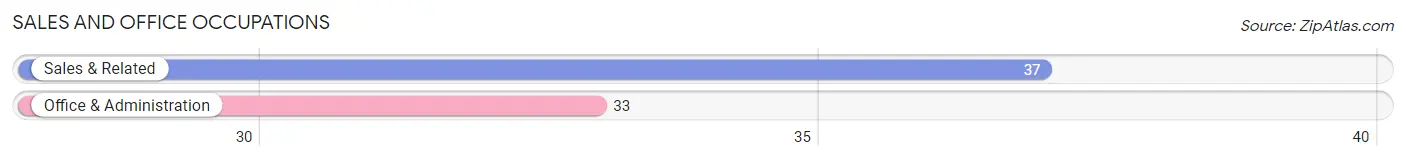
Sales and Office Occupations by Sex
| Occupation | Male | Female |
| Sales & Related | 6 (16.2%) | 31 (83.8%) |
| Office & Administration | 0 (0.0%) | 33 (100.0%) |
| Total (Category) | 6 (8.6%) | 64 (91.4%) |
| Total (Overall) | 96 (43.8%) | 123 (56.2%) |
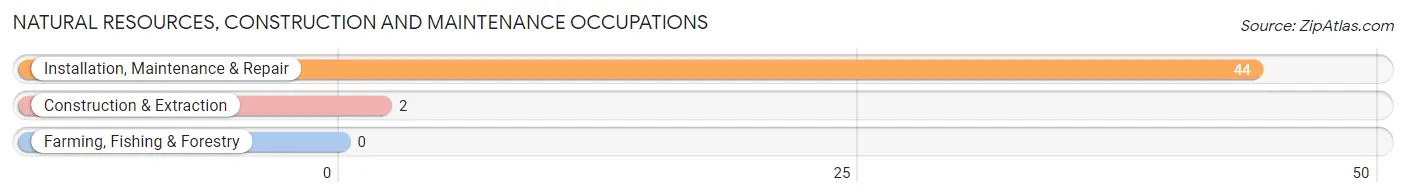
Natural Resources, Construction and Maintenance Occupations
The most common Natural Resources, Construction and Maintenance occupations in South Webster are Installation, Maintenance & Repair (44 | 20.1%), and Construction & Extraction (2 | 0.9%).
Natural Resources, Construction and Maintenance Occupations by Sex
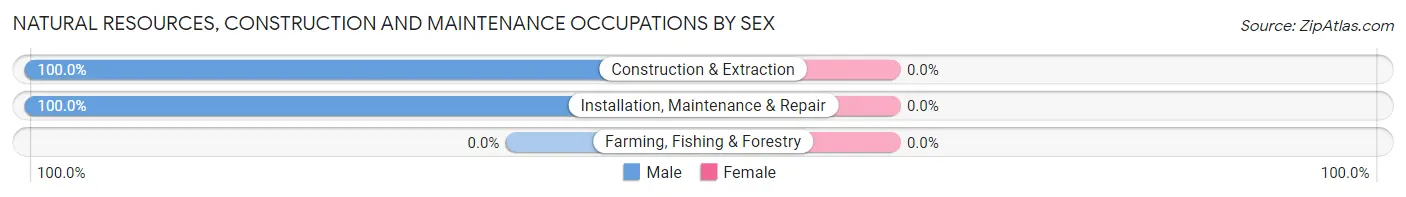
| Occupation | Male | Female |
| Farming, Fishing & Forestry | 0 (0.0%) | 0 (0.0%) |
| Construction & Extraction | 2 (100.0%) | 0 (0.0%) |
| Installation, Maintenance & Repair | 44 (100.0%) | 0 (0.0%) |
| Total (Category) | 46 (100.0%) | 0 (0.0%) |
| Total (Overall) | 96 (43.8%) | 123 (56.2%) |
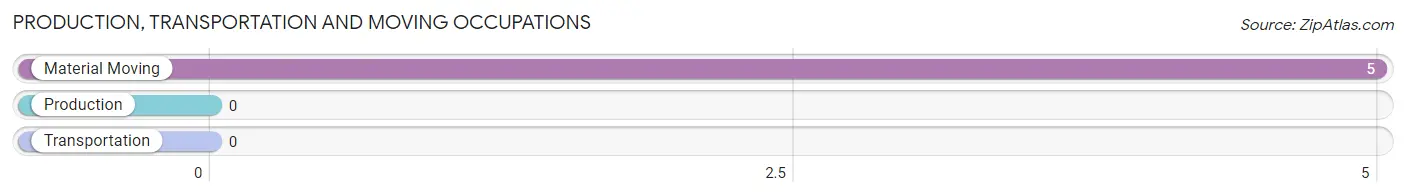
Production, Transportation and Moving Occupations
The most common Production, Transportation and Moving occupations in South Webster are , and Material Moving (5 | 2.3%).
Production, Transportation and Moving Occupations by Sex
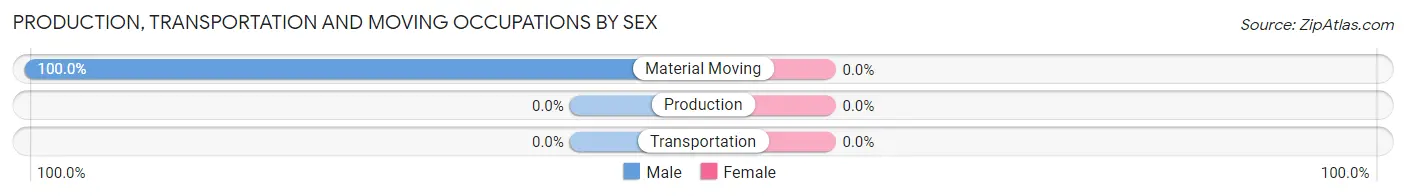
| Occupation | Male | Female |
| Production | 0 (0.0%) | 0 (0.0%) |
| Transportation | 0 (0.0%) | 0 (0.0%) |
| Material Moving | 5 (100.0%) | 0 (0.0%) |
| Total (Category) | 5 (100.0%) | 0 (0.0%) |
| Total (Overall) | 96 (43.8%) | 123 (56.2%) |
Employment Industries by Sex in South Webster
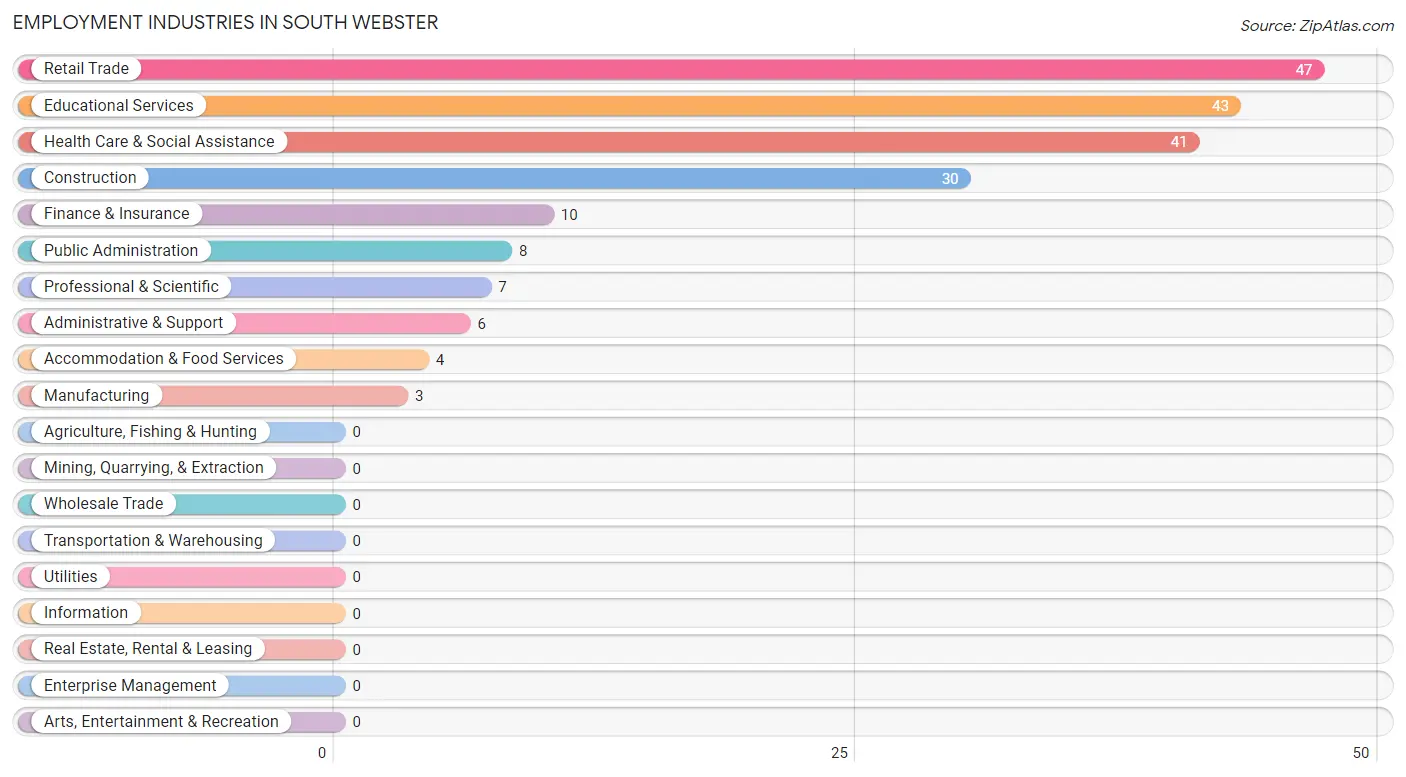
Employment Industries in South Webster
The major employment industries in South Webster include Retail Trade (47 | 21.5%), Educational Services (43 | 19.6%), Health Care & Social Assistance (41 | 18.7%), Construction (30 | 13.7%), and Finance & Insurance (10 | 4.6%).
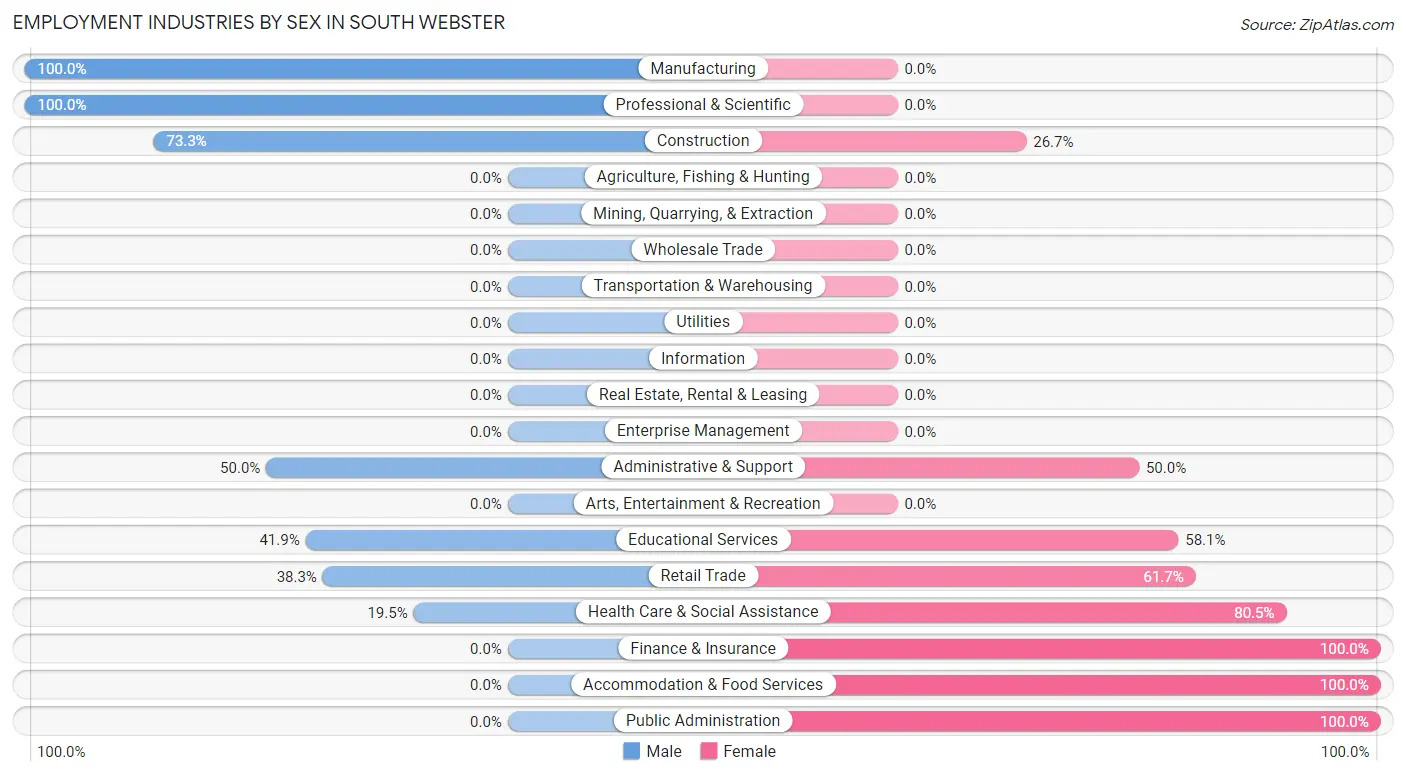
Employment Industries by Sex in South Webster
The South Webster industries that see more men than women are Manufacturing (100.0%), Professional & Scientific (100.0%), and Construction (73.3%), whereas the industries that tend to have a higher number of women are Finance & Insurance (100.0%), Accommodation & Food Services (100.0%), and Public Administration (100.0%).
| Industry | Male | Female |
| Agriculture, Fishing & Hunting | 0 (0.0%) | 0 (0.0%) |
| Mining, Quarrying, & Extraction | 0 (0.0%) | 0 (0.0%) |
| Construction | 22 (73.3%) | 8 (26.7%) |
| Manufacturing | 3 (100.0%) | 0 (0.0%) |
| Wholesale Trade | 0 (0.0%) | 0 (0.0%) |
| Retail Trade | 18 (38.3%) | 29 (61.7%) |
| Transportation & Warehousing | 0 (0.0%) | 0 (0.0%) |
| Utilities | 0 (0.0%) | 0 (0.0%) |
| Information | 0 (0.0%) | 0 (0.0%) |
| Finance & Insurance | 0 (0.0%) | 10 (100.0%) |
| Real Estate, Rental & Leasing | 0 (0.0%) | 0 (0.0%) |
| Professional & Scientific | 7 (100.0%) | 0 (0.0%) |
| Enterprise Management | 0 (0.0%) | 0 (0.0%) |
| Administrative & Support | 3 (50.0%) | 3 (50.0%) |
| Educational Services | 18 (41.9%) | 25 (58.1%) |
| Health Care & Social Assistance | 8 (19.5%) | 33 (80.5%) |
| Arts, Entertainment & Recreation | 0 (0.0%) | 0 (0.0%) |
| Accommodation & Food Services | 0 (0.0%) | 4 (100.0%) |
| Public Administration | 0 (0.0%) | 8 (100.0%) |
| Total | 96 (43.8%) | 123 (56.2%) |
Education in South Webster
School Enrollment in South Webster
The most common levels of schooling among the 148 students in South Webster are elementary school (48 | 32.4%), high school (46 | 31.1%), and middle school (41 | 27.7%).
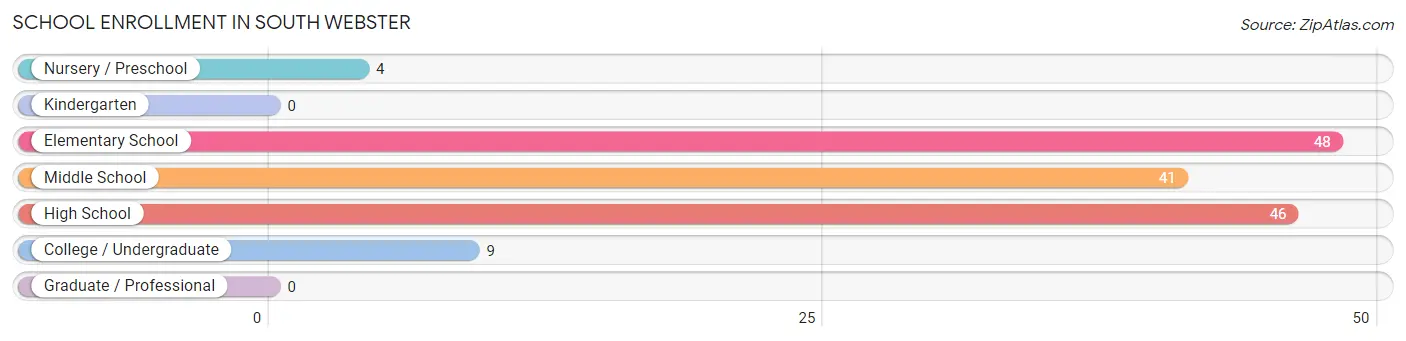
| School Level | # Students | % Students |
| Nursery / Preschool | 4 | 2.7% |
| Kindergarten | 0 | 0.0% |
| Elementary School | 48 | 32.4% |
| Middle School | 41 | 27.7% |
| High School | 46 | 31.1% |
| College / Undergraduate | 9 | 6.1% |
| Graduate / Professional | 0 | 0.0% |
| Total | 148 | 100.0% |
School Enrollment by Age by Funding Source in South Webster
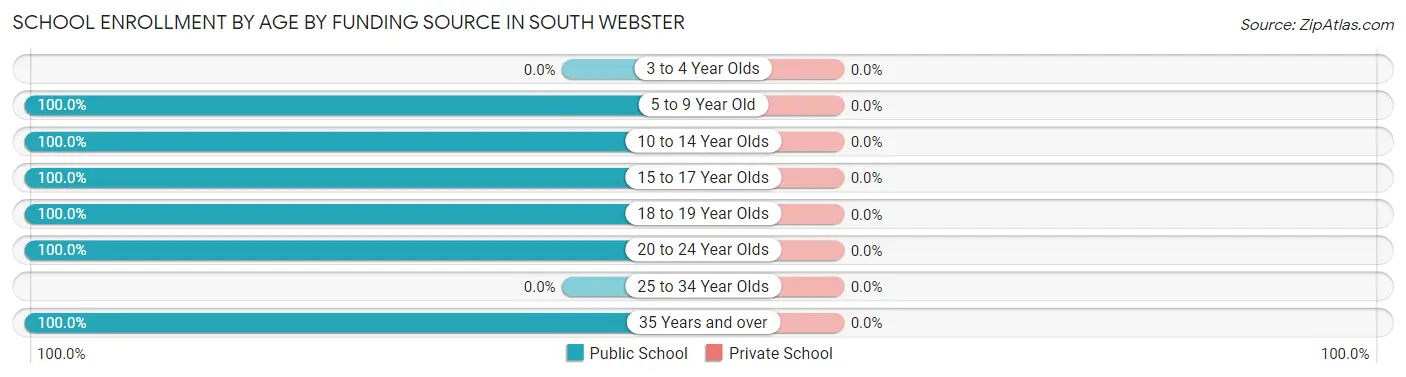
| Age Bracket | Public School | Private School |
| 3 to 4 Year Olds | 0 (0.0%) | 0 (0.0%) |
| 5 to 9 Year Old | 32 (100.0%) | 0 (0.0%) |
| 10 to 14 Year Olds | 61 (100.0%) | 0 (0.0%) |
| 15 to 17 Year Olds | 46 (100.0%) | 0 (0.0%) |
| 18 to 19 Year Olds | 3 (100.0%) | 0 (0.0%) |
| 20 to 24 Year Olds | 5 (100.0%) | 0 (0.0%) |
| 25 to 34 Year Olds | 0 (0.0%) | 0 (0.0%) |
| 35 Years and over | 1 (100.0%) | 0 (0.0%) |
| Total | 148 (100.0%) | 0 (0.0%) |
Educational Attainment by Field of Study in South Webster
Education (44 | 42.3%), bio, nature & agricultural (22 | 21.1%), arts & humanities (16 | 15.4%), business (9 | 8.6%), and science & technology (7 | 6.7%) are the most common fields of study among 104 individuals in South Webster who have obtained a bachelor's degree or higher.
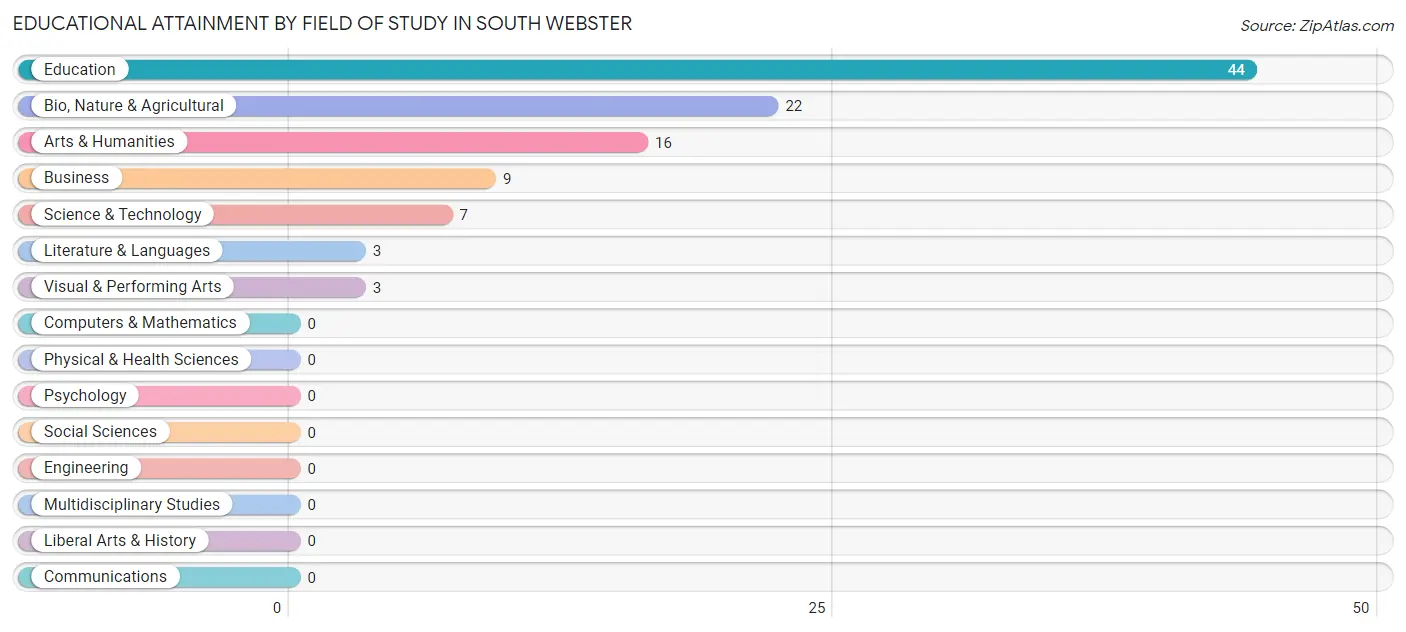
| Field of Study | # Graduates | % Graduates |
| Computers & Mathematics | 0 | 0.0% |
| Bio, Nature & Agricultural | 22 | 21.1% |
| Physical & Health Sciences | 0 | 0.0% |
| Psychology | 0 | 0.0% |
| Social Sciences | 0 | 0.0% |
| Engineering | 0 | 0.0% |
| Multidisciplinary Studies | 0 | 0.0% |
| Science & Technology | 7 | 6.7% |
| Business | 9 | 8.6% |
| Education | 44 | 42.3% |
| Literature & Languages | 3 | 2.9% |
| Liberal Arts & History | 0 | 0.0% |
| Visual & Performing Arts | 3 | 2.9% |
| Communications | 0 | 0.0% |
| Arts & Humanities | 16 | 15.4% |
| Total | 104 | 100.0% |
Transportation & Commute in South Webster
Vehicle Availability by Sex in South Webster
The most prevalent vehicle ownership categories in South Webster are males with 2 vehicles (48, accounting for 50.0%) and females with 2 vehicles (63, making up 39.0%).
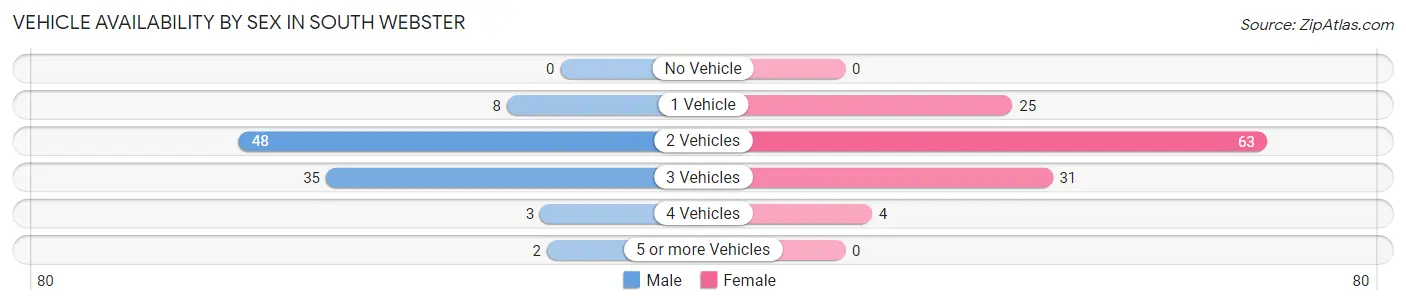
| Vehicles Available | Male | Female |
| No Vehicle | 0 (0.0%) | 0 (0.0%) |
| 1 Vehicle | 8 (8.3%) | 25 (20.3%) |
| 2 Vehicles | 48 (50.0%) | 63 (51.2%) |
| 3 Vehicles | 35 (36.5%) | 31 (25.2%) |
| 4 Vehicles | 3 (3.1%) | 4 (3.3%) |
| 5 or more Vehicles | 2 (2.1%) | 0 (0.0%) |
| Total | 96 (100.0%) | 123 (100.0%) |
Commute Time in South Webster
The most frequently occuring commute durations in South Webster are 30 to 34 minutes (48 commuters, 22.3%), less than 5 minutes (46 commuters, 21.4%), and 45 to 59 minutes (26 commuters, 12.1%).
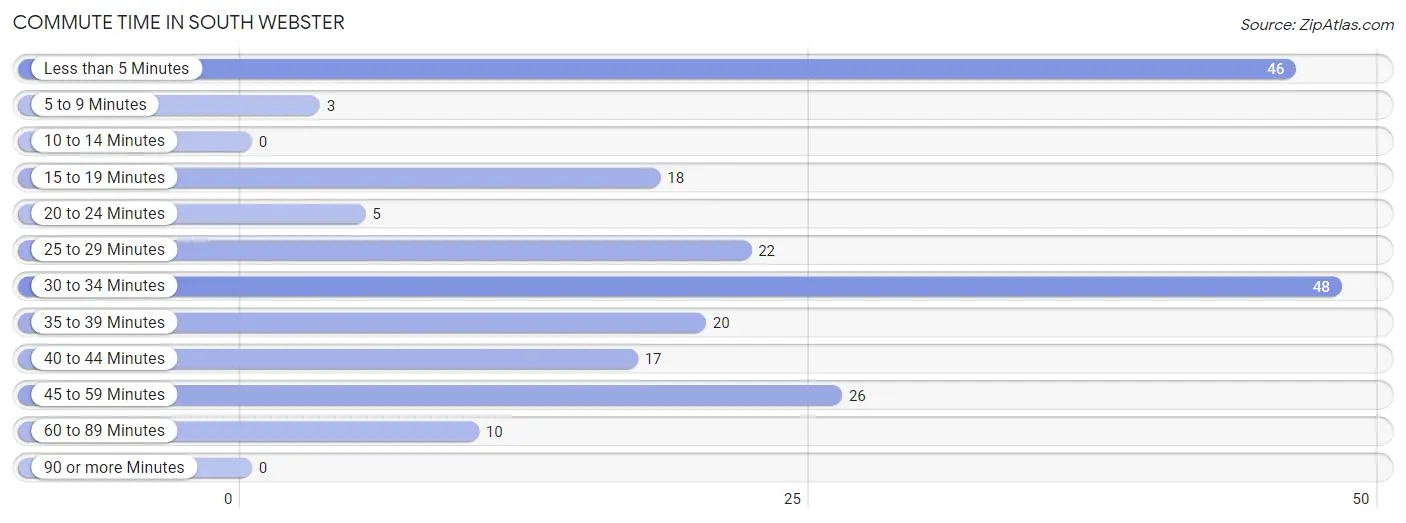
| Commute Time | # Commuters | % Commuters |
| Less than 5 Minutes | 46 | 21.4% |
| 5 to 9 Minutes | 3 | 1.4% |
| 10 to 14 Minutes | 0 | 0.0% |
| 15 to 19 Minutes | 18 | 8.4% |
| 20 to 24 Minutes | 5 | 2.3% |
| 25 to 29 Minutes | 22 | 10.2% |
| 30 to 34 Minutes | 48 | 22.3% |
| 35 to 39 Minutes | 20 | 9.3% |
| 40 to 44 Minutes | 17 | 7.9% |
| 45 to 59 Minutes | 26 | 12.1% |
| 60 to 89 Minutes | 10 | 4.6% |
| 90 or more Minutes | 0 | 0.0% |
Commute Time by Sex in South Webster
The most common commute times in South Webster are 30 to 34 minutes (23 commuters, 24.0%) for males and 45 to 59 minutes (26 commuters, 21.8%) for females.
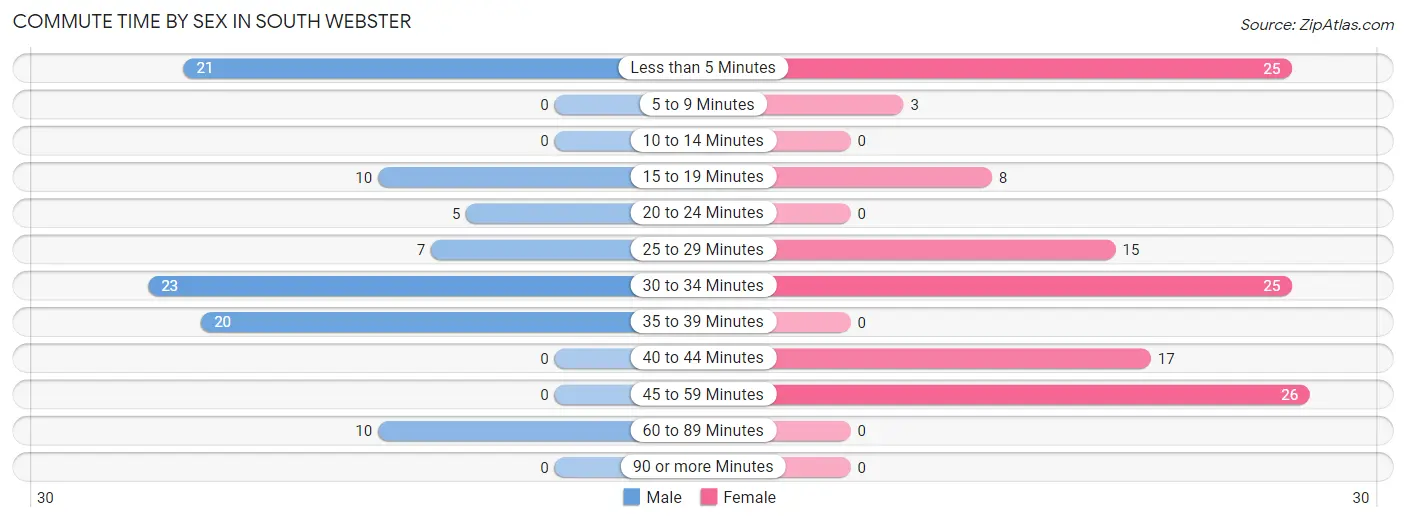
| Commute Time | Male | Female |
| Less than 5 Minutes | 21 (21.9%) | 25 (21.0%) |
| 5 to 9 Minutes | 0 (0.0%) | 3 (2.5%) |
| 10 to 14 Minutes | 0 (0.0%) | 0 (0.0%) |
| 15 to 19 Minutes | 10 (10.4%) | 8 (6.7%) |
| 20 to 24 Minutes | 5 (5.2%) | 0 (0.0%) |
| 25 to 29 Minutes | 7 (7.3%) | 15 (12.6%) |
| 30 to 34 Minutes | 23 (24.0%) | 25 (21.0%) |
| 35 to 39 Minutes | 20 (20.8%) | 0 (0.0%) |
| 40 to 44 Minutes | 0 (0.0%) | 17 (14.3%) |
| 45 to 59 Minutes | 0 (0.0%) | 26 (21.8%) |
| 60 to 89 Minutes | 10 (10.4%) | 0 (0.0%) |
| 90 or more Minutes | 0 (0.0%) | 0 (0.0%) |
Time of Departure to Work by Sex in South Webster
The most frequent times of departure to work in South Webster are 7:30 AM to 7:59 AM (30, 31.2%) for males and 7:00 AM to 7:29 AM (50, 42.0%) for females.
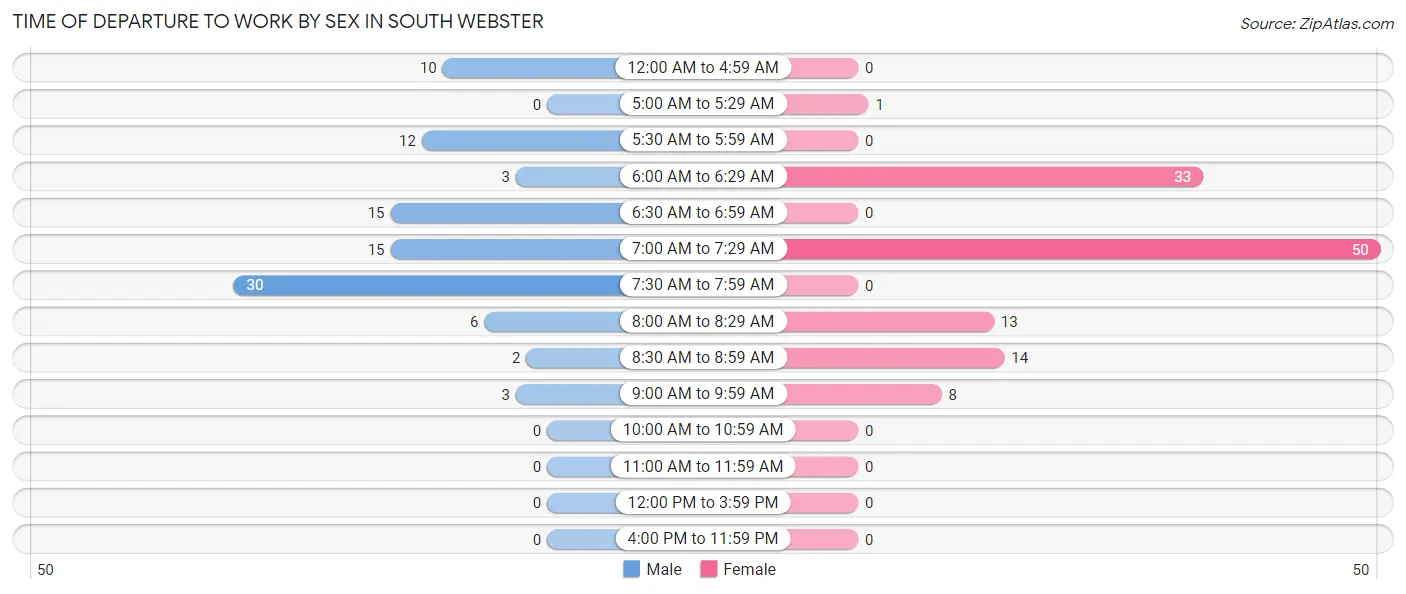
| Time of Departure | Male | Female |
| 12:00 AM to 4:59 AM | 10 (10.4%) | 0 (0.0%) |
| 5:00 AM to 5:29 AM | 0 (0.0%) | 1 (0.8%) |
| 5:30 AM to 5:59 AM | 12 (12.5%) | 0 (0.0%) |
| 6:00 AM to 6:29 AM | 3 (3.1%) | 33 (27.7%) |
| 6:30 AM to 6:59 AM | 15 (15.6%) | 0 (0.0%) |
| 7:00 AM to 7:29 AM | 15 (15.6%) | 50 (42.0%) |
| 7:30 AM to 7:59 AM | 30 (31.2%) | 0 (0.0%) |
| 8:00 AM to 8:29 AM | 6 (6.2%) | 13 (10.9%) |
| 8:30 AM to 8:59 AM | 2 (2.1%) | 14 (11.8%) |
| 9:00 AM to 9:59 AM | 3 (3.1%) | 8 (6.7%) |
| 10:00 AM to 10:59 AM | 0 (0.0%) | 0 (0.0%) |
| 11:00 AM to 11:59 AM | 0 (0.0%) | 0 (0.0%) |
| 12:00 PM to 3:59 PM | 0 (0.0%) | 0 (0.0%) |
| 4:00 PM to 11:59 PM | 0 (0.0%) | 0 (0.0%) |
| Total | 96 (100.0%) | 119 (100.0%) |
Housing Occupancy in South Webster
Occupancy by Ownership in South Webster
Of the total 341 dwellings in South Webster, owner-occupied units account for 261 (76.5%), while renter-occupied units make up 80 (23.5%).
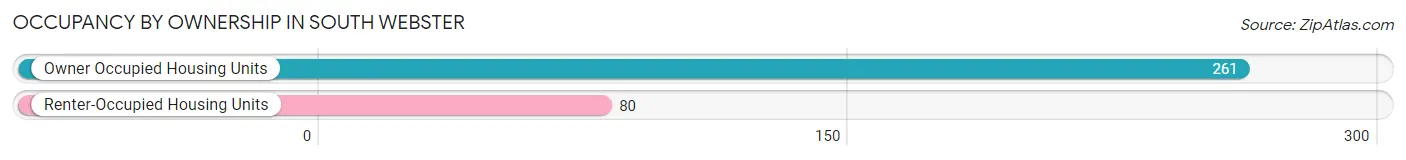
| Occupancy | # Housing Units | % Housing Units |
| Owner Occupied Housing Units | 261 | 76.5% |
| Renter-Occupied Housing Units | 80 | 23.5% |
| Total Occupied Housing Units | 341 | 100.0% |
Occupancy by Household Size in South Webster
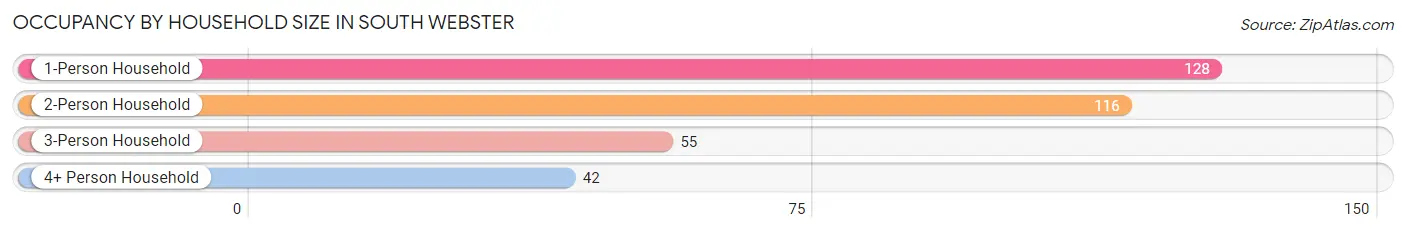
| Household Size | # Housing Units | % Housing Units |
| 1-Person Household | 128 | 37.5% |
| 2-Person Household | 116 | 34.0% |
| 3-Person Household | 55 | 16.1% |
| 4+ Person Household | 42 | 12.3% |
| Total Housing Units | 341 | 100.0% |
Occupancy by Ownership by Household Size in South Webster
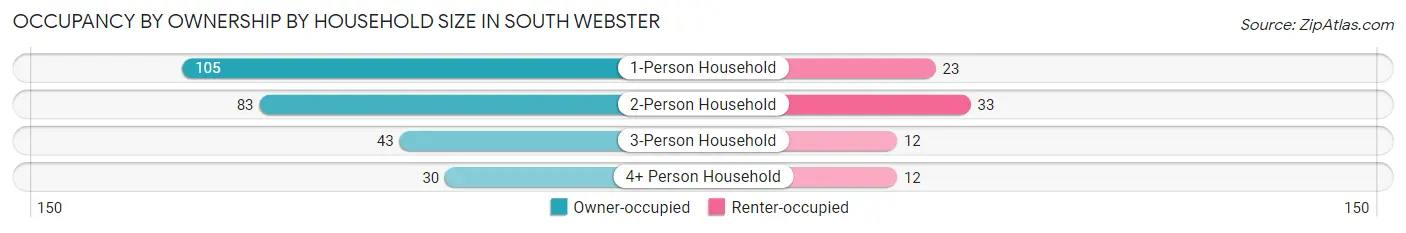
| Household Size | Owner-occupied | Renter-occupied |
| 1-Person Household | 105 (82.0%) | 23 (18.0%) |
| 2-Person Household | 83 (71.6%) | 33 (28.4%) |
| 3-Person Household | 43 (78.2%) | 12 (21.8%) |
| 4+ Person Household | 30 (71.4%) | 12 (28.6%) |
| Total Housing Units | 261 (76.5%) | 80 (23.5%) |
Occupancy by Educational Attainment in South Webster
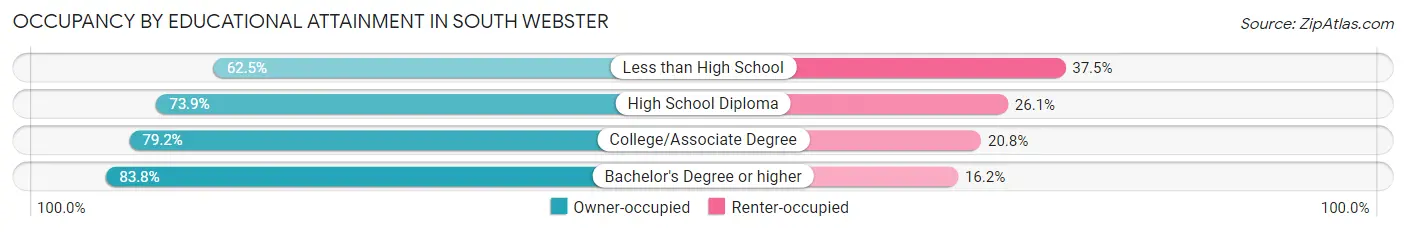
| Household Size | Owner-occupied | Renter-occupied |
| Less than High School | 20 (62.5%) | 12 (37.5%) |
| High School Diploma | 99 (73.9%) | 35 (26.1%) |
| College/Associate Degree | 80 (79.2%) | 21 (20.8%) |
| Bachelor's Degree or higher | 62 (83.8%) | 12 (16.2%) |
Occupancy by Age of Householder in South Webster
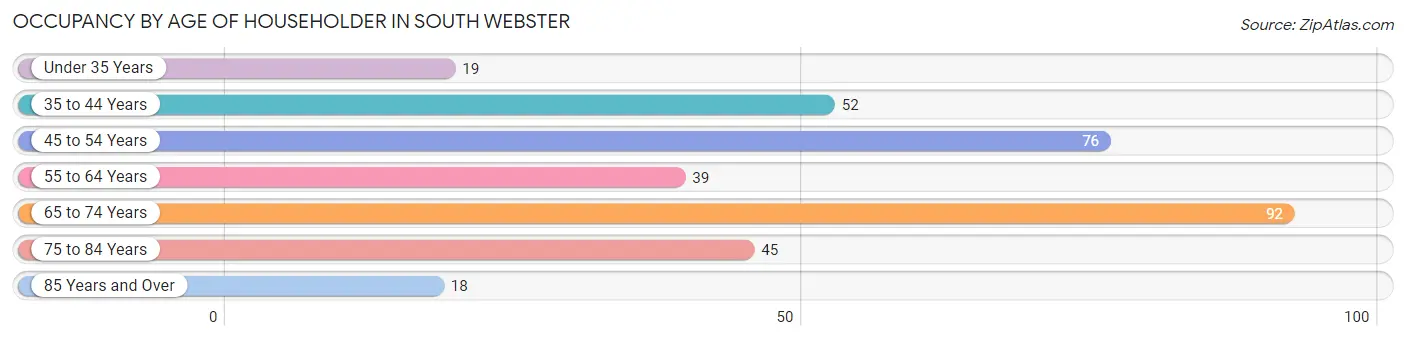
| Age Bracket | # Households | % Households |
| Under 35 Years | 19 | 5.6% |
| 35 to 44 Years | 52 | 15.2% |
| 45 to 54 Years | 76 | 22.3% |
| 55 to 64 Years | 39 | 11.4% |
| 65 to 74 Years | 92 | 27.0% |
| 75 to 84 Years | 45 | 13.2% |
| 85 Years and Over | 18 | 5.3% |
| Total | 341 | 100.0% |
Housing Finances in South Webster
Median Income by Occupancy in South Webster
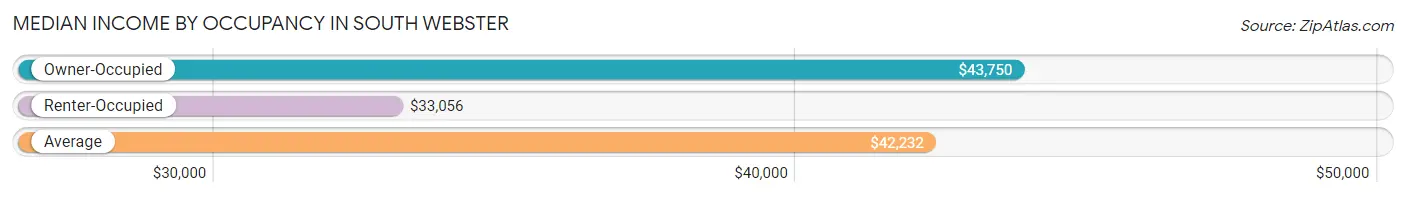
| Occupancy Type | # Households | Median Income |
| Owner-Occupied | 261 (76.5%) | $43,750 |
| Renter-Occupied | 80 (23.5%) | $33,056 |
| Average | 341 (100.0%) | $42,232 |
Occupancy by Householder Income Bracket in South Webster
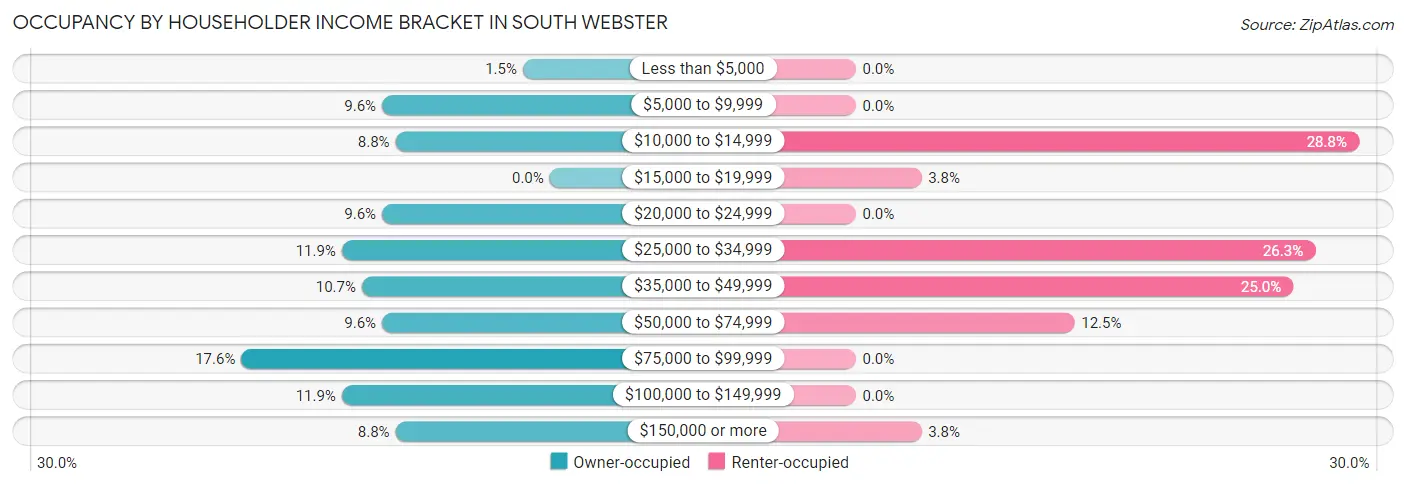
| Income Bracket | Owner-occupied | Renter-occupied |
| Less than $5,000 | 4 (1.5%) | 0 (0.0%) |
| $5,000 to $9,999 | 25 (9.6%) | 0 (0.0%) |
| $10,000 to $14,999 | 23 (8.8%) | 23 (28.7%) |
| $15,000 to $19,999 | 0 (0.0%) | 3 (3.7%) |
| $20,000 to $24,999 | 25 (9.6%) | 0 (0.0%) |
| $25,000 to $34,999 | 31 (11.9%) | 21 (26.3%) |
| $35,000 to $49,999 | 28 (10.7%) | 20 (25.0%) |
| $50,000 to $74,999 | 25 (9.6%) | 10 (12.5%) |
| $75,000 to $99,999 | 46 (17.6%) | 0 (0.0%) |
| $100,000 to $149,999 | 31 (11.9%) | 0 (0.0%) |
| $150,000 or more | 23 (8.8%) | 3 (3.7%) |
| Total | 261 (100.0%) | 80 (100.0%) |
Monthly Housing Cost Tiers in South Webster
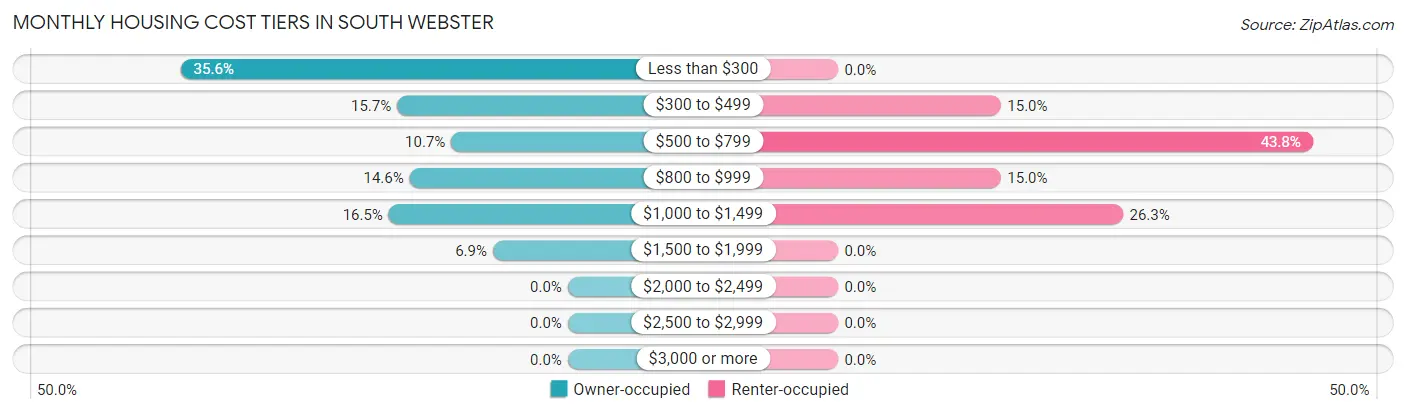
| Monthly Cost | Owner-occupied | Renter-occupied |
| Less than $300 | 93 (35.6%) | 0 (0.0%) |
| $300 to $499 | 41 (15.7%) | 12 (15.0%) |
| $500 to $799 | 28 (10.7%) | 35 (43.8%) |
| $800 to $999 | 38 (14.6%) | 12 (15.0%) |
| $1,000 to $1,499 | 43 (16.5%) | 21 (26.3%) |
| $1,500 to $1,999 | 18 (6.9%) | 0 (0.0%) |
| $2,000 to $2,499 | 0 (0.0%) | 0 (0.0%) |
| $2,500 to $2,999 | 0 (0.0%) | 0 (0.0%) |
| $3,000 or more | 0 (0.0%) | 0 (0.0%) |
| Total | 261 (100.0%) | 80 (100.0%) |
Physical Housing Characteristics in South Webster
Housing Structures in South Webster
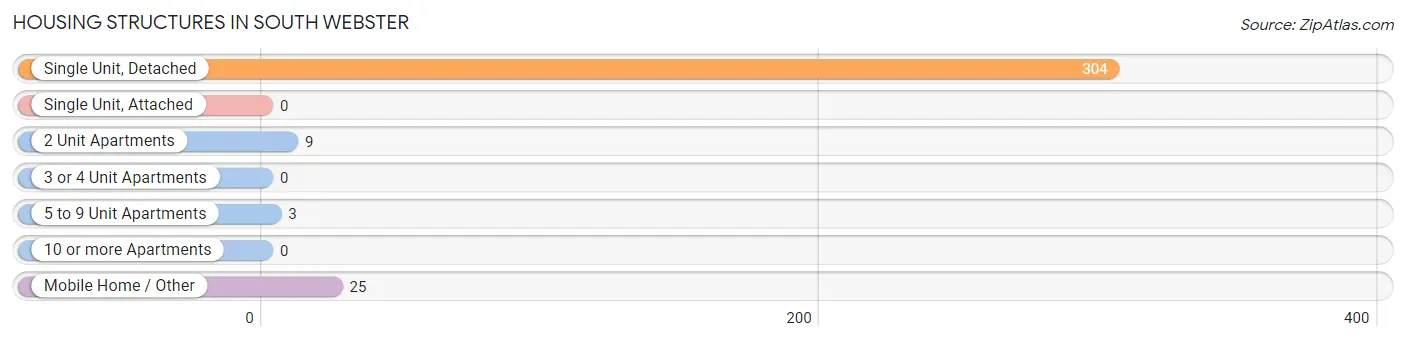
| Structure Type | # Housing Units | % Housing Units |
| Single Unit, Detached | 304 | 89.1% |
| Single Unit, Attached | 0 | 0.0% |
| 2 Unit Apartments | 9 | 2.6% |
| 3 or 4 Unit Apartments | 0 | 0.0% |
| 5 to 9 Unit Apartments | 3 | 0.9% |
| 10 or more Apartments | 0 | 0.0% |
| Mobile Home / Other | 25 | 7.3% |
| Total | 341 | 100.0% |
Housing Structures by Occupancy in South Webster
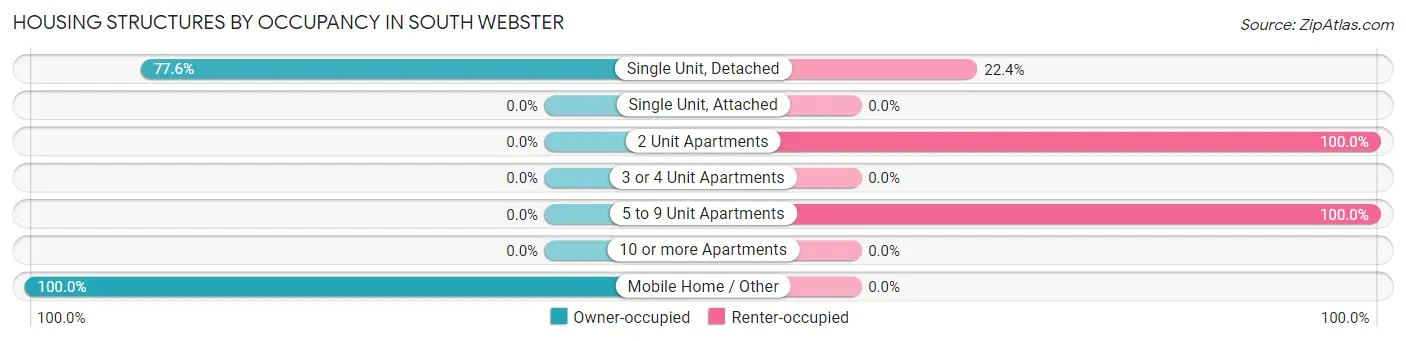
| Structure Type | Owner-occupied | Renter-occupied |
| Single Unit, Detached | 236 (77.6%) | 68 (22.4%) |
| Single Unit, Attached | 0 (0.0%) | 0 (0.0%) |
| 2 Unit Apartments | 0 (0.0%) | 9 (100.0%) |
| 3 or 4 Unit Apartments | 0 (0.0%) | 0 (0.0%) |
| 5 to 9 Unit Apartments | 0 (0.0%) | 3 (100.0%) |
| 10 or more Apartments | 0 (0.0%) | 0 (0.0%) |
| Mobile Home / Other | 25 (100.0%) | 0 (0.0%) |
| Total | 261 (76.5%) | 80 (23.5%) |
Housing Structures by Number of Rooms in South Webster
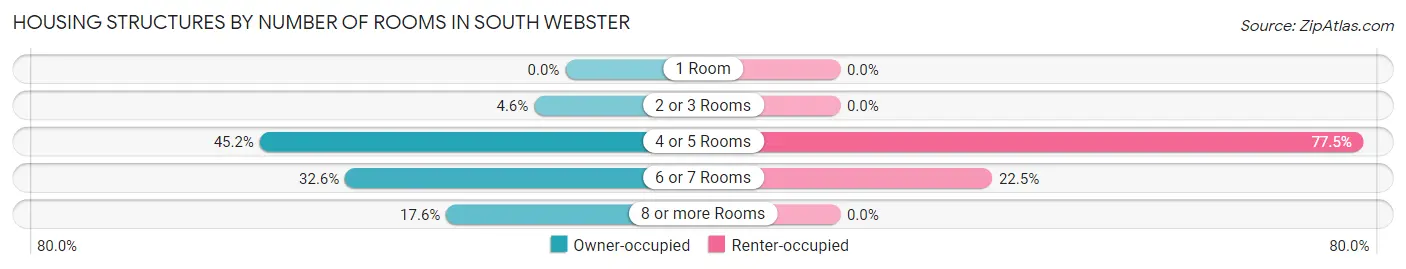
| Number of Rooms | Owner-occupied | Renter-occupied |
| 1 Room | 0 (0.0%) | 0 (0.0%) |
| 2 or 3 Rooms | 12 (4.6%) | 0 (0.0%) |
| 4 or 5 Rooms | 118 (45.2%) | 62 (77.5%) |
| 6 or 7 Rooms | 85 (32.6%) | 18 (22.5%) |
| 8 or more Rooms | 46 (17.6%) | 0 (0.0%) |
| Total | 261 (100.0%) | 80 (100.0%) |
Housing Structure by Heating Type in South Webster
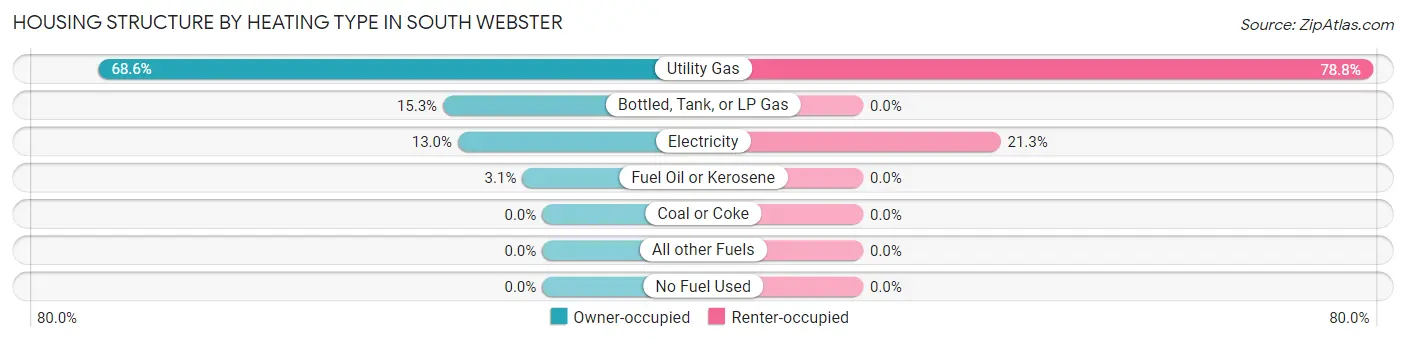
| Heating Type | Owner-occupied | Renter-occupied |
| Utility Gas | 179 (68.6%) | 63 (78.7%) |
| Bottled, Tank, or LP Gas | 40 (15.3%) | 0 (0.0%) |
| Electricity | 34 (13.0%) | 17 (21.2%) |
| Fuel Oil or Kerosene | 8 (3.1%) | 0 (0.0%) |
| Coal or Coke | 0 (0.0%) | 0 (0.0%) |
| All other Fuels | 0 (0.0%) | 0 (0.0%) |
| No Fuel Used | 0 (0.0%) | 0 (0.0%) |
| Total | 261 (100.0%) | 80 (100.0%) |
Household Vehicle Usage in South Webster
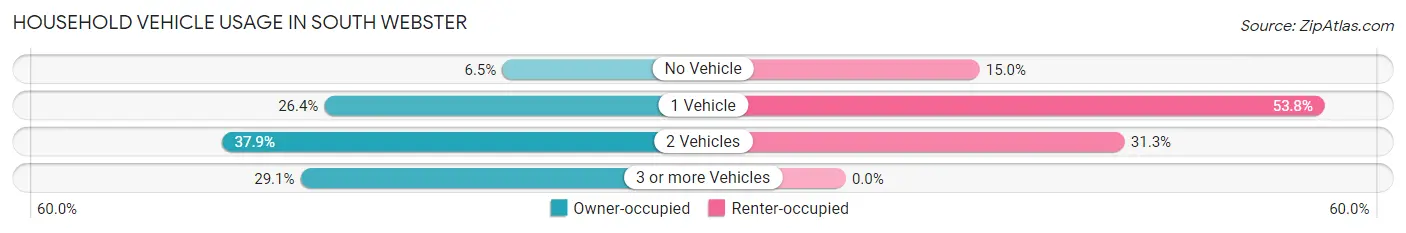
| Vehicles per Household | Owner-occupied | Renter-occupied |
| No Vehicle | 17 (6.5%) | 12 (15.0%) |
| 1 Vehicle | 69 (26.4%) | 43 (53.7%) |
| 2 Vehicles | 99 (37.9%) | 25 (31.2%) |
| 3 or more Vehicles | 76 (29.1%) | 0 (0.0%) |
| Total | 261 (100.0%) | 80 (100.0%) |
Real Estate & Mortgages in South Webster
Real Estate and Mortgage Overview in South Webster
| Characteristic | Without Mortgage | With Mortgage |
| Housing Units | 150 | 111 |
| Median Property Value | $115,700 | $114,800 |
| Median Household Income | $30,417 | $23 |
| Monthly Housing Costs | $282 | $0 |
| Real Estate Taxes | $676 | $0 |
Property Value by Mortgage Status in South Webster
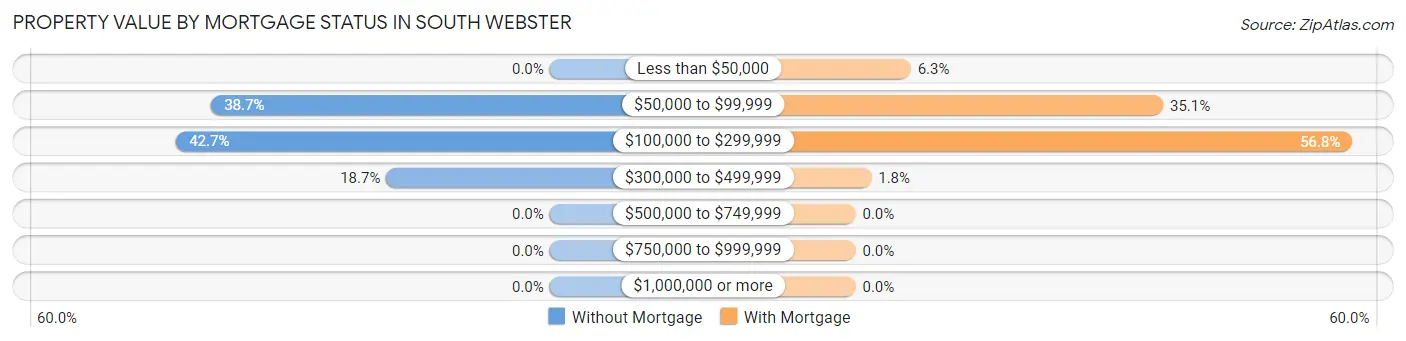
| Property Value | Without Mortgage | With Mortgage |
| Less than $50,000 | 0 (0.0%) | 7 (6.3%) |
| $50,000 to $99,999 | 58 (38.7%) | 39 (35.1%) |
| $100,000 to $299,999 | 64 (42.7%) | 63 (56.8%) |
| $300,000 to $499,999 | 28 (18.7%) | 2 (1.8%) |
| $500,000 to $749,999 | 0 (0.0%) | 0 (0.0%) |
| $750,000 to $999,999 | 0 (0.0%) | 0 (0.0%) |
| $1,000,000 or more | 0 (0.0%) | 0 (0.0%) |
| Total | 150 (100.0%) | 111 (100.0%) |
Household Income by Mortgage Status in South Webster
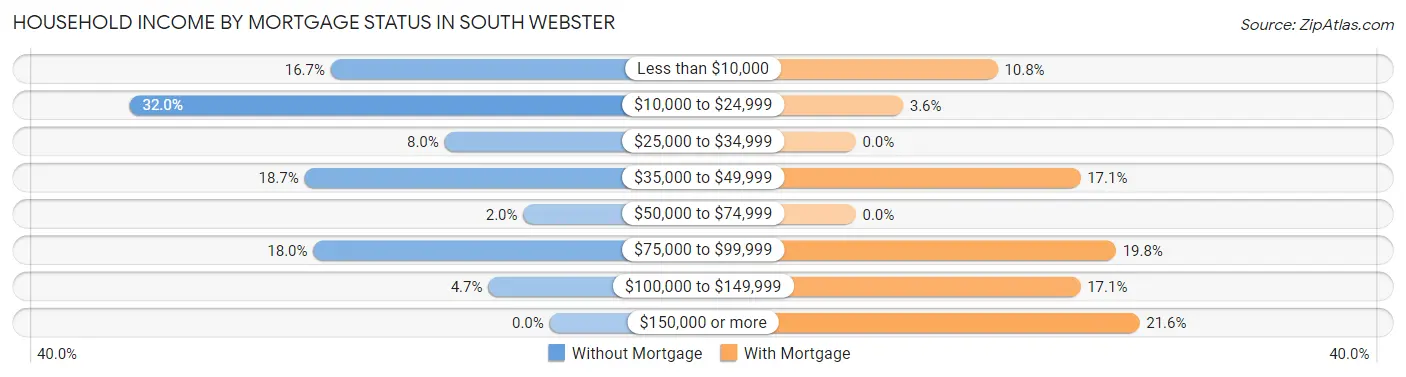
| Household Income | Without Mortgage | With Mortgage |
| Less than $10,000 | 25 (16.7%) | 12 (10.8%) |
| $10,000 to $24,999 | 48 (32.0%) | 4 (3.6%) |
| $25,000 to $34,999 | 12 (8.0%) | 0 (0.0%) |
| $35,000 to $49,999 | 28 (18.7%) | 19 (17.1%) |
| $50,000 to $74,999 | 3 (2.0%) | 0 (0.0%) |
| $75,000 to $99,999 | 27 (18.0%) | 22 (19.8%) |
| $100,000 to $149,999 | 7 (4.7%) | 19 (17.1%) |
| $150,000 or more | 0 (0.0%) | 24 (21.6%) |
| Total | 150 (100.0%) | 111 (100.0%) |
Property Value to Household Income Ratio in South Webster
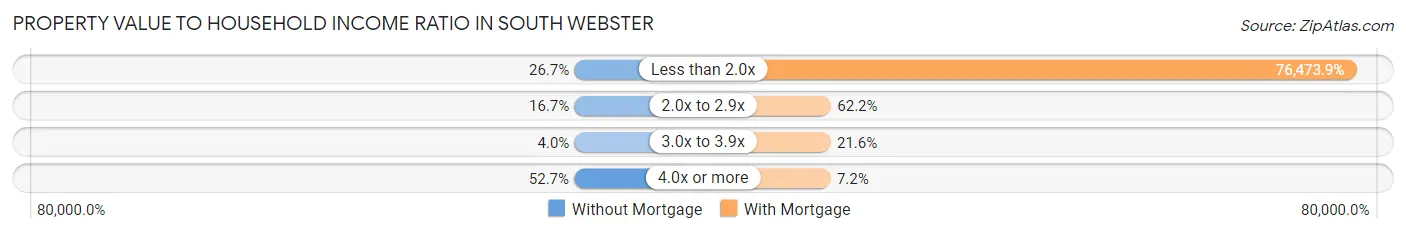
| Value-to-Income Ratio | Without Mortgage | With Mortgage |
| Less than 2.0x | 40 (26.7%) | 84,886 (76,473.9%) |
| 2.0x to 2.9x | 25 (16.7%) | 69 (62.2%) |
| 3.0x to 3.9x | 6 (4.0%) | 24 (21.6%) |
| 4.0x or more | 79 (52.7%) | 8 (7.2%) |
| Total | 150 (100.0%) | 111 (100.0%) |
Real Estate Taxes by Mortgage Status in South Webster
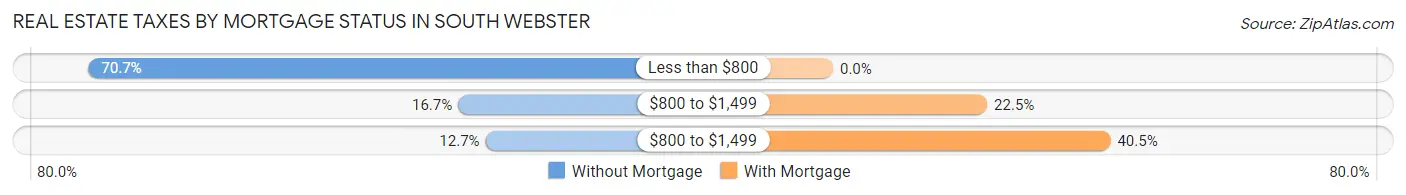
| Property Taxes | Without Mortgage | With Mortgage |
| Less than $800 | 106 (70.7%) | 0 (0.0%) |
| $800 to $1,499 | 25 (16.7%) | 25 (22.5%) |
| $800 to $1,499 | 19 (12.7%) | 45 (40.5%) |
| Total | 150 (100.0%) | 111 (100.0%) |
Health & Disability in South Webster
Health Insurance Coverage by Age in South Webster
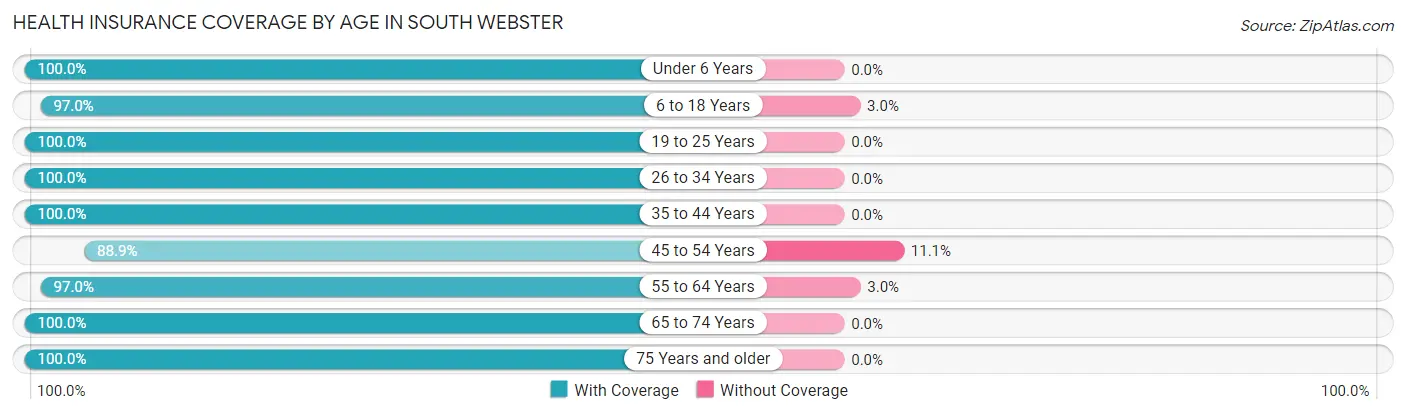
| Age Bracket | With Coverage | Without Coverage |
| Under 6 Years | 36 (100.0%) | 0 (0.0%) |
| 6 to 18 Years | 131 (97.0%) | 4 (3.0%) |
| 19 to 25 Years | 29 (100.0%) | 0 (0.0%) |
| 26 to 34 Years | 11 (100.0%) | 0 (0.0%) |
| 35 to 44 Years | 96 (100.0%) | 0 (0.0%) |
| 45 to 54 Years | 104 (88.9%) | 13 (11.1%) |
| 55 to 64 Years | 65 (97.0%) | 2 (3.0%) |
| 65 to 74 Years | 144 (100.0%) | 0 (0.0%) |
| 75 Years and older | 101 (100.0%) | 0 (0.0%) |
| Total | 717 (97.4%) | 19 (2.6%) |
Health Insurance Coverage by Citizenship Status in South Webster
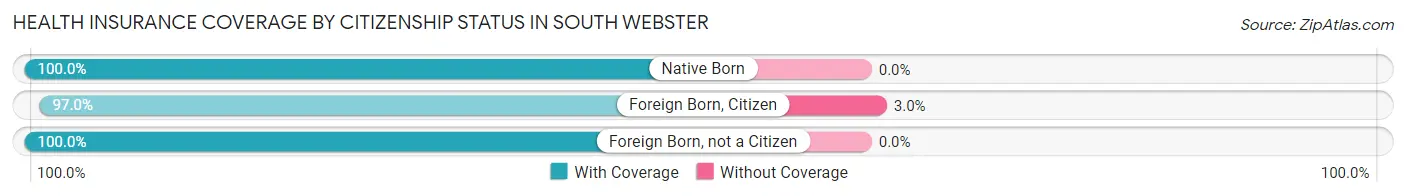
| Citizenship Status | With Coverage | Without Coverage |
| Native Born | 36 (100.0%) | 0 (0.0%) |
| Foreign Born, Citizen | 131 (97.0%) | 4 (3.0%) |
| Foreign Born, not a Citizen | 29 (100.0%) | 0 (0.0%) |
Health Insurance Coverage by Household Income in South Webster
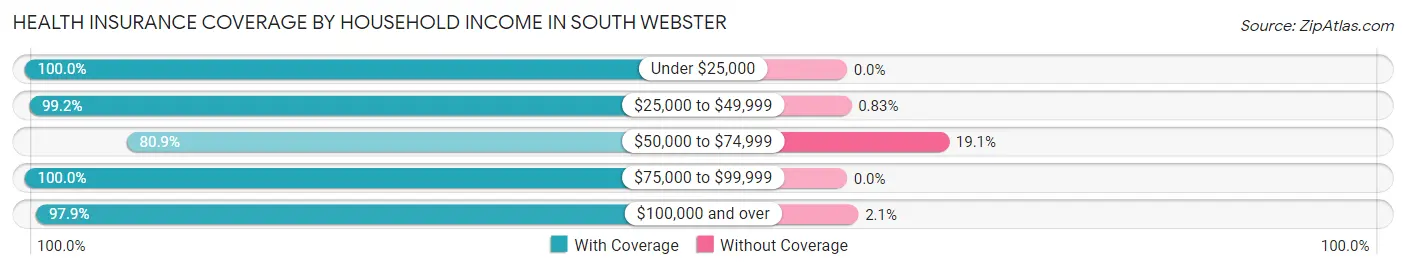
| Household Income | With Coverage | Without Coverage |
| Under $25,000 | 142 (100.0%) | 0 (0.0%) |
| $25,000 to $49,999 | 238 (99.2%) | 2 (0.8%) |
| $50,000 to $74,999 | 55 (80.9%) | 13 (19.1%) |
| $75,000 to $99,999 | 99 (100.0%) | 0 (0.0%) |
| $100,000 and over | 183 (97.9%) | 4 (2.1%) |
Public vs Private Health Insurance Coverage by Age in South Webster
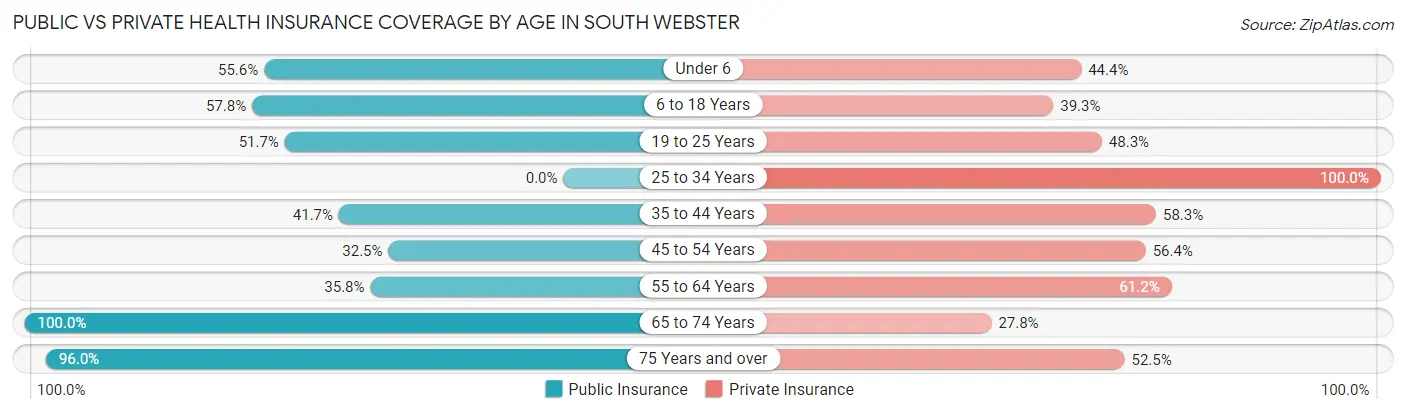
| Age Bracket | Public Insurance | Private Insurance |
| Under 6 | 20 (55.6%) | 16 (44.4%) |
| 6 to 18 Years | 78 (57.8%) | 53 (39.3%) |
| 19 to 25 Years | 15 (51.7%) | 14 (48.3%) |
| 25 to 34 Years | 0 (0.0%) | 11 (100.0%) |
| 35 to 44 Years | 40 (41.7%) | 56 (58.3%) |
| 45 to 54 Years | 38 (32.5%) | 66 (56.4%) |
| 55 to 64 Years | 24 (35.8%) | 41 (61.2%) |
| 65 to 74 Years | 144 (100.0%) | 40 (27.8%) |
| 75 Years and over | 97 (96.0%) | 53 (52.5%) |
| Total | 456 (62.0%) | 350 (47.5%) |
Disability Status by Sex by Age in South Webster
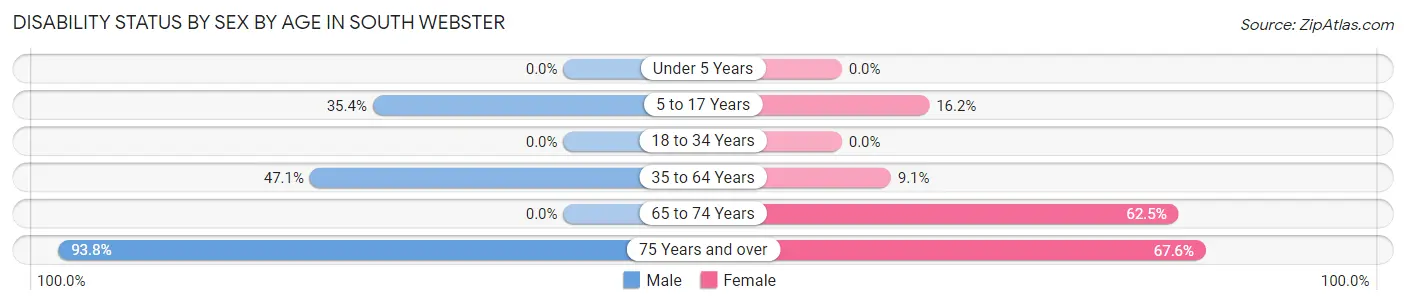
| Age Bracket | Male | Female |
| Under 5 Years | 0 (0.0%) | 0 (0.0%) |
| 5 to 17 Years | 23 (35.4%) | 12 (16.2%) |
| 18 to 34 Years | 0 (0.0%) | 0 (0.0%) |
| 35 to 64 Years | 80 (47.1%) | 10 (9.1%) |
| 65 to 74 Years | 0 (0.0%) | 60 (62.5%) |
| 75 Years and over | 60 (93.8%) | 25 (67.6%) |
Disability Class by Sex by Age in South Webster
Disability Class: Hearing Difficulty
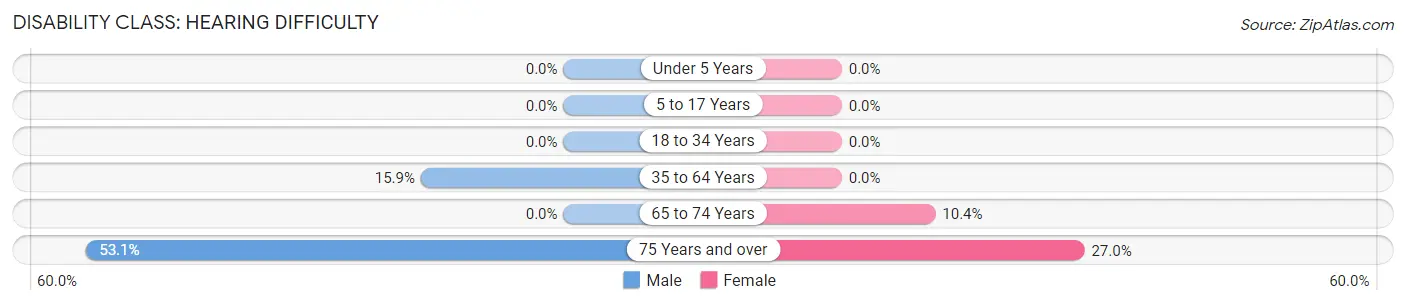
| Age Bracket | Male | Female |
| Under 5 Years | 0 (0.0%) | 0 (0.0%) |
| 5 to 17 Years | 0 (0.0%) | 0 (0.0%) |
| 18 to 34 Years | 0 (0.0%) | 0 (0.0%) |
| 35 to 64 Years | 27 (15.9%) | 0 (0.0%) |
| 65 to 74 Years | 0 (0.0%) | 10 (10.4%) |
| 75 Years and over | 34 (53.1%) | 10 (27.0%) |
Disability Class: Vision Difficulty
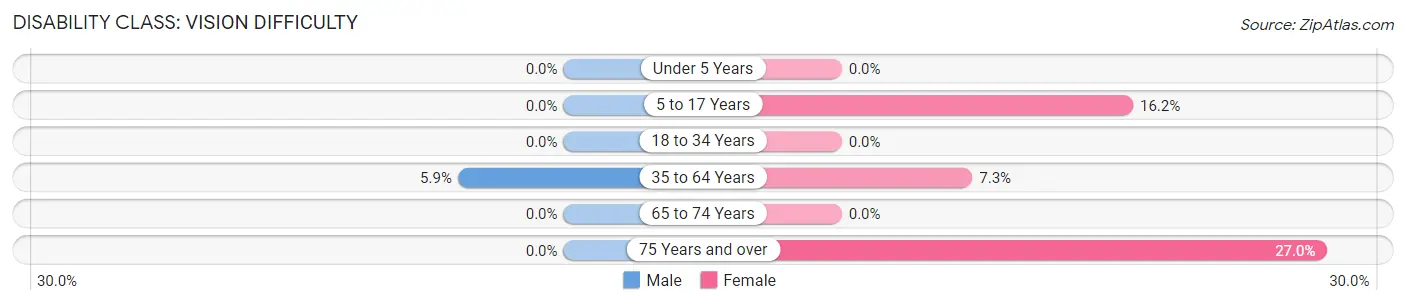
| Age Bracket | Male | Female |
| Under 5 Years | 0 (0.0%) | 0 (0.0%) |
| 5 to 17 Years | 0 (0.0%) | 12 (16.2%) |
| 18 to 34 Years | 0 (0.0%) | 0 (0.0%) |
| 35 to 64 Years | 10 (5.9%) | 8 (7.3%) |
| 65 to 74 Years | 0 (0.0%) | 0 (0.0%) |
| 75 Years and over | 0 (0.0%) | 10 (27.0%) |
Disability Class: Cognitive Difficulty
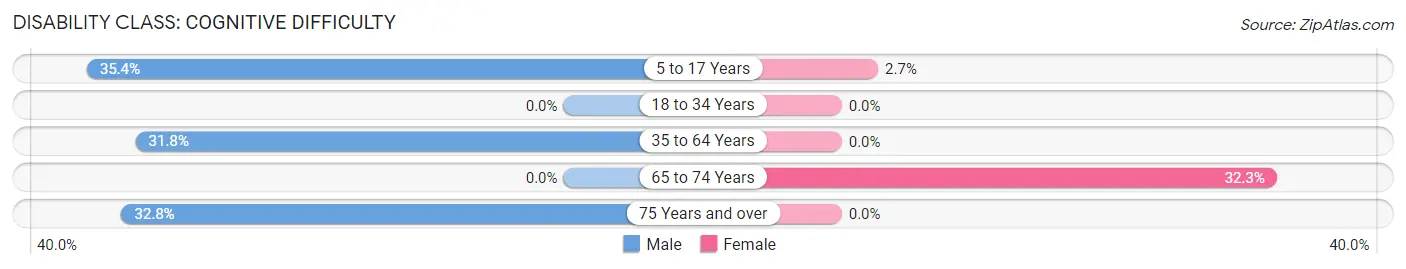
| Age Bracket | Male | Female |
| 5 to 17 Years | 23 (35.4%) | 2 (2.7%) |
| 18 to 34 Years | 0 (0.0%) | 0 (0.0%) |
| 35 to 64 Years | 54 (31.8%) | 0 (0.0%) |
| 65 to 74 Years | 0 (0.0%) | 31 (32.3%) |
| 75 Years and over | 21 (32.8%) | 0 (0.0%) |
Disability Class: Ambulatory Difficulty
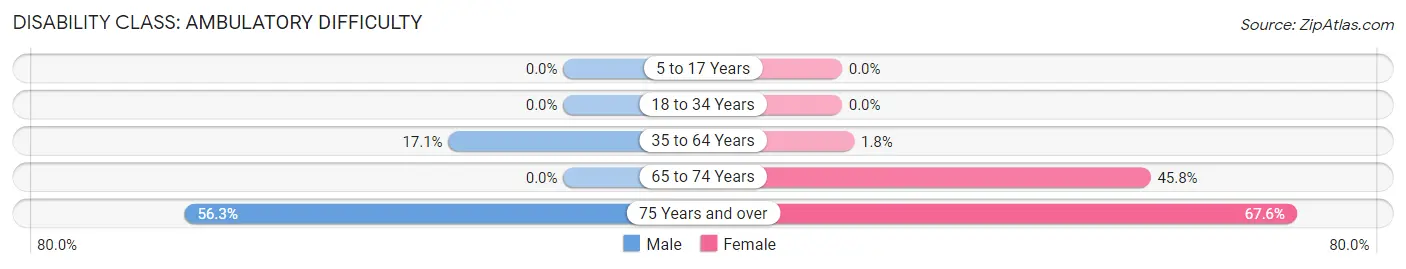
| Age Bracket | Male | Female |
| 5 to 17 Years | 0 (0.0%) | 0 (0.0%) |
| 18 to 34 Years | 0 (0.0%) | 0 (0.0%) |
| 35 to 64 Years | 29 (17.1%) | 2 (1.8%) |
| 65 to 74 Years | 0 (0.0%) | 44 (45.8%) |
| 75 Years and over | 36 (56.2%) | 25 (67.6%) |
Disability Class: Self-Care Difficulty
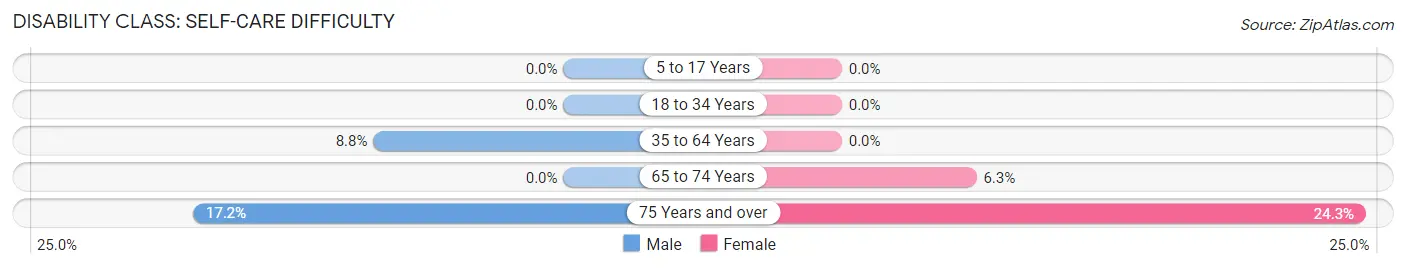
| Age Bracket | Male | Female |
| 5 to 17 Years | 0 (0.0%) | 0 (0.0%) |
| 18 to 34 Years | 0 (0.0%) | 0 (0.0%) |
| 35 to 64 Years | 15 (8.8%) | 0 (0.0%) |
| 65 to 74 Years | 0 (0.0%) | 6 (6.2%) |
| 75 Years and over | 11 (17.2%) | 9 (24.3%) |
Technology Access in South Webster
Computing Device Access in South Webster
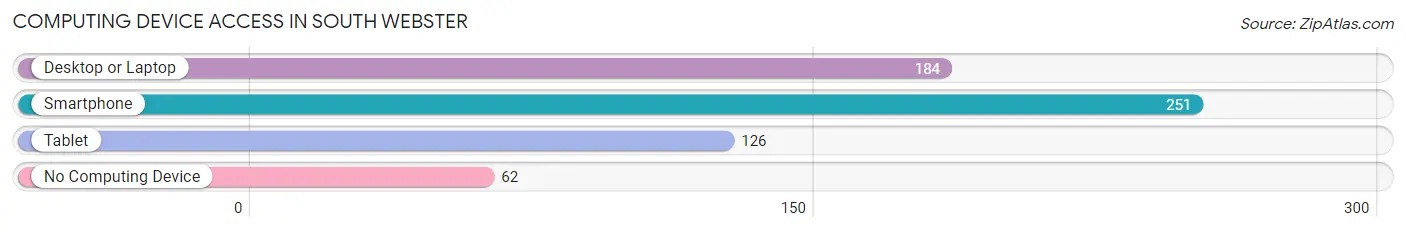
| Device Type | # Households | % Households |
| Desktop or Laptop | 184 | 54.0% |
| Smartphone | 251 | 73.6% |
| Tablet | 126 | 36.9% |
| No Computing Device | 62 | 18.2% |
| Total | 341 | 100.0% |
Internet Access in South Webster
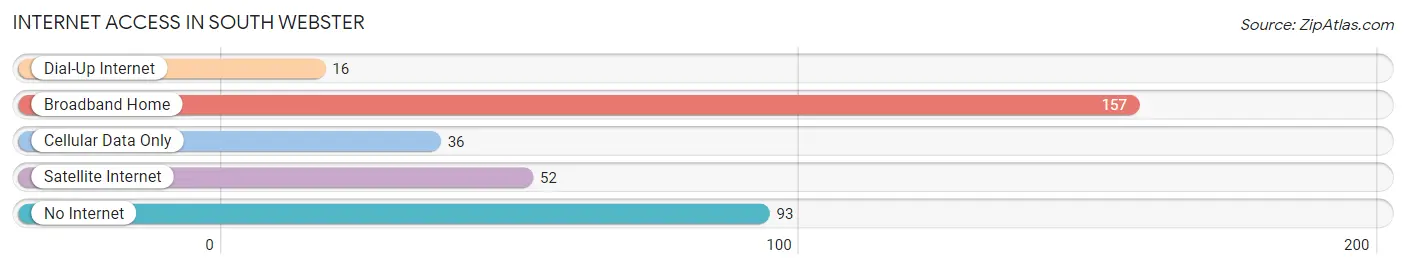
| Internet Type | # Households | % Households |
| Dial-Up Internet | 16 | 4.7% |
| Broadband Home | 157 | 46.0% |
| Cellular Data Only | 36 | 10.6% |
| Satellite Internet | 52 | 15.2% |
| No Internet | 93 | 27.3% |
| Total | 341 | 100.0% |
South Webster Summary
History
South Webster is a village located in Scioto County, Ohio. It is situated along the Ohio River, approximately 10 miles south of Portsmouth. The village was founded in 1837 by a group of settlers from Virginia and North Carolina. The village was originally known as “Webster”, but the name was changed to “South Webster” in 1845 to distinguish it from another village in the area.
The village was a small farming community until the late 19th century, when the railroad arrived. This allowed for the development of the coal industry in the area, which brought an influx of new residents. The village was incorporated in 1891 and the population grew to over 1,000 by the early 20th century.
The village was home to several businesses, including a flour mill, a sawmill, a brickyard, and a furniture factory. The village also had a number of churches, including the Methodist Episcopal Church, the Presbyterian Church, and the Baptist Church.
The village was also home to a number of schools, including the South Webster High School, which was established in 1891. The school was later renamed the South Webster Junior-Senior High School and served the village until it closed in 1971.
Geography
South Webster is located in Scioto County, Ohio, along the Ohio River. The village is situated approximately 10 miles south of Portsmouth. The village is bordered by the townships of Clay, Rush, and Washington.
The village has a total area of 0.7 square miles, all of which is land. The terrain is mostly flat, with some rolling hills. The village is located in the Appalachian Plateau region of Ohio.
The climate in South Webster is humid continental, with hot summers and cold winters. The average annual temperature is around 50 degrees Fahrenheit. The average annual precipitation is around 40 inches.
Economy
The economy of South Webster is largely based on agriculture and manufacturing. The village is home to several farms, which produce a variety of crops, including corn, soybeans, and wheat. The village also has a number of manufacturing businesses, including a furniture factory and a brickyard.
The village is also home to a number of retail businesses, including a grocery store, a hardware store, and a pharmacy. The village also has a number of restaurants and bars.
Demographics
As of the 2010 census, the population of South Webster was 1,093. The racial makeup of the village was 97.3% White, 0.7% African American, 0.2% Native American, 0.2% Asian, and 1.6% from other races. Hispanic or Latino of any race were 1.2% of the population.
The median household income in South Webster was $37,500, and the median family income was $45,000. The per capita income was $18,000. About 11.3% of the population was below the poverty line.
Common Questions
What is Per Capita Income in South Webster?
Per Capita income in South Webster is $31,143.
What is the Median Family Income in South Webster?
Median Family Income in South Webster is $54,792.
What is the Median Household income in South Webster?
Median Household Income in South Webster is $42,232.
What is Income or Wage Gap in South Webster?
Income or Wage Gap in South Webster is 45.5%.
Women in South Webster earn 54.5 cents for every dollar earned by a man.
What is Inequality or Gini Index in South Webster?
Inequality or Gini Index in South Webster is 0.52.
What is the Total Population of South Webster?
Total Population of South Webster is 736.
What is the Total Male Population of South Webster?
Total Male Population of South Webster is 376.
What is the Total Female Population of South Webster?
Total Female Population of South Webster is 360.
What is the Ratio of Males per 100 Females in South Webster?
There are 104.44 Males per 100 Females in South Webster.
What is the Ratio of Females per 100 Males in South Webster?
There are 95.74 Females per 100 Males in South Webster.
What is the Median Population Age in South Webster?
Median Population Age in South Webster is 52.4 Years.
What is the Average Family Size in South Webster
Average Family Size in South Webster is 2.8 People.
What is the Average Household Size in South Webster
Average Household Size in South Webster is 2.2 People.
How Large is the Labor Force in South Webster?
There are 235 People in the Labor Forcein in South Webster.
What is the Percentage of People in the Labor Force in South Webster?
40.0% of People are in the Labor Force in South Webster.
What is the Unemployment Rate in South Webster?
Unemployment Rate in South Webster is 6.8%.