Zip Codes with the Highest Percentage of Population with a Degree in Liberal Arts and History in Grand Island, NE
RELATED REPORTS & OPTIONS
Liberal Arts and History
Grand Island
Compare Zip Codes
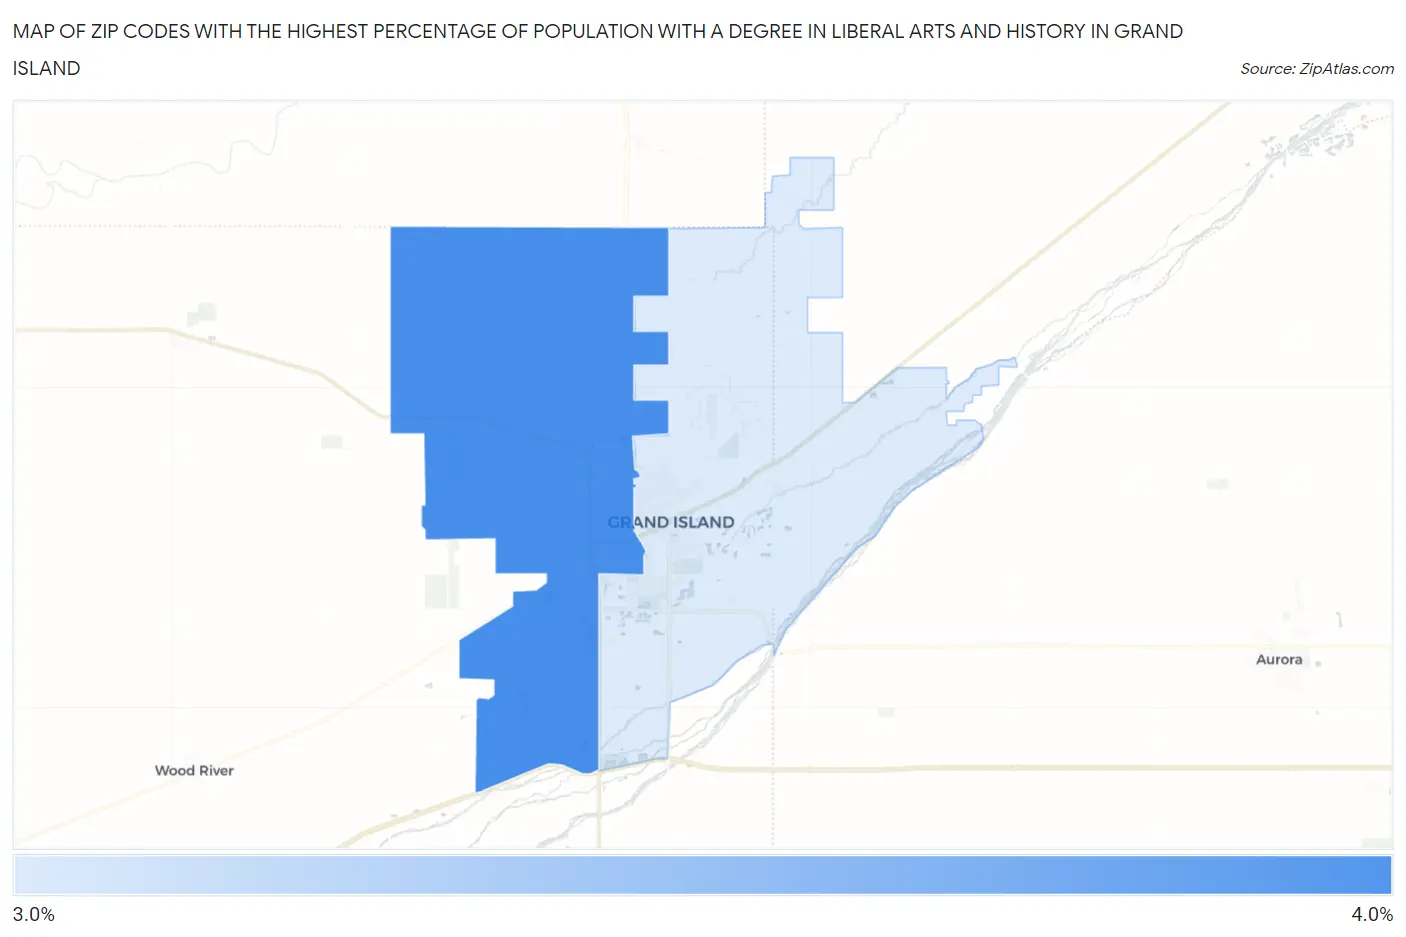
Map of Zip Codes with the Highest Percentage of Population with a Degree in Liberal Arts and History in Grand Island
3.1%
3.4%
Zip Codes with the Highest Percentage of Population with a Degree in Liberal Arts and History in Grand Island, NE
| Zip Code | % Graduates | vs State | vs National | |
| 1. | 68803 | 3.4% | 4.0%(-0.603)#206 | 4.9%(-1.50)#17,077 |
| 2. | 68801 | 3.1% | 4.0%(-0.840)#220 | 4.9%(-1.74)#17,883 |
1
Common Questions
What are the Top Zip Codes with the Highest Percentage of Population with a Degree in Liberal Arts and History in Grand Island, NE?
Top Zip Codes with the Highest Percentage of Population with a Degree in Liberal Arts and History in Grand Island, NE are:
What zip code has the Highest Percentage of Population with a Degree in Liberal Arts and History in Grand Island, NE?
68803 has the Highest Percentage of Population with a Degree in Liberal Arts and History in Grand Island, NE with 3.4%.
What is the Percentage of Population with a Degree in Liberal Arts and History in Grand Island, NE?
Percentage of Population with a Degree in Liberal Arts and History in Grand Island is 3.3%.
What is the Percentage of Population with a Degree in Liberal Arts and History in Nebraska?
Percentage of Population with a Degree in Liberal Arts and History in Nebraska is 4.0%.
What is the Percentage of Population with a Degree in Liberal Arts and History in the United States?
Percentage of Population with a Degree in Liberal Arts and History in the United States is 4.9%.