Zip Codes with the Highest Percentage of Population with a Degree in Liberal Arts and History in Bellevue, NE
RELATED REPORTS & OPTIONS
Liberal Arts and History
Bellevue
Compare Zip Codes
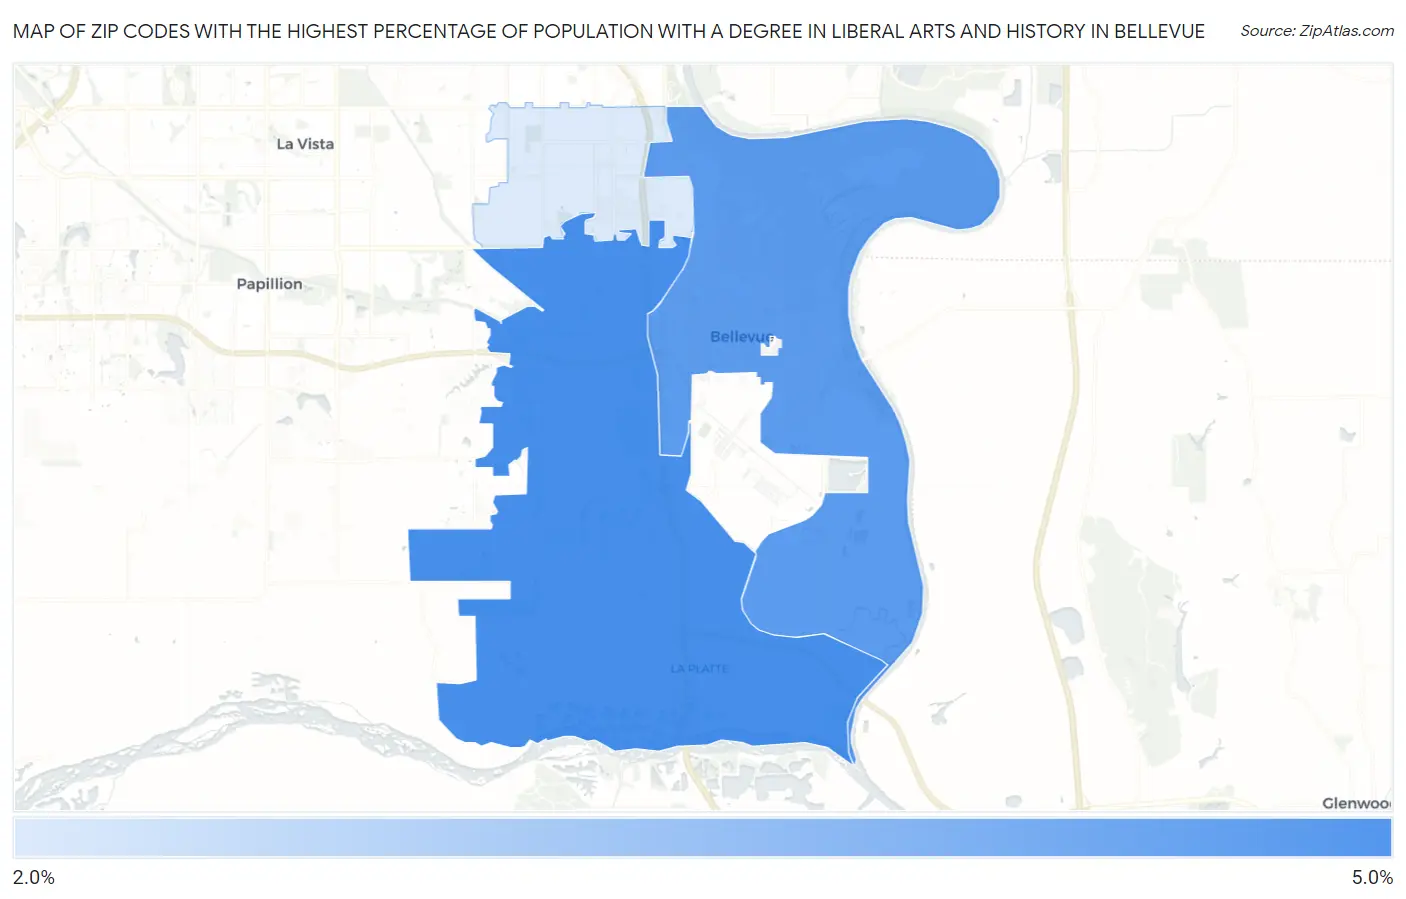
Map of Zip Codes with the Highest Percentage of Population with a Degree in Liberal Arts and History in Bellevue
2.7%
4.8%
Zip Codes with the Highest Percentage of Population with a Degree in Liberal Arts and History in Bellevue, NE
| Zip Code | % Graduates | vs State | vs National | |
| 1. | 68123 | 4.8% | 4.0%(+0.778)#128 | 4.9%(-0.121)#12,157 |
| 2. | 68005 | 4.5% | 4.0%(+0.494)#141 | 4.9%(-0.405)#13,062 |
| 3. | 68147 | 2.7% | 4.0%(-1.24)#241 | 4.9%(-2.14)#19,222 |
1
Common Questions
What are the Top Zip Codes with the Highest Percentage of Population with a Degree in Liberal Arts and History in Bellevue, NE?
Top Zip Codes with the Highest Percentage of Population with a Degree in Liberal Arts and History in Bellevue, NE are:
What zip code has the Highest Percentage of Population with a Degree in Liberal Arts and History in Bellevue, NE?
68123 has the Highest Percentage of Population with a Degree in Liberal Arts and History in Bellevue, NE with 4.8%.
What is the Percentage of Population with a Degree in Liberal Arts and History in Bellevue, NE?
Percentage of Population with a Degree in Liberal Arts and History in Bellevue is 4.4%.
What is the Percentage of Population with a Degree in Liberal Arts and History in Nebraska?
Percentage of Population with a Degree in Liberal Arts and History in Nebraska is 4.0%.
What is the Percentage of Population with a Degree in Liberal Arts and History in the United States?
Percentage of Population with a Degree in Liberal Arts and History in the United States is 4.9%.