Zip Codes with the Highest Percentage of Population with a Degree in Liberal Arts and History in Florida
RELATED REPORTS & OPTIONS
Liberal Arts and History
Florida
Compare Zip Codes
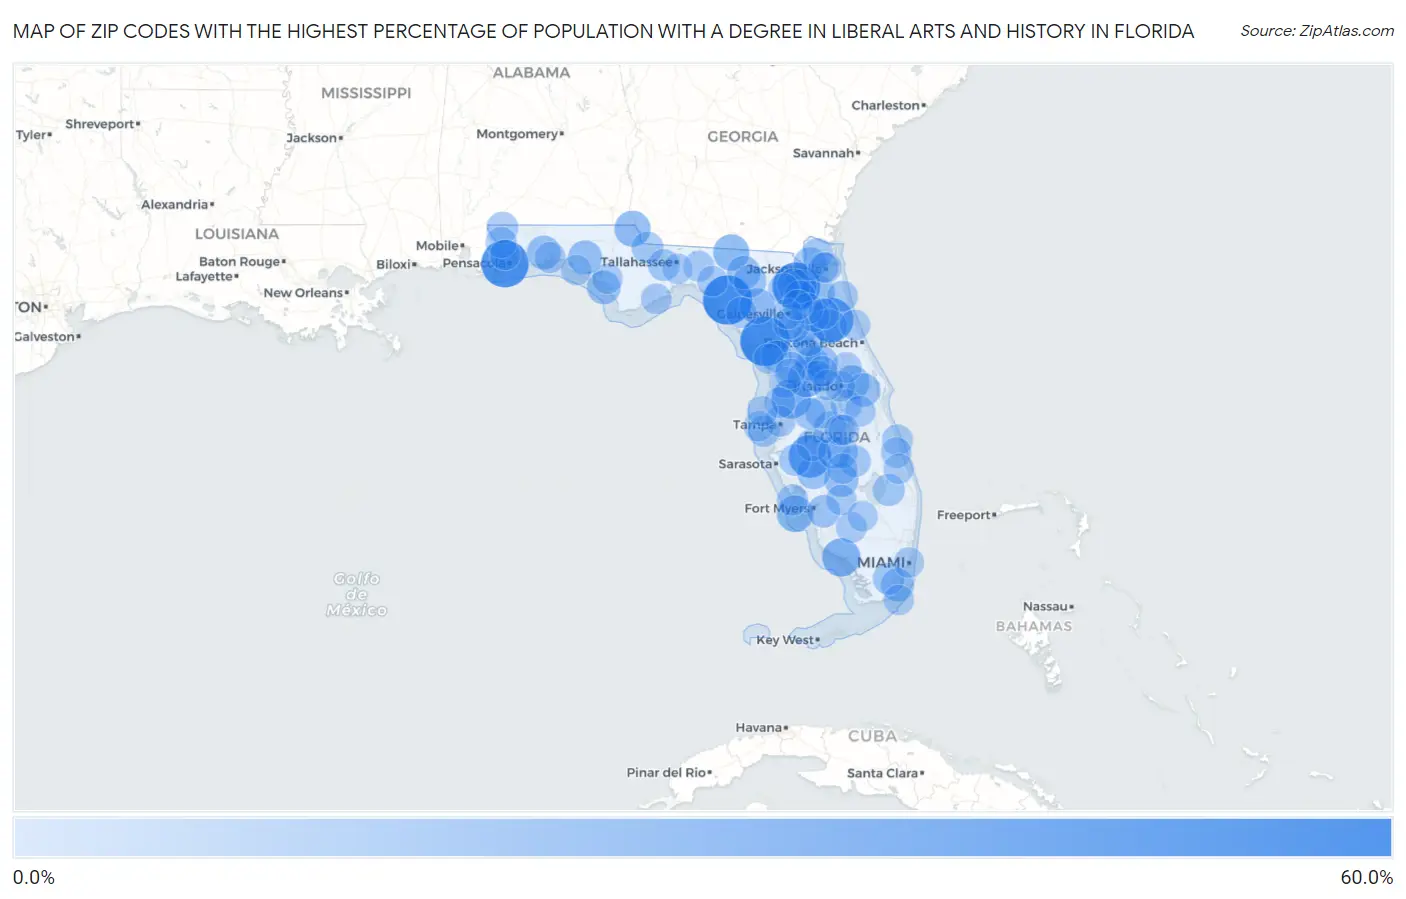
Map of Zip Codes with the Highest Percentage of Population with a Degree in Liberal Arts and History in Florida
0.0%
60.0%
Zip Codes with the Highest Percentage of Population with a Degree in Liberal Arts and History in Florida
| Zip Code | % Graduates | vs State | vs National | |
| 1. | 32639 | 50.8% | 3.9%(+46.9)#1 | 4.9%(+45.9)#139 |
| 2. | 32356 | 50.0% | 3.9%(+46.1)#2 | 4.9%(+45.1)#164 |
| 3. | 32026 | 46.1% | 3.9%(+42.2)#3 | 4.9%(+41.2)#192 |
| 4. | 32511 | 45.9% | 3.9%(+42.0)#4 | 4.9%(+41.0)#194 |
| 5. | 32187 | 38.8% | 3.9%(+34.8)#5 | 4.9%(+33.9)#263 |
| 6. | 33865 | 35.3% | 3.9%(+31.4)#6 | 4.9%(+30.4)#310 |
| 7. | 33574 | 28.0% | 3.9%(+24.1)#7 | 4.9%(+23.1)#467 |
| 8. | 34139 | 25.0% | 3.9%(+21.1)#8 | 4.9%(+20.1)#591 |
| 9. | 33514 | 22.2% | 3.9%(+18.3)#9 | 4.9%(+17.4)#717 |
| 10. | 33924 | 21.0% | 3.9%(+17.1)#10 | 4.9%(+16.1)#797 |
| 11. | 32350 | 20.3% | 3.9%(+16.4)#11 | 4.9%(+15.4)#837 |
| 12. | 32423 | 19.9% | 3.9%(+16.0)#12 | 4.9%(+15.0)#876 |
| 13. | 32619 | 19.1% | 3.9%(+15.2)#13 | 4.9%(+14.2)#927 |
| 14. | 32079 | 17.3% | 3.9%(+13.3)#14 | 4.9%(+12.4)#1,107 |
| 15. | 32816 | 16.5% | 3.9%(+12.6)#15 | 4.9%(+11.6)#1,192 |
| 16. | 32157 | 16.1% | 3.9%(+12.2)#16 | 4.9%(+11.2)#1,249 |
| 17. | 32462 | 15.8% | 3.9%(+11.9)#17 | 4.9%(+10.9)#1,284 |
| 18. | 33960 | 15.7% | 3.9%(+11.8)#18 | 4.9%(+10.8)#1,302 |
| 19. | 32542 | 15.2% | 3.9%(+11.2)#19 | 4.9%(+10.3)#1,391 |
| 20. | 32403 | 14.8% | 3.9%(+10.9)#20 | 4.9%(+9.90)#1,469 |
| 21. | 34731 | 14.6% | 3.9%(+10.7)#21 | 4.9%(+9.71)#1,503 |
| 22. | 32058 | 14.5% | 3.9%(+10.6)#22 | 4.9%(+9.67)#1,514 |
| 23. | 32709 | 14.5% | 3.9%(+10.6)#23 | 4.9%(+9.64)#1,521 |
| 24. | 32735 | 14.2% | 3.9%(+10.3)#24 | 4.9%(+9.33)#1,596 |
| 25. | 32064 | 14.1% | 3.9%(+10.2)#25 | 4.9%(+9.28)#1,606 |
| 26. | 34266 | 13.8% | 3.9%(+9.83)#26 | 4.9%(+8.88)#1,698 |
| 27. | 33035 | 13.5% | 3.9%(+9.54)#27 | 4.9%(+8.59)#1,781 |
| 28. | 32009 | 13.2% | 3.9%(+9.29)#28 | 4.9%(+8.33)#1,849 |
| 29. | 32083 | 13.0% | 3.9%(+9.08)#29 | 4.9%(+8.13)#1,909 |
| 30. | 32062 | 12.9% | 3.9%(+8.99)#30 | 4.9%(+8.03)#1,935 |
| 31. | 33976 | 12.3% | 3.9%(+8.36)#31 | 4.9%(+7.40)#2,114 |
| 32. | 33834 | 12.1% | 3.9%(+8.18)#32 | 4.9%(+7.22)#2,181 |
| 33. | 34420 | 11.4% | 3.9%(+7.53)#33 | 4.9%(+6.58)#2,373 |
| 34. | 33872 | 11.4% | 3.9%(+7.48)#34 | 4.9%(+6.52)#2,399 |
| 35. | 32113 | 11.3% | 3.9%(+7.34)#35 | 4.9%(+6.38)#2,453 |
| 36. | 33853 | 11.2% | 3.9%(+7.33)#36 | 4.9%(+6.37)#2,456 |
| 37. | 33438 | 11.1% | 3.9%(+7.19)#37 | 4.9%(+6.24)#2,507 |
| 38. | 34488 | 11.0% | 3.9%(+7.12)#38 | 4.9%(+6.17)#2,541 |
| 39. | 33850 | 11.0% | 3.9%(+7.11)#39 | 4.9%(+6.15)#2,551 |
| 40. | 32324 | 10.6% | 3.9%(+6.72)#40 | 4.9%(+5.76)#2,741 |
| 41. | 32310 | 10.6% | 3.9%(+6.71)#41 | 4.9%(+5.75)#2,742 |
| 42. | 33187 | 10.6% | 3.9%(+6.70)#42 | 4.9%(+5.75)#2,749 |
| 43. | 32664 | 10.3% | 3.9%(+6.43)#43 | 4.9%(+5.47)#2,897 |
| 44. | 33857 | 10.3% | 3.9%(+6.38)#44 | 4.9%(+5.42)#2,932 |
| 45. | 32091 | 10.3% | 3.9%(+6.35)#45 | 4.9%(+5.39)#2,956 |
| 46. | 34251 | 10.2% | 3.9%(+6.29)#46 | 4.9%(+5.33)#2,993 |
| 47. | 32535 | 10.0% | 3.9%(+6.08)#47 | 4.9%(+5.13)#3,098 |
| 48. | 32148 | 9.9% | 3.9%(+5.97)#48 | 4.9%(+5.01)#3,175 |
| 49. | 33870 | 9.9% | 3.9%(+5.96)#49 | 4.9%(+5.01)#3,177 |
| 50. | 33777 | 9.8% | 3.9%(+5.89)#50 | 4.9%(+4.94)#3,233 |
| 51. | 33805 | 9.8% | 3.9%(+5.85)#51 | 4.9%(+4.89)#3,259 |
| 52. | 32666 | 9.7% | 3.9%(+5.76)#52 | 4.9%(+4.80)#3,324 |
| 53. | 32667 | 9.6% | 3.9%(+5.69)#53 | 4.9%(+4.74)#3,367 |
| 54. | 34769 | 9.6% | 3.9%(+5.64)#54 | 4.9%(+4.69)#3,401 |
| 55. | 34433 | 9.5% | 3.9%(+5.63)#55 | 4.9%(+4.68)#3,413 |
| 56. | 32577 | 9.5% | 3.9%(+5.61)#56 | 4.9%(+4.66)#3,426 |
| 57. | 34450 | 9.3% | 3.9%(+5.43)#57 | 4.9%(+4.47)#3,564 |
| 58. | 34737 | 9.3% | 3.9%(+5.41)#58 | 4.9%(+4.45)#3,580 |
| 59. | 33921 | 9.2% | 3.9%(+5.29)#59 | 4.9%(+4.34)#3,673 |
| 60. | 32054 | 9.1% | 3.9%(+5.20)#60 | 4.9%(+4.25)#3,736 |
| 61. | 32580 | 9.0% | 3.9%(+5.11)#61 | 4.9%(+4.16)#3,822 |
| 62. | 32011 | 9.0% | 3.9%(+5.09)#62 | 4.9%(+4.14)#3,844 |
| 63. | 32963 | 8.9% | 3.9%(+4.98)#63 | 4.9%(+4.02)#3,940 |
| 64. | 32628 | 8.9% | 3.9%(+4.95)#64 | 4.9%(+3.99)#3,970 |
| 65. | 32084 | 8.9% | 3.9%(+4.95)#65 | 4.9%(+3.99)#3,975 |
| 66. | 34773 | 8.8% | 3.9%(+4.88)#66 | 4.9%(+3.92)#4,036 |
| 67. | 33854 | 8.7% | 3.9%(+4.82)#67 | 4.9%(+3.87)#4,093 |
| 68. | 34601 | 8.7% | 3.9%(+4.81)#68 | 4.9%(+3.85)#4,105 |
| 69. | 33603 | 8.7% | 3.9%(+4.75)#69 | 4.9%(+3.79)#4,156 |
| 70. | 32344 | 8.7% | 3.9%(+4.75)#70 | 4.9%(+3.79)#4,160 |
| 71. | 34142 | 8.6% | 3.9%(+4.72)#71 | 4.9%(+3.77)#4,184 |
| 72. | 34637 | 8.5% | 3.9%(+4.61)#72 | 4.9%(+3.66)#4,306 |
| 73. | 32177 | 8.3% | 3.9%(+4.36)#73 | 4.9%(+3.41)#4,569 |
| 74. | 32805 | 8.2% | 3.9%(+4.30)#74 | 4.9%(+3.35)#4,637 |
| 75. | 32322 | 8.2% | 3.9%(+4.28)#75 | 4.9%(+3.33)#4,659 |
| 76. | 32347 | 8.2% | 3.9%(+4.24)#76 | 4.9%(+3.28)#4,719 |
| 77. | 32136 | 8.1% | 3.9%(+4.18)#77 | 4.9%(+3.22)#4,785 |
| 78. | 33935 | 8.1% | 3.9%(+4.15)#78 | 4.9%(+3.19)#4,816 |
| 79. | 33898 | 8.0% | 3.9%(+4.12)#79 | 4.9%(+3.16)#4,859 |
| 80. | 34951 | 8.0% | 3.9%(+4.10)#80 | 4.9%(+3.14)#4,879 |
| 81. | 32601 | 8.0% | 3.9%(+4.09)#81 | 4.9%(+3.14)#4,884 |
| 82. | 32771 | 8.0% | 3.9%(+4.07)#82 | 4.9%(+3.11)#4,913 |
| 83. | 32206 | 8.0% | 3.9%(+4.06)#83 | 4.9%(+3.10)#4,923 |
| 84. | 34760 | 7.9% | 3.9%(+3.99)#84 | 4.9%(+3.04)#5,021 |
| 85. | 33037 | 7.9% | 3.9%(+3.97)#85 | 4.9%(+3.01)#5,054 |
| 86. | 33440 | 7.8% | 3.9%(+3.92)#86 | 4.9%(+2.97)#5,111 |
| 87. | 32694 | 7.8% | 3.9%(+3.85)#87 | 4.9%(+2.89)#5,215 |
| 88. | 34428 | 7.7% | 3.9%(+3.83)#88 | 4.9%(+2.87)#5,238 |
| 89. | 33128 | 7.7% | 3.9%(+3.81)#89 | 4.9%(+2.85)#5,263 |
| 90. | 34953 | 7.7% | 3.9%(+3.79)#90 | 4.9%(+2.84)#5,288 |
| 91. | 33852 | 7.7% | 3.9%(+3.76)#91 | 4.9%(+2.81)#5,337 |
| 92. | 32404 | 7.7% | 3.9%(+3.74)#92 | 4.9%(+2.78)#5,368 |
| 93. | 32778 | 7.7% | 3.9%(+3.74)#93 | 4.9%(+2.78)#5,372 |
| 94. | 32461 | 7.7% | 3.9%(+3.74)#94 | 4.9%(+2.78)#5,373 |
| 95. | 32534 | 7.6% | 3.9%(+3.70)#95 | 4.9%(+2.74)#5,428 |
| 96. | 33786 | 7.6% | 3.9%(+3.69)#96 | 4.9%(+2.73)#5,432 |
| 97. | 32209 | 7.6% | 3.9%(+3.64)#97 | 4.9%(+2.69)#5,499 |
| 98. | 32305 | 7.6% | 3.9%(+3.64)#98 | 4.9%(+2.69)#5,503 |
| 99. | 34689 | 7.5% | 3.9%(+3.61)#99 | 4.9%(+2.65)#5,553 |
| 100. | 34436 | 7.4% | 3.9%(+3.53)#100 | 4.9%(+2.57)#5,680 |
Common Questions
What are the Top 10 Zip Codes with the Highest Percentage of Population with a Degree in Liberal Arts and History in Florida?
Top 10 Zip Codes with the Highest Percentage of Population with a Degree in Liberal Arts and History in Florida are:
What zip code has the Highest Percentage of Population with a Degree in Liberal Arts and History in Florida?
32639 has the Highest Percentage of Population with a Degree in Liberal Arts and History in Florida with 50.8%.
What is the Percentage of Population with a Degree in Liberal Arts and History in the State of Florida?
Percentage of Population with a Degree in Liberal Arts and History in Florida is 3.9%.
What is the Percentage of Population with a Degree in Liberal Arts and History in the United States?
Percentage of Population with a Degree in Liberal Arts and History in the United States is 4.9%.