Zip Codes with the Highest Percentage of Population with a Degree in Computers and Mathematics in Michigan
RELATED REPORTS & OPTIONS
Computers and Mathematics
Michigan
Compare Zip Codes
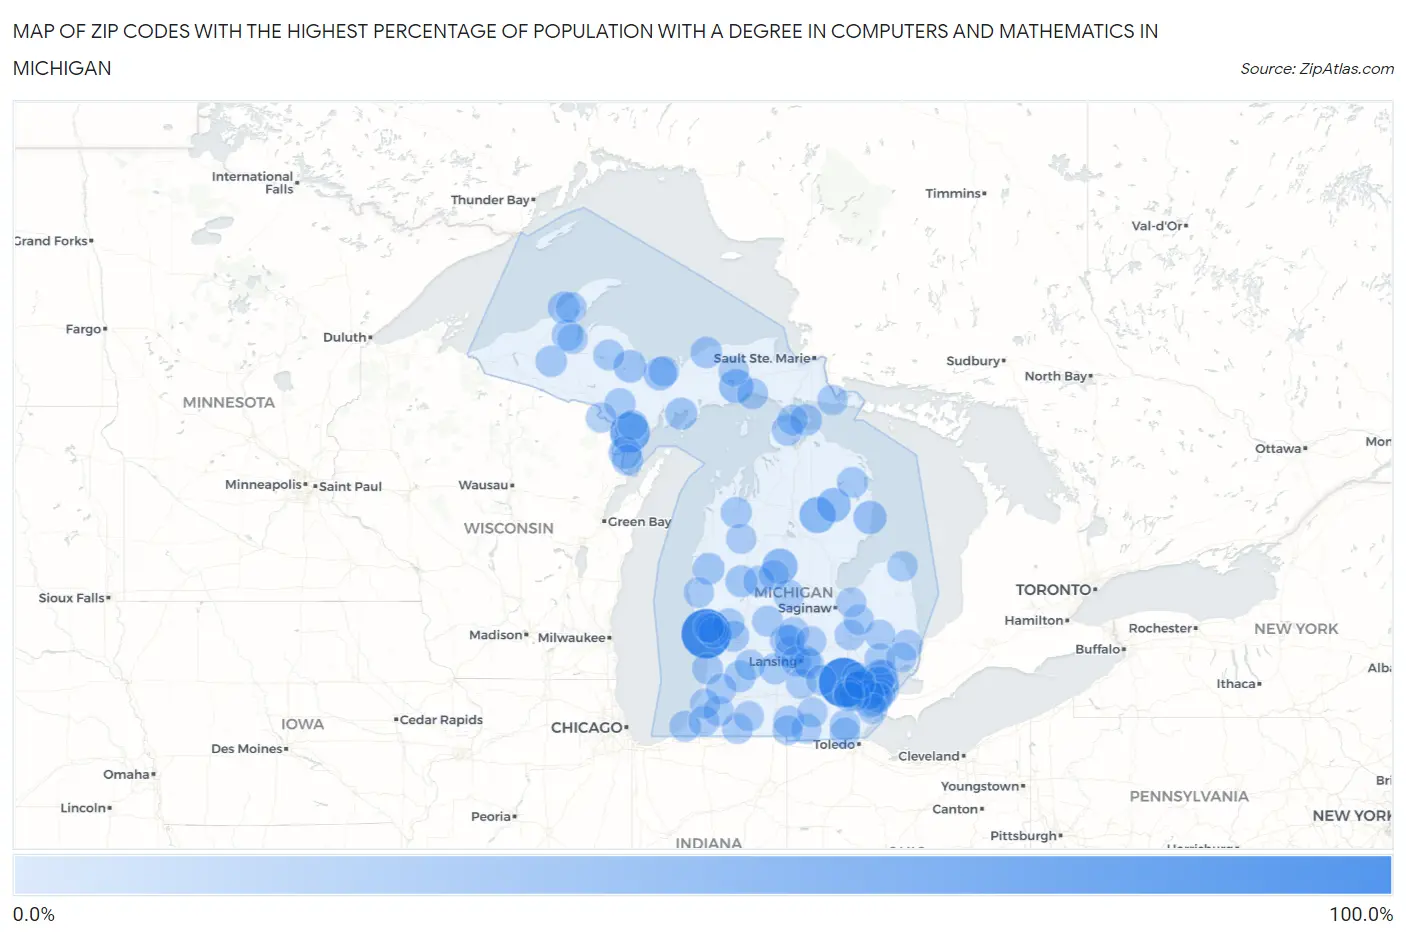
Map of Zip Codes with the Highest Percentage of Population with a Degree in Computers and Mathematics in Michigan
0.0%
100.0%
Zip Codes with the Highest Percentage of Population with a Degree in Computers and Mathematics in Michigan
| Zip Code | % Graduates | vs State | vs National | |
| 1. | 49409 | 100.0% | 4.2%(+95.8)#1 | 4.9%(+95.1)#14 |
| 2. | 48139 | 100.0% | 4.2%(+95.8)#2 | 4.9%(+95.1)#16 |
| 3. | 49863 | 52.4% | 4.2%(+48.1)#3 | 4.9%(+47.5)#69 |
| 4. | 48636 | 34.1% | 4.2%(+29.9)#4 | 4.9%(+29.2)#176 |
| 5. | 48633 | 30.0% | 4.2%(+25.8)#5 | 4.9%(+25.1)#227 |
| 6. | 49820 | 25.0% | 4.2%(+20.8)#6 | 4.9%(+20.1)#304 |
| 7. | 48621 | 24.6% | 4.2%(+20.4)#7 | 4.9%(+19.7)#310 |
| 8. | 48738 | 20.9% | 4.2%(+16.6)#8 | 4.9%(+16.0)#434 |
| 9. | 49826 | 20.0% | 4.2%(+15.8)#9 | 4.9%(+15.1)#468 |
| 10. | 49848 | 18.2% | 4.2%(+14.0)#10 | 4.9%(+13.3)#557 |
| 11. | 49871 | 17.6% | 4.2%(+13.4)#11 | 4.9%(+12.8)#579 |
| 12. | 49864 | 15.4% | 4.2%(+11.2)#12 | 4.9%(+10.5)#759 |
| 13. | 49338 | 14.3% | 4.2%(+10.1)#13 | 4.9%(+9.44)#857 |
| 14. | 49405 | 13.5% | 4.2%(+9.22)#14 | 4.9%(+8.56)#987 |
| 15. | 49905 | 13.3% | 4.2%(+9.10)#15 | 4.9%(+8.44)#1,003 |
| 16. | 49775 | 13.3% | 4.2%(+9.10)#16 | 4.9%(+8.44)#1,011 |
| 17. | 49839 | 12.7% | 4.2%(+8.47)#17 | 4.9%(+7.80)#1,093 |
| 18. | 49958 | 12.5% | 4.2%(+8.27)#18 | 4.9%(+7.61)#1,131 |
| 19. | 49070 | 12.3% | 4.2%(+8.09)#19 | 4.9%(+7.43)#1,164 |
| 20. | 49967 | 11.9% | 4.2%(+7.67)#20 | 4.9%(+7.01)#1,235 |
| 21. | 48825 | 11.4% | 4.2%(+7.13)#21 | 4.9%(+6.47)#1,356 |
| 22. | 49893 | 11.2% | 4.2%(+6.93)#22 | 4.9%(+6.26)#1,408 |
| 23. | 49755 | 11.0% | 4.2%(+6.81)#23 | 4.9%(+6.14)#1,446 |
| 24. | 49637 | 11.0% | 4.2%(+6.77)#24 | 4.9%(+6.11)#1,457 |
| 25. | 49834 | 10.9% | 4.2%(+6.68)#25 | 4.9%(+6.02)#1,478 |
| 26. | 49320 | 10.8% | 4.2%(+6.58)#26 | 4.9%(+5.92)#1,502 |
| 27. | 49318 | 10.3% | 4.2%(+6.11)#27 | 4.9%(+5.45)#1,629 |
| 28. | 49744 | 10.2% | 4.2%(+6.00)#28 | 4.9%(+5.33)#1,684 |
| 29. | 49125 | 10.2% | 4.2%(+5.94)#29 | 4.9%(+5.27)#1,700 |
| 30. | 49096 | 10.0% | 4.2%(+5.81)#30 | 4.9%(+5.15)#1,738 |
| 31. | 49762 | 10.0% | 4.2%(+5.77)#31 | 4.9%(+5.11)#1,754 |
| 32. | 48885 | 9.9% | 4.2%(+5.65)#32 | 4.9%(+4.98)#1,802 |
| 33. | 49406 | 9.7% | 4.2%(+5.51)#33 | 4.9%(+4.85)#1,866 |
| 34. | 48180 | 9.6% | 4.2%(+5.40)#34 | 4.9%(+4.74)#1,912 |
| 35. | 48084 | 9.6% | 4.2%(+5.37)#35 | 4.9%(+4.70)#1,926 |
| 36. | 49931 | 9.5% | 4.2%(+5.29)#36 | 4.9%(+4.62)#1,959 |
| 37. | 49544 | 9.5% | 4.2%(+5.29)#37 | 4.9%(+4.62)#1,960 |
| 38. | 48335 | 9.5% | 4.2%(+5.26)#38 | 4.9%(+4.60)#1,968 |
| 39. | 49814 | 9.4% | 4.2%(+5.20)#39 | 4.9%(+4.54)#2,001 |
| 40. | 48206 | 9.4% | 4.2%(+5.19)#40 | 4.9%(+4.52)#2,007 |
| 41. | 48185 | 9.3% | 4.2%(+5.05)#41 | 4.9%(+4.38)#2,080 |
| 42. | 48859 | 9.1% | 4.2%(+4.86)#42 | 4.9%(+4.20)#2,180 |
| 43. | 49042 | 9.1% | 4.2%(+4.84)#43 | 4.9%(+4.18)#2,214 |
| 44. | 48030 | 8.9% | 4.2%(+4.70)#44 | 4.9%(+4.04)#2,296 |
| 45. | 48822 | 8.9% | 4.2%(+4.66)#45 | 4.9%(+3.99)#2,320 |
| 46. | 49227 | 8.8% | 4.2%(+4.62)#46 | 4.9%(+3.96)#2,336 |
| 47. | 48873 | 8.6% | 4.2%(+4.40)#47 | 4.9%(+3.74)#2,461 |
| 48. | 49102 | 8.4% | 4.2%(+4.13)#48 | 4.9%(+3.47)#2,615 |
| 49. | 48393 | 8.4% | 4.2%(+4.13)#49 | 4.9%(+3.47)#2,617 |
| 50. | 48853 | 8.3% | 4.2%(+4.10)#50 | 4.9%(+3.44)#2,638 |
| 51. | 49825 | 8.3% | 4.2%(+4.10)#51 | 4.9%(+3.44)#2,645 |
| 52. | 48083 | 8.2% | 4.2%(+4.01)#52 | 4.9%(+3.35)#2,714 |
| 53. | 48027 | 8.2% | 4.2%(+3.96)#53 | 4.9%(+3.29)#2,753 |
| 54. | 48374 | 8.2% | 4.2%(+3.95)#54 | 4.9%(+3.29)#2,759 |
| 55. | 48363 | 8.2% | 4.2%(+3.93)#55 | 4.9%(+3.26)#2,782 |
| 56. | 48505 | 8.0% | 4.2%(+3.77)#56 | 4.9%(+3.11)#2,890 |
| 57. | 49026 | 8.0% | 4.2%(+3.75)#57 | 4.9%(+3.09)#2,920 |
| 58. | 48168 | 7.8% | 4.2%(+3.55)#58 | 4.9%(+2.88)#3,083 |
| 59. | 48120 | 7.7% | 4.2%(+3.51)#59 | 4.9%(+2.85)#3,105 |
| 60. | 49802 | 7.7% | 4.2%(+3.48)#60 | 4.9%(+2.82)#3,124 |
| 61. | 48468 | 7.7% | 4.2%(+3.46)#61 | 4.9%(+2.80)#3,149 |
| 62. | 49045 | 7.7% | 4.2%(+3.43)#62 | 4.9%(+2.77)#3,187 |
| 63. | 49415 | 7.6% | 4.2%(+3.36)#63 | 4.9%(+2.70)#3,251 |
| 64. | 48835 | 7.6% | 4.2%(+3.35)#64 | 4.9%(+2.68)#3,264 |
| 65. | 49455 | 7.6% | 4.2%(+3.34)#65 | 4.9%(+2.68)#3,267 |
| 66. | 48746 | 7.6% | 4.2%(+3.34)#66 | 4.9%(+2.68)#3,275 |
| 67. | 49448 | 7.5% | 4.2%(+3.31)#67 | 4.9%(+2.65)#3,301 |
| 68. | 48174 | 7.5% | 4.2%(+3.31)#68 | 4.9%(+2.64)#3,305 |
| 69. | 48237 | 7.5% | 4.2%(+3.24)#69 | 4.9%(+2.58)#3,364 |
| 70. | 49853 | 7.5% | 4.2%(+3.24)#70 | 4.9%(+2.57)#3,370 |
| 71. | 48101 | 7.4% | 4.2%(+3.15)#71 | 4.9%(+2.49)#3,454 |
| 72. | 49444 | 7.4% | 4.2%(+3.15)#72 | 4.9%(+2.49)#3,455 |
| 73. | 49238 | 7.3% | 4.2%(+3.05)#73 | 4.9%(+2.39)#3,544 |
| 74. | 49098 | 7.3% | 4.2%(+3.04)#74 | 4.9%(+2.38)#3,556 |
| 75. | 49908 | 7.3% | 4.2%(+3.02)#75 | 4.9%(+2.36)#3,565 |
| 76. | 48186 | 7.2% | 4.2%(+3.01)#76 | 4.9%(+2.35)#3,580 |
| 77. | 48917 | 7.2% | 4.2%(+3.00)#77 | 4.9%(+2.33)#3,596 |
| 78. | 49271 | 7.2% | 4.2%(+2.97)#78 | 4.9%(+2.31)#3,623 |
| 79. | 48134 | 7.1% | 4.2%(+2.90)#79 | 4.9%(+2.24)#3,704 |
| 80. | 49725 | 7.1% | 4.2%(+2.84)#80 | 4.9%(+2.18)#3,749 |
| 81. | 48412 | 7.1% | 4.2%(+2.83)#81 | 4.9%(+2.16)#3,762 |
| 82. | 48050 | 7.0% | 4.2%(+2.79)#82 | 4.9%(+2.12)#3,802 |
| 83. | 49072 | 7.0% | 4.2%(+2.78)#83 | 4.9%(+2.12)#3,805 |
| 84. | 49701 | 7.0% | 4.2%(+2.73)#84 | 4.9%(+2.07)#3,876 |
| 85. | 49264 | 7.0% | 4.2%(+2.73)#85 | 4.9%(+2.07)#3,878 |
| 86. | 48864 | 6.9% | 4.2%(+2.71)#86 | 4.9%(+2.05)#3,896 |
| 87. | 49276 | 6.9% | 4.2%(+2.69)#87 | 4.9%(+2.03)#3,919 |
| 88. | 49285 | 6.9% | 4.2%(+2.69)#88 | 4.9%(+2.03)#3,921 |
| 89. | 48198 | 6.9% | 4.2%(+2.68)#89 | 4.9%(+2.01)#3,936 |
| 90. | 48757 | 6.9% | 4.2%(+2.67)#90 | 4.9%(+2.00)#3,949 |
| 91. | 49333 | 6.9% | 4.2%(+2.66)#91 | 4.9%(+1.99)#3,963 |
| 92. | 49874 | 6.9% | 4.2%(+2.63)#92 | 4.9%(+1.97)#3,982 |
| 93. | 48105 | 6.8% | 4.2%(+2.61)#93 | 4.9%(+1.95)#4,004 |
| 94. | 49618 | 6.8% | 4.2%(+2.61)#94 | 4.9%(+1.94)#4,010 |
| 95. | 48109 | 6.8% | 4.2%(+2.55)#95 | 4.9%(+1.89)#4,097 |
| 96. | 48866 | 6.8% | 4.2%(+2.54)#96 | 4.9%(+1.88)#4,108 |
| 97. | 48167 | 6.8% | 4.2%(+2.54)#97 | 4.9%(+1.88)#4,111 |
| 98. | 48632 | 6.7% | 4.2%(+2.44)#98 | 4.9%(+1.77)#4,239 |
| 99. | 49233 | 6.6% | 4.2%(+2.40)#99 | 4.9%(+1.74)#4,298 |
| 100. | 49274 | 6.6% | 4.2%(+2.33)#100 | 4.9%(+1.66)#4,378 |
Common Questions
What are the Top 10 Zip Codes with the Highest Percentage of Population with a Degree in Computers and Mathematics in Michigan?
Top 10 Zip Codes with the Highest Percentage of Population with a Degree in Computers and Mathematics in Michigan are:
What zip code has the Highest Percentage of Population with a Degree in Computers and Mathematics in Michigan?
49409 has the Highest Percentage of Population with a Degree in Computers and Mathematics in Michigan with 100.0%.
What is the Percentage of Population with a Degree in Computers and Mathematics in the State of Michigan?
Percentage of Population with a Degree in Computers and Mathematics in Michigan is 4.2%.
What is the Percentage of Population with a Degree in Computers and Mathematics in the United States?
Percentage of Population with a Degree in Computers and Mathematics in the United States is 4.9%.