Zip Codes with the Highest Percentage of Population with a Degree in Computers and Mathematics in Missouri
RELATED REPORTS & OPTIONS
Computers and Mathematics
Missouri
Compare Zip Codes
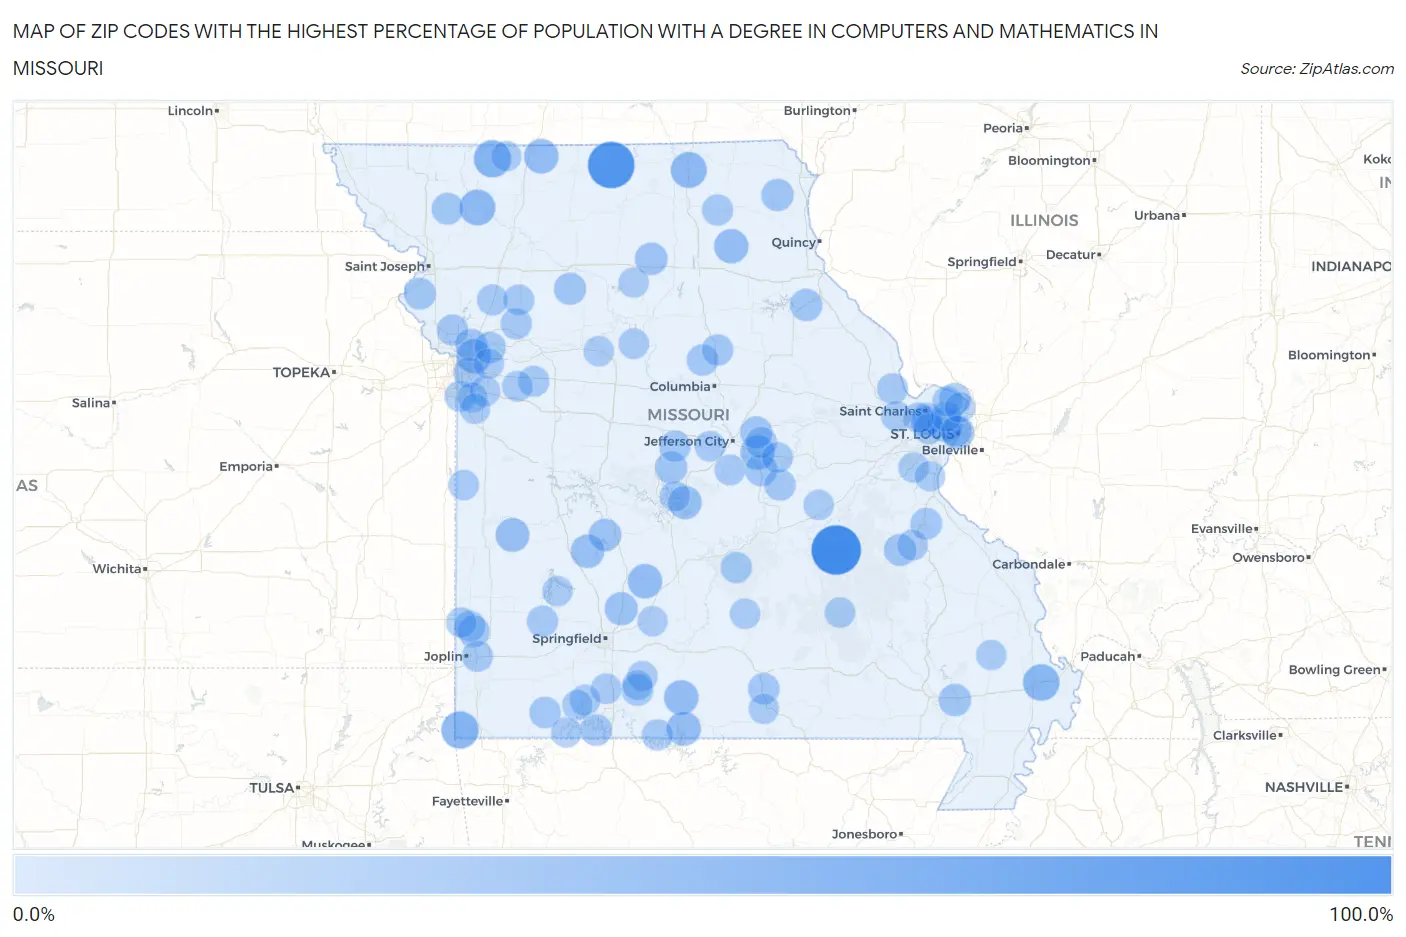
Map of Zip Codes with the Highest Percentage of Population with a Degree in Computers and Mathematics in Missouri
0.0%
100.0%
Zip Codes with the Highest Percentage of Population with a Degree in Computers and Mathematics in Missouri
| Zip Code | % Graduates | vs State | vs National | |
| 1. | 65446 | 100.0% | 4.4%(+95.6)#1 | 4.9%(+95.1)#8 |
| 2. | 64655 | 85.7% | 4.4%(+81.3)#2 | 4.9%(+80.8)#24 |
| 3. | 64863 | 40.4% | 4.4%(+36.0)#3 | 4.9%(+35.5)#128 |
| 4. | 64420 | 40.0% | 4.4%(+35.6)#4 | 4.9%(+35.1)#136 |
| 5. | 63823 | 36.6% | 4.4%(+32.2)#5 | 4.9%(+31.7)#155 |
| 6. | 63561 | 34.0% | 4.4%(+29.6)#6 | 4.9%(+29.1)#177 |
| 7. | 64438 | 33.3% | 4.4%(+28.9)#7 | 4.9%(+28.4)#189 |
| 8. | 65755 | 27.1% | 4.4%(+22.7)#8 | 4.9%(+22.2)#264 |
| 9. | 64161 | 27.0% | 4.4%(+22.6)#9 | 4.9%(+22.1)#265 |
| 10. | 64426 | 26.9% | 4.4%(+22.5)#10 | 4.9%(+22.0)#268 |
| 11. | 65590 | 26.7% | 4.4%(+22.3)#11 | 4.9%(+21.8)#272 |
| 12. | 65054 | 26.2% | 4.4%(+21.8)#12 | 4.9%(+21.3)#281 |
| 13. | 65676 | 25.9% | 4.4%(+21.5)#13 | 4.9%(+21.0)#286 |
| 14. | 63451 | 25.7% | 4.4%(+21.3)#14 | 4.9%(+20.8)#290 |
| 15. | 63133 | 23.4% | 4.4%(+19.0)#15 | 4.9%(+18.5)#350 |
| 16. | 64750 | 23.3% | 4.4%(+18.9)#16 | 4.9%(+18.4)#352 |
| 17. | 65650 | 22.6% | 4.4%(+18.1)#17 | 4.9%(+17.7)#376 |
| 18. | 63101 | 22.4% | 4.4%(+17.9)#18 | 4.9%(+17.5)#380 |
| 19. | 65047 | 22.3% | 4.4%(+17.9)#19 | 4.9%(+17.4)#381 |
| 20. | 65648 | 20.5% | 4.4%(+16.0)#20 | 4.9%(+15.6)#445 |
| 21. | 64631 | 18.0% | 4.4%(+13.5)#21 | 4.9%(+13.1)#564 |
| 22. | 65668 | 17.9% | 4.4%(+13.4)#22 | 4.9%(+13.0)#569 |
| 23. | 63940 | 17.1% | 4.4%(+12.6)#23 | 4.9%(+12.2)#624 |
| 24. | 63436 | 17.0% | 4.4%(+12.6)#24 | 4.9%(+12.1)#627 |
| 25. | 65080 | 16.7% | 4.4%(+12.2)#25 | 4.9%(+11.8)#639 |
| 26. | 63473 | 16.7% | 4.4%(+12.2)#26 | 4.9%(+11.8)#650 |
| 27. | 65035 | 16.2% | 4.4%(+11.7)#27 | 4.9%(+11.3)#688 |
| 28. | 64638 | 16.1% | 4.4%(+11.7)#28 | 4.9%(+11.2)#695 |
| 29. | 64158 | 16.0% | 4.4%(+11.6)#29 | 4.9%(+11.1)#699 |
| 30. | 65011 | 15.6% | 4.4%(+11.2)#30 | 4.9%(+10.7)#736 |
| 31. | 63648 | 15.6% | 4.4%(+11.1)#31 | 4.9%(+10.7)#741 |
| 32. | 64440 | 14.3% | 4.4%(+9.84)#32 | 4.9%(+9.39)#866 |
| 33. | 64457 | 14.0% | 4.4%(+9.51)#33 | 4.9%(+9.06)#915 |
| 34. | 64849 | 13.8% | 4.4%(+9.35)#34 | 4.9%(+8.90)#932 |
| 35. | 63087 | 13.5% | 4.4%(+9.09)#35 | 4.9%(+8.64)#973 |
| 36. | 65611 | 13.5% | 4.4%(+9.06)#36 | 4.9%(+8.61)#979 |
| 37. | 63386 | 13.3% | 4.4%(+8.89)#37 | 4.9%(+8.44)#1,006 |
| 38. | 65657 | 13.3% | 4.4%(+8.89)#38 | 4.9%(+8.44)#1,007 |
| 39. | 64072 | 13.0% | 4.4%(+8.60)#39 | 4.9%(+8.15)#1,052 |
| 40. | 63043 | 13.0% | 4.4%(+8.53)#40 | 4.9%(+8.09)#1,059 |
| 41. | 65256 | 12.9% | 4.4%(+8.50)#41 | 4.9%(+8.05)#1,064 |
| 42. | 65625 | 12.7% | 4.4%(+8.29)#42 | 4.9%(+7.84)#1,087 |
| 43. | 65789 | 12.7% | 4.4%(+8.28)#43 | 4.9%(+7.83)#1,089 |
| 44. | 65050 | 12.5% | 4.4%(+8.05)#44 | 4.9%(+7.61)#1,132 |
| 45. | 65016 | 12.1% | 4.4%(+7.67)#45 | 4.9%(+7.23)#1,196 |
| 46. | 65284 | 12.0% | 4.4%(+7.57)#46 | 4.9%(+7.12)#1,212 |
| 47. | 65013 | 11.9% | 4.4%(+7.50)#47 | 4.9%(+7.05)#1,221 |
| 48. | 65473 | 11.9% | 4.4%(+7.50)#48 | 4.9%(+7.05)#1,222 |
| 49. | 64164 | 11.8% | 4.4%(+7.32)#49 | 4.9%(+6.87)#1,273 |
| 50. | 65733 | 11.5% | 4.4%(+7.03)#50 | 4.9%(+6.58)#1,332 |
| 51. | 64084 | 11.4% | 4.4%(+6.93)#51 | 4.9%(+6.48)#1,354 |
| 52. | 65752 | 11.2% | 4.4%(+6.78)#52 | 4.9%(+6.33)#1,397 |
| 53. | 63547 | 10.7% | 4.4%(+6.27)#53 | 4.9%(+5.82)#1,523 |
| 54. | 64841 | 10.7% | 4.4%(+6.25)#54 | 4.9%(+5.80)#1,529 |
| 55. | 64671 | 10.6% | 4.4%(+6.13)#55 | 4.9%(+5.68)#1,561 |
| 56. | 64076 | 10.5% | 4.4%(+6.09)#56 | 4.9%(+5.64)#1,572 |
| 57. | 64465 | 10.5% | 4.4%(+6.05)#57 | 4.9%(+5.60)#1,589 |
| 58. | 64855 | 10.4% | 4.4%(+5.96)#58 | 4.9%(+5.51)#1,612 |
| 59. | 63146 | 10.2% | 4.4%(+5.75)#59 | 4.9%(+5.31)#1,691 |
| 60. | 63369 | 10.1% | 4.4%(+5.62)#60 | 4.9%(+5.17)#1,725 |
| 61. | 64146 | 10.0% | 4.4%(+5.52)#61 | 4.9%(+5.07)#1,769 |
| 62. | 65051 | 9.9% | 4.4%(+5.50)#62 | 4.9%(+5.05)#1,777 |
| 63. | 63653 | 9.5% | 4.4%(+5.08)#63 | 4.9%(+4.63)#1,948 |
| 64. | 65076 | 9.3% | 4.4%(+4.88)#64 | 4.9%(+4.43)#2,054 |
| 65. | 63141 | 9.2% | 4.4%(+4.75)#65 | 4.9%(+4.30)#2,116 |
| 66. | 64011 | 9.1% | 4.4%(+4.61)#66 | 4.9%(+4.16)#2,223 |
| 67. | 65754 | 8.8% | 4.4%(+4.40)#67 | 4.9%(+3.95)#2,341 |
| 68. | 65349 | 8.5% | 4.4%(+4.06)#68 | 4.9%(+3.61)#2,533 |
| 69. | 65053 | 8.4% | 4.4%(+4.00)#69 | 4.9%(+3.55)#2,572 |
| 70. | 63106 | 8.4% | 4.4%(+3.98)#70 | 4.9%(+3.53)#2,578 |
| 71. | 64129 | 8.4% | 4.4%(+3.93)#71 | 4.9%(+3.48)#2,607 |
| 72. | 65656 | 8.3% | 4.4%(+3.89)#72 | 4.9%(+3.44)#2,632 |
| 73. | 63629 | 8.3% | 4.4%(+3.89)#73 | 4.9%(+3.44)#2,636 |
| 74. | 64722 | 8.3% | 4.4%(+3.89)#74 | 4.9%(+3.44)#2,644 |
| 75. | 63135 | 8.2% | 4.4%(+3.77)#75 | 4.9%(+3.32)#2,738 |
| 76. | 65049 | 8.2% | 4.4%(+3.71)#76 | 4.9%(+3.26)#2,780 |
| 77. | 63051 | 8.2% | 4.4%(+3.71)#77 | 4.9%(+3.26)#2,785 |
| 78. | 64832 | 8.1% | 4.4%(+3.68)#78 | 4.9%(+3.23)#2,802 |
| 79. | 65444 | 8.0% | 4.4%(+3.52)#79 | 4.9%(+3.07)#2,932 |
| 80. | 63034 | 7.9% | 4.4%(+3.47)#80 | 4.9%(+3.02)#2,965 |
| 81. | 65624 | 7.9% | 4.4%(+3.46)#81 | 4.9%(+3.01)#2,975 |
| 82. | 64063 | 7.9% | 4.4%(+3.41)#82 | 4.9%(+2.97)#3,016 |
| 83. | 65658 | 7.7% | 4.4%(+3.29)#83 | 4.9%(+2.84)#3,110 |
| 84. | 63303 | 7.7% | 4.4%(+3.26)#84 | 4.9%(+2.81)#3,133 |
| 85. | 64056 | 7.7% | 4.4%(+3.25)#85 | 4.9%(+2.80)#3,141 |
| 86. | 65635 | 7.7% | 4.4%(+3.25)#86 | 4.9%(+2.80)#3,159 |
| 87. | 64149 | 7.7% | 4.4%(+3.25)#87 | 4.9%(+2.80)#3,166 |
| 88. | 63138 | 7.7% | 4.4%(+3.22)#88 | 4.9%(+2.77)#3,186 |
| 89. | 65339 | 7.6% | 4.4%(+3.13)#89 | 4.9%(+2.68)#3,268 |
| 90. | 63012 | 7.5% | 4.4%(+3.03)#90 | 4.9%(+2.59)#3,359 |
| 91. | 65775 | 7.5% | 4.4%(+3.03)#91 | 4.9%(+2.59)#3,360 |
| 92. | 65453 | 7.4% | 4.4%(+2.96)#92 | 4.9%(+2.51)#3,431 |
| 93. | 65706 | 7.4% | 4.4%(+2.94)#93 | 4.9%(+2.49)#3,449 |
| 94. | 65720 | 7.3% | 4.4%(+2.83)#94 | 4.9%(+2.38)#3,553 |
| 95. | 63368 | 7.2% | 4.4%(+2.77)#95 | 4.9%(+2.32)#3,610 |
| 96. | 64083 | 7.2% | 4.4%(+2.75)#96 | 4.9%(+2.31)#3,626 |
| 97. | 65629 | 7.1% | 4.4%(+2.70)#97 | 4.9%(+2.25)#3,689 |
| 98. | 64458 | 7.1% | 4.4%(+2.70)#98 | 4.9%(+2.25)#3,693 |
| 99. | 64676 | 7.1% | 4.4%(+2.70)#99 | 4.9%(+2.25)#3,699 |
| 100. | 63730 | 7.1% | 4.4%(+2.64)#100 | 4.9%(+2.19)#3,739 |
Common Questions
What are the Top 10 Zip Codes with the Highest Percentage of Population with a Degree in Computers and Mathematics in Missouri?
Top 10 Zip Codes with the Highest Percentage of Population with a Degree in Computers and Mathematics in Missouri are:
What zip code has the Highest Percentage of Population with a Degree in Computers and Mathematics in Missouri?
65446 has the Highest Percentage of Population with a Degree in Computers and Mathematics in Missouri with 100.0%.
What is the Percentage of Population with a Degree in Computers and Mathematics in the State of Missouri?
Percentage of Population with a Degree in Computers and Mathematics in Missouri is 4.4%.
What is the Percentage of Population with a Degree in Computers and Mathematics in the United States?
Percentage of Population with a Degree in Computers and Mathematics in the United States is 4.9%.