Zip Codes with the Highest Percentage of Population with a Degree in Computers and Mathematics in Georgia
RELATED REPORTS & OPTIONS
Computers and Mathematics
Georgia
Compare Zip Codes
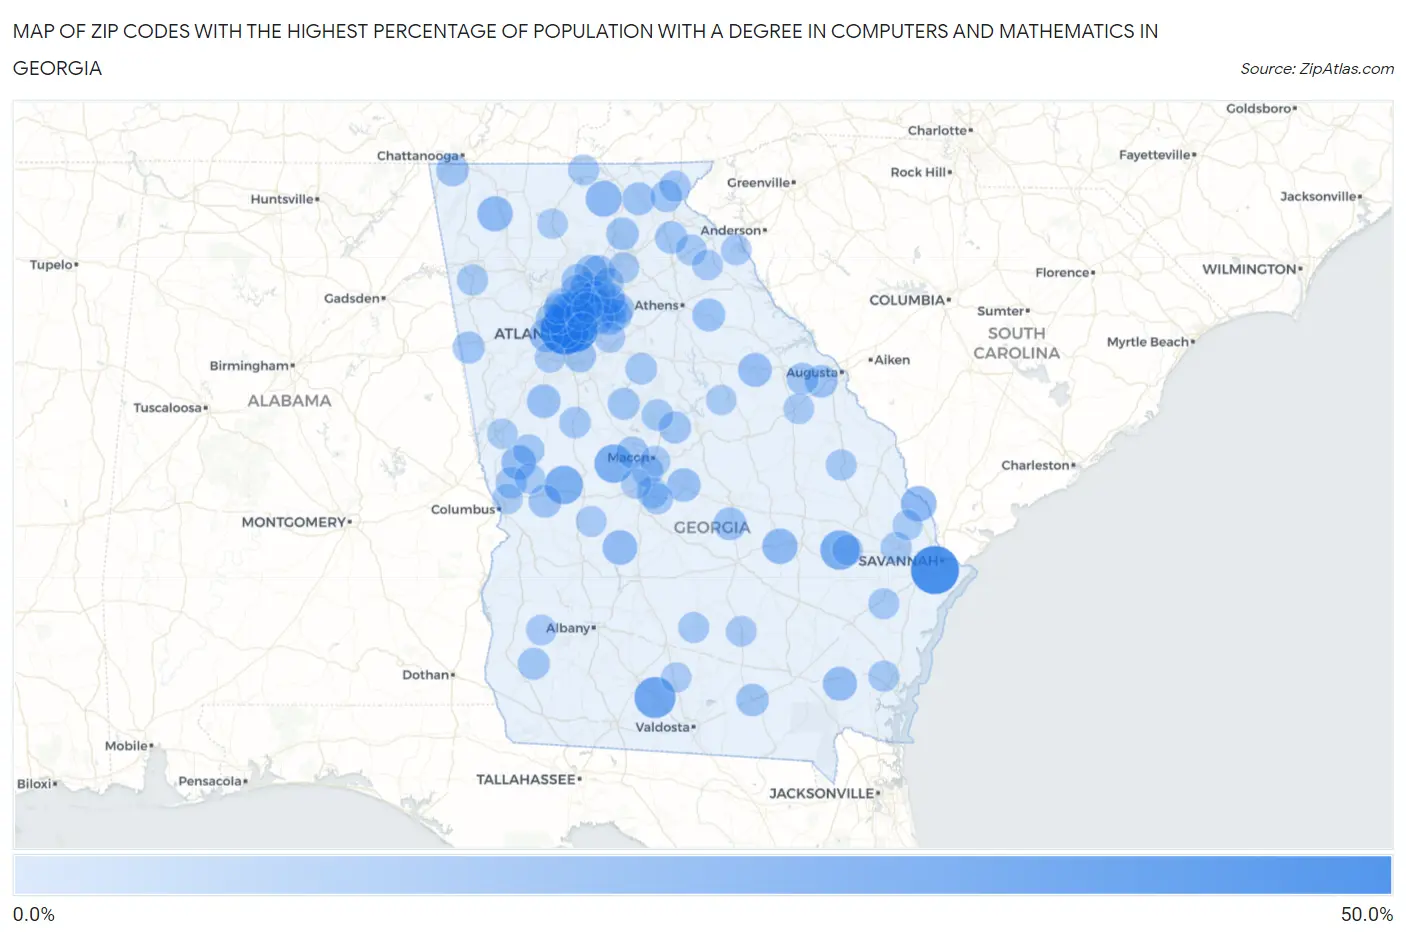
Map of Zip Codes with the Highest Percentage of Population with a Degree in Computers and Mathematics in Georgia
0.0%
50.0%
Zip Codes with the Highest Percentage of Population with a Degree in Computers and Mathematics in Georgia
| Zip Code | % Graduates | vs State | vs National | |
| 1. | 30322 | 47.6% | 5.5%(+42.1)#1 | 4.9%(+42.7)#94 |
| 2. | 30332 | 46.2% | 5.5%(+40.6)#2 | 4.9%(+41.3)#101 |
| 3. | 31409 | 44.4% | 5.5%(+38.9)#3 | 4.9%(+39.6)#111 |
| 4. | 31722 | 29.6% | 5.5%(+24.1)#4 | 4.9%(+24.7)#234 |
| 5. | 30414 | 25.9% | 5.5%(+20.4)#5 | 4.9%(+21.0)#287 |
| 6. | 31066 | 24.2% | 5.5%(+18.7)#6 | 4.9%(+19.3)#320 |
| 7. | 31812 | 23.8% | 5.5%(+18.3)#7 | 4.9%(+18.9)#336 |
| 8. | 30572 | 18.6% | 5.5%(+13.1)#8 | 4.9%(+13.7)#526 |
| 9. | 30346 | 18.4% | 5.5%(+12.9)#9 | 4.9%(+13.5)#545 |
| 10. | 31303 | 17.9% | 5.5%(+12.3)#10 | 4.9%(+13.0)#568 |
| 11. | 30410 | 17.6% | 5.5%(+12.0)#11 | 4.9%(+12.7)#583 |
| 12. | 30746 | 17.3% | 5.5%(+11.8)#12 | 4.9%(+12.5)#602 |
| 13. | 31007 | 16.2% | 5.5%(+10.7)#13 | 4.9%(+11.3)#690 |
| 14. | 31823 | 15.8% | 5.5%(+10.3)#14 | 4.9%(+10.9)#716 |
| 15. | 31553 | 14.8% | 5.5%(+9.29)#15 | 4.9%(+9.92)#805 |
| 16. | 30336 | 14.1% | 5.5%(+8.59)#16 | 4.9%(+9.21)#898 |
| 17. | 30821 | 14.0% | 5.5%(+8.50)#17 | 4.9%(+9.12)#905 |
| 18. | 30276 | 13.9% | 5.5%(+8.37)#18 | 4.9%(+9.00)#920 |
| 19. | 31044 | 13.9% | 5.5%(+8.36)#19 | 4.9%(+8.99)#923 |
| 20. | 30630 | 12.7% | 5.5%(+7.14)#20 | 4.9%(+7.77)#1,099 |
| 21. | 31075 | 12.6% | 5.5%(+7.03)#21 | 4.9%(+7.66)#1,117 |
| 22. | 30545 | 12.3% | 5.5%(+6.77)#22 | 4.9%(+7.39)#1,171 |
| 23. | 31801 | 12.3% | 5.5%(+6.75)#23 | 4.9%(+7.37)#1,175 |
| 24. | 30750 | 11.9% | 5.5%(+6.37)#24 | 4.9%(+6.99)#1,238 |
| 25. | 30905 | 11.8% | 5.5%(+6.27)#25 | 4.9%(+6.90)#1,258 |
| 26. | 31634 | 11.7% | 5.5%(+6.14)#26 | 4.9%(+6.77)#1,292 |
| 27. | 30564 | 11.6% | 5.5%(+6.11)#27 | 4.9%(+6.74)#1,299 |
| 28. | 30040 | 11.6% | 5.5%(+6.08)#28 | 4.9%(+6.71)#1,307 |
| 29. | 30511 | 11.4% | 5.5%(+5.88)#29 | 4.9%(+6.51)#1,349 |
| 30. | 30273 | 11.1% | 5.5%(+5.62)#30 | 4.9%(+6.24)#1,413 |
| 31. | 31220 | 11.1% | 5.5%(+5.61)#31 | 4.9%(+6.24)#1,416 |
| 32. | 31033 | 10.9% | 5.5%(+5.38)#32 | 4.9%(+6.01)#1,481 |
| 33. | 30182 | 10.9% | 5.5%(+5.34)#33 | 4.9%(+5.97)#1,491 |
| 34. | 30046 | 10.8% | 5.5%(+5.33)#34 | 4.9%(+5.95)#1,495 |
| 35. | 30041 | 10.7% | 5.5%(+5.22)#35 | 4.9%(+5.84)#1,518 |
| 36. | 30216 | 10.5% | 5.5%(+5.01)#36 | 4.9%(+5.63)#1,574 |
| 37. | 39841 | 10.5% | 5.5%(+4.96)#37 | 4.9%(+5.59)#1,590 |
| 38. | 30005 | 10.4% | 5.5%(+4.89)#38 | 4.9%(+5.52)#1,611 |
| 39. | 30024 | 10.3% | 5.5%(+4.76)#39 | 4.9%(+5.39)#1,656 |
| 40. | 30044 | 10.3% | 5.5%(+4.75)#40 | 4.9%(+5.37)#1,661 |
| 41. | 30814 | 10.3% | 5.5%(+4.75)#41 | 4.9%(+5.37)#1,662 |
| 42. | 30004 | 10.2% | 5.5%(+4.71)#42 | 4.9%(+5.33)#1,682 |
| 43. | 30523 | 10.2% | 5.5%(+4.69)#43 | 4.9%(+5.31)#1,686 |
| 44. | 30078 | 9.9% | 5.5%(+4.38)#44 | 4.9%(+5.01)#1,794 |
| 45. | 31088 | 9.8% | 5.5%(+4.33)#45 | 4.9%(+4.95)#1,812 |
| 46. | 31038 | 9.8% | 5.5%(+4.32)#46 | 4.9%(+4.94)#1,819 |
| 47. | 30295 | 9.8% | 5.5%(+4.31)#47 | 4.9%(+4.93)#1,824 |
| 48. | 30055 | 9.7% | 5.5%(+4.21)#48 | 4.9%(+4.84)#1,868 |
| 49. | 30022 | 9.7% | 5.5%(+4.18)#49 | 4.9%(+4.81)#1,884 |
| 50. | 30328 | 9.6% | 5.5%(+4.11)#50 | 4.9%(+4.73)#1,913 |
| 51. | 31830 | 9.5% | 5.5%(+3.94)#51 | 4.9%(+4.57)#1,986 |
| 52. | 30017 | 9.4% | 5.5%(+3.88)#52 | 4.9%(+4.50)#2,017 |
| 53. | 30097 | 9.2% | 5.5%(+3.72)#53 | 4.9%(+4.35)#2,097 |
| 54. | 31804 | 9.2% | 5.5%(+3.68)#54 | 4.9%(+4.31)#2,111 |
| 55. | 30313 | 9.2% | 5.5%(+3.66)#55 | 4.9%(+4.28)#2,131 |
| 56. | 30576 | 9.1% | 5.5%(+3.62)#56 | 4.9%(+4.25)#2,158 |
| 57. | 30339 | 9.1% | 5.5%(+3.57)#57 | 4.9%(+4.20)#2,176 |
| 58. | 31216 | 9.1% | 5.5%(+3.56)#58 | 4.9%(+4.19)#2,212 |
| 59. | 30045 | 9.1% | 5.5%(+3.55)#59 | 4.9%(+4.18)#2,217 |
| 60. | 30338 | 9.0% | 5.5%(+3.52)#60 | 4.9%(+4.15)#2,227 |
| 61. | 30096 | 9.0% | 5.5%(+3.47)#61 | 4.9%(+4.10)#2,258 |
| 62. | 30068 | 9.0% | 5.5%(+3.47)#62 | 4.9%(+4.09)#2,263 |
| 63. | 31308 | 9.0% | 5.5%(+3.46)#63 | 4.9%(+4.09)#2,265 |
| 64. | 30147 | 9.0% | 5.5%(+3.44)#64 | 4.9%(+4.07)#2,281 |
| 65. | 31005 | 8.8% | 5.5%(+3.27)#65 | 4.9%(+3.90)#2,377 |
| 66. | 30092 | 8.7% | 5.5%(+3.14)#66 | 4.9%(+3.77)#2,447 |
| 67. | 31523 | 8.6% | 5.5%(+3.03)#67 | 4.9%(+3.66)#2,505 |
| 68. | 30082 | 8.5% | 5.5%(+2.99)#68 | 4.9%(+3.62)#2,531 |
| 69. | 30442 | 8.4% | 5.5%(+2.92)#69 | 4.9%(+3.55)#2,574 |
| 70. | 30559 | 8.4% | 5.5%(+2.83)#70 | 4.9%(+3.46)#2,622 |
| 71. | 31774 | 8.3% | 5.5%(+2.82)#71 | 4.9%(+3.45)#2,628 |
| 72. | 31301 | 8.3% | 5.5%(+2.78)#72 | 4.9%(+3.41)#2,671 |
| 73. | 30521 | 8.3% | 5.5%(+2.74)#73 | 4.9%(+3.36)#2,702 |
| 74. | 31533 | 8.1% | 5.5%(+2.60)#74 | 4.9%(+3.22)#2,808 |
| 75. | 30067 | 8.1% | 5.5%(+2.59)#75 | 4.9%(+3.21)#2,821 |
| 76. | 31041 | 8.0% | 5.5%(+2.48)#76 | 4.9%(+3.11)#2,896 |
| 77. | 30047 | 8.0% | 5.5%(+2.46)#77 | 4.9%(+3.08)#2,923 |
| 78. | 30341 | 8.0% | 5.5%(+2.45)#78 | 4.9%(+3.07)#2,929 |
| 79. | 30417 | 8.0% | 5.5%(+2.43)#79 | 4.9%(+3.06)#2,945 |
| 80. | 31201 | 7.9% | 5.5%(+2.38)#80 | 4.9%(+3.00)#2,982 |
| 81. | 30662 | 7.9% | 5.5%(+2.33)#81 | 4.9%(+2.96)#3,021 |
| 82. | 30833 | 7.8% | 5.5%(+2.31)#82 | 4.9%(+2.94)#3,034 |
| 83. | 31831 | 7.8% | 5.5%(+2.31)#83 | 4.9%(+2.94)#3,037 |
| 84. | 30643 | 7.8% | 5.5%(+2.30)#84 | 4.9%(+2.92)#3,047 |
| 85. | 30009 | 7.8% | 5.5%(+2.28)#85 | 4.9%(+2.90)#3,069 |
| 86. | 30043 | 7.8% | 5.5%(+2.26)#86 | 4.9%(+2.89)#3,082 |
| 87. | 30566 | 7.6% | 5.5%(+2.10)#87 | 4.9%(+2.72)#3,226 |
| 88. | 30291 | 7.6% | 5.5%(+2.05)#88 | 4.9%(+2.68)#3,274 |
| 89. | 30241 | 7.6% | 5.5%(+2.05)#89 | 4.9%(+2.67)#3,276 |
| 90. | 30071 | 7.5% | 5.5%(+2.01)#90 | 4.9%(+2.64)#3,306 |
| 91. | 30012 | 7.5% | 5.5%(+2.00)#91 | 4.9%(+2.63)#3,315 |
| 92. | 39866 | 7.5% | 5.5%(+1.98)#92 | 4.9%(+2.61)#3,339 |
| 93. | 31909 | 7.4% | 5.5%(+1.89)#93 | 4.9%(+2.51)#3,427 |
| 94. | 31087 | 7.4% | 5.5%(+1.88)#94 | 4.9%(+2.51)#3,433 |
| 95. | 31008 | 7.4% | 5.5%(+1.88)#95 | 4.9%(+2.50)#3,438 |
| 96. | 30079 | 7.3% | 5.5%(+1.78)#96 | 4.9%(+2.40)#3,526 |
| 97. | 30175 | 7.2% | 5.5%(+1.69)#97 | 4.9%(+2.32)#3,616 |
| 98. | 31647 | 7.1% | 5.5%(+1.62)#98 | 4.9%(+2.25)#3,684 |
| 99. | 31312 | 7.1% | 5.5%(+1.55)#99 | 4.9%(+2.18)#3,747 |
| 100. | 30518 | 7.0% | 5.5%(+1.52)#100 | 4.9%(+2.15)#3,777 |
Common Questions
What are the Top 10 Zip Codes with the Highest Percentage of Population with a Degree in Computers and Mathematics in Georgia?
Top 10 Zip Codes with the Highest Percentage of Population with a Degree in Computers and Mathematics in Georgia are:
What zip code has the Highest Percentage of Population with a Degree in Computers and Mathematics in Georgia?
30322 has the Highest Percentage of Population with a Degree in Computers and Mathematics in Georgia with 47.6%.
What is the Percentage of Population with a Degree in Computers and Mathematics in the State of Georgia?
Percentage of Population with a Degree in Computers and Mathematics in Georgia is 5.5%.
What is the Percentage of Population with a Degree in Computers and Mathematics in the United States?
Percentage of Population with a Degree in Computers and Mathematics in the United States is 4.9%.