Zip Codes with the Highest Percentage of Population Employed in Real Estate, Rental & Leasing in Delaware

RELATED REPORTS & OPTIONS

Real Estate, Rental & Leasing
Population
Families and Households
Female Fertility
Female Fertility (Unmarried)
Race (Community Size)
Race (Percentage)
Ancestry (Community Size)
AfghanAfricanAlaska NativeAlaskan AthabascanAlbanianAleutAlsatianAmericanApacheArabArapahoArgentineanArmenianAssyrian / Chaldean / SyriacAustralianAustrianBahamianBangladeshiBarbadianBasqueBelgianBelizeanBermudanBhutaneseBlackfeetBolivianBrazilianBritishBritish West IndianBulgarianBurmeseCajunCambodianCanadianCape VerdeanCarpatho RusynCelticCentral AmericanCentral American IndianCherokeeCheyenneChickasawChileanChineseChippewaChoctawColombianColvilleComancheCosta RicanCreeCreekCroatianCrowCubanCypriotCzechCzechoslovakianDanishDelawareDominicanDutchDutch West IndianEastern EuropeanEcuadorianEgyptianEnglishEstonianEthiopianEuropeanFijianFilipinoFinnishFrenchFrench American IndianFrench CanadianGermanGerman RussianGhanaianGreekGuamanian / ChamorroGuatemalanGuyaneseHaitianHmongHonduranHopiHoumaHungarianIcelanderIndian (Asian)IndonesianInupiatIranianIraqiIrishIroquoisIsraeliItalianJamaicanJapaneseJordanianKenyanKiowaKoreanLaotianLatvianLebaneseLiberianLithuanianLumbeeLuxembourgerMacedonianMalaysianMalteseMarshalleseMenomineeMexicanMexican American IndianMongolianMoroccanNative HawaiianNavajoNepaleseNew ZealanderNicaraguanNigerianNorthern EuropeanNorwegianOkinawanOsageOttawaPaiutePakistaniPalestinianPanamanianParaguayanPennsylvania GermanPeruvianPimaPolishPortuguesePotawatomiPuebloPuerto RicanPuget Sound SalishRomanianRussianSalvadoranSamoanScandinavianScotch-IrishScottishSeminoleSenegaleseSerbianShoshoneSierra LeoneanSiouxSlavicSlovakSloveneSomaliSouth AfricanSouth AmericanSouth American IndianSoviet UnionSpaniardSpanishSpanish AmericanSpanish American IndianSri LankanSubsaharan AfricanSudaneseSwedishSwissSyrianTaiwaneseThaiTlingit-HaidaTohono O'OdhamTonganTrinidadian and TobagonianTsimshianTurkishU.S. Virgin IslanderUgandanUkrainianUruguayanUteVenezuelanVietnameseWelshWest IndianYakamaYaquiYugoslavianYumanYup'ikZimbabwean
Ancestry (Percentage)
AfghanAfricanAlaska NativeAlaskan AthabascanAlbanianAleutAlsatianAmericanApacheArabArapahoArgentineanArmenianAssyrian / Chaldean / SyriacAustralianAustrianBahamianBangladeshiBarbadianBasqueBelgianBelizeanBermudanBhutaneseBlackfeetBolivianBrazilianBritishBritish West IndianBulgarianBurmeseCajunCambodianCanadianCape VerdeanCarpatho RusynCelticCentral AmericanCentral American IndianCherokeeCheyenneChickasawChileanChineseChippewaChoctawColombianColvilleComancheCosta RicanCreeCreekCroatianCrowCubanCypriotCzechCzechoslovakianDanishDelawareDominicanDutchDutch West IndianEastern EuropeanEcuadorianEgyptianEnglishEstonianEthiopianEuropeanFijianFilipinoFinnishFrenchFrench American IndianFrench CanadianGermanGerman RussianGhanaianGreekGuamanian / ChamorroGuatemalanGuyaneseHaitianHmongHonduranHopiHoumaHungarianIcelanderIndian (Asian)IndonesianInupiatIranianIraqiIrishIroquoisIsraeliItalianJamaicanJapaneseJordanianKenyanKiowaKoreanLaotianLatvianLebaneseLiberianLithuanianLumbeeLuxembourgerMacedonianMalaysianMalteseMarshalleseMenomineeMexicanMexican American IndianMongolianMoroccanNative HawaiianNavajoNepaleseNew ZealanderNicaraguanNigerianNorthern EuropeanNorwegianOkinawanOsageOttawaPaiutePakistaniPalestinianPanamanianParaguayanPennsylvania GermanPeruvianPimaPolishPortuguesePotawatomiPuebloPuerto RicanPuget Sound SalishRomanianRussianSalvadoranSamoanScandinavianScotch-IrishScottishSeminoleSenegaleseSerbianShoshoneSierra LeoneanSiouxSlavicSlovakSloveneSomaliSouth AfricanSouth AmericanSouth American IndianSoviet UnionSpaniardSpanishSpanish AmericanSpanish American IndianSri LankanSubsaharan AfricanSudaneseSwedishSwissSyrianTaiwaneseThaiTlingit-HaidaTohono O'OdhamTonganTrinidadian and TobagonianTsimshianTurkishU.S. Virgin IslanderUgandanUkrainianUruguayanUteVenezuelanVietnameseWelshWest IndianYakamaYaquiYugoslavianYumanYup'ikZimbabwean
Immigrant Origin (Total)
AfghanistanAfricaAlbaniaArgentinaArmeniaAsiaAustraliaAustriaAzoresBahamasBangladeshBarbadosBelarusBelgiumBelizeBoliviaBosnia and HerzegovinaBrazilBulgariaBurma / MyanmarCabo VerdeCambodiaCameroonCanadaCaribbeanCentral AmericaChileChinaColombiaCongoCosta RicaCroatiaCubaCzechoslovakiaDenmarkDominicaDominican RepublicEastern AfricaEastern AsiaEastern EuropeEcuadorEgyptEl SalvadorEnglandEritreaEthiopiaEuropeFijiFranceGermanyGhanaGreeceGrenadaGuatemalaGuyanaHaitiHondurasHong KongHungaryIndiaIndonesiaIranIraqIrelandIsraelItalyJamaicaJapanJordanKazakhstanKenyaKoreaKuwaitLaosLatin AmericaLatviaLebanonLiberiaLithuaniaMalaysiaMexicoMicronesiaMiddle AfricaMoldovaMoroccoNepalNetherlandsNicaraguaNigeriaNorth MacedoniaNorthern AfricaNorthern EuropeNorwayOceaniaPakistanPanamaPeruPhilippinesPolandPortugalRomaniaRussiaSaudi ArabiaScotlandSenegalSerbiaSierra LeoneSingaporeSomaliaSouth AfricaSouth AmericaSouth Central AsiaSouth Eastern AsiaSouthern EuropeSpainSri LankaSt. Vincent and the GrenadinesSudanSwedenSwitzerlandSyriaTaiwanThailandTrinidad and TobagoTurkeyUgandaUkraineUruguayUzbekistanVenezuelaVietnamWest IndiesWestern AfricaWestern AsiaWestern EuropeYemenZaireZimbabwe
Immigrant Origin (Percentage)
AfghanistanAfricaAlbaniaArgentinaArmeniaAsiaAustraliaAustriaAzoresBahamasBangladeshBarbadosBelarusBelgiumBelizeBoliviaBosnia and HerzegovinaBrazilBulgariaBurma / MyanmarCabo VerdeCambodiaCameroonCanadaCaribbeanCentral AmericaChileChinaColombiaCongoCosta RicaCroatiaCubaCzechoslovakiaDenmarkDominicaDominican RepublicEastern AfricaEastern AsiaEastern EuropeEcuadorEgyptEl SalvadorEnglandEritreaEthiopiaEuropeFijiFranceGermanyGhanaGreeceGrenadaGuatemalaGuyanaHaitiHondurasHong KongHungaryIndiaIndonesiaIranIraqIrelandIsraelItalyJamaicaJapanJordanKazakhstanKenyaKoreaKuwaitLaosLatin AmericaLatviaLebanonLiberiaLithuaniaMalaysiaMexicoMicronesiaMiddle AfricaMoldovaMoroccoNepalNetherlandsNicaraguaNigeriaNorth MacedoniaNorthern AfricaNorthern EuropeNorwayOceaniaPakistanPanamaPeruPhilippinesPolandPortugalRomaniaRussiaSaudi ArabiaScotlandSenegalSerbiaSierra LeoneSingaporeSomaliaSouth AfricaSouth AmericaSouth Central AsiaSouth Eastern AsiaSouthern EuropeSpainSri LankaSt. Vincent and the GrenadinesSudanSwedenSwitzerlandSyriaTaiwanThailandTrinidad and TobagoTurkeyUgandaUkraineUruguayUzbekistanVenezuelaVietnamWest IndiesWestern AfricaWestern AsiaWestern EuropeYemenZaireZimbabwe
Income
Income (Families)
Income (Households)
Poverty
Poverty (Families)
Unemployment
Employment Occupations
Employment Industries
Employer Class
Commute Time
Commute Means
School Enrollment
Education by Degree Field
Occupancy
Finances
Physical Characteristics
Delaware
Compare Zip Codes
Comparison Subject

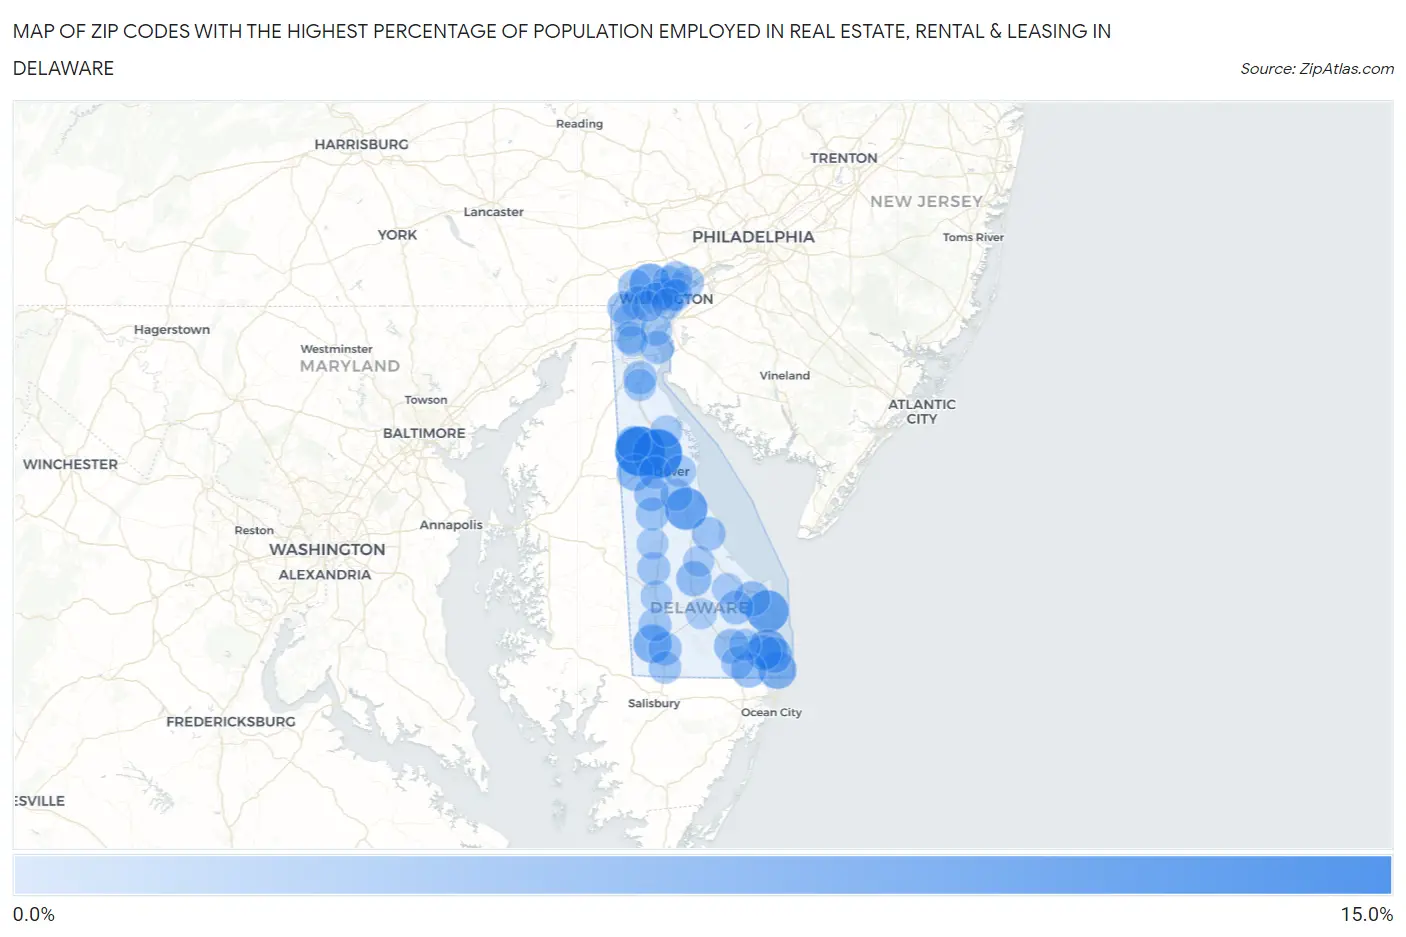
Map of Zip Codes with the Highest Percentage of Population Employed in Real Estate, Rental & Leasing in Delaware

0.0%
15.0%
Zip Codes with the Highest Percentage of Population Employed in Real Estate, Rental & Leasing in Delaware Map

Zip Codes with the Highest Percentage of Population Employed in Real Estate, Rental & Leasing in Delaware

Zip Code % Employed vs State vs National
1.1995512.3%1.8%(+10.5)#11.9%(+10.4)#251
2.1993612.1%1.8%(+10.4)#21.9%(+10.3)#258
3.199467.7%1.8%(+5.93)#31.9%(+5.83)#602
4.199717.5%1.8%(+5.74)#41.9%(+5.63)#632
5.198076.4%1.8%(+4.65)#51.9%(+4.55)#842
6.199705.5%1.8%(+3.76)#61.9%(+3.66)#1,134
7.199315.0%1.8%(+3.25)#71.9%(+3.15)#1,366
8.199444.9%1.8%(+3.09)#81.9%(+2.99)#1,459
9.199534.0%1.8%(+2.25)#91.9%(+2.15)#2,122
10.199304.0%1.8%(+2.18)#101.9%(+2.07)#2,216
11.199673.4%1.8%(+1.63)#111.9%(+1.53)#2,978
12.199383.3%1.8%(+1.52)#121.9%(+1.41)#3,199
13.199583.3%1.8%(+1.50)#131.9%(+1.40)#3,235
14.199413.2%1.8%(+1.39)#141.9%(+1.29)#3,454
15.199753.1%1.8%(+1.35)#151.9%(+1.25)#3,528
16.199662.8%1.8%(+0.994)#161.9%(+0.891)#4,479
17.199342.6%1.8%(+0.856)#171.9%(+0.753)#4,949
18.197072.3%1.8%(+0.545)#181.9%(+0.443)#6,159
19.199512.3%1.8%(+0.542)#191.9%(+0.439)#6,174
20.198082.2%1.8%(+0.441)#201.9%(+0.338)#6,661
21.199632.2%1.8%(+0.399)#211.9%(+0.296)#6,863
22.197092.1%1.8%(+0.276)#221.9%(+0.173)#7,510
23.199432.0%1.8%(+0.254)#231.9%(+0.152)#7,623
24.199562.0%1.8%(+0.186)#241.9%(+0.083)#7,983
25.197061.9%1.8%(+0.102)#251.9%(-0.001)#8,531
26.197131.9%1.8%(+0.062)#261.9%(-0.041)#8,782
27.198021.8%1.8%(+0.056)#271.9%(-0.047)#8,833
28.199501.8%1.8%(+0.047)#281.9%(-0.056)#8,895
29.199731.8%1.8%(-0.006)#291.9%(-0.108)#9,234
30.198031.8%1.8%(-0.016)#301.9%(-0.118)#9,290
31.197031.8%1.8%(-0.026)#311.9%(-0.128)#9,357
32.197111.8%1.8%(-0.036)#321.9%(-0.138)#9,424
33.198061.6%1.8%(-0.146)#331.9%(-0.249)#10,163
34.198051.6%1.8%(-0.192)#341.9%(-0.294)#10,453
35.199041.5%1.8%(-0.242)#351.9%(-0.345)#10,814
36.198101.5%1.8%(-0.335)#361.9%(-0.437)#11,540
37.199451.5%1.8%(-0.336)#371.9%(-0.439)#11,553
38.199621.4%1.8%(-0.339)#381.9%(-0.442)#11,580
39.199401.4%1.8%(-0.347)#391.9%(-0.450)#11,642
40.197021.4%1.8%(-0.406)#401.9%(-0.509)#12,115
41.199011.3%1.8%(-0.524)#411.9%(-0.627)#12,989
42.199391.2%1.8%(-0.551)#421.9%(-0.654)#13,181
43.197201.2%1.8%(-0.564)#431.9%(-0.667)#13,289
44.198091.2%1.8%(-0.638)#441.9%(-0.741)#13,878
45.197301.1%1.8%(-0.644)#451.9%(-0.747)#13,911
46.199771.0%1.8%(-0.768)#461.9%(-0.871)#14,976
47.199520.98%1.8%(-0.807)#471.9%(-0.910)#15,316
48.199330.95%1.8%(-0.834)#481.9%(-0.937)#15,522
49.199680.77%1.8%(-1.01)#491.9%(-1.12)#16,892
50.198040.76%1.8%(-1.03)#501.9%(-1.13)#17,019
51.198010.71%1.8%(-1.08)#511.9%(-1.18)#17,383
52.199600.66%1.8%(-1.13)#521.9%(-1.23)#17,802
53.199470.53%1.8%(-1.26)#531.9%(-1.36)#18,810
54.197010.50%1.8%(-1.29)#541.9%(-1.40)#19,113

Common Questions

What are the Top 10 Zip Codes with the Highest Percentage of Population Employed in Real Estate, Rental & Leasing in Delaware?
Top 10 Zip Codes with the Highest Percentage of Population Employed in Real Estate, Rental & Leasing in Delaware are:
#1
12.3%
#2
12.1%
#3
7.7%
#4
7.5%
#5
6.4%
#6
5.5%
#7
5.0%
#8
4.9%
#9
4.0%
#10
4.0%
What zip code has the Highest Percentage of Population Employed in Real Estate, Rental & Leasing in Delaware?
19955 has the Highest Percentage of Population Employed in Real Estate, Rental & Leasing in Delaware with 12.3%.
What is the Percentage of Population Employed in Real Estate, Rental & Leasing in the State of Delaware?
Percentage of Population Employed in Real Estate, Rental & Leasing in Delaware is 1.8%.
What is the Percentage of Population Employed in Real Estate, Rental & Leasing in the United States?
Percentage of Population Employed in Real Estate, Rental & Leasing in the United States is 1.9%.