Zip Codes with the Highest Percentage of Population Employed in Real Estate, Rental & Leasing in New Hampshire
RELATED REPORTS & OPTIONS
Real Estate, Rental & Leasing
New Hampshire
Compare Zip Codes
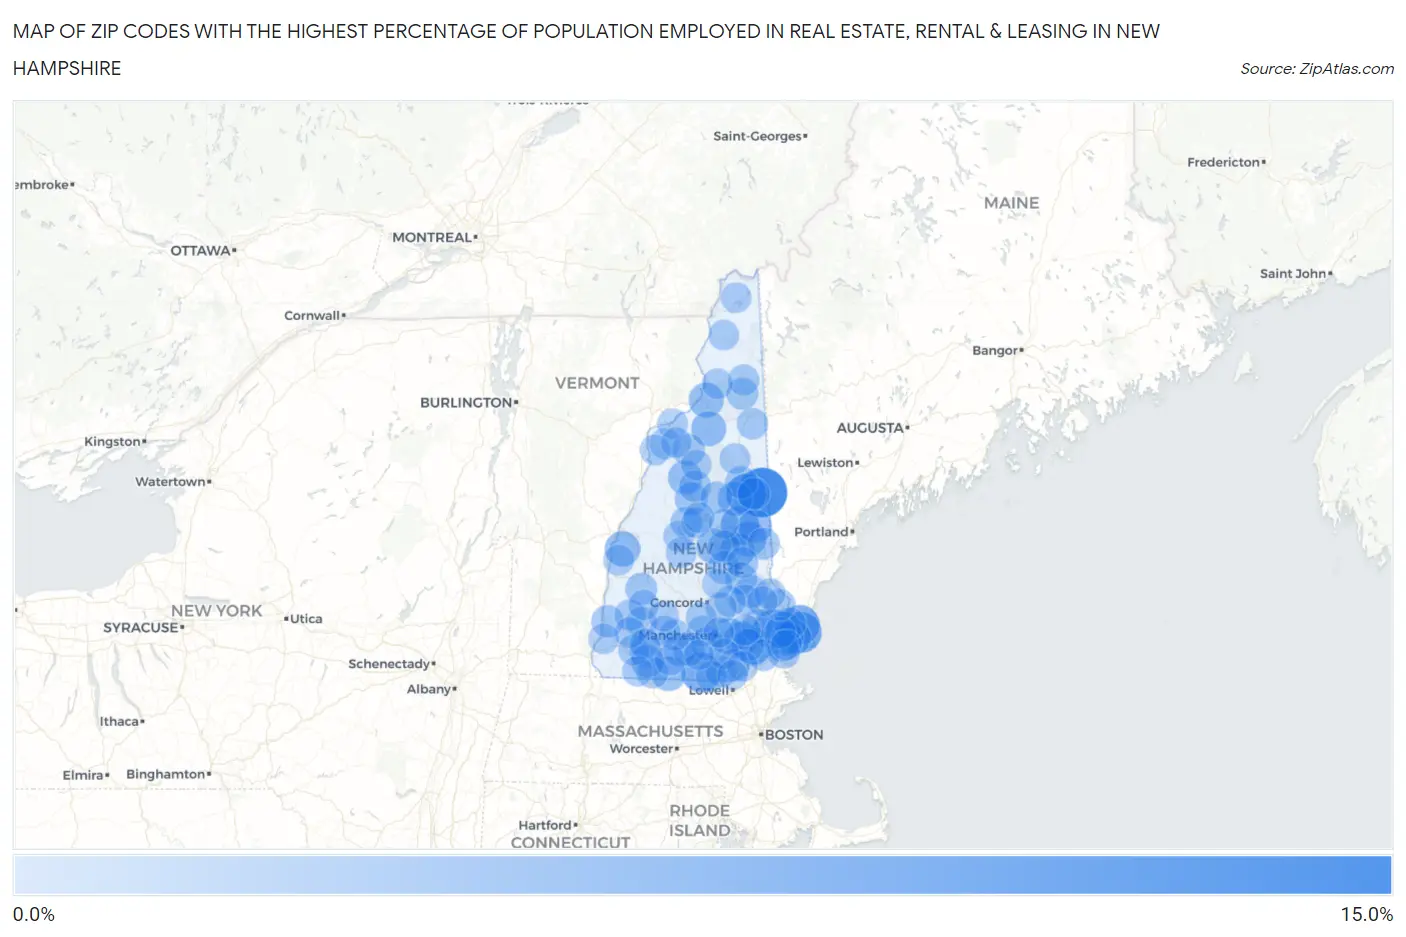
Map of Zip Codes with the Highest Percentage of Population Employed in Real Estate, Rental & Leasing in New Hampshire
0.0%
15.0%
Zip Codes with the Highest Percentage of Population Employed in Real Estate, Rental & Leasing in New Hampshire
| Zip Code | % Employed | vs State | vs National | |
| 1. | 03832 | 13.9% | 1.5%(+12.4)#1 | 1.9%(+12.0)#202 |
| 2. | 03870 | 8.1% | 1.5%(+6.63)#2 | 1.9%(+6.20)#543 |
| 3. | 03875 | 7.7% | 1.5%(+6.28)#3 | 1.9%(+5.84)#597 |
| 4. | 03854 | 7.5% | 1.5%(+6.03)#4 | 1.9%(+5.59)#638 |
| 5. | 03049 | 7.4% | 1.5%(+5.93)#5 | 1.9%(+5.50)#662 |
| 6. | 03856 | 6.8% | 1.5%(+5.35)#6 | 1.9%(+4.92)#767 |
| 7. | 03816 | 6.4% | 1.5%(+4.93)#7 | 1.9%(+4.49)#856 |
| 8. | 03819 | 5.4% | 1.5%(+3.91)#8 | 1.9%(+3.48)#1,210 |
| 9. | 03032 | 5.2% | 1.5%(+3.73)#9 | 1.9%(+3.30)#1,289 |
| 10. | 03894 | 4.7% | 1.5%(+3.24)#10 | 1.9%(+2.80)#1,569 |
| 11. | 03781 | 4.6% | 1.5%(+3.13)#11 | 1.9%(+2.70)#1,644 |
| 12. | 03584 | 4.4% | 1.5%(+2.95)#12 | 1.9%(+2.52)#1,784 |
| 13. | 03810 | 4.4% | 1.5%(+2.93)#13 | 1.9%(+2.50)#1,799 |
| 14. | 03246 | 4.3% | 1.5%(+2.86)#14 | 1.9%(+2.43)#1,852 |
| 15. | 03595 | 4.3% | 1.5%(+2.86)#15 | 1.9%(+2.42)#1,858 |
| 16. | 03871 | 4.2% | 1.5%(+2.76)#16 | 1.9%(+2.33)#1,941 |
| 17. | 03840 | 4.1% | 1.5%(+2.68)#17 | 1.9%(+2.24)#2,027 |
| 18. | 03036 | 4.1% | 1.5%(+2.64)#18 | 1.9%(+2.21)#2,055 |
| 19. | 03886 | 4.1% | 1.5%(+2.61)#19 | 1.9%(+2.18)#2,096 |
| 20. | 03071 | 4.0% | 1.5%(+2.54)#20 | 1.9%(+2.10)#2,175 |
| 21. | 03262 | 3.8% | 1.5%(+2.36)#21 | 1.9%(+1.92)#2,372 |
| 22. | 03864 | 3.7% | 1.5%(+2.20)#22 | 1.9%(+1.77)#2,574 |
| 23. | 03042 | 3.4% | 1.5%(+1.99)#23 | 1.9%(+1.55)#2,942 |
| 24. | 03082 | 3.2% | 1.5%(+1.75)#24 | 1.9%(+1.32)#3,393 |
| 25. | 03237 | 3.1% | 1.5%(+1.68)#25 | 1.9%(+1.25)#3,535 |
| 26. | 03444 | 3.1% | 1.5%(+1.63)#26 | 1.9%(+1.20)#3,643 |
| 27. | 03110 | 3.0% | 1.5%(+1.59)#27 | 1.9%(+1.16)#3,758 |
| 28. | 03223 | 3.0% | 1.5%(+1.56)#28 | 1.9%(+1.13)#3,832 |
| 29. | 03452 | 3.0% | 1.5%(+1.56)#29 | 1.9%(+1.12)#3,858 |
| 30. | 03884 | 2.9% | 1.5%(+1.44)#30 | 1.9%(+1.01)#4,181 |
| 31. | 03818 | 2.9% | 1.5%(+1.41)#31 | 1.9%(+0.977)#4,250 |
| 32. | 03873 | 2.8% | 1.5%(+1.31)#32 | 1.9%(+0.880)#4,516 |
| 33. | 03580 | 2.7% | 1.5%(+1.20)#33 | 1.9%(+0.771)#4,884 |
| 34. | 03862 | 2.7% | 1.5%(+1.20)#34 | 1.9%(+0.767)#4,905 |
| 35. | 03849 | 2.6% | 1.5%(+1.17)#35 | 1.9%(+0.733)#5,019 |
| 36. | 03608 | 2.6% | 1.5%(+1.14)#36 | 1.9%(+0.710)#5,097 |
| 37. | 03801 | 2.6% | 1.5%(+1.10)#37 | 1.9%(+0.668)#5,253 |
| 38. | 03087 | 2.5% | 1.5%(+1.05)#38 | 1.9%(+0.616)#5,461 |
| 39. | 03057 | 2.5% | 1.5%(+1.04)#39 | 1.9%(+0.607)#5,498 |
| 40. | 03874 | 2.5% | 1.5%(+1.03)#40 | 1.9%(+0.596)#5,535 |
| 41. | 03872 | 2.4% | 1.5%(+0.973)#41 | 1.9%(+0.540)#5,752 |
| 42. | 03225 | 2.4% | 1.5%(+0.960)#42 | 1.9%(+0.527)#5,818 |
| 43. | 03844 | 2.4% | 1.5%(+0.899)#43 | 1.9%(+0.467)#6,063 |
| 44. | 03285 | 2.3% | 1.5%(+0.888)#44 | 1.9%(+0.456)#6,107 |
| 45. | 03858 | 2.3% | 1.5%(+0.879)#45 | 1.9%(+0.447)#6,143 |
| 46. | 03259 | 2.3% | 1.5%(+0.866)#46 | 1.9%(+0.434)#6,203 |
| 47. | 03570 | 2.3% | 1.5%(+0.853)#47 | 1.9%(+0.421)#6,257 |
| 48. | 03752 | 2.3% | 1.5%(+0.850)#48 | 1.9%(+0.418)#6,270 |
| 49. | 03249 | 2.3% | 1.5%(+0.835)#49 | 1.9%(+0.403)#6,332 |
| 50. | 03461 | 2.2% | 1.5%(+0.768)#50 | 1.9%(+0.336)#6,676 |
| 51. | 03264 | 2.2% | 1.5%(+0.725)#51 | 1.9%(+0.292)#6,881 |
| 52. | 03885 | 2.2% | 1.5%(+0.695)#52 | 1.9%(+0.263)#7,047 |
| 53. | 03051 | 2.1% | 1.5%(+0.605)#53 | 1.9%(+0.173)#7,512 |
| 54. | 03043 | 2.0% | 1.5%(+0.579)#54 | 1.9%(+0.146)#7,654 |
| 55. | 03581 | 2.0% | 1.5%(+0.536)#55 | 1.9%(+0.103)#7,870 |
| 56. | 03809 | 2.0% | 1.5%(+0.517)#56 | 1.9%(+0.085)#7,977 |
| 57. | 03820 | 1.9% | 1.5%(+0.473)#57 | 1.9%(+0.041)#8,238 |
| 58. | 03456 | 1.9% | 1.5%(+0.459)#58 | 1.9%(+0.026)#8,350 |
| 59. | 03588 | 1.9% | 1.5%(+0.457)#59 | 1.9%(+0.024)#8,363 |
| 60. | 03045 | 1.9% | 1.5%(+0.439)#60 | 1.9%(+0.007)#8,481 |
| 61. | 03842 | 1.9% | 1.5%(+0.436)#61 | 1.9%(+0.004)#8,501 |
| 62. | 03077 | 1.9% | 1.5%(+0.428)#62 | 1.9%(-0.004)#8,553 |
| 63. | 03261 | 1.9% | 1.5%(+0.428)#63 | 1.9%(-0.005)#8,556 |
| 64. | 03234 | 1.9% | 1.5%(+0.420)#64 | 1.9%(-0.013)#8,608 |
| 65. | 03062 | 1.9% | 1.5%(+0.417)#65 | 1.9%(-0.015)#8,622 |
| 66. | 03464 | 1.9% | 1.5%(+0.410)#66 | 1.9%(-0.023)#8,665 |
| 67. | 03839 | 1.8% | 1.5%(+0.316)#67 | 1.9%(-0.117)#9,279 |
| 68. | 03812 | 1.7% | 1.5%(+0.288)#68 | 1.9%(-0.144)#9,453 |
| 69. | 03275 | 1.7% | 1.5%(+0.285)#69 | 1.9%(-0.148)#9,482 |
| 70. | 03455 | 1.7% | 1.5%(+0.265)#70 | 1.9%(-0.168)#9,594 |
| 71. | 03222 | 1.7% | 1.5%(+0.263)#71 | 1.9%(-0.169)#9,609 |
| 72. | 03585 | 1.7% | 1.5%(+0.256)#72 | 1.9%(-0.176)#9,658 |
| 73. | 03445 | 1.7% | 1.5%(+0.240)#73 | 1.9%(-0.193)#9,762 |
| 74. | 03046 | 1.7% | 1.5%(+0.235)#74 | 1.9%(-0.198)#9,805 |
| 75. | 03217 | 1.7% | 1.5%(+0.231)#75 | 1.9%(-0.202)#9,838 |
| 76. | 03245 | 1.7% | 1.5%(+0.215)#76 | 1.9%(-0.218)#9,945 |
| 77. | 03243 | 1.7% | 1.5%(+0.210)#77 | 1.9%(-0.222)#9,974 |
| 78. | 03745 | 1.7% | 1.5%(+0.199)#78 | 1.9%(-0.233)#10,058 |
| 79. | 03582 | 1.6% | 1.5%(+0.173)#79 | 1.9%(-0.260)#10,227 |
| 80. | 03740 | 1.6% | 1.5%(+0.157)#80 | 1.9%(-0.276)#10,338 |
| 81. | 03467 | 1.6% | 1.5%(+0.149)#81 | 1.9%(-0.284)#10,390 |
| 82. | 03442 | 1.6% | 1.5%(+0.124)#82 | 1.9%(-0.308)#10,560 |
| 83. | 03561 | 1.5% | 1.5%(+0.090)#83 | 1.9%(-0.342)#10,793 |
| 84. | 03586 | 1.5% | 1.5%(+0.089)#84 | 1.9%(-0.344)#10,808 |
| 85. | 03053 | 1.5% | 1.5%(+0.085)#85 | 1.9%(-0.347)#10,828 |
| 86. | 03450 | 1.5% | 1.5%(+0.062)#86 | 1.9%(-0.370)#10,994 |
| 87. | 03084 | 1.5% | 1.5%(+0.058)#87 | 1.9%(-0.374)#11,023 |
| 88. | 03244 | 1.5% | 1.5%(+0.045)#88 | 1.9%(-0.388)#11,127 |
| 89. | 03592 | 1.5% | 1.5%(+0.043)#89 | 1.9%(-0.390)#11,140 |
| 90. | 03251 | 1.5% | 1.5%(+0.033)#90 | 1.9%(-0.399)#11,206 |
| 91. | 03447 | 1.5% | 1.5%(+0.031)#91 | 1.9%(-0.402)#11,234 |
| 92. | 03079 | 1.5% | 1.5%(+0.030)#92 | 1.9%(-0.402)#11,238 |
| 93. | 03280 | 1.5% | 1.5%(+0.001)#93 | 1.9%(-0.432)#11,487 |
| 94. | 03576 | 1.5% | 1.5%(-0.001)#94 | 1.9%(-0.434)#11,507 |
| 95. | 03104 | 1.4% | 1.5%(-0.071)#95 | 1.9%(-0.504)#12,076 |
| 96. | 03825 | 1.4% | 1.5%(-0.085)#96 | 1.9%(-0.518)#12,188 |
| 97. | 03254 | 1.4% | 1.5%(-0.104)#97 | 1.9%(-0.537)#12,309 |
| 98. | 03307 | 1.3% | 1.5%(-0.126)#98 | 1.9%(-0.558)#12,462 |
| 99. | 03031 | 1.3% | 1.5%(-0.154)#99 | 1.9%(-0.586)#12,682 |
| 100. | 03076 | 1.3% | 1.5%(-0.165)#100 | 1.9%(-0.598)#12,763 |
Common Questions
What are the Top 10 Zip Codes with the Highest Percentage of Population Employed in Real Estate, Rental & Leasing in New Hampshire?
Top 10 Zip Codes with the Highest Percentage of Population Employed in Real Estate, Rental & Leasing in New Hampshire are:
What zip code has the Highest Percentage of Population Employed in Real Estate, Rental & Leasing in New Hampshire?
03832 has the Highest Percentage of Population Employed in Real Estate, Rental & Leasing in New Hampshire with 13.9%.
What is the Percentage of Population Employed in Real Estate, Rental & Leasing in the State of New Hampshire?
Percentage of Population Employed in Real Estate, Rental & Leasing in New Hampshire is 1.5%.
What is the Percentage of Population Employed in Real Estate, Rental & Leasing in the United States?
Percentage of Population Employed in Real Estate, Rental & Leasing in the United States is 1.9%.