Zip Codes with the Highest Percentage of Population Employed in Real Estate, Rental & Leasing in Nebraska
RELATED REPORTS & OPTIONS
Real Estate, Rental & Leasing
Nebraska
Compare Zip Codes
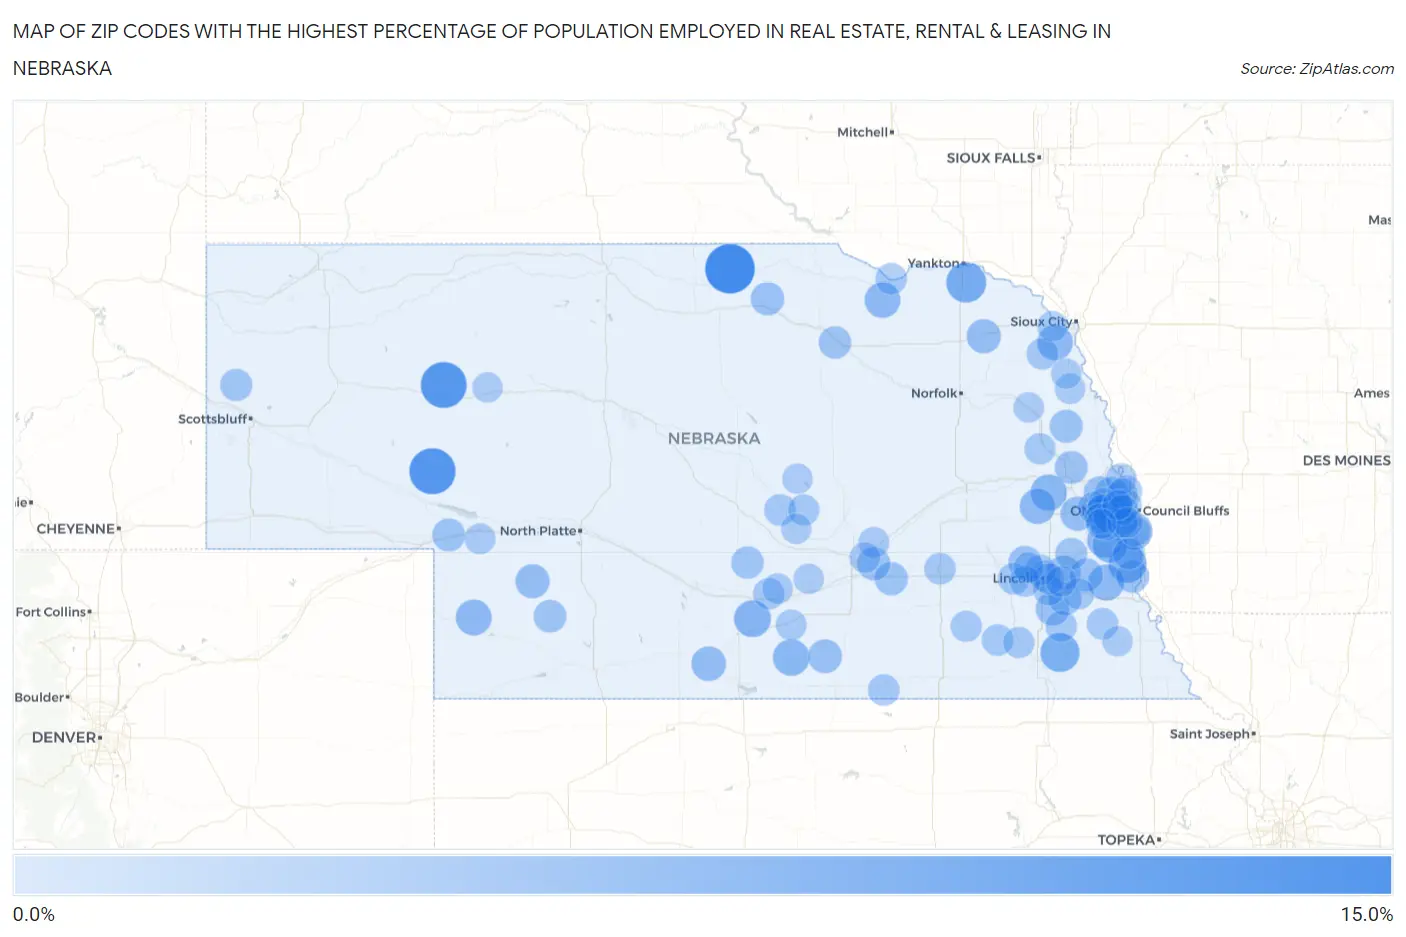
Map of Zip Codes with the Highest Percentage of Population Employed in Real Estate, Rental & Leasing in Nebraska
0.0%
15.0%
Zip Codes with the Highest Percentage of Population Employed in Real Estate, Rental & Leasing in Nebraska
| Zip Code | % Employed | vs State | vs National | |
| 1. | 68753 | 12.5% | 1.2%(+11.3)#1 | 1.9%(+10.6)#246 |
| 2. | 69147 | 10.5% | 1.2%(+9.34)#2 | 1.9%(+8.63)#341 |
| 3. | 69333 | 10.3% | 1.2%(+9.11)#3 | 1.9%(+8.40)#358 |
| 4. | 68736 | 6.9% | 1.2%(+5.67)#4 | 1.9%(+4.96)#757 |
| 5. | 68357 | 6.3% | 1.2%(+5.16)#5 | 1.9%(+4.45)#871 |
| 6. | 68409 | 5.7% | 1.2%(+4.51)#6 | 1.9%(+3.80)#1,076 |
| 7. | 68113 | 5.4% | 1.2%(+4.17)#7 | 1.9%(+3.47)#1,213 |
| 8. | 68940 | 5.1% | 1.2%(+3.89)#8 | 1.9%(+3.18)#1,353 |
| 9. | 68981 | 4.9% | 1.2%(+3.69)#9 | 1.9%(+2.99)#1,461 |
| 10. | 68015 | 4.6% | 1.2%(+3.44)#10 | 1.9%(+2.74)#1,619 |
| 11. | 68307 | 4.5% | 1.2%(+3.34)#11 | 1.9%(+2.64)#1,700 |
| 12. | 69033 | 4.5% | 1.2%(+3.32)#12 | 1.9%(+2.61)#1,718 |
| 13. | 68059 | 4.4% | 1.2%(+3.25)#13 | 1.9%(+2.54)#1,769 |
| 14. | 68783 | 4.4% | 1.2%(+3.24)#14 | 1.9%(+2.53)#1,778 |
| 15. | 68741 | 4.4% | 1.2%(+3.20)#15 | 1.9%(+2.49)#1,803 |
| 16. | 68040 | 4.3% | 1.2%(+3.07)#16 | 1.9%(+2.36)#1,912 |
| 17. | 68016 | 4.2% | 1.2%(+3.02)#17 | 1.9%(+2.31)#1,951 |
| 18. | 68967 | 3.7% | 1.2%(+2.56)#18 | 1.9%(+1.85)#2,456 |
| 19. | 68073 | 3.5% | 1.2%(+2.34)#19 | 1.9%(+1.63)#2,793 |
| 20. | 68717 | 3.5% | 1.2%(+2.31)#20 | 1.9%(+1.60)#2,843 |
| 21. | 69169 | 3.5% | 1.2%(+2.30)#21 | 1.9%(+1.60)#2,861 |
| 22. | 68527 | 3.4% | 1.2%(+2.18)#22 | 1.9%(+1.47)#3,107 |
| 23. | 68928 | 3.3% | 1.2%(+2.11)#23 | 1.9%(+1.40)#3,234 |
| 24. | 68372 | 3.2% | 1.2%(+2.03)#24 | 1.9%(+1.32)#3,395 |
| 25. | 68142 | 3.1% | 1.2%(+1.90)#25 | 1.9%(+1.19)#3,660 |
| 26. | 68402 | 3.0% | 1.2%(+1.86)#26 | 1.9%(+1.16)#3,761 |
| 27. | 68349 | 3.0% | 1.2%(+1.85)#27 | 1.9%(+1.14)#3,809 |
| 28. | 68780 | 3.0% | 1.2%(+1.85)#28 | 1.9%(+1.14)#3,811 |
| 29. | 68818 | 3.0% | 1.2%(+1.83)#29 | 1.9%(+1.12)#3,879 |
| 30. | 68865 | 3.0% | 1.2%(+1.81)#30 | 1.9%(+1.10)#3,926 |
| 31. | 68144 | 2.9% | 1.2%(+1.74)#31 | 1.9%(+1.03)#4,096 |
| 32. | 68045 | 2.9% | 1.2%(+1.70)#32 | 1.9%(+0.993)#4,216 |
| 33. | 68455 | 2.8% | 1.2%(+1.65)#33 | 1.9%(+0.938)#4,355 |
| 34. | 68317 | 2.8% | 1.2%(+1.64)#34 | 1.9%(+0.936)#4,359 |
| 35. | 68130 | 2.8% | 1.2%(+1.62)#35 | 1.9%(+0.913)#4,426 |
| 36. | 68124 | 2.8% | 1.2%(+1.62)#36 | 1.9%(+0.911)#4,430 |
| 37. | 69127 | 2.8% | 1.2%(+1.62)#37 | 1.9%(+0.909)#4,433 |
| 38. | 68044 | 2.8% | 1.2%(+1.60)#38 | 1.9%(+0.893)#4,473 |
| 39. | 69032 | 2.7% | 1.2%(+1.50)#39 | 1.9%(+0.790)#4,803 |
| 40. | 68154 | 2.6% | 1.2%(+1.45)#40 | 1.9%(+0.739)#4,998 |
| 41. | 68007 | 2.6% | 1.2%(+1.44)#41 | 1.9%(+0.727)#5,038 |
| 42. | 68742 | 2.6% | 1.2%(+1.40)#42 | 1.9%(+0.689)#5,160 |
| 43. | 68812 | 2.6% | 1.2%(+1.38)#43 | 1.9%(+0.672)#5,235 |
| 44. | 68114 | 2.4% | 1.2%(+1.22)#44 | 1.9%(+0.512)#5,883 |
| 45. | 69357 | 2.4% | 1.2%(+1.22)#45 | 1.9%(+0.511)#5,885 |
| 46. | 68366 | 2.2% | 1.2%(+1.000)#46 | 1.9%(+0.292)#6,885 |
| 47. | 68022 | 2.1% | 1.2%(+0.919)#47 | 1.9%(+0.211)#7,310 |
| 48. | 68853 | 2.1% | 1.2%(+0.910)#48 | 1.9%(+0.202)#7,353 |
| 49. | 68112 | 2.1% | 1.2%(+0.904)#49 | 1.9%(+0.196)#7,386 |
| 50. | 68733 | 2.1% | 1.2%(+0.903)#50 | 1.9%(+0.195)#7,397 |
| 51. | 68423 | 2.1% | 1.2%(+0.900)#51 | 1.9%(+0.192)#7,401 |
| 52. | 68445 | 2.0% | 1.2%(+0.857)#52 | 1.9%(+0.149)#7,640 |
| 53. | 68978 | 2.0% | 1.2%(+0.827)#53 | 1.9%(+0.119)#7,776 |
| 54. | 68116 | 2.0% | 1.2%(+0.822)#54 | 1.9%(+0.114)#7,803 |
| 55. | 68329 | 2.0% | 1.2%(+0.816)#55 | 1.9%(+0.108)#7,843 |
| 56. | 68048 | 2.0% | 1.2%(+0.798)#56 | 1.9%(+0.090)#7,942 |
| 57. | 68760 | 2.0% | 1.2%(+0.797)#57 | 1.9%(+0.088)#7,947 |
| 58. | 68467 | 2.0% | 1.2%(+0.771)#58 | 1.9%(+0.063)#8,099 |
| 59. | 68849 | 1.9% | 1.2%(+0.734)#59 | 1.9%(+0.026)#8,347 |
| 60. | 68301 | 1.9% | 1.2%(+0.694)#60 | 1.9%(-0.014)#8,618 |
| 61. | 68118 | 1.9% | 1.2%(+0.673)#61 | 1.9%(-0.035)#8,736 |
| 62. | 68817 | 1.9% | 1.2%(+0.668)#62 | 1.9%(-0.040)#8,771 |
| 63. | 68503 | 1.8% | 1.2%(+0.666)#63 | 1.9%(-0.042)#8,790 |
| 64. | 68117 | 1.8% | 1.2%(+0.658)#64 | 1.9%(-0.050)#8,849 |
| 65. | 68057 | 1.8% | 1.2%(+0.658)#65 | 1.9%(-0.050)#8,855 |
| 66. | 68341 | 1.8% | 1.2%(+0.625)#66 | 1.9%(-0.083)#9,069 |
| 67. | 68516 | 1.8% | 1.2%(+0.617)#67 | 1.9%(-0.092)#9,133 |
| 68. | 68406 | 1.8% | 1.2%(+0.610)#68 | 1.9%(-0.098)#9,175 |
| 69. | 68521 | 1.8% | 1.2%(+0.608)#69 | 1.9%(-0.100)#9,186 |
| 70. | 68510 | 1.8% | 1.2%(+0.592)#70 | 1.9%(-0.116)#9,276 |
| 71. | 68532 | 1.8% | 1.2%(+0.581)#71 | 1.9%(-0.127)#9,347 |
| 72. | 68111 | 1.7% | 1.2%(+0.535)#72 | 1.9%(-0.173)#9,629 |
| 73. | 68418 | 1.7% | 1.2%(+0.523)#73 | 1.9%(-0.185)#9,707 |
| 74. | 68023 | 1.7% | 1.2%(+0.470)#74 | 1.9%(-0.238)#10,088 |
| 75. | 68520 | 1.7% | 1.2%(+0.469)#75 | 1.9%(-0.239)#10,095 |
| 76. | 68827 | 1.6% | 1.2%(+0.465)#76 | 1.9%(-0.243)#10,129 |
| 77. | 68959 | 1.6% | 1.2%(+0.446)#77 | 1.9%(-0.262)#10,248 |
| 78. | 69153 | 1.6% | 1.2%(+0.434)#78 | 1.9%(-0.274)#10,326 |
| 79. | 68138 | 1.6% | 1.2%(+0.373)#79 | 1.9%(-0.335)#10,742 |
| 80. | 68137 | 1.5% | 1.2%(+0.356)#80 | 1.9%(-0.352)#10,861 |
| 81. | 68801 | 1.5% | 1.2%(+0.352)#81 | 1.9%(-0.356)#10,885 |
| 82. | 68847 | 1.5% | 1.2%(+0.332)#82 | 1.9%(-0.376)#11,034 |
| 83. | 68005 | 1.5% | 1.2%(+0.327)#83 | 1.9%(-0.382)#11,075 |
| 84. | 68135 | 1.5% | 1.2%(+0.308)#84 | 1.9%(-0.400)#11,223 |
| 85. | 68743 | 1.5% | 1.2%(+0.287)#85 | 1.9%(-0.421)#11,390 |
| 86. | 68157 | 1.5% | 1.2%(+0.287)#86 | 1.9%(-0.422)#11,395 |
| 87. | 68152 | 1.5% | 1.2%(+0.277)#87 | 1.9%(-0.431)#11,476 |
| 88. | 68524 | 1.5% | 1.2%(+0.267)#88 | 1.9%(-0.441)#11,571 |
| 89. | 68716 | 1.4% | 1.2%(+0.263)#89 | 1.9%(-0.445)#11,608 |
| 90. | 68132 | 1.4% | 1.2%(+0.251)#90 | 1.9%(-0.457)#11,713 |
| 91. | 68871 | 1.4% | 1.2%(+0.235)#91 | 1.9%(-0.473)#11,832 |
| 92. | 68147 | 1.4% | 1.2%(+0.227)#92 | 1.9%(-0.481)#11,900 |
| 93. | 68378 | 1.4% | 1.2%(+0.196)#93 | 1.9%(-0.512)#12,143 |
| 94. | 69366 | 1.4% | 1.2%(+0.196)#94 | 1.9%(-0.512)#12,145 |
| 95. | 68134 | 1.4% | 1.2%(+0.193)#95 | 1.9%(-0.515)#12,166 |
| 96. | 68876 | 1.4% | 1.2%(+0.193)#96 | 1.9%(-0.515)#12,168 |
| 97. | 68055 | 1.4% | 1.2%(+0.186)#97 | 1.9%(-0.522)#12,214 |
| 98. | 68067 | 1.4% | 1.2%(+0.177)#98 | 1.9%(-0.531)#12,271 |
| 99. | 68136 | 1.4% | 1.2%(+0.172)#99 | 1.9%(-0.537)#12,308 |
| 100. | 68859 | 1.3% | 1.2%(+0.156)#100 | 1.9%(-0.552)#12,421 |
Common Questions
What are the Top 10 Zip Codes with the Highest Percentage of Population Employed in Real Estate, Rental & Leasing in Nebraska?
Top 10 Zip Codes with the Highest Percentage of Population Employed in Real Estate, Rental & Leasing in Nebraska are:
What zip code has the Highest Percentage of Population Employed in Real Estate, Rental & Leasing in Nebraska?
68753 has the Highest Percentage of Population Employed in Real Estate, Rental & Leasing in Nebraska with 12.5%.
What is the Percentage of Population Employed in Real Estate, Rental & Leasing in the State of Nebraska?
Percentage of Population Employed in Real Estate, Rental & Leasing in Nebraska is 1.2%.
What is the Percentage of Population Employed in Real Estate, Rental & Leasing in the United States?
Percentage of Population Employed in Real Estate, Rental & Leasing in the United States is 1.9%.