Hiram, GA Map & Demographics
Hiram Map
Hiram Overview
$33,952
PER CAPITA INCOME
$98,359
AVG FAMILY INCOME
$81,055
AVG HOUSEHOLD INCOME
6.9%
WAGE / INCOME GAP [ % ]
93.1¢/ $1
WAGE / INCOME GAP [ $ ]
0.29
INEQUALITY / GINI INDEX
4,911
TOTAL POPULATION
2,172
MALE POPULATION
2,739
FEMALE POPULATION
79.30
MALES / 100 FEMALES
126.10
FEMALES / 100 MALES
35.4
MEDIAN AGE
3.8
AVG FAMILY SIZE
2.8
AVG HOUSEHOLD SIZE
2,534
LABOR FORCE [ PEOPLE ]
67.5%
PERCENT IN LABOR FORCE
1.7%
UNEMPLOYMENT RATE
Hiram Zip Codes
Hiram Area Codes
Income in Hiram
Income Overview in Hiram
Per Capita Income in Hiram is $33,952, while median incomes of families and households are $98,359 and $81,055 respectively.
| Characteristic | Number | Measure |
| Per Capita Income | 4,911 | $33,952 |
| Median Family Income | 1,087 | $98,359 |
| Mean Family Income | 1,087 | $101,197 |
| Median Household Income | 1,725 | $81,055 |
| Mean Household Income | 1,725 | $88,844 |
| Income Deficit | 1,087 | $0 |
| Wage / Income Gap (%) | 4,911 | 6.92% |
| Wage / Income Gap ($) | 4,911 | 93.08¢ per $1 |
| Gini / Inequality Index | 4,911 | 0.29 |
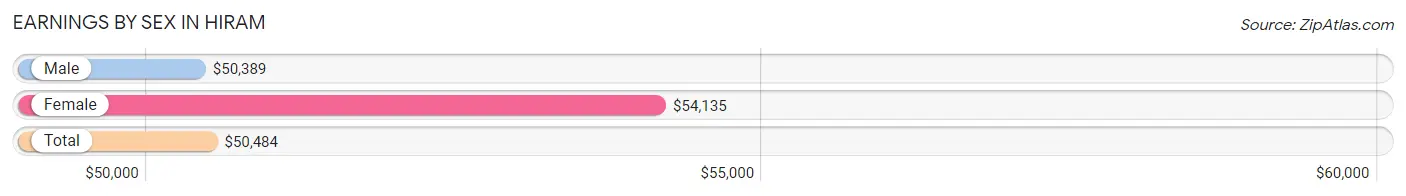
Earnings by Sex in Hiram
Average Earnings in Hiram are $50,484, $50,389 for men and $54,135 for women, a difference of 6.9%.
| Sex | Number | Average Earnings |
| Male | 1,267 (47.9%) | $50,389 |
| Female | 1,377 (52.1%) | $54,135 |
| Total | 2,644 (100.0%) | $50,484 |
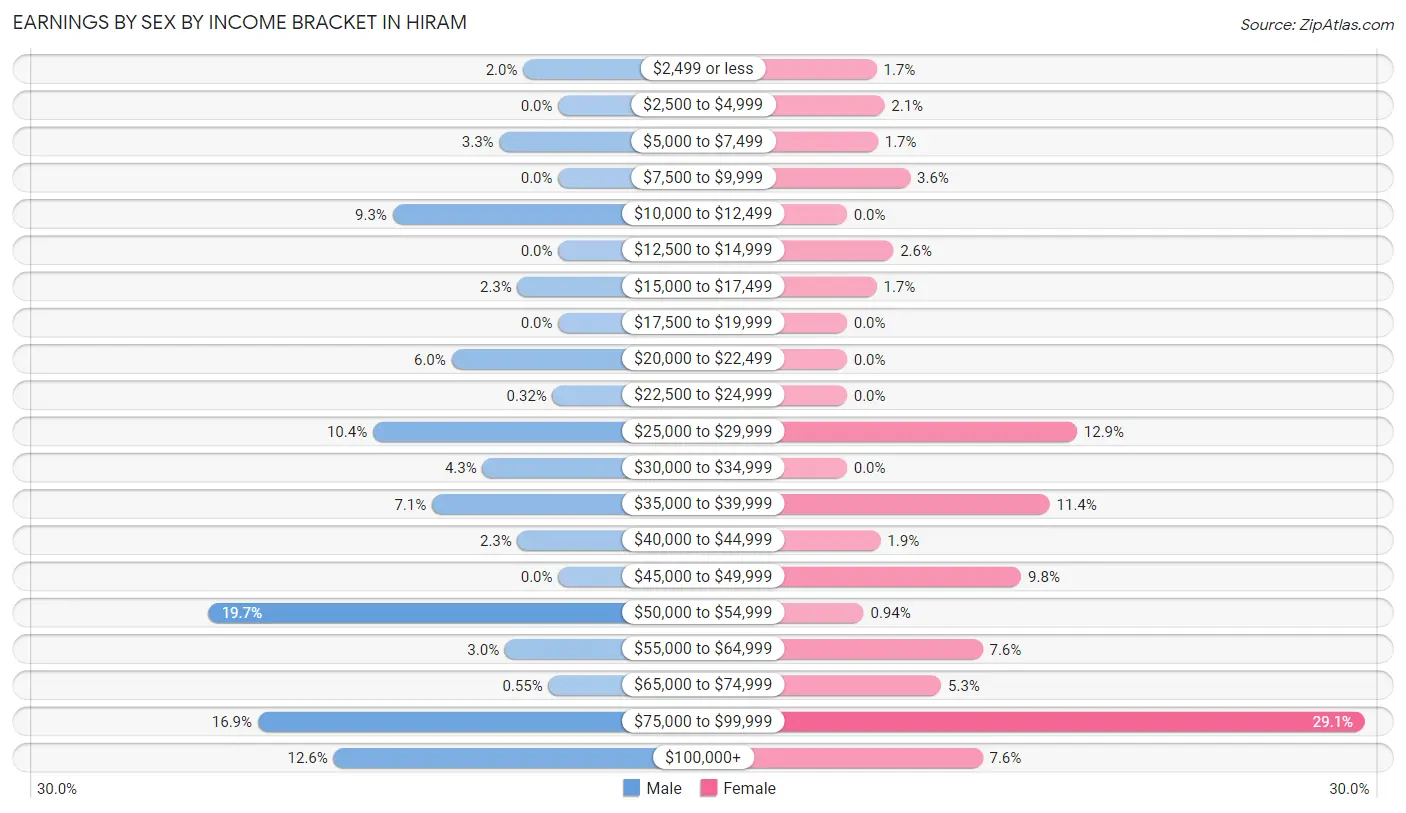
Earnings by Sex by Income Bracket in Hiram
The most common earnings brackets in Hiram are $50,000 to $54,999 for men (249 | 19.7%) and $75,000 to $99,999 for women (401 | 29.1%).
| Income | Male | Female |
| $2,499 or less | 25 (2.0%) | 23 (1.7%) |
| $2,500 to $4,999 | 0 (0.0%) | 29 (2.1%) |
| $5,000 to $7,499 | 42 (3.3%) | 24 (1.7%) |
| $7,500 to $9,999 | 0 (0.0%) | 49 (3.6%) |
| $10,000 to $12,499 | 118 (9.3%) | 0 (0.0%) |
| $12,500 to $14,999 | 0 (0.0%) | 36 (2.6%) |
| $15,000 to $17,499 | 29 (2.3%) | 23 (1.7%) |
| $17,500 to $19,999 | 0 (0.0%) | 0 (0.0%) |
| $20,000 to $22,499 | 76 (6.0%) | 0 (0.0%) |
| $22,500 to $24,999 | 4 (0.3%) | 0 (0.0%) |
| $25,000 to $29,999 | 132 (10.4%) | 178 (12.9%) |
| $30,000 to $34,999 | 54 (4.3%) | 0 (0.0%) |
| $35,000 to $39,999 | 90 (7.1%) | 157 (11.4%) |
| $40,000 to $44,999 | 29 (2.3%) | 26 (1.9%) |
| $45,000 to $49,999 | 0 (0.0%) | 135 (9.8%) |
| $50,000 to $54,999 | 249 (19.7%) | 13 (0.9%) |
| $55,000 to $64,999 | 38 (3.0%) | 105 (7.6%) |
| $65,000 to $74,999 | 7 (0.5%) | 73 (5.3%) |
| $75,000 to $99,999 | 214 (16.9%) | 401 (29.1%) |
| $100,000+ | 160 (12.6%) | 105 (7.6%) |
| Total | 1,267 (100.0%) | 1,377 (100.0%) |
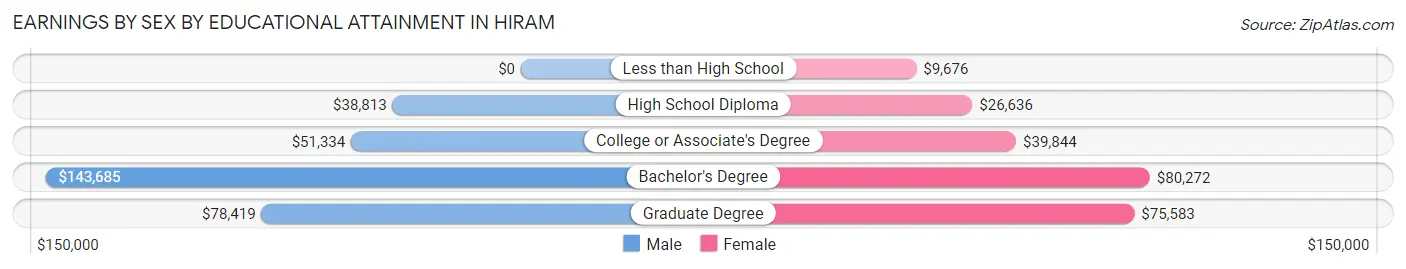
Earnings by Sex by Educational Attainment in Hiram
Average earnings in Hiram are $51,830 for men and $57,216 for women, a difference of 9.4%. Men with an educational attainment of bachelor's degree enjoy the highest average annual earnings of $143,685, while those with high school diploma education earn the least with $38,813. Women with an educational attainment of bachelor's degree earn the most with the average annual earnings of $80,272, while those with less than high school education have the smallest earnings of $9,676.
| Educational Attainment | Male Income | Female Income |
| Less than High School | - | - |
| High School Diploma | $38,813 | $26,636 |
| College or Associate's Degree | $51,334 | $39,844 |
| Bachelor's Degree | $143,685 | $80,272 |
| Graduate Degree | $78,419 | $75,583 |
| Total | $51,830 | $57,216 |
Family Income in Hiram
Family Income Brackets in Hiram
According to the Hiram family income data, there are 313 families falling into the $75,000 to $99,999 income range, which is the most common income bracket and makes up 28.8% of all families.
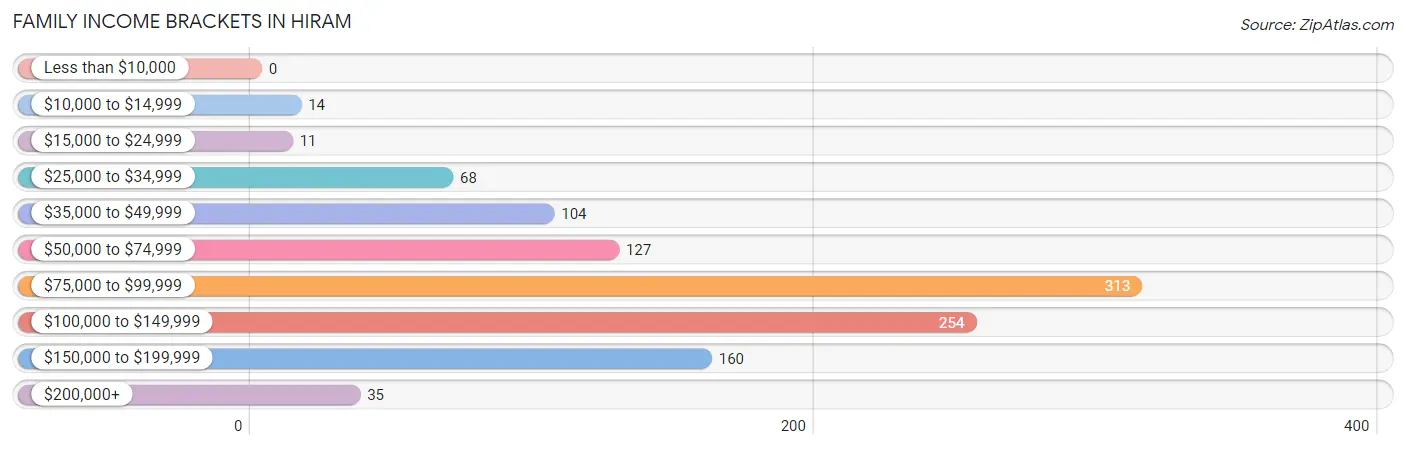
| Income Bracket | # Families | % Families |
| Less than $10,000 | 0 | 0.0% |
| $10,000 to $14,999 | 14 | 1.3% |
| $15,000 to $24,999 | 11 | 1.0% |
| $25,000 to $34,999 | 68 | 6.3% |
| $35,000 to $49,999 | 104 | 9.6% |
| $50,000 to $74,999 | 127 | 11.7% |
| $75,000 to $99,999 | 313 | 28.8% |
| $100,000 to $149,999 | 254 | 23.4% |
| $150,000 to $199,999 | 160 | 14.7% |
| $200,000+ | 35 | 3.2% |
Family Income by Famaliy Size in Hiram
5-person families (212 | 19.5%) account for the highest median family income in Hiram with $139,542 per family, while 2-person families (433 | 39.8%) have the highest median income of $35,432 per family member.
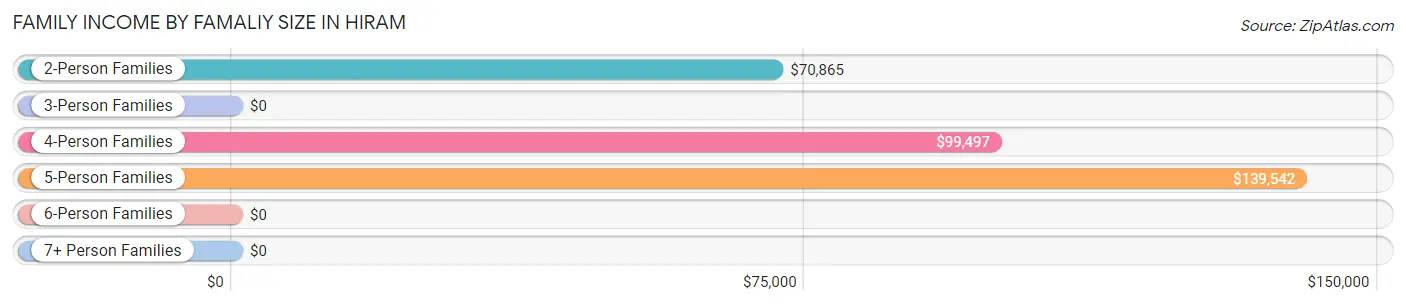
| Income Bracket | # Families | Median Income |
| 2-Person Families | 433 (39.8%) | $70,865 |
| 3-Person Families | 102 (9.4%) | $0 |
| 4-Person Families | 340 (31.3%) | $99,497 |
| 5-Person Families | 212 (19.5%) | $139,542 |
| 6-Person Families | 0 (0.0%) | $0 |
| 7+ Person Families | 0 (0.0%) | $0 |
| Total | 1,087 (100.0%) | $98,359 |
Family Income by Number of Earners in Hiram
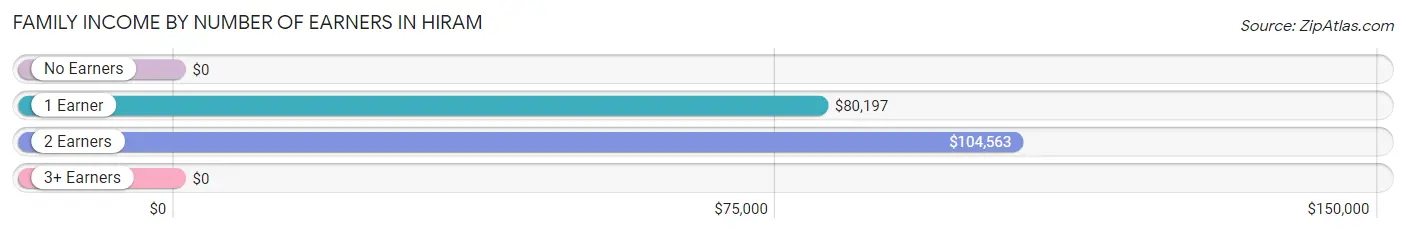
| Number of Earners | # Families | Median Income |
| No Earners | 62 (5.7%) | $0 |
| 1 Earner | 384 (35.3%) | $80,197 |
| 2 Earners | 570 (52.4%) | $104,563 |
| 3+ Earners | 71 (6.5%) | $0 |
| Total | 1,087 (100.0%) | $98,359 |
Household Income in Hiram
Household Income Brackets in Hiram
With 585 households falling in the category, the $75,000 to $99,999 income range is the most frequent in Hiram, accounting for 33.9% of all households. In contrast, only 14 households (0.8%) fall into the $10,000 to $14,999 income bracket, making it the least populous group.
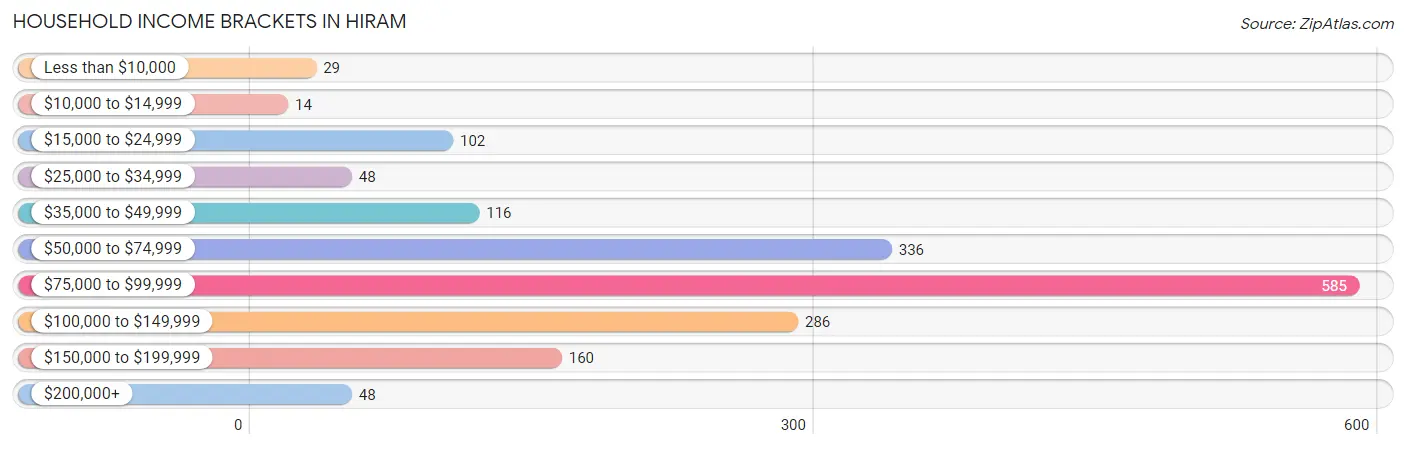
| Income Bracket | # Households | % Households |
| Less than $10,000 | 29 | 1.7% |
| $10,000 to $14,999 | 14 | 0.8% |
| $15,000 to $24,999 | 102 | 5.9% |
| $25,000 to $34,999 | 48 | 2.8% |
| $35,000 to $49,999 | 116 | 6.7% |
| $50,000 to $74,999 | 336 | 19.5% |
| $75,000 to $99,999 | 585 | 33.9% |
| $100,000 to $149,999 | 286 | 16.6% |
| $150,000 to $199,999 | 160 | 9.3% |
| $200,000+ | 48 | 2.8% |
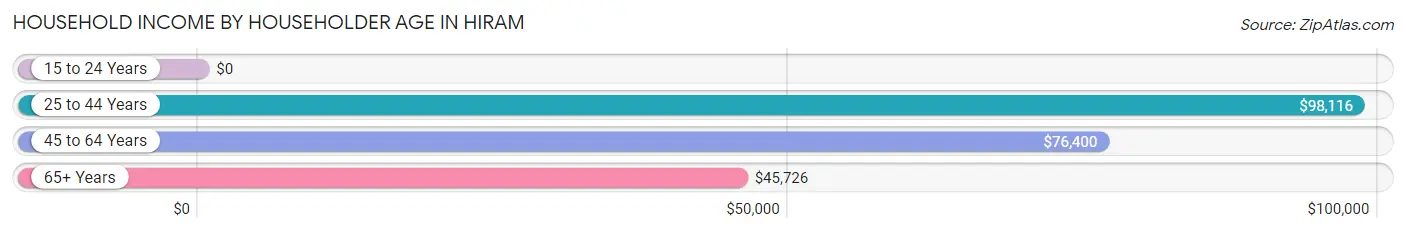
Household Income by Householder Age in Hiram
The median household income in Hiram is $81,055, with the highest median household income of $98,116 found in the 25 to 44 years age bracket for the primary householder. A total of 731 households (42.4%) fall into this category.
| Income Bracket | # Households | Median Income |
| 15 to 24 Years | 0 (0.0%) | $0 |
| 25 to 44 Years | 731 (42.4%) | $98,116 |
| 45 to 64 Years | 722 (41.9%) | $76,400 |
| 65+ Years | 272 (15.8%) | $45,726 |
| Total | 1,725 (100.0%) | $81,055 |
Poverty in Hiram
Income Below Poverty by Sex and Age in Hiram
With 9.8% poverty level for males and 8.5% for females among the residents of Hiram, 6 to 11 year old males and 15 year old females are the most vulnerable to poverty, with 61 males (59.2%) and 26 females (100.0%) in their respective age groups living below the poverty level.
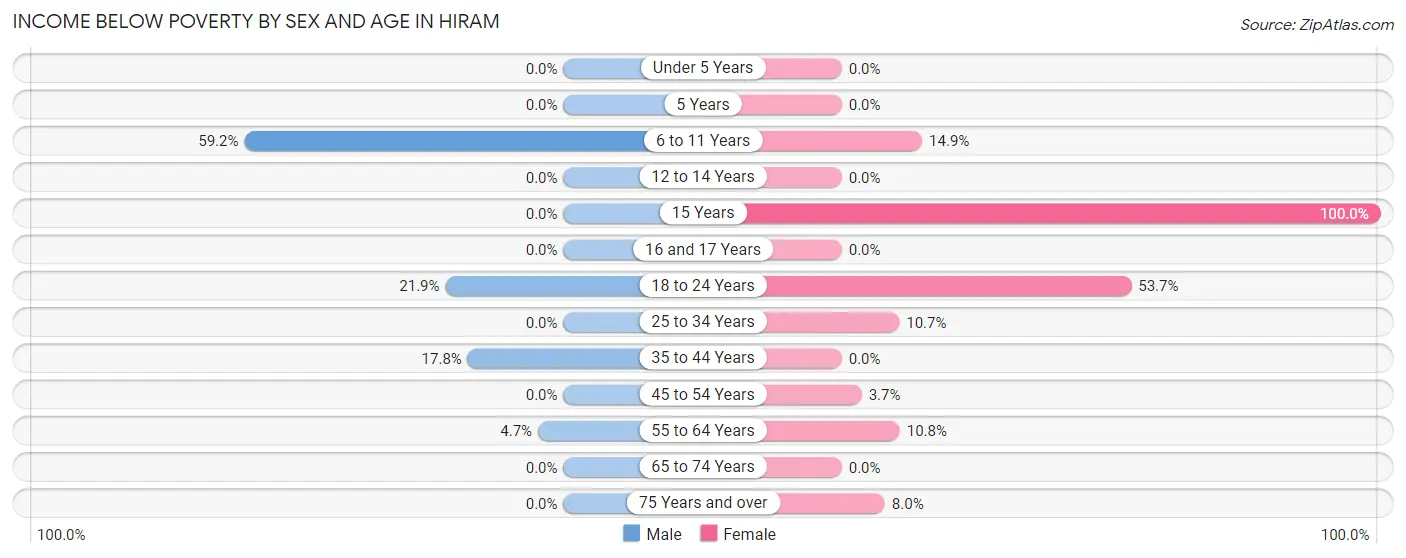
| Age Bracket | Male | Female |
| Under 5 Years | 0 (0.0%) | 0 (0.0%) |
| 5 Years | 0 (0.0%) | 0 (0.0%) |
| 6 to 11 Years | 61 (59.2%) | 64 (14.9%) |
| 12 to 14 Years | 0 (0.0%) | 0 (0.0%) |
| 15 Years | 0 (0.0%) | 26 (100.0%) |
| 16 and 17 Years | 0 (0.0%) | 0 (0.0%) |
| 18 to 24 Years | 60 (21.9%) | 36 (53.7%) |
| 25 to 34 Years | 0 (0.0%) | 48 (10.7%) |
| 35 to 44 Years | 81 (17.8%) | 0 (0.0%) |
| 45 to 54 Years | 0 (0.0%) | 14 (3.7%) |
| 55 to 64 Years | 11 (4.7%) | 37 (10.8%) |
| 65 to 74 Years | 0 (0.0%) | 0 (0.0%) |
| 75 Years and over | 0 (0.0%) | 8 (8.0%) |
| Total | 213 (9.8%) | 233 (8.5%) |
Income Above Poverty by Sex and Age in Hiram
According to the poverty statistics in Hiram, males aged under 5 years and females aged under 5 years are the age groups that are most secure financially, with 100.0% of males and 100.0% of females in these age groups living above the poverty line.
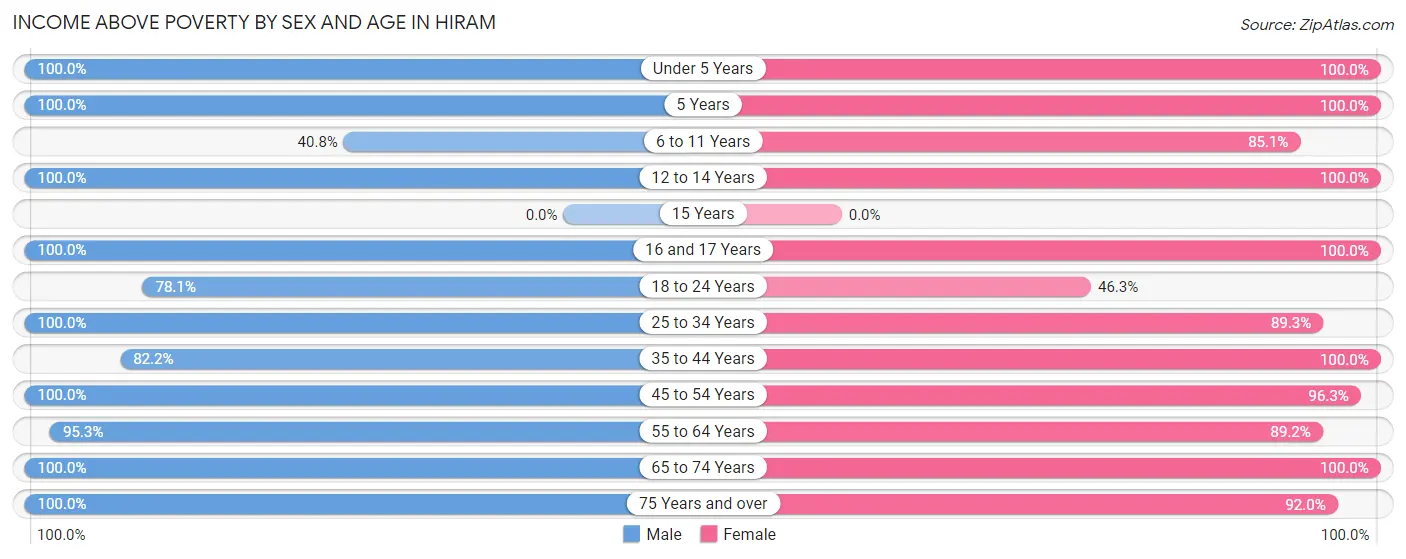
| Age Bracket | Male | Female |
| Under 5 Years | 262 (100.0%) | 173 (100.0%) |
| 5 Years | 7 (100.0%) | 22 (100.0%) |
| 6 to 11 Years | 42 (40.8%) | 365 (85.1%) |
| 12 to 14 Years | 73 (100.0%) | 62 (100.0%) |
| 15 Years | 0 (0.0%) | 0 (0.0%) |
| 16 and 17 Years | 217 (100.0%) | 55 (100.0%) |
| 18 to 24 Years | 214 (78.1%) | 31 (46.3%) |
| 25 to 34 Years | 137 (100.0%) | 402 (89.3%) |
| 35 to 44 Years | 375 (82.2%) | 428 (100.0%) |
| 45 to 54 Years | 195 (100.0%) | 364 (96.3%) |
| 55 to 64 Years | 222 (95.3%) | 307 (89.2%) |
| 65 to 74 Years | 118 (100.0%) | 205 (100.0%) |
| 75 Years and over | 97 (100.0%) | 92 (92.0%) |
| Total | 1,959 (90.2%) | 2,506 (91.5%) |
Income Below Poverty Among Married-Couple Families in Hiram
The poverty statistics for married-couple families in Hiram show that 7.0% or 48 of the total 687 families live below the poverty line. Families with 3 or 4 children have the highest poverty rate of 75.0%, comprising of 48 families. On the other hand, families with no children have the lowest poverty rate of 0.0%, which includes 0 families.
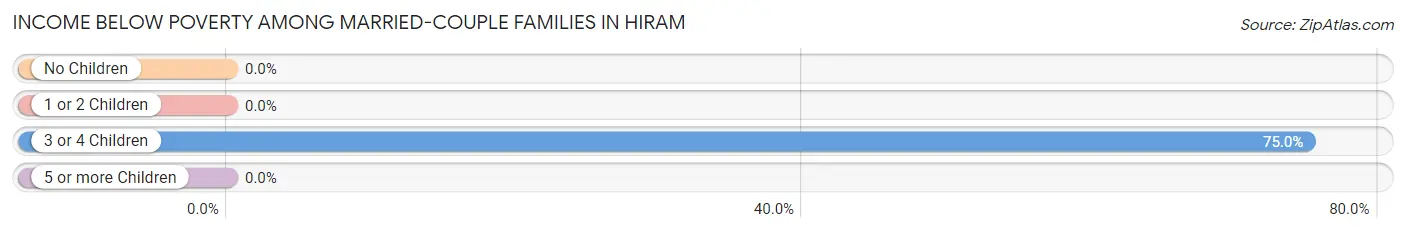
| Children | Above Poverty | Below Poverty |
| No Children | 214 (100.0%) | 0 (0.0%) |
| 1 or 2 Children | 409 (100.0%) | 0 (0.0%) |
| 3 or 4 Children | 16 (25.0%) | 48 (75.0%) |
| 5 or more Children | 0 (0.0%) | 0 (0.0%) |
| Total | 639 (93.0%) | 48 (7.0%) |
Income Below Poverty Among Single-Parent Households in Hiram
According to the poverty data in Hiram, 16.4% or 11 single-father households and 4.2% or 14 single-mother households are living below the poverty line. Among single-father households, those with no children have the highest poverty rate, with 11 households (100.0%) experiencing poverty. Likewise, among single-mother households, those with no children have the highest poverty rate, with 14 households (10.8%) falling below the poverty line.
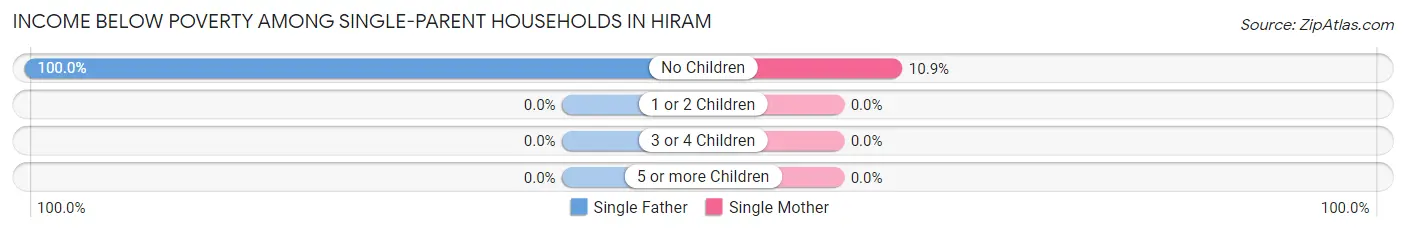
| Children | Single Father | Single Mother |
| No Children | 11 (100.0%) | 14 (10.8%) |
| 1 or 2 Children | 0 (0.0%) | 0 (0.0%) |
| 3 or 4 Children | 0 (0.0%) | 0 (0.0%) |
| 5 or more Children | 0 (0.0%) | 0 (0.0%) |
| Total | 11 (16.4%) | 14 (4.2%) |
Income Below Poverty Among Married-Couple vs Single-Parent Households in Hiram
The poverty data for Hiram shows that 48 of the married-couple family households (7.0%) and 25 of the single-parent households (6.2%) are living below the poverty level. Within the married-couple family households, those with 3 or 4 children have the highest poverty rate, with 48 households (75.0%) falling below the poverty line. Among the single-parent households, those with no children have the highest poverty rate, with 25 household (17.9%) living below poverty.
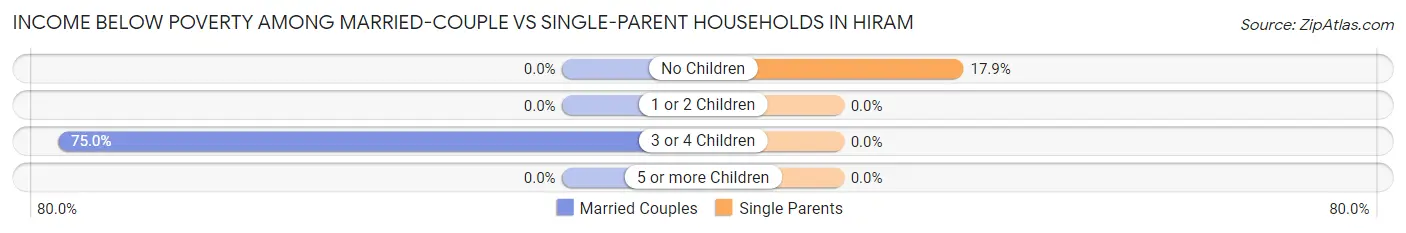
| Children | Married-Couple Families | Single-Parent Households |
| No Children | 0 (0.0%) | 25 (17.9%) |
| 1 or 2 Children | 0 (0.0%) | 0 (0.0%) |
| 3 or 4 Children | 48 (75.0%) | 0 (0.0%) |
| 5 or more Children | 0 (0.0%) | 0 (0.0%) |
| Total | 48 (7.0%) | 25 (6.2%) |
Race in Hiram
The most populous races in Hiram are Black / African American (2,085 | 42.5%), White / Caucasian (1,420 | 28.9%), and Hispanic or Latino (699 | 14.2%).
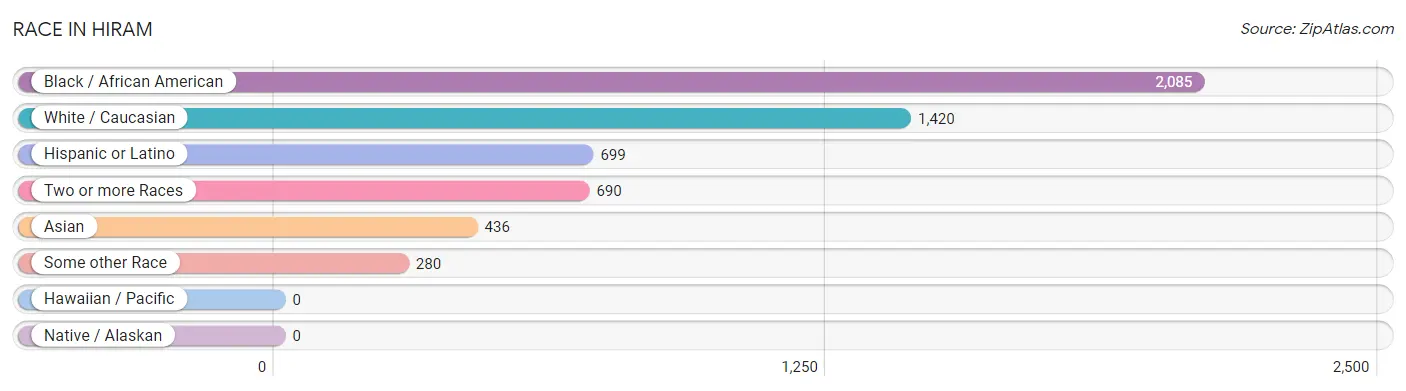
| Race | # Population | % Population |
| Asian | 436 | 8.9% |
| Black / African American | 2,085 | 42.5% |
| Hawaiian / Pacific | 0 | 0.0% |
| Hispanic or Latino | 699 | 14.2% |
| Native / Alaskan | 0 | 0.0% |
| White / Caucasian | 1,420 | 28.9% |
| Two or more Races | 690 | 14.1% |
| Some other Race | 280 | 5.7% |
| Total | 4,911 | 100.0% |
Ancestry in Hiram
The most populous ancestries reported in Hiram are Thai (499 | 10.2%), German (463 | 9.4%), Central American (280 | 5.7%), Honduran (280 | 5.7%), and American (261 | 5.3%), together accounting for 36.3% of all Hiram residents.
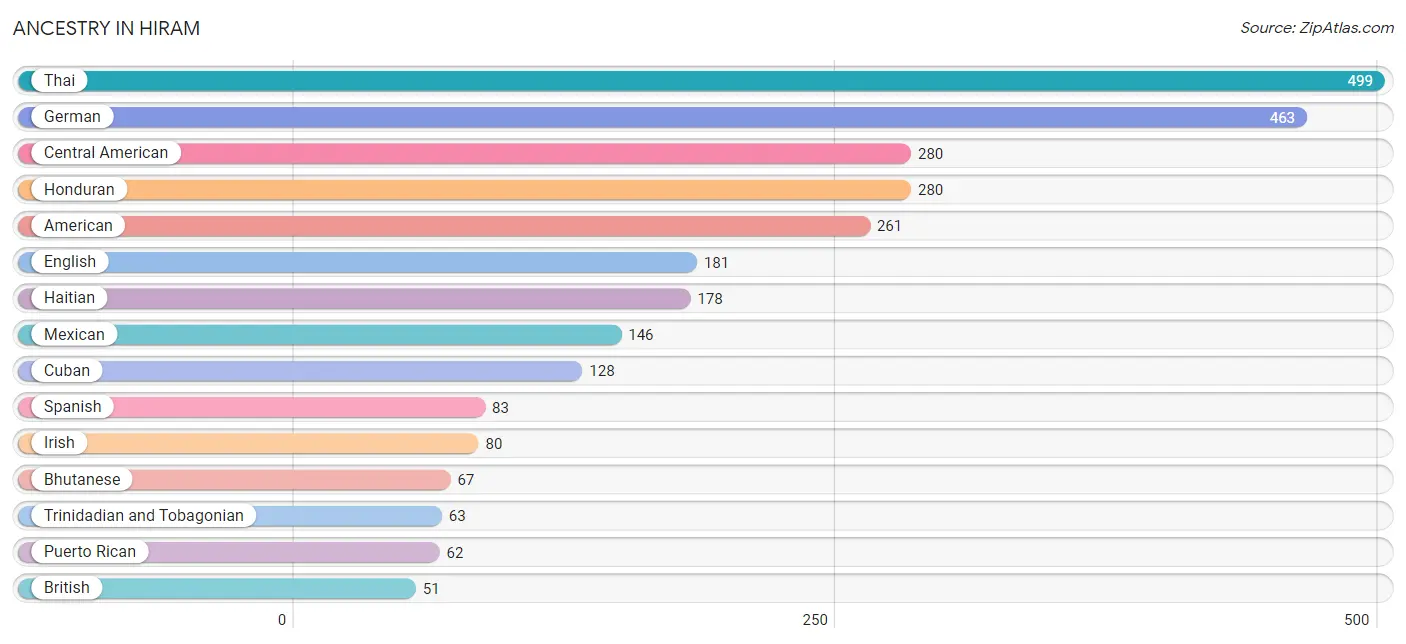
| Ancestry | # Population | % Population |
| American | 261 | 5.3% |
| Bhutanese | 67 | 1.4% |
| British | 51 | 1.0% |
| Central American | 280 | 5.7% |
| Cuban | 128 | 2.6% |
| Dutch | 49 | 1.0% |
| English | 181 | 3.7% |
| European | 9 | 0.2% |
| French | 12 | 0.2% |
| German | 463 | 9.4% |
| Haitian | 178 | 3.6% |
| Honduran | 280 | 5.7% |
| Irish | 80 | 1.6% |
| Italian | 17 | 0.4% |
| Laotian | 49 | 1.0% |
| Mexican | 146 | 3.0% |
| Polish | 42 | 0.9% |
| Portuguese | 17 | 0.4% |
| Puerto Rican | 62 | 1.3% |
| Scottish | 47 | 1.0% |
| Spanish | 83 | 1.7% |
| Thai | 499 | 10.2% |
| Trinidadian and Tobagonian | 63 | 1.3% | View All 23 Rows |
Immigrants in Hiram
The most numerous immigrant groups reported in Hiram came from Latin America (451 | 9.2%), Asia (424 | 8.6%), India (375 | 7.6%), South Central Asia (375 | 7.6%), and Central America (284 | 5.8%), together accounting for 38.9% of all Hiram residents.
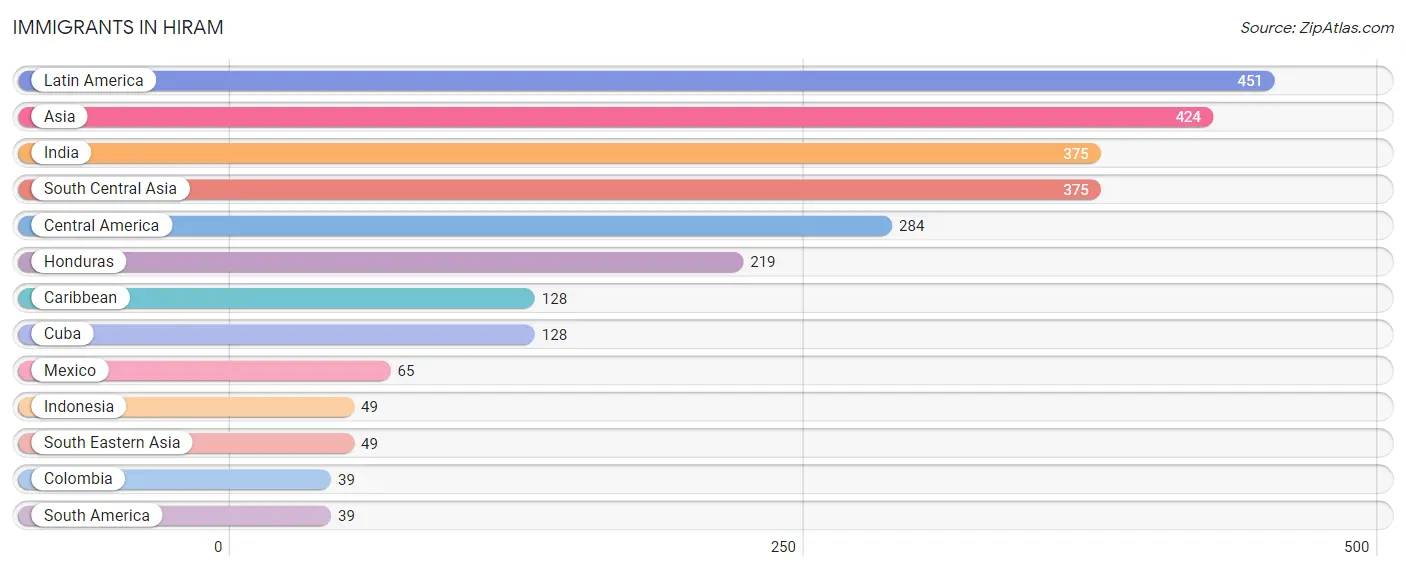
| Immigration Origin | # Population | % Population |
| Asia | 424 | 8.6% |
| Caribbean | 128 | 2.6% |
| Central America | 284 | 5.8% |
| Colombia | 39 | 0.8% |
| Cuba | 128 | 2.6% |
| Honduras | 219 | 4.5% |
| India | 375 | 7.6% |
| Indonesia | 49 | 1.0% |
| Latin America | 451 | 9.2% |
| Mexico | 65 | 1.3% |
| South America | 39 | 0.8% |
| South Central Asia | 375 | 7.6% |
| South Eastern Asia | 49 | 1.0% | View All 13 Rows |
Sex and Age in Hiram
Sex and Age in Hiram
The most populous age groups in Hiram are 35 to 39 Years (320 | 14.7%) for men and 35 to 39 Years (396 | 14.5%) for women.
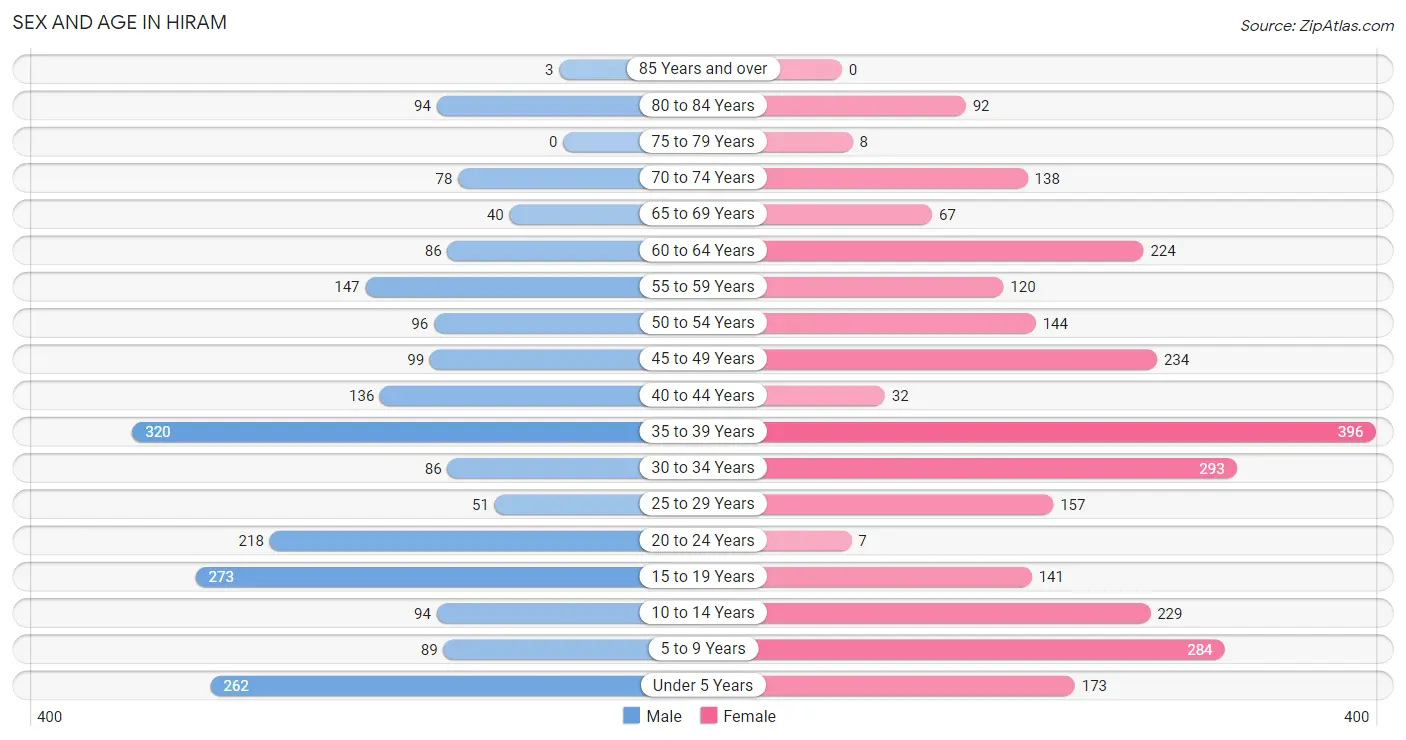
| Age Bracket | Male | Female |
| Under 5 Years | 262 (12.1%) | 173 (6.3%) |
| 5 to 9 Years | 89 (4.1%) | 284 (10.4%) |
| 10 to 14 Years | 94 (4.3%) | 229 (8.4%) |
| 15 to 19 Years | 273 (12.6%) | 141 (5.1%) |
| 20 to 24 Years | 218 (10.0%) | 7 (0.3%) |
| 25 to 29 Years | 51 (2.4%) | 157 (5.7%) |
| 30 to 34 Years | 86 (4.0%) | 293 (10.7%) |
| 35 to 39 Years | 320 (14.7%) | 396 (14.5%) |
| 40 to 44 Years | 136 (6.3%) | 32 (1.2%) |
| 45 to 49 Years | 99 (4.6%) | 234 (8.5%) |
| 50 to 54 Years | 96 (4.4%) | 144 (5.3%) |
| 55 to 59 Years | 147 (6.8%) | 120 (4.4%) |
| 60 to 64 Years | 86 (4.0%) | 224 (8.2%) |
| 65 to 69 Years | 40 (1.8%) | 67 (2.5%) |
| 70 to 74 Years | 78 (3.6%) | 138 (5.0%) |
| 75 to 79 Years | 0 (0.0%) | 8 (0.3%) |
| 80 to 84 Years | 94 (4.3%) | 92 (3.4%) |
| 85 Years and over | 3 (0.1%) | 0 (0.0%) |
| Total | 2,172 (100.0%) | 2,739 (100.0%) |
Families and Households in Hiram
Median Family Size in Hiram
The median family size in Hiram is 3.76 persons per family, with single male/father families (67 | 6.2%) accounting for the largest median family size of 4.24 persons per family. On the other hand, single female/mother families (333 | 30.6%) represent the smallest median family size with 2.81 persons per family.
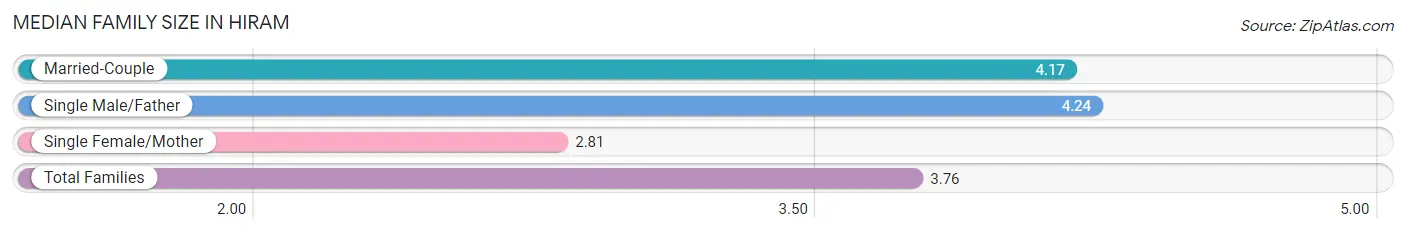
| Family Type | # Families | Family Size |
| Married-Couple | 687 (63.2%) | 4.17 |
| Single Male/Father | 67 (6.2%) | 4.24 |
| Single Female/Mother | 333 (30.6%) | 2.81 |
| Total Families | 1,087 (100.0%) | 3.76 |
Median Household Size in Hiram
The median household size in Hiram is 2.84 persons per household, with single male/father households (67 | 3.9%) accounting for the largest median household size of 4.49 persons per household. non-family households (638 | 37.0%) represent the smallest median household size with 1.14 persons per household.
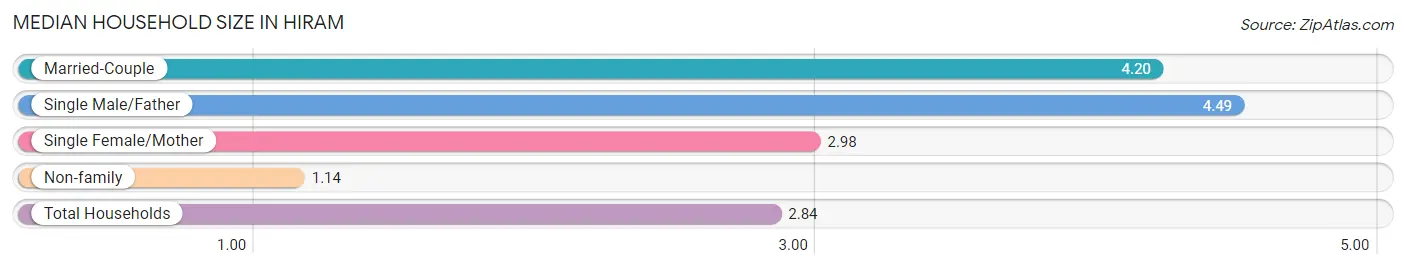
| Household Type | # Households | Household Size |
| Married-Couple | 687 (39.8%) | 4.20 |
| Single Male/Father | 67 (3.9%) | 4.49 |
| Single Female/Mother | 333 (19.3%) | 2.98 |
| Non-family | 638 (37.0%) | 1.14 |
| Total Households | 1,725 (100.0%) | 2.84 |
Household Size by Marriage Status in Hiram
Out of a total of 1,725 households in Hiram, 1,087 (63.0%) are family households, while 638 (37.0%) are nonfamily households. The most numerous type of family households are 2-person households, comprising 412, and the most common type of nonfamily households are 1-person households, comprising 577.
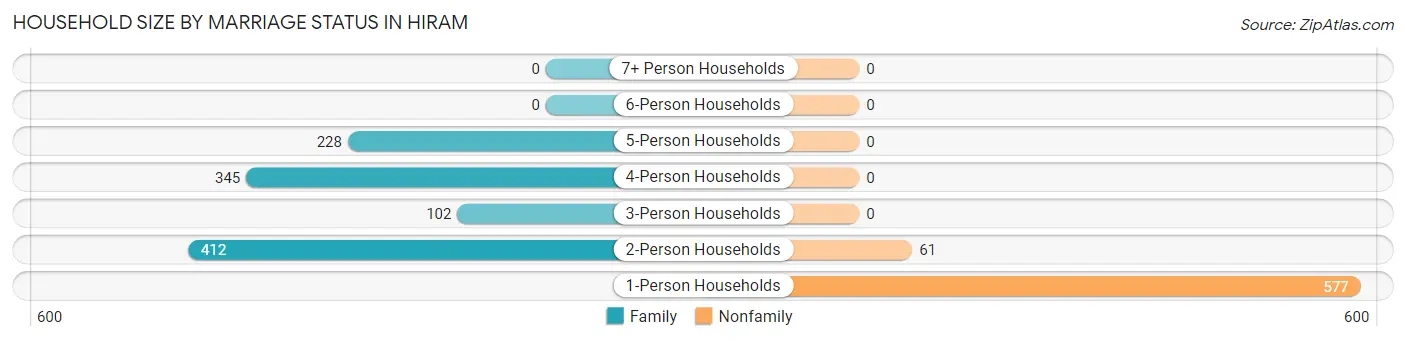
| Household Size | Family Households | Nonfamily Households |
| 1-Person Households | - | 577 (33.5%) |
| 2-Person Households | 412 (23.9%) | 61 (3.5%) |
| 3-Person Households | 102 (5.9%) | 0 (0.0%) |
| 4-Person Households | 345 (20.0%) | 0 (0.0%) |
| 5-Person Households | 228 (13.2%) | 0 (0.0%) |
| 6-Person Households | 0 (0.0%) | 0 (0.0%) |
| 7+ Person Households | 0 (0.0%) | 0 (0.0%) |
| Total | 1,087 (63.0%) | 638 (37.0%) |
Female Fertility in Hiram
Fertility by Age in Hiram
Average fertility rate in Hiram is 87.0 births per 1,000 women. Women in the age bracket of 20 to 34 years have the highest fertility rate with 241.0 births per 1,000 women. Women in the age bracket of 20 to 34 years acount for 100.0% of all women with births.
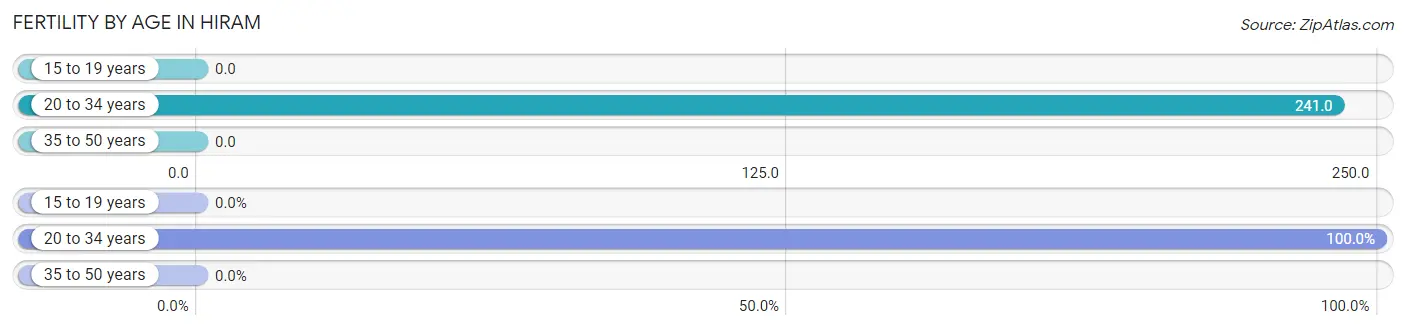
| Age Bracket | Women with Births | Births / 1,000 Women |
| 15 to 19 years | 0 (0.0%) | 0.0 |
| 20 to 34 years | 110 (100.0%) | 241.0 |
| 35 to 50 years | 0 (0.0%) | 0.0 |
| Total | 110 (100.0%) | 87.0 |
Fertility by Age by Marriage Status in Hiram
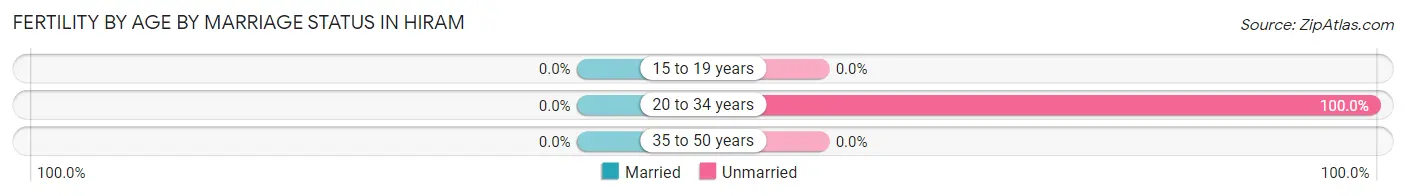
| Age Bracket | Married | Unmarried |
| 15 to 19 years | 0 (0.0%) | 0 (0.0%) |
| 20 to 34 years | 0 (0.0%) | 110 (100.0%) |
| 35 to 50 years | 0 (0.0%) | 0 (0.0%) |
| Total | 0 (0.0%) | 110 (100.0%) |
Fertility by Education in Hiram
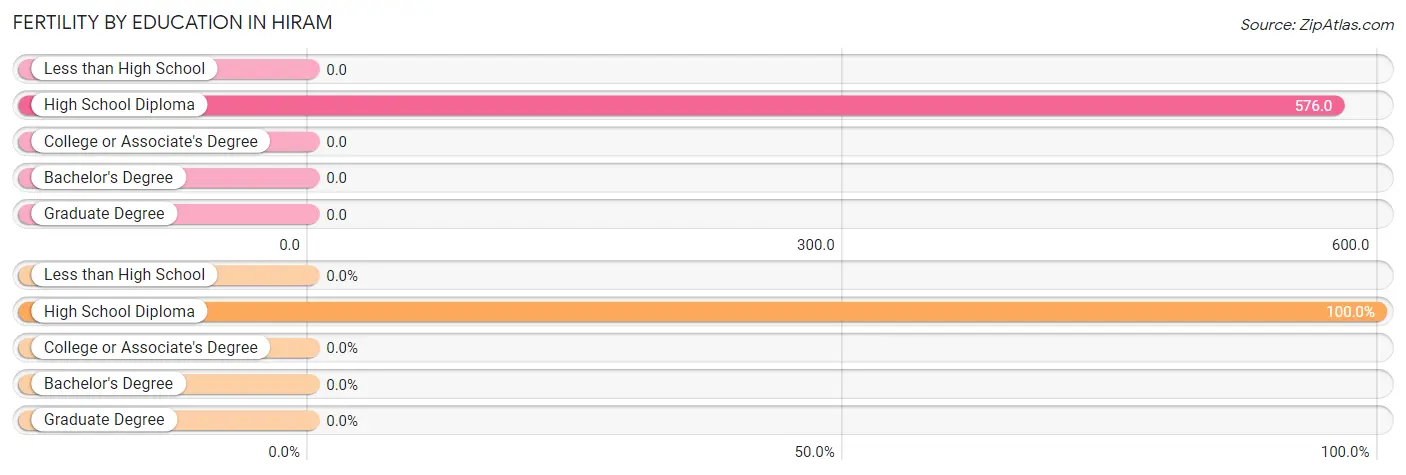
| Educational Attainment | Women with Births | Births / 1,000 Women |
| Less than High School | 0 (0.0%) | 0.0 |
| High School Diploma | 110 (100.0%) | 576.0 |
| College or Associate's Degree | 0 (0.0%) | 0.0 |
| Bachelor's Degree | 0 (0.0%) | 0.0 |
| Graduate Degree | 0 (0.0%) | 0.0 |
| Total | 110 (100.0%) | 87.0 |
Fertility by Education by Marriage Status in Hiram
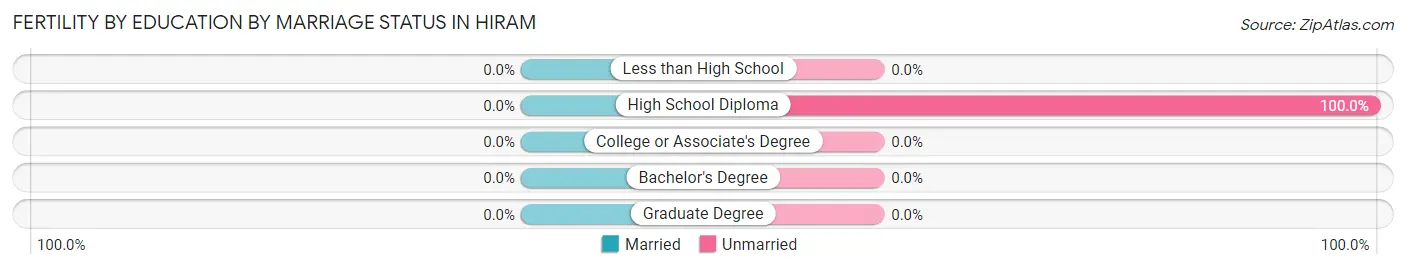
| Educational Attainment | Married | Unmarried |
| Less than High School | 0 (0.0%) | 0 (0.0%) |
| High School Diploma | 0 (0.0%) | 110 (100.0%) |
| College or Associate's Degree | 0 (0.0%) | 0 (0.0%) |
| Bachelor's Degree | 0 (0.0%) | 0 (0.0%) |
| Graduate Degree | 0 (0.0%) | 0 (0.0%) |
| Total | 0 (0.0%) | 110 (100.0%) |
Employment Characteristics in Hiram
Employment by Class of Employer in Hiram
Among the 2,491 employed individuals in Hiram, private company employees (1,828 | 73.4%), local government employees (210 | 8.4%), and self-employed (incorporated) (153 | 6.1%) make up the most common classes of employment.
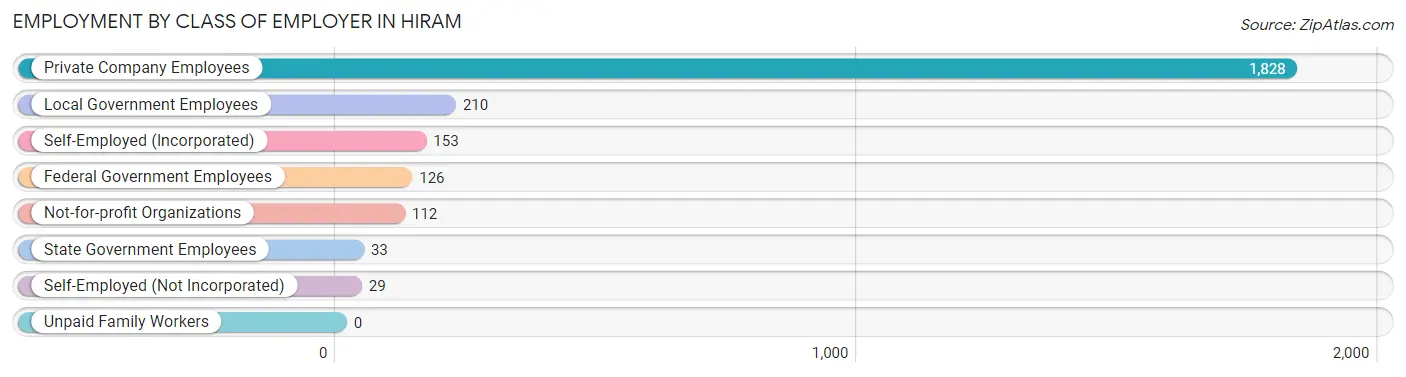
| Employer Class | # Employees | % Employees |
| Private Company Employees | 1,828 | 73.4% |
| Self-Employed (Incorporated) | 153 | 6.1% |
| Self-Employed (Not Incorporated) | 29 | 1.2% |
| Not-for-profit Organizations | 112 | 4.5% |
| Local Government Employees | 210 | 8.4% |
| State Government Employees | 33 | 1.3% |
| Federal Government Employees | 126 | 5.1% |
| Unpaid Family Workers | 0 | 0.0% |
| Total | 2,491 | 100.0% |
Employment Status by Age in Hiram
According to the labor force statistics for Hiram, out of the total population over 16 years of age (3,754), 67.5% or 2,534 individuals are in the labor force, with 1.7% or 43 of them unemployed. The age group with the highest labor force participation rate is 25 to 29 years, with 100.0% or 208 individuals in the labor force. Within the labor force, the 35 to 44 years age range has the highest percentage of unemployed individuals, with 4.9% or 40 of them being unemployed.
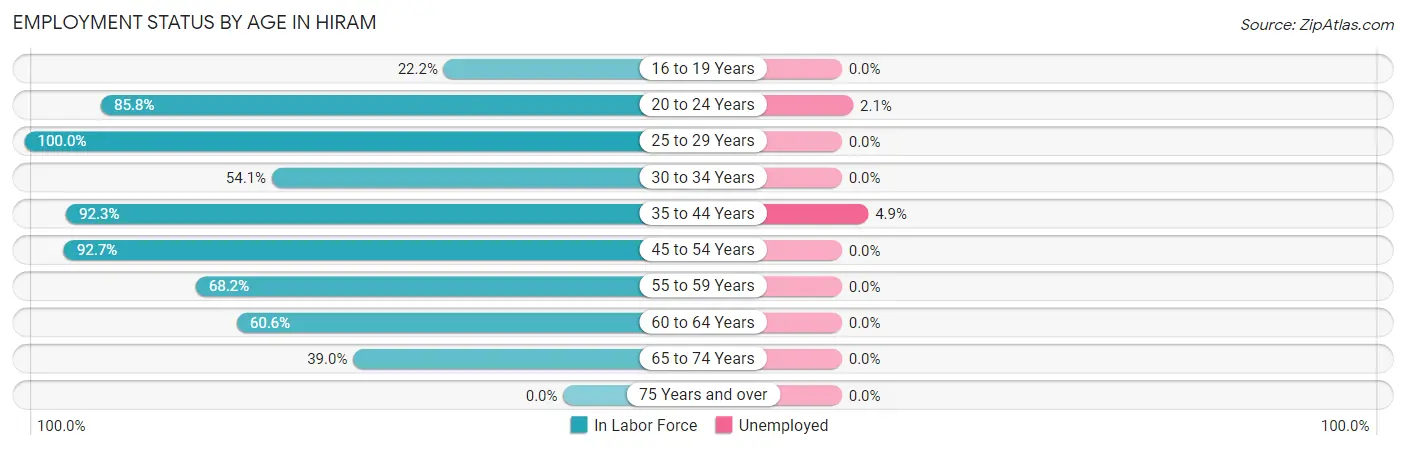
| Age Bracket | In Labor Force | Unemployed |
| 16 to 19 Years | 86 (22.2%) | 0 (0.0%) |
| 20 to 24 Years | 193 (85.8%) | 4 (2.1%) |
| 25 to 29 Years | 208 (100.0%) | 0 (0.0%) |
| 30 to 34 Years | 205 (54.1%) | 0 (0.0%) |
| 35 to 44 Years | 816 (92.3%) | 40 (4.9%) |
| 45 to 54 Years | 531 (92.7%) | 0 (0.0%) |
| 55 to 59 Years | 182 (68.2%) | 0 (0.0%) |
| 60 to 64 Years | 188 (60.6%) | 0 (0.0%) |
| 65 to 74 Years | 126 (39.0%) | 0 (0.0%) |
| 75 Years and over | 0 (0.0%) | 0 (0.0%) |
| Total | 2,534 (67.5%) | 43 (1.7%) |
Employment Status by Educational Attainment in Hiram
According to labor force statistics for Hiram, 81.3% of individuals (2,131) out of the total population between 25 and 64 years of age (2,621) are in the labor force, with 1.9% or 40 of them being unemployed. The group with the highest labor force participation rate are those with the educational attainment of college / associate degree, with 95.8% or 917 individuals in the labor force. Within the labor force, individuals with high school diploma education have the highest percentage of unemployment, with 14.7% or 40 of them being unemployed.
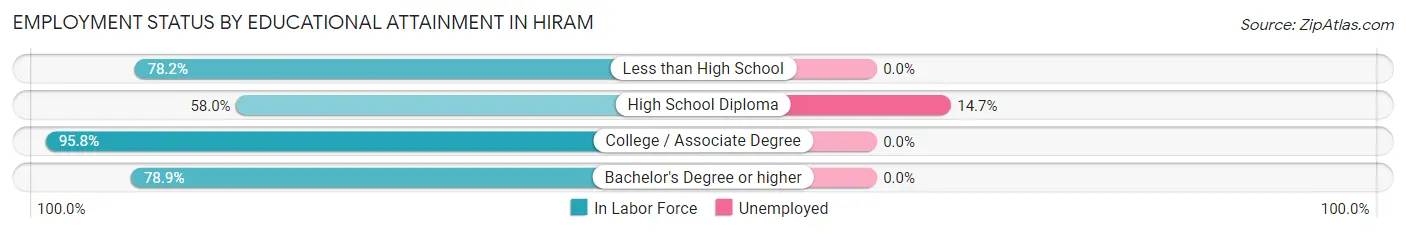
| Educational Attainment | In Labor Force | Unemployed |
| Less than High School | 104 (78.2%) | 0 (0.0%) |
| High School Diploma | 273 (58.0%) | 69 (14.7%) |
| College / Associate Degree | 917 (95.8%) | 0 (0.0%) |
| Bachelor's Degree or higher | 836 (78.9%) | 0 (0.0%) |
| Total | 2,131 (81.3%) | 50 (1.9%) |
Employment Occupations by Sex in Hiram
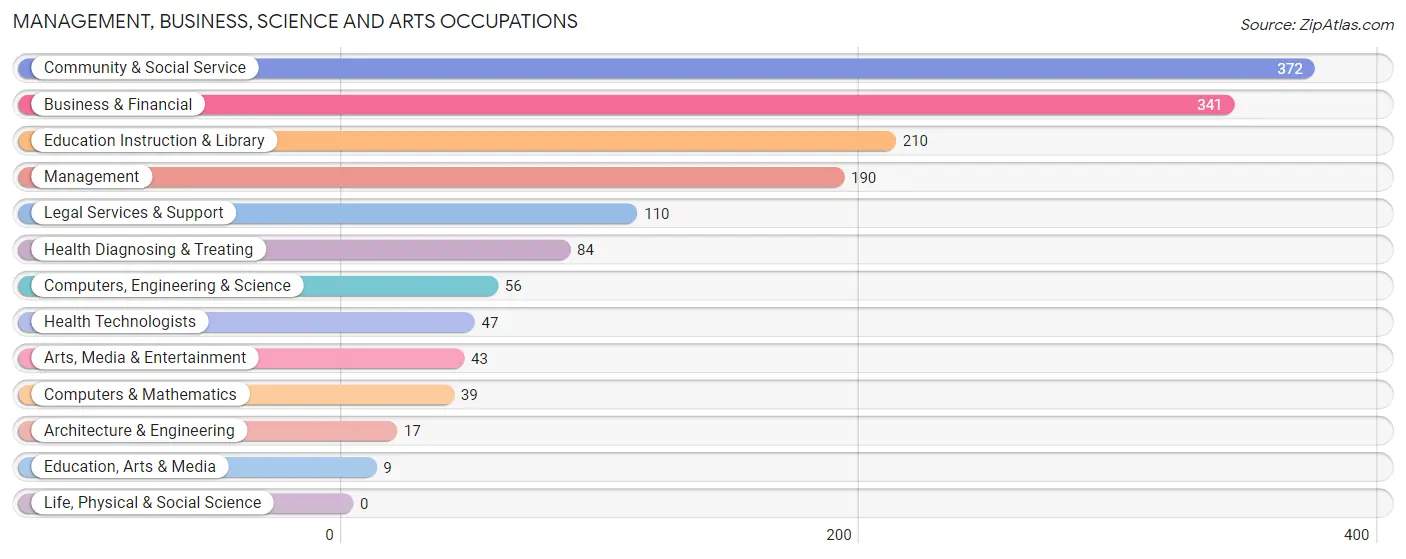
Management, Business, Science and Arts Occupations
The most common Management, Business, Science and Arts occupations in Hiram are Community & Social Service (372 | 14.9%), Business & Financial (341 | 13.7%), Education Instruction & Library (210 | 8.4%), Management (190 | 7.6%), and Legal Services & Support (110 | 4.4%).
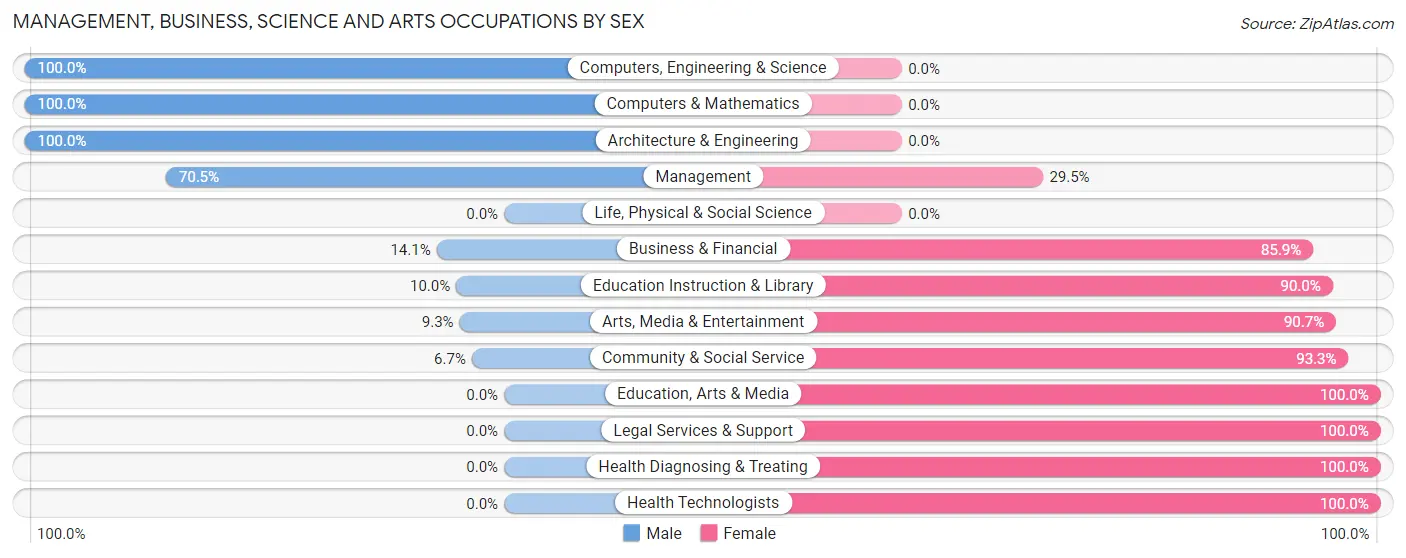
Management, Business, Science and Arts Occupations by Sex
Within the Management, Business, Science and Arts occupations in Hiram, the most male-oriented occupations are Computers, Engineering & Science (100.0%), Computers & Mathematics (100.0%), and Architecture & Engineering (100.0%), while the most female-oriented occupations are Education, Arts & Media (100.0%), Legal Services & Support (100.0%), and Health Diagnosing & Treating (100.0%).
| Occupation | Male | Female |
| Management | 134 (70.5%) | 56 (29.5%) |
| Business & Financial | 48 (14.1%) | 293 (85.9%) |
| Computers, Engineering & Science | 56 (100.0%) | 0 (0.0%) |
| Computers & Mathematics | 39 (100.0%) | 0 (0.0%) |
| Architecture & Engineering | 17 (100.0%) | 0 (0.0%) |
| Life, Physical & Social Science | 0 (0.0%) | 0 (0.0%) |
| Community & Social Service | 25 (6.7%) | 347 (93.3%) |
| Education, Arts & Media | 0 (0.0%) | 9 (100.0%) |
| Legal Services & Support | 0 (0.0%) | 110 (100.0%) |
| Education Instruction & Library | 21 (10.0%) | 189 (90.0%) |
| Arts, Media & Entertainment | 4 (9.3%) | 39 (90.7%) |
| Health Diagnosing & Treating | 0 (0.0%) | 84 (100.0%) |
| Health Technologists | 0 (0.0%) | 47 (100.0%) |
| Total (Category) | 263 (25.2%) | 780 (74.8%) |
| Total (Overall) | 1,186 (47.6%) | 1,305 (52.4%) |
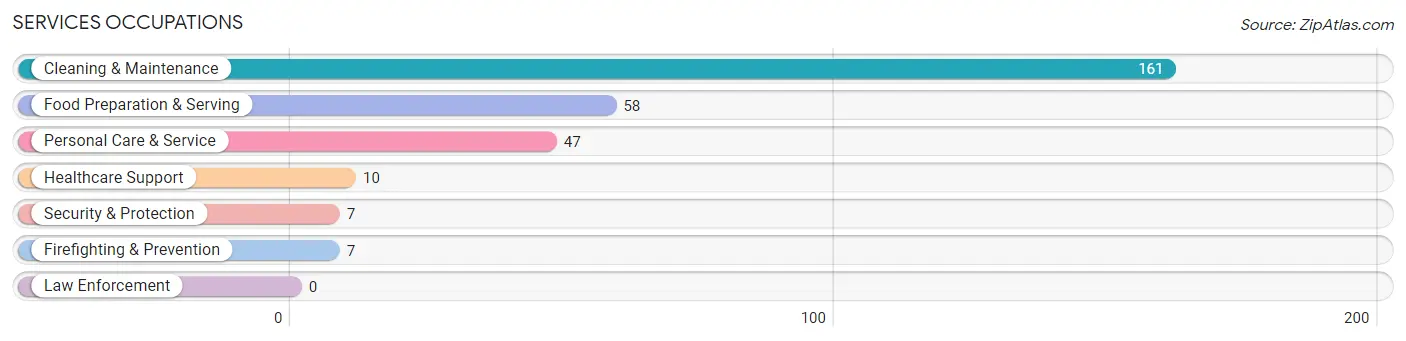
Services Occupations
The most common Services occupations in Hiram are Cleaning & Maintenance (161 | 6.5%), Food Preparation & Serving (58 | 2.3%), Personal Care & Service (47 | 1.9%), Healthcare Support (10 | 0.4%), and Security & Protection (7 | 0.3%).
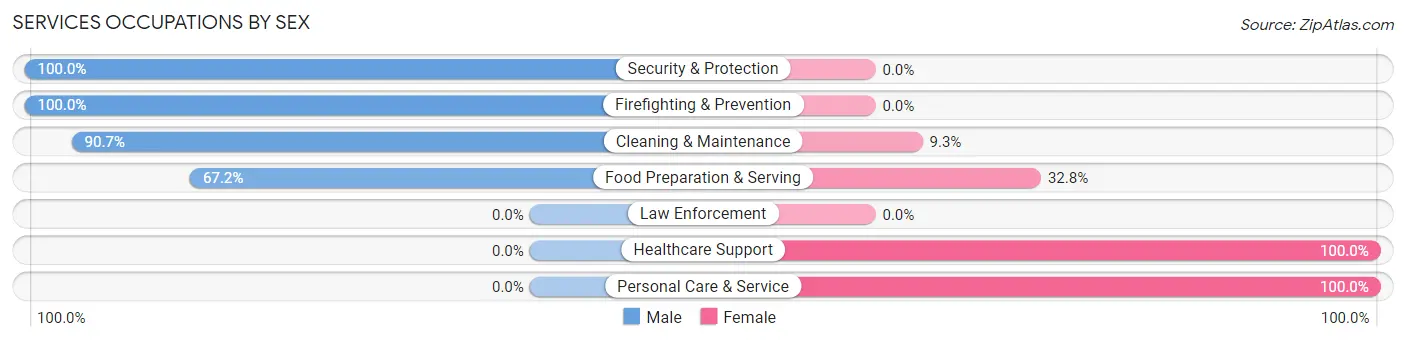
Services Occupations by Sex
Within the Services occupations in Hiram, the most male-oriented occupations are Security & Protection (100.0%), Firefighting & Prevention (100.0%), and Cleaning & Maintenance (90.7%), while the most female-oriented occupations are Healthcare Support (100.0%), Personal Care & Service (100.0%), and Food Preparation & Serving (32.8%).
| Occupation | Male | Female |
| Healthcare Support | 0 (0.0%) | 10 (100.0%) |
| Security & Protection | 7 (100.0%) | 0 (0.0%) |
| Firefighting & Prevention | 7 (100.0%) | 0 (0.0%) |
| Law Enforcement | 0 (0.0%) | 0 (0.0%) |
| Food Preparation & Serving | 39 (67.2%) | 19 (32.8%) |
| Cleaning & Maintenance | 146 (90.7%) | 15 (9.3%) |
| Personal Care & Service | 0 (0.0%) | 47 (100.0%) |
| Total (Category) | 192 (67.8%) | 91 (32.2%) |
| Total (Overall) | 1,186 (47.6%) | 1,305 (52.4%) |
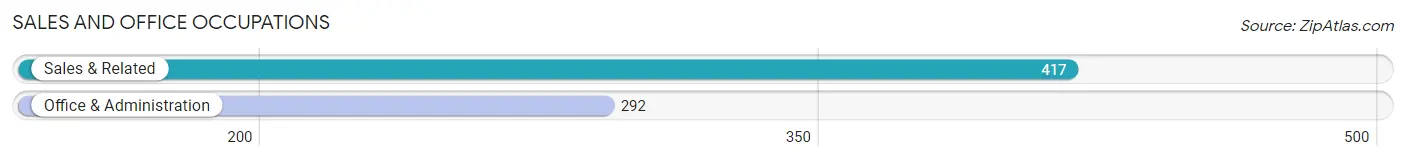
Sales and Office Occupations
The most common Sales and Office occupations in Hiram are Sales & Related (417 | 16.7%), and Office & Administration (292 | 11.7%).
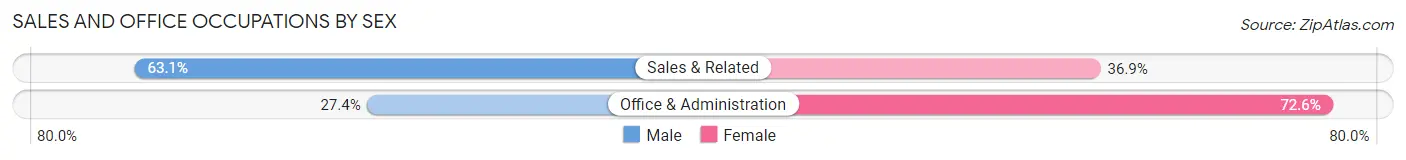
Sales and Office Occupations by Sex
| Occupation | Male | Female |
| Sales & Related | 263 (63.1%) | 154 (36.9%) |
| Office & Administration | 80 (27.4%) | 212 (72.6%) |
| Total (Category) | 343 (48.4%) | 366 (51.6%) |
| Total (Overall) | 1,186 (47.6%) | 1,305 (52.4%) |
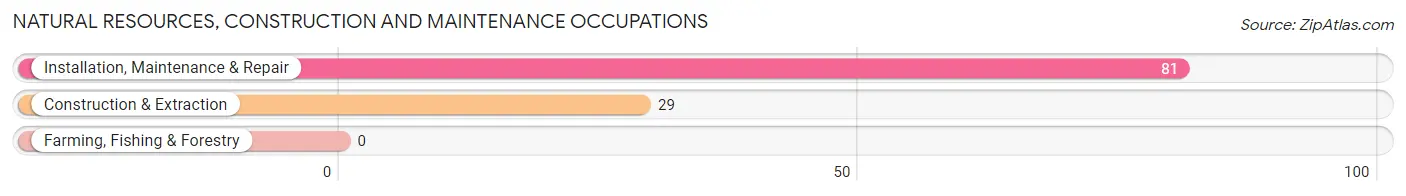
Natural Resources, Construction and Maintenance Occupations
The most common Natural Resources, Construction and Maintenance occupations in Hiram are Installation, Maintenance & Repair (81 | 3.3%), and Construction & Extraction (29 | 1.2%).
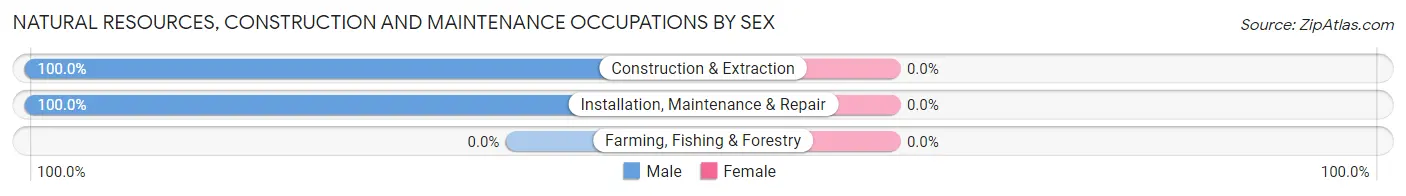
Natural Resources, Construction and Maintenance Occupations by Sex
| Occupation | Male | Female |
| Farming, Fishing & Forestry | 0 (0.0%) | 0 (0.0%) |
| Construction & Extraction | 29 (100.0%) | 0 (0.0%) |
| Installation, Maintenance & Repair | 81 (100.0%) | 0 (0.0%) |
| Total (Category) | 110 (100.0%) | 0 (0.0%) |
| Total (Overall) | 1,186 (47.6%) | 1,305 (52.4%) |
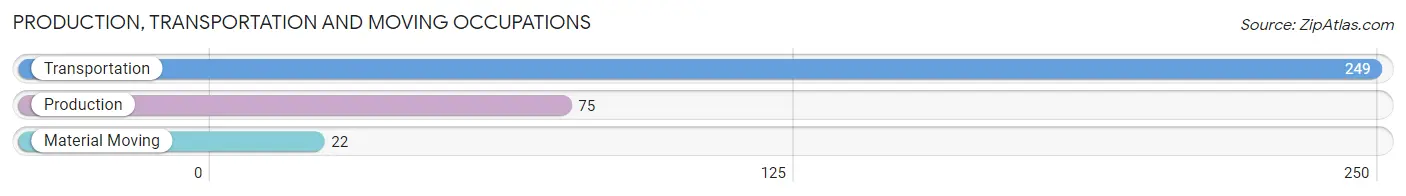
Production, Transportation and Moving Occupations
The most common Production, Transportation and Moving occupations in Hiram are Transportation (249 | 10.0%), Production (75 | 3.0%), and Material Moving (22 | 0.9%).
Production, Transportation and Moving Occupations by Sex
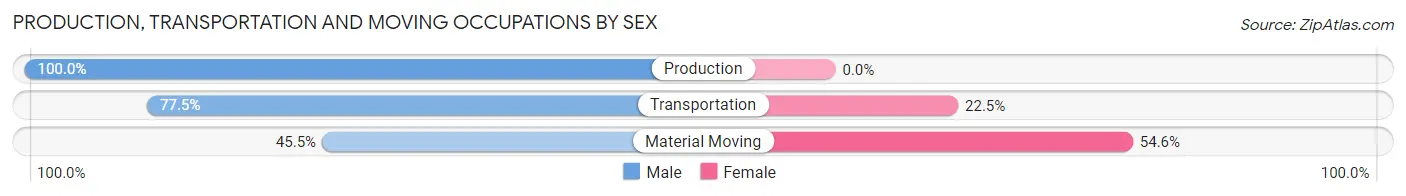
| Occupation | Male | Female |
| Production | 75 (100.0%) | 0 (0.0%) |
| Transportation | 193 (77.5%) | 56 (22.5%) |
| Material Moving | 10 (45.5%) | 12 (54.5%) |
| Total (Category) | 278 (80.3%) | 68 (19.7%) |
| Total (Overall) | 1,186 (47.6%) | 1,305 (52.4%) |
Employment Industries by Sex in Hiram
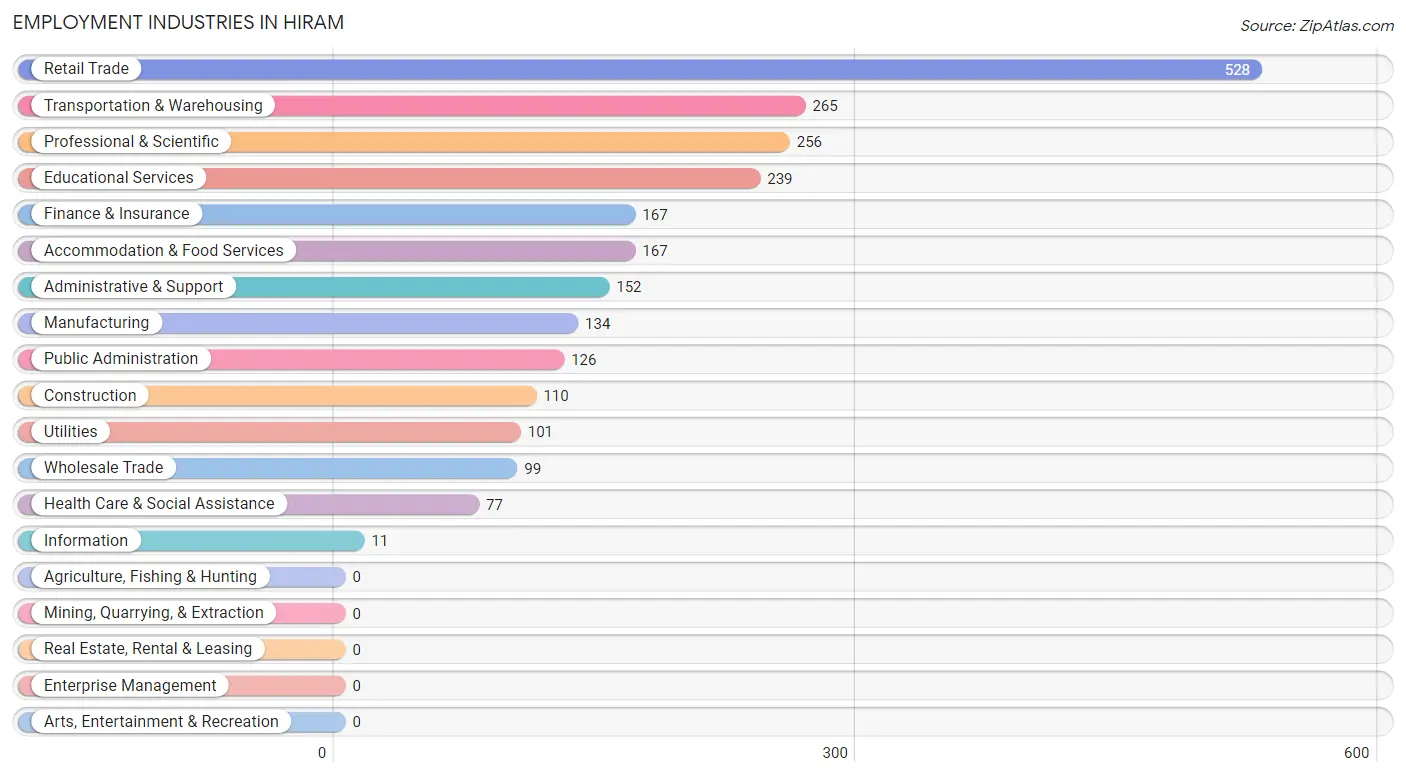
Employment Industries in Hiram
The major employment industries in Hiram include Retail Trade (528 | 21.2%), Transportation & Warehousing (265 | 10.6%), Professional & Scientific (256 | 10.3%), Educational Services (239 | 9.6%), and Finance & Insurance (167 | 6.7%).
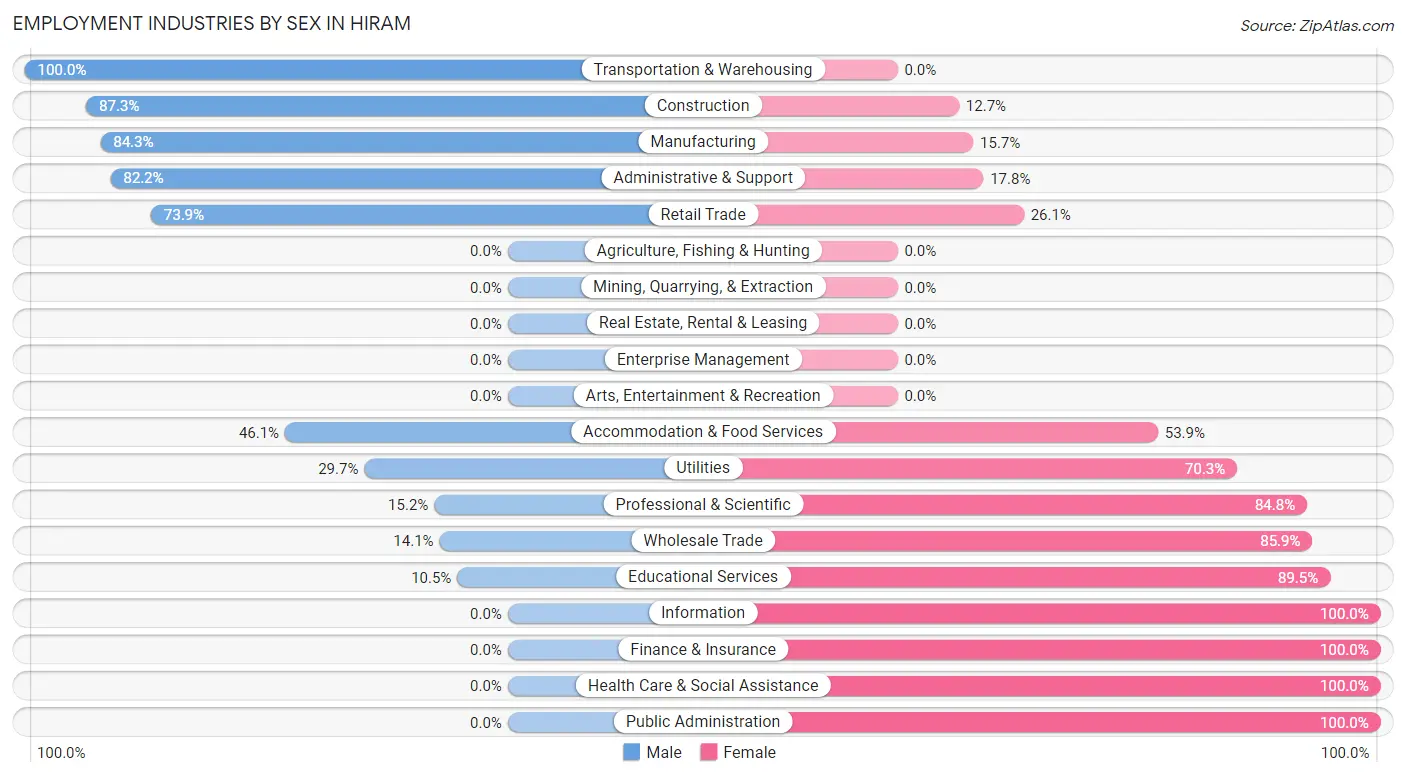
Employment Industries by Sex in Hiram
The Hiram industries that see more men than women are Transportation & Warehousing (100.0%), Construction (87.3%), and Manufacturing (84.3%), whereas the industries that tend to have a higher number of women are Information (100.0%), Finance & Insurance (100.0%), and Health Care & Social Assistance (100.0%).
| Industry | Male | Female |
| Agriculture, Fishing & Hunting | 0 (0.0%) | 0 (0.0%) |
| Mining, Quarrying, & Extraction | 0 (0.0%) | 0 (0.0%) |
| Construction | 96 (87.3%) | 14 (12.7%) |
| Manufacturing | 113 (84.3%) | 21 (15.7%) |
| Wholesale Trade | 14 (14.1%) | 85 (85.9%) |
| Retail Trade | 390 (73.9%) | 138 (26.1%) |
| Transportation & Warehousing | 265 (100.0%) | 0 (0.0%) |
| Utilities | 30 (29.7%) | 71 (70.3%) |
| Information | 0 (0.0%) | 11 (100.0%) |
| Finance & Insurance | 0 (0.0%) | 167 (100.0%) |
| Real Estate, Rental & Leasing | 0 (0.0%) | 0 (0.0%) |
| Professional & Scientific | 39 (15.2%) | 217 (84.8%) |
| Enterprise Management | 0 (0.0%) | 0 (0.0%) |
| Administrative & Support | 125 (82.2%) | 27 (17.8%) |
| Educational Services | 25 (10.5%) | 214 (89.5%) |
| Health Care & Social Assistance | 0 (0.0%) | 77 (100.0%) |
| Arts, Entertainment & Recreation | 0 (0.0%) | 0 (0.0%) |
| Accommodation & Food Services | 77 (46.1%) | 90 (53.9%) |
| Public Administration | 0 (0.0%) | 126 (100.0%) |
| Total | 1,186 (47.6%) | 1,305 (52.4%) |
Education in Hiram
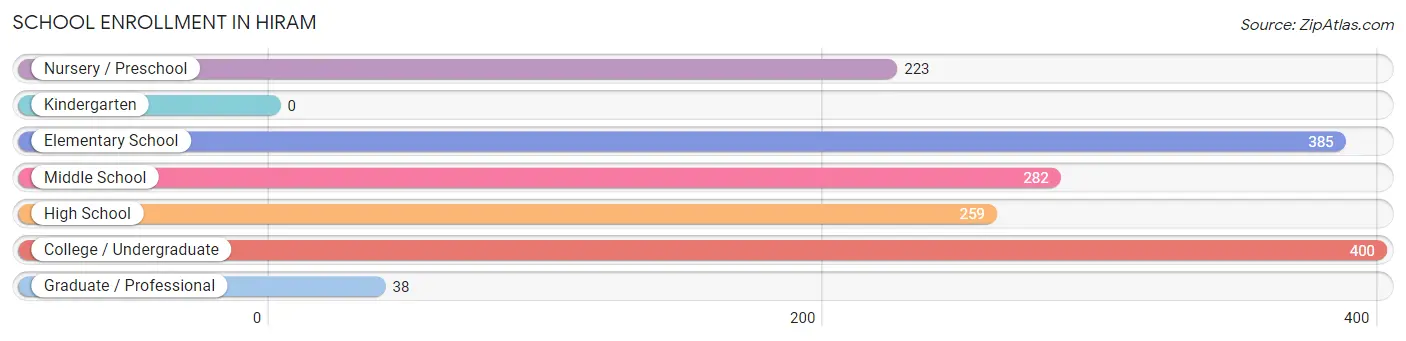
School Enrollment in Hiram
The most common levels of schooling among the 1,587 students in Hiram are college / undergraduate (400 | 25.2%), elementary school (385 | 24.3%), and middle school (282 | 17.8%).
| School Level | # Students | % Students |
| Nursery / Preschool | 223 | 14.1% |
| Kindergarten | 0 | 0.0% |
| Elementary School | 385 | 24.3% |
| Middle School | 282 | 17.8% |
| High School | 259 | 16.3% |
| College / Undergraduate | 400 | 25.2% |
| Graduate / Professional | 38 | 2.4% |
| Total | 1,587 | 100.0% |
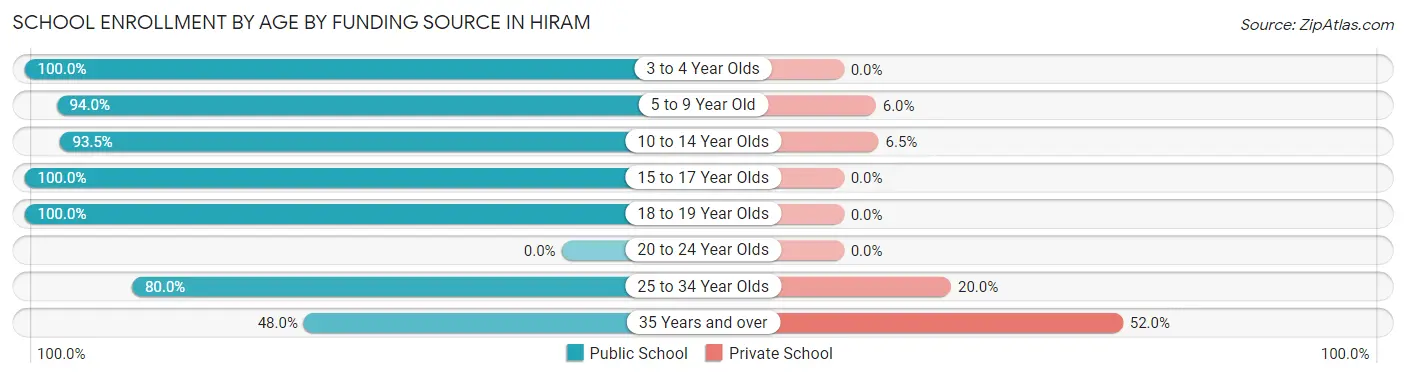
School Enrollment by Age by Funding Source in Hiram
Out of a total of 1,587 students who are enrolled in schools in Hiram, 198 (12.5%) attend a private institution, while the remaining 1,389 (87.5%) are enrolled in public schools. The age group of 35 years and over has the highest likelihood of being enrolled in private schools, with 144 (52.0% in the age bracket) enrolled. Conversely, the age group of 3 to 4 year olds has the lowest likelihood of being enrolled in a private school, with 216 (100.0% in the age bracket) attending a public institution.
| Age Bracket | Public School | Private School |
| 3 to 4 Year Olds | 216 (100.0%) | 0 (0.0%) |
| 5 to 9 Year Old | 330 (94.0%) | 21 (6.0%) |
| 10 to 14 Year Olds | 302 (93.5%) | 21 (6.5%) |
| 15 to 17 Year Olds | 298 (100.0%) | 0 (0.0%) |
| 18 to 19 Year Olds | 62 (100.0%) | 0 (0.0%) |
| 20 to 24 Year Olds | 0 (0.0%) | 0 (0.0%) |
| 25 to 34 Year Olds | 48 (80.0%) | 12 (20.0%) |
| 35 Years and over | 133 (48.0%) | 144 (52.0%) |
| Total | 1,389 (87.5%) | 198 (12.5%) |
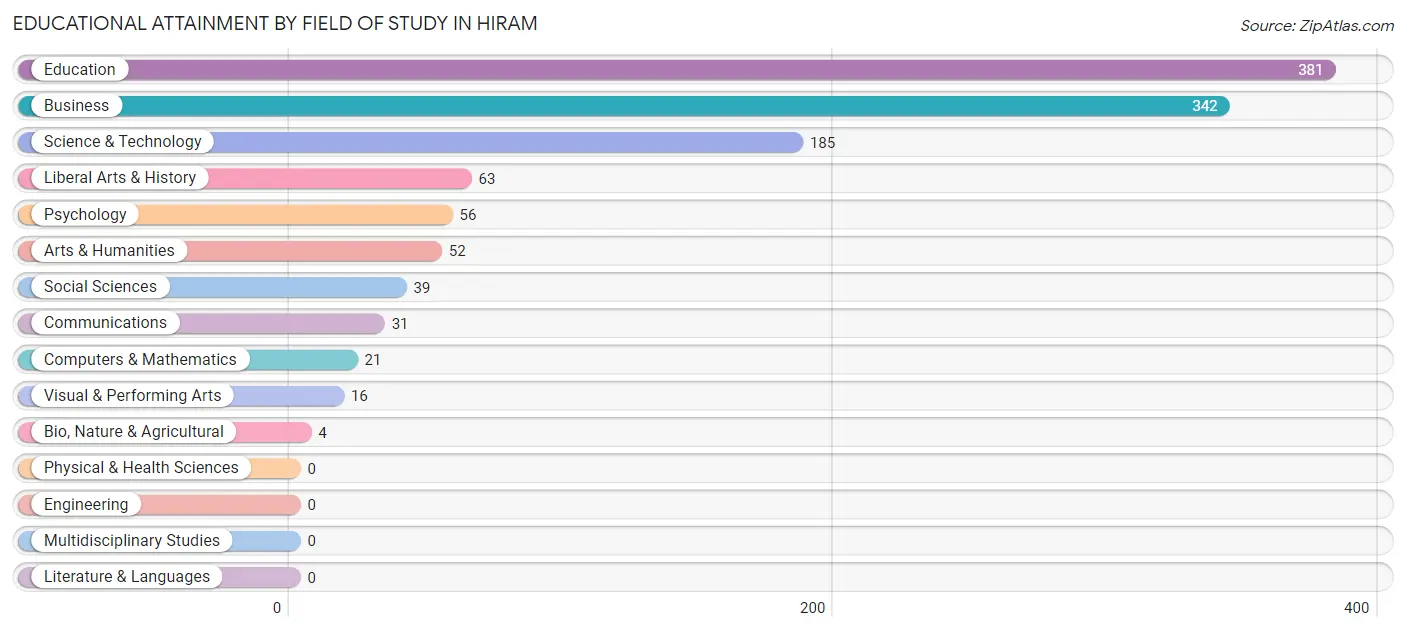
Educational Attainment by Field of Study in Hiram
Education (381 | 32.0%), business (342 | 28.7%), science & technology (185 | 15.5%), liberal arts & history (63 | 5.3%), and psychology (56 | 4.7%) are the most common fields of study among 1,190 individuals in Hiram who have obtained a bachelor's degree or higher.
| Field of Study | # Graduates | % Graduates |
| Computers & Mathematics | 21 | 1.8% |
| Bio, Nature & Agricultural | 4 | 0.3% |
| Physical & Health Sciences | 0 | 0.0% |
| Psychology | 56 | 4.7% |
| Social Sciences | 39 | 3.3% |
| Engineering | 0 | 0.0% |
| Multidisciplinary Studies | 0 | 0.0% |
| Science & Technology | 185 | 15.5% |
| Business | 342 | 28.7% |
| Education | 381 | 32.0% |
| Literature & Languages | 0 | 0.0% |
| Liberal Arts & History | 63 | 5.3% |
| Visual & Performing Arts | 16 | 1.3% |
| Communications | 31 | 2.6% |
| Arts & Humanities | 52 | 4.4% |
| Total | 1,190 | 100.0% |
Transportation & Commute in Hiram
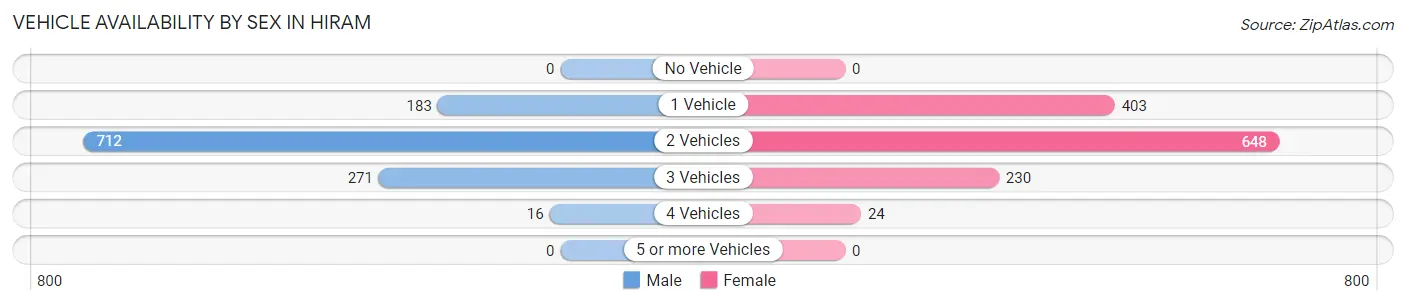
Vehicle Availability by Sex in Hiram
The most prevalent vehicle ownership categories in Hiram are males with 2 vehicles (712, accounting for 60.2%) and females with 2 vehicles (648, making up 54.6%).
| Vehicles Available | Male | Female |
| No Vehicle | 0 (0.0%) | 0 (0.0%) |
| 1 Vehicle | 183 (15.5%) | 403 (30.9%) |
| 2 Vehicles | 712 (60.2%) | 648 (49.7%) |
| 3 Vehicles | 271 (22.9%) | 230 (17.6%) |
| 4 Vehicles | 16 (1.3%) | 24 (1.8%) |
| 5 or more Vehicles | 0 (0.0%) | 0 (0.0%) |
| Total | 1,182 (100.0%) | 1,305 (100.0%) |
Commute Time in Hiram
The most frequently occuring commute durations in Hiram are 30 to 34 minutes (715 commuters, 34.0%), 45 to 59 minutes (381 commuters, 18.1%), and 10 to 14 minutes (244 commuters, 11.6%).
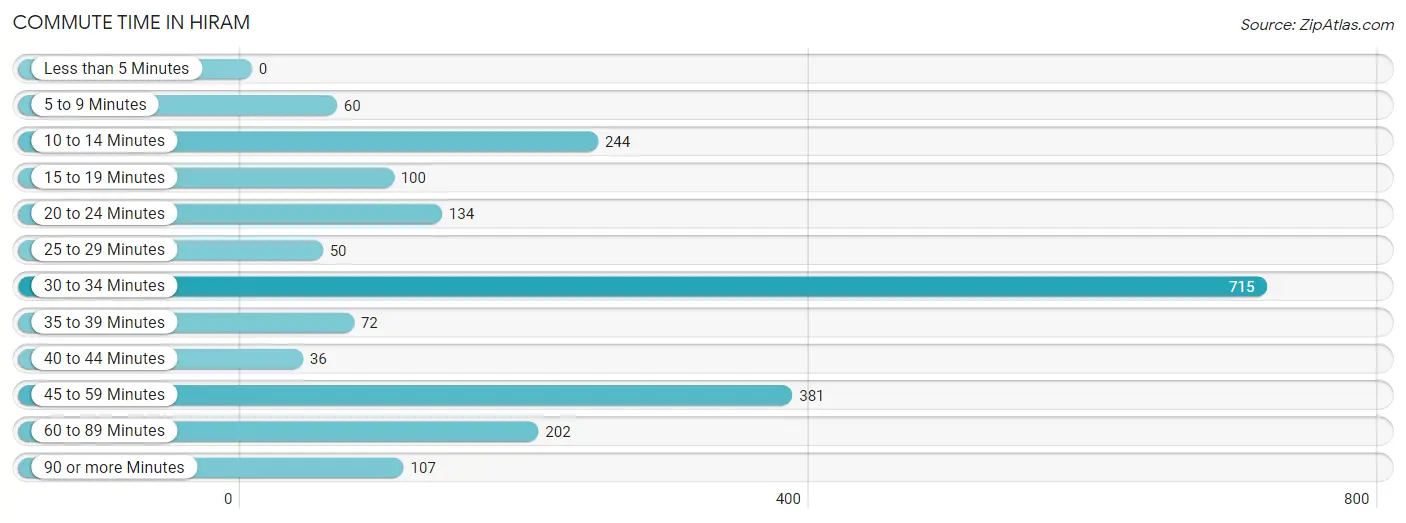
| Commute Time | # Commuters | % Commuters |
| Less than 5 Minutes | 0 | 0.0% |
| 5 to 9 Minutes | 60 | 2.9% |
| 10 to 14 Minutes | 244 | 11.6% |
| 15 to 19 Minutes | 100 | 4.8% |
| 20 to 24 Minutes | 134 | 6.4% |
| 25 to 29 Minutes | 50 | 2.4% |
| 30 to 34 Minutes | 715 | 34.0% |
| 35 to 39 Minutes | 72 | 3.4% |
| 40 to 44 Minutes | 36 | 1.7% |
| 45 to 59 Minutes | 381 | 18.1% |
| 60 to 89 Minutes | 202 | 9.6% |
| 90 or more Minutes | 107 | 5.1% |
Commute Time by Sex in Hiram
The most common commute times in Hiram are 30 to 34 minutes (486 commuters, 44.9%) for males and 30 to 34 minutes (229 commuters, 22.5%) for females.
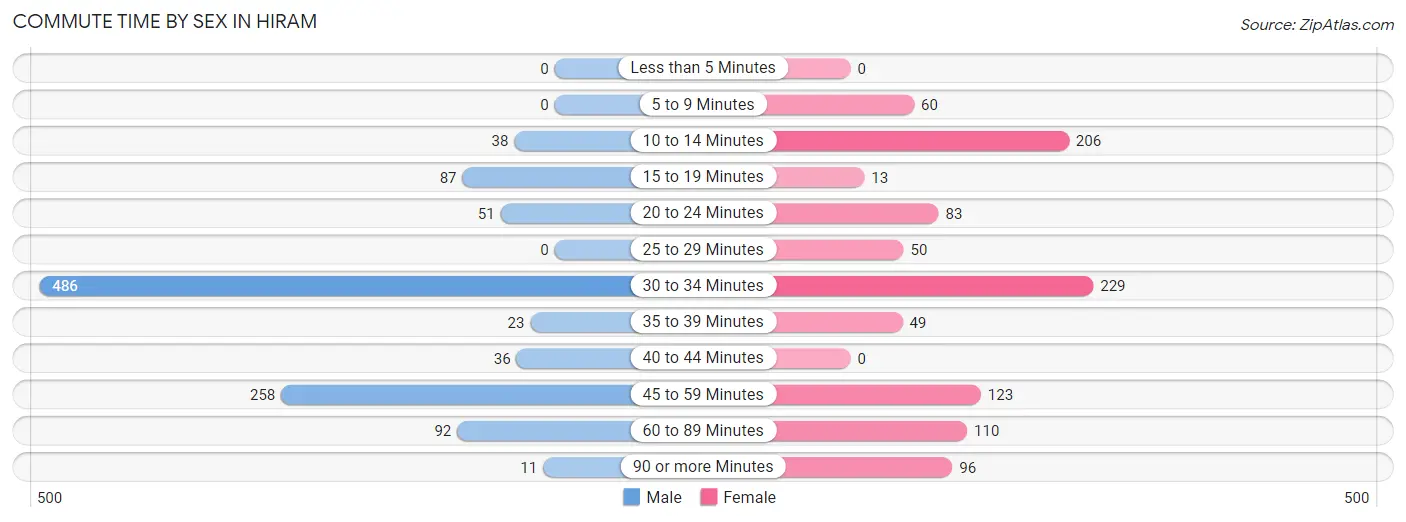
| Commute Time | Male | Female |
| Less than 5 Minutes | 0 (0.0%) | 0 (0.0%) |
| 5 to 9 Minutes | 0 (0.0%) | 60 (5.9%) |
| 10 to 14 Minutes | 38 (3.5%) | 206 (20.2%) |
| 15 to 19 Minutes | 87 (8.0%) | 13 (1.3%) |
| 20 to 24 Minutes | 51 (4.7%) | 83 (8.2%) |
| 25 to 29 Minutes | 0 (0.0%) | 50 (4.9%) |
| 30 to 34 Minutes | 486 (44.9%) | 229 (22.5%) |
| 35 to 39 Minutes | 23 (2.1%) | 49 (4.8%) |
| 40 to 44 Minutes | 36 (3.3%) | 0 (0.0%) |
| 45 to 59 Minutes | 258 (23.8%) | 123 (12.1%) |
| 60 to 89 Minutes | 92 (8.5%) | 110 (10.8%) |
| 90 or more Minutes | 11 (1.0%) | 96 (9.4%) |
Time of Departure to Work by Sex in Hiram
The most frequent times of departure to work in Hiram are 4:00 PM to 11:59 PM (264, 24.4%) for males and 7:00 AM to 7:29 AM (240, 23.5%) for females.
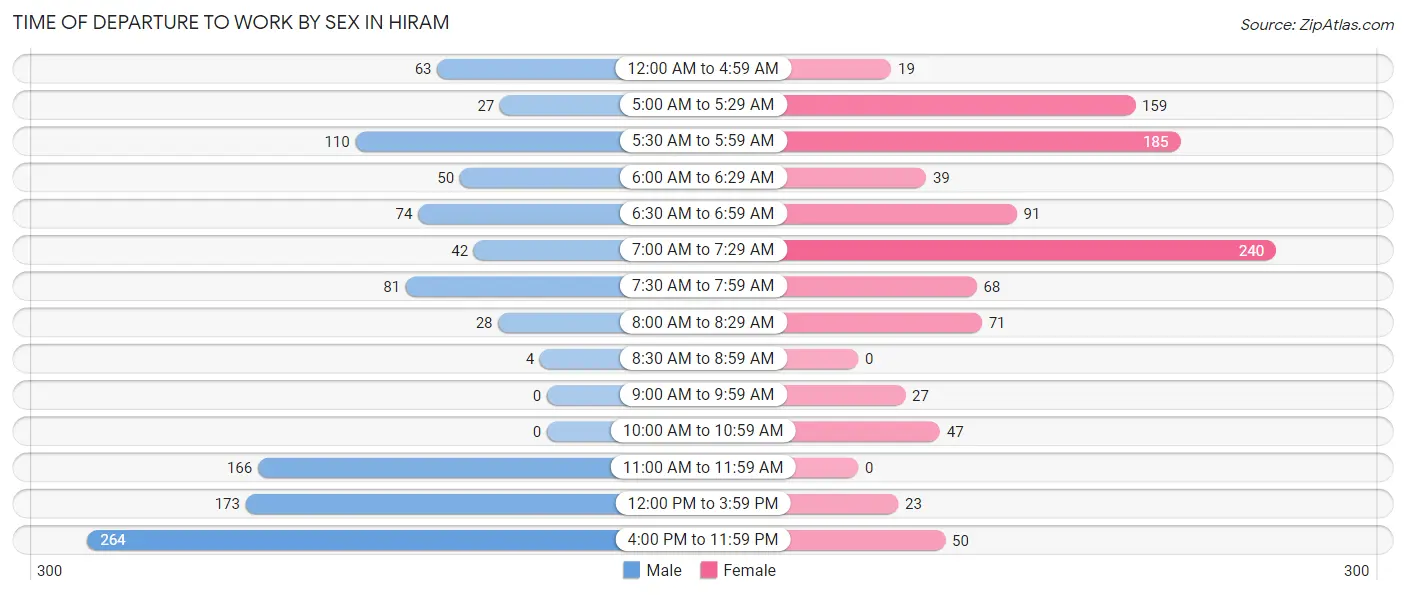
| Time of Departure | Male | Female |
| 12:00 AM to 4:59 AM | 63 (5.8%) | 19 (1.9%) |
| 5:00 AM to 5:29 AM | 27 (2.5%) | 159 (15.6%) |
| 5:30 AM to 5:59 AM | 110 (10.2%) | 185 (18.2%) |
| 6:00 AM to 6:29 AM | 50 (4.6%) | 39 (3.8%) |
| 6:30 AM to 6:59 AM | 74 (6.8%) | 91 (8.9%) |
| 7:00 AM to 7:29 AM | 42 (3.9%) | 240 (23.5%) |
| 7:30 AM to 7:59 AM | 81 (7.5%) | 68 (6.7%) |
| 8:00 AM to 8:29 AM | 28 (2.6%) | 71 (7.0%) |
| 8:30 AM to 8:59 AM | 4 (0.4%) | 0 (0.0%) |
| 9:00 AM to 9:59 AM | 0 (0.0%) | 27 (2.6%) |
| 10:00 AM to 10:59 AM | 0 (0.0%) | 47 (4.6%) |
| 11:00 AM to 11:59 AM | 166 (15.3%) | 0 (0.0%) |
| 12:00 PM to 3:59 PM | 173 (16.0%) | 23 (2.3%) |
| 4:00 PM to 11:59 PM | 264 (24.4%) | 50 (4.9%) |
| Total | 1,082 (100.0%) | 1,019 (100.0%) |
Housing Occupancy in Hiram
Occupancy by Ownership in Hiram
Of the total 1,725 dwellings in Hiram, owner-occupied units account for 1,130 (65.5%), while renter-occupied units make up 595 (34.5%).
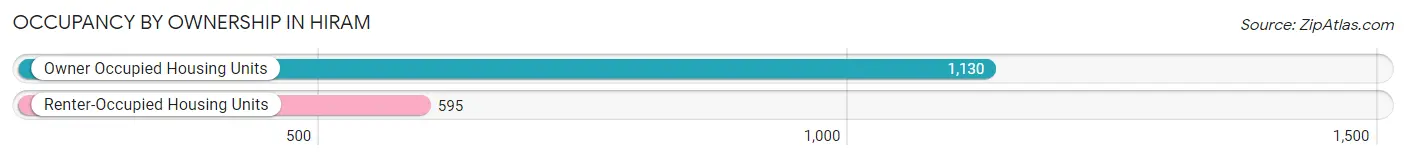
| Occupancy | # Housing Units | % Housing Units |
| Owner Occupied Housing Units | 1,130 | 65.5% |
| Renter-Occupied Housing Units | 595 | 34.5% |
| Total Occupied Housing Units | 1,725 | 100.0% |
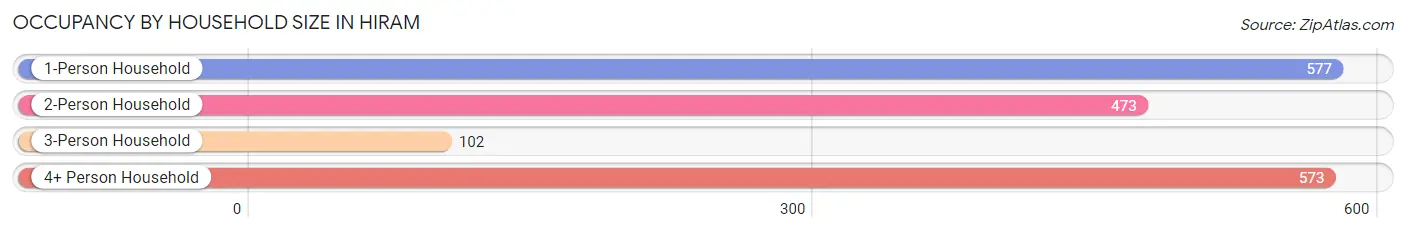
Occupancy by Household Size in Hiram
| Household Size | # Housing Units | % Housing Units |
| 1-Person Household | 577 | 33.5% |
| 2-Person Household | 473 | 27.4% |
| 3-Person Household | 102 | 5.9% |
| 4+ Person Household | 573 | 33.2% |
| Total Housing Units | 1,725 | 100.0% |
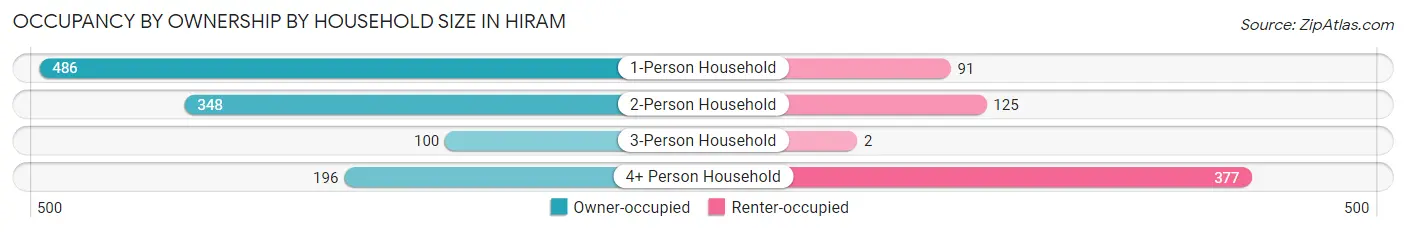
Occupancy by Ownership by Household Size in Hiram
| Household Size | Owner-occupied | Renter-occupied |
| 1-Person Household | 486 (84.2%) | 91 (15.8%) |
| 2-Person Household | 348 (73.6%) | 125 (26.4%) |
| 3-Person Household | 100 (98.0%) | 2 (2.0%) |
| 4+ Person Household | 196 (34.2%) | 377 (65.8%) |
| Total Housing Units | 1,130 (65.5%) | 595 (34.5%) |
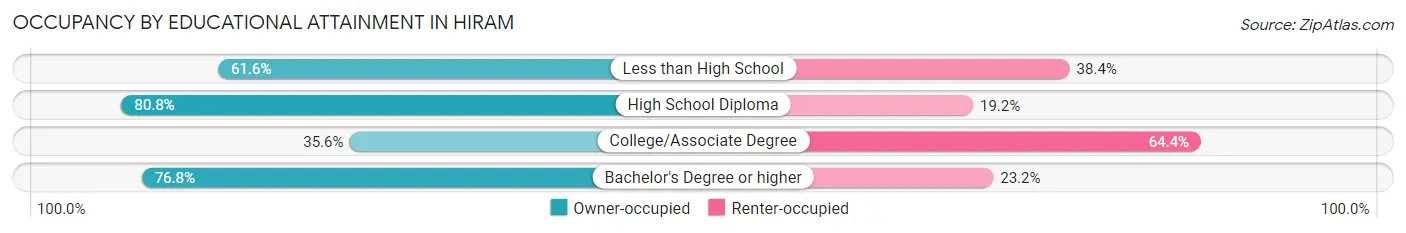
Occupancy by Educational Attainment in Hiram
| Household Size | Owner-occupied | Renter-occupied |
| Less than High School | 98 (61.6%) | 61 (38.4%) |
| High School Diploma | 202 (80.8%) | 48 (19.2%) |
| College/Associate Degree | 156 (35.6%) | 282 (64.4%) |
| Bachelor's Degree or higher | 674 (76.8%) | 204 (23.2%) |
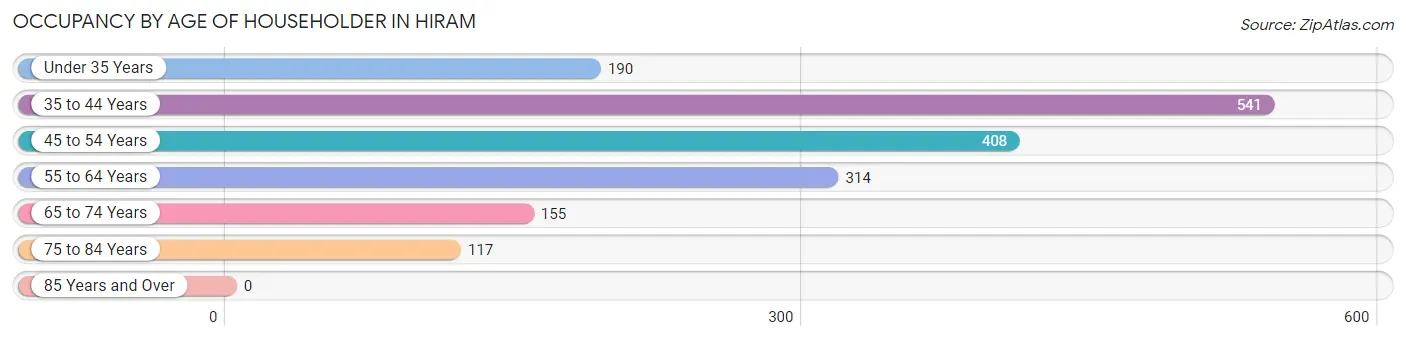
Occupancy by Age of Householder in Hiram
| Age Bracket | # Households | % Households |
| Under 35 Years | 190 | 11.0% |
| 35 to 44 Years | 541 | 31.4% |
| 45 to 54 Years | 408 | 23.6% |
| 55 to 64 Years | 314 | 18.2% |
| 65 to 74 Years | 155 | 9.0% |
| 75 to 84 Years | 117 | 6.8% |
| 85 Years and Over | 0 | 0.0% |
| Total | 1,725 | 100.0% |
Housing Finances in Hiram
Median Income by Occupancy in Hiram
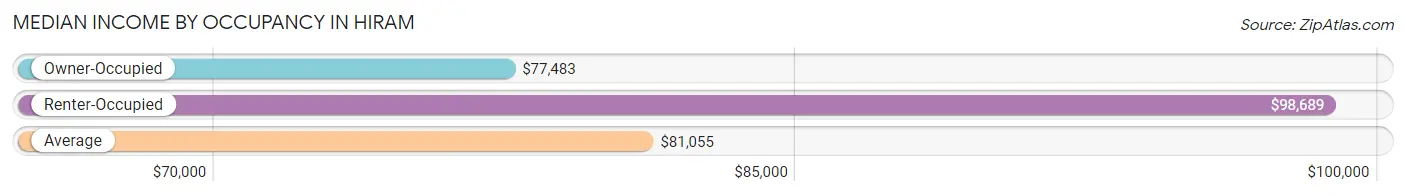
| Occupancy Type | # Households | Median Income |
| Owner-Occupied | 1,130 (65.5%) | $77,483 |
| Renter-Occupied | 595 (34.5%) | $98,689 |
| Average | 1,725 (100.0%) | $81,055 |
Occupancy by Householder Income Bracket in Hiram
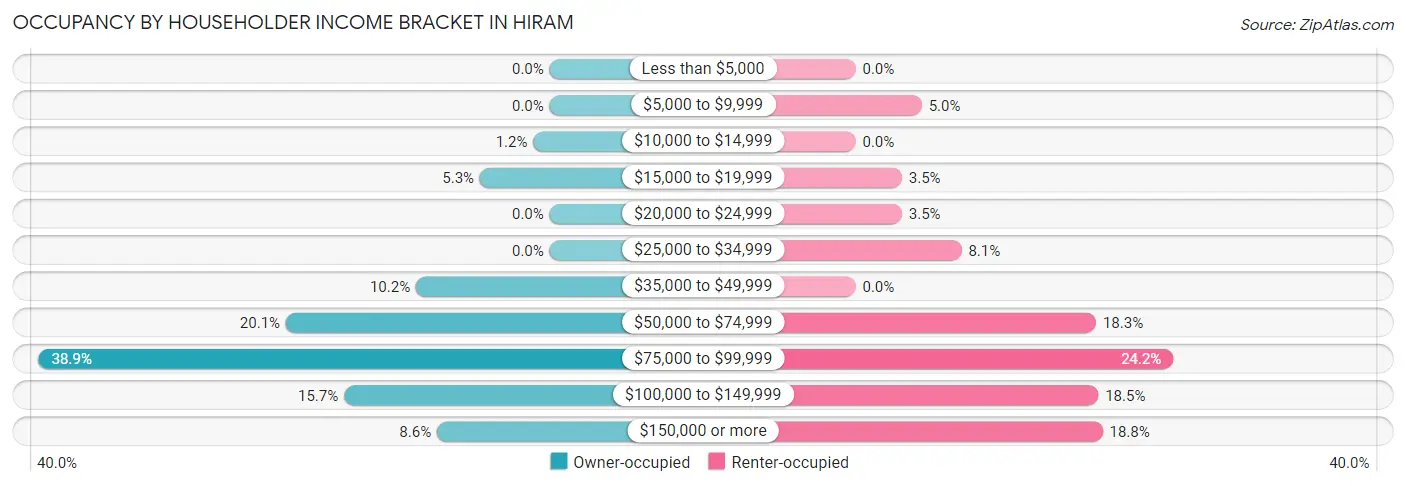
| Income Bracket | Owner-occupied | Renter-occupied |
| Less than $5,000 | 0 (0.0%) | 0 (0.0%) |
| $5,000 to $9,999 | 0 (0.0%) | 30 (5.0%) |
| $10,000 to $14,999 | 14 (1.2%) | 0 (0.0%) |
| $15,000 to $19,999 | 60 (5.3%) | 21 (3.5%) |
| $20,000 to $24,999 | 0 (0.0%) | 21 (3.5%) |
| $25,000 to $34,999 | 0 (0.0%) | 48 (8.1%) |
| $35,000 to $49,999 | 115 (10.2%) | 0 (0.0%) |
| $50,000 to $74,999 | 227 (20.1%) | 109 (18.3%) |
| $75,000 to $99,999 | 440 (38.9%) | 144 (24.2%) |
| $100,000 to $149,999 | 177 (15.7%) | 110 (18.5%) |
| $150,000 or more | 97 (8.6%) | 112 (18.8%) |
| Total | 1,130 (100.0%) | 595 (100.0%) |
Monthly Housing Cost Tiers in Hiram
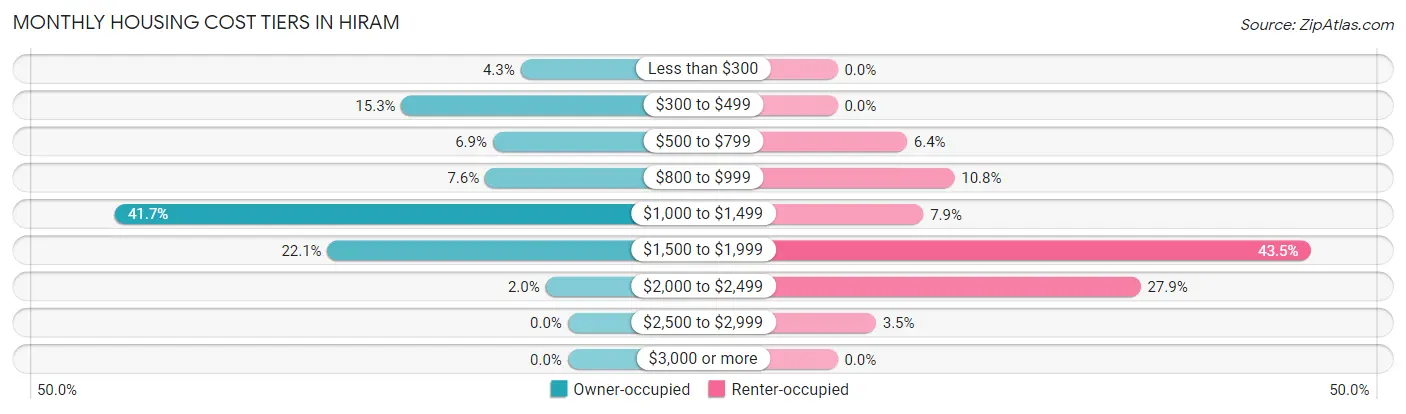
| Monthly Cost | Owner-occupied | Renter-occupied |
| Less than $300 | 49 (4.3%) | 0 (0.0%) |
| $300 to $499 | 173 (15.3%) | 0 (0.0%) |
| $500 to $799 | 78 (6.9%) | 38 (6.4%) |
| $800 to $999 | 86 (7.6%) | 64 (10.8%) |
| $1,000 to $1,499 | 471 (41.7%) | 47 (7.9%) |
| $1,500 to $1,999 | 250 (22.1%) | 259 (43.5%) |
| $2,000 to $2,499 | 23 (2.0%) | 166 (27.9%) |
| $2,500 to $2,999 | 0 (0.0%) | 21 (3.5%) |
| $3,000 or more | 0 (0.0%) | 0 (0.0%) |
| Total | 1,130 (100.0%) | 595 (100.0%) |
Physical Housing Characteristics in Hiram
Housing Structures in Hiram
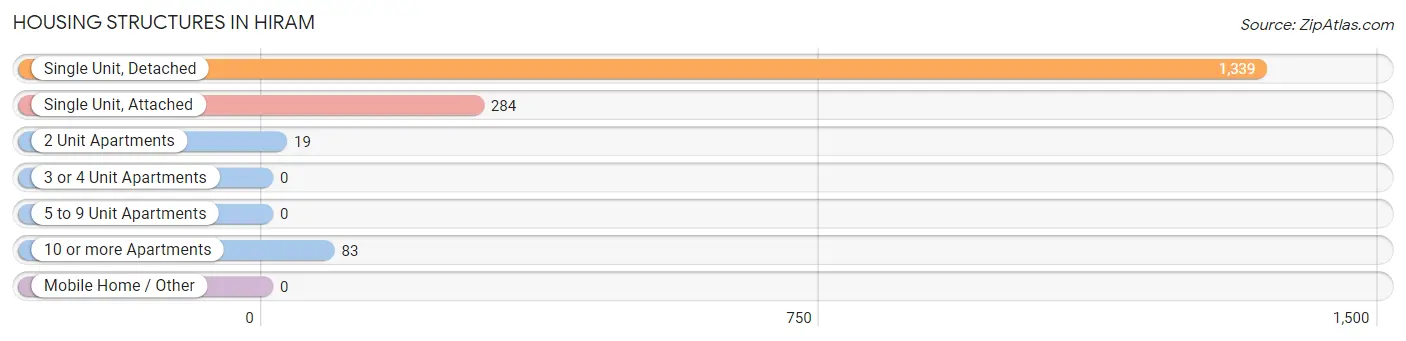
| Structure Type | # Housing Units | % Housing Units |
| Single Unit, Detached | 1,339 | 77.6% |
| Single Unit, Attached | 284 | 16.5% |
| 2 Unit Apartments | 19 | 1.1% |
| 3 or 4 Unit Apartments | 0 | 0.0% |
| 5 to 9 Unit Apartments | 0 | 0.0% |
| 10 or more Apartments | 83 | 4.8% |
| Mobile Home / Other | 0 | 0.0% |
| Total | 1,725 | 100.0% |
Housing Structures by Occupancy in Hiram
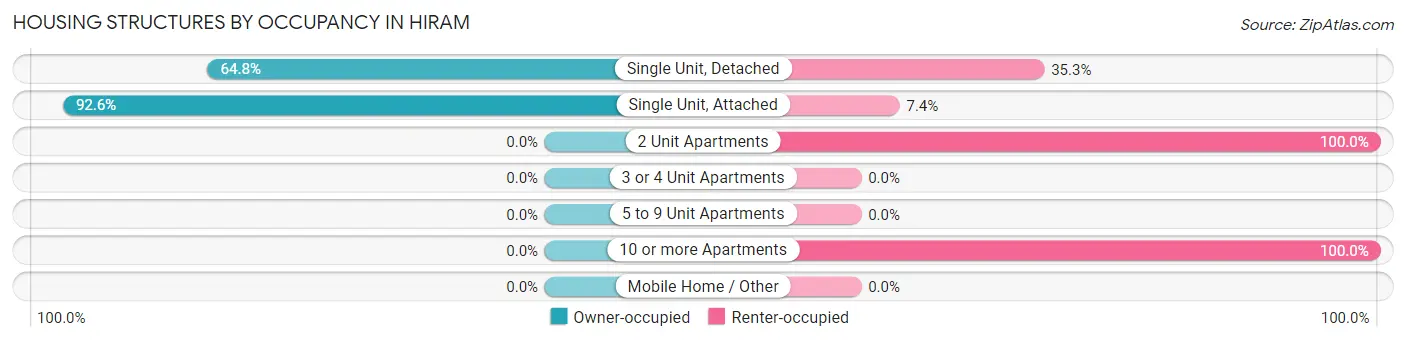
| Structure Type | Owner-occupied | Renter-occupied |
| Single Unit, Detached | 867 (64.7%) | 472 (35.2%) |
| Single Unit, Attached | 263 (92.6%) | 21 (7.4%) |
| 2 Unit Apartments | 0 (0.0%) | 19 (100.0%) |
| 3 or 4 Unit Apartments | 0 (0.0%) | 0 (0.0%) |
| 5 to 9 Unit Apartments | 0 (0.0%) | 0 (0.0%) |
| 10 or more Apartments | 0 (0.0%) | 83 (100.0%) |
| Mobile Home / Other | 0 (0.0%) | 0 (0.0%) |
| Total | 1,130 (65.5%) | 595 (34.5%) |
Housing Structures by Number of Rooms in Hiram
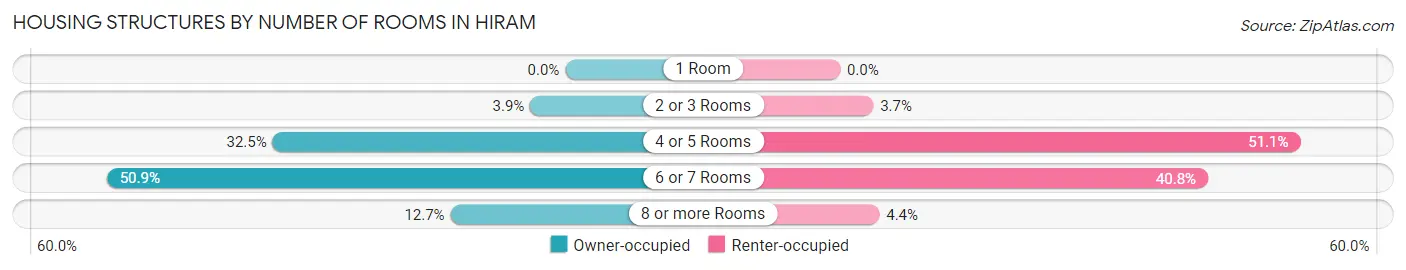
| Number of Rooms | Owner-occupied | Renter-occupied |
| 1 Room | 0 (0.0%) | 0 (0.0%) |
| 2 or 3 Rooms | 44 (3.9%) | 22 (3.7%) |
| 4 or 5 Rooms | 367 (32.5%) | 304 (51.1%) |
| 6 or 7 Rooms | 575 (50.9%) | 243 (40.8%) |
| 8 or more Rooms | 144 (12.7%) | 26 (4.4%) |
| Total | 1,130 (100.0%) | 595 (100.0%) |
Housing Structure by Heating Type in Hiram
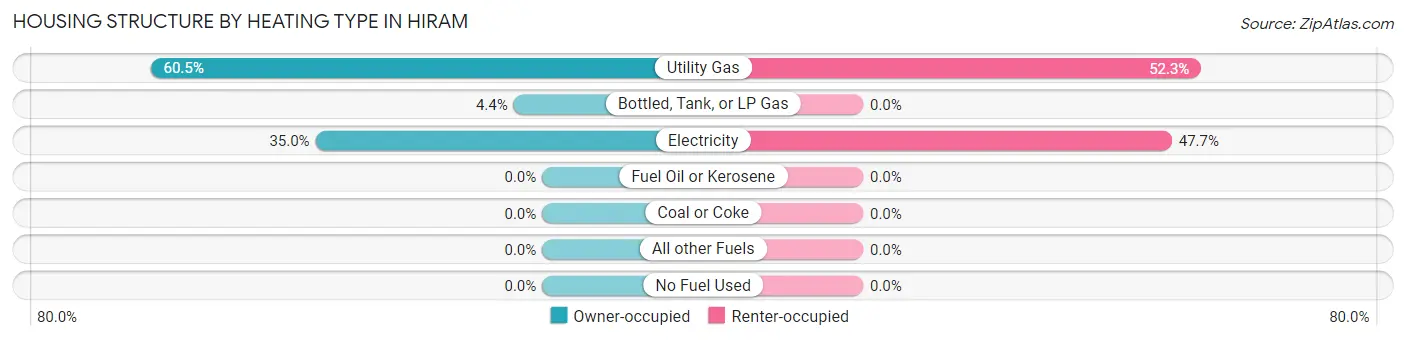
| Heating Type | Owner-occupied | Renter-occupied |
| Utility Gas | 684 (60.5%) | 311 (52.3%) |
| Bottled, Tank, or LP Gas | 50 (4.4%) | 0 (0.0%) |
| Electricity | 396 (35.0%) | 284 (47.7%) |
| Fuel Oil or Kerosene | 0 (0.0%) | 0 (0.0%) |
| Coal or Coke | 0 (0.0%) | 0 (0.0%) |
| All other Fuels | 0 (0.0%) | 0 (0.0%) |
| No Fuel Used | 0 (0.0%) | 0 (0.0%) |
| Total | 1,130 (100.0%) | 595 (100.0%) |
Household Vehicle Usage in Hiram
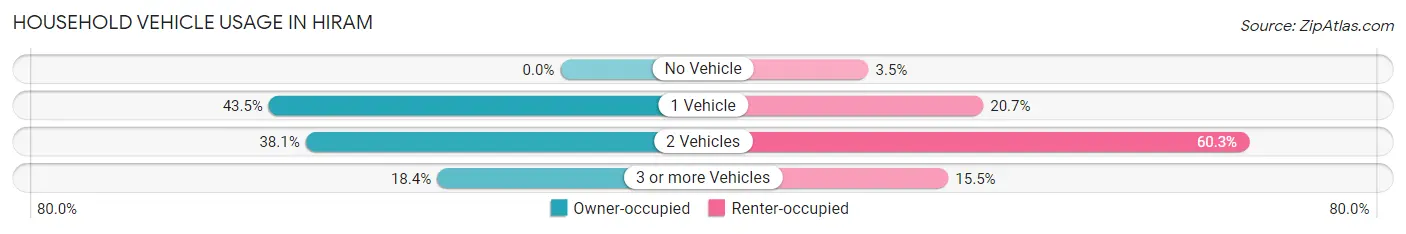
| Vehicles per Household | Owner-occupied | Renter-occupied |
| No Vehicle | 0 (0.0%) | 21 (3.5%) |
| 1 Vehicle | 492 (43.5%) | 123 (20.7%) |
| 2 Vehicles | 430 (38.1%) | 359 (60.3%) |
| 3 or more Vehicles | 208 (18.4%) | 92 (15.5%) |
| Total | 1,130 (100.0%) | 595 (100.0%) |
Real Estate & Mortgages in Hiram
Real Estate and Mortgage Overview in Hiram
| Characteristic | Without Mortgage | With Mortgage |
| Housing Units | 279 | 851 |
| Median Property Value | $186,300 | $215,700 |
| Median Household Income | $59,940 | $69 |
| Monthly Housing Costs | $388 | $0 |
| Real Estate Taxes | $964 | $17 |
Property Value by Mortgage Status in Hiram
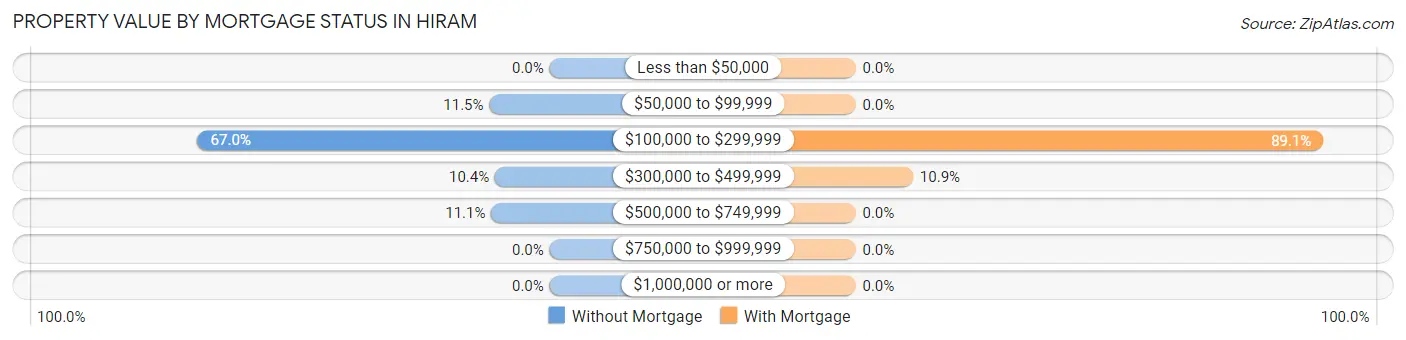
| Property Value | Without Mortgage | With Mortgage |
| Less than $50,000 | 0 (0.0%) | 0 (0.0%) |
| $50,000 to $99,999 | 32 (11.5%) | 0 (0.0%) |
| $100,000 to $299,999 | 187 (67.0%) | 758 (89.1%) |
| $300,000 to $499,999 | 29 (10.4%) | 93 (10.9%) |
| $500,000 to $749,999 | 31 (11.1%) | 0 (0.0%) |
| $750,000 to $999,999 | 0 (0.0%) | 0 (0.0%) |
| $1,000,000 or more | 0 (0.0%) | 0 (0.0%) |
| Total | 279 (100.0%) | 851 (100.0%) |
Household Income by Mortgage Status in Hiram
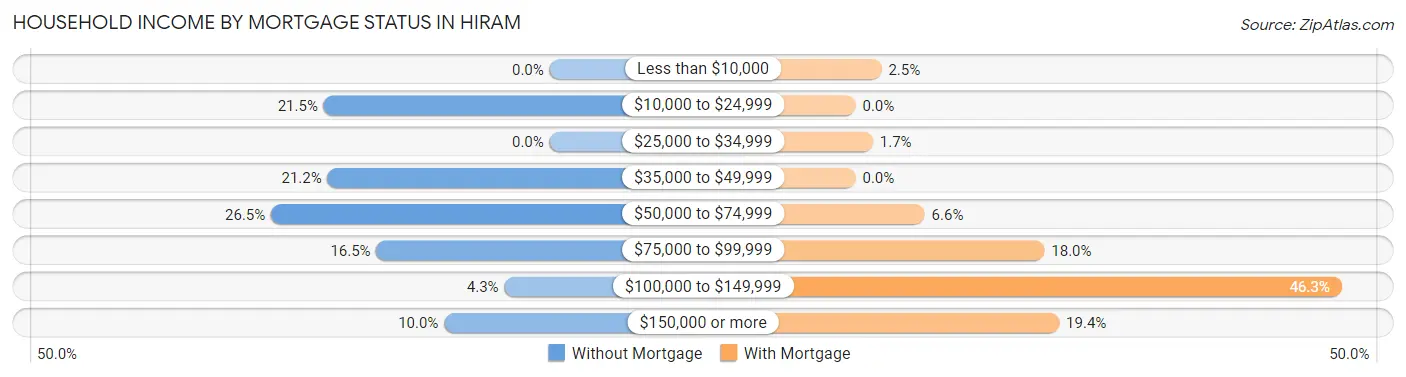
| Household Income | Without Mortgage | With Mortgage |
| Less than $10,000 | 0 (0.0%) | 21 (2.5%) |
| $10,000 to $24,999 | 60 (21.5%) | 0 (0.0%) |
| $25,000 to $34,999 | 0 (0.0%) | 14 (1.7%) |
| $35,000 to $49,999 | 59 (21.1%) | 0 (0.0%) |
| $50,000 to $74,999 | 74 (26.5%) | 56 (6.6%) |
| $75,000 to $99,999 | 46 (16.5%) | 153 (18.0%) |
| $100,000 to $149,999 | 12 (4.3%) | 394 (46.3%) |
| $150,000 or more | 28 (10.0%) | 165 (19.4%) |
| Total | 279 (100.0%) | 851 (100.0%) |
Property Value to Household Income Ratio in Hiram
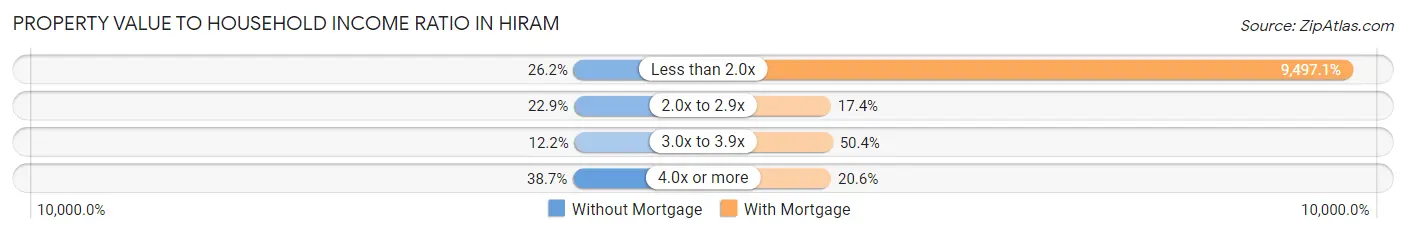
| Value-to-Income Ratio | Without Mortgage | With Mortgage |
| Less than 2.0x | 73 (26.2%) | 80,820 (9,497.1%) |
| 2.0x to 2.9x | 64 (22.9%) | 148 (17.4%) |
| 3.0x to 3.9x | 34 (12.2%) | 429 (50.4%) |
| 4.0x or more | 108 (38.7%) | 175 (20.6%) |
| Total | 279 (100.0%) | 851 (100.0%) |
Real Estate Taxes by Mortgage Status in Hiram
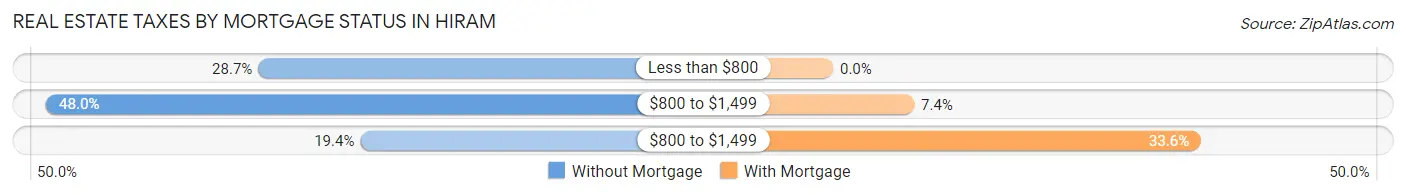
| Property Taxes | Without Mortgage | With Mortgage |
| Less than $800 | 80 (28.7%) | 0 (0.0%) |
| $800 to $1,499 | 134 (48.0%) | 63 (7.4%) |
| $800 to $1,499 | 54 (19.4%) | 286 (33.6%) |
| Total | 279 (100.0%) | 851 (100.0%) |
Health & Disability in Hiram
Health Insurance Coverage by Age in Hiram
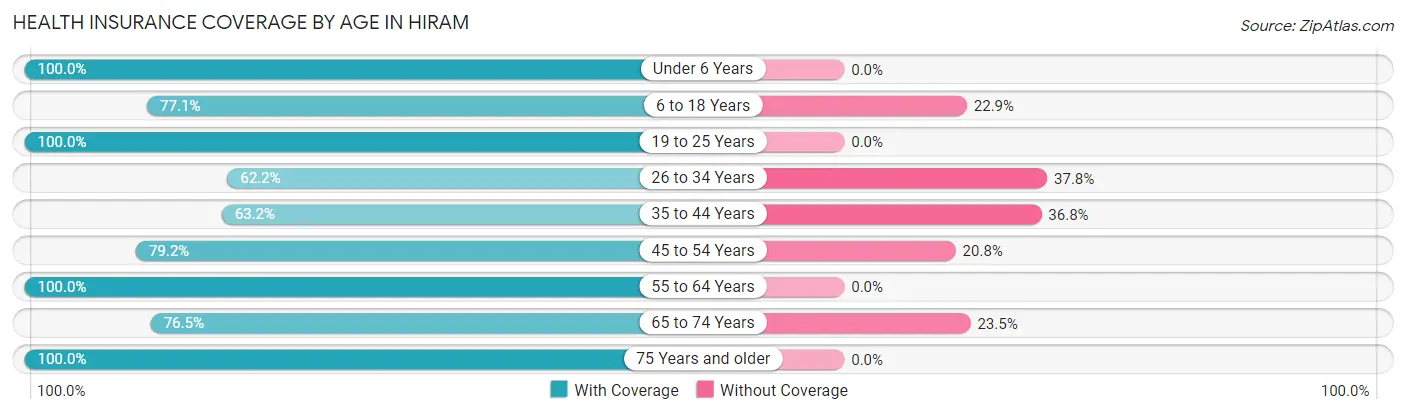
| Age Bracket | With Coverage | Without Coverage |
| Under 6 Years | 464 (100.0%) | 0 (0.0%) |
| 6 to 18 Years | 820 (77.1%) | 243 (22.9%) |
| 19 to 25 Years | 243 (100.0%) | 0 (0.0%) |
| 26 to 34 Years | 365 (62.2%) | 222 (37.8%) |
| 35 to 44 Years | 559 (63.2%) | 325 (36.8%) |
| 45 to 54 Years | 454 (79.2%) | 119 (20.8%) |
| 55 to 64 Years | 577 (100.0%) | 0 (0.0%) |
| 65 to 74 Years | 247 (76.5%) | 76 (23.5%) |
| 75 Years and older | 197 (100.0%) | 0 (0.0%) |
| Total | 3,926 (79.9%) | 985 (20.1%) |
Health Insurance Coverage by Citizenship Status in Hiram
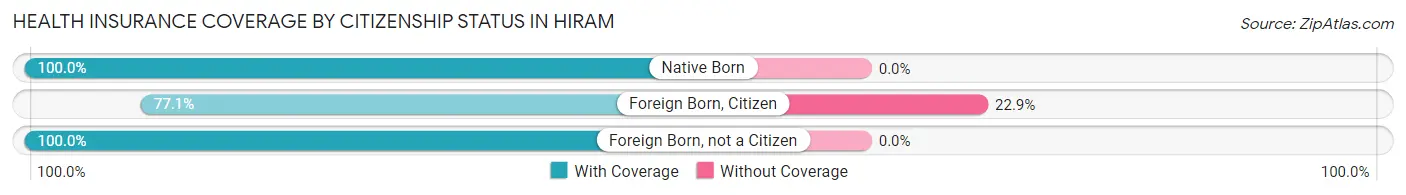
| Citizenship Status | With Coverage | Without Coverage |
| Native Born | 464 (100.0%) | 0 (0.0%) |
| Foreign Born, Citizen | 820 (77.1%) | 243 (22.9%) |
| Foreign Born, not a Citizen | 243 (100.0%) | 0 (0.0%) |
Health Insurance Coverage by Household Income in Hiram
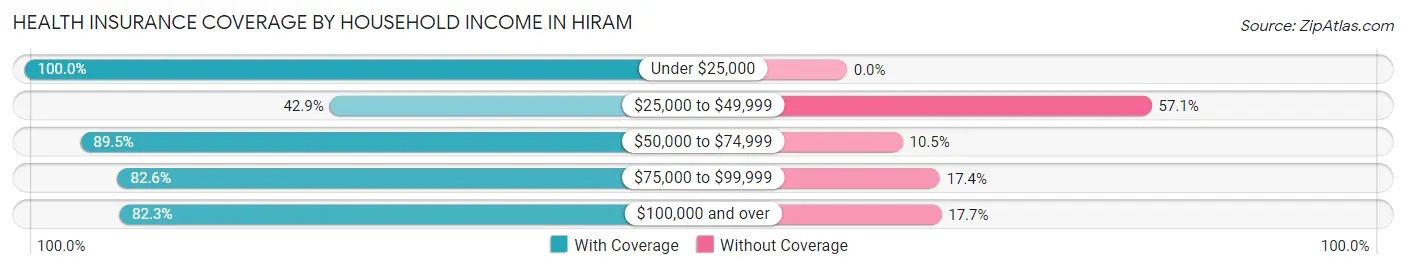
| Household Income | With Coverage | Without Coverage |
| Under $25,000 | 239 (100.0%) | 0 (0.0%) |
| $25,000 to $49,999 | 232 (42.9%) | 309 (57.1%) |
| $50,000 to $74,999 | 625 (89.5%) | 73 (10.5%) |
| $75,000 to $99,999 | 1,042 (82.6%) | 220 (17.4%) |
| $100,000 and over | 1,780 (82.3%) | 383 (17.7%) |
Public vs Private Health Insurance Coverage by Age in Hiram
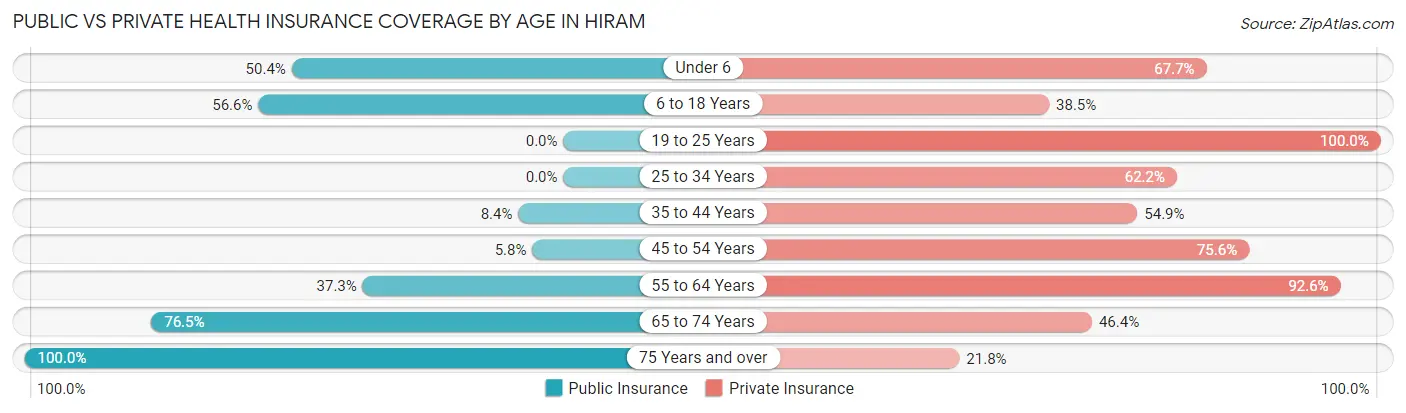
| Age Bracket | Public Insurance | Private Insurance |
| Under 6 | 234 (50.4%) | 314 (67.7%) |
| 6 to 18 Years | 602 (56.6%) | 409 (38.5%) |
| 19 to 25 Years | 0 (0.0%) | 243 (100.0%) |
| 25 to 34 Years | 0 (0.0%) | 365 (62.2%) |
| 35 to 44 Years | 74 (8.4%) | 485 (54.9%) |
| 45 to 54 Years | 33 (5.8%) | 433 (75.6%) |
| 55 to 64 Years | 215 (37.3%) | 534 (92.5%) |
| 65 to 74 Years | 247 (76.5%) | 150 (46.4%) |
| 75 Years and over | 197 (100.0%) | 43 (21.8%) |
| Total | 1,602 (32.6%) | 2,976 (60.6%) |
Disability Status by Sex by Age in Hiram
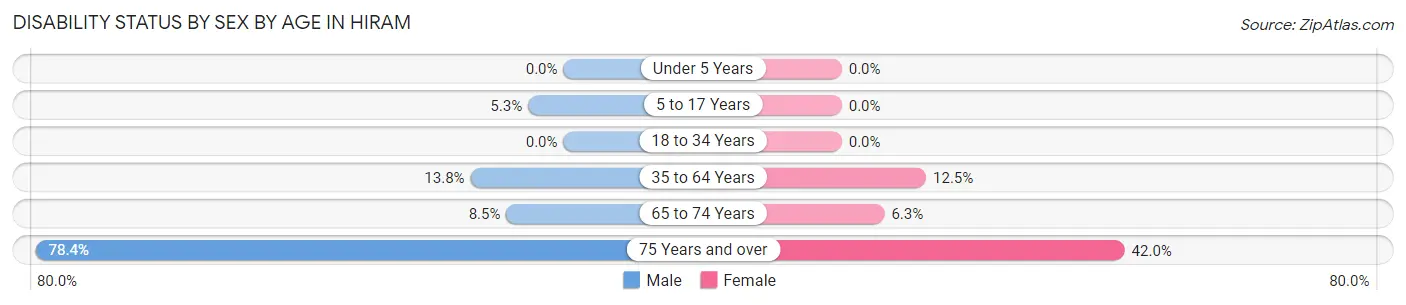
| Age Bracket | Male | Female |
| Under 5 Years | 0 (0.0%) | 0 (0.0%) |
| 5 to 17 Years | 21 (5.2%) | 0 (0.0%) |
| 18 to 34 Years | 0 (0.0%) | 0 (0.0%) |
| 35 to 64 Years | 122 (13.8%) | 144 (12.5%) |
| 65 to 74 Years | 10 (8.5%) | 13 (6.3%) |
| 75 Years and over | 76 (78.3%) | 42 (42.0%) |
Disability Class by Sex by Age in Hiram
Disability Class: Hearing Difficulty
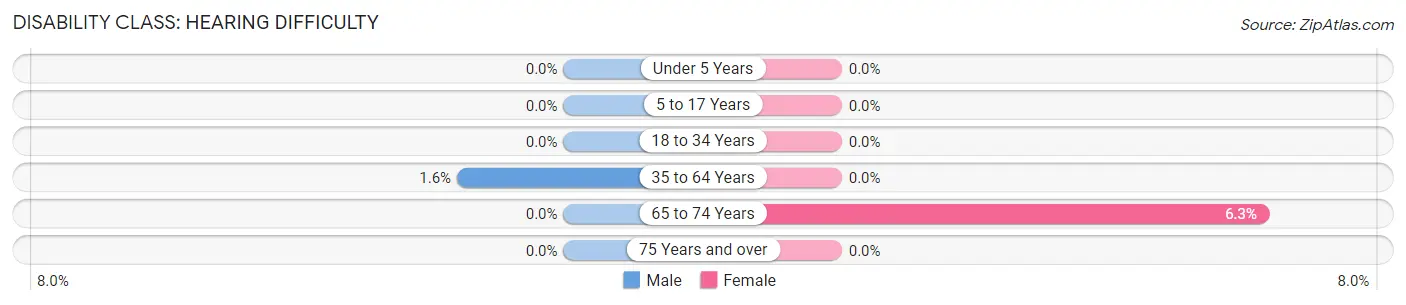
| Age Bracket | Male | Female |
| Under 5 Years | 0 (0.0%) | 0 (0.0%) |
| 5 to 17 Years | 0 (0.0%) | 0 (0.0%) |
| 18 to 34 Years | 0 (0.0%) | 0 (0.0%) |
| 35 to 64 Years | 14 (1.6%) | 0 (0.0%) |
| 65 to 74 Years | 0 (0.0%) | 13 (6.3%) |
| 75 Years and over | 0 (0.0%) | 0 (0.0%) |
Disability Class: Vision Difficulty
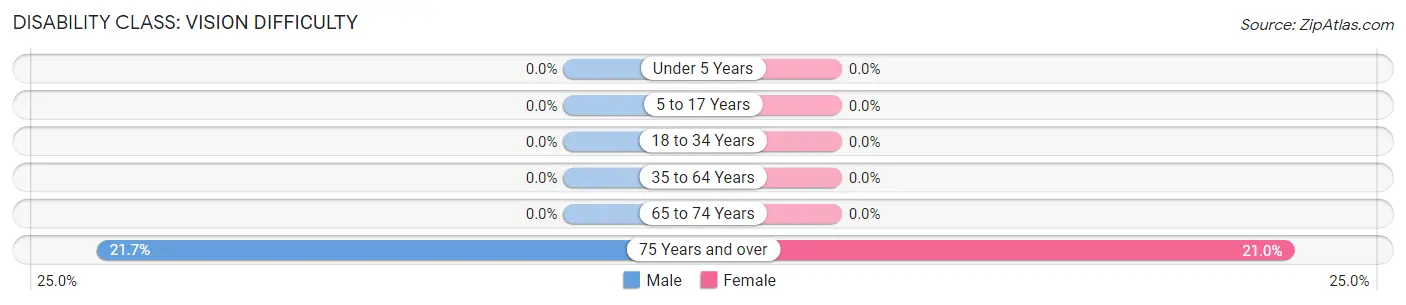
| Age Bracket | Male | Female |
| Under 5 Years | 0 (0.0%) | 0 (0.0%) |
| 5 to 17 Years | 0 (0.0%) | 0 (0.0%) |
| 18 to 34 Years | 0 (0.0%) | 0 (0.0%) |
| 35 to 64 Years | 0 (0.0%) | 0 (0.0%) |
| 65 to 74 Years | 0 (0.0%) | 0 (0.0%) |
| 75 Years and over | 21 (21.6%) | 21 (21.0%) |
Disability Class: Cognitive Difficulty
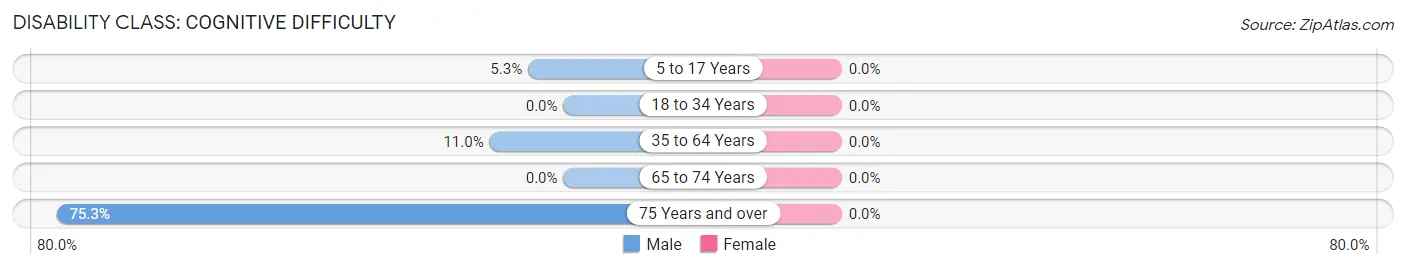
| Age Bracket | Male | Female |
| 5 to 17 Years | 21 (5.2%) | 0 (0.0%) |
| 18 to 34 Years | 0 (0.0%) | 0 (0.0%) |
| 35 to 64 Years | 97 (11.0%) | 0 (0.0%) |
| 65 to 74 Years | 0 (0.0%) | 0 (0.0%) |
| 75 Years and over | 73 (75.3%) | 0 (0.0%) |
Disability Class: Ambulatory Difficulty
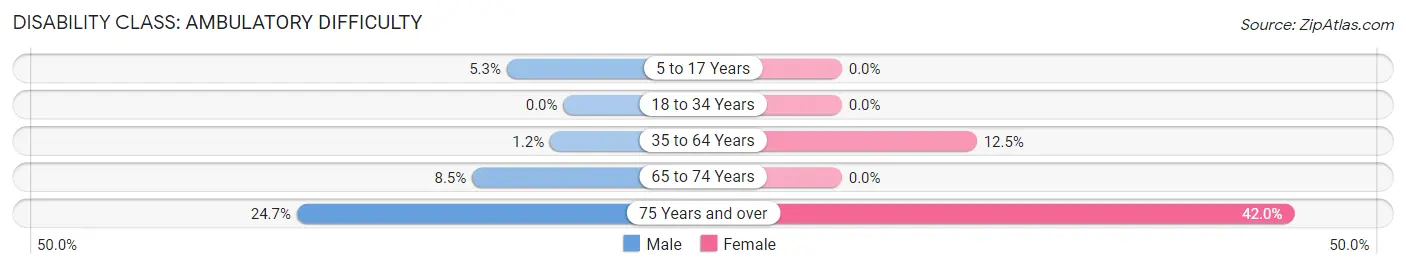
| Age Bracket | Male | Female |
| 5 to 17 Years | 21 (5.2%) | 0 (0.0%) |
| 18 to 34 Years | 0 (0.0%) | 0 (0.0%) |
| 35 to 64 Years | 11 (1.2%) | 144 (12.5%) |
| 65 to 74 Years | 10 (8.5%) | 0 (0.0%) |
| 75 Years and over | 24 (24.7%) | 42 (42.0%) |
Disability Class: Self-Care Difficulty
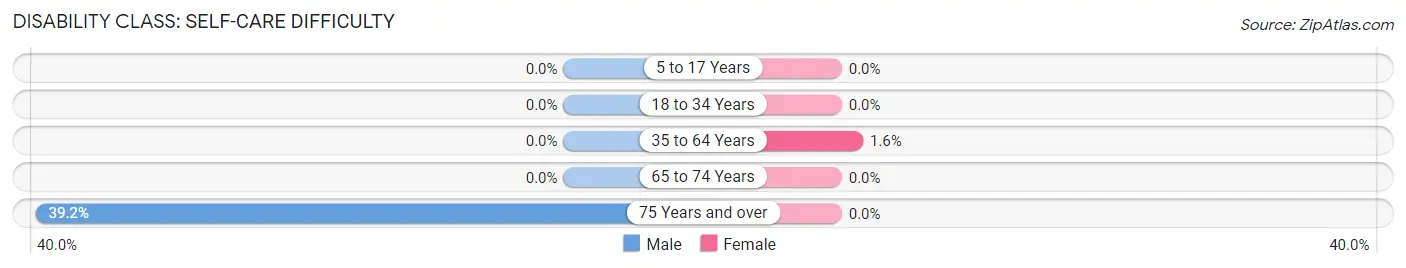
| Age Bracket | Male | Female |
| 5 to 17 Years | 0 (0.0%) | 0 (0.0%) |
| 18 to 34 Years | 0 (0.0%) | 0 (0.0%) |
| 35 to 64 Years | 0 (0.0%) | 18 (1.6%) |
| 65 to 74 Years | 0 (0.0%) | 0 (0.0%) |
| 75 Years and over | 38 (39.2%) | 0 (0.0%) |
Technology Access in Hiram
Computing Device Access in Hiram
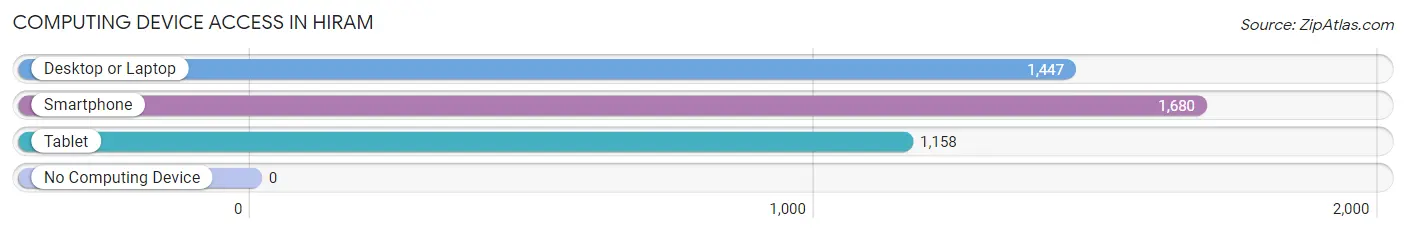
| Device Type | # Households | % Households |
| Desktop or Laptop | 1,447 | 83.9% |
| Smartphone | 1,680 | 97.4% |
| Tablet | 1,158 | 67.1% |
| No Computing Device | 0 | 0.0% |
| Total | 1,725 | 100.0% |
Internet Access in Hiram
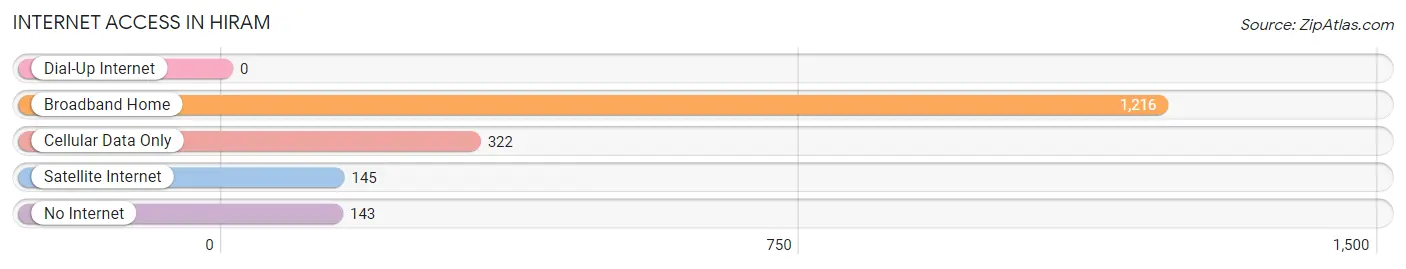
| Internet Type | # Households | % Households |
| Dial-Up Internet | 0 | 0.0% |
| Broadband Home | 1,216 | 70.5% |
| Cellular Data Only | 322 | 18.7% |
| Satellite Internet | 145 | 8.4% |
| No Internet | 143 | 8.3% |
| Total | 1,725 | 100.0% |
Hiram Summary
Hiram, Georgia is a small city located in Paulding County, Georgia, United States. It is situated about 30 miles northwest of Atlanta and is part of the Atlanta metropolitan area. The city was incorporated in 1891 and has a population of about 6,000 people.
History
Hiram was founded in 1891 by a group of settlers from the nearby town of Dallas. The town was named after Hiram Parks, a local farmer who donated land for the town's development. The town was originally a farming community, but it soon developed into a small industrial center. The town was home to several factories, including a cotton mill, a sawmill, and a gristmill.
In the early 1900s, Hiram experienced a period of growth and prosperity. The town was home to several businesses, including a bank, a hotel, and a movie theater. The town also had a railroad station, which connected it to the larger cities of Atlanta and Dallas.
In the 1950s, Hiram began to experience a decline in population and economic activity. The factories that had once been the town's main source of income began to close, and many of the businesses that had been in the town moved away. The town's population decreased from a peak of about 1,500 in the 1950s to just over 6,000 in 2020.
Geography
Hiram is located in Paulding County, Georgia, about 30 miles northwest of Atlanta. The city is situated in the foothills of the Appalachian Mountains and is surrounded by rolling hills and forests. The city is located near the Etowah River, which flows through the city and provides a source of recreation for the residents.
The climate in Hiram is mild and humid, with temperatures ranging from the mid-50s in the winter to the mid-80s in the summer. The city receives an average of 48 inches of rain per year.
Economy
Hiram's economy is largely based on the service industry. The city is home to several restaurants, retail stores, and other businesses. The city is also home to several manufacturing companies, including a plastics manufacturer and a paper mill.
The city is also home to several educational institutions, including a community college and a technical college. The city is also home to a number of parks and recreational facilities, including a golf course and a public swimming pool.
Demographics
Hiram has a population of about 6,000 people. The city is predominantly white, with about 75% of the population identifying as white. The remaining 25% of the population is made up of African Americans, Hispanics, and other ethnicities.
The median household income in Hiram is about $45,000, and the median home value is about $150,000. The city has a low unemployment rate of about 4%.
Conclusion
Hiram, Georgia is a small city located in Paulding County, Georgia, United States. It is situated about 30 miles northwest of Atlanta and is part of the Atlanta metropolitan area. The city was incorporated in 1891 and has a population of about 6,000 people. The city's economy is largely based on the service industry, and it is home to several educational institutions, parks, and recreational facilities. The city is predominantly white, with about 75% of the population identifying as white. The median household income in Hiram is about $45,000, and the median home value is about $150,000.
Common Questions
What is Per Capita Income in Hiram?
Per Capita income in Hiram is $33,952.
What is the Median Family Income in Hiram?
Median Family Income in Hiram is $98,359.
What is the Median Household income in Hiram?
Median Household Income in Hiram is $81,055.
What is Income or Wage Gap in Hiram?
Income or Wage Gap in Hiram is 6.9%.
Women in Hiram earn 93.1 cents for every dollar earned by a man.
What is Inequality or Gini Index in Hiram?
Inequality or Gini Index in Hiram is 0.29.
What is the Total Population of Hiram?
Total Population of Hiram is 4,911.
What is the Total Male Population of Hiram?
Total Male Population of Hiram is 2,172.
What is the Total Female Population of Hiram?
Total Female Population of Hiram is 2,739.
What is the Ratio of Males per 100 Females in Hiram?
There are 79.30 Males per 100 Females in Hiram.
What is the Ratio of Females per 100 Males in Hiram?
There are 126.10 Females per 100 Males in Hiram.
What is the Median Population Age in Hiram?
Median Population Age in Hiram is 35.4 Years.
What is the Average Family Size in Hiram
Average Family Size in Hiram is 3.8 People.
What is the Average Household Size in Hiram
Average Household Size in Hiram is 2.8 People.
How Large is the Labor Force in Hiram?
There are 2,534 People in the Labor Forcein in Hiram.
What is the Percentage of People in the Labor Force in Hiram?
67.5% of People are in the Labor Force in Hiram.
What is the Unemployment Rate in Hiram?
Unemployment Rate in Hiram is 1.7%.