Tignall, GA Map & Demographics
Tignall Map
Tignall Overview
$21,757
PER CAPITA INCOME
$80,892
AVG FAMILY INCOME
$80,122
AVG HOUSEHOLD INCOME
42.5%
WAGE / INCOME GAP [ % ]
57.5¢/ $1
WAGE / INCOME GAP [ $ ]
0.35
INEQUALITY / GINI INDEX
1,163
TOTAL POPULATION
714
MALE POPULATION
449
FEMALE POPULATION
159.02
MALES / 100 FEMALES
62.89
FEMALES / 100 MALES
40.4
MEDIAN AGE
3.0
AVG FAMILY SIZE
2.6
AVG HOUSEHOLD SIZE
343
LABOR FORCE [ PEOPLE ]
39.8%
PERCENT IN LABOR FORCE
9.3%
UNEMPLOYMENT RATE
Tignall Zip Codes
Tignall Area Codes
Income in Tignall
Income Overview in Tignall
Per Capita Income in Tignall is $21,757, while median incomes of families and households are $80,892 and $80,122 respectively.
| Characteristic | Number | Measure |
| Per Capita Income | 1,163 | $21,757 |
| Median Family Income | 348 | $80,892 |
| Mean Family Income | 348 | $72,819 |
| Median Household Income | 440 | $80,122 |
| Mean Household Income | 440 | $63,895 |
| Income Deficit | 348 | $0 |
| Wage / Income Gap (%) | 1,163 | 42.49% |
| Wage / Income Gap ($) | 1,163 | 57.51¢ per $1 |
| Gini / Inequality Index | 1,163 | 0.35 |
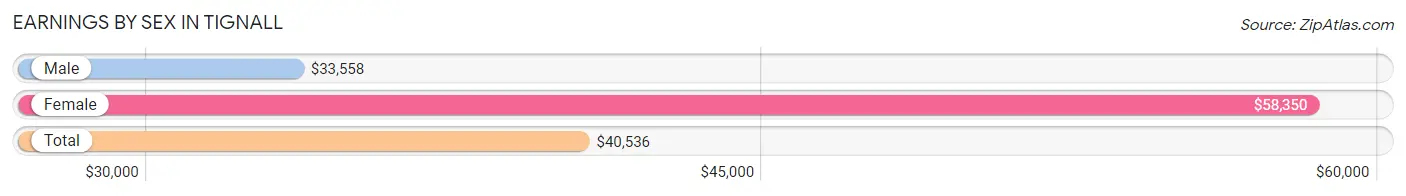
Earnings by Sex in Tignall
Average Earnings in Tignall are $40,536, $33,558 for men and $58,350 for women, a difference of 42.5%.
| Sex | Number | Average Earnings |
| Male | 199 (44.2%) | $33,558 |
| Female | 251 (55.8%) | $58,350 |
| Total | 450 (100.0%) | $40,536 |
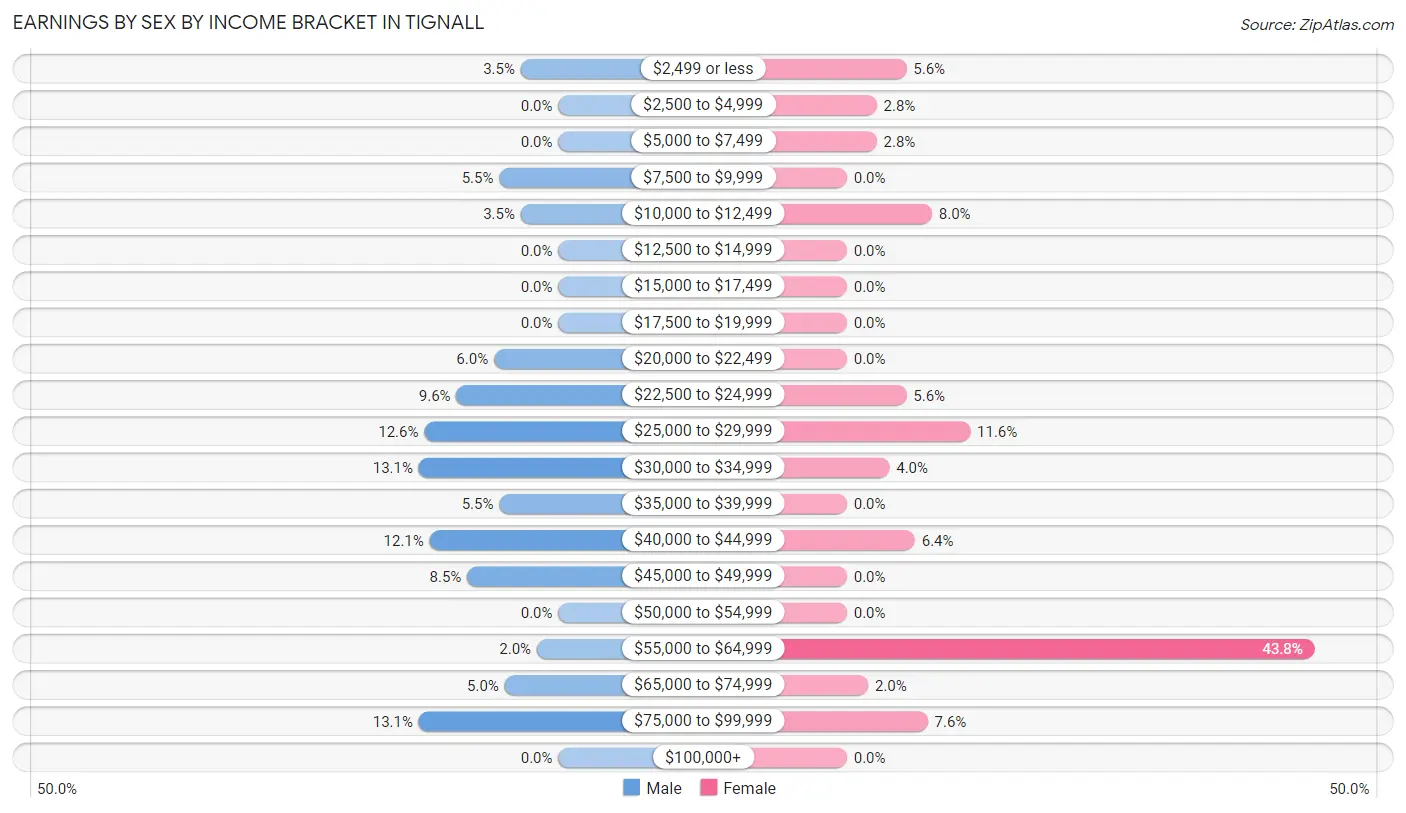
Earnings by Sex by Income Bracket in Tignall
The most common earnings brackets in Tignall are $30,000 to $34,999 for men (26 | 13.1%) and $55,000 to $64,999 for women (110 | 43.8%).
| Income | Male | Female |
| $2,499 or less | 7 (3.5%) | 14 (5.6%) |
| $2,500 to $4,999 | 0 (0.0%) | 7 (2.8%) |
| $5,000 to $7,499 | 0 (0.0%) | 7 (2.8%) |
| $7,500 to $9,999 | 11 (5.5%) | 0 (0.0%) |
| $10,000 to $12,499 | 7 (3.5%) | 20 (8.0%) |
| $12,500 to $14,999 | 0 (0.0%) | 0 (0.0%) |
| $15,000 to $17,499 | 0 (0.0%) | 0 (0.0%) |
| $17,500 to $19,999 | 0 (0.0%) | 0 (0.0%) |
| $20,000 to $22,499 | 12 (6.0%) | 0 (0.0%) |
| $22,500 to $24,999 | 19 (9.6%) | 14 (5.6%) |
| $25,000 to $29,999 | 25 (12.6%) | 29 (11.6%) |
| $30,000 to $34,999 | 26 (13.1%) | 10 (4.0%) |
| $35,000 to $39,999 | 11 (5.5%) | 0 (0.0%) |
| $40,000 to $44,999 | 24 (12.1%) | 16 (6.4%) |
| $45,000 to $49,999 | 17 (8.5%) | 0 (0.0%) |
| $50,000 to $54,999 | 0 (0.0%) | 0 (0.0%) |
| $55,000 to $64,999 | 4 (2.0%) | 110 (43.8%) |
| $65,000 to $74,999 | 10 (5.0%) | 5 (2.0%) |
| $75,000 to $99,999 | 26 (13.1%) | 19 (7.6%) |
| $100,000+ | 0 (0.0%) | 0 (0.0%) |
| Total | 199 (100.0%) | 251 (100.0%) |
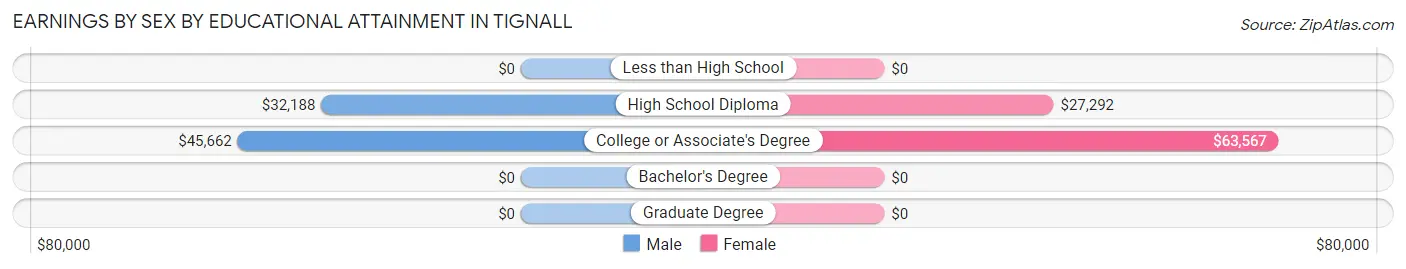
Earnings by Sex by Educational Attainment in Tignall
Average earnings in Tignall are $33,942 for men and $59,800 for women, a difference of 43.2%. Men with an educational attainment of college or associate's degree enjoy the highest average annual earnings of $45,662, while those with high school diploma education earn the least with $32,188. Women with an educational attainment of college or associate's degree earn the most with the average annual earnings of $63,567, while those with high school diploma education have the smallest earnings of $27,292.
| Educational Attainment | Male Income | Female Income |
| Less than High School | - | - |
| High School Diploma | $32,188 | $27,292 |
| College or Associate's Degree | $45,662 | $63,567 |
| Bachelor's Degree | - | - |
| Graduate Degree | - | - |
| Total | $33,942 | $59,800 |
Family Income in Tignall
Family Income Brackets in Tignall
According to the Tignall family income data, there are 156 families falling into the $75,000 to $99,999 income range, which is the most common income bracket and makes up 44.8% of all families.
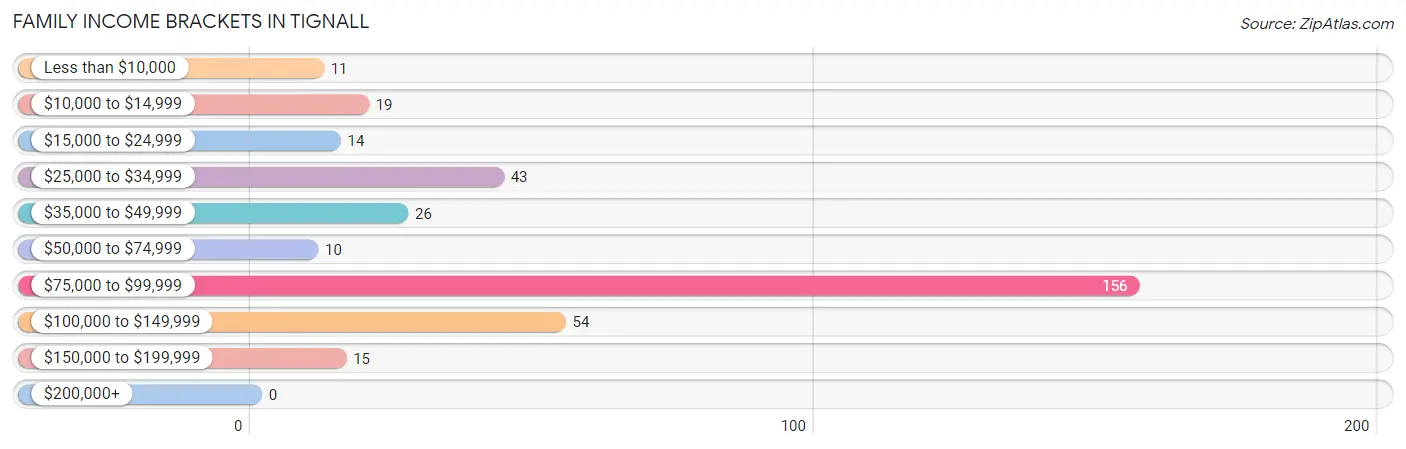
| Income Bracket | # Families | % Families |
| Less than $10,000 | 11 | 3.2% |
| $10,000 to $14,999 | 19 | 5.5% |
| $15,000 to $24,999 | 14 | 4.0% |
| $25,000 to $34,999 | 43 | 12.4% |
| $35,000 to $49,999 | 26 | 7.5% |
| $50,000 to $74,999 | 10 | 2.9% |
| $75,000 to $99,999 | 156 | 44.8% |
| $100,000 to $149,999 | 54 | 15.5% |
| $150,000 to $199,999 | 15 | 4.3% |
| $200,000+ | 0 | 0.0% |
Family Income by Famaliy Size in Tignall
3-person families (58 | 16.7%) account for the highest median family income in Tignall with $88,182 per family, while 3-person families (58 | 16.7%) have the highest median income of $29,394 per family member.
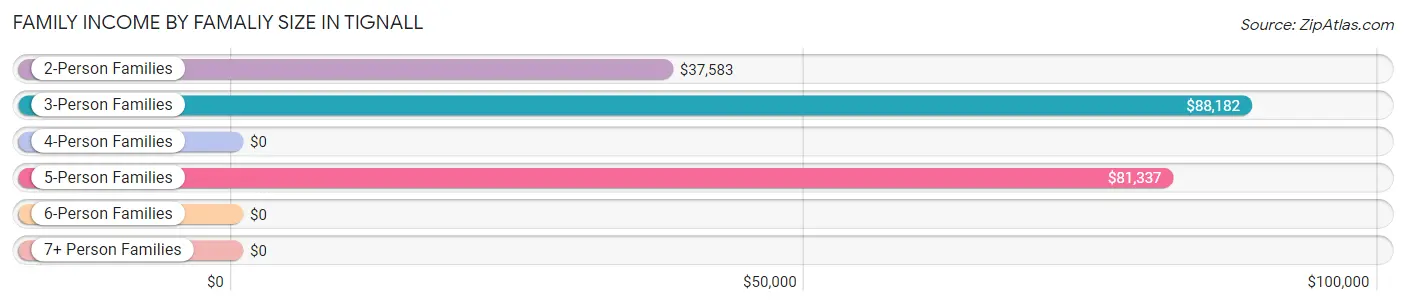
| Income Bracket | # Families | Median Income |
| 2-Person Families | 129 (37.1%) | $37,583 |
| 3-Person Families | 58 (16.7%) | $88,182 |
| 4-Person Families | 6 (1.7%) | $0 |
| 5-Person Families | 153 (44.0%) | $81,337 |
| 6-Person Families | 2 (0.6%) | $0 |
| 7+ Person Families | 0 (0.0%) | $0 |
| Total | 348 (100.0%) | $80,892 |
Family Income by Number of Earners in Tignall
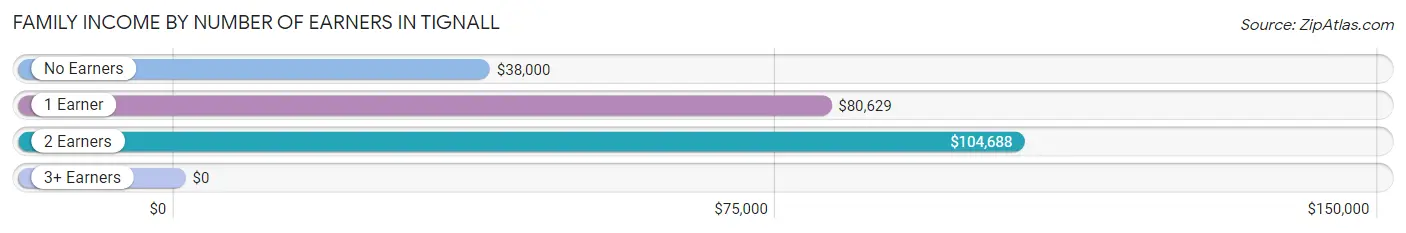
| Number of Earners | # Families | Median Income |
| No Earners | 44 (12.6%) | $38,000 |
| 1 Earner | 226 (64.9%) | $80,629 |
| 2 Earners | 68 (19.5%) | $104,688 |
| 3+ Earners | 10 (2.9%) | $0 |
| Total | 348 (100.0%) | $80,892 |
Household Income in Tignall
Household Income Brackets in Tignall
With 156 households falling in the category, the $75,000 to $99,999 income range is the most frequent in Tignall, accounting for 35.4% of all households.
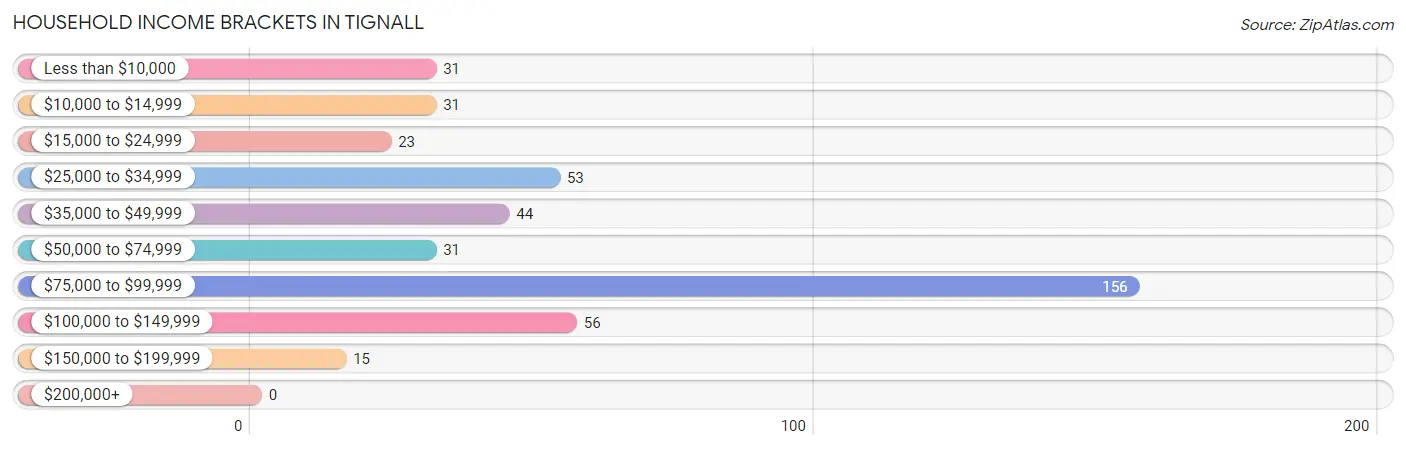
| Income Bracket | # Households | % Households |
| Less than $10,000 | 31 | 7.0% |
| $10,000 to $14,999 | 31 | 7.0% |
| $15,000 to $24,999 | 23 | 5.2% |
| $25,000 to $34,999 | 53 | 12.0% |
| $35,000 to $49,999 | 44 | 10.0% |
| $50,000 to $74,999 | 31 | 7.0% |
| $75,000 to $99,999 | 156 | 35.5% |
| $100,000 to $149,999 | 56 | 12.7% |
| $150,000 to $199,999 | 15 | 3.4% |
| $200,000+ | 0 | 0.0% |
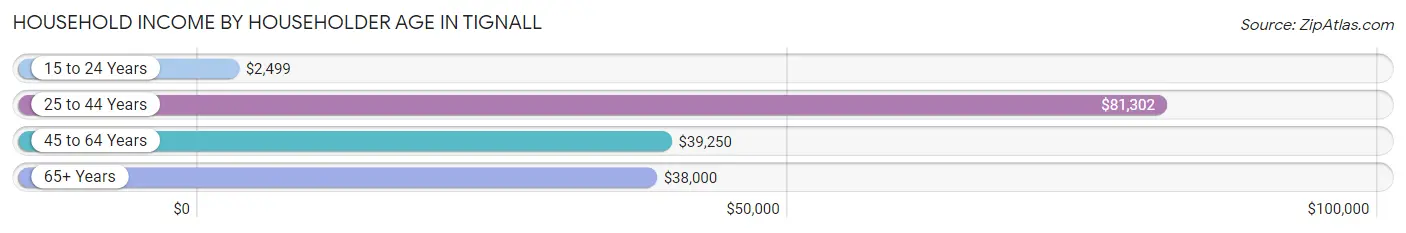
Household Income by Householder Age in Tignall
The median household income in Tignall is $80,122, with the highest median household income of $81,302 found in the 25 to 44 years age bracket for the primary householder. A total of 215 households (48.9%) fall into this category. Meanwhile, the 15 to 24 years age bracket for the primary householder has the lowest median household income of $2,499, with 24 households (5.4%) in this group.
| Income Bracket | # Households | Median Income |
| 15 to 24 Years | 24 (5.4%) | $2,499 |
| 25 to 44 Years | 215 (48.9%) | $81,302 |
| 45 to 64 Years | 77 (17.5%) | $39,250 |
| 65+ Years | 124 (28.2%) | $38,000 |
| Total | 440 (100.0%) | $80,122 |
Poverty in Tignall
Income Below Poverty by Sex and Age in Tignall
With 11.5% poverty level for males and 27.2% for females among the residents of Tignall, 65 to 74 year old males and 18 to 24 year old females are the most vulnerable to poverty, with 8 males (50.0%) and 24 females (70.6%) in their respective age groups living below the poverty level.
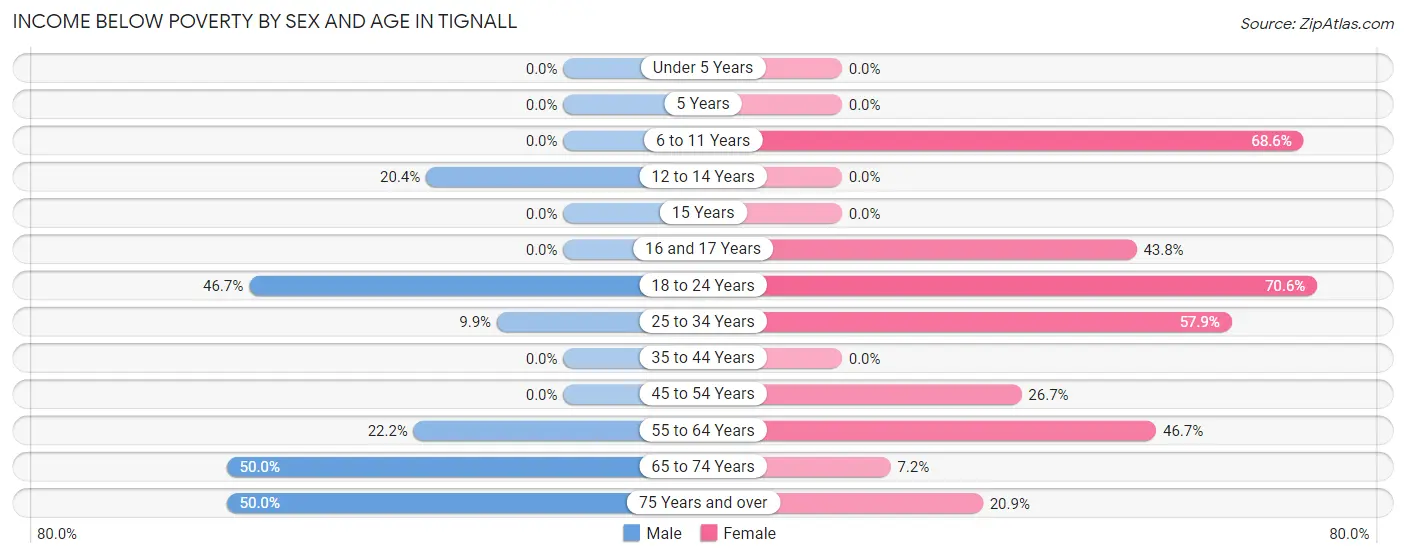
| Age Bracket | Male | Female |
| Under 5 Years | 0 (0.0%) | 0 (0.0%) |
| 5 Years | 0 (0.0%) | 0 (0.0%) |
| 6 to 11 Years | 0 (0.0%) | 24 (68.6%) |
| 12 to 14 Years | 32 (20.4%) | 0 (0.0%) |
| 15 Years | 0 (0.0%) | 0 (0.0%) |
| 16 and 17 Years | 0 (0.0%) | 7 (43.8%) |
| 18 to 24 Years | 7 (46.7%) | 24 (70.6%) |
| 25 to 34 Years | 7 (9.9%) | 33 (57.9%) |
| 35 to 44 Years | 0 (0.0%) | 0 (0.0%) |
| 45 to 54 Years | 0 (0.0%) | 12 (26.7%) |
| 55 to 64 Years | 12 (22.2%) | 7 (46.7%) |
| 65 to 74 Years | 8 (50.0%) | 6 (7.2%) |
| 75 Years and over | 16 (50.0%) | 9 (20.9%) |
| Total | 82 (11.5%) | 122 (27.2%) |
Income Above Poverty by Sex and Age in Tignall
According to the poverty statistics in Tignall, males aged under 5 years and females aged under 5 years are the age groups that are most secure financially, with 100.0% of males and 100.0% of females in these age groups living above the poverty line.
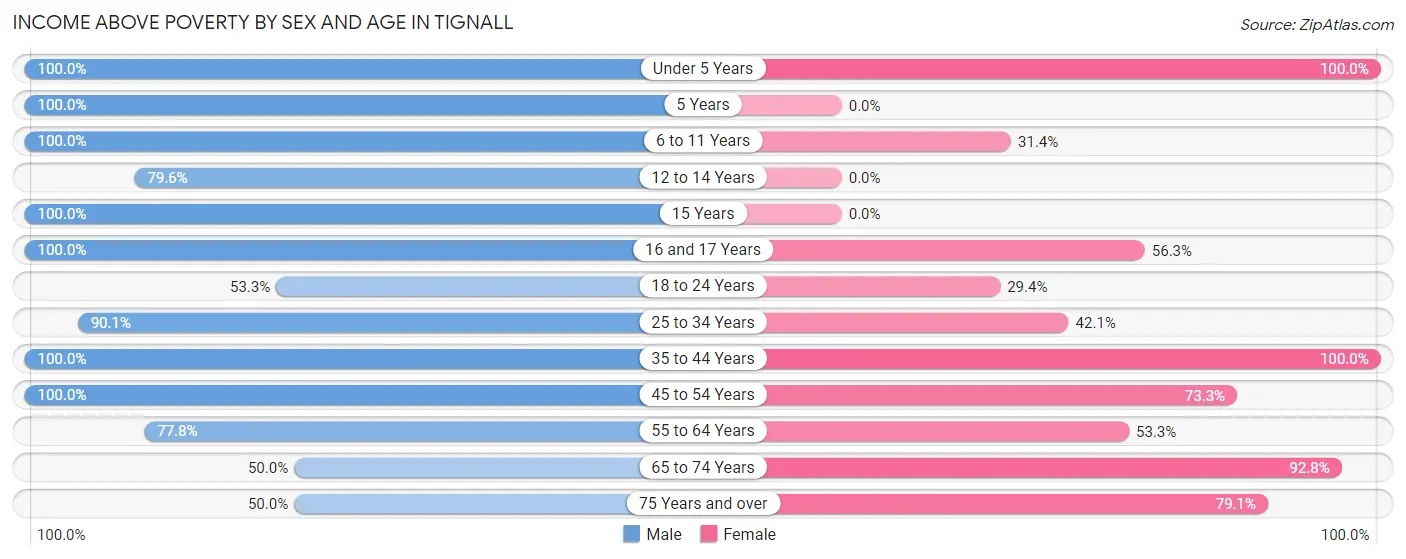
| Age Bracket | Male | Female |
| Under 5 Years | 23 (100.0%) | 12 (100.0%) |
| 5 Years | 4 (100.0%) | 0 (0.0%) |
| 6 to 11 Years | 29 (100.0%) | 11 (31.4%) |
| 12 to 14 Years | 125 (79.6%) | 0 (0.0%) |
| 15 Years | 39 (100.0%) | 0 (0.0%) |
| 16 and 17 Years | 42 (100.0%) | 9 (56.2%) |
| 18 to 24 Years | 8 (53.3%) | 10 (29.4%) |
| 25 to 34 Years | 64 (90.1%) | 24 (42.1%) |
| 35 to 44 Years | 180 (100.0%) | 109 (100.0%) |
| 45 to 54 Years | 50 (100.0%) | 33 (73.3%) |
| 55 to 64 Years | 42 (77.8%) | 8 (53.3%) |
| 65 to 74 Years | 8 (50.0%) | 77 (92.8%) |
| 75 Years and over | 16 (50.0%) | 34 (79.1%) |
| Total | 630 (88.5%) | 327 (72.8%) |
Income Below Poverty Among Married-Couple Families in Tignall
The poverty statistics for married-couple families in Tignall show that 5.0% or 13 of the total 259 families live below the poverty line. Families with no children have the highest poverty rate of 14.6%, comprising of 13 families. On the other hand, families with 1 or 2 children have the lowest poverty rate of 0.0%, which includes 0 families.
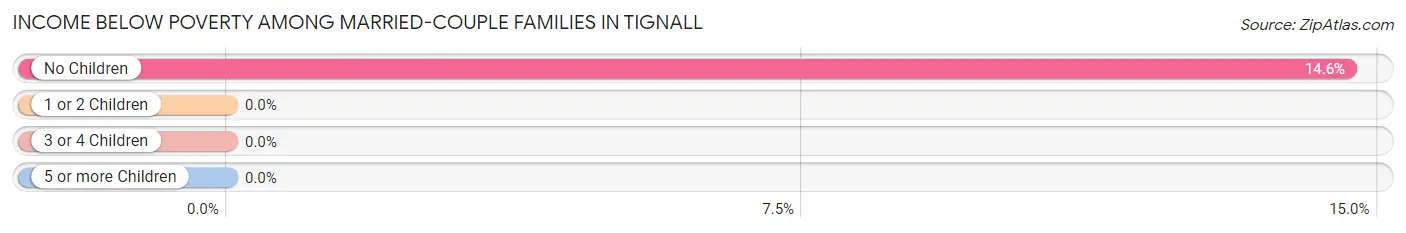
| Children | Above Poverty | Below Poverty |
| No Children | 76 (85.4%) | 13 (14.6%) |
| 1 or 2 Children | 25 (100.0%) | 0 (0.0%) |
| 3 or 4 Children | 145 (100.0%) | 0 (0.0%) |
| 5 or more Children | 0 (0.0%) | 0 (0.0%) |
| Total | 246 (95.0%) | 13 (5.0%) |
Income Below Poverty Among Single-Parent Households in Tignall
According to the poverty data in Tignall, 84.2% or 16 single-father households and 22.9% or 16 single-mother households are living below the poverty line. Among single-father households, those with no children have the highest poverty rate, with 5 households (100.0%) experiencing poverty. Likewise, among single-mother households, those with 3 or 4 children have the highest poverty rate, with 2 households (100.0%) falling below the poverty line.
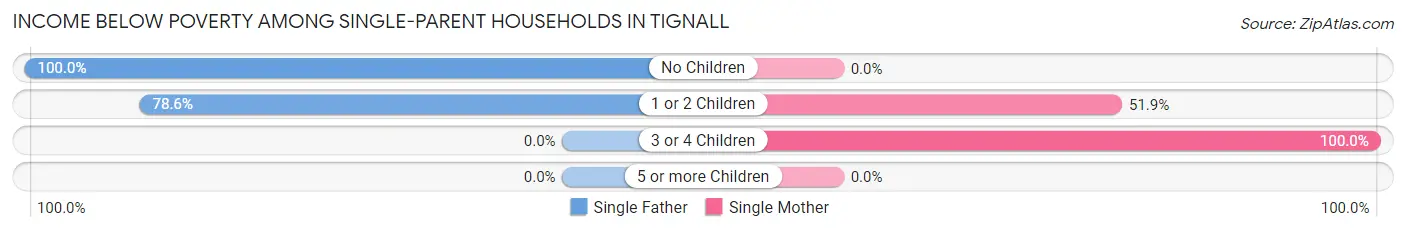
| Children | Single Father | Single Mother |
| No Children | 5 (100.0%) | 0 (0.0%) |
| 1 or 2 Children | 11 (78.6%) | 14 (51.8%) |
| 3 or 4 Children | 0 (0.0%) | 2 (100.0%) |
| 5 or more Children | 0 (0.0%) | 0 (0.0%) |
| Total | 16 (84.2%) | 16 (22.9%) |
Income Below Poverty Among Married-Couple vs Single-Parent Households in Tignall
The poverty data for Tignall shows that 13 of the married-couple family households (5.0%) and 32 of the single-parent households (36.0%) are living below the poverty level. Within the married-couple family households, those with no children have the highest poverty rate, with 13 households (14.6%) falling below the poverty line. Among the single-parent households, those with 3 or 4 children have the highest poverty rate, with 2 household (100.0%) living below poverty.
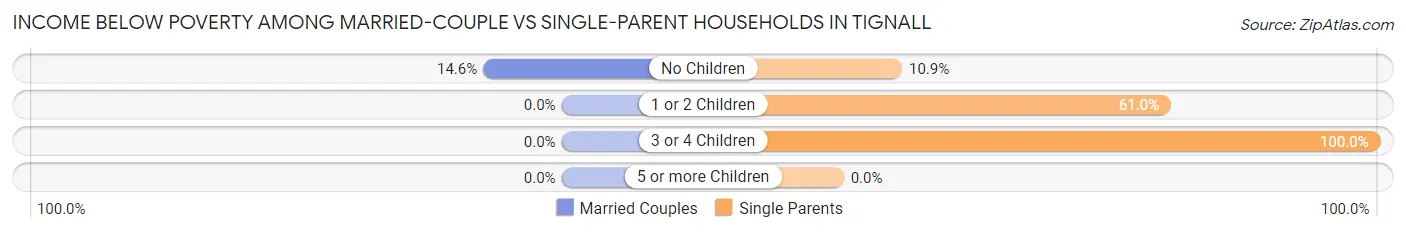
| Children | Married-Couple Families | Single-Parent Households |
| No Children | 13 (14.6%) | 5 (10.9%) |
| 1 or 2 Children | 0 (0.0%) | 25 (61.0%) |
| 3 or 4 Children | 0 (0.0%) | 2 (100.0%) |
| 5 or more Children | 0 (0.0%) | 0 (0.0%) |
| Total | 13 (5.0%) | 32 (36.0%) |
Race in Tignall
The most populous races in Tignall are Black / African American (806 | 69.3%), White / Caucasian (306 | 26.3%), and Two or more Races (45 | 3.9%).
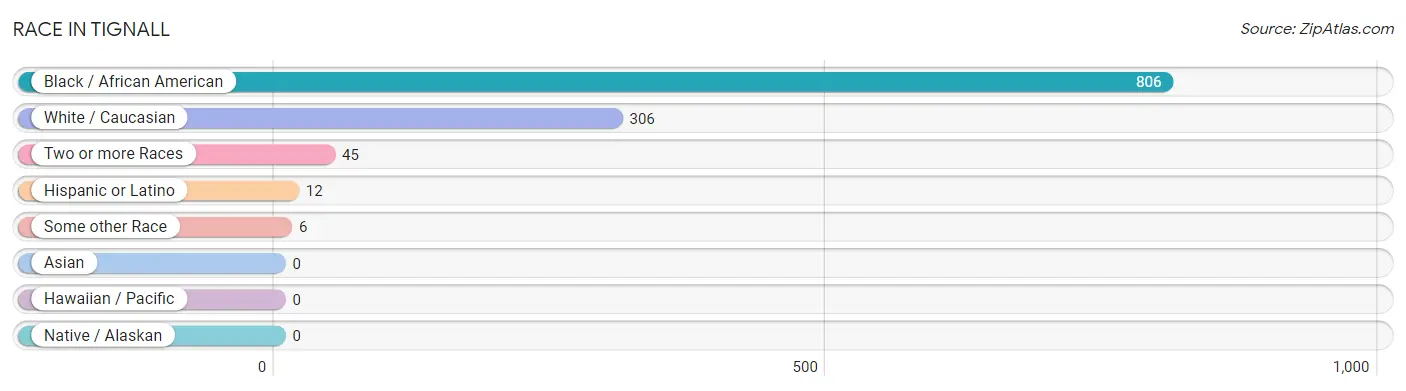
| Race | # Population | % Population |
| Asian | 0 | 0.0% |
| Black / African American | 806 | 69.3% |
| Hawaiian / Pacific | 0 | 0.0% |
| Hispanic or Latino | 12 | 1.0% |
| Native / Alaskan | 0 | 0.0% |
| White / Caucasian | 306 | 26.3% |
| Two or more Races | 45 | 3.9% |
| Some other Race | 6 | 0.5% |
| Total | 1,163 | 100.0% |
Ancestry in Tignall
The most populous ancestries reported in Tignall are American (56 | 4.8%), English (53 | 4.6%), Irish (45 | 3.9%), Scotch-Irish (39 | 3.4%), and Polish (34 | 2.9%), together accounting for 19.5% of all Tignall residents.
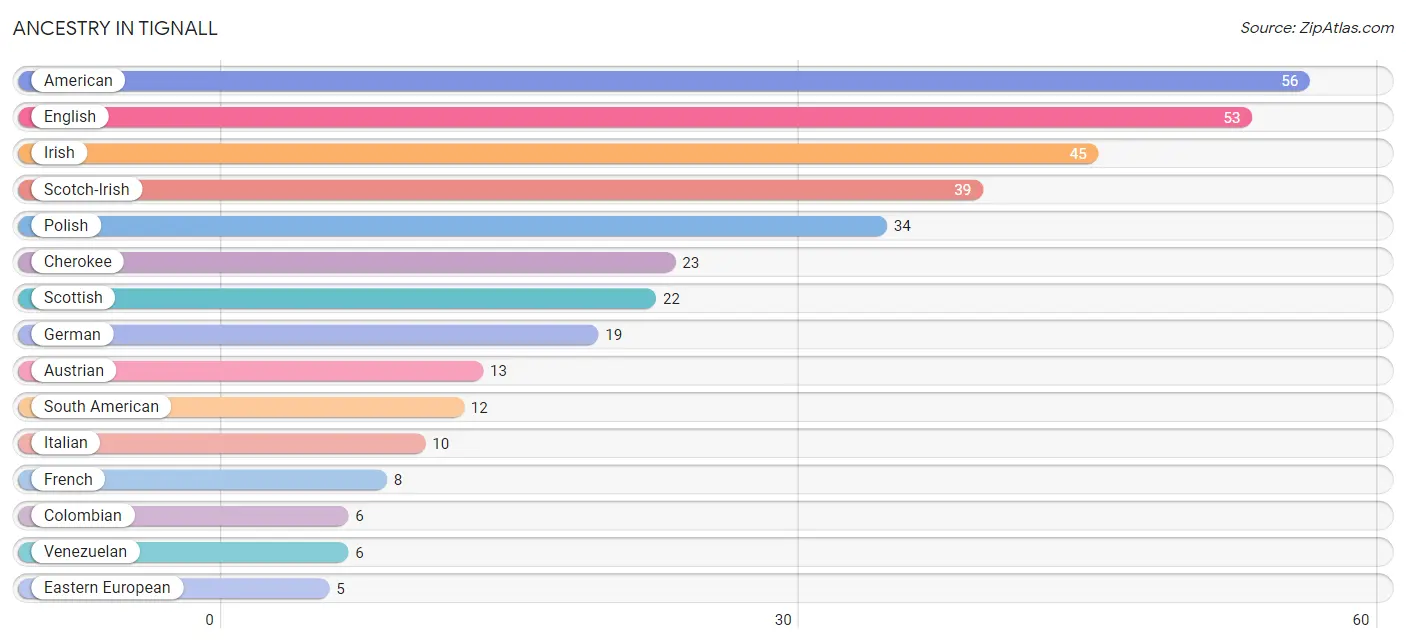
| Ancestry | # Population | % Population |
| American | 56 | 4.8% |
| Austrian | 13 | 1.1% |
| Cherokee | 23 | 2.0% |
| Colombian | 6 | 0.5% |
| Eastern European | 5 | 0.4% |
| English | 53 | 4.6% |
| French | 8 | 0.7% |
| German | 19 | 1.6% |
| Irish | 45 | 3.9% |
| Italian | 10 | 0.9% |
| Polish | 34 | 2.9% |
| Scotch-Irish | 39 | 3.4% |
| Scottish | 22 | 1.9% |
| South American | 12 | 1.0% |
| Swiss | 3 | 0.3% |
| Venezuelan | 6 | 0.5% | View All 16 Rows |
Immigrants in Tignall
The most numerous immigrant groups reported in Tignall came from Latin America (12 | 1.0%), South America (12 | 1.0%), Colombia (6 | 0.5%), and Venezuela (6 | 0.5%), together accounting for 3.1% of all Tignall residents.
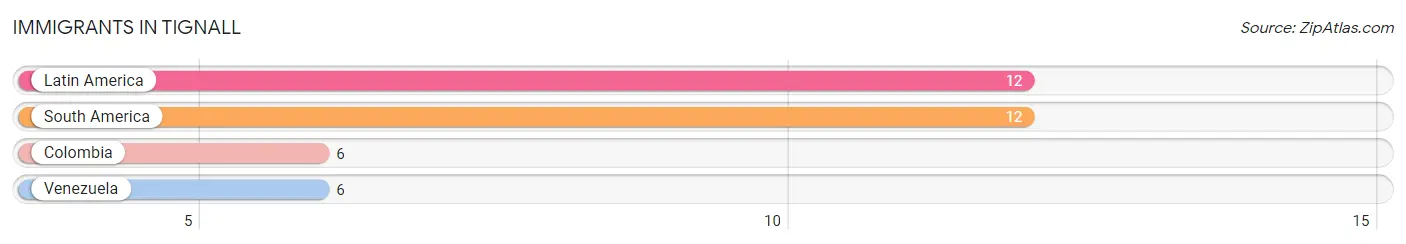
| Immigration Origin | # Population | % Population |
| Colombia | 6 | 0.5% |
| Latin America | 12 | 1.0% |
| South America | 12 | 1.0% |
| Venezuela | 6 | 0.5% | View All 4 Rows |
Sex and Age in Tignall
Sex and Age in Tignall
The most populous age groups in Tignall are 10 to 14 Years (186 | 26.1%) for men and 40 to 44 Years (106 | 23.6%) for women.
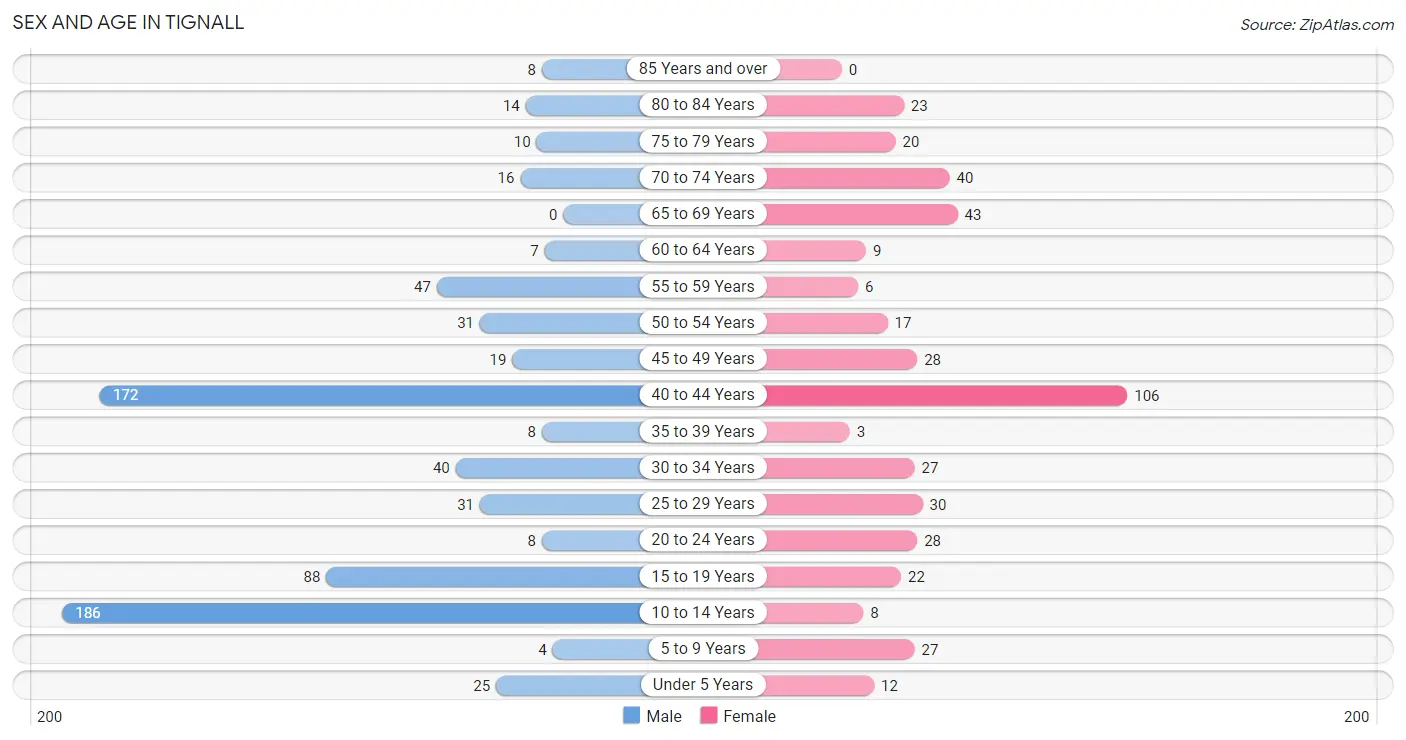
| Age Bracket | Male | Female |
| Under 5 Years | 25 (3.5%) | 12 (2.7%) |
| 5 to 9 Years | 4 (0.6%) | 27 (6.0%) |
| 10 to 14 Years | 186 (26.1%) | 8 (1.8%) |
| 15 to 19 Years | 88 (12.3%) | 22 (4.9%) |
| 20 to 24 Years | 8 (1.1%) | 28 (6.2%) |
| 25 to 29 Years | 31 (4.3%) | 30 (6.7%) |
| 30 to 34 Years | 40 (5.6%) | 27 (6.0%) |
| 35 to 39 Years | 8 (1.1%) | 3 (0.7%) |
| 40 to 44 Years | 172 (24.1%) | 106 (23.6%) |
| 45 to 49 Years | 19 (2.7%) | 28 (6.2%) |
| 50 to 54 Years | 31 (4.3%) | 17 (3.8%) |
| 55 to 59 Years | 47 (6.6%) | 6 (1.3%) |
| 60 to 64 Years | 7 (1.0%) | 9 (2.0%) |
| 65 to 69 Years | 0 (0.0%) | 43 (9.6%) |
| 70 to 74 Years | 16 (2.2%) | 40 (8.9%) |
| 75 to 79 Years | 10 (1.4%) | 20 (4.4%) |
| 80 to 84 Years | 14 (2.0%) | 23 (5.1%) |
| 85 Years and over | 8 (1.1%) | 0 (0.0%) |
| Total | 714 (100.0%) | 449 (100.0%) |
Families and Households in Tignall
Median Family Size in Tignall
The median family size in Tignall is 3.01 persons per family, with single male/father families (19 | 5.5%) accounting for the largest median family size of 4.37 persons per family. On the other hand, married-couple families (259 | 74.4%) represent the smallest median family size with 2.93 persons per family.
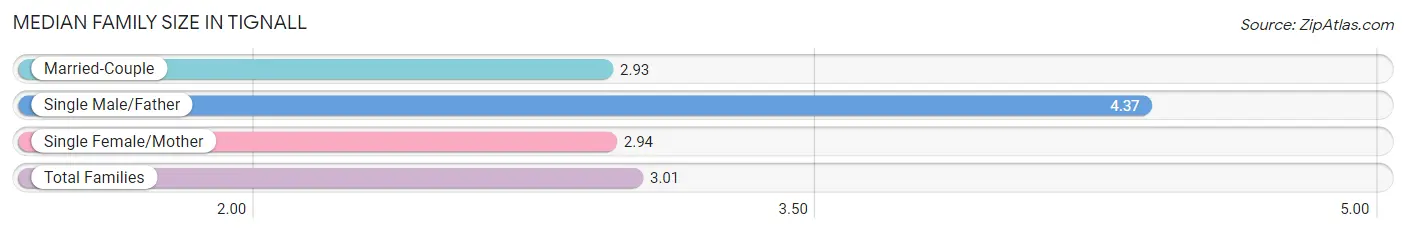
| Family Type | # Families | Family Size |
| Married-Couple | 259 (74.4%) | 2.93 |
| Single Male/Father | 19 (5.5%) | 4.37 |
| Single Female/Mother | 70 (20.1%) | 2.94 |
| Total Families | 348 (100.0%) | 3.01 |
Median Household Size in Tignall
The median household size in Tignall is 2.64 persons per household, with single male/father households (19 | 4.3%) accounting for the largest median household size of 4.37 persons per household. non-family households (92 | 20.9%) represent the smallest median household size with 1.15 persons per household.
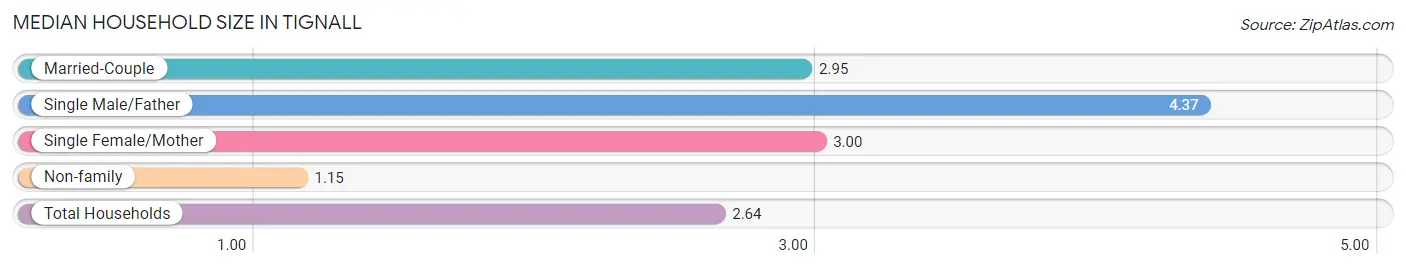
| Household Type | # Households | Household Size |
| Married-Couple | 259 (58.9%) | 2.95 |
| Single Male/Father | 19 (4.3%) | 4.37 |
| Single Female/Mother | 70 (15.9%) | 3.00 |
| Non-family | 92 (20.9%) | 1.15 |
| Total Households | 440 (100.0%) | 2.64 |
Household Size by Marriage Status in Tignall
Out of a total of 440 households in Tignall, 348 (79.1%) are family households, while 92 (20.9%) are nonfamily households. The most numerous type of family households are 5-person households, comprising 153, and the most common type of nonfamily households are 1-person households, comprising 86.
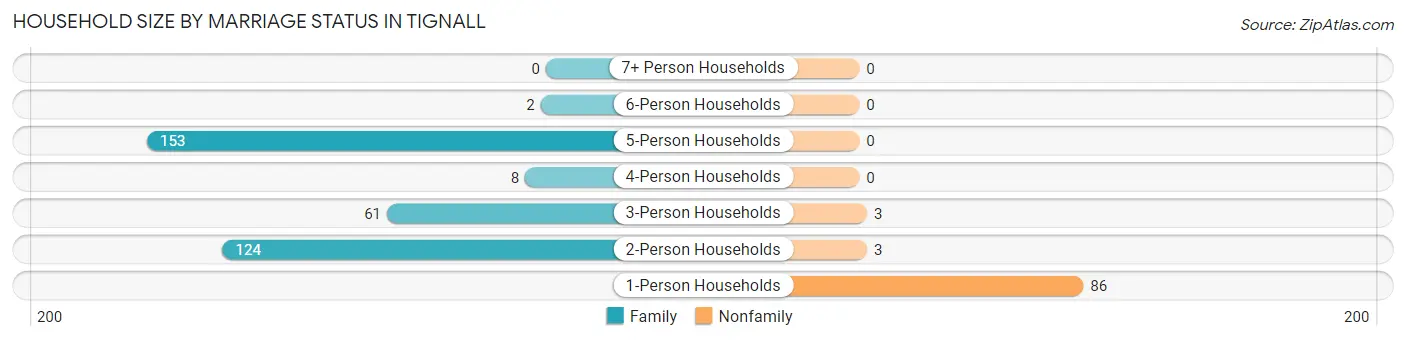
| Household Size | Family Households | Nonfamily Households |
| 1-Person Households | - | 86 (19.6%) |
| 2-Person Households | 124 (28.2%) | 3 (0.7%) |
| 3-Person Households | 61 (13.9%) | 3 (0.7%) |
| 4-Person Households | 8 (1.8%) | 0 (0.0%) |
| 5-Person Households | 153 (34.8%) | 0 (0.0%) |
| 6-Person Households | 2 (0.4%) | 0 (0.0%) |
| 7+ Person Households | 0 (0.0%) | 0 (0.0%) |
| Total | 348 (79.1%) | 92 (20.9%) |
Female Fertility in Tignall
Fertility by Age in Tignall
Average fertility rate in Tignall is 41.0 births per 1,000 women. Women in the age bracket of 20 to 34 years have the highest fertility rate with 118.0 births per 1,000 women. Women in the age bracket of 20 to 34 years acount for 100.0% of all women with births.
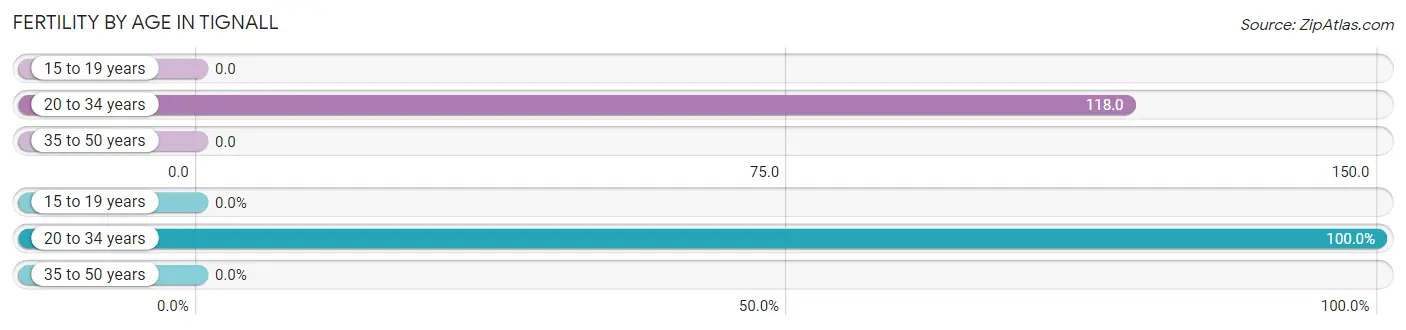
| Age Bracket | Women with Births | Births / 1,000 Women |
| 15 to 19 years | 0 (0.0%) | 0.0 |
| 20 to 34 years | 10 (100.0%) | 118.0 |
| 35 to 50 years | 0 (0.0%) | 0.0 |
| Total | 10 (100.0%) | 41.0 |
Fertility by Age by Marriage Status in Tignall
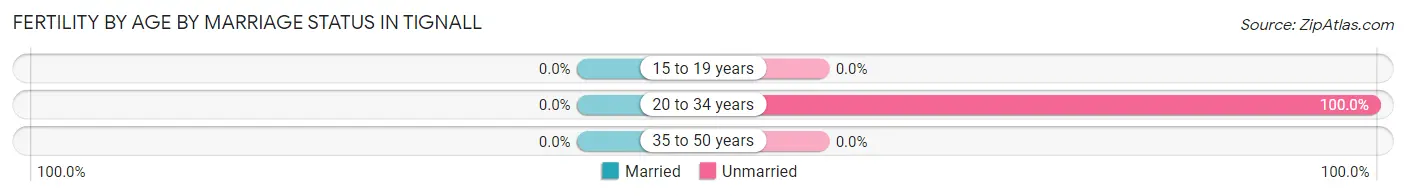
| Age Bracket | Married | Unmarried |
| 15 to 19 years | 0 (0.0%) | 0 (0.0%) |
| 20 to 34 years | 0 (0.0%) | 10 (100.0%) |
| 35 to 50 years | 0 (0.0%) | 0 (0.0%) |
| Total | 0 (0.0%) | 10 (100.0%) |
Fertility by Education in Tignall
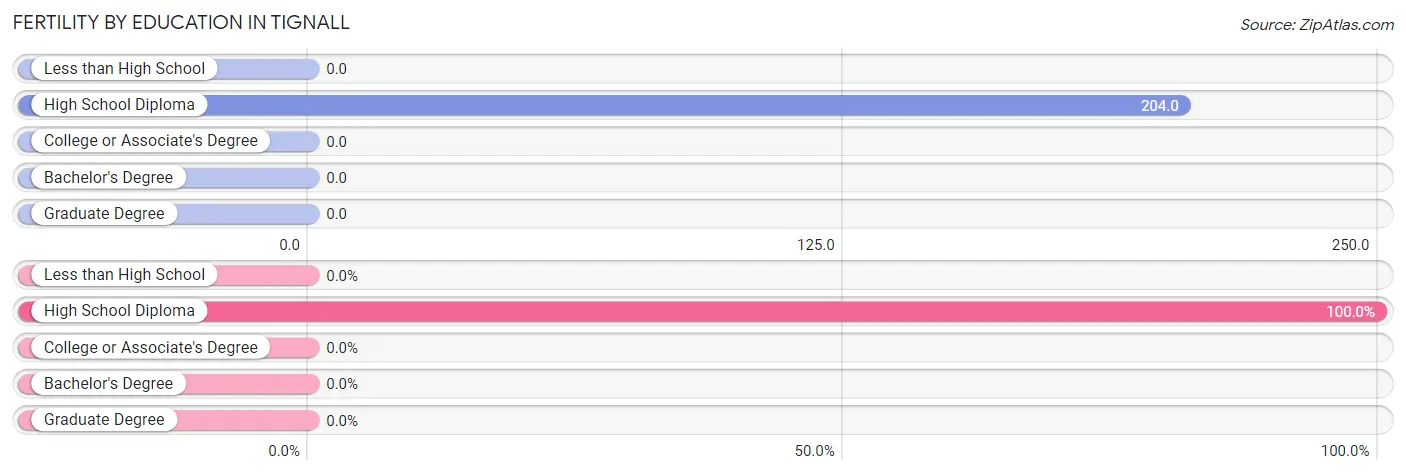
| Educational Attainment | Women with Births | Births / 1,000 Women |
| Less than High School | 0 (0.0%) | 0.0 |
| High School Diploma | 10 (100.0%) | 204.0 |
| College or Associate's Degree | 0 (0.0%) | 0.0 |
| Bachelor's Degree | 0 (0.0%) | 0.0 |
| Graduate Degree | 0 (0.0%) | 0.0 |
| Total | 10 (100.0%) | 41.0 |
Fertility by Education by Marriage Status in Tignall
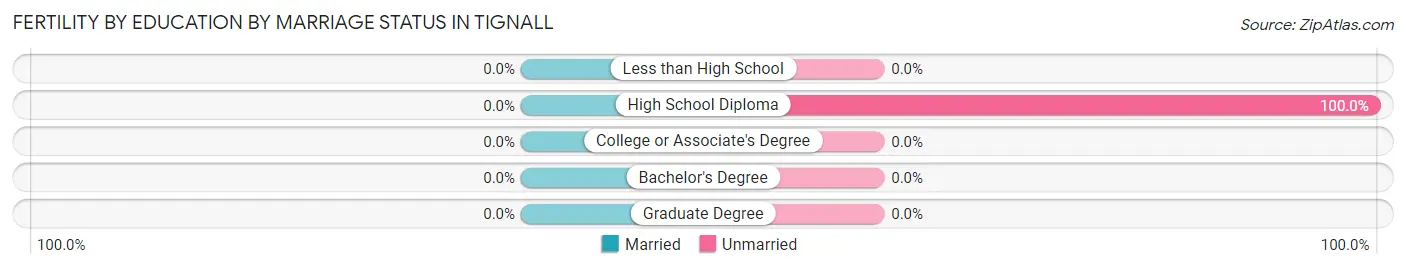
| Educational Attainment | Married | Unmarried |
| Less than High School | 0 (0.0%) | 0 (0.0%) |
| High School Diploma | 0 (0.0%) | 10 (100.0%) |
| College or Associate's Degree | 0 (0.0%) | 0 (0.0%) |
| Bachelor's Degree | 0 (0.0%) | 0 (0.0%) |
| Graduate Degree | 0 (0.0%) | 0 (0.0%) |
| Total | 0 (0.0%) | 10 (100.0%) |
Employment Characteristics in Tignall
Employment by Class of Employer in Tignall
Among the 311 employed individuals in Tignall, private company employees (187 | 60.1%), not-for-profit organizations (43 | 13.8%), and local government employees (23 | 7.4%) make up the most common classes of employment.
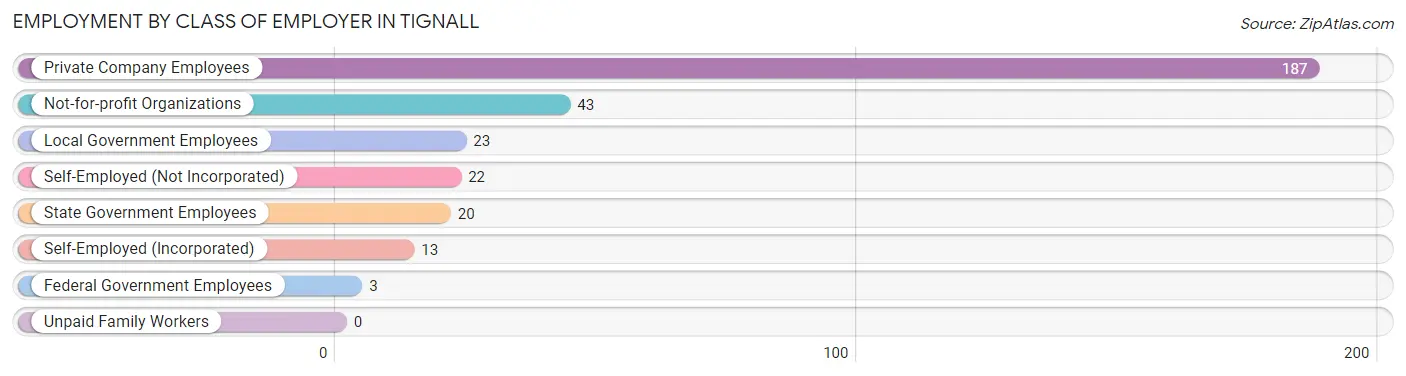
| Employer Class | # Employees | % Employees |
| Private Company Employees | 187 | 60.1% |
| Self-Employed (Incorporated) | 13 | 4.2% |
| Self-Employed (Not Incorporated) | 22 | 7.1% |
| Not-for-profit Organizations | 43 | 13.8% |
| Local Government Employees | 23 | 7.4% |
| State Government Employees | 20 | 6.4% |
| Federal Government Employees | 3 | 1.0% |
| Unpaid Family Workers | 0 | 0.0% |
| Total | 311 | 100.0% |
Employment Status by Age in Tignall
According to the labor force statistics for Tignall, out of the total population over 16 years of age (862), 39.8% or 343 individuals are in the labor force, with 9.3% or 32 of them unemployed. The age group with the highest labor force participation rate is 25 to 29 years, with 100.0% or 61 individuals in the labor force. Within the labor force, the 16 to 19 years age range has the highest percentage of unemployed individuals, with 100.0% or 14 of them being unemployed.
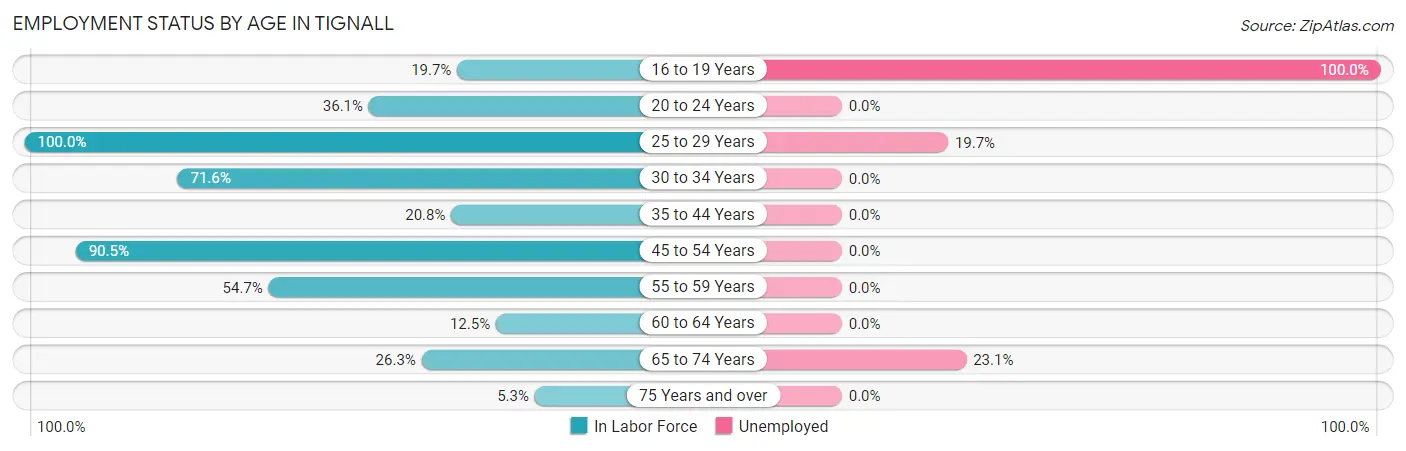
| Age Bracket | In Labor Force | Unemployed |
| 16 to 19 Years | 14 (19.7%) | 14 (100.0%) |
| 20 to 24 Years | 13 (36.1%) | 0 (0.0%) |
| 25 to 29 Years | 61 (100.0%) | 12 (19.7%) |
| 30 to 34 Years | 48 (71.6%) | 0 (0.0%) |
| 35 to 44 Years | 60 (20.8%) | 0 (0.0%) |
| 45 to 54 Years | 86 (90.5%) | 0 (0.0%) |
| 55 to 59 Years | 29 (54.7%) | 0 (0.0%) |
| 60 to 64 Years | 2 (12.5%) | 0 (0.0%) |
| 65 to 74 Years | 26 (26.3%) | 6 (23.1%) |
| 75 Years and over | 4 (5.3%) | 0 (0.0%) |
| Total | 343 (39.8%) | 32 (9.3%) |
Employment Status by Educational Attainment in Tignall
According to labor force statistics for Tignall, 49.2% of individuals (286) out of the total population between 25 and 64 years of age (581) are in the labor force, with 4.2% or 12 of them being unemployed. The group with the highest labor force participation rate are those with the educational attainment of bachelor's degree or higher, with 100.0% or 34 individuals in the labor force. Within the labor force, individuals with bachelor's degree or higher education have the highest percentage of unemployment, with 14.7% or 5 of them being unemployed.
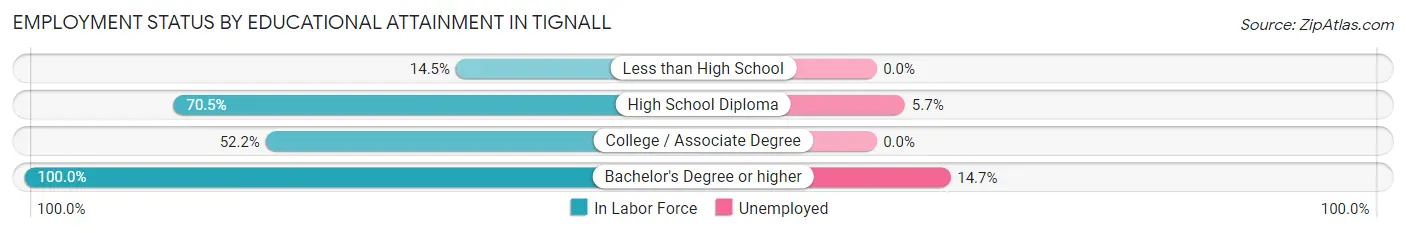
| Educational Attainment | In Labor Force | Unemployed |
| Less than High School | 25 (14.5%) | 0 (0.0%) |
| High School Diploma | 122 (70.5%) | 10 (5.7%) |
| College / Associate Degree | 105 (52.2%) | 0 (0.0%) |
| Bachelor's Degree or higher | 34 (100.0%) | 5 (14.7%) |
| Total | 286 (49.2%) | 24 (4.2%) |
Employment Occupations by Sex in Tignall
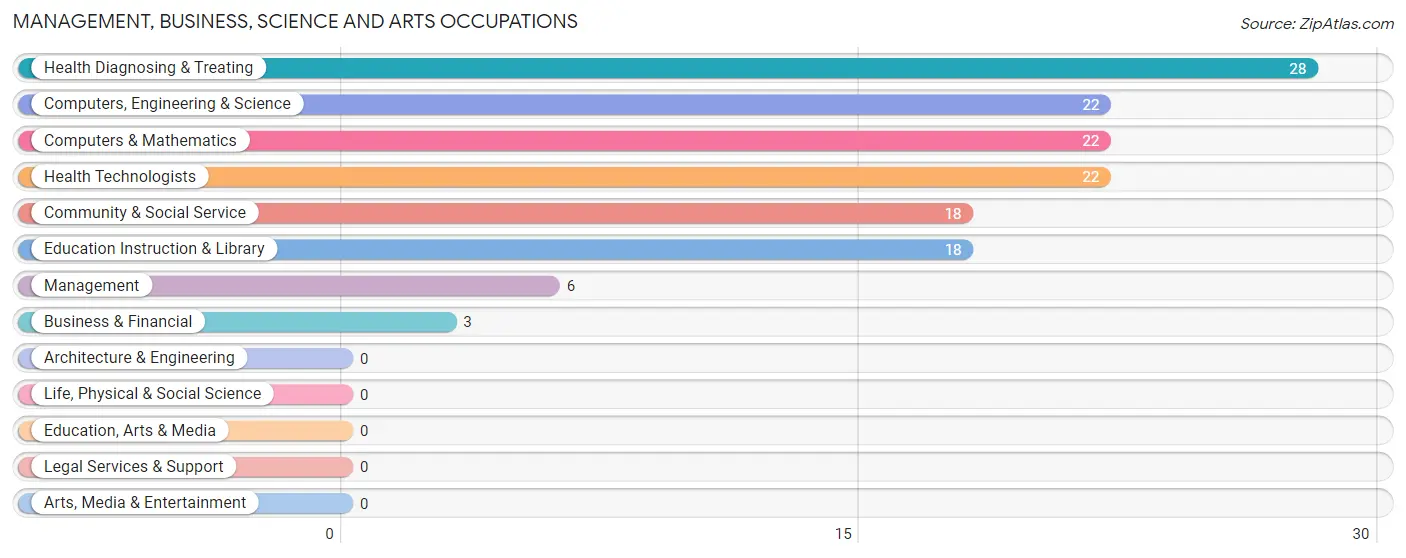
Management, Business, Science and Arts Occupations
The most common Management, Business, Science and Arts occupations in Tignall are Health Diagnosing & Treating (28 | 9.0%), Computers, Engineering & Science (22 | 7.1%), Computers & Mathematics (22 | 7.1%), Health Technologists (22 | 7.1%), and Community & Social Service (18 | 5.8%).
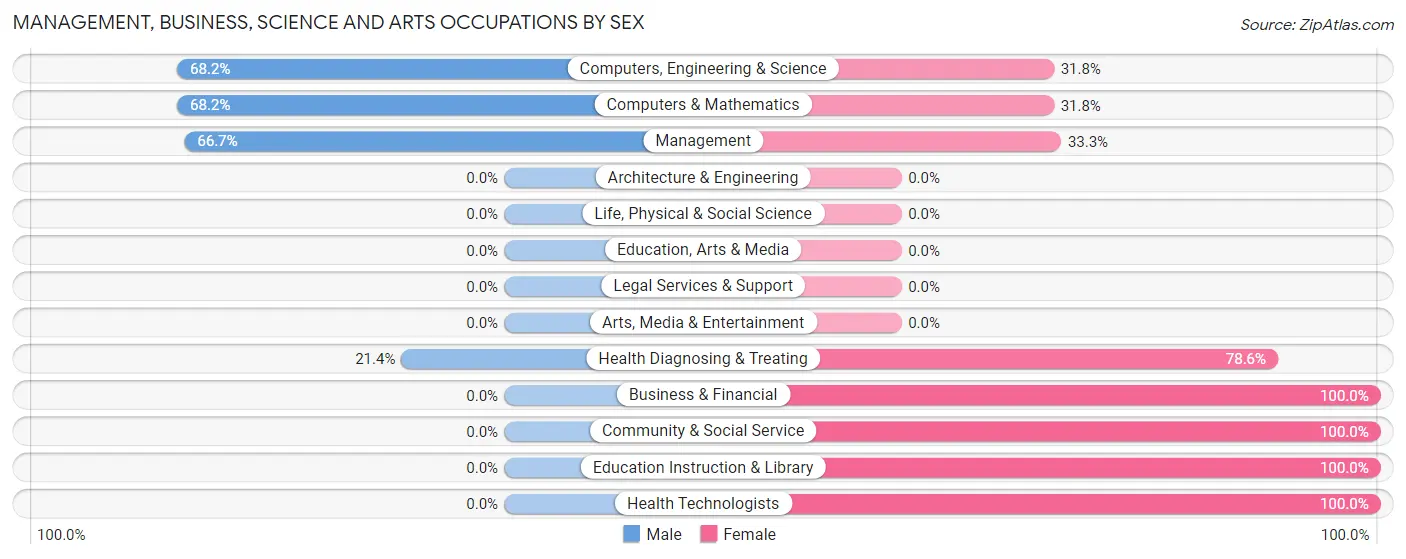
Management, Business, Science and Arts Occupations by Sex
Within the Management, Business, Science and Arts occupations in Tignall, the most male-oriented occupations are Computers, Engineering & Science (68.2%), Computers & Mathematics (68.2%), and Management (66.7%), while the most female-oriented occupations are Business & Financial (100.0%), Community & Social Service (100.0%), and Education Instruction & Library (100.0%).
| Occupation | Male | Female |
| Management | 4 (66.7%) | 2 (33.3%) |
| Business & Financial | 0 (0.0%) | 3 (100.0%) |
| Computers, Engineering & Science | 15 (68.2%) | 7 (31.8%) |
| Computers & Mathematics | 15 (68.2%) | 7 (31.8%) |
| Architecture & Engineering | 0 (0.0%) | 0 (0.0%) |
| Life, Physical & Social Science | 0 (0.0%) | 0 (0.0%) |
| Community & Social Service | 0 (0.0%) | 18 (100.0%) |
| Education, Arts & Media | 0 (0.0%) | 0 (0.0%) |
| Legal Services & Support | 0 (0.0%) | 0 (0.0%) |
| Education Instruction & Library | 0 (0.0%) | 18 (100.0%) |
| Arts, Media & Entertainment | 0 (0.0%) | 0 (0.0%) |
| Health Diagnosing & Treating | 6 (21.4%) | 22 (78.6%) |
| Health Technologists | 0 (0.0%) | 22 (100.0%) |
| Total (Category) | 25 (32.5%) | 52 (67.5%) |
| Total (Overall) | 170 (54.7%) | 141 (45.3%) |
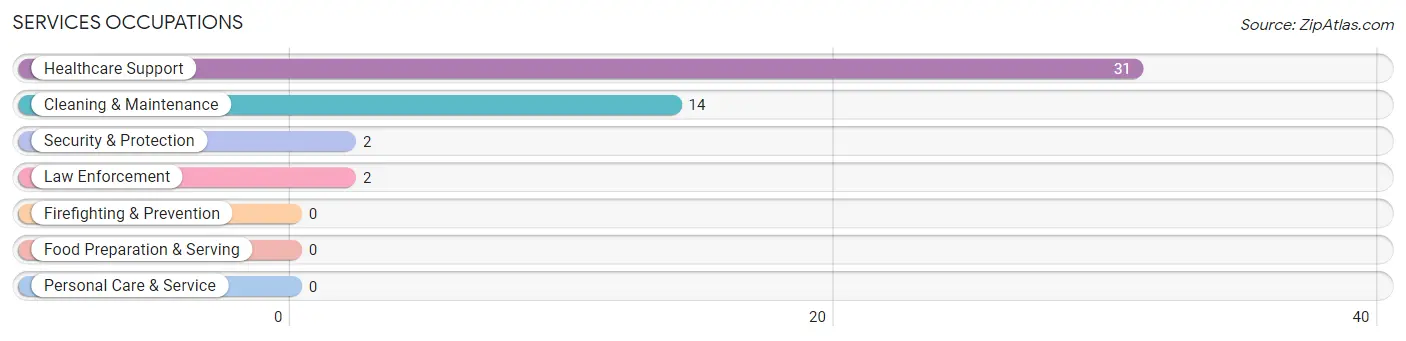
Services Occupations
The most common Services occupations in Tignall are Healthcare Support (31 | 10.0%), Cleaning & Maintenance (14 | 4.5%), Security & Protection (2 | 0.6%), and Law Enforcement (2 | 0.6%).
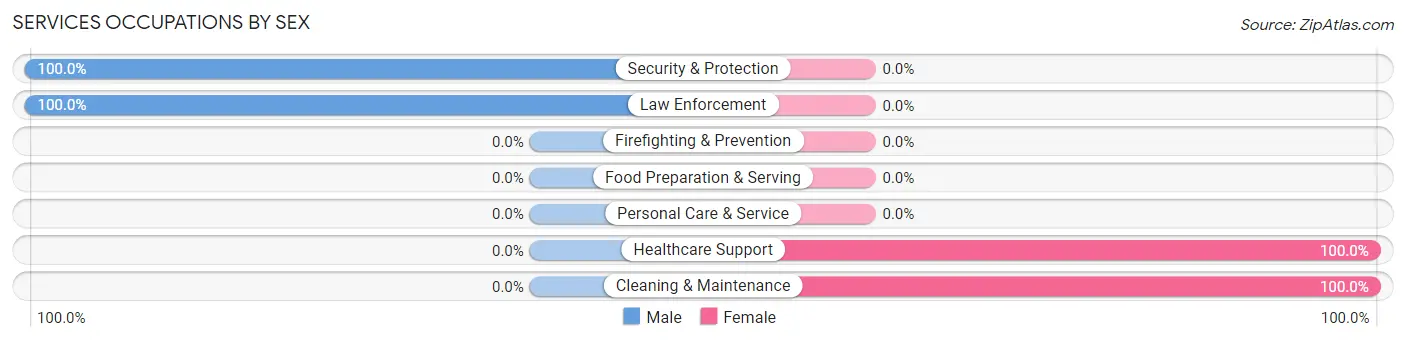
Services Occupations by Sex
Within the Services occupations in Tignall, the most male-oriented occupations are Security & Protection (100.0%), and Law Enforcement (100.0%), while the most female-oriented occupations are Healthcare Support (100.0%), and Cleaning & Maintenance (100.0%).
| Occupation | Male | Female |
| Healthcare Support | 0 (0.0%) | 31 (100.0%) |
| Security & Protection | 2 (100.0%) | 0 (0.0%) |
| Firefighting & Prevention | 0 (0.0%) | 0 (0.0%) |
| Law Enforcement | 2 (100.0%) | 0 (0.0%) |
| Food Preparation & Serving | 0 (0.0%) | 0 (0.0%) |
| Cleaning & Maintenance | 0 (0.0%) | 14 (100.0%) |
| Personal Care & Service | 0 (0.0%) | 0 (0.0%) |
| Total (Category) | 2 (4.3%) | 45 (95.7%) |
| Total (Overall) | 170 (54.7%) | 141 (45.3%) |
Sales and Office Occupations
The most common Sales and Office occupations in Tignall are Office & Administration (55 | 17.7%), and Sales & Related (4 | 1.3%).
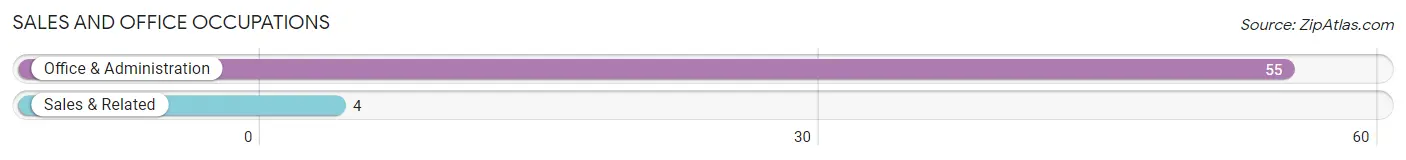
Sales and Office Occupations by Sex
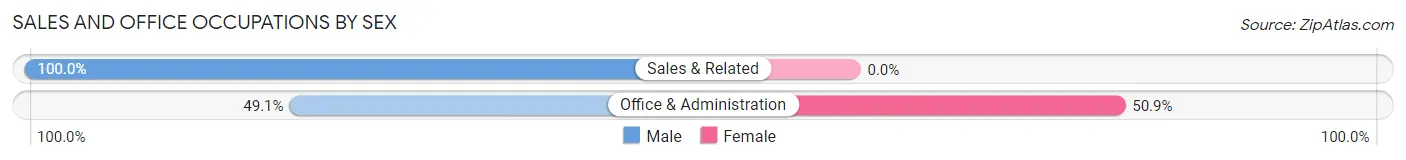
| Occupation | Male | Female |
| Sales & Related | 4 (100.0%) | 0 (0.0%) |
| Office & Administration | 27 (49.1%) | 28 (50.9%) |
| Total (Category) | 31 (52.5%) | 28 (47.5%) |
| Total (Overall) | 170 (54.7%) | 141 (45.3%) |
Natural Resources, Construction and Maintenance Occupations
The most common Natural Resources, Construction and Maintenance occupations in Tignall are Construction & Extraction (51 | 16.4%), Installation, Maintenance & Repair (12 | 3.9%), and Farming, Fishing & Forestry (7 | 2.2%).
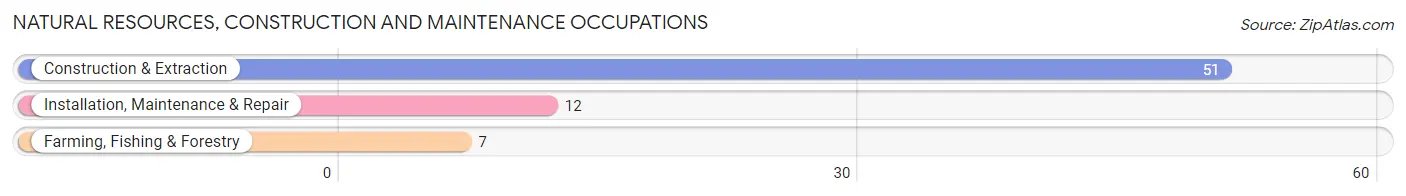
Natural Resources, Construction and Maintenance Occupations by Sex
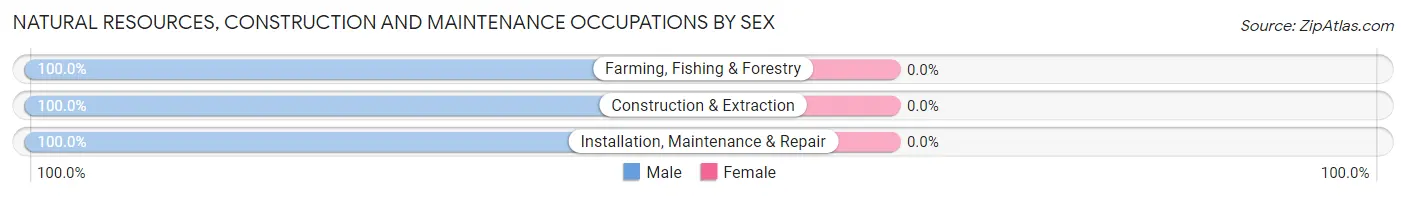
| Occupation | Male | Female |
| Farming, Fishing & Forestry | 7 (100.0%) | 0 (0.0%) |
| Construction & Extraction | 51 (100.0%) | 0 (0.0%) |
| Installation, Maintenance & Repair | 12 (100.0%) | 0 (0.0%) |
| Total (Category) | 70 (100.0%) | 0 (0.0%) |
| Total (Overall) | 170 (54.7%) | 141 (45.3%) |
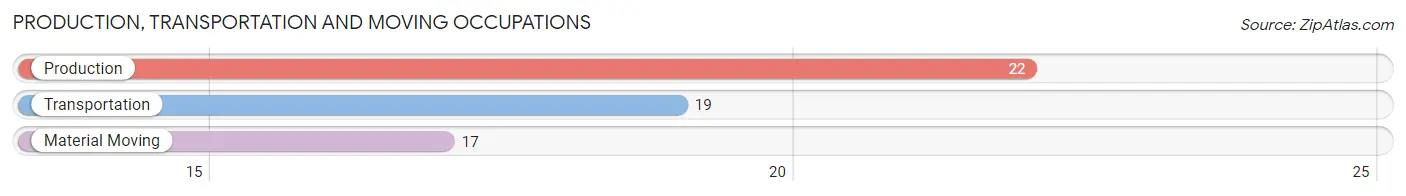
Production, Transportation and Moving Occupations
The most common Production, Transportation and Moving occupations in Tignall are Production (22 | 7.1%), Transportation (19 | 6.1%), and Material Moving (17 | 5.5%).
Production, Transportation and Moving Occupations by Sex
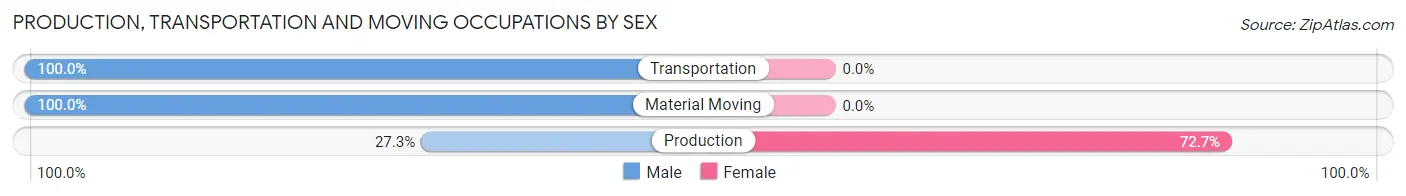
| Occupation | Male | Female |
| Production | 6 (27.3%) | 16 (72.7%) |
| Transportation | 19 (100.0%) | 0 (0.0%) |
| Material Moving | 17 (100.0%) | 0 (0.0%) |
| Total (Category) | 42 (72.4%) | 16 (27.6%) |
| Total (Overall) | 170 (54.7%) | 141 (45.3%) |
Employment Industries by Sex in Tignall
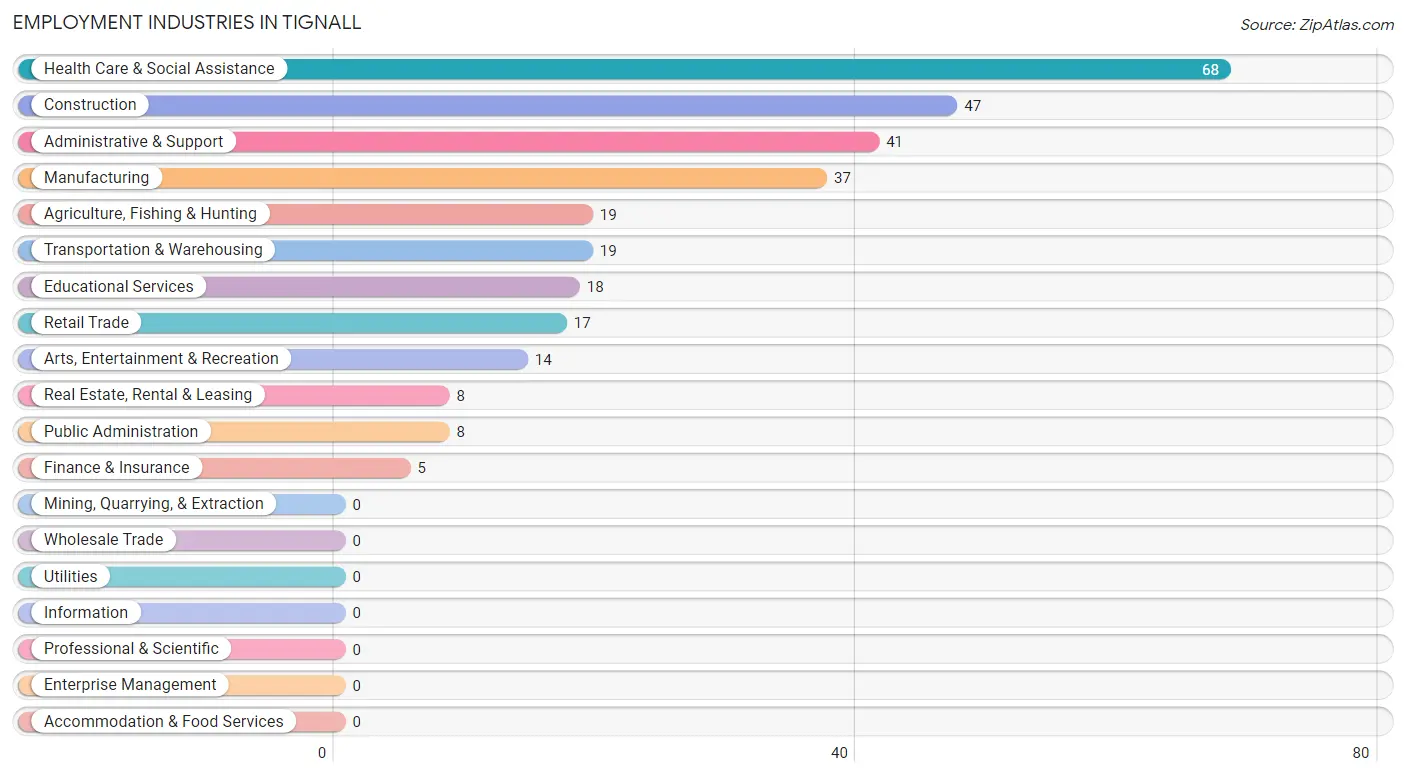
Employment Industries in Tignall
The major employment industries in Tignall include Health Care & Social Assistance (68 | 21.9%), Construction (47 | 15.1%), Administrative & Support (41 | 13.2%), Manufacturing (37 | 11.9%), and Agriculture, Fishing & Hunting (19 | 6.1%).
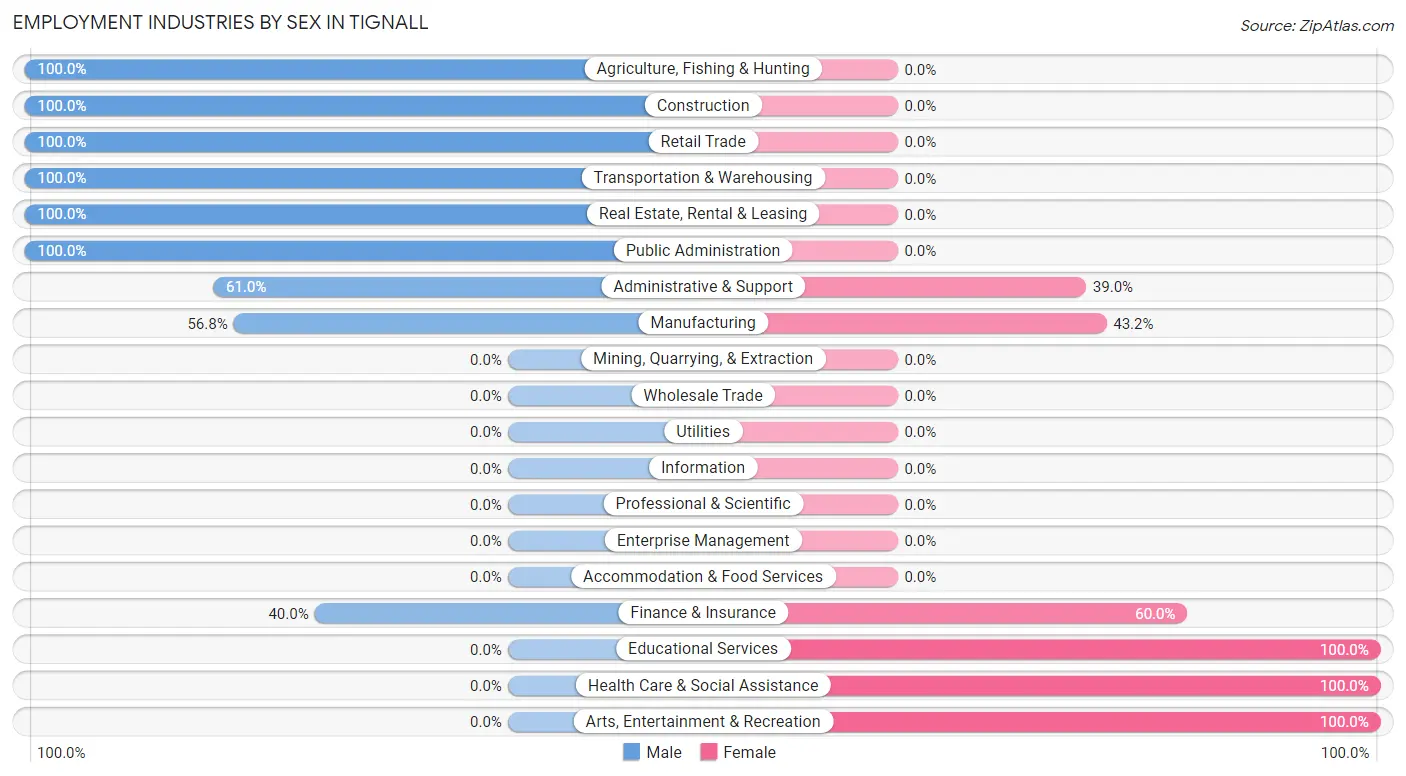
Employment Industries by Sex in Tignall
The Tignall industries that see more men than women are Agriculture, Fishing & Hunting (100.0%), Construction (100.0%), and Retail Trade (100.0%), whereas the industries that tend to have a higher number of women are Educational Services (100.0%), Health Care & Social Assistance (100.0%), and Arts, Entertainment & Recreation (100.0%).
| Industry | Male | Female |
| Agriculture, Fishing & Hunting | 19 (100.0%) | 0 (0.0%) |
| Mining, Quarrying, & Extraction | 0 (0.0%) | 0 (0.0%) |
| Construction | 47 (100.0%) | 0 (0.0%) |
| Manufacturing | 21 (56.8%) | 16 (43.2%) |
| Wholesale Trade | 0 (0.0%) | 0 (0.0%) |
| Retail Trade | 17 (100.0%) | 0 (0.0%) |
| Transportation & Warehousing | 19 (100.0%) | 0 (0.0%) |
| Utilities | 0 (0.0%) | 0 (0.0%) |
| Information | 0 (0.0%) | 0 (0.0%) |
| Finance & Insurance | 2 (40.0%) | 3 (60.0%) |
| Real Estate, Rental & Leasing | 8 (100.0%) | 0 (0.0%) |
| Professional & Scientific | 0 (0.0%) | 0 (0.0%) |
| Enterprise Management | 0 (0.0%) | 0 (0.0%) |
| Administrative & Support | 25 (61.0%) | 16 (39.0%) |
| Educational Services | 0 (0.0%) | 18 (100.0%) |
| Health Care & Social Assistance | 0 (0.0%) | 68 (100.0%) |
| Arts, Entertainment & Recreation | 0 (0.0%) | 14 (100.0%) |
| Accommodation & Food Services | 0 (0.0%) | 0 (0.0%) |
| Public Administration | 8 (100.0%) | 0 (0.0%) |
| Total | 170 (54.7%) | 141 (45.3%) |
Education in Tignall
School Enrollment in Tignall
The most common levels of schooling among the 346 students in Tignall are middle school (157 | 45.4%), high school (104 | 30.1%), and elementary school (56 | 16.2%).
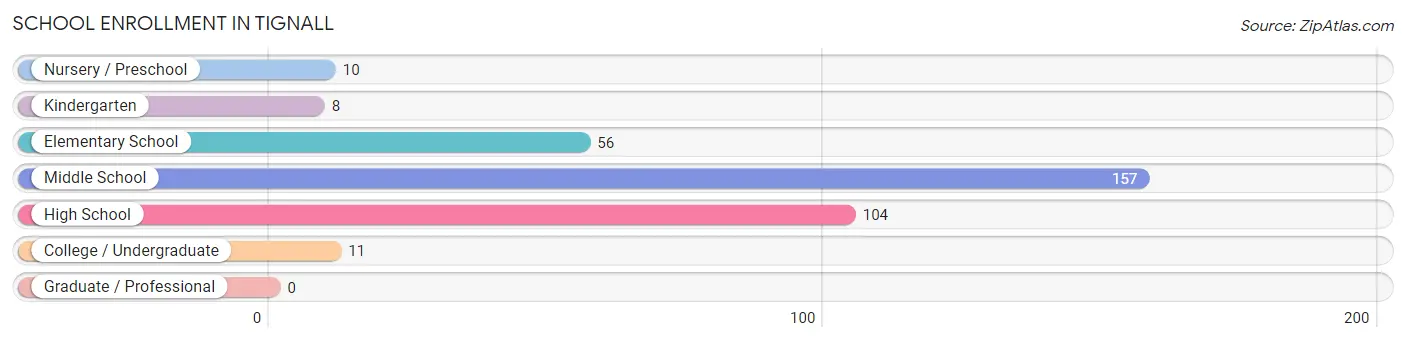
| School Level | # Students | % Students |
| Nursery / Preschool | 10 | 2.9% |
| Kindergarten | 8 | 2.3% |
| Elementary School | 56 | 16.2% |
| Middle School | 157 | 45.4% |
| High School | 104 | 30.1% |
| College / Undergraduate | 11 | 3.2% |
| Graduate / Professional | 0 | 0.0% |
| Total | 346 | 100.0% |
School Enrollment by Age by Funding Source in Tignall
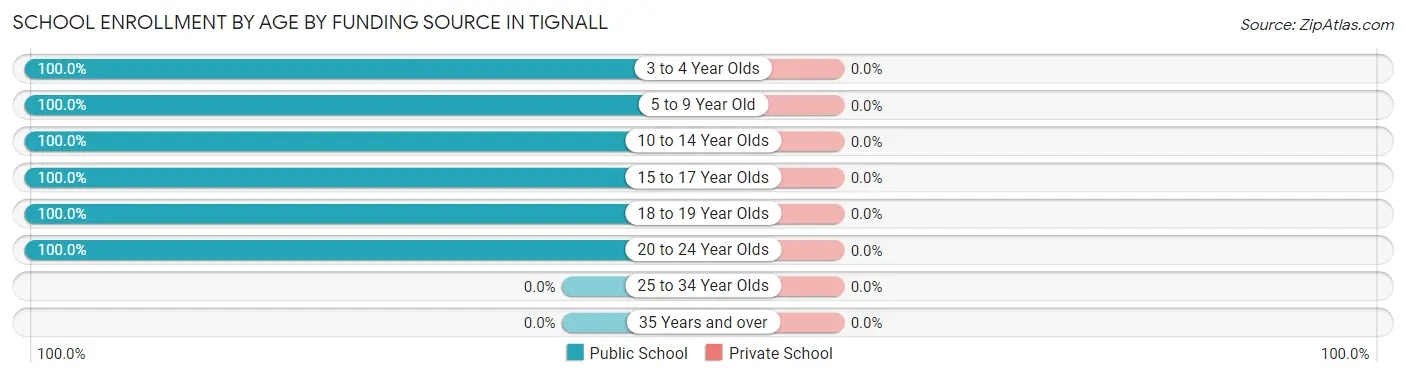
| Age Bracket | Public School | Private School |
| 3 to 4 Year Olds | 6 (100.0%) | 0 (0.0%) |
| 5 to 9 Year Old | 31 (100.0%) | 0 (0.0%) |
| 10 to 14 Year Olds | 194 (100.0%) | 0 (0.0%) |
| 15 to 17 Year Olds | 97 (100.0%) | 0 (0.0%) |
| 18 to 19 Year Olds | 13 (100.0%) | 0 (0.0%) |
| 20 to 24 Year Olds | 5 (100.0%) | 0 (0.0%) |
| 25 to 34 Year Olds | 0 (0.0%) | 0 (0.0%) |
| 35 Years and over | 0 (0.0%) | 0 (0.0%) |
| Total | 346 (100.0%) | 0 (0.0%) |
Educational Attainment by Field of Study in Tignall
Physical & health sciences (18 | 39.1%), business (10 | 21.7%), bio, nature & agricultural (5 | 10.9%), literature & languages (5 | 10.9%), and education (3 | 6.5%) are the most common fields of study among 46 individuals in Tignall who have obtained a bachelor's degree or higher.
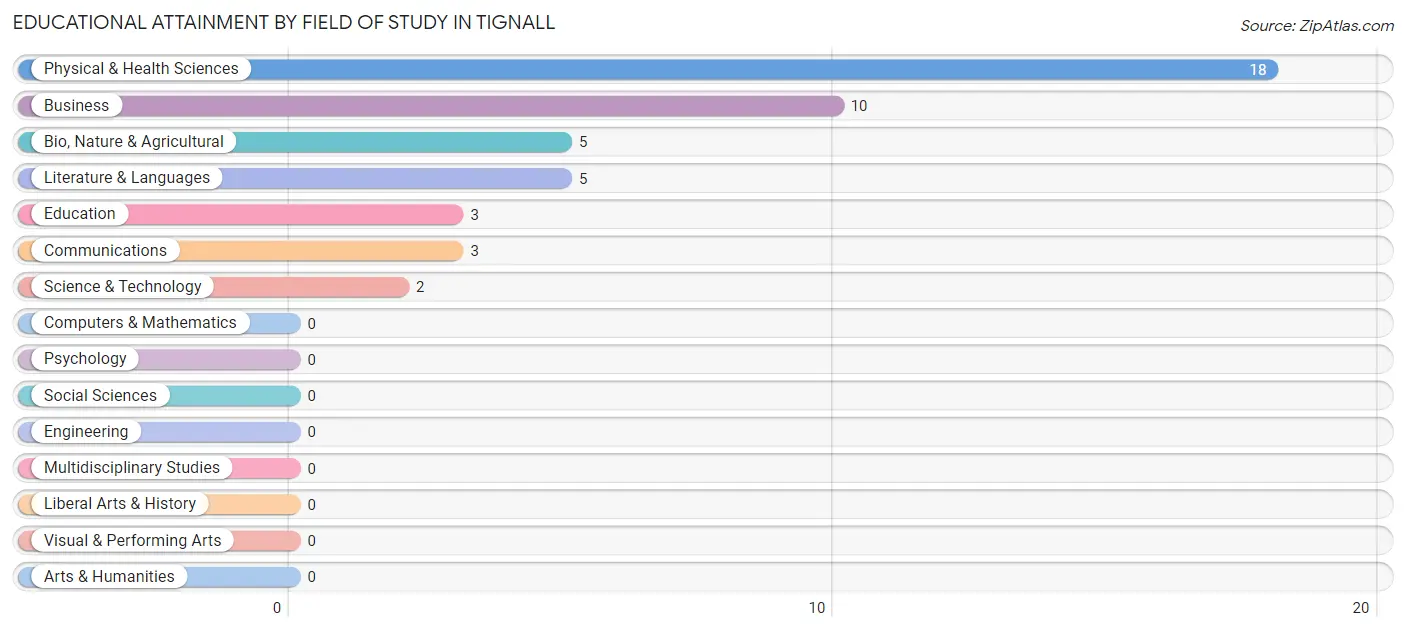
| Field of Study | # Graduates | % Graduates |
| Computers & Mathematics | 0 | 0.0% |
| Bio, Nature & Agricultural | 5 | 10.9% |
| Physical & Health Sciences | 18 | 39.1% |
| Psychology | 0 | 0.0% |
| Social Sciences | 0 | 0.0% |
| Engineering | 0 | 0.0% |
| Multidisciplinary Studies | 0 | 0.0% |
| Science & Technology | 2 | 4.3% |
| Business | 10 | 21.7% |
| Education | 3 | 6.5% |
| Literature & Languages | 5 | 10.9% |
| Liberal Arts & History | 0 | 0.0% |
| Visual & Performing Arts | 0 | 0.0% |
| Communications | 3 | 6.5% |
| Arts & Humanities | 0 | 0.0% |
| Total | 46 | 100.0% |
Transportation & Commute in Tignall
Vehicle Availability by Sex in Tignall
The most prevalent vehicle ownership categories in Tignall are males with 2 vehicles (54, accounting for 31.8%) and females with 2 vehicles (58, making up 38.3%).
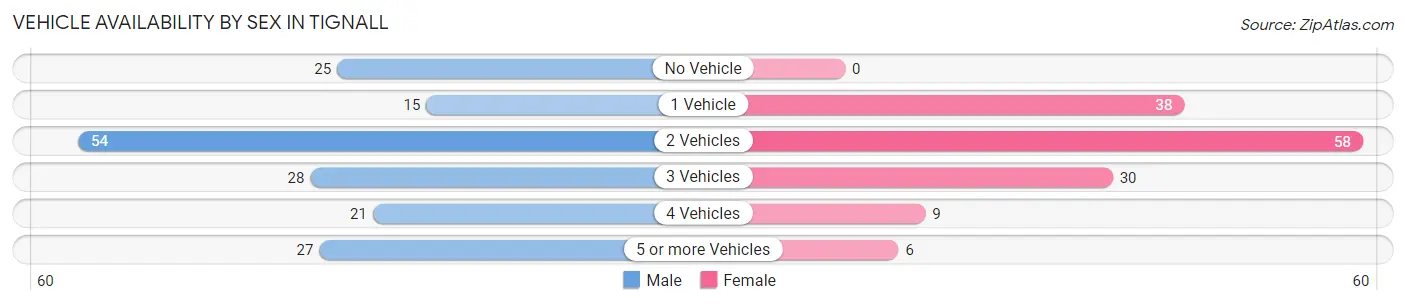
| Vehicles Available | Male | Female |
| No Vehicle | 25 (14.7%) | 0 (0.0%) |
| 1 Vehicle | 15 (8.8%) | 38 (27.0%) |
| 2 Vehicles | 54 (31.8%) | 58 (41.1%) |
| 3 Vehicles | 28 (16.5%) | 30 (21.3%) |
| 4 Vehicles | 21 (12.3%) | 9 (6.4%) |
| 5 or more Vehicles | 27 (15.9%) | 6 (4.3%) |
| Total | 170 (100.0%) | 141 (100.0%) |
Commute Time in Tignall
The most frequently occuring commute durations in Tignall are 20 to 24 minutes (77 commuters, 24.8%), 15 to 19 minutes (52 commuters, 16.7%), and 60 to 89 minutes (45 commuters, 14.5%).
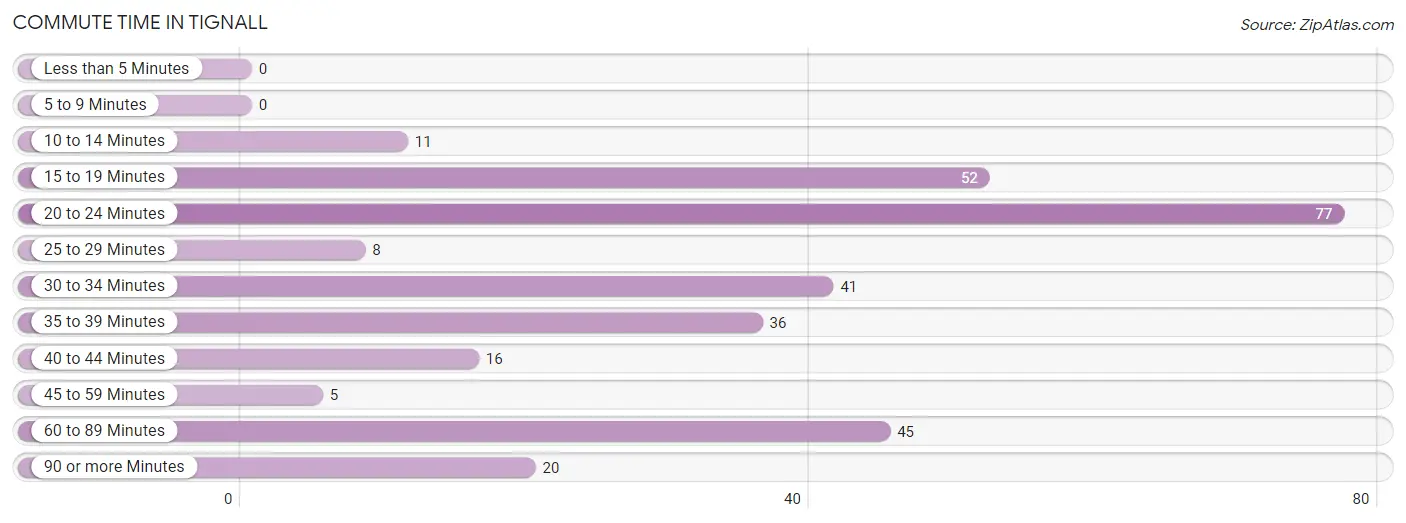
| Commute Time | # Commuters | % Commuters |
| Less than 5 Minutes | 0 | 0.0% |
| 5 to 9 Minutes | 0 | 0.0% |
| 10 to 14 Minutes | 11 | 3.5% |
| 15 to 19 Minutes | 52 | 16.7% |
| 20 to 24 Minutes | 77 | 24.8% |
| 25 to 29 Minutes | 8 | 2.6% |
| 30 to 34 Minutes | 41 | 13.2% |
| 35 to 39 Minutes | 36 | 11.6% |
| 40 to 44 Minutes | 16 | 5.1% |
| 45 to 59 Minutes | 5 | 1.6% |
| 60 to 89 Minutes | 45 | 14.5% |
| 90 or more Minutes | 20 | 6.4% |
Commute Time by Sex in Tignall
The most common commute times in Tignall are 20 to 24 minutes (53 commuters, 31.2%) for males and 60 to 89 minutes (42 commuters, 29.8%) for females.
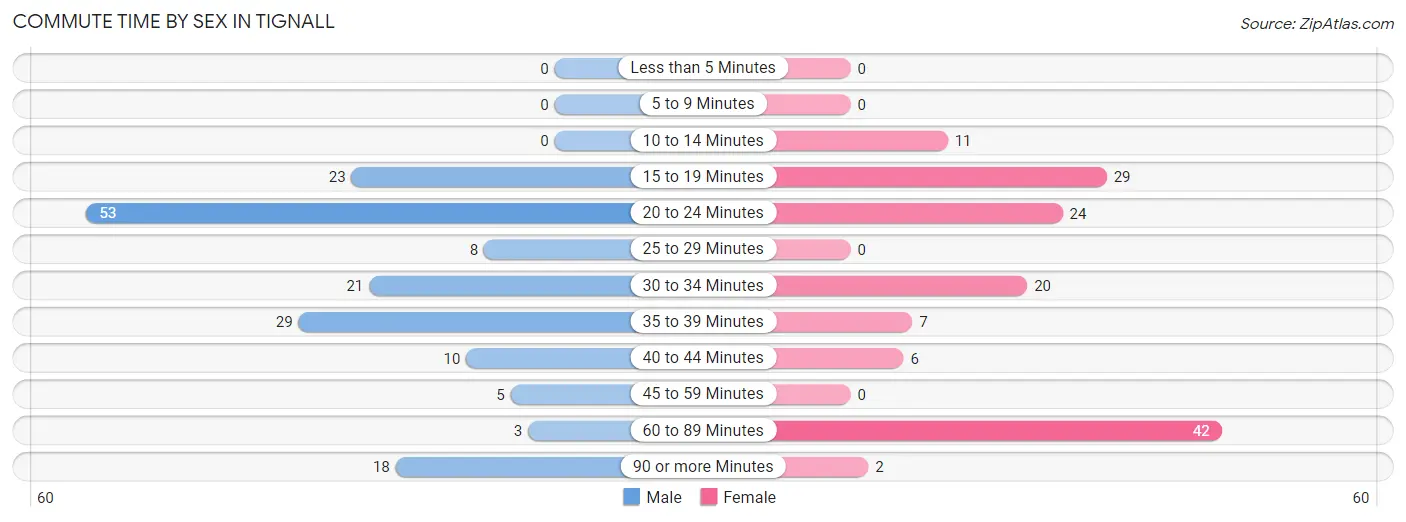
| Commute Time | Male | Female |
| Less than 5 Minutes | 0 (0.0%) | 0 (0.0%) |
| 5 to 9 Minutes | 0 (0.0%) | 0 (0.0%) |
| 10 to 14 Minutes | 0 (0.0%) | 11 (7.8%) |
| 15 to 19 Minutes | 23 (13.5%) | 29 (20.6%) |
| 20 to 24 Minutes | 53 (31.2%) | 24 (17.0%) |
| 25 to 29 Minutes | 8 (4.7%) | 0 (0.0%) |
| 30 to 34 Minutes | 21 (12.3%) | 20 (14.2%) |
| 35 to 39 Minutes | 29 (17.1%) | 7 (5.0%) |
| 40 to 44 Minutes | 10 (5.9%) | 6 (4.3%) |
| 45 to 59 Minutes | 5 (2.9%) | 0 (0.0%) |
| 60 to 89 Minutes | 3 (1.8%) | 42 (29.8%) |
| 90 or more Minutes | 18 (10.6%) | 2 (1.4%) |
Time of Departure to Work by Sex in Tignall
The most frequent times of departure to work in Tignall are 7:00 AM to 7:29 AM (69, 40.6%) for males and 7:30 AM to 7:59 AM (32, 22.7%) for females.
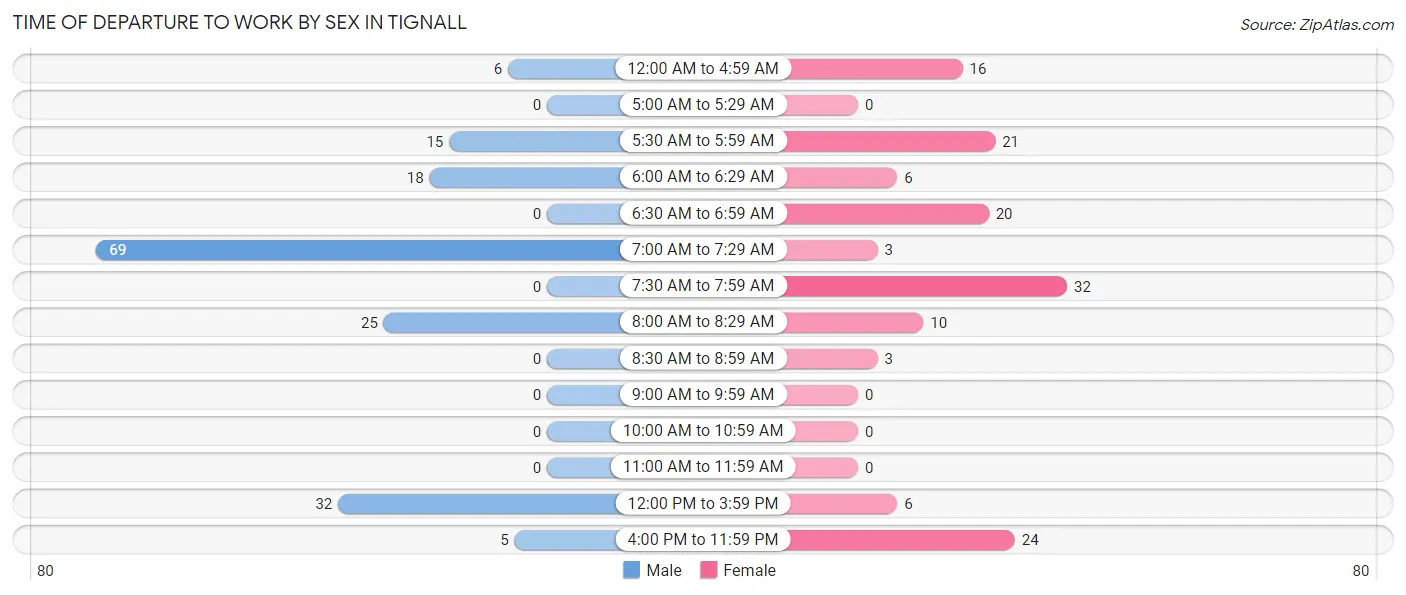
| Time of Departure | Male | Female |
| 12:00 AM to 4:59 AM | 6 (3.5%) | 16 (11.4%) |
| 5:00 AM to 5:29 AM | 0 (0.0%) | 0 (0.0%) |
| 5:30 AM to 5:59 AM | 15 (8.8%) | 21 (14.9%) |
| 6:00 AM to 6:29 AM | 18 (10.6%) | 6 (4.3%) |
| 6:30 AM to 6:59 AM | 0 (0.0%) | 20 (14.2%) |
| 7:00 AM to 7:29 AM | 69 (40.6%) | 3 (2.1%) |
| 7:30 AM to 7:59 AM | 0 (0.0%) | 32 (22.7%) |
| 8:00 AM to 8:29 AM | 25 (14.7%) | 10 (7.1%) |
| 8:30 AM to 8:59 AM | 0 (0.0%) | 3 (2.1%) |
| 9:00 AM to 9:59 AM | 0 (0.0%) | 0 (0.0%) |
| 10:00 AM to 10:59 AM | 0 (0.0%) | 0 (0.0%) |
| 11:00 AM to 11:59 AM | 0 (0.0%) | 0 (0.0%) |
| 12:00 PM to 3:59 PM | 32 (18.8%) | 6 (4.3%) |
| 4:00 PM to 11:59 PM | 5 (2.9%) | 24 (17.0%) |
| Total | 170 (100.0%) | 141 (100.0%) |
Housing Occupancy in Tignall
Occupancy by Ownership in Tignall
Of the total 440 dwellings in Tignall, owner-occupied units account for 195 (44.3%), while renter-occupied units make up 245 (55.7%).
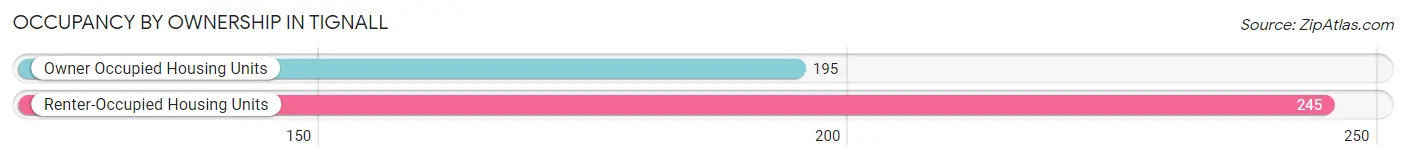
| Occupancy | # Housing Units | % Housing Units |
| Owner Occupied Housing Units | 195 | 44.3% |
| Renter-Occupied Housing Units | 245 | 55.7% |
| Total Occupied Housing Units | 440 | 100.0% |
Occupancy by Household Size in Tignall
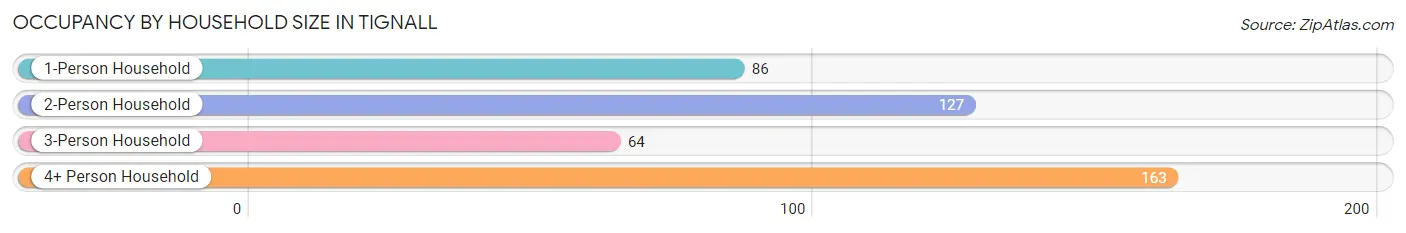
| Household Size | # Housing Units | % Housing Units |
| 1-Person Household | 86 | 19.6% |
| 2-Person Household | 127 | 28.9% |
| 3-Person Household | 64 | 14.5% |
| 4+ Person Household | 163 | 37.0% |
| Total Housing Units | 440 | 100.0% |
Occupancy by Ownership by Household Size in Tignall
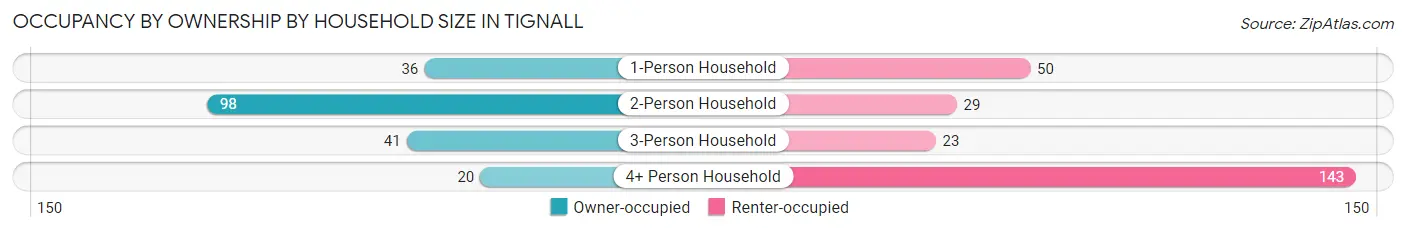
| Household Size | Owner-occupied | Renter-occupied |
| 1-Person Household | 36 (41.9%) | 50 (58.1%) |
| 2-Person Household | 98 (77.2%) | 29 (22.8%) |
| 3-Person Household | 41 (64.1%) | 23 (35.9%) |
| 4+ Person Household | 20 (12.3%) | 143 (87.7%) |
| Total Housing Units | 195 (44.3%) | 245 (55.7%) |
Occupancy by Educational Attainment in Tignall
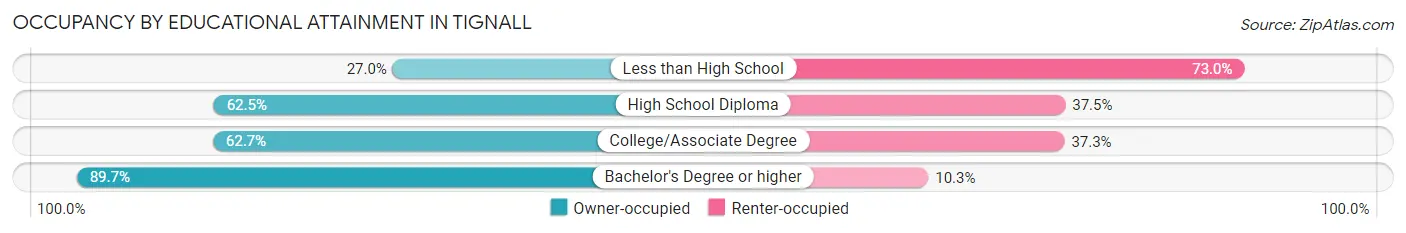
| Household Size | Owner-occupied | Renter-occupied |
| Less than High School | 67 (27.0%) | 181 (73.0%) |
| High School Diploma | 55 (62.5%) | 33 (37.5%) |
| College/Associate Degree | 47 (62.7%) | 28 (37.3%) |
| Bachelor's Degree or higher | 26 (89.7%) | 3 (10.3%) |
Occupancy by Age of Householder in Tignall
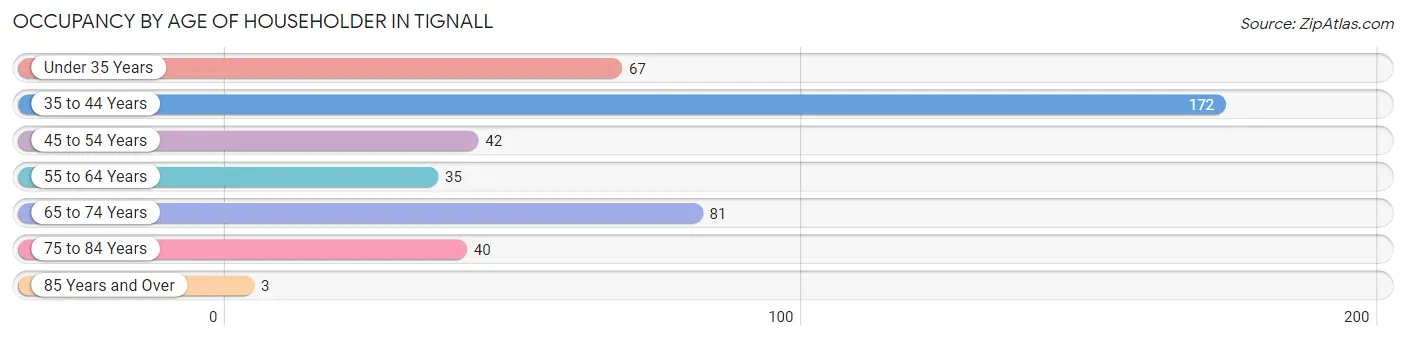
| Age Bracket | # Households | % Households |
| Under 35 Years | 67 | 15.2% |
| 35 to 44 Years | 172 | 39.1% |
| 45 to 54 Years | 42 | 9.6% |
| 55 to 64 Years | 35 | 8.0% |
| 65 to 74 Years | 81 | 18.4% |
| 75 to 84 Years | 40 | 9.1% |
| 85 Years and Over | 3 | 0.7% |
| Total | 440 | 100.0% |
Housing Finances in Tignall
Median Income by Occupancy in Tignall
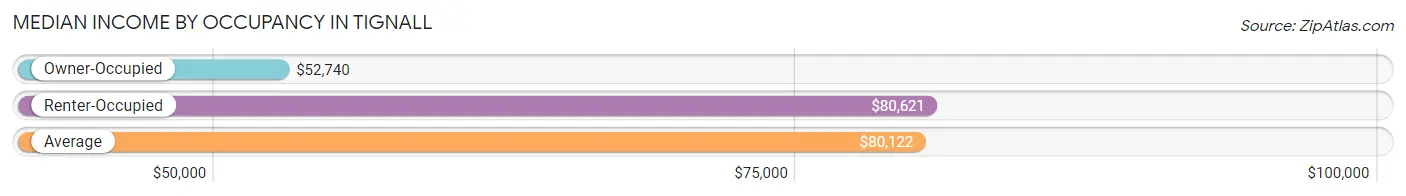
| Occupancy Type | # Households | Median Income |
| Owner-Occupied | 195 (44.3%) | $52,740 |
| Renter-Occupied | 245 (55.7%) | $80,621 |
| Average | 440 (100.0%) | $80,122 |
Occupancy by Householder Income Bracket in Tignall
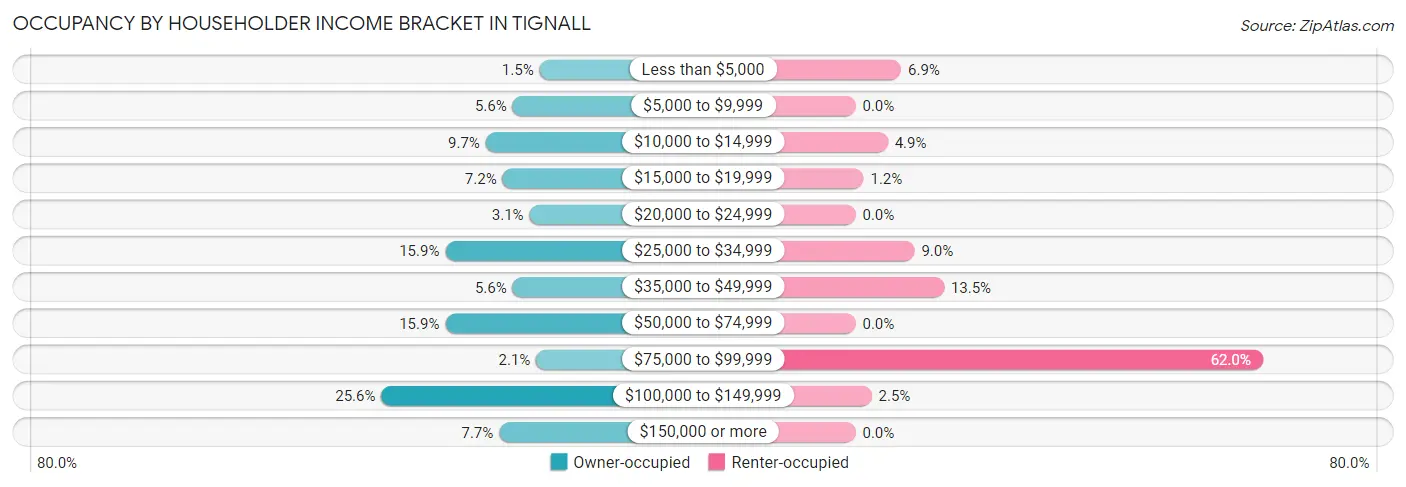
| Income Bracket | Owner-occupied | Renter-occupied |
| Less than $5,000 | 3 (1.5%) | 17 (6.9%) |
| $5,000 to $9,999 | 11 (5.6%) | 0 (0.0%) |
| $10,000 to $14,999 | 19 (9.7%) | 12 (4.9%) |
| $15,000 to $19,999 | 14 (7.2%) | 3 (1.2%) |
| $20,000 to $24,999 | 6 (3.1%) | 0 (0.0%) |
| $25,000 to $34,999 | 31 (15.9%) | 22 (9.0%) |
| $35,000 to $49,999 | 11 (5.6%) | 33 (13.5%) |
| $50,000 to $74,999 | 31 (15.9%) | 0 (0.0%) |
| $75,000 to $99,999 | 4 (2.1%) | 152 (62.0%) |
| $100,000 to $149,999 | 50 (25.6%) | 6 (2.5%) |
| $150,000 or more | 15 (7.7%) | 0 (0.0%) |
| Total | 195 (100.0%) | 245 (100.0%) |
Monthly Housing Cost Tiers in Tignall
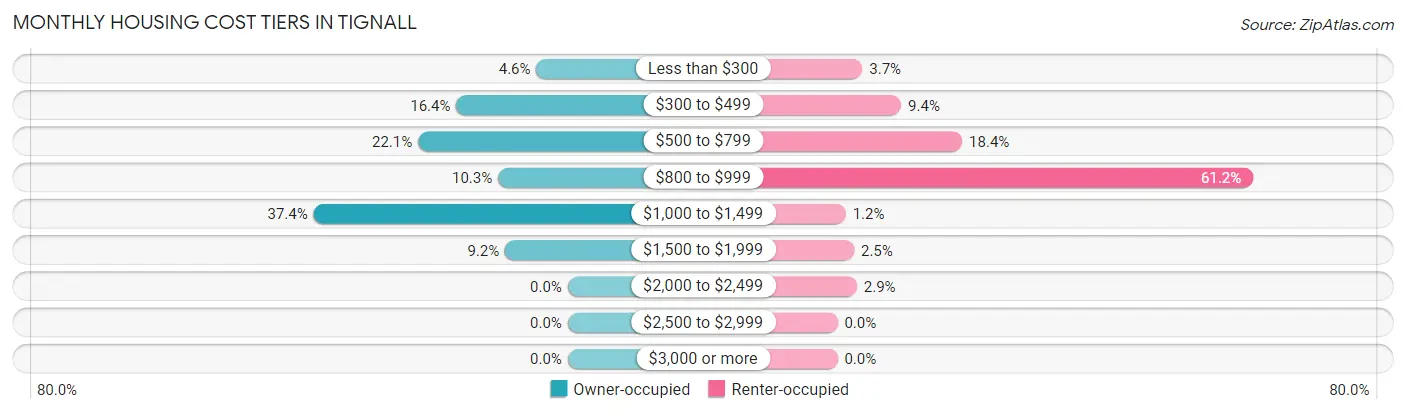
| Monthly Cost | Owner-occupied | Renter-occupied |
| Less than $300 | 9 (4.6%) | 9 (3.7%) |
| $300 to $499 | 32 (16.4%) | 23 (9.4%) |
| $500 to $799 | 43 (22.1%) | 45 (18.4%) |
| $800 to $999 | 20 (10.3%) | 150 (61.2%) |
| $1,000 to $1,499 | 73 (37.4%) | 3 (1.2%) |
| $1,500 to $1,999 | 18 (9.2%) | 6 (2.5%) |
| $2,000 to $2,499 | 0 (0.0%) | 7 (2.9%) |
| $2,500 to $2,999 | 0 (0.0%) | 0 (0.0%) |
| $3,000 or more | 0 (0.0%) | 0 (0.0%) |
| Total | 195 (100.0%) | 245 (100.0%) |
Physical Housing Characteristics in Tignall
Housing Structures in Tignall
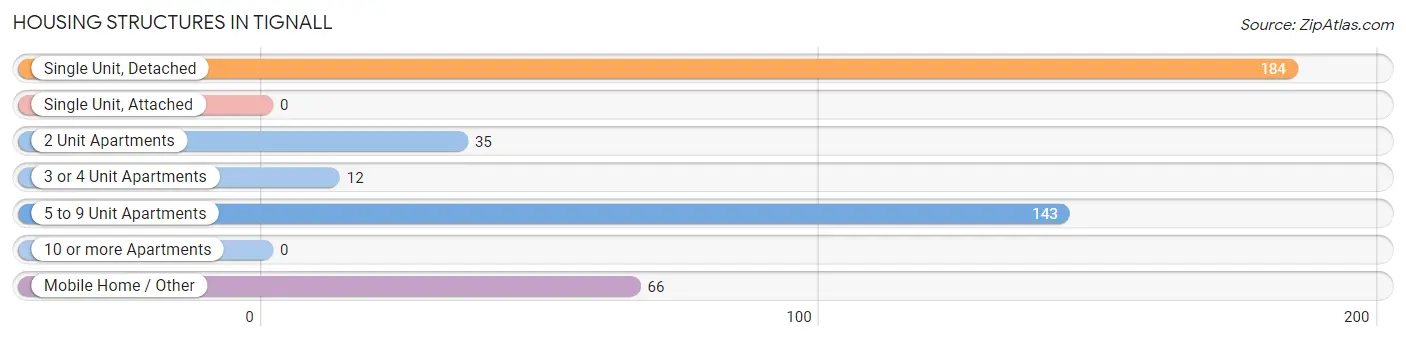
| Structure Type | # Housing Units | % Housing Units |
| Single Unit, Detached | 184 | 41.8% |
| Single Unit, Attached | 0 | 0.0% |
| 2 Unit Apartments | 35 | 8.0% |
| 3 or 4 Unit Apartments | 12 | 2.7% |
| 5 to 9 Unit Apartments | 143 | 32.5% |
| 10 or more Apartments | 0 | 0.0% |
| Mobile Home / Other | 66 | 15.0% |
| Total | 440 | 100.0% |
Housing Structures by Occupancy in Tignall
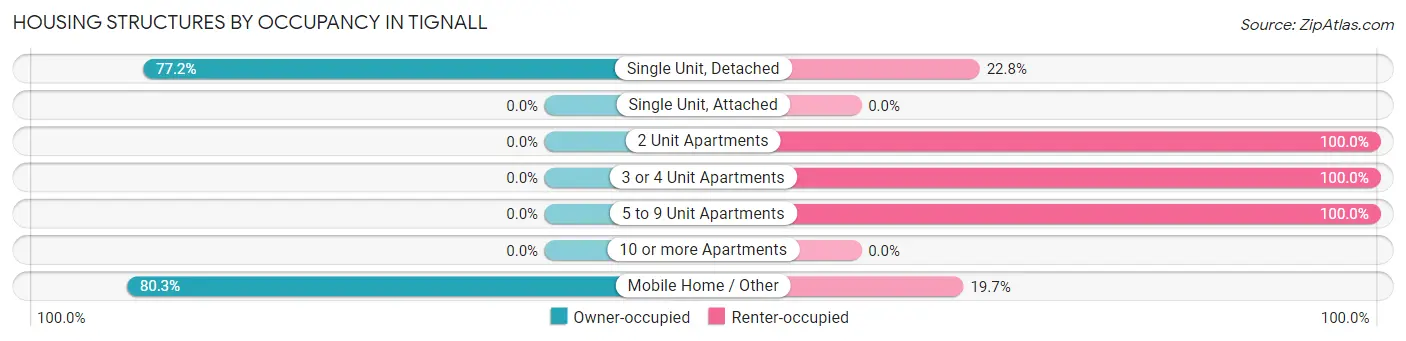
| Structure Type | Owner-occupied | Renter-occupied |
| Single Unit, Detached | 142 (77.2%) | 42 (22.8%) |
| Single Unit, Attached | 0 (0.0%) | 0 (0.0%) |
| 2 Unit Apartments | 0 (0.0%) | 35 (100.0%) |
| 3 or 4 Unit Apartments | 0 (0.0%) | 12 (100.0%) |
| 5 to 9 Unit Apartments | 0 (0.0%) | 143 (100.0%) |
| 10 or more Apartments | 0 (0.0%) | 0 (0.0%) |
| Mobile Home / Other | 53 (80.3%) | 13 (19.7%) |
| Total | 195 (44.3%) | 245 (55.7%) |
Housing Structures by Number of Rooms in Tignall
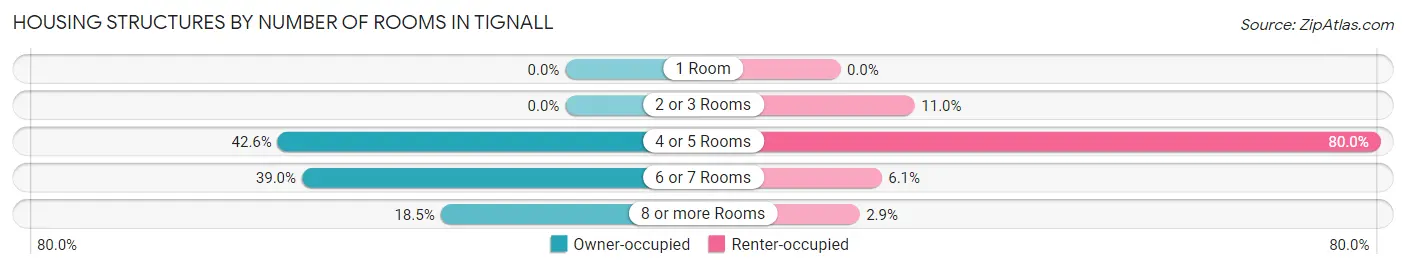
| Number of Rooms | Owner-occupied | Renter-occupied |
| 1 Room | 0 (0.0%) | 0 (0.0%) |
| 2 or 3 Rooms | 0 (0.0%) | 27 (11.0%) |
| 4 or 5 Rooms | 83 (42.6%) | 196 (80.0%) |
| 6 or 7 Rooms | 76 (39.0%) | 15 (6.1%) |
| 8 or more Rooms | 36 (18.5%) | 7 (2.9%) |
| Total | 195 (100.0%) | 245 (100.0%) |
Housing Structure by Heating Type in Tignall
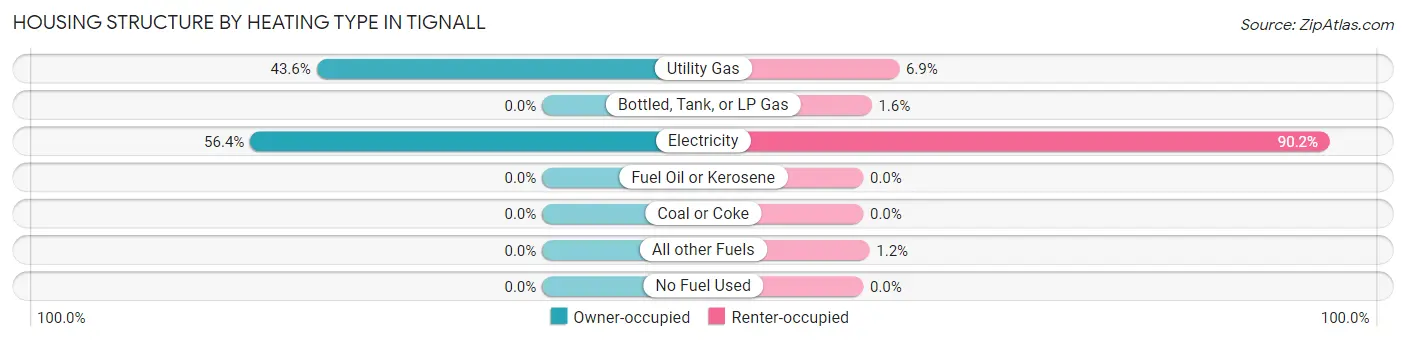
| Heating Type | Owner-occupied | Renter-occupied |
| Utility Gas | 85 (43.6%) | 17 (6.9%) |
| Bottled, Tank, or LP Gas | 0 (0.0%) | 4 (1.6%) |
| Electricity | 110 (56.4%) | 221 (90.2%) |
| Fuel Oil or Kerosene | 0 (0.0%) | 0 (0.0%) |
| Coal or Coke | 0 (0.0%) | 0 (0.0%) |
| All other Fuels | 0 (0.0%) | 3 (1.2%) |
| No Fuel Used | 0 (0.0%) | 0 (0.0%) |
| Total | 195 (100.0%) | 245 (100.0%) |
Household Vehicle Usage in Tignall
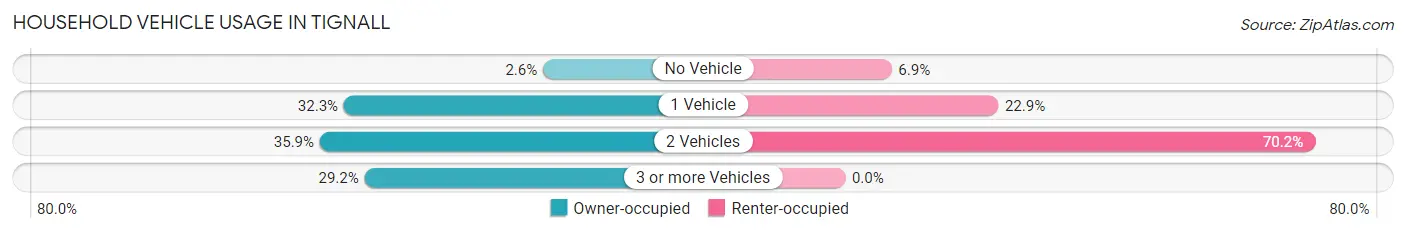
| Vehicles per Household | Owner-occupied | Renter-occupied |
| No Vehicle | 5 (2.6%) | 17 (6.9%) |
| 1 Vehicle | 63 (32.3%) | 56 (22.9%) |
| 2 Vehicles | 70 (35.9%) | 172 (70.2%) |
| 3 or more Vehicles | 57 (29.2%) | 0 (0.0%) |
| Total | 195 (100.0%) | 245 (100.0%) |
Real Estate & Mortgages in Tignall
Real Estate and Mortgage Overview in Tignall
| Characteristic | Without Mortgage | With Mortgage |
| Housing Units | 87 | 108 |
| Median Property Value | $85,600 | $85,600 |
| Median Household Income | $19,375 | $15 |
| Monthly Housing Costs | $507 | $0 |
| Real Estate Taxes | - | - |
Property Value by Mortgage Status in Tignall
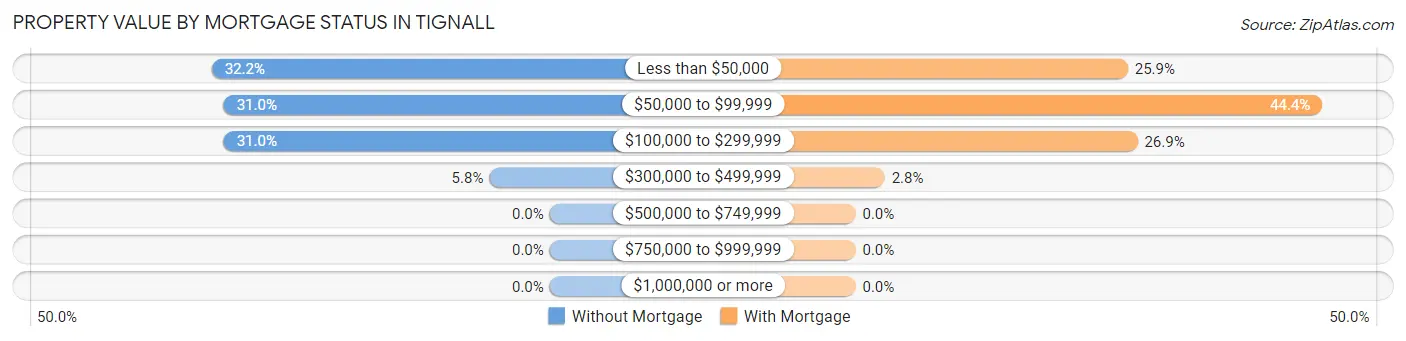
| Property Value | Without Mortgage | With Mortgage |
| Less than $50,000 | 28 (32.2%) | 28 (25.9%) |
| $50,000 to $99,999 | 27 (31.0%) | 48 (44.4%) |
| $100,000 to $299,999 | 27 (31.0%) | 29 (26.9%) |
| $300,000 to $499,999 | 5 (5.8%) | 3 (2.8%) |
| $500,000 to $749,999 | 0 (0.0%) | 0 (0.0%) |
| $750,000 to $999,999 | 0 (0.0%) | 0 (0.0%) |
| $1,000,000 or more | 0 (0.0%) | 0 (0.0%) |
| Total | 87 (100.0%) | 108 (100.0%) |
Household Income by Mortgage Status in Tignall
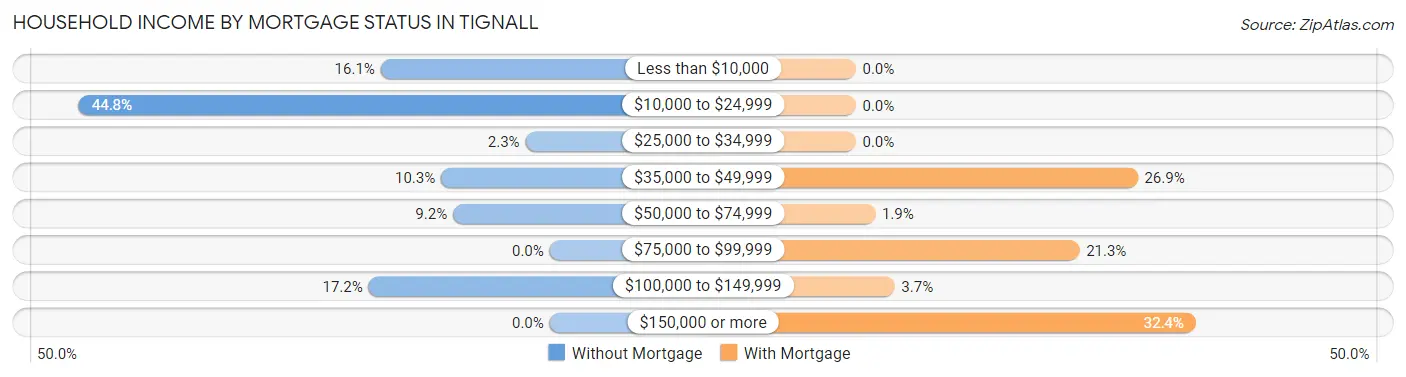
| Household Income | Without Mortgage | With Mortgage |
| Less than $10,000 | 14 (16.1%) | 0 (0.0%) |
| $10,000 to $24,999 | 39 (44.8%) | 0 (0.0%) |
| $25,000 to $34,999 | 2 (2.3%) | 0 (0.0%) |
| $35,000 to $49,999 | 9 (10.3%) | 29 (26.9%) |
| $50,000 to $74,999 | 8 (9.2%) | 2 (1.8%) |
| $75,000 to $99,999 | 0 (0.0%) | 23 (21.3%) |
| $100,000 to $149,999 | 15 (17.2%) | 4 (3.7%) |
| $150,000 or more | 0 (0.0%) | 35 (32.4%) |
| Total | 87 (100.0%) | 108 (100.0%) |
Property Value to Household Income Ratio in Tignall
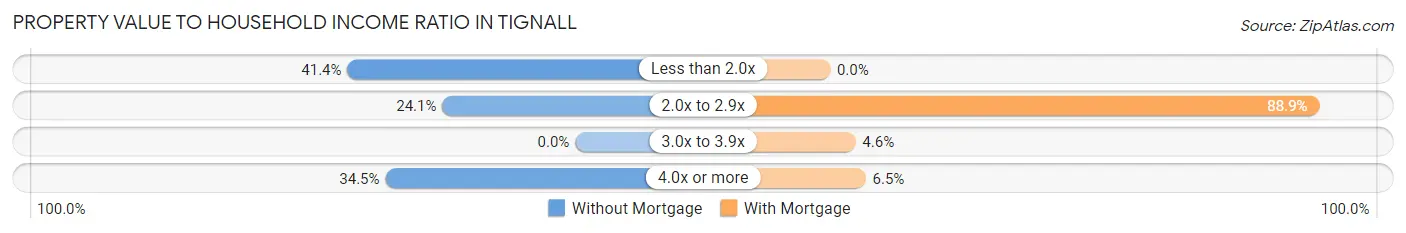
| Value-to-Income Ratio | Without Mortgage | With Mortgage |
| Less than 2.0x | 36 (41.4%) | 0 (0.0%) |
| 2.0x to 2.9x | 21 (24.1%) | 96 (88.9%) |
| 3.0x to 3.9x | 0 (0.0%) | 5 (4.6%) |
| 4.0x or more | 30 (34.5%) | 7 (6.5%) |
| Total | 87 (100.0%) | 108 (100.0%) |
Real Estate Taxes by Mortgage Status in Tignall
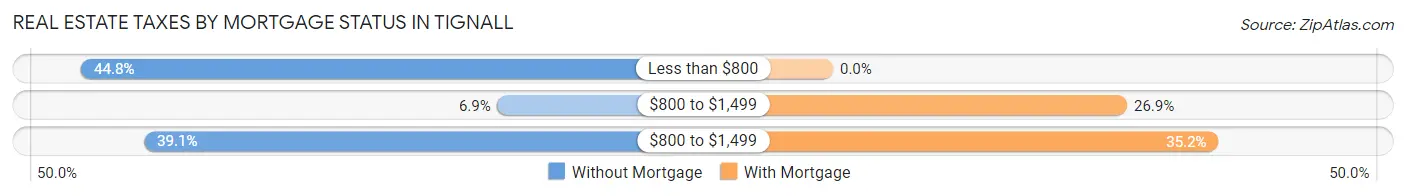
| Property Taxes | Without Mortgage | With Mortgage |
| Less than $800 | 39 (44.8%) | 0 (0.0%) |
| $800 to $1,499 | 6 (6.9%) | 29 (26.9%) |
| $800 to $1,499 | 34 (39.1%) | 38 (35.2%) |
| Total | 87 (100.0%) | 108 (100.0%) |
Health & Disability in Tignall
Health Insurance Coverage by Age in Tignall
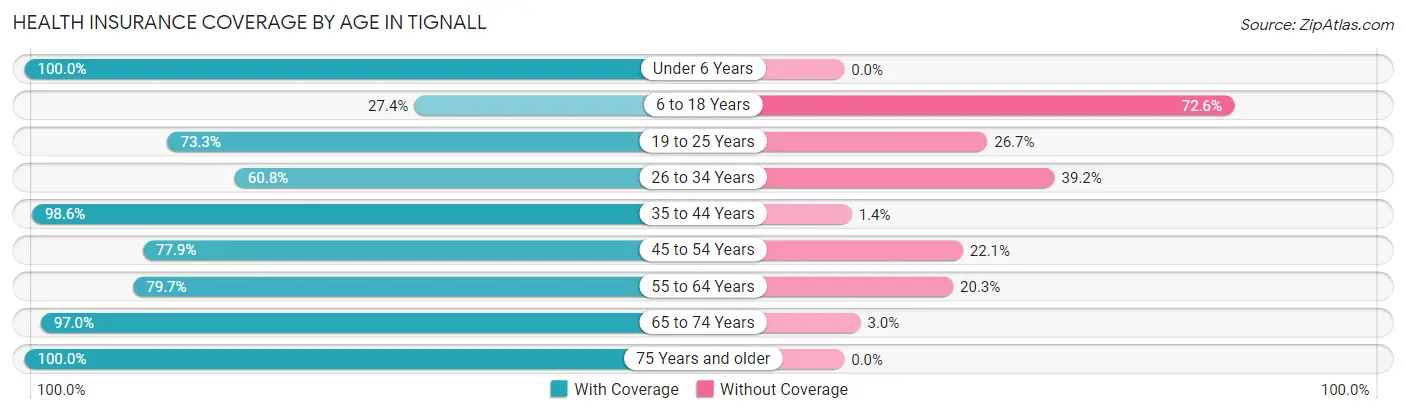
| Age Bracket | With Coverage | Without Coverage |
| Under 6 Years | 41 (100.0%) | 0 (0.0%) |
| 6 to 18 Years | 87 (27.4%) | 231 (72.6%) |
| 19 to 25 Years | 55 (73.3%) | 20 (26.7%) |
| 26 to 34 Years | 62 (60.8%) | 40 (39.2%) |
| 35 to 44 Years | 285 (98.6%) | 4 (1.4%) |
| 45 to 54 Years | 74 (77.9%) | 21 (22.1%) |
| 55 to 64 Years | 55 (79.7%) | 14 (20.3%) |
| 65 to 74 Years | 96 (97.0%) | 3 (3.0%) |
| 75 Years and older | 75 (100.0%) | 0 (0.0%) |
| Total | 830 (71.4%) | 333 (28.6%) |
Health Insurance Coverage by Citizenship Status in Tignall
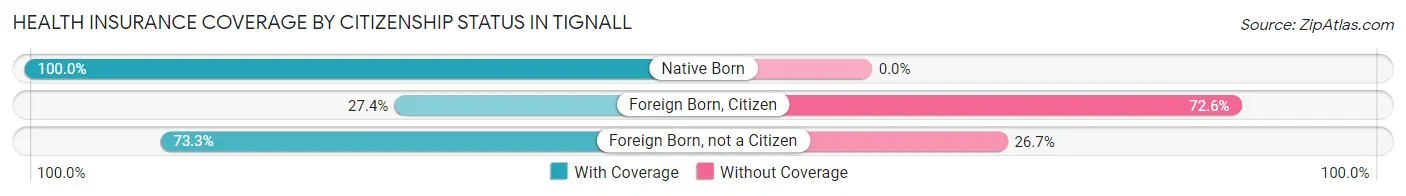
| Citizenship Status | With Coverage | Without Coverage |
| Native Born | 41 (100.0%) | 0 (0.0%) |
| Foreign Born, Citizen | 87 (27.4%) | 231 (72.6%) |
| Foreign Born, not a Citizen | 55 (73.3%) | 20 (26.7%) |
Health Insurance Coverage by Household Income in Tignall
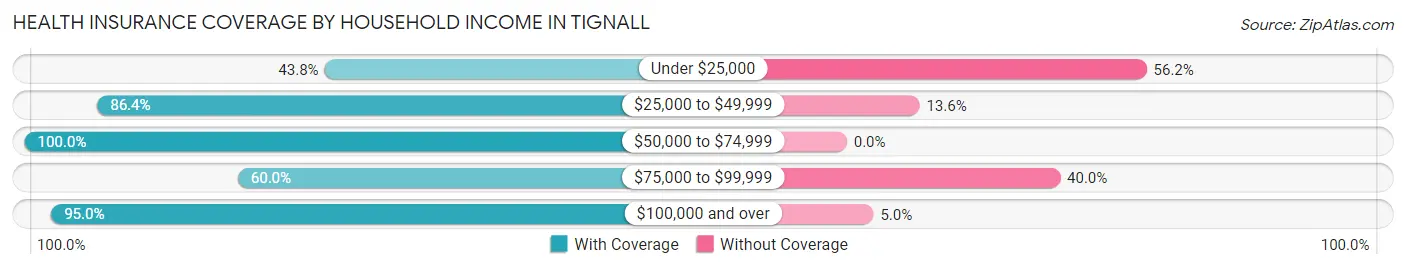
| Household Income | With Coverage | Without Coverage |
| Under $25,000 | 71 (43.8%) | 91 (56.2%) |
| $25,000 to $49,999 | 203 (86.4%) | 32 (13.6%) |
| $50,000 to $74,999 | 48 (100.0%) | 0 (0.0%) |
| $75,000 to $99,999 | 299 (60.0%) | 199 (40.0%) |
| $100,000 and over | 209 (95.0%) | 11 (5.0%) |
Public vs Private Health Insurance Coverage by Age in Tignall
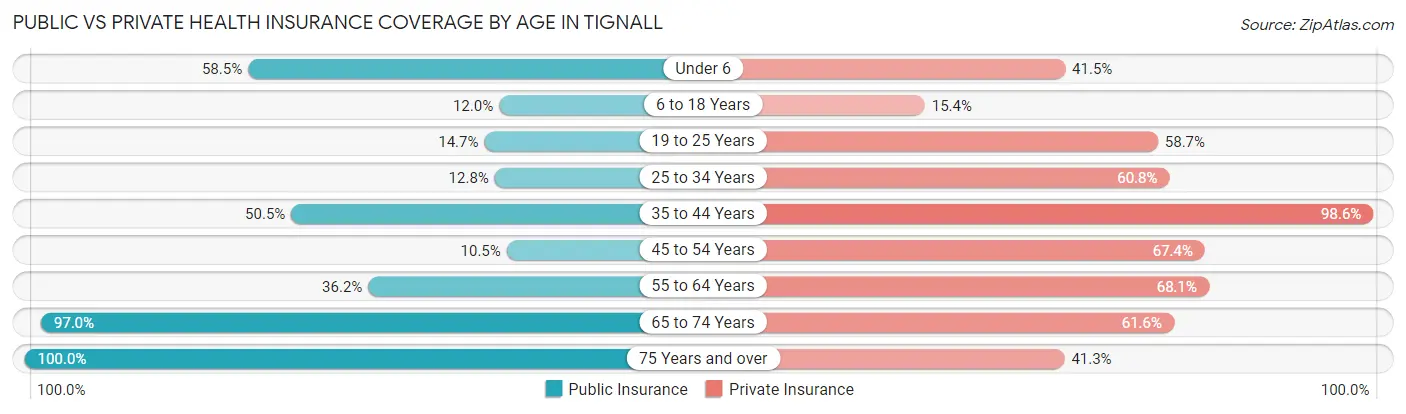
| Age Bracket | Public Insurance | Private Insurance |
| Under 6 | 24 (58.5%) | 17 (41.5%) |
| 6 to 18 Years | 38 (11.9%) | 49 (15.4%) |
| 19 to 25 Years | 11 (14.7%) | 44 (58.7%) |
| 25 to 34 Years | 13 (12.8%) | 62 (60.8%) |
| 35 to 44 Years | 146 (50.5%) | 285 (98.6%) |
| 45 to 54 Years | 10 (10.5%) | 64 (67.4%) |
| 55 to 64 Years | 25 (36.2%) | 47 (68.1%) |
| 65 to 74 Years | 96 (97.0%) | 61 (61.6%) |
| 75 Years and over | 75 (100.0%) | 31 (41.3%) |
| Total | 438 (37.7%) | 660 (56.8%) |
Disability Status by Sex by Age in Tignall
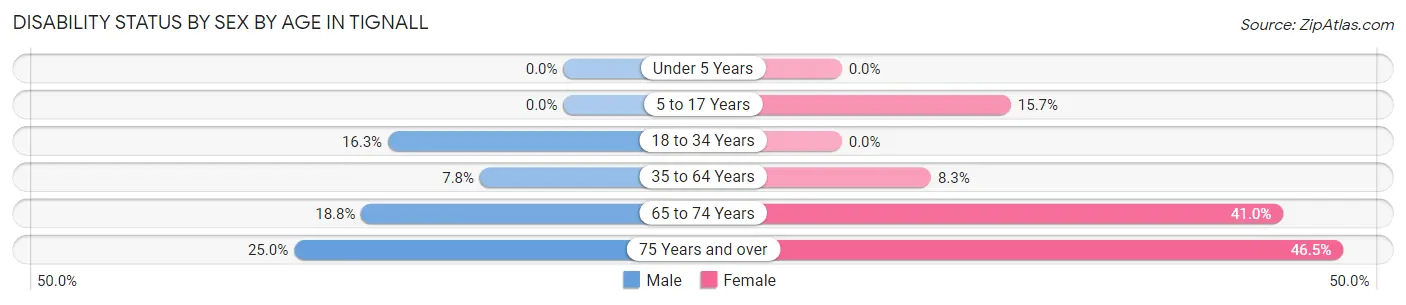
| Age Bracket | Male | Female |
| Under 5 Years | 0 (0.0%) | 0 (0.0%) |
| 5 to 17 Years | 0 (0.0%) | 8 (15.7%) |
| 18 to 34 Years | 14 (16.3%) | 0 (0.0%) |
| 35 to 64 Years | 22 (7.7%) | 14 (8.3%) |
| 65 to 74 Years | 3 (18.8%) | 34 (41.0%) |
| 75 Years and over | 8 (25.0%) | 20 (46.5%) |
Disability Class by Sex by Age in Tignall
Disability Class: Hearing Difficulty
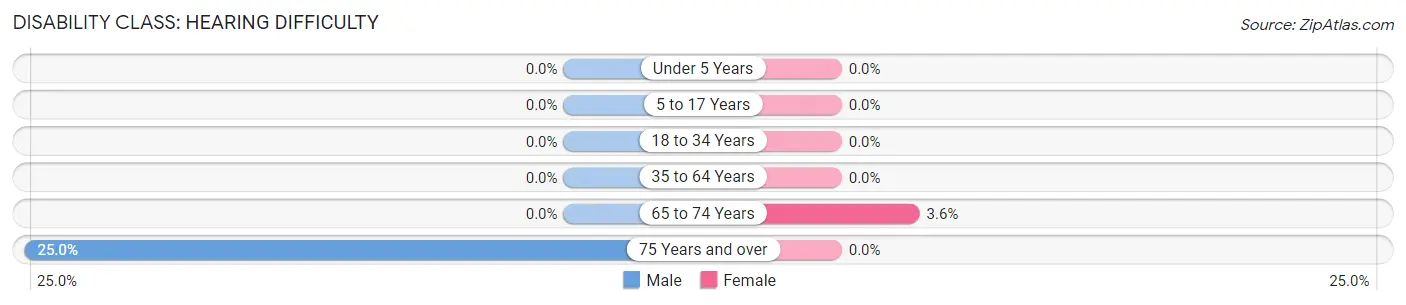
| Age Bracket | Male | Female |
| Under 5 Years | 0 (0.0%) | 0 (0.0%) |
| 5 to 17 Years | 0 (0.0%) | 0 (0.0%) |
| 18 to 34 Years | 0 (0.0%) | 0 (0.0%) |
| 35 to 64 Years | 0 (0.0%) | 0 (0.0%) |
| 65 to 74 Years | 0 (0.0%) | 3 (3.6%) |
| 75 Years and over | 8 (25.0%) | 0 (0.0%) |
Disability Class: Vision Difficulty
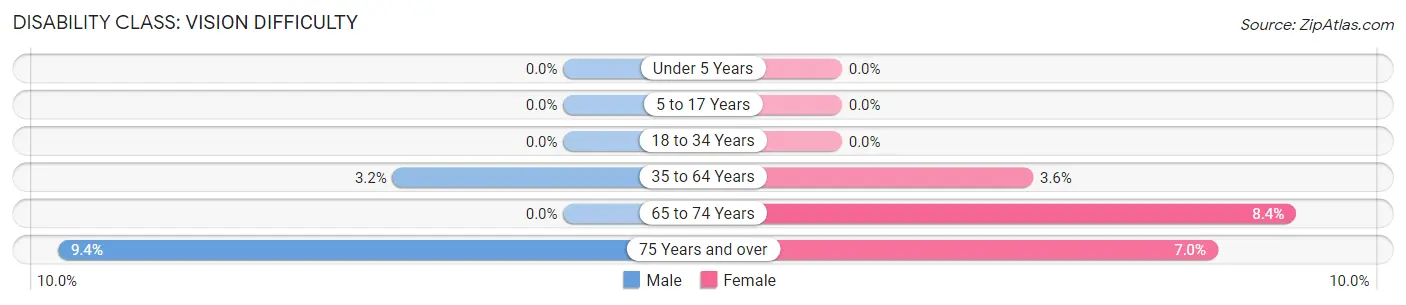
| Age Bracket | Male | Female |
| Under 5 Years | 0 (0.0%) | 0 (0.0%) |
| 5 to 17 Years | 0 (0.0%) | 0 (0.0%) |
| 18 to 34 Years | 0 (0.0%) | 0 (0.0%) |
| 35 to 64 Years | 9 (3.2%) | 6 (3.5%) |
| 65 to 74 Years | 0 (0.0%) | 7 (8.4%) |
| 75 Years and over | 3 (9.4%) | 3 (7.0%) |
Disability Class: Cognitive Difficulty
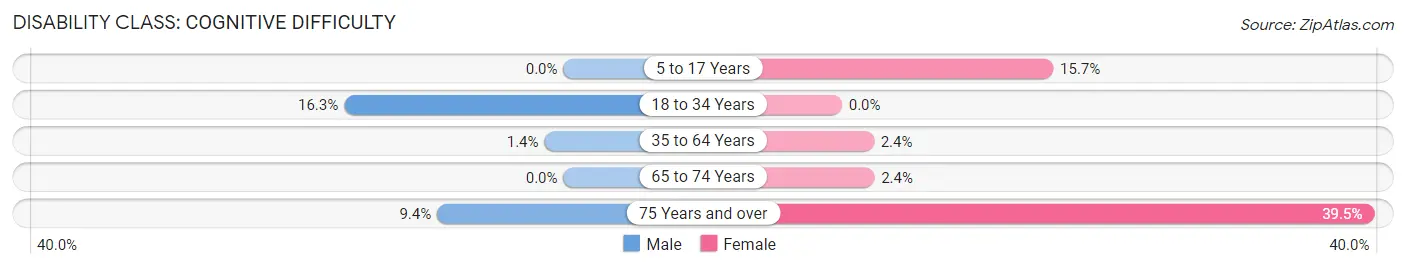
| Age Bracket | Male | Female |
| 5 to 17 Years | 0 (0.0%) | 8 (15.7%) |
| 18 to 34 Years | 14 (16.3%) | 0 (0.0%) |
| 35 to 64 Years | 4 (1.4%) | 4 (2.4%) |
| 65 to 74 Years | 0 (0.0%) | 2 (2.4%) |
| 75 Years and over | 3 (9.4%) | 17 (39.5%) |
Disability Class: Ambulatory Difficulty
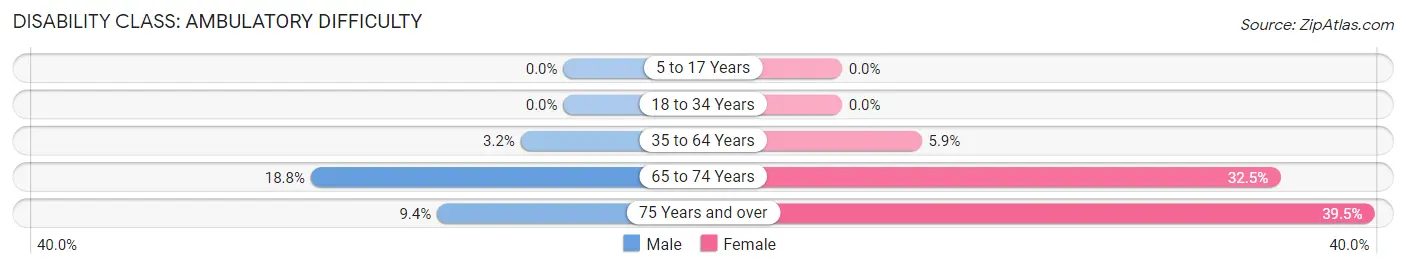
| Age Bracket | Male | Female |
| 5 to 17 Years | 0 (0.0%) | 0 (0.0%) |
| 18 to 34 Years | 0 (0.0%) | 0 (0.0%) |
| 35 to 64 Years | 9 (3.2%) | 10 (5.9%) |
| 65 to 74 Years | 3 (18.8%) | 27 (32.5%) |
| 75 Years and over | 3 (9.4%) | 17 (39.5%) |
Disability Class: Self-Care Difficulty
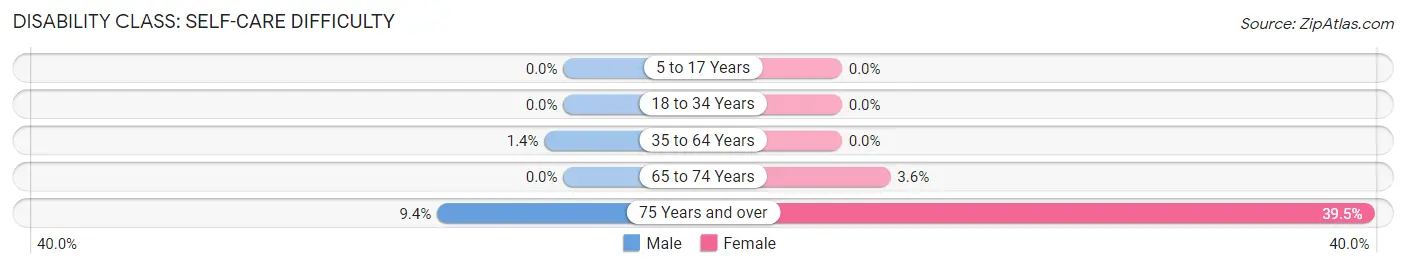
| Age Bracket | Male | Female |
| 5 to 17 Years | 0 (0.0%) | 0 (0.0%) |
| 18 to 34 Years | 0 (0.0%) | 0 (0.0%) |
| 35 to 64 Years | 4 (1.4%) | 0 (0.0%) |
| 65 to 74 Years | 0 (0.0%) | 3 (3.6%) |
| 75 Years and over | 3 (9.4%) | 17 (39.5%) |
Technology Access in Tignall
Computing Device Access in Tignall
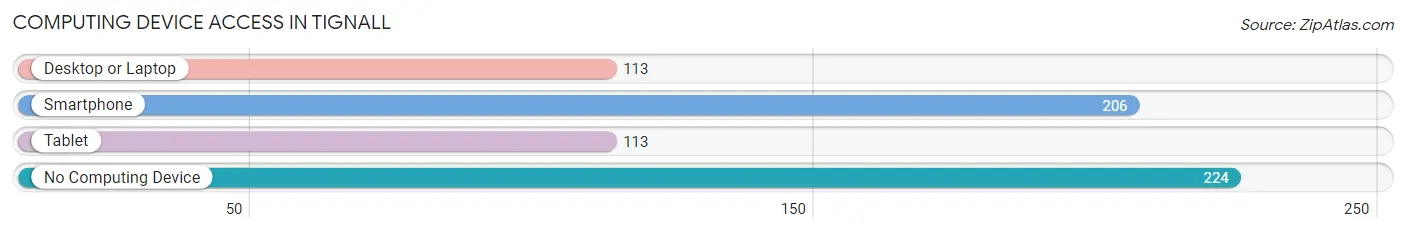
| Device Type | # Households | % Households |
| Desktop or Laptop | 113 | 25.7% |
| Smartphone | 206 | 46.8% |
| Tablet | 113 | 25.7% |
| No Computing Device | 224 | 50.9% |
| Total | 440 | 100.0% |
Internet Access in Tignall
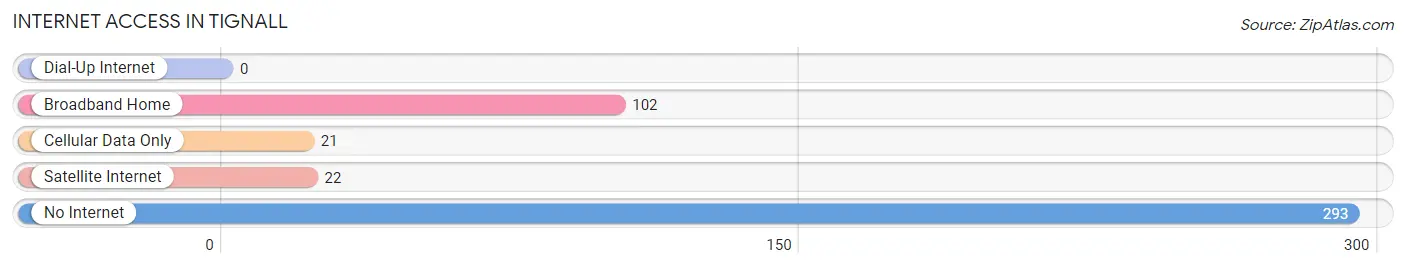
| Internet Type | # Households | % Households |
| Dial-Up Internet | 0 | 0.0% |
| Broadband Home | 102 | 23.2% |
| Cellular Data Only | 21 | 4.8% |
| Satellite Internet | 22 | 5.0% |
| No Internet | 293 | 66.6% |
| Total | 440 | 100.0% |
Tignall Summary
Tignall is a small town located in Wilkes County, Georgia, United States. It is situated along the banks of the Broad River, approximately 50 miles east of Athens. The town was founded in 1820 and incorporated in 1891. As of the 2010 census, the population of Tignall was 517.
History
Tignall was founded in 1820 by a group of settlers from North Carolina. The town was named after a local Native American chief, Tignall. The town was incorporated in 1891 and was the first town in Wilkes County to be incorporated.
Tignall was a major railroad hub in the late 19th and early 20th centuries. The town was home to the Tignall and Washington Railroad, which connected Tignall to Washington, Georgia. The railroad was used to transport cotton, timber, and other goods.
The town was also home to a number of businesses, including a cotton gin, a grist mill, a sawmill, and a blacksmith shop. In the early 20th century, Tignall was home to a number of stores, including a general store, a drug store, and a hardware store.
Geography
Tignall is located in Wilkes County, Georgia, approximately 50 miles east of Athens. The town is situated along the banks of the Broad River. The town has a total area of 1.2 square miles, all of which is land.
The town is located in the Piedmont region of Georgia, which is characterized by rolling hills and forests. The town is located in the foothills of the Blue Ridge Mountains.
Economy
Tignall’s economy is largely based on agriculture. The town is home to a number of farms, which produce a variety of crops, including corn, soybeans, and cotton. The town is also home to a number of timber companies, which harvest timber from the surrounding forests.
The town is also home to a number of small businesses, including restaurants, convenience stores, and auto repair shops. The town is also home to a number of manufacturing companies, which produce a variety of products, including furniture, clothing, and electronics.
Demographics
As of the 2010 census, the population of Tignall was 517. The town has a population density of 431 people per square mile. The median age of the population is 41.7 years.
The racial makeup of the town is 87.3% White, 9.2% African American, 0.4% Native American, 0.2% Asian, 0.2% Pacific Islander, and 2.7% from other races. The median household income is $30,938. The per capita income is $15,945.
Conclusion
Tignall is a small town located in Wilkes County, Georgia. The town was founded in 1820 and incorporated in 1891. As of the 2010 census, the population of Tignall was 517. The town’s economy is largely based on agriculture and timber production. The town is also home to a number of small businesses. The racial makeup of the town is 87.3% White, 9.2% African American, 0.4% Native American, 0.2% Asian, 0.2% Pacific Islander, and 2.7% from other races. The median household income is $30,938.
Common Questions
What is Per Capita Income in Tignall?
Per Capita income in Tignall is $21,757.
What is the Median Family Income in Tignall?
Median Family Income in Tignall is $80,892.
What is the Median Household income in Tignall?
Median Household Income in Tignall is $80,122.
What is Income or Wage Gap in Tignall?
Income or Wage Gap in Tignall is 42.5%.
Women in Tignall earn 57.5 cents for every dollar earned by a man.
What is Inequality or Gini Index in Tignall?
Inequality or Gini Index in Tignall is 0.35.
What is the Total Population of Tignall?
Total Population of Tignall is 1,163.
What is the Total Male Population of Tignall?
Total Male Population of Tignall is 714.
What is the Total Female Population of Tignall?
Total Female Population of Tignall is 449.
What is the Ratio of Males per 100 Females in Tignall?
There are 159.02 Males per 100 Females in Tignall.
What is the Ratio of Females per 100 Males in Tignall?
There are 62.89 Females per 100 Males in Tignall.
What is the Median Population Age in Tignall?
Median Population Age in Tignall is 40.4 Years.
What is the Average Family Size in Tignall
Average Family Size in Tignall is 3.0 People.
What is the Average Household Size in Tignall
Average Household Size in Tignall is 2.6 People.
How Large is the Labor Force in Tignall?
There are 343 People in the Labor Forcein in Tignall.
What is the Percentage of People in the Labor Force in Tignall?
39.8% of People are in the Labor Force in Tignall.
What is the Unemployment Rate in Tignall?
Unemployment Rate in Tignall is 9.3%.