Arnoldsville, GA Map & Demographics
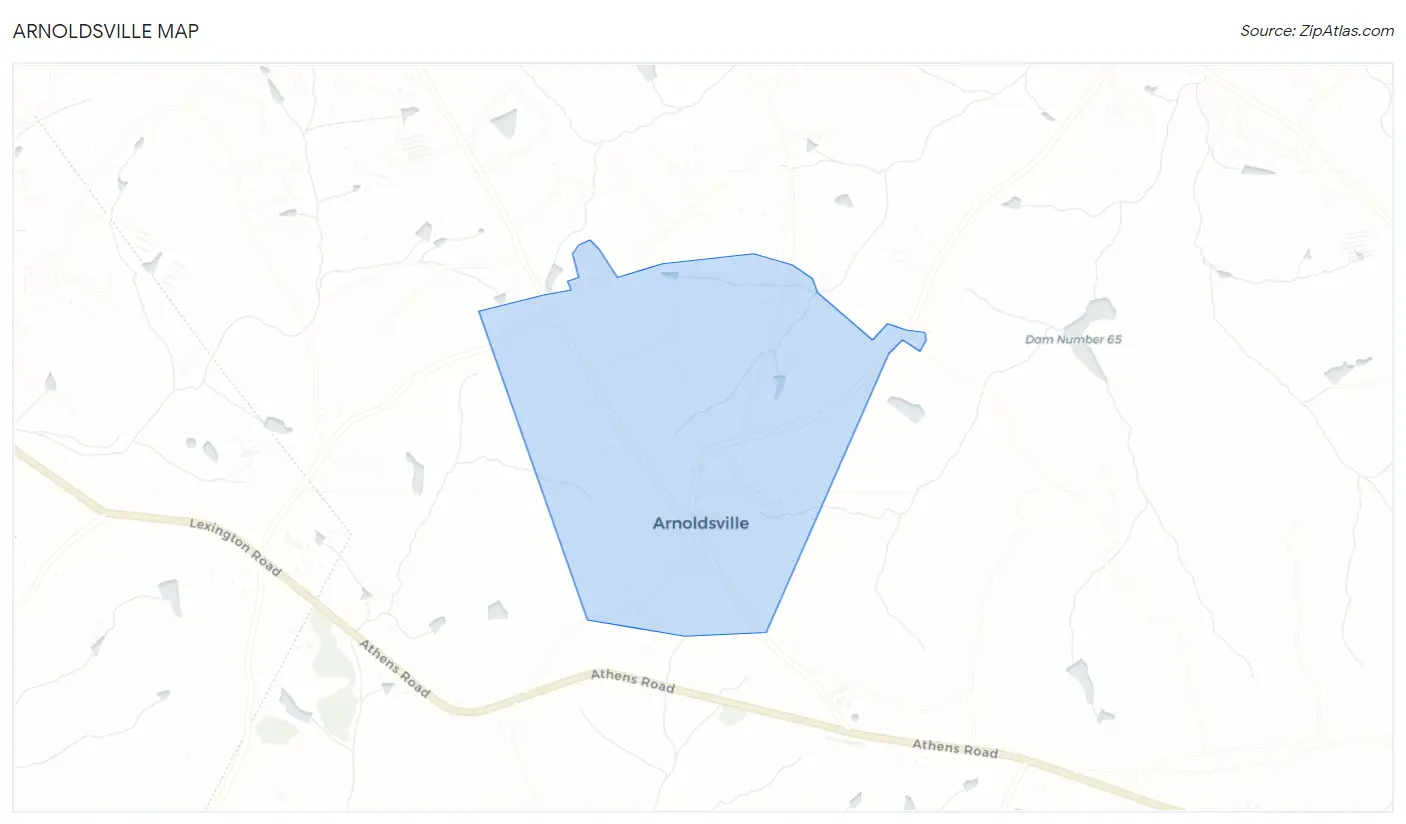
Arnoldsville Map
Arnoldsville Overview
$26,520
PER CAPITA INCOME
$63,750
AVG FAMILY INCOME
$42,292
AVG HOUSEHOLD INCOME
54.5%
WAGE / INCOME GAP [ % ]
45.5¢/ $1
WAGE / INCOME GAP [ $ ]
0.39
INEQUALITY / GINI INDEX
486
TOTAL POPULATION
231
MALE POPULATION
255
FEMALE POPULATION
90.59
MALES / 100 FEMALES
110.39
FEMALES / 100 MALES
46.3
MEDIAN AGE
2.9
AVG FAMILY SIZE
2.3
AVG HOUSEHOLD SIZE
244
LABOR FORCE [ PEOPLE ]
56.9%
PERCENT IN LABOR FORCE
2.0%
UNEMPLOYMENT RATE
Arnoldsville Zip Codes
Arnoldsville Area Codes
Income in Arnoldsville
Income Overview in Arnoldsville
Per Capita Income in Arnoldsville is $26,520, while median incomes of families and households are $63,750 and $42,292 respectively.
| Characteristic | Number | Measure |
| Per Capita Income | 486 | $26,520 |
| Median Family Income | 143 | $63,750 |
| Mean Family Income | 143 | $66,259 |
| Median Household Income | 207 | $42,292 |
| Mean Household Income | 207 | $59,374 |
| Income Deficit | 143 | $0 |
| Wage / Income Gap (%) | 486 | 54.51% |
| Wage / Income Gap ($) | 486 | 45.49¢ per $1 |
| Gini / Inequality Index | 486 | 0.39 |
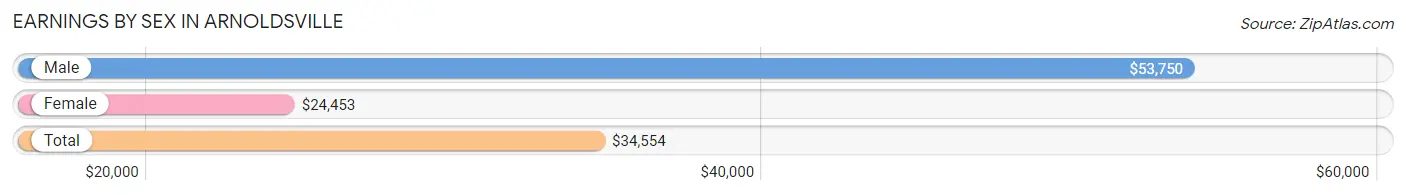
Earnings by Sex in Arnoldsville
Average Earnings in Arnoldsville are $34,554, $53,750 for men and $24,453 for women, a difference of 54.5%.
| Sex | Number | Average Earnings |
| Male | 99 (39.0%) | $53,750 |
| Female | 155 (61.0%) | $24,453 |
| Total | 254 (100.0%) | $34,554 |
Earnings by Sex by Income Bracket in Arnoldsville
The most common earnings brackets in Arnoldsville are $50,000 to $54,999 for men (13 | 13.1%) and $10,000 to $12,499 for women (29 | 18.7%).

| Income | Male | Female |
| $2,499 or less | 0 (0.0%) | 15 (9.7%) |
| $2,500 to $4,999 | 5 (5.1%) | 9 (5.8%) |
| $5,000 to $7,499 | 2 (2.0%) | 5 (3.2%) |
| $7,500 to $9,999 | 3 (3.0%) | 0 (0.0%) |
| $10,000 to $12,499 | 0 (0.0%) | 29 (18.7%) |
| $12,500 to $14,999 | 2 (2.0%) | 1 (0.6%) |
| $15,000 to $17,499 | 0 (0.0%) | 0 (0.0%) |
| $17,500 to $19,999 | 5 (5.1%) | 2 (1.3%) |
| $20,000 to $22,499 | 0 (0.0%) | 4 (2.6%) |
| $22,500 to $24,999 | 2 (2.0%) | 16 (10.3%) |
| $25,000 to $29,999 | 2 (2.0%) | 2 (1.3%) |
| $30,000 to $34,999 | 1 (1.0%) | 27 (17.4%) |
| $35,000 to $39,999 | 6 (6.1%) | 7 (4.5%) |
| $40,000 to $44,999 | 3 (3.0%) | 13 (8.4%) |
| $45,000 to $49,999 | 11 (11.1%) | 5 (3.2%) |
| $50,000 to $54,999 | 13 (13.1%) | 1 (0.6%) |
| $55,000 to $64,999 | 13 (13.1%) | 10 (6.5%) |
| $65,000 to $74,999 | 8 (8.1%) | 0 (0.0%) |
| $75,000 to $99,999 | 13 (13.1%) | 8 (5.2%) |
| $100,000+ | 10 (10.1%) | 1 (0.6%) |
| Total | 99 (100.0%) | 155 (100.0%) |
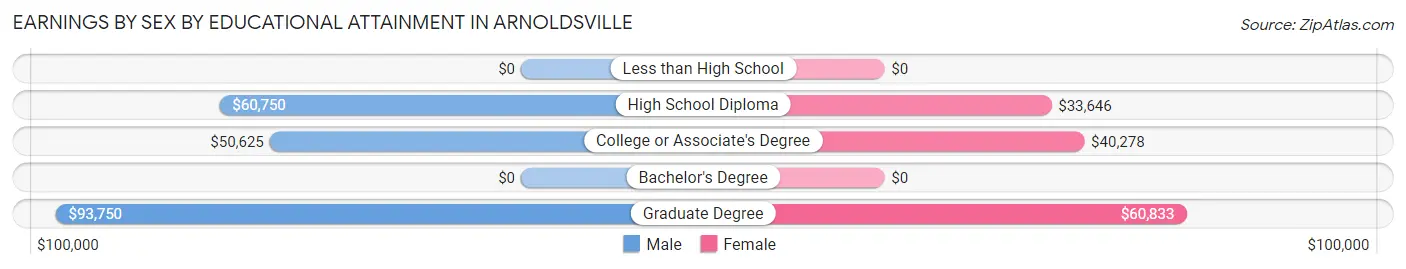
Earnings by Sex by Educational Attainment in Arnoldsville
Average earnings in Arnoldsville are $54,886 for men and $33,380 for women, a difference of 39.2%. Men with an educational attainment of graduate degree enjoy the highest average annual earnings of $93,750, while those with college or associate's degree education earn the least with $50,625. Women with an educational attainment of graduate degree earn the most with the average annual earnings of $60,833, while those with high school diploma education have the smallest earnings of $33,646.
| Educational Attainment | Male Income | Female Income |
| Less than High School | - | - |
| High School Diploma | $60,750 | $33,646 |
| College or Associate's Degree | $50,625 | $40,278 |
| Bachelor's Degree | - | - |
| Graduate Degree | $93,750 | $60,833 |
| Total | $54,886 | $33,380 |
Family Income in Arnoldsville
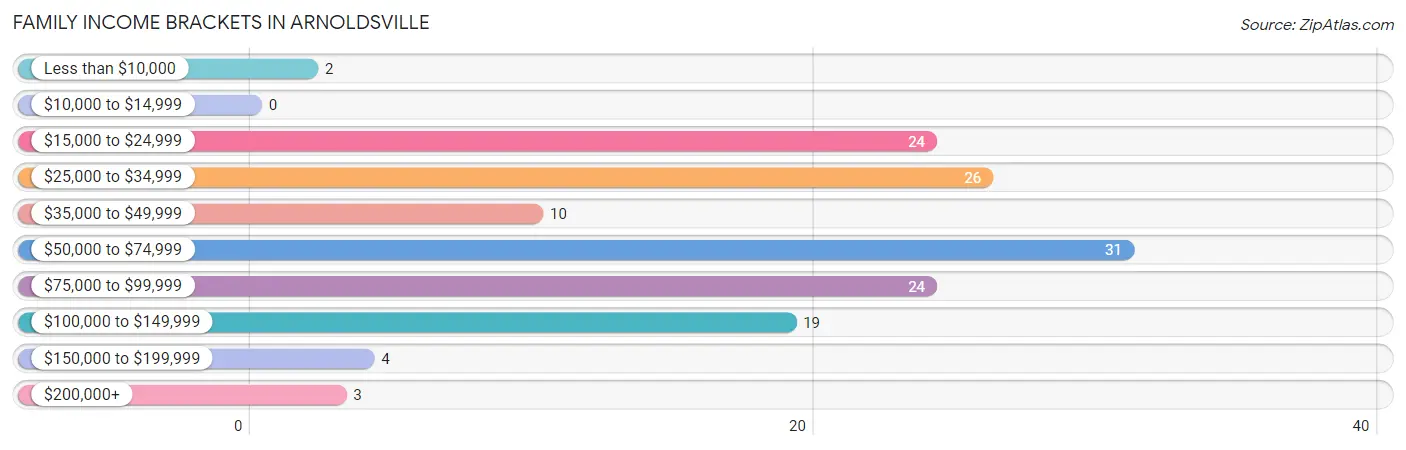
Family Income Brackets in Arnoldsville
According to the Arnoldsville family income data, there are 31 families falling into the $50,000 to $74,999 income range, which is the most common income bracket and makes up 21.7% of all families.
| Income Bracket | # Families | % Families |
| Less than $10,000 | 2 | 1.4% |
| $10,000 to $14,999 | 0 | 0.0% |
| $15,000 to $24,999 | 24 | 16.8% |
| $25,000 to $34,999 | 26 | 18.2% |
| $35,000 to $49,999 | 10 | 7.0% |
| $50,000 to $74,999 | 31 | 21.7% |
| $75,000 to $99,999 | 24 | 16.8% |
| $100,000 to $149,999 | 19 | 13.3% |
| $150,000 to $199,999 | 4 | 2.8% |
| $200,000+ | 3 | 2.1% |
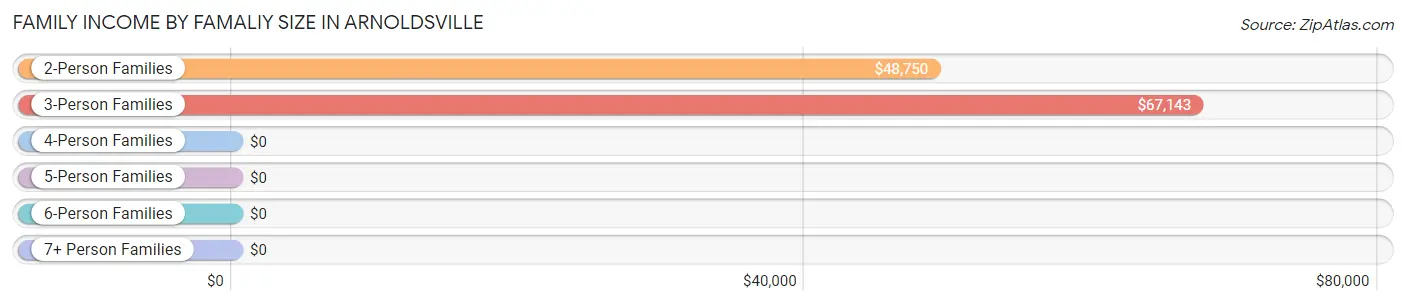
Family Income by Famaliy Size in Arnoldsville
3-person families (28 | 19.6%) account for the highest median family income in Arnoldsville with $67,143 per family, while 2-person families (74 | 51.7%) have the highest median income of $24,375 per family member.
| Income Bracket | # Families | Median Income |
| 2-Person Families | 74 (51.7%) | $48,750 |
| 3-Person Families | 28 (19.6%) | $67,143 |
| 4-Person Families | 39 (27.3%) | $0 |
| 5-Person Families | 2 (1.4%) | $0 |
| 6-Person Families | 0 (0.0%) | $0 |
| 7+ Person Families | 0 (0.0%) | $0 |
| Total | 143 (100.0%) | $63,750 |
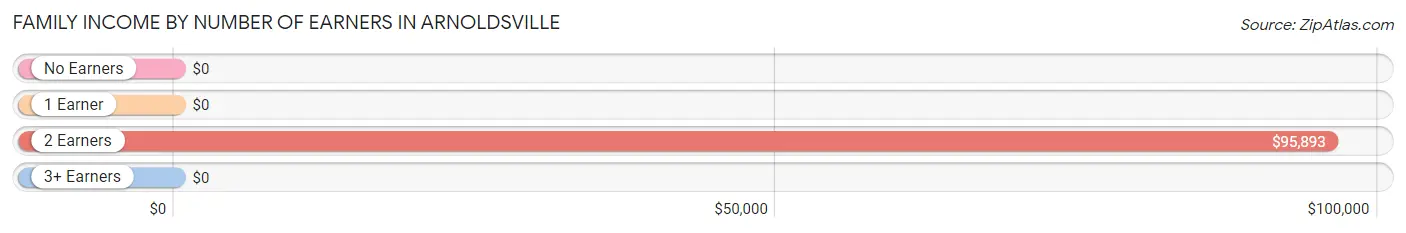
Family Income by Number of Earners in Arnoldsville
| Number of Earners | # Families | Median Income |
| No Earners | 41 (28.7%) | $0 |
| 1 Earner | 47 (32.9%) | $0 |
| 2 Earners | 31 (21.7%) | $95,893 |
| 3+ Earners | 24 (16.8%) | $0 |
| Total | 143 (100.0%) | $63,750 |
Household Income in Arnoldsville
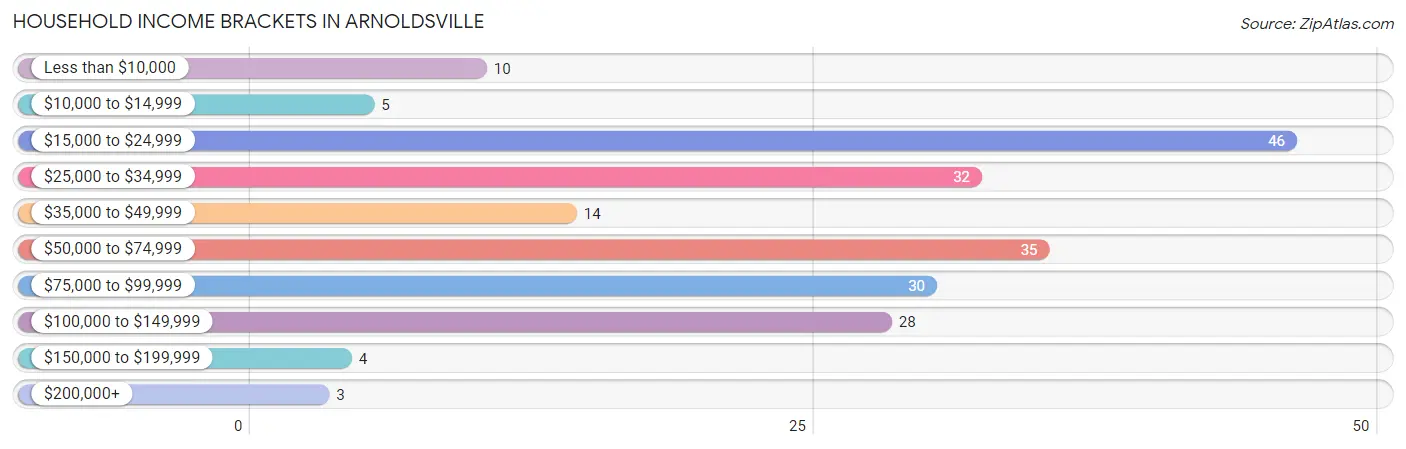
Household Income Brackets in Arnoldsville
With 46 households falling in the category, the $15,000 to $24,999 income range is the most frequent in Arnoldsville, accounting for 22.2% of all households. In contrast, only 3 households (1.5%) fall into the $200,000+ income bracket, making it the least populous group.
| Income Bracket | # Households | % Households |
| Less than $10,000 | 10 | 4.8% |
| $10,000 to $14,999 | 5 | 2.4% |
| $15,000 to $24,999 | 46 | 22.2% |
| $25,000 to $34,999 | 32 | 15.5% |
| $35,000 to $49,999 | 14 | 6.8% |
| $50,000 to $74,999 | 35 | 16.9% |
| $75,000 to $99,999 | 30 | 14.5% |
| $100,000 to $149,999 | 28 | 13.5% |
| $150,000 to $199,999 | 4 | 1.9% |
| $200,000+ | 3 | 1.4% |
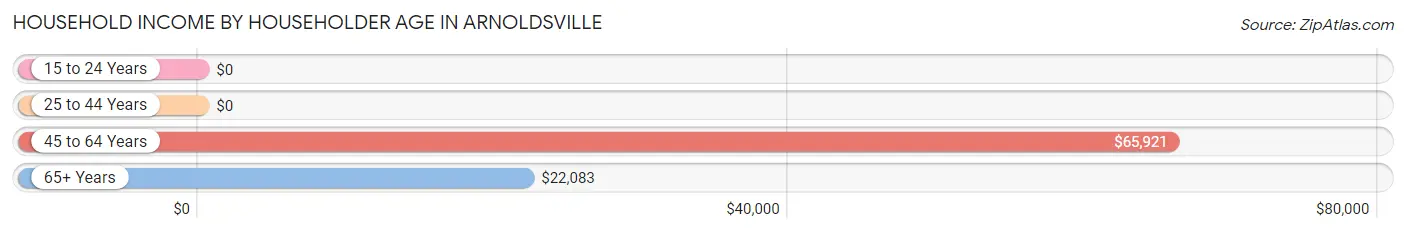
Household Income by Householder Age in Arnoldsville
The median household income in Arnoldsville is $42,292, with the highest median household income of $65,921 found in the 45 to 64 years age bracket for the primary householder. A total of 82 households (39.6%) fall into this category. Meanwhile, the 15 to 24 years age bracket for the primary householder has the lowest median household income of $0, with 2 households (1.0%) in this group.
| Income Bracket | # Households | Median Income |
| 15 to 24 Years | 2 (1.0%) | $0 |
| 25 to 44 Years | 61 (29.5%) | $0 |
| 45 to 64 Years | 82 (39.6%) | $65,921 |
| 65+ Years | 62 (29.9%) | $22,083 |
| Total | 207 (100.0%) | $42,292 |
Poverty in Arnoldsville
Income Below Poverty by Sex and Age in Arnoldsville
With 6.5% poverty level for males and 2.0% for females among the residents of Arnoldsville, 75 year old and over males and 55 to 64 year old females are the most vulnerable to poverty, with 7 males (63.6%) and 3 females (17.6%) in their respective age groups living below the poverty level.
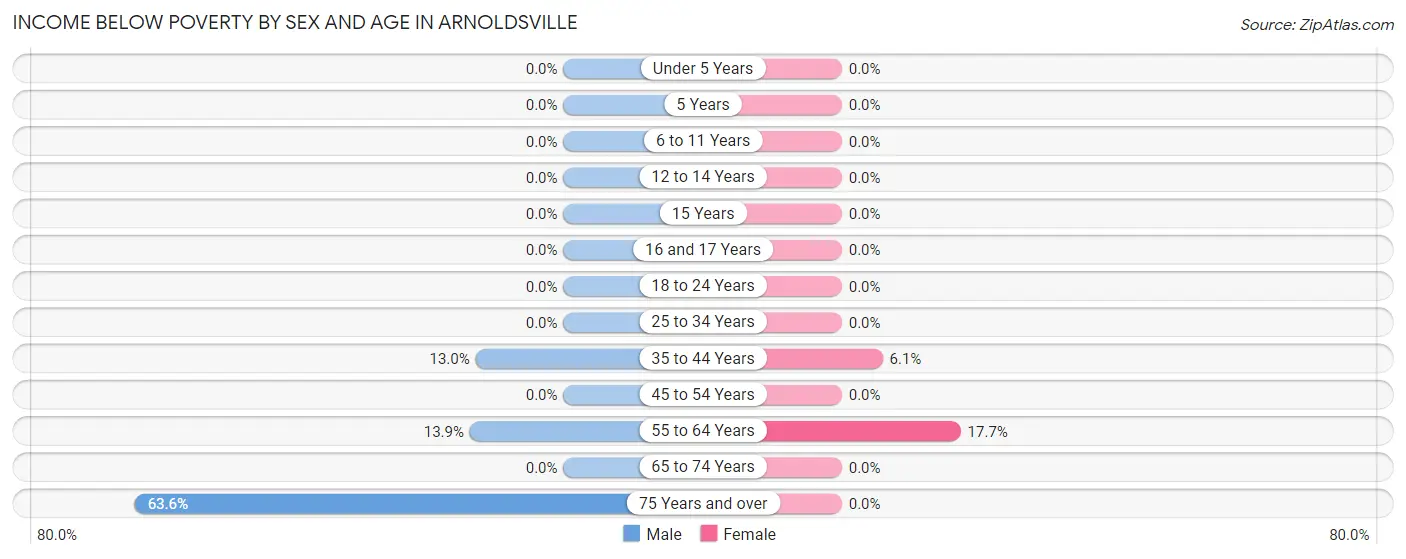
| Age Bracket | Male | Female |
| Under 5 Years | 0 (0.0%) | 0 (0.0%) |
| 5 Years | 0 (0.0%) | 0 (0.0%) |
| 6 to 11 Years | 0 (0.0%) | 0 (0.0%) |
| 12 to 14 Years | 0 (0.0%) | 0 (0.0%) |
| 15 Years | 0 (0.0%) | 0 (0.0%) |
| 16 and 17 Years | 0 (0.0%) | 0 (0.0%) |
| 18 to 24 Years | 0 (0.0%) | 0 (0.0%) |
| 25 to 34 Years | 0 (0.0%) | 0 (0.0%) |
| 35 to 44 Years | 3 (13.0%) | 2 (6.1%) |
| 45 to 54 Years | 0 (0.0%) | 0 (0.0%) |
| 55 to 64 Years | 5 (13.9%) | 3 (17.6%) |
| 65 to 74 Years | 0 (0.0%) | 0 (0.0%) |
| 75 Years and over | 7 (63.6%) | 0 (0.0%) |
| Total | 15 (6.5%) | 5 (2.0%) |
Income Above Poverty by Sex and Age in Arnoldsville
According to the poverty statistics in Arnoldsville, males aged under 5 years and females aged under 5 years are the age groups that are most secure financially, with 100.0% of males and 100.0% of females in these age groups living above the poverty line.
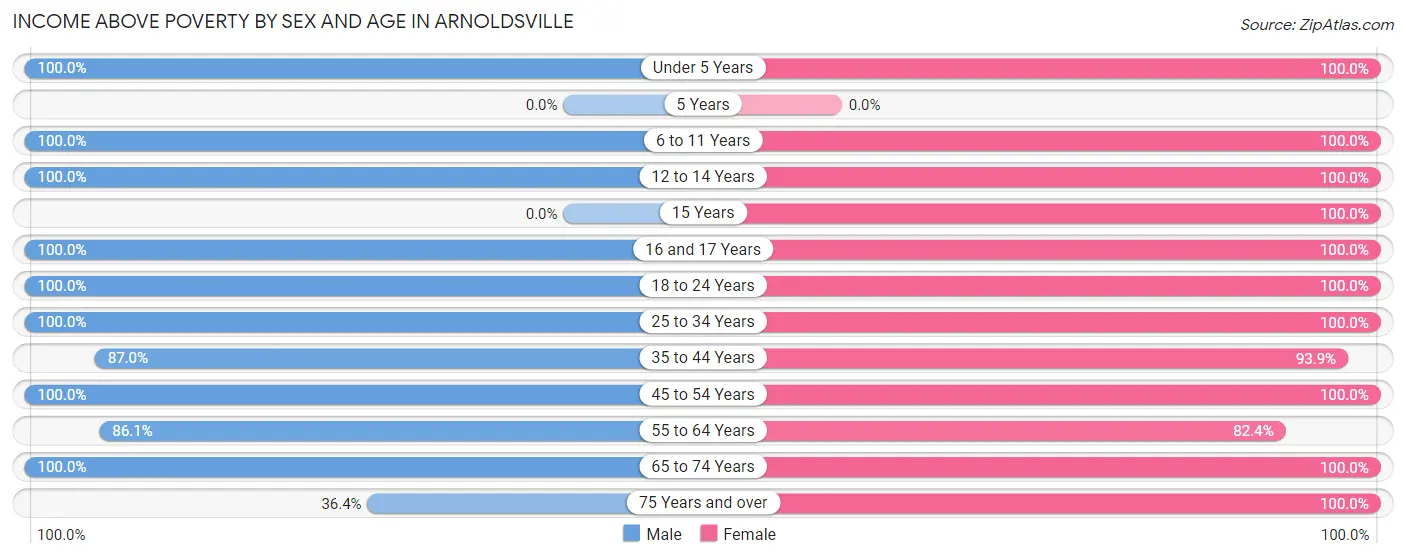
| Age Bracket | Male | Female |
| Under 5 Years | 2 (100.0%) | 4 (100.0%) |
| 5 Years | 0 (0.0%) | 0 (0.0%) |
| 6 to 11 Years | 6 (100.0%) | 5 (100.0%) |
| 12 to 14 Years | 32 (100.0%) | 4 (100.0%) |
| 15 Years | 0 (0.0%) | 4 (100.0%) |
| 16 and 17 Years | 22 (100.0%) | 5 (100.0%) |
| 18 to 24 Years | 17 (100.0%) | 40 (100.0%) |
| 25 to 34 Years | 21 (100.0%) | 14 (100.0%) |
| 35 to 44 Years | 20 (87.0%) | 31 (93.9%) |
| 45 to 54 Years | 33 (100.0%) | 64 (100.0%) |
| 55 to 64 Years | 31 (86.1%) | 14 (82.4%) |
| 65 to 74 Years | 28 (100.0%) | 49 (100.0%) |
| 75 Years and over | 4 (36.4%) | 12 (100.0%) |
| Total | 216 (93.5%) | 246 (98.0%) |
Income Below Poverty Among Married-Couple Families in Arnoldsville
The poverty statistics for married-couple families in Arnoldsville show that 1.9% or 2 of the total 106 families live below the poverty line. Families with no children have the highest poverty rate of 2.2%, comprising of 2 families. On the other hand, families with 1 or 2 children have the lowest poverty rate of 0.0%, which includes 0 families.
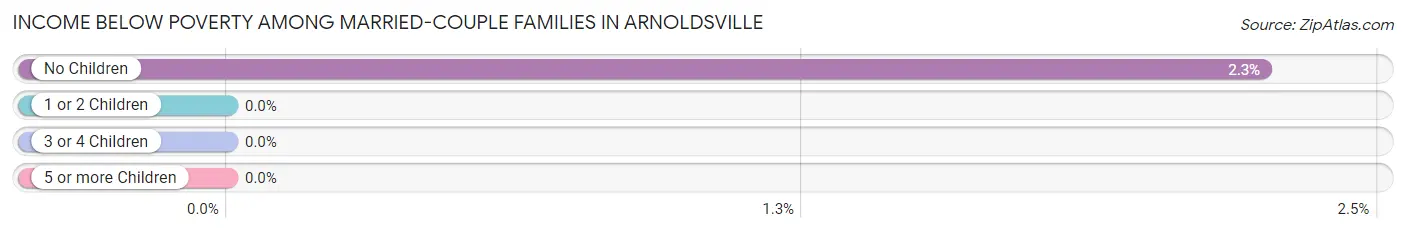
| Children | Above Poverty | Below Poverty |
| No Children | 87 (97.8%) | 2 (2.2%) |
| 1 or 2 Children | 15 (100.0%) | 0 (0.0%) |
| 3 or 4 Children | 2 (100.0%) | 0 (0.0%) |
| 5 or more Children | 0 (0.0%) | 0 (0.0%) |
| Total | 104 (98.1%) | 2 (1.9%) |
Income Below Poverty Among Single-Parent Households in Arnoldsville
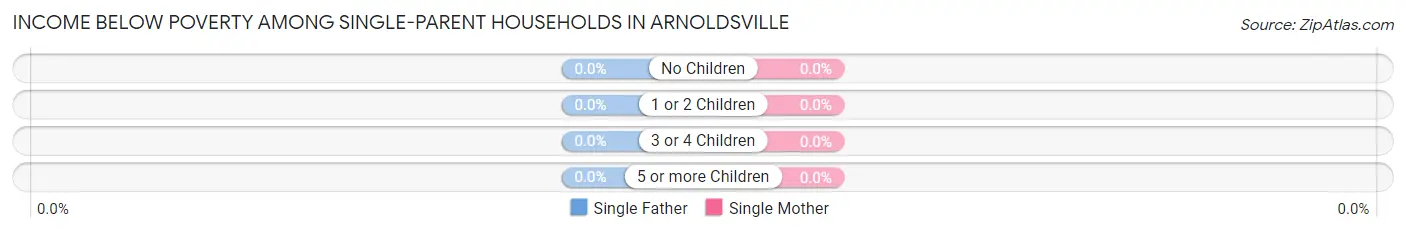
| Children | Single Father | Single Mother |
| No Children | 0 (0.0%) | 0 (0.0%) |
| 1 or 2 Children | 0 (0.0%) | 0 (0.0%) |
| 3 or 4 Children | 0 (0.0%) | 0 (0.0%) |
| 5 or more Children | 0 (0.0%) | 0 (0.0%) |
| Total | 0 (0.0%) | 0 (0.0%) |
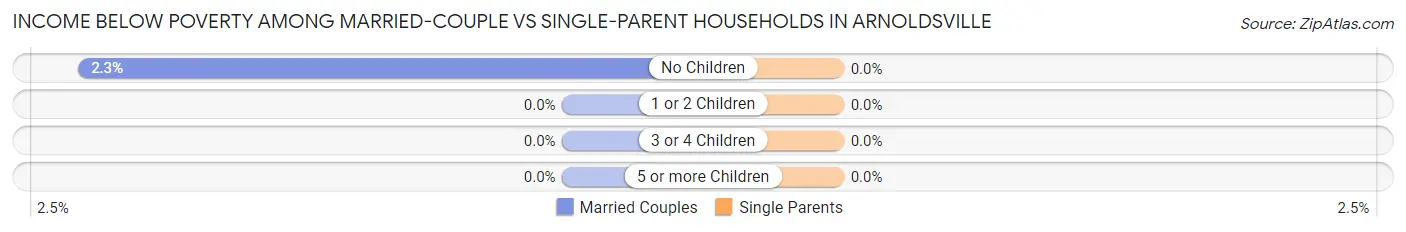
Income Below Poverty Among Married-Couple vs Single-Parent Households in Arnoldsville
| Children | Married-Couple Families | Single-Parent Households |
| No Children | 2 (2.2%) | 0 (0.0%) |
| 1 or 2 Children | 0 (0.0%) | 0 (0.0%) |
| 3 or 4 Children | 0 (0.0%) | 0 (0.0%) |
| 5 or more Children | 0 (0.0%) | 0 (0.0%) |
| Total | 2 (1.9%) | 0 (0.0%) |
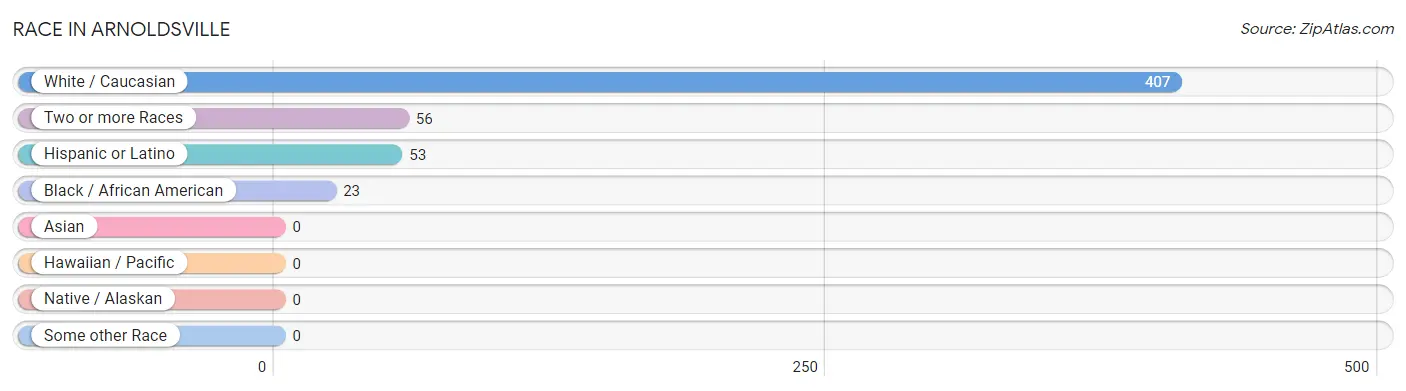
Race in Arnoldsville
The most populous races in Arnoldsville are White / Caucasian (407 | 83.7%), Two or more Races (56 | 11.5%), and Hispanic or Latino (53 | 10.9%).
| Race | # Population | % Population |
| Asian | 0 | 0.0% |
| Black / African American | 23 | 4.7% |
| Hawaiian / Pacific | 0 | 0.0% |
| Hispanic or Latino | 53 | 10.9% |
| Native / Alaskan | 0 | 0.0% |
| White / Caucasian | 407 | 83.7% |
| Two or more Races | 56 | 11.5% |
| Some other Race | 0 | 0.0% |
| Total | 486 | 100.0% |
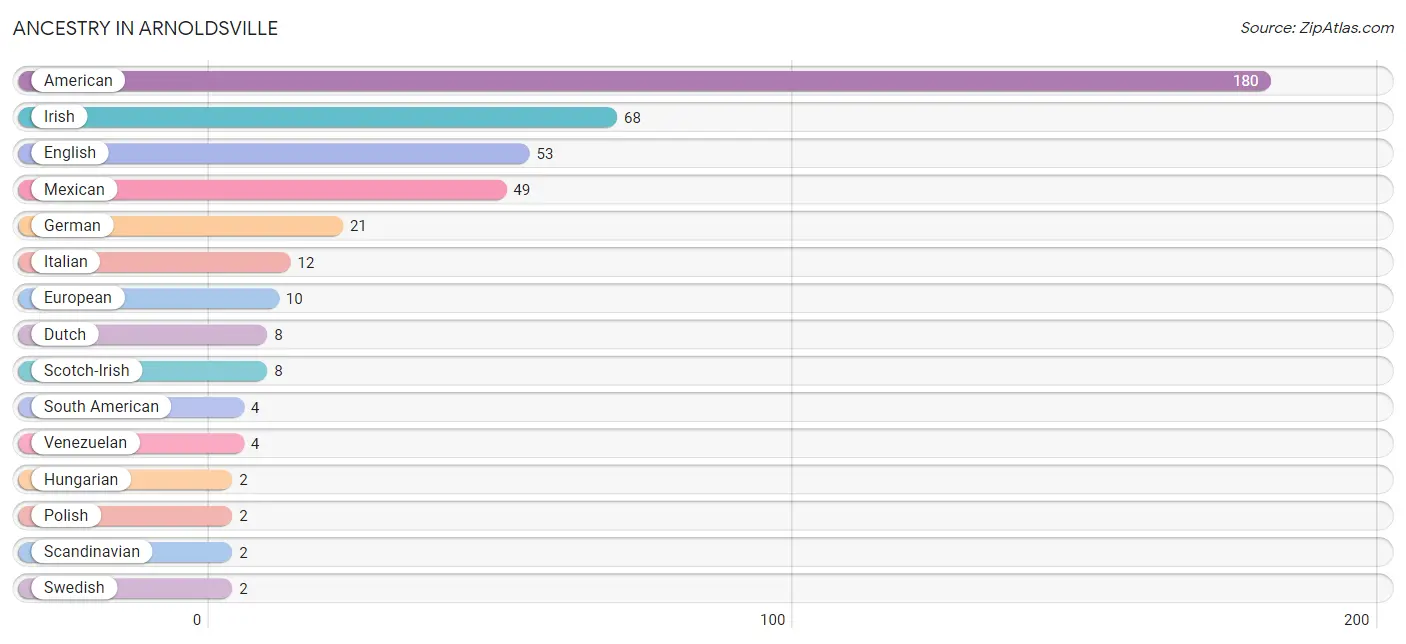
Ancestry in Arnoldsville
The most populous ancestries reported in Arnoldsville are American (180 | 37.0%), Irish (68 | 14.0%), English (53 | 10.9%), Mexican (49 | 10.1%), and German (21 | 4.3%), together accounting for 76.3% of all Arnoldsville residents.
| Ancestry | # Population | % Population |
| American | 180 | 37.0% |
| Belgian | 1 | 0.2% |
| British | 1 | 0.2% |
| Dutch | 8 | 1.7% |
| English | 53 | 10.9% |
| European | 10 | 2.1% |
| German | 21 | 4.3% |
| Hungarian | 2 | 0.4% |
| Inupiat | 1 | 0.2% |
| Irish | 68 | 14.0% |
| Italian | 12 | 2.5% |
| Mexican | 49 | 10.1% |
| Norwegian | 1 | 0.2% |
| Polish | 2 | 0.4% |
| Scandinavian | 2 | 0.4% |
| Scotch-Irish | 8 | 1.7% |
| South American | 4 | 0.8% |
| Swedish | 2 | 0.4% |
| Venezuelan | 4 | 0.8% | View All 19 Rows |
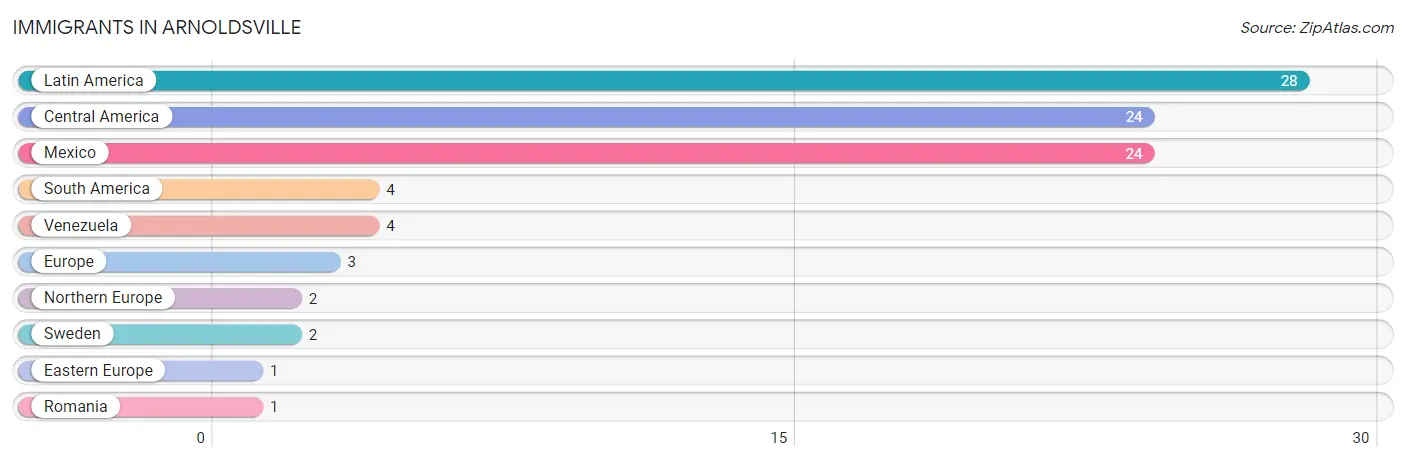
Immigrants in Arnoldsville
The most numerous immigrant groups reported in Arnoldsville came from Latin America (28 | 5.8%), Central America (24 | 4.9%), Mexico (24 | 4.9%), South America (4 | 0.8%), and Venezuela (4 | 0.8%), together accounting for 17.3% of all Arnoldsville residents.
| Immigration Origin | # Population | % Population |
| Central America | 24 | 4.9% |
| Eastern Europe | 1 | 0.2% |
| Europe | 3 | 0.6% |
| Latin America | 28 | 5.8% |
| Mexico | 24 | 4.9% |
| Northern Europe | 2 | 0.4% |
| Romania | 1 | 0.2% |
| South America | 4 | 0.8% |
| Sweden | 2 | 0.4% |
| Venezuela | 4 | 0.8% | View All 10 Rows |
Sex and Age in Arnoldsville
Sex and Age in Arnoldsville
The most populous age groups in Arnoldsville are 10 to 14 Years (32 | 13.9%) for men and 20 to 24 Years (36 | 14.1%) for women.
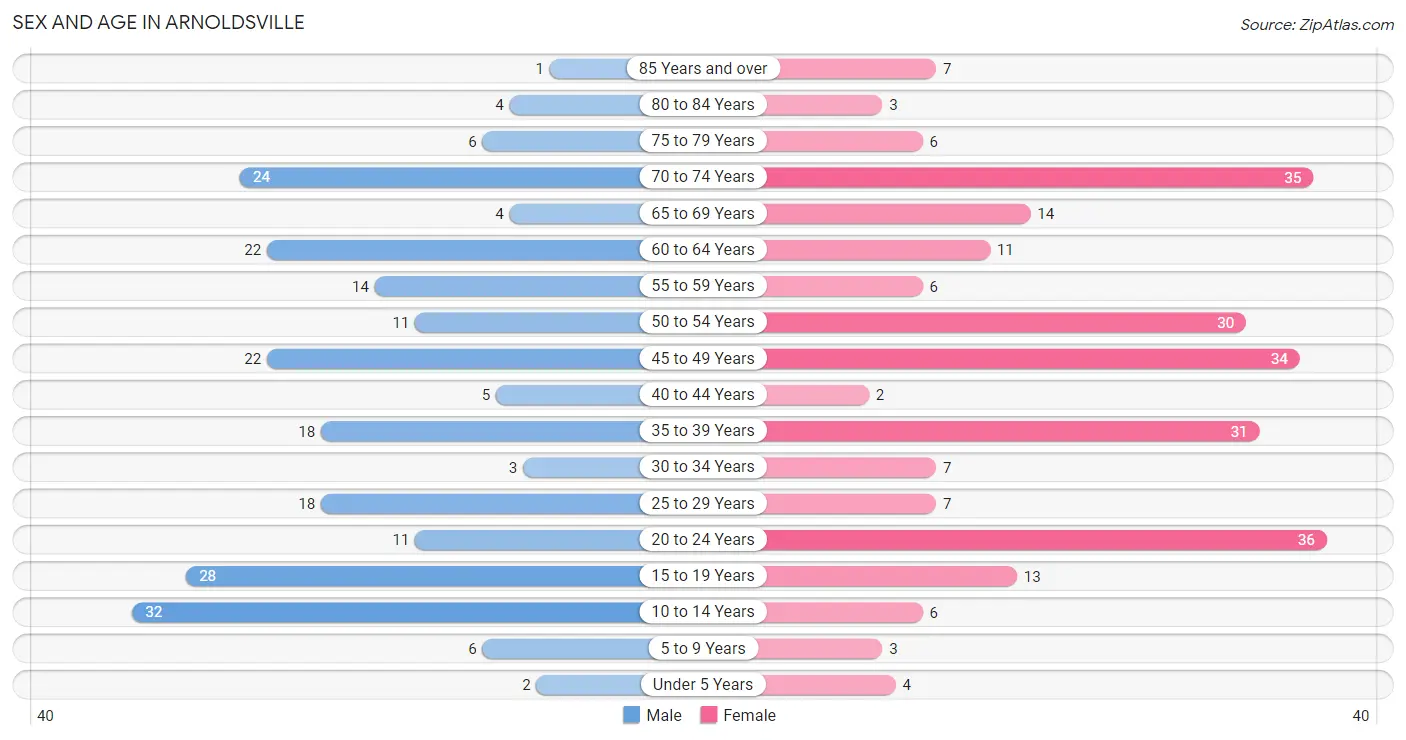
| Age Bracket | Male | Female |
| Under 5 Years | 2 (0.9%) | 4 (1.6%) |
| 5 to 9 Years | 6 (2.6%) | 3 (1.2%) |
| 10 to 14 Years | 32 (13.9%) | 6 (2.4%) |
| 15 to 19 Years | 28 (12.1%) | 13 (5.1%) |
| 20 to 24 Years | 11 (4.8%) | 36 (14.1%) |
| 25 to 29 Years | 18 (7.8%) | 7 (2.8%) |
| 30 to 34 Years | 3 (1.3%) | 7 (2.8%) |
| 35 to 39 Years | 18 (7.8%) | 31 (12.2%) |
| 40 to 44 Years | 5 (2.2%) | 2 (0.8%) |
| 45 to 49 Years | 22 (9.5%) | 34 (13.3%) |
| 50 to 54 Years | 11 (4.8%) | 30 (11.8%) |
| 55 to 59 Years | 14 (6.1%) | 6 (2.4%) |
| 60 to 64 Years | 22 (9.5%) | 11 (4.3%) |
| 65 to 69 Years | 4 (1.7%) | 14 (5.5%) |
| 70 to 74 Years | 24 (10.4%) | 35 (13.7%) |
| 75 to 79 Years | 6 (2.6%) | 6 (2.4%) |
| 80 to 84 Years | 4 (1.7%) | 3 (1.2%) |
| 85 Years and over | 1 (0.4%) | 7 (2.8%) |
| Total | 231 (100.0%) | 255 (100.0%) |
Families and Households in Arnoldsville
Median Family Size in Arnoldsville
The median family size in Arnoldsville is 2.87 persons per family, with single male/father families (5 | 3.5%) accounting for the largest median family size of 4.2 persons per family. On the other hand, married-couple families (106 | 74.1%) represent the smallest median family size with 2.77 persons per family.
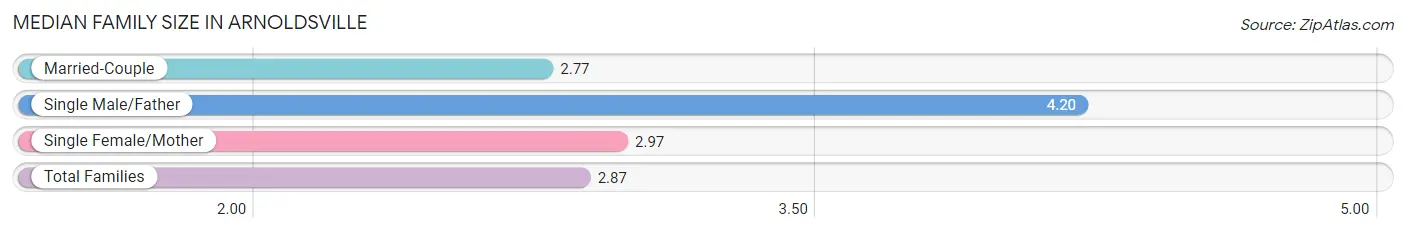
| Family Type | # Families | Family Size |
| Married-Couple | 106 (74.1%) | 2.77 |
| Single Male/Father | 5 (3.5%) | 4.20 |
| Single Female/Mother | 32 (22.4%) | 2.97 |
| Total Families | 143 (100.0%) | 2.87 |
Median Household Size in Arnoldsville
The median household size in Arnoldsville is 2.33 persons per household, with single male/father households (5 | 2.4%) accounting for the largest median household size of 4.6 persons per household. non-family households (64 | 30.9%) represent the smallest median household size with 1.05 persons per household.
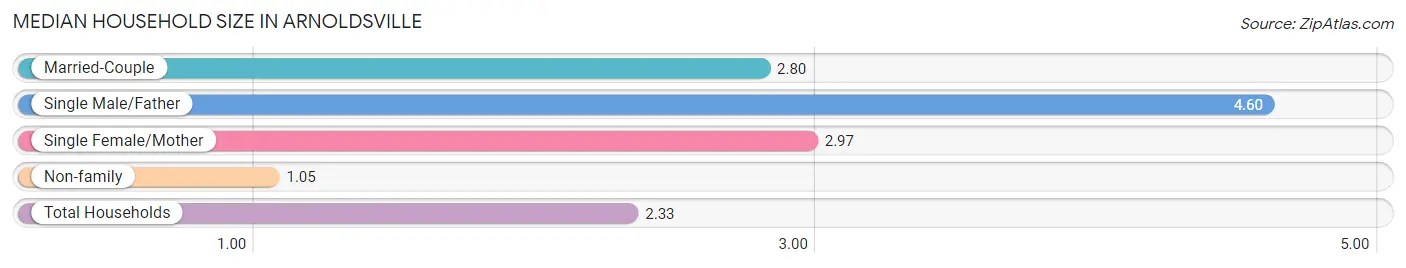
| Household Type | # Households | Household Size |
| Married-Couple | 106 (51.2%) | 2.80 |
| Single Male/Father | 5 (2.4%) | 4.60 |
| Single Female/Mother | 32 (15.5%) | 2.97 |
| Non-family | 64 (30.9%) | 1.05 |
| Total Households | 207 (100.0%) | 2.33 |
Household Size by Marriage Status in Arnoldsville
Out of a total of 207 households in Arnoldsville, 143 (69.1%) are family households, while 64 (30.9%) are nonfamily households. The most numerous type of family households are 2-person households, comprising 71, and the most common type of nonfamily households are 1-person households, comprising 56.
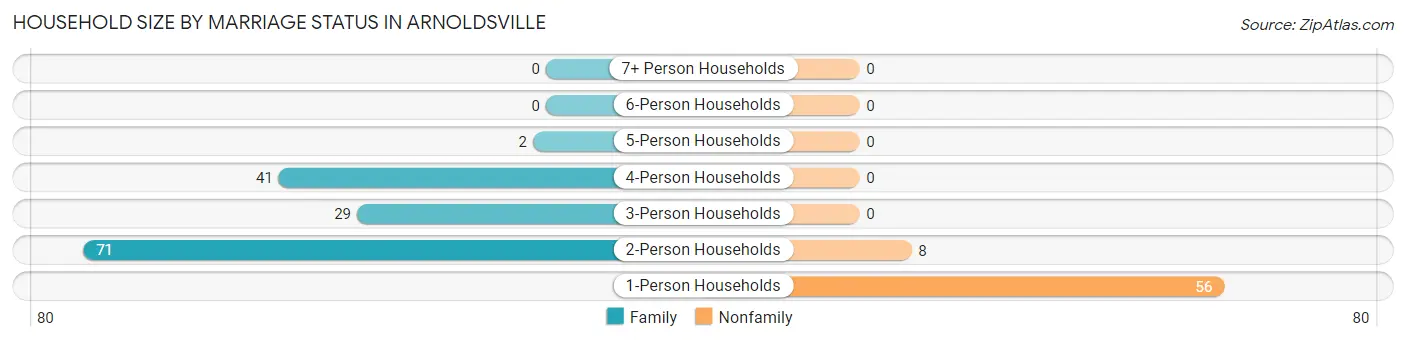
| Household Size | Family Households | Nonfamily Households |
| 1-Person Households | - | 56 (27.1%) |
| 2-Person Households | 71 (34.3%) | 8 (3.9%) |
| 3-Person Households | 29 (14.0%) | 0 (0.0%) |
| 4-Person Households | 41 (19.8%) | 0 (0.0%) |
| 5-Person Households | 2 (1.0%) | 0 (0.0%) |
| 6-Person Households | 0 (0.0%) | 0 (0.0%) |
| 7+ Person Households | 0 (0.0%) | 0 (0.0%) |
| Total | 143 (69.1%) | 64 (30.9%) |
Female Fertility in Arnoldsville
Fertility by Age in Arnoldsville
| Age Bracket | Women with Births | Births / 1,000 Women |
| 15 to 19 years | 0 (0.0%) | 0.0 |
| 20 to 34 years | 0 (0.0%) | 0.0 |
| 35 to 50 years | 0 (0.0%) | 0.0 |
| Total | 0 (0.0%) | 0.0 |
Fertility by Age by Marriage Status in Arnoldsville
| Age Bracket | Married | Unmarried |
| 15 to 19 years | 0 (0.0%) | 0 (0.0%) |
| 20 to 34 years | 0 (0.0%) | 0 (0.0%) |
| 35 to 50 years | 0 (0.0%) | 0 (0.0%) |
| Total | 0 (0.0%) | 0 (0.0%) |
Fertility by Education in Arnoldsville
| Educational Attainment | Women with Births | Births / 1,000 Women |
| Less than High School | 0 (0.0%) | 0.0 |
| High School Diploma | 0 (0.0%) | 0.0 |
| College or Associate's Degree | 0 (0.0%) | 0.0 |
| Bachelor's Degree | 0 (0.0%) | 0.0 |
| Graduate Degree | 0 (0.0%) | 0.0 |
| Total | 0 (0.0%) | 0.0 |
Fertility by Education by Marriage Status in Arnoldsville
| Educational Attainment | Married | Unmarried |
| Less than High School | 0 (0.0%) | 0 (0.0%) |
| High School Diploma | 0 (0.0%) | 0 (0.0%) |
| College or Associate's Degree | 0 (0.0%) | 0 (0.0%) |
| Bachelor's Degree | 0 (0.0%) | 0 (0.0%) |
| Graduate Degree | 0 (0.0%) | 0 (0.0%) |
| Total | 0 (0.0%) | 0 (0.0%) |
Employment Characteristics in Arnoldsville
Employment by Class of Employer in Arnoldsville
Among the 233 employed individuals in Arnoldsville, private company employees (183 | 78.5%), state government employees (17 | 7.3%), and local government employees (11 | 4.7%) make up the most common classes of employment.
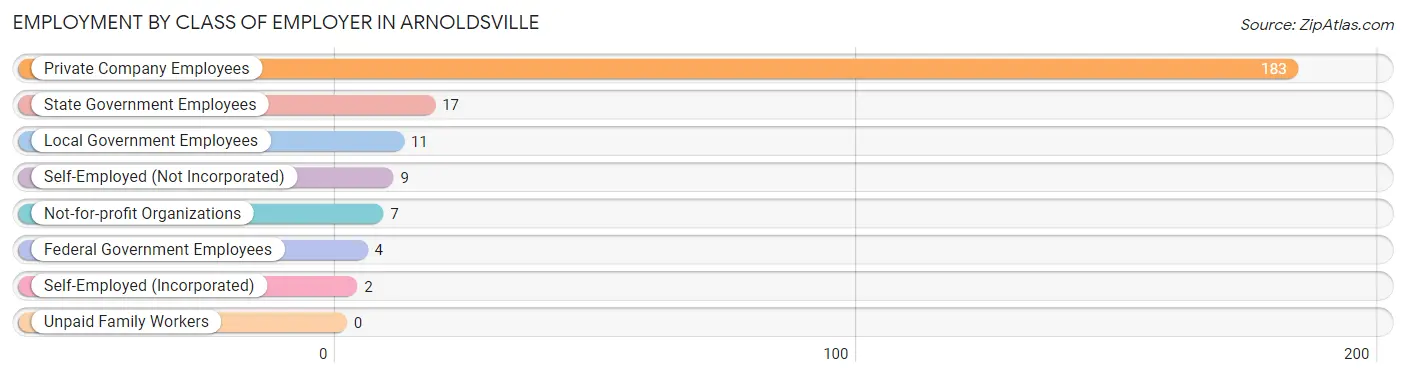
| Employer Class | # Employees | % Employees |
| Private Company Employees | 183 | 78.5% |
| Self-Employed (Incorporated) | 2 | 0.9% |
| Self-Employed (Not Incorporated) | 9 | 3.9% |
| Not-for-profit Organizations | 7 | 3.0% |
| Local Government Employees | 11 | 4.7% |
| State Government Employees | 17 | 7.3% |
| Federal Government Employees | 4 | 1.7% |
| Unpaid Family Workers | 0 | 0.0% |
| Total | 233 | 100.0% |
Employment Status by Age in Arnoldsville
According to the labor force statistics for Arnoldsville, out of the total population over 16 years of age (429), 56.9% or 244 individuals are in the labor force, with 2.0% or 5 of them unemployed. The age group with the highest labor force participation rate is 25 to 29 years, with 100.0% or 25 individuals in the labor force. Within the labor force, the 20 to 24 years age range has the highest percentage of unemployed individuals, with 11.6% or 5 of them being unemployed.
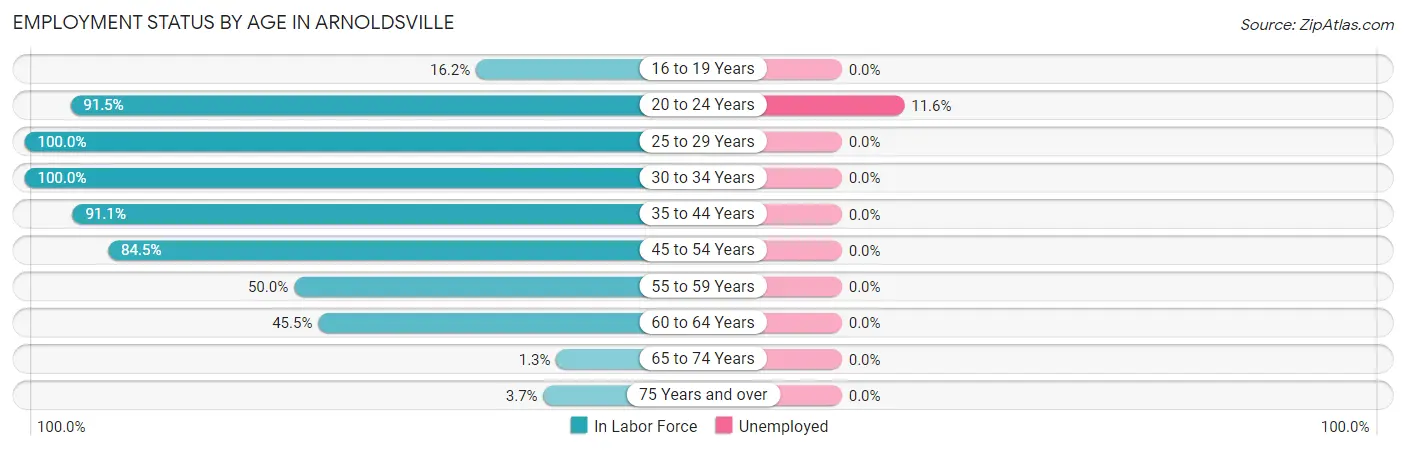
| Age Bracket | In Labor Force | Unemployed |
| 16 to 19 Years | 6 (16.2%) | 0 (0.0%) |
| 20 to 24 Years | 43 (91.5%) | 5 (11.6%) |
| 25 to 29 Years | 25 (100.0%) | 0 (0.0%) |
| 30 to 34 Years | 10 (100.0%) | 0 (0.0%) |
| 35 to 44 Years | 51 (91.1%) | 0 (0.0%) |
| 45 to 54 Years | 82 (84.5%) | 0 (0.0%) |
| 55 to 59 Years | 10 (50.0%) | 0 (0.0%) |
| 60 to 64 Years | 15 (45.5%) | 0 (0.0%) |
| 65 to 74 Years | 1 (1.3%) | 0 (0.0%) |
| 75 Years and over | 1 (3.7%) | 0 (0.0%) |
| Total | 244 (56.9%) | 5 (2.0%) |
Employment Status by Educational Attainment in Arnoldsville
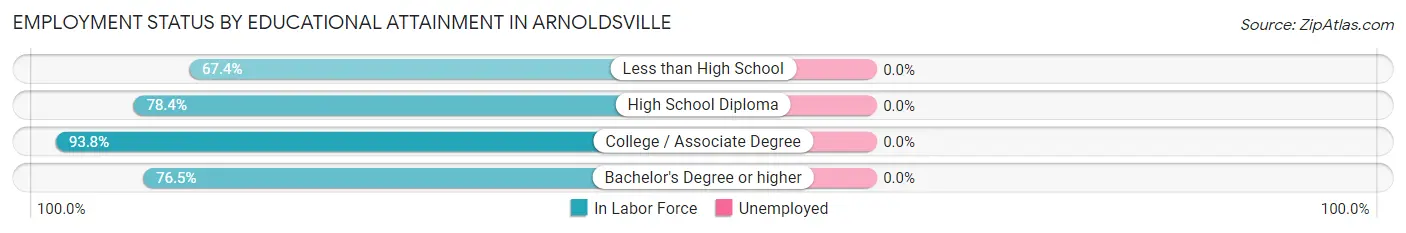
| Educational Attainment | In Labor Force | Unemployed |
| Less than High School | 31 (67.4%) | 0 (0.0%) |
| High School Diploma | 76 (78.4%) | 0 (0.0%) |
| College / Associate Degree | 60 (93.8%) | 0 (0.0%) |
| Bachelor's Degree or higher | 26 (76.5%) | 0 (0.0%) |
| Total | 193 (80.1%) | 0 (0.0%) |
Employment Occupations by Sex in Arnoldsville
Management, Business, Science and Arts Occupations
The most common Management, Business, Science and Arts occupations in Arnoldsville are Community & Social Service (17 | 7.1%), Education Instruction & Library (16 | 6.7%), Management (13 | 5.4%), Computers, Engineering & Science (7 | 2.9%), and Health Diagnosing & Treating (5 | 2.1%).
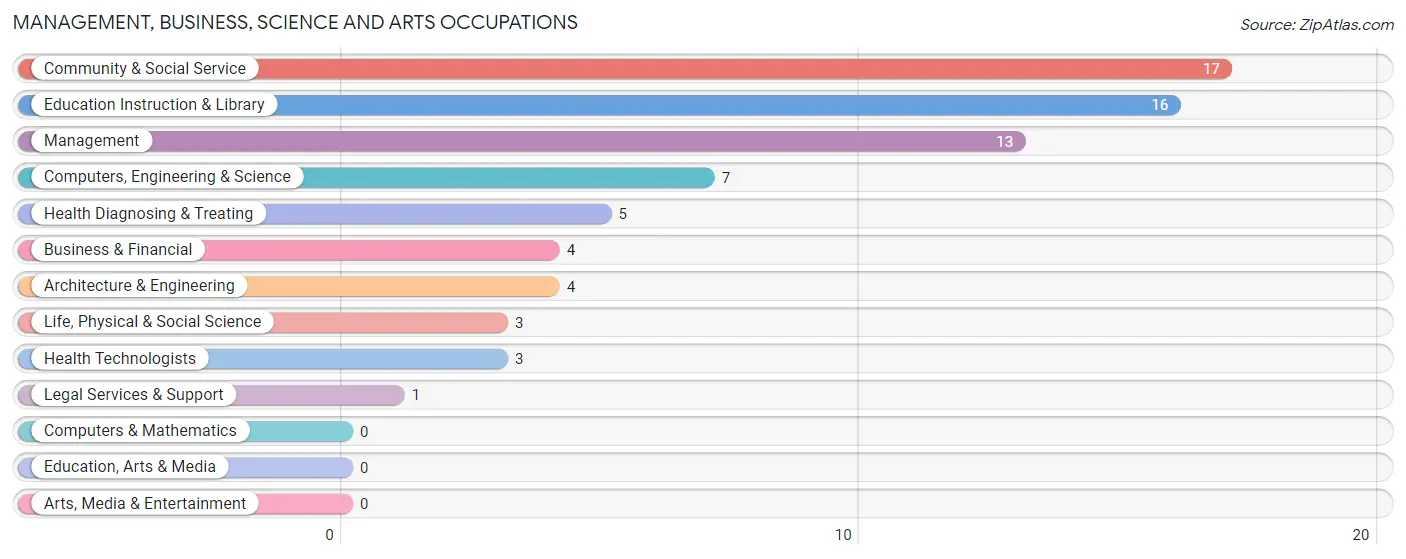
Management, Business, Science and Arts Occupations by Sex
Within the Management, Business, Science and Arts occupations in Arnoldsville, the most male-oriented occupations are Computers, Engineering & Science (100.0%), Architecture & Engineering (100.0%), and Life, Physical & Social Science (100.0%), while the most female-oriented occupations are Business & Financial (100.0%), Legal Services & Support (100.0%), and Health Diagnosing & Treating (100.0%).
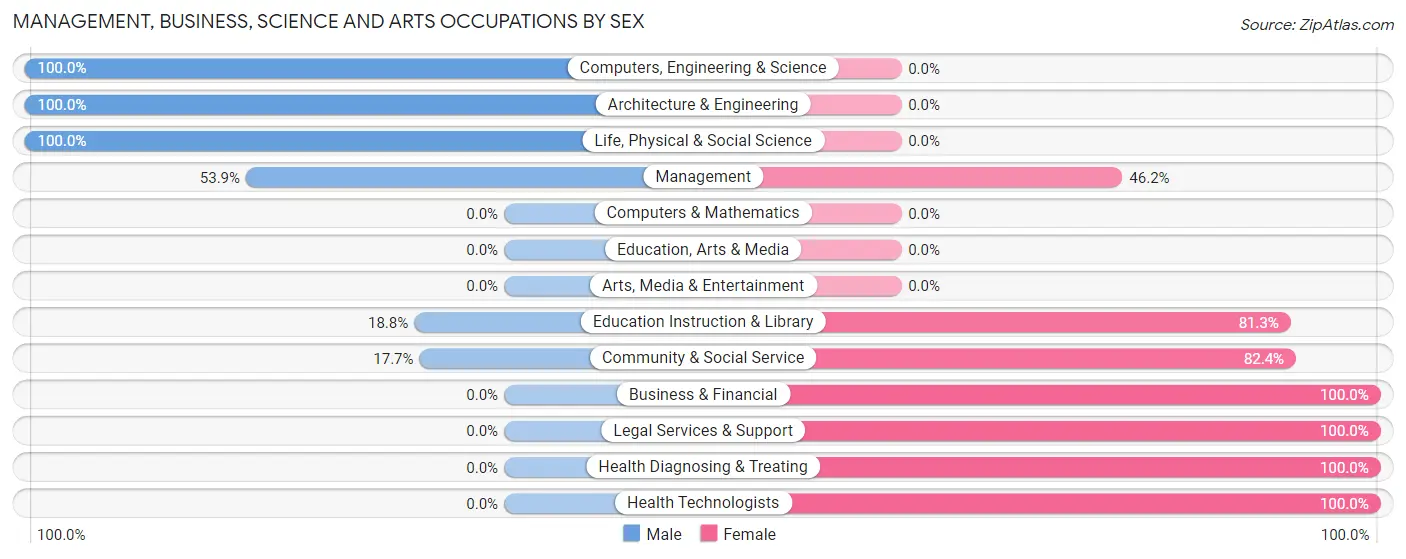
| Occupation | Male | Female |
| Management | 7 (53.8%) | 6 (46.2%) |
| Business & Financial | 0 (0.0%) | 4 (100.0%) |
| Computers, Engineering & Science | 7 (100.0%) | 0 (0.0%) |
| Computers & Mathematics | 0 (0.0%) | 0 (0.0%) |
| Architecture & Engineering | 4 (100.0%) | 0 (0.0%) |
| Life, Physical & Social Science | 3 (100.0%) | 0 (0.0%) |
| Community & Social Service | 3 (17.6%) | 14 (82.4%) |
| Education, Arts & Media | 0 (0.0%) | 0 (0.0%) |
| Legal Services & Support | 0 (0.0%) | 1 (100.0%) |
| Education Instruction & Library | 3 (18.8%) | 13 (81.2%) |
| Arts, Media & Entertainment | 0 (0.0%) | 0 (0.0%) |
| Health Diagnosing & Treating | 0 (0.0%) | 5 (100.0%) |
| Health Technologists | 0 (0.0%) | 3 (100.0%) |
| Total (Category) | 17 (37.0%) | 29 (63.0%) |
| Total (Overall) | 93 (38.9%) | 146 (61.1%) |
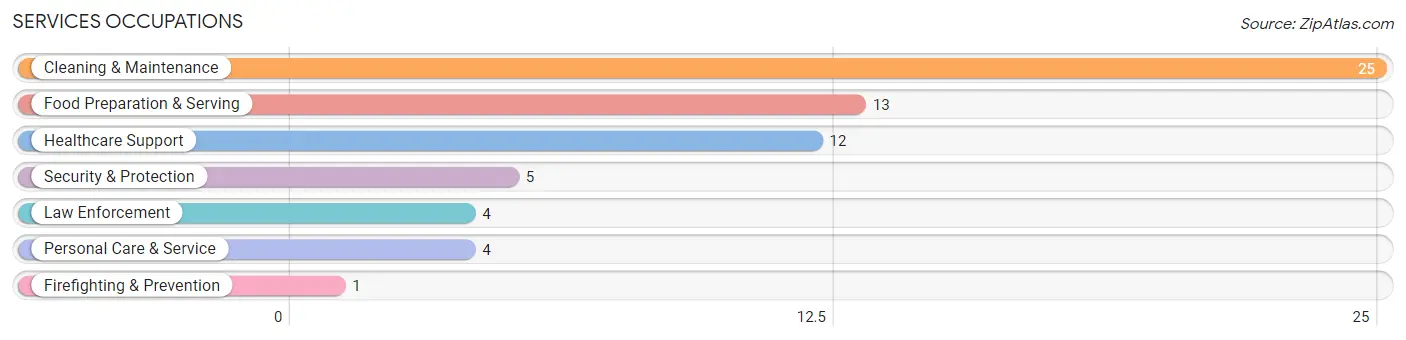
Services Occupations
The most common Services occupations in Arnoldsville are Cleaning & Maintenance (25 | 10.5%), Food Preparation & Serving (13 | 5.4%), Healthcare Support (12 | 5.0%), Security & Protection (5 | 2.1%), and Law Enforcement (4 | 1.7%).
Services Occupations by Sex
Within the Services occupations in Arnoldsville, the most male-oriented occupations are Firefighting & Prevention (100.0%), Food Preparation & Serving (100.0%), and Security & Protection (60.0%), while the most female-oriented occupations are Healthcare Support (100.0%), Personal Care & Service (100.0%), and Cleaning & Maintenance (84.0%).
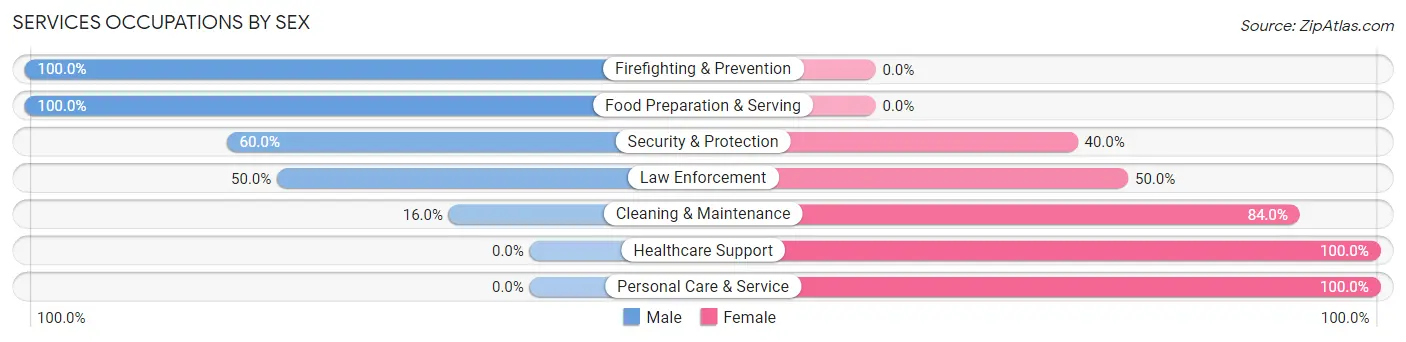
| Occupation | Male | Female |
| Healthcare Support | 0 (0.0%) | 12 (100.0%) |
| Security & Protection | 3 (60.0%) | 2 (40.0%) |
| Firefighting & Prevention | 1 (100.0%) | 0 (0.0%) |
| Law Enforcement | 2 (50.0%) | 2 (50.0%) |
| Food Preparation & Serving | 13 (100.0%) | 0 (0.0%) |
| Cleaning & Maintenance | 4 (16.0%) | 21 (84.0%) |
| Personal Care & Service | 0 (0.0%) | 4 (100.0%) |
| Total (Category) | 20 (33.9%) | 39 (66.1%) |
| Total (Overall) | 93 (38.9%) | 146 (61.1%) |
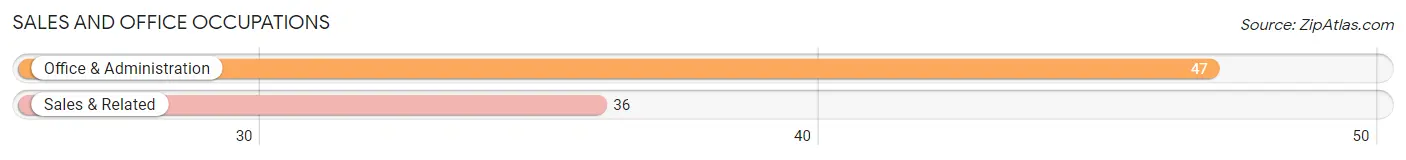
Sales and Office Occupations
The most common Sales and Office occupations in Arnoldsville are Office & Administration (47 | 19.7%), and Sales & Related (36 | 15.1%).
Sales and Office Occupations by Sex
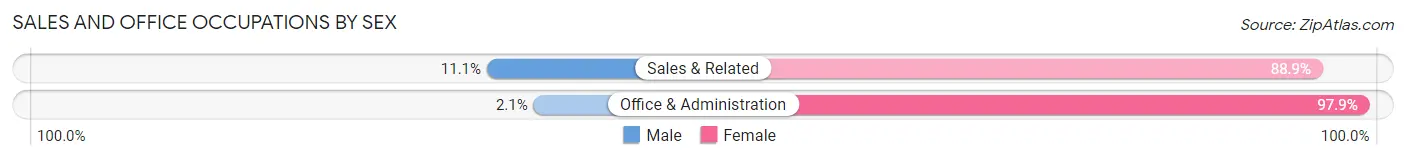
| Occupation | Male | Female |
| Sales & Related | 4 (11.1%) | 32 (88.9%) |
| Office & Administration | 1 (2.1%) | 46 (97.9%) |
| Total (Category) | 5 (6.0%) | 78 (94.0%) |
| Total (Overall) | 93 (38.9%) | 146 (61.1%) |
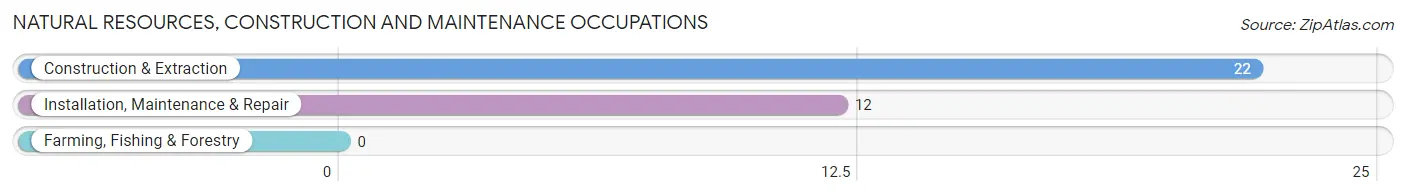
Natural Resources, Construction and Maintenance Occupations
The most common Natural Resources, Construction and Maintenance occupations in Arnoldsville are Construction & Extraction (22 | 9.2%), and Installation, Maintenance & Repair (12 | 5.0%).
Natural Resources, Construction and Maintenance Occupations by Sex
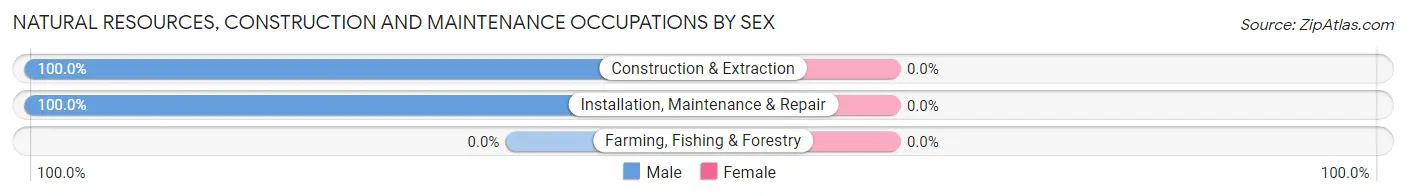
| Occupation | Male | Female |
| Farming, Fishing & Forestry | 0 (0.0%) | 0 (0.0%) |
| Construction & Extraction | 22 (100.0%) | 0 (0.0%) |
| Installation, Maintenance & Repair | 12 (100.0%) | 0 (0.0%) |
| Total (Category) | 34 (100.0%) | 0 (0.0%) |
| Total (Overall) | 93 (38.9%) | 146 (61.1%) |
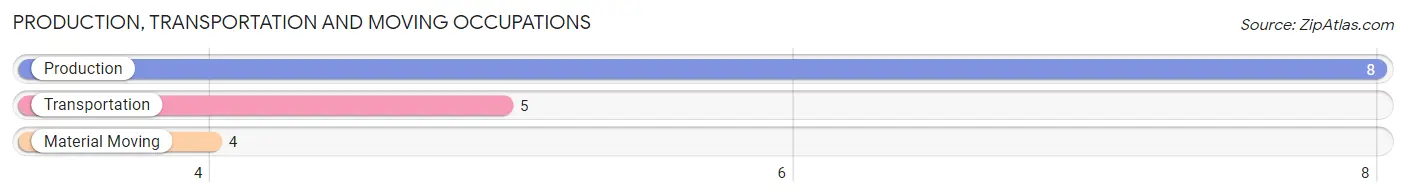
Production, Transportation and Moving Occupations
The most common Production, Transportation and Moving occupations in Arnoldsville are Production (8 | 3.4%), Transportation (5 | 2.1%), and Material Moving (4 | 1.7%).
Production, Transportation and Moving Occupations by Sex
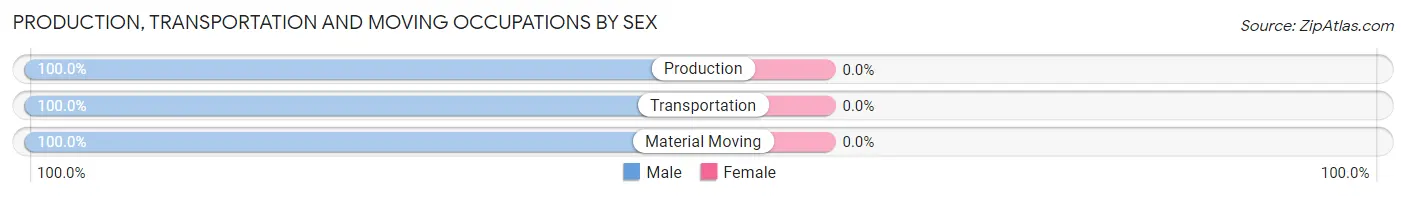
| Occupation | Male | Female |
| Production | 8 (100.0%) | 0 (0.0%) |
| Transportation | 5 (100.0%) | 0 (0.0%) |
| Material Moving | 4 (100.0%) | 0 (0.0%) |
| Total (Category) | 17 (100.0%) | 0 (0.0%) |
| Total (Overall) | 93 (38.9%) | 146 (61.1%) |
Employment Industries by Sex in Arnoldsville
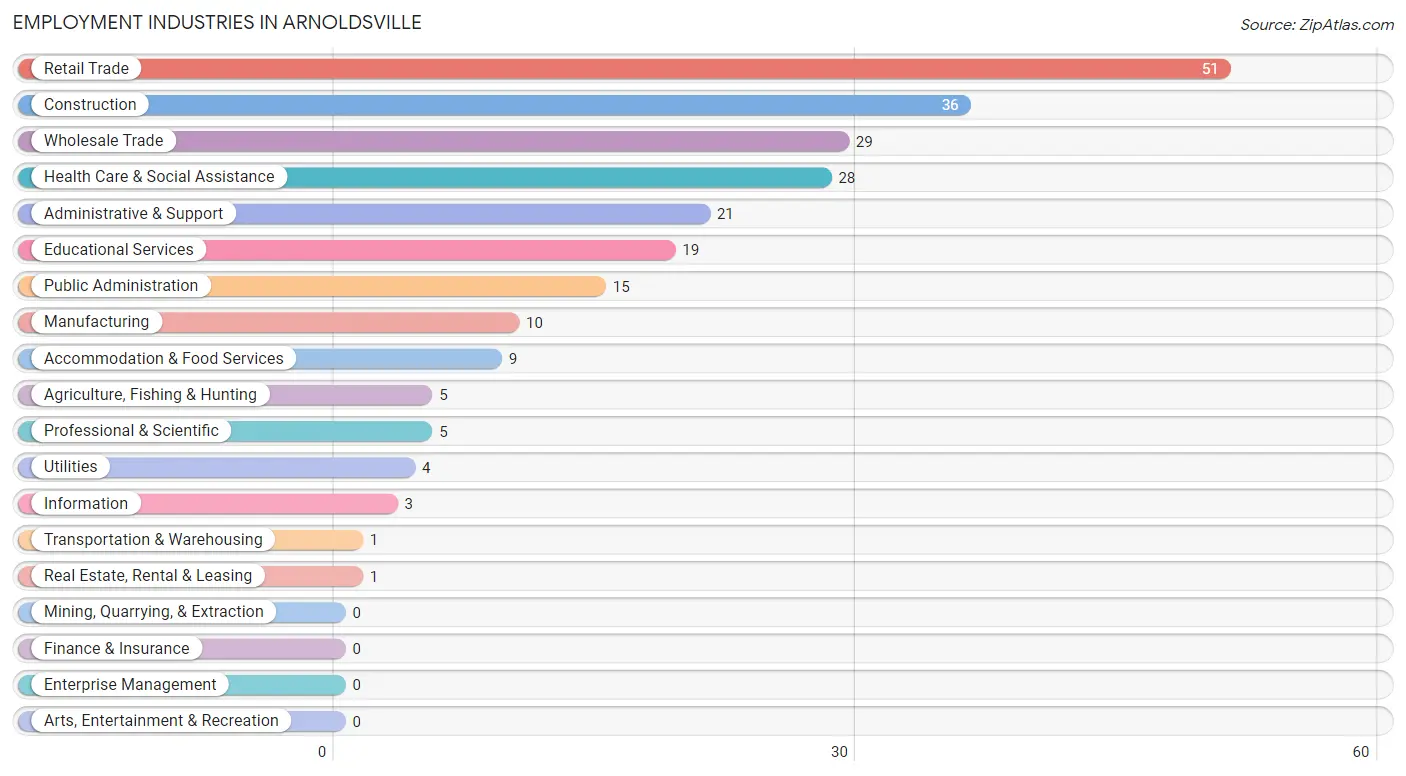
Employment Industries in Arnoldsville
The major employment industries in Arnoldsville include Retail Trade (51 | 21.3%), Construction (36 | 15.1%), Wholesale Trade (29 | 12.1%), Health Care & Social Assistance (28 | 11.7%), and Administrative & Support (21 | 8.8%).
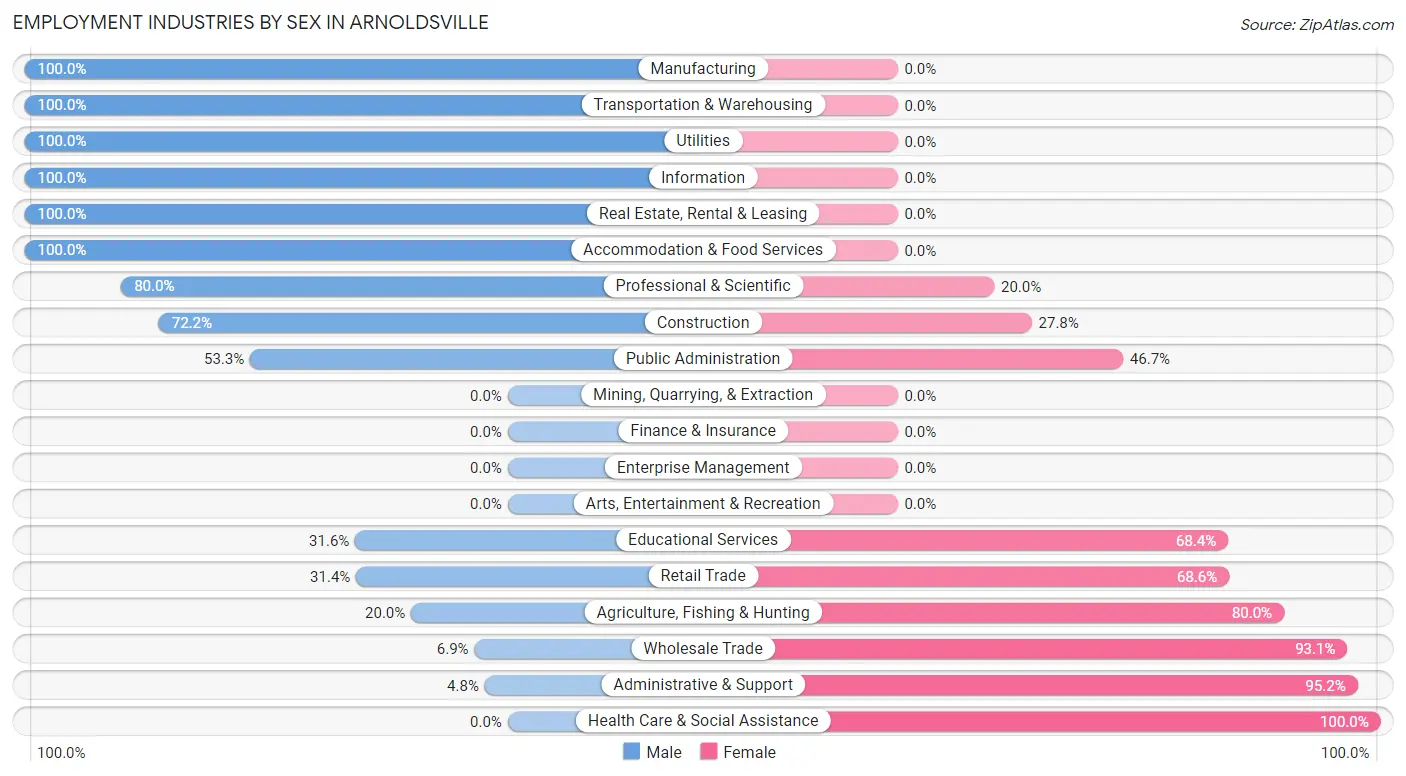
Employment Industries by Sex in Arnoldsville
The Arnoldsville industries that see more men than women are Manufacturing (100.0%), Transportation & Warehousing (100.0%), and Utilities (100.0%), whereas the industries that tend to have a higher number of women are Health Care & Social Assistance (100.0%), Administrative & Support (95.2%), and Wholesale Trade (93.1%).
| Industry | Male | Female |
| Agriculture, Fishing & Hunting | 1 (20.0%) | 4 (80.0%) |
| Mining, Quarrying, & Extraction | 0 (0.0%) | 0 (0.0%) |
| Construction | 26 (72.2%) | 10 (27.8%) |
| Manufacturing | 10 (100.0%) | 0 (0.0%) |
| Wholesale Trade | 2 (6.9%) | 27 (93.1%) |
| Retail Trade | 16 (31.4%) | 35 (68.6%) |
| Transportation & Warehousing | 1 (100.0%) | 0 (0.0%) |
| Utilities | 4 (100.0%) | 0 (0.0%) |
| Information | 3 (100.0%) | 0 (0.0%) |
| Finance & Insurance | 0 (0.0%) | 0 (0.0%) |
| Real Estate, Rental & Leasing | 1 (100.0%) | 0 (0.0%) |
| Professional & Scientific | 4 (80.0%) | 1 (20.0%) |
| Enterprise Management | 0 (0.0%) | 0 (0.0%) |
| Administrative & Support | 1 (4.8%) | 20 (95.2%) |
| Educational Services | 6 (31.6%) | 13 (68.4%) |
| Health Care & Social Assistance | 0 (0.0%) | 28 (100.0%) |
| Arts, Entertainment & Recreation | 0 (0.0%) | 0 (0.0%) |
| Accommodation & Food Services | 9 (100.0%) | 0 (0.0%) |
| Public Administration | 8 (53.3%) | 7 (46.7%) |
| Total | 93 (38.9%) | 146 (61.1%) |
Education in Arnoldsville
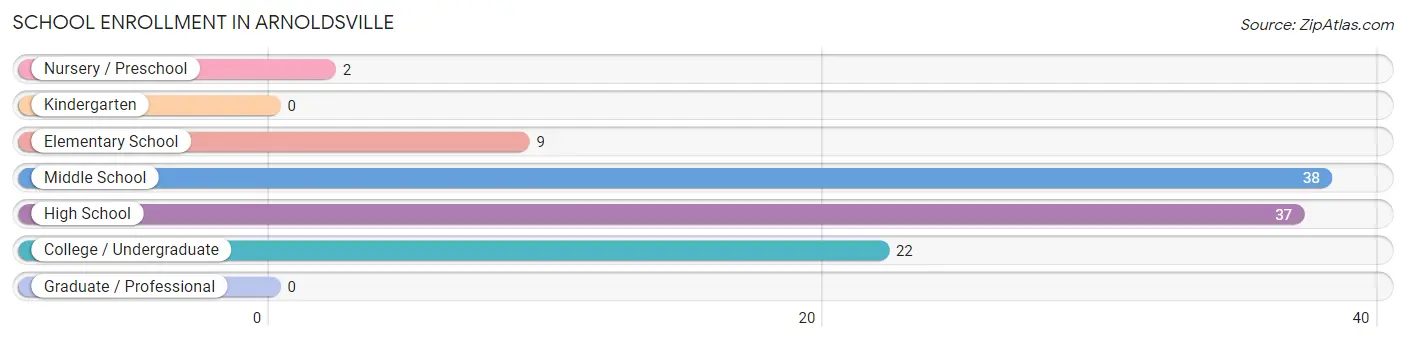
School Enrollment in Arnoldsville
The most common levels of schooling among the 108 students in Arnoldsville are middle school (38 | 35.2%), high school (37 | 34.3%), and college / undergraduate (22 | 20.4%).
| School Level | # Students | % Students |
| Nursery / Preschool | 2 | 1.8% |
| Kindergarten | 0 | 0.0% |
| Elementary School | 9 | 8.3% |
| Middle School | 38 | 35.2% |
| High School | 37 | 34.3% |
| College / Undergraduate | 22 | 20.4% |
| Graduate / Professional | 0 | 0.0% |
| Total | 108 | 100.0% |
School Enrollment by Age by Funding Source in Arnoldsville
Out of a total of 108 students who are enrolled in schools in Arnoldsville, 10 (9.3%) attend a private institution, while the remaining 98 (90.7%) are enrolled in public schools. The age group of 20 to 24 year olds has the highest likelihood of being enrolled in private schools, with 9 (75.0% in the age bracket) enrolled. Conversely, the age group of 5 to 9 year old has the lowest likelihood of being enrolled in a private school, with 9 (100.0% in the age bracket) attending a public institution.
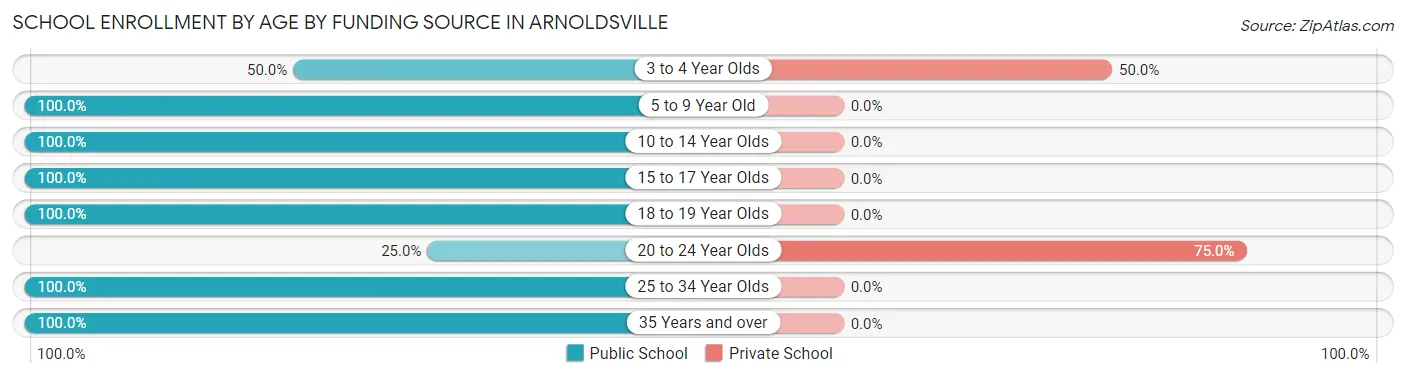
| Age Bracket | Public School | Private School |
| 3 to 4 Year Olds | 1 (50.0%) | 1 (50.0%) |
| 5 to 9 Year Old | 9 (100.0%) | 0 (0.0%) |
| 10 to 14 Year Olds | 38 (100.0%) | 0 (0.0%) |
| 15 to 17 Year Olds | 31 (100.0%) | 0 (0.0%) |
| 18 to 19 Year Olds | 10 (100.0%) | 0 (0.0%) |
| 20 to 24 Year Olds | 3 (25.0%) | 9 (75.0%) |
| 25 to 34 Year Olds | 4 (100.0%) | 0 (0.0%) |
| 35 Years and over | 2 (100.0%) | 0 (0.0%) |
| Total | 98 (90.7%) | 10 (9.3%) |
Educational Attainment by Field of Study in Arnoldsville
Bio, nature & agricultural (11 | 20.7%), education (11 | 20.7%), science & technology (9 | 17.0%), business (7 | 13.2%), and communications (4 | 7.5%) are the most common fields of study among 53 individuals in Arnoldsville who have obtained a bachelor's degree or higher.
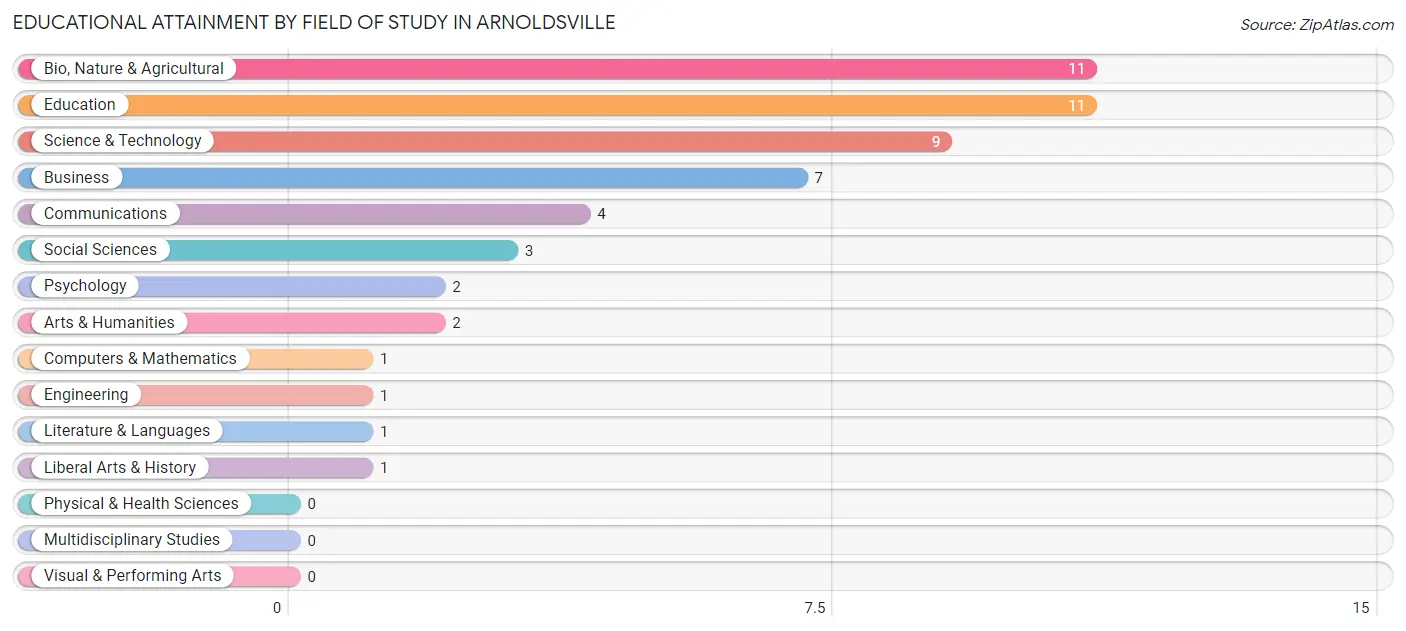
| Field of Study | # Graduates | % Graduates |
| Computers & Mathematics | 1 | 1.9% |
| Bio, Nature & Agricultural | 11 | 20.7% |
| Physical & Health Sciences | 0 | 0.0% |
| Psychology | 2 | 3.8% |
| Social Sciences | 3 | 5.7% |
| Engineering | 1 | 1.9% |
| Multidisciplinary Studies | 0 | 0.0% |
| Science & Technology | 9 | 17.0% |
| Business | 7 | 13.2% |
| Education | 11 | 20.7% |
| Literature & Languages | 1 | 1.9% |
| Liberal Arts & History | 1 | 1.9% |
| Visual & Performing Arts | 0 | 0.0% |
| Communications | 4 | 7.5% |
| Arts & Humanities | 2 | 3.8% |
| Total | 53 | 100.0% |
Transportation & Commute in Arnoldsville
Vehicle Availability by Sex in Arnoldsville
The most prevalent vehicle ownership categories in Arnoldsville are males with 3 vehicles (50, accounting for 53.8%) and females with 3 vehicles (66, making up 35.7%).
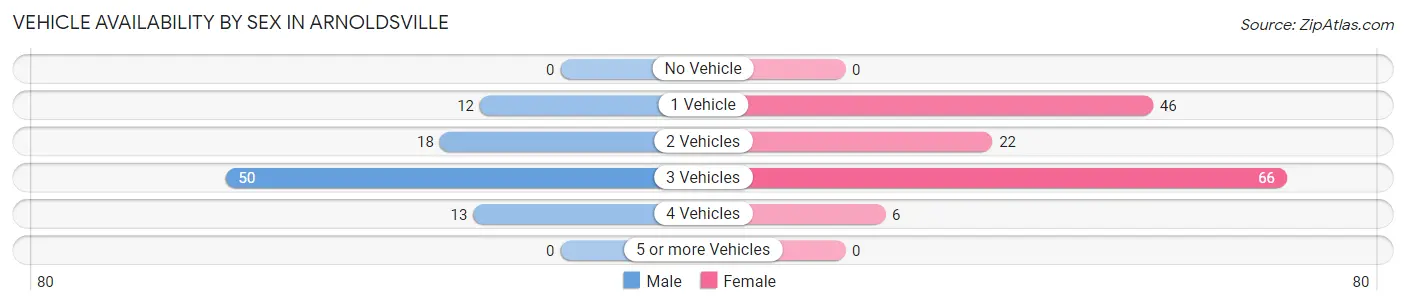
| Vehicles Available | Male | Female |
| No Vehicle | 0 (0.0%) | 0 (0.0%) |
| 1 Vehicle | 12 (12.9%) | 46 (32.9%) |
| 2 Vehicles | 18 (19.4%) | 22 (15.7%) |
| 3 Vehicles | 50 (53.8%) | 66 (47.1%) |
| 4 Vehicles | 13 (14.0%) | 6 (4.3%) |
| 5 or more Vehicles | 0 (0.0%) | 0 (0.0%) |
| Total | 93 (100.0%) | 140 (100.0%) |
Commute Time in Arnoldsville
The most frequently occuring commute durations in Arnoldsville are 30 to 34 minutes (58 commuters, 25.2%), 20 to 24 minutes (57 commuters, 24.8%), and 15 to 19 minutes (23 commuters, 10.0%).
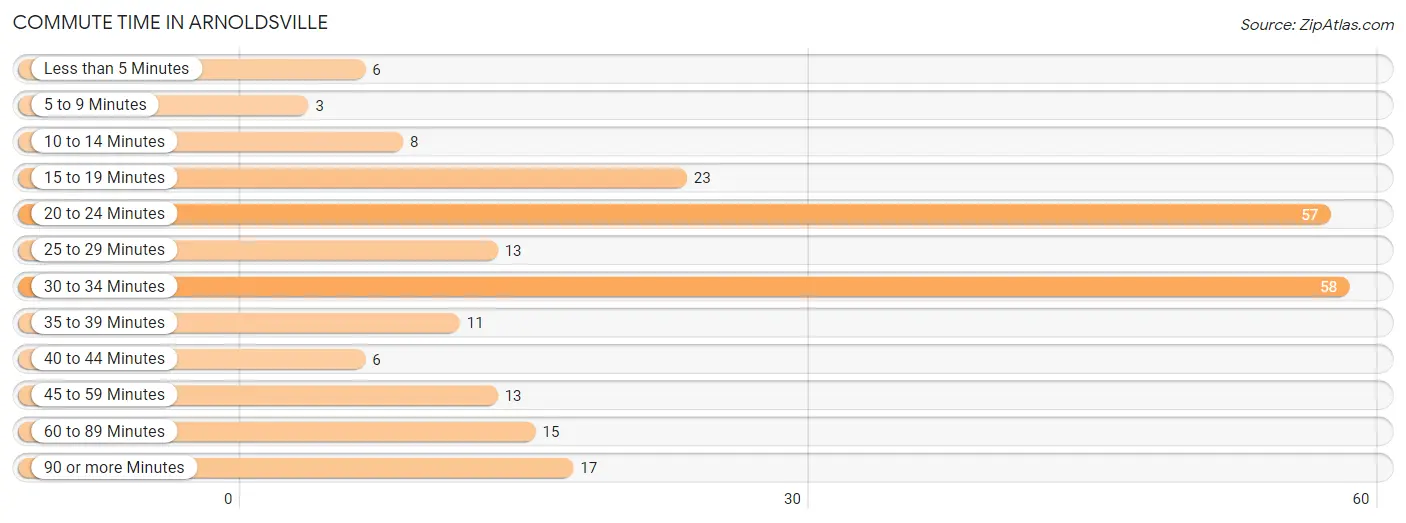
| Commute Time | # Commuters | % Commuters |
| Less than 5 Minutes | 6 | 2.6% |
| 5 to 9 Minutes | 3 | 1.3% |
| 10 to 14 Minutes | 8 | 3.5% |
| 15 to 19 Minutes | 23 | 10.0% |
| 20 to 24 Minutes | 57 | 24.8% |
| 25 to 29 Minutes | 13 | 5.7% |
| 30 to 34 Minutes | 58 | 25.2% |
| 35 to 39 Minutes | 11 | 4.8% |
| 40 to 44 Minutes | 6 | 2.6% |
| 45 to 59 Minutes | 13 | 5.7% |
| 60 to 89 Minutes | 15 | 6.5% |
| 90 or more Minutes | 17 | 7.4% |
Commute Time by Sex in Arnoldsville
The most common commute times in Arnoldsville are 20 to 24 minutes (19 commuters, 20.4%) for males and 30 to 34 minutes (41 commuters, 29.9%) for females.
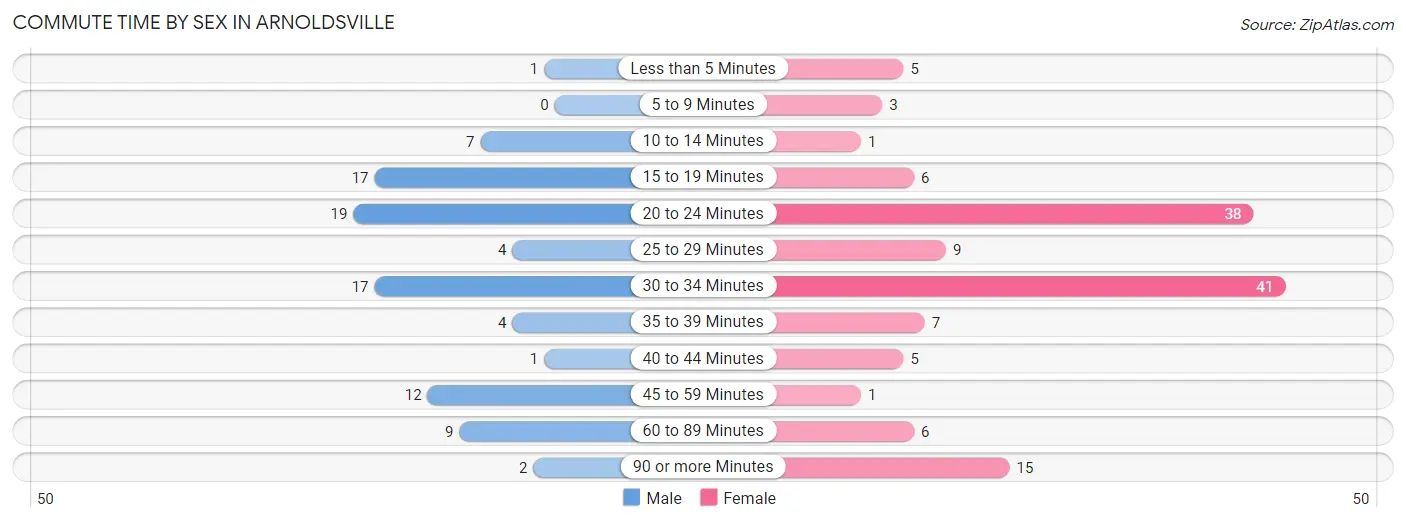
| Commute Time | Male | Female |
| Less than 5 Minutes | 1 (1.1%) | 5 (3.6%) |
| 5 to 9 Minutes | 0 (0.0%) | 3 (2.2%) |
| 10 to 14 Minutes | 7 (7.5%) | 1 (0.7%) |
| 15 to 19 Minutes | 17 (18.3%) | 6 (4.4%) |
| 20 to 24 Minutes | 19 (20.4%) | 38 (27.7%) |
| 25 to 29 Minutes | 4 (4.3%) | 9 (6.6%) |
| 30 to 34 Minutes | 17 (18.3%) | 41 (29.9%) |
| 35 to 39 Minutes | 4 (4.3%) | 7 (5.1%) |
| 40 to 44 Minutes | 1 (1.1%) | 5 (3.6%) |
| 45 to 59 Minutes | 12 (12.9%) | 1 (0.7%) |
| 60 to 89 Minutes | 9 (9.7%) | 6 (4.4%) |
| 90 or more Minutes | 2 (2.1%) | 15 (11.0%) |
Time of Departure to Work by Sex in Arnoldsville
The most frequent times of departure to work in Arnoldsville are 7:00 AM to 7:29 AM (18, 19.4%) for males and 7:00 AM to 7:29 AM (30, 21.9%) for females.
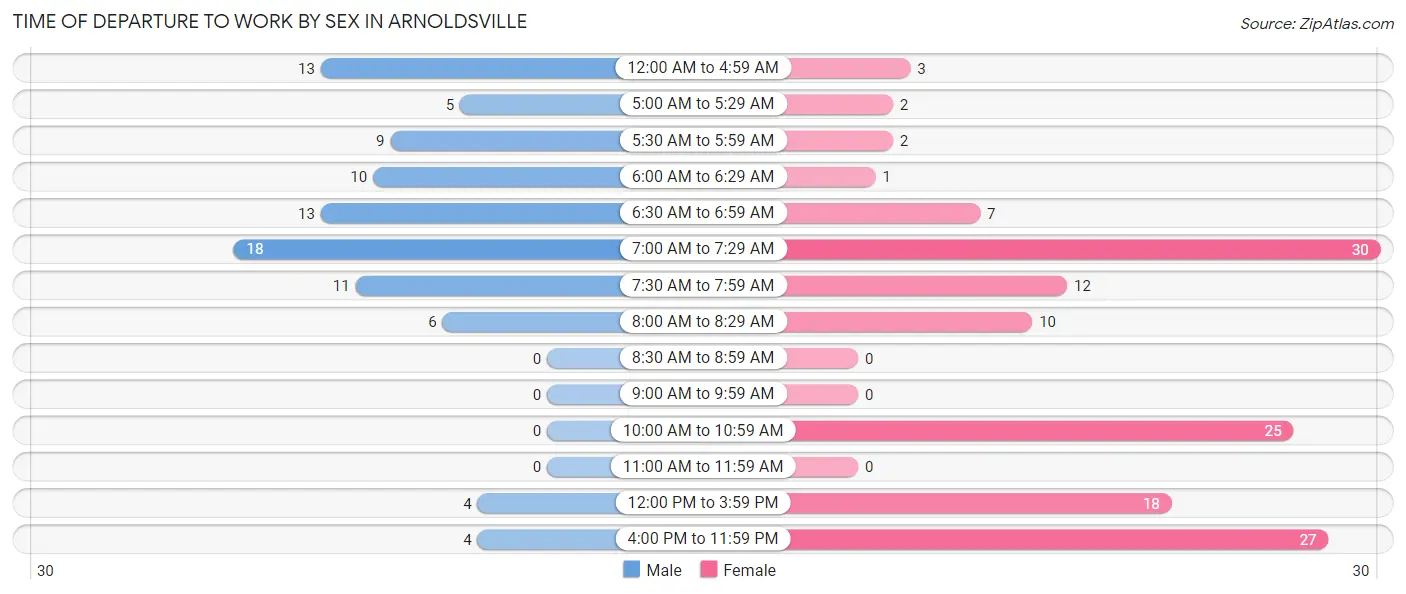
| Time of Departure | Male | Female |
| 12:00 AM to 4:59 AM | 13 (14.0%) | 3 (2.2%) |
| 5:00 AM to 5:29 AM | 5 (5.4%) | 2 (1.5%) |
| 5:30 AM to 5:59 AM | 9 (9.7%) | 2 (1.5%) |
| 6:00 AM to 6:29 AM | 10 (10.7%) | 1 (0.7%) |
| 6:30 AM to 6:59 AM | 13 (14.0%) | 7 (5.1%) |
| 7:00 AM to 7:29 AM | 18 (19.4%) | 30 (21.9%) |
| 7:30 AM to 7:59 AM | 11 (11.8%) | 12 (8.8%) |
| 8:00 AM to 8:29 AM | 6 (6.5%) | 10 (7.3%) |
| 8:30 AM to 8:59 AM | 0 (0.0%) | 0 (0.0%) |
| 9:00 AM to 9:59 AM | 0 (0.0%) | 0 (0.0%) |
| 10:00 AM to 10:59 AM | 0 (0.0%) | 25 (18.2%) |
| 11:00 AM to 11:59 AM | 0 (0.0%) | 0 (0.0%) |
| 12:00 PM to 3:59 PM | 4 (4.3%) | 18 (13.1%) |
| 4:00 PM to 11:59 PM | 4 (4.3%) | 27 (19.7%) |
| Total | 93 (100.0%) | 137 (100.0%) |
Housing Occupancy in Arnoldsville
Occupancy by Ownership in Arnoldsville
Of the total 207 dwellings in Arnoldsville, owner-occupied units account for 146 (70.5%), while renter-occupied units make up 61 (29.5%).
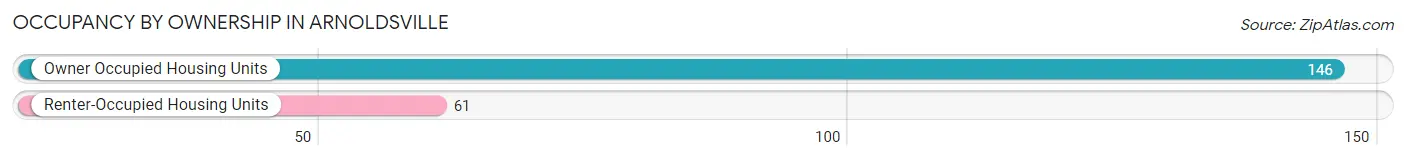
| Occupancy | # Housing Units | % Housing Units |
| Owner Occupied Housing Units | 146 | 70.5% |
| Renter-Occupied Housing Units | 61 | 29.5% |
| Total Occupied Housing Units | 207 | 100.0% |
Occupancy by Household Size in Arnoldsville
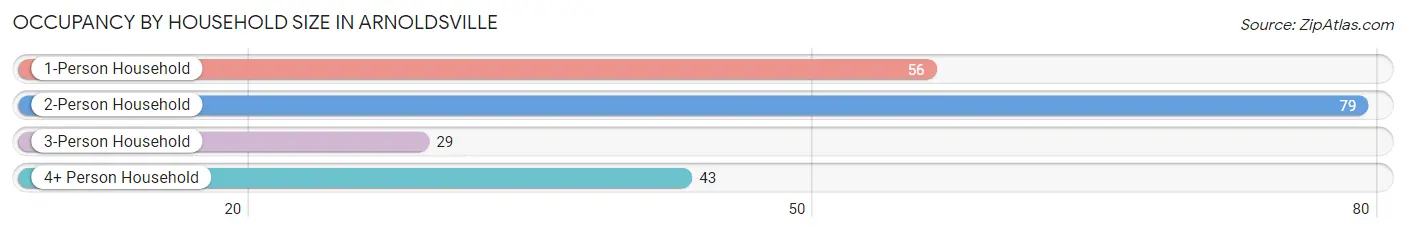
| Household Size | # Housing Units | % Housing Units |
| 1-Person Household | 56 | 27.1% |
| 2-Person Household | 79 | 38.2% |
| 3-Person Household | 29 | 14.0% |
| 4+ Person Household | 43 | 20.8% |
| Total Housing Units | 207 | 100.0% |
Occupancy by Ownership by Household Size in Arnoldsville
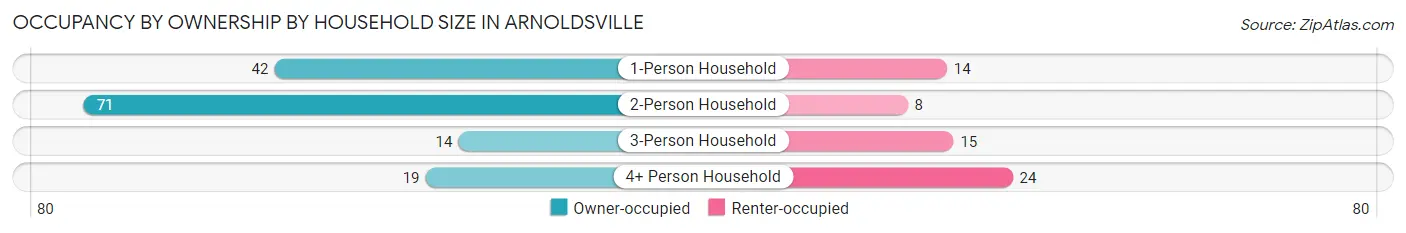
| Household Size | Owner-occupied | Renter-occupied |
| 1-Person Household | 42 (75.0%) | 14 (25.0%) |
| 2-Person Household | 71 (89.9%) | 8 (10.1%) |
| 3-Person Household | 14 (48.3%) | 15 (51.7%) |
| 4+ Person Household | 19 (44.2%) | 24 (55.8%) |
| Total Housing Units | 146 (70.5%) | 61 (29.5%) |
Occupancy by Educational Attainment in Arnoldsville
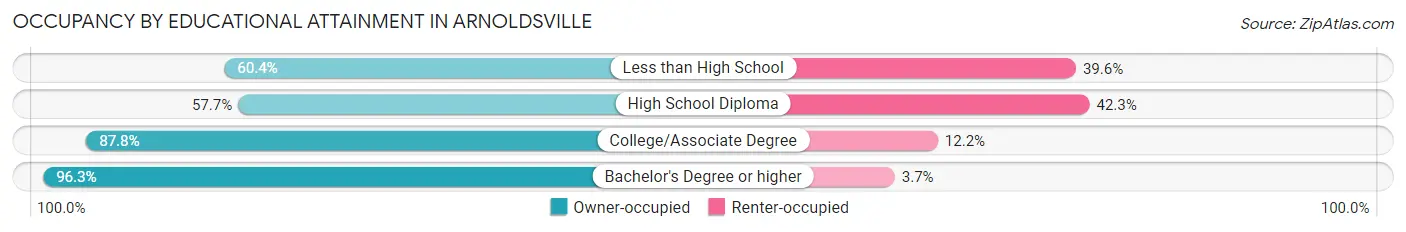
| Household Size | Owner-occupied | Renter-occupied |
| Less than High School | 32 (60.4%) | 21 (39.6%) |
| High School Diploma | 45 (57.7%) | 33 (42.3%) |
| College/Associate Degree | 43 (87.8%) | 6 (12.2%) |
| Bachelor's Degree or higher | 26 (96.3%) | 1 (3.7%) |
Occupancy by Age of Householder in Arnoldsville
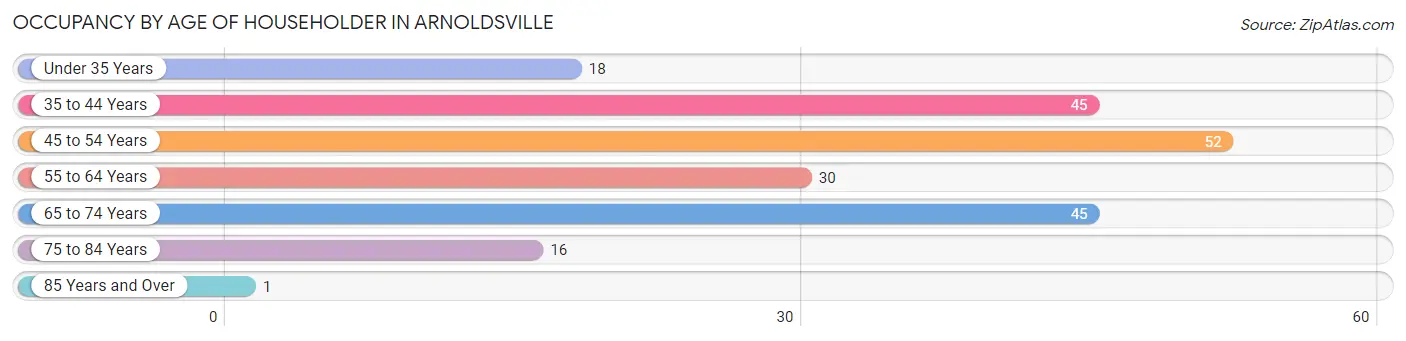
| Age Bracket | # Households | % Households |
| Under 35 Years | 18 | 8.7% |
| 35 to 44 Years | 45 | 21.7% |
| 45 to 54 Years | 52 | 25.1% |
| 55 to 64 Years | 30 | 14.5% |
| 65 to 74 Years | 45 | 21.7% |
| 75 to 84 Years | 16 | 7.7% |
| 85 Years and Over | 1 | 0.5% |
| Total | 207 | 100.0% |
Housing Finances in Arnoldsville
Median Income by Occupancy in Arnoldsville
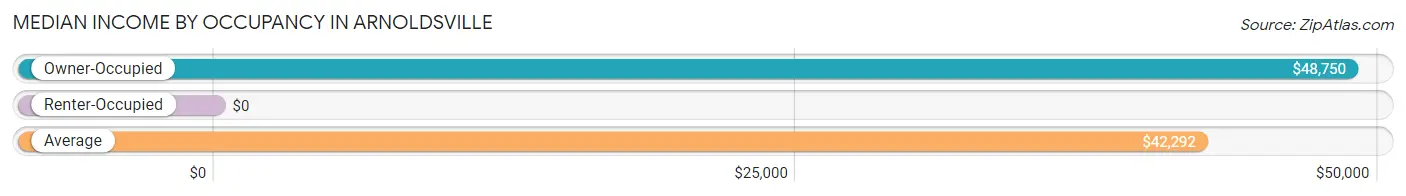
| Occupancy Type | # Households | Median Income |
| Owner-Occupied | 146 (70.5%) | $48,750 |
| Renter-Occupied | 61 (29.5%) | $0 |
| Average | 207 (100.0%) | $42,292 |
Occupancy by Householder Income Bracket in Arnoldsville
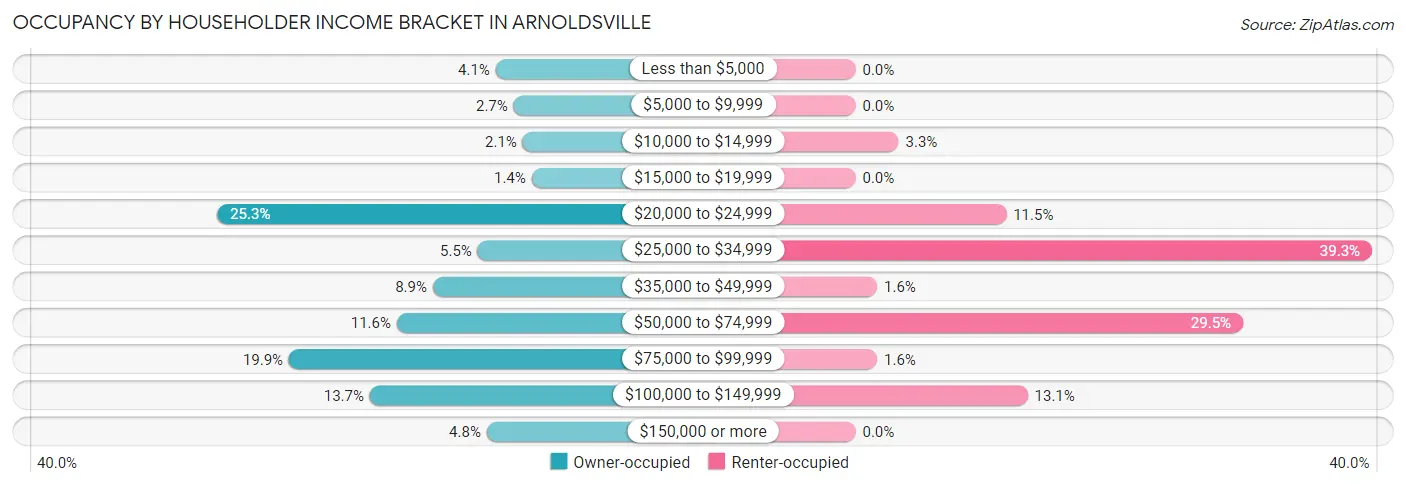
| Income Bracket | Owner-occupied | Renter-occupied |
| Less than $5,000 | 6 (4.1%) | 0 (0.0%) |
| $5,000 to $9,999 | 4 (2.7%) | 0 (0.0%) |
| $10,000 to $14,999 | 3 (2.1%) | 2 (3.3%) |
| $15,000 to $19,999 | 2 (1.4%) | 0 (0.0%) |
| $20,000 to $24,999 | 37 (25.3%) | 7 (11.5%) |
| $25,000 to $34,999 | 8 (5.5%) | 24 (39.3%) |
| $35,000 to $49,999 | 13 (8.9%) | 1 (1.6%) |
| $50,000 to $74,999 | 17 (11.6%) | 18 (29.5%) |
| $75,000 to $99,999 | 29 (19.9%) | 1 (1.6%) |
| $100,000 to $149,999 | 20 (13.7%) | 8 (13.1%) |
| $150,000 or more | 7 (4.8%) | 0 (0.0%) |
| Total | 146 (100.0%) | 61 (100.0%) |
Monthly Housing Cost Tiers in Arnoldsville
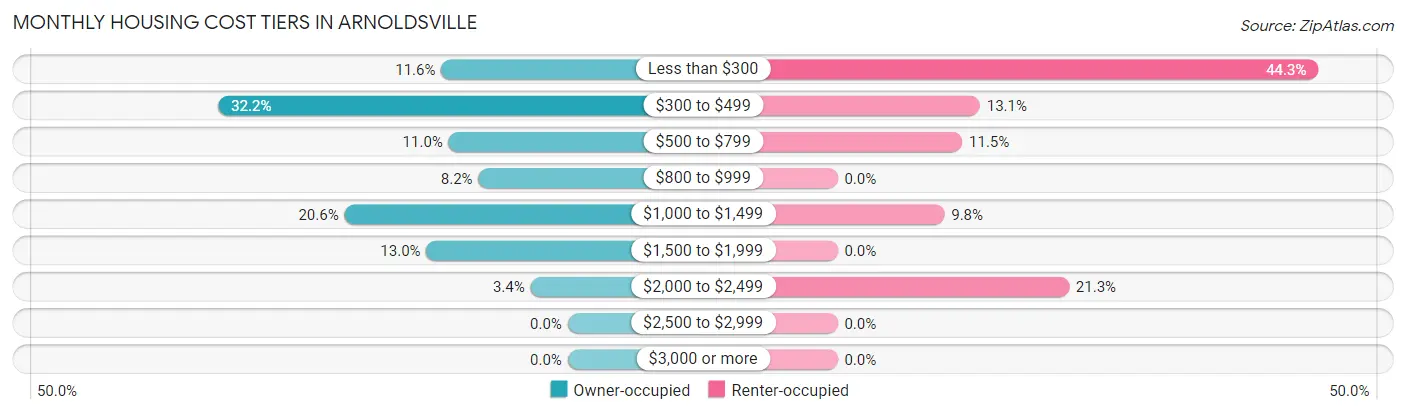
| Monthly Cost | Owner-occupied | Renter-occupied |
| Less than $300 | 17 (11.6%) | 27 (44.3%) |
| $300 to $499 | 47 (32.2%) | 8 (13.1%) |
| $500 to $799 | 16 (11.0%) | 7 (11.5%) |
| $800 to $999 | 12 (8.2%) | 0 (0.0%) |
| $1,000 to $1,499 | 30 (20.5%) | 6 (9.8%) |
| $1,500 to $1,999 | 19 (13.0%) | 0 (0.0%) |
| $2,000 to $2,499 | 5 (3.4%) | 13 (21.3%) |
| $2,500 to $2,999 | 0 (0.0%) | 0 (0.0%) |
| $3,000 or more | 0 (0.0%) | 0 (0.0%) |
| Total | 146 (100.0%) | 61 (100.0%) |
Physical Housing Characteristics in Arnoldsville
Housing Structures in Arnoldsville
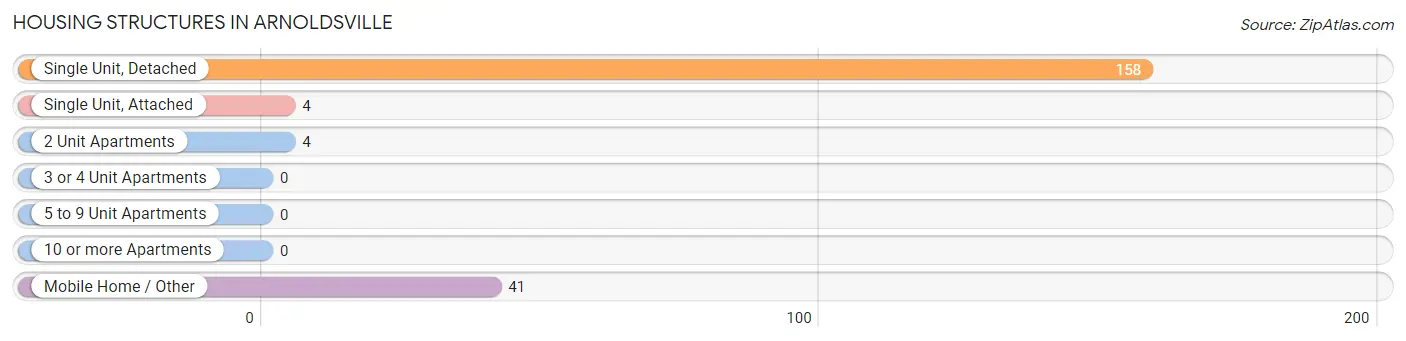
| Structure Type | # Housing Units | % Housing Units |
| Single Unit, Detached | 158 | 76.3% |
| Single Unit, Attached | 4 | 1.9% |
| 2 Unit Apartments | 4 | 1.9% |
| 3 or 4 Unit Apartments | 0 | 0.0% |
| 5 to 9 Unit Apartments | 0 | 0.0% |
| 10 or more Apartments | 0 | 0.0% |
| Mobile Home / Other | 41 | 19.8% |
| Total | 207 | 100.0% |
Housing Structures by Occupancy in Arnoldsville
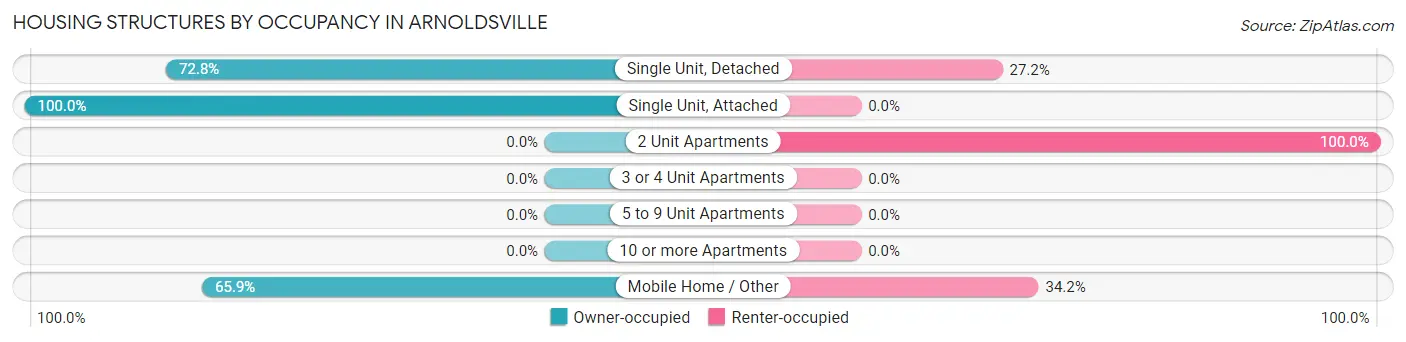
| Structure Type | Owner-occupied | Renter-occupied |
| Single Unit, Detached | 115 (72.8%) | 43 (27.2%) |
| Single Unit, Attached | 4 (100.0%) | 0 (0.0%) |
| 2 Unit Apartments | 0 (0.0%) | 4 (100.0%) |
| 3 or 4 Unit Apartments | 0 (0.0%) | 0 (0.0%) |
| 5 to 9 Unit Apartments | 0 (0.0%) | 0 (0.0%) |
| 10 or more Apartments | 0 (0.0%) | 0 (0.0%) |
| Mobile Home / Other | 27 (65.8%) | 14 (34.2%) |
| Total | 146 (70.5%) | 61 (29.5%) |
Housing Structures by Number of Rooms in Arnoldsville
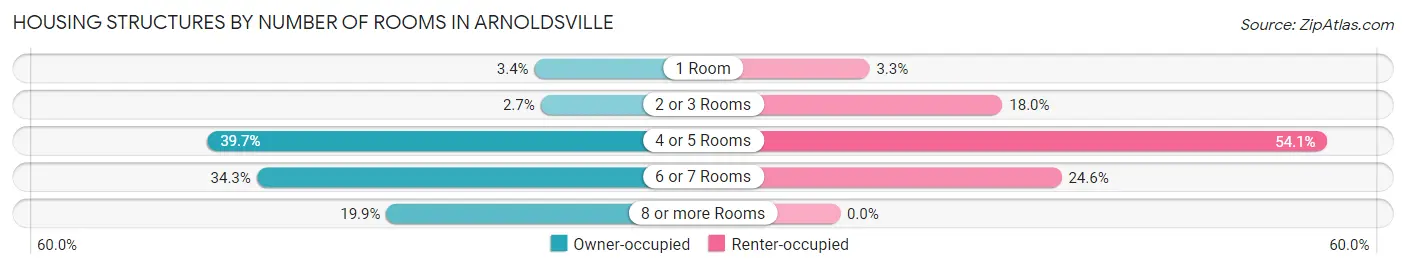
| Number of Rooms | Owner-occupied | Renter-occupied |
| 1 Room | 5 (3.4%) | 2 (3.3%) |
| 2 or 3 Rooms | 4 (2.7%) | 11 (18.0%) |
| 4 or 5 Rooms | 58 (39.7%) | 33 (54.1%) |
| 6 or 7 Rooms | 50 (34.3%) | 15 (24.6%) |
| 8 or more Rooms | 29 (19.9%) | 0 (0.0%) |
| Total | 146 (100.0%) | 61 (100.0%) |
Housing Structure by Heating Type in Arnoldsville
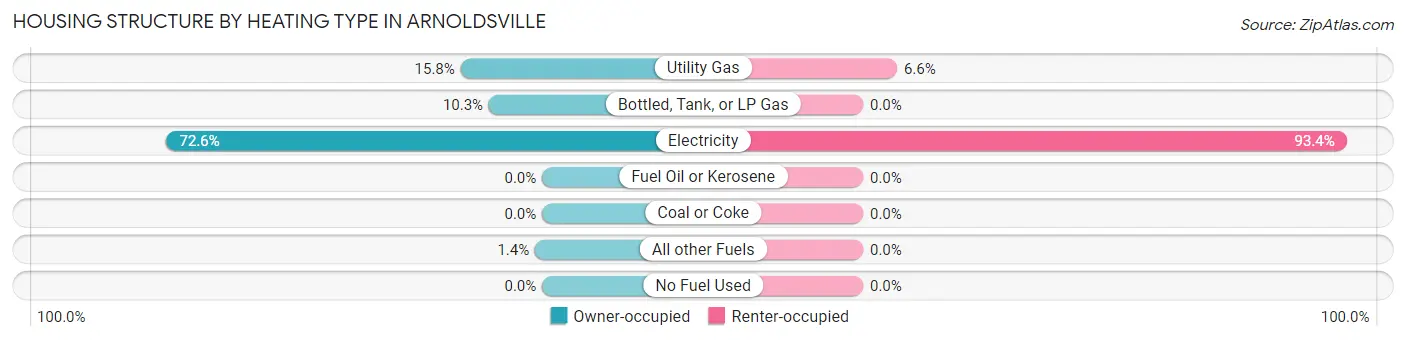
| Heating Type | Owner-occupied | Renter-occupied |
| Utility Gas | 23 (15.8%) | 4 (6.6%) |
| Bottled, Tank, or LP Gas | 15 (10.3%) | 0 (0.0%) |
| Electricity | 106 (72.6%) | 57 (93.4%) |
| Fuel Oil or Kerosene | 0 (0.0%) | 0 (0.0%) |
| Coal or Coke | 0 (0.0%) | 0 (0.0%) |
| All other Fuels | 2 (1.4%) | 0 (0.0%) |
| No Fuel Used | 0 (0.0%) | 0 (0.0%) |
| Total | 146 (100.0%) | 61 (100.0%) |
Household Vehicle Usage in Arnoldsville
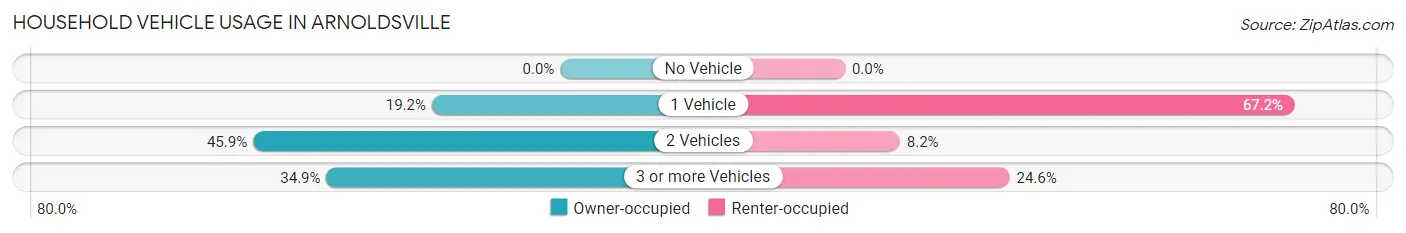
| Vehicles per Household | Owner-occupied | Renter-occupied |
| No Vehicle | 0 (0.0%) | 0 (0.0%) |
| 1 Vehicle | 28 (19.2%) | 41 (67.2%) |
| 2 Vehicles | 67 (45.9%) | 5 (8.2%) |
| 3 or more Vehicles | 51 (34.9%) | 15 (24.6%) |
| Total | 146 (100.0%) | 61 (100.0%) |
Real Estate & Mortgages in Arnoldsville
Real Estate and Mortgage Overview in Arnoldsville
| Characteristic | Without Mortgage | With Mortgage |
| Housing Units | 79 | 67 |
| Median Property Value | - | - |
| Median Household Income | $23,438 | $7 |
| Monthly Housing Costs | $426 | $0 |
| Real Estate Taxes | $721 | $0 |
Property Value by Mortgage Status in Arnoldsville
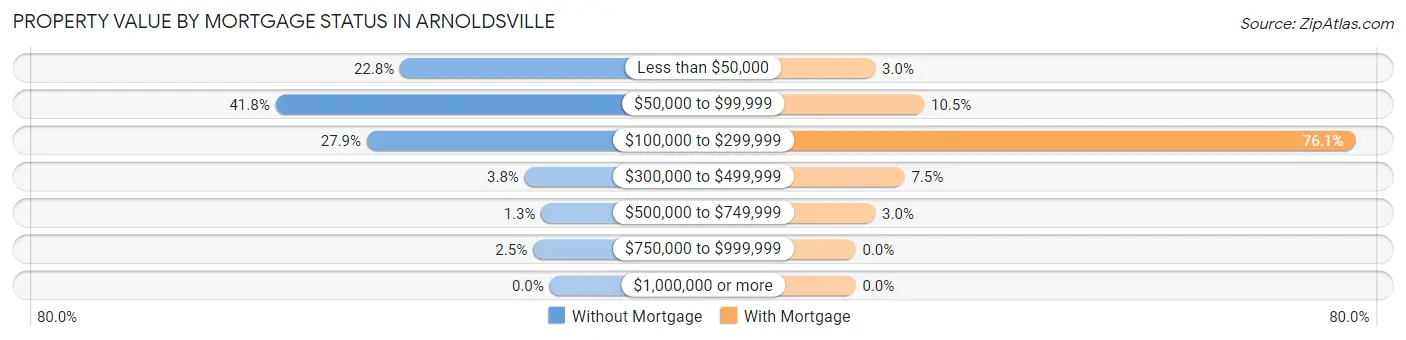
| Property Value | Without Mortgage | With Mortgage |
| Less than $50,000 | 18 (22.8%) | 2 (3.0%) |
| $50,000 to $99,999 | 33 (41.8%) | 7 (10.4%) |
| $100,000 to $299,999 | 22 (27.9%) | 51 (76.1%) |
| $300,000 to $499,999 | 3 (3.8%) | 5 (7.5%) |
| $500,000 to $749,999 | 1 (1.3%) | 2 (3.0%) |
| $750,000 to $999,999 | 2 (2.5%) | 0 (0.0%) |
| $1,000,000 or more | 0 (0.0%) | 0 (0.0%) |
| Total | 79 (100.0%) | 67 (100.0%) |
Household Income by Mortgage Status in Arnoldsville
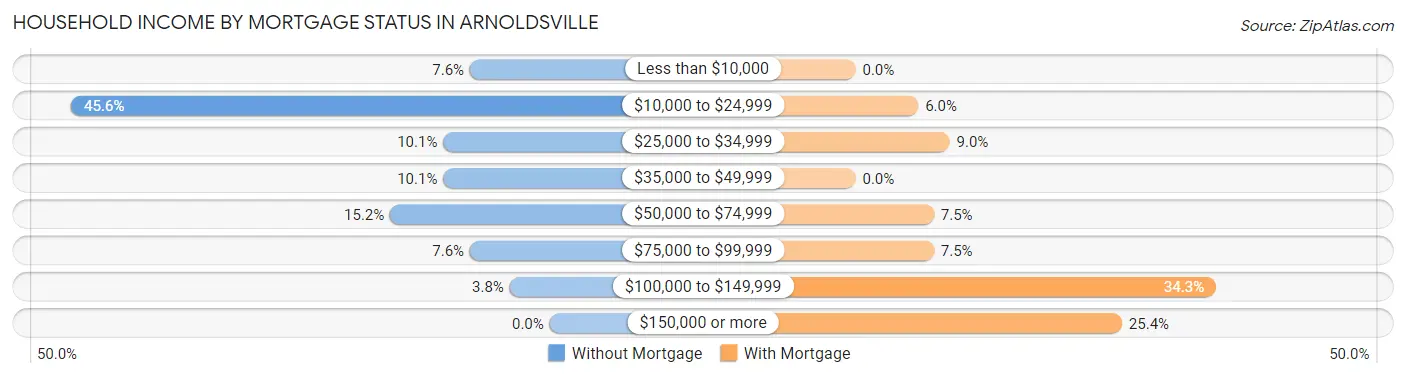
| Household Income | Without Mortgage | With Mortgage |
| Less than $10,000 | 6 (7.6%) | 0 (0.0%) |
| $10,000 to $24,999 | 36 (45.6%) | 4 (6.0%) |
| $25,000 to $34,999 | 8 (10.1%) | 6 (9.0%) |
| $35,000 to $49,999 | 8 (10.1%) | 0 (0.0%) |
| $50,000 to $74,999 | 12 (15.2%) | 5 (7.5%) |
| $75,000 to $99,999 | 6 (7.6%) | 5 (7.5%) |
| $100,000 to $149,999 | 3 (3.8%) | 23 (34.3%) |
| $150,000 or more | 0 (0.0%) | 17 (25.4%) |
| Total | 79 (100.0%) | 67 (100.0%) |
Property Value to Household Income Ratio in Arnoldsville
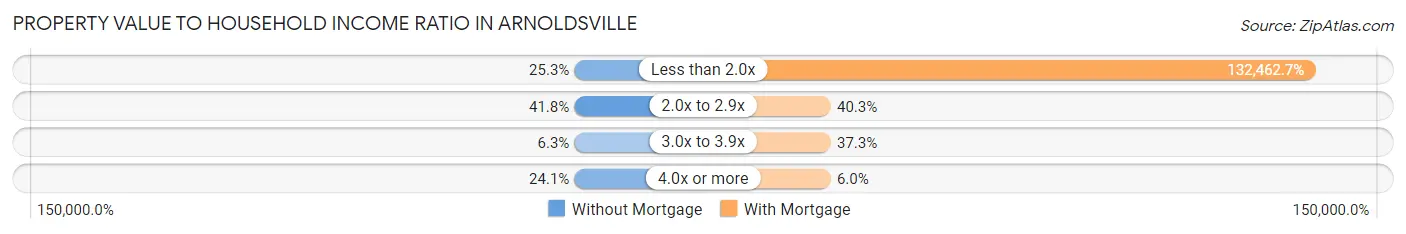
| Value-to-Income Ratio | Without Mortgage | With Mortgage |
| Less than 2.0x | 20 (25.3%) | 88,750 (132,462.7%) |
| 2.0x to 2.9x | 33 (41.8%) | 27 (40.3%) |
| 3.0x to 3.9x | 5 (6.3%) | 25 (37.3%) |
| 4.0x or more | 19 (24.0%) | 4 (6.0%) |
| Total | 79 (100.0%) | 67 (100.0%) |
Real Estate Taxes by Mortgage Status in Arnoldsville
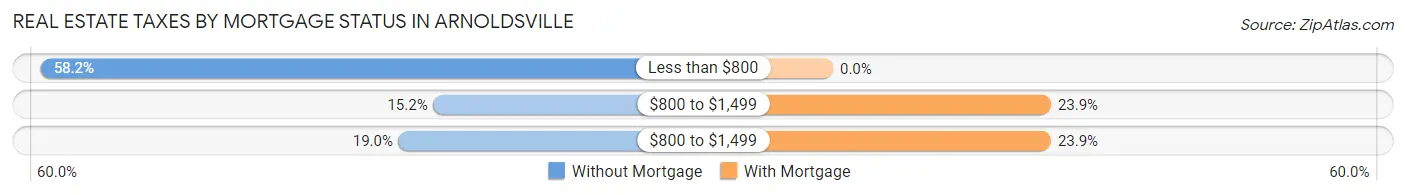
| Property Taxes | Without Mortgage | With Mortgage |
| Less than $800 | 46 (58.2%) | 0 (0.0%) |
| $800 to $1,499 | 12 (15.2%) | 16 (23.9%) |
| $800 to $1,499 | 15 (19.0%) | 16 (23.9%) |
| Total | 79 (100.0%) | 67 (100.0%) |
Health & Disability in Arnoldsville
Health Insurance Coverage by Age in Arnoldsville
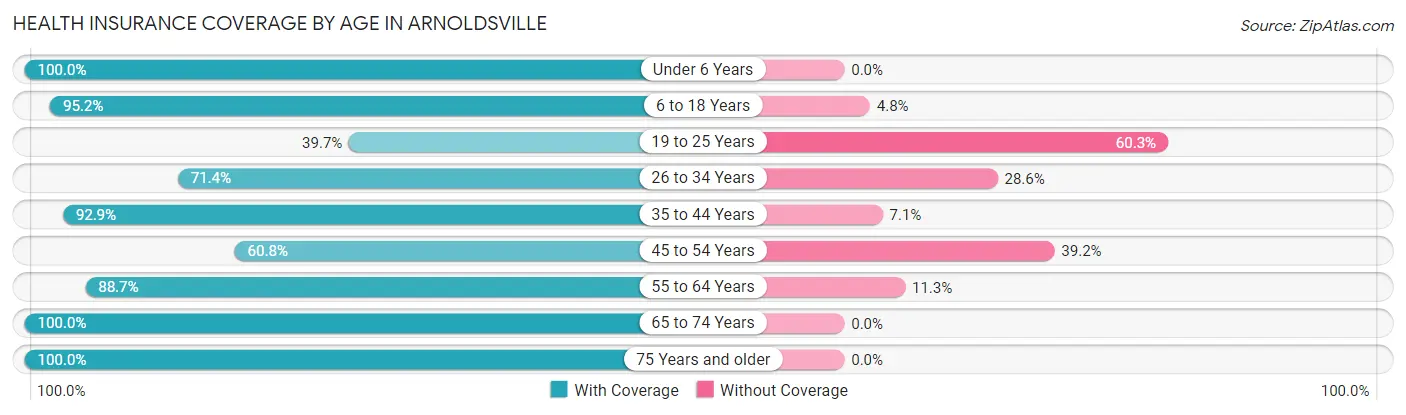
| Age Bracket | With Coverage | Without Coverage |
| Under 6 Years | 6 (100.0%) | 0 (0.0%) |
| 6 to 18 Years | 80 (95.2%) | 4 (4.8%) |
| 19 to 25 Years | 23 (39.7%) | 35 (60.3%) |
| 26 to 34 Years | 20 (71.4%) | 8 (28.6%) |
| 35 to 44 Years | 52 (92.9%) | 4 (7.1%) |
| 45 to 54 Years | 59 (60.8%) | 38 (39.2%) |
| 55 to 64 Years | 47 (88.7%) | 6 (11.3%) |
| 65 to 74 Years | 77 (100.0%) | 0 (0.0%) |
| 75 Years and older | 23 (100.0%) | 0 (0.0%) |
| Total | 387 (80.3%) | 95 (19.7%) |
Health Insurance Coverage by Citizenship Status in Arnoldsville
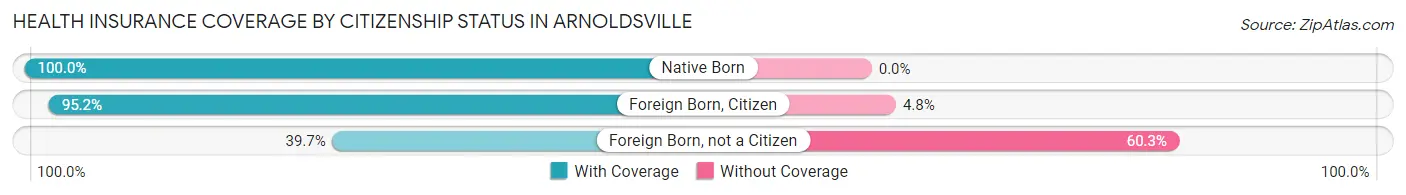
| Citizenship Status | With Coverage | Without Coverage |
| Native Born | 6 (100.0%) | 0 (0.0%) |
| Foreign Born, Citizen | 80 (95.2%) | 4 (4.8%) |
| Foreign Born, not a Citizen | 23 (39.7%) | 35 (60.3%) |
Health Insurance Coverage by Household Income in Arnoldsville
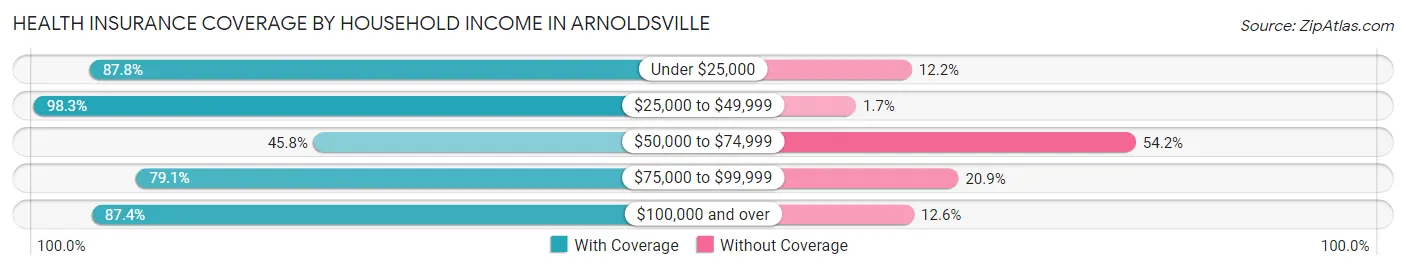
| Household Income | With Coverage | Without Coverage |
| Under $25,000 | 72 (87.8%) | 10 (12.2%) |
| $25,000 to $49,999 | 113 (98.3%) | 2 (1.7%) |
| $50,000 to $74,999 | 44 (45.8%) | 52 (54.2%) |
| $75,000 to $99,999 | 68 (79.1%) | 18 (20.9%) |
| $100,000 and over | 90 (87.4%) | 13 (12.6%) |
Public vs Private Health Insurance Coverage by Age in Arnoldsville
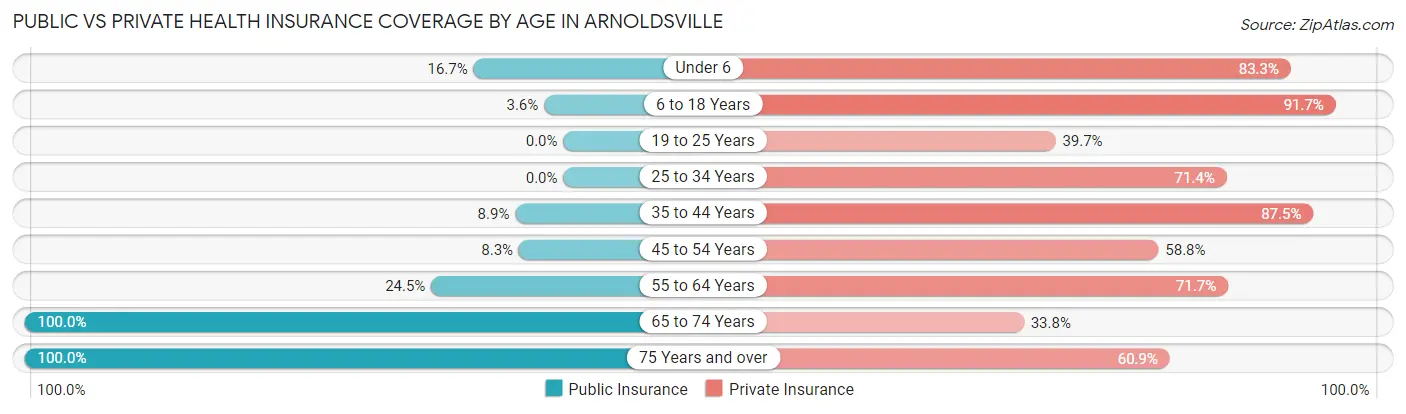
| Age Bracket | Public Insurance | Private Insurance |
| Under 6 | 1 (16.7%) | 5 (83.3%) |
| 6 to 18 Years | 3 (3.6%) | 77 (91.7%) |
| 19 to 25 Years | 0 (0.0%) | 23 (39.7%) |
| 25 to 34 Years | 0 (0.0%) | 20 (71.4%) |
| 35 to 44 Years | 5 (8.9%) | 49 (87.5%) |
| 45 to 54 Years | 8 (8.3%) | 57 (58.8%) |
| 55 to 64 Years | 13 (24.5%) | 38 (71.7%) |
| 65 to 74 Years | 77 (100.0%) | 26 (33.8%) |
| 75 Years and over | 23 (100.0%) | 14 (60.9%) |
| Total | 130 (27.0%) | 309 (64.1%) |
Disability Status by Sex by Age in Arnoldsville
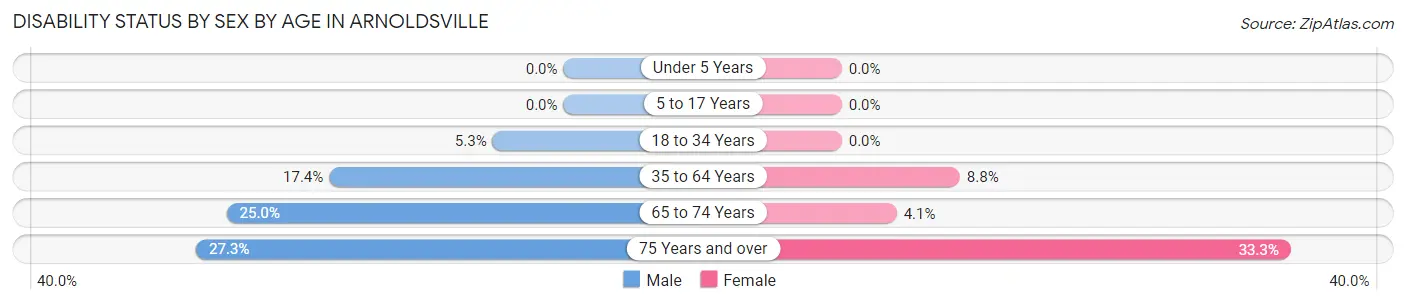
| Age Bracket | Male | Female |
| Under 5 Years | 0 (0.0%) | 0 (0.0%) |
| 5 to 17 Years | 0 (0.0%) | 0 (0.0%) |
| 18 to 34 Years | 2 (5.3%) | 0 (0.0%) |
| 35 to 64 Years | 16 (17.4%) | 10 (8.8%) |
| 65 to 74 Years | 7 (25.0%) | 2 (4.1%) |
| 75 Years and over | 3 (27.3%) | 4 (33.3%) |
Disability Class by Sex by Age in Arnoldsville
Disability Class: Hearing Difficulty
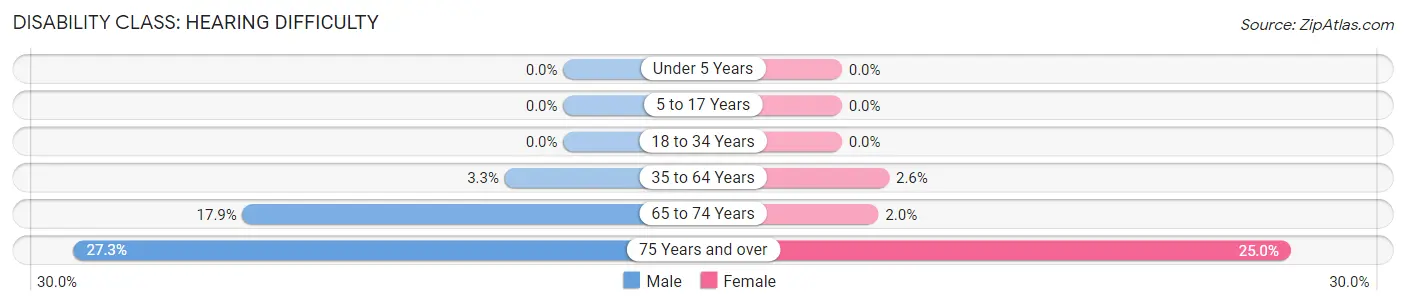
| Age Bracket | Male | Female |
| Under 5 Years | 0 (0.0%) | 0 (0.0%) |
| 5 to 17 Years | 0 (0.0%) | 0 (0.0%) |
| 18 to 34 Years | 0 (0.0%) | 0 (0.0%) |
| 35 to 64 Years | 3 (3.3%) | 3 (2.6%) |
| 65 to 74 Years | 5 (17.9%) | 1 (2.0%) |
| 75 Years and over | 3 (27.3%) | 3 (25.0%) |
Disability Class: Vision Difficulty
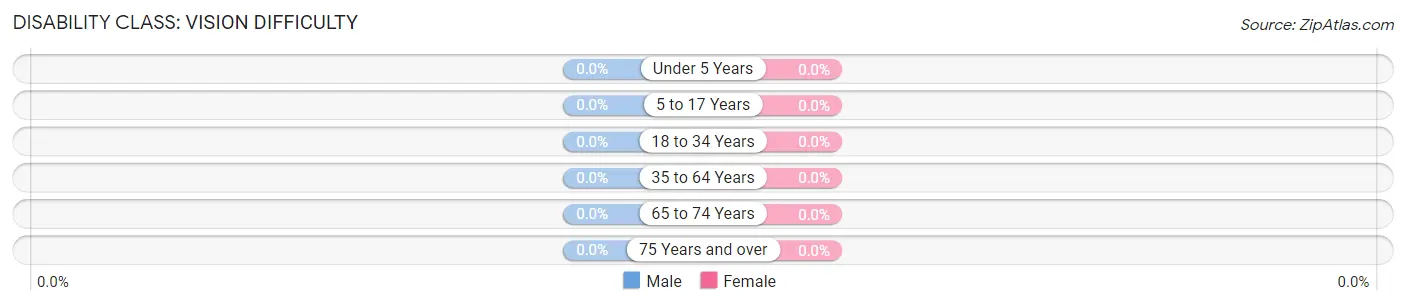
| Age Bracket | Male | Female |
| Under 5 Years | 0 (0.0%) | 0 (0.0%) |
| 5 to 17 Years | 0 (0.0%) | 0 (0.0%) |
| 18 to 34 Years | 0 (0.0%) | 0 (0.0%) |
| 35 to 64 Years | 0 (0.0%) | 0 (0.0%) |
| 65 to 74 Years | 0 (0.0%) | 0 (0.0%) |
| 75 Years and over | 0 (0.0%) | 0 (0.0%) |
Disability Class: Cognitive Difficulty
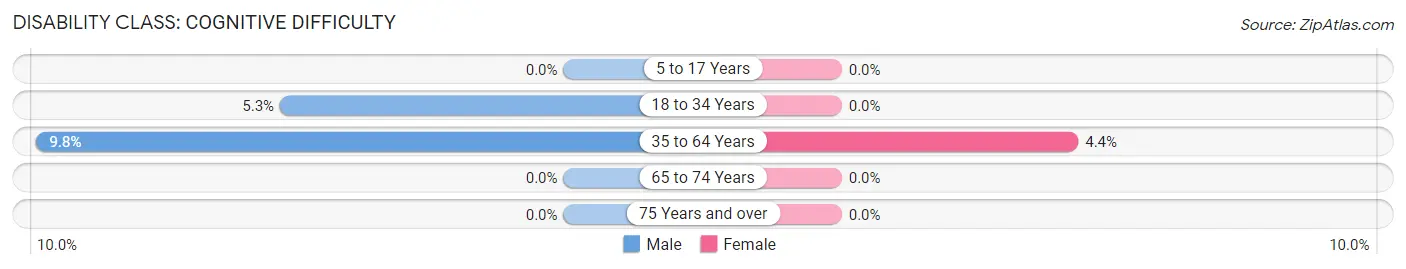
| Age Bracket | Male | Female |
| 5 to 17 Years | 0 (0.0%) | 0 (0.0%) |
| 18 to 34 Years | 2 (5.3%) | 0 (0.0%) |
| 35 to 64 Years | 9 (9.8%) | 5 (4.4%) |
| 65 to 74 Years | 0 (0.0%) | 0 (0.0%) |
| 75 Years and over | 0 (0.0%) | 0 (0.0%) |
Disability Class: Ambulatory Difficulty
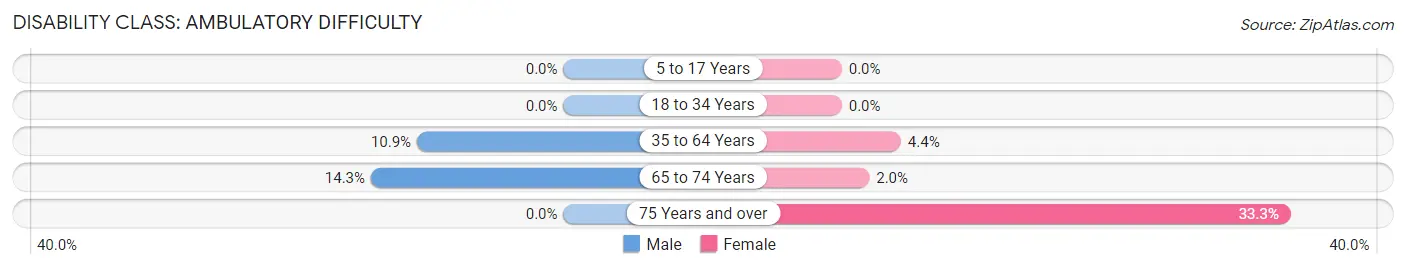
| Age Bracket | Male | Female |
| 5 to 17 Years | 0 (0.0%) | 0 (0.0%) |
| 18 to 34 Years | 0 (0.0%) | 0 (0.0%) |
| 35 to 64 Years | 10 (10.9%) | 5 (4.4%) |
| 65 to 74 Years | 4 (14.3%) | 1 (2.0%) |
| 75 Years and over | 0 (0.0%) | 4 (33.3%) |
Disability Class: Self-Care Difficulty
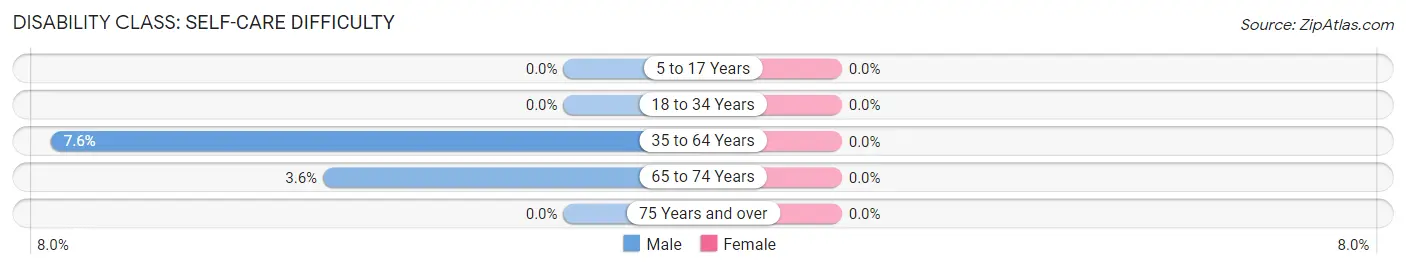
| Age Bracket | Male | Female |
| 5 to 17 Years | 0 (0.0%) | 0 (0.0%) |
| 18 to 34 Years | 0 (0.0%) | 0 (0.0%) |
| 35 to 64 Years | 7 (7.6%) | 0 (0.0%) |
| 65 to 74 Years | 1 (3.6%) | 0 (0.0%) |
| 75 Years and over | 0 (0.0%) | 0 (0.0%) |
Technology Access in Arnoldsville
Computing Device Access in Arnoldsville
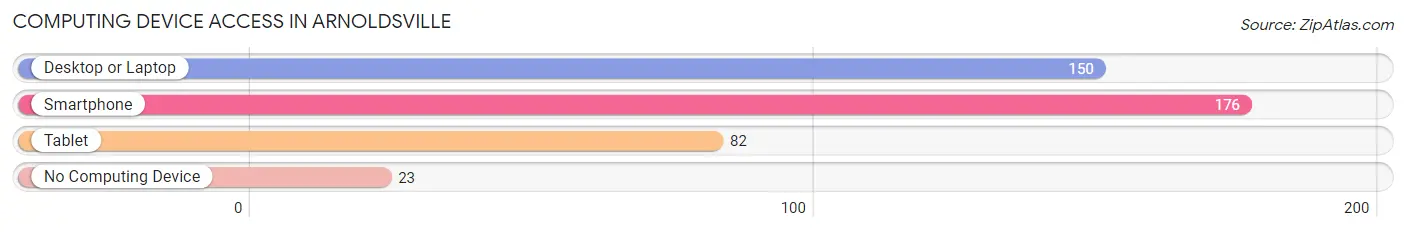
| Device Type | # Households | % Households |
| Desktop or Laptop | 150 | 72.5% |
| Smartphone | 176 | 85.0% |
| Tablet | 82 | 39.6% |
| No Computing Device | 23 | 11.1% |
| Total | 207 | 100.0% |
Internet Access in Arnoldsville
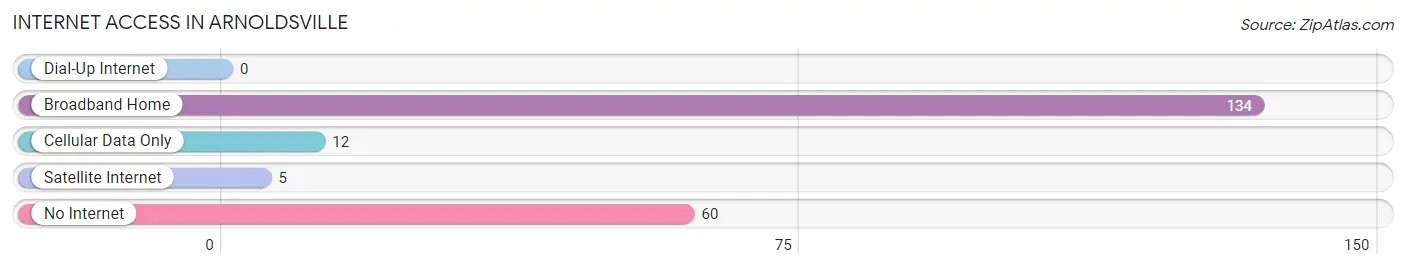
| Internet Type | # Households | % Households |
| Dial-Up Internet | 0 | 0.0% |
| Broadband Home | 134 | 64.7% |
| Cellular Data Only | 12 | 5.8% |
| Satellite Internet | 5 | 2.4% |
| No Internet | 60 | 29.0% |
| Total | 207 | 100.0% |
Arnoldsville Summary
Arnoldsville is a small unincorporated community located in Oglethorpe County, Georgia, United States. It is situated in the northeastern part of the county, approximately 8 miles (13 km) east of the county seat of Lexington. The population of Arnoldsville was estimated to be 1,072 in 2019.
History
Arnoldsville was founded in 1820 by John Arnold, a Revolutionary War veteran. The town was named after him and was originally known as Arnold's Crossroads. The town was incorporated in 1883 and was the first incorporated town in Oglethorpe County.
In the late 19th century, Arnoldsville was a thriving agricultural community. The town was home to several cotton gins, a grist mill, a sawmill, and a blacksmith shop. The town also had a post office, a general store, and a hotel.
In the early 20th century, Arnoldsville began to decline as the railroad bypassed the town. The decline continued until the 1950s when the town began to experience a resurgence. The town was revitalized by the construction of a new highway, which brought new businesses and residents to the area.
Geography
Arnoldsville is located in the northeastern part of Oglethorpe County, approximately 8 miles (13 km) east of the county seat of Lexington. The town is situated at the intersection of Georgia State Route 22 and Georgia State Route 77.
The town is located in the Piedmont region of Georgia, which is characterized by rolling hills and forests. The town is located in the Oconee National Forest, which is home to a variety of wildlife, including deer, turkey, and black bear.
Economy
Arnoldsville is a small, rural community with a limited economy. The town is home to several small businesses, including a convenience store, a gas station, and a restaurant. The town is also home to a few manufacturing companies, including a furniture manufacturer and a plastics manufacturer.
The town is also home to several farms, which produce a variety of crops, including corn, soybeans, and cotton. The town is also home to several horse farms, which raise and train horses for show and racing.
Demographics
As of the 2010 census, the population of Arnoldsville was 1,072. The racial makeup of the town was 94.3% White, 3.2% African American, 0.3% Native American, 0.2% Asian, 0.1% Pacific Islander, 0.7% from other races, and 1.3% from two or more races. Hispanic or Latino of any race were 1.7% of the population.
The median household income in Arnoldsville was $37,917, and the median family income was $45,625. The per capita income for the town was $18,945. About 11.3% of families and 14.2% of the population were below the poverty line, including 18.2% of those under age 18 and 8.3% of those age 65 or over.
Common Questions
What is Per Capita Income in Arnoldsville?
Per Capita income in Arnoldsville is $26,520.
What is the Median Family Income in Arnoldsville?
Median Family Income in Arnoldsville is $63,750.
What is the Median Household income in Arnoldsville?
Median Household Income in Arnoldsville is $42,292.
What is Income or Wage Gap in Arnoldsville?
Income or Wage Gap in Arnoldsville is 54.5%.
Women in Arnoldsville earn 45.5 cents for every dollar earned by a man.
What is Inequality or Gini Index in Arnoldsville?
Inequality or Gini Index in Arnoldsville is 0.39.
What is the Total Population of Arnoldsville?
Total Population of Arnoldsville is 486.
What is the Total Male Population of Arnoldsville?
Total Male Population of Arnoldsville is 231.
What is the Total Female Population of Arnoldsville?
Total Female Population of Arnoldsville is 255.
What is the Ratio of Males per 100 Females in Arnoldsville?
There are 90.59 Males per 100 Females in Arnoldsville.
What is the Ratio of Females per 100 Males in Arnoldsville?
There are 110.39 Females per 100 Males in Arnoldsville.
What is the Median Population Age in Arnoldsville?
Median Population Age in Arnoldsville is 46.3 Years.
What is the Average Family Size in Arnoldsville
Average Family Size in Arnoldsville is 2.9 People.
What is the Average Household Size in Arnoldsville
Average Household Size in Arnoldsville is 2.3 People.
How Large is the Labor Force in Arnoldsville?
There are 244 People in the Labor Forcein in Arnoldsville.
What is the Percentage of People in the Labor Force in Arnoldsville?
56.9% of People are in the Labor Force in Arnoldsville.
What is the Unemployment Rate in Arnoldsville?
Unemployment Rate in Arnoldsville is 2.0%.