Hogansville, GA Map & Demographics
Hogansville Map
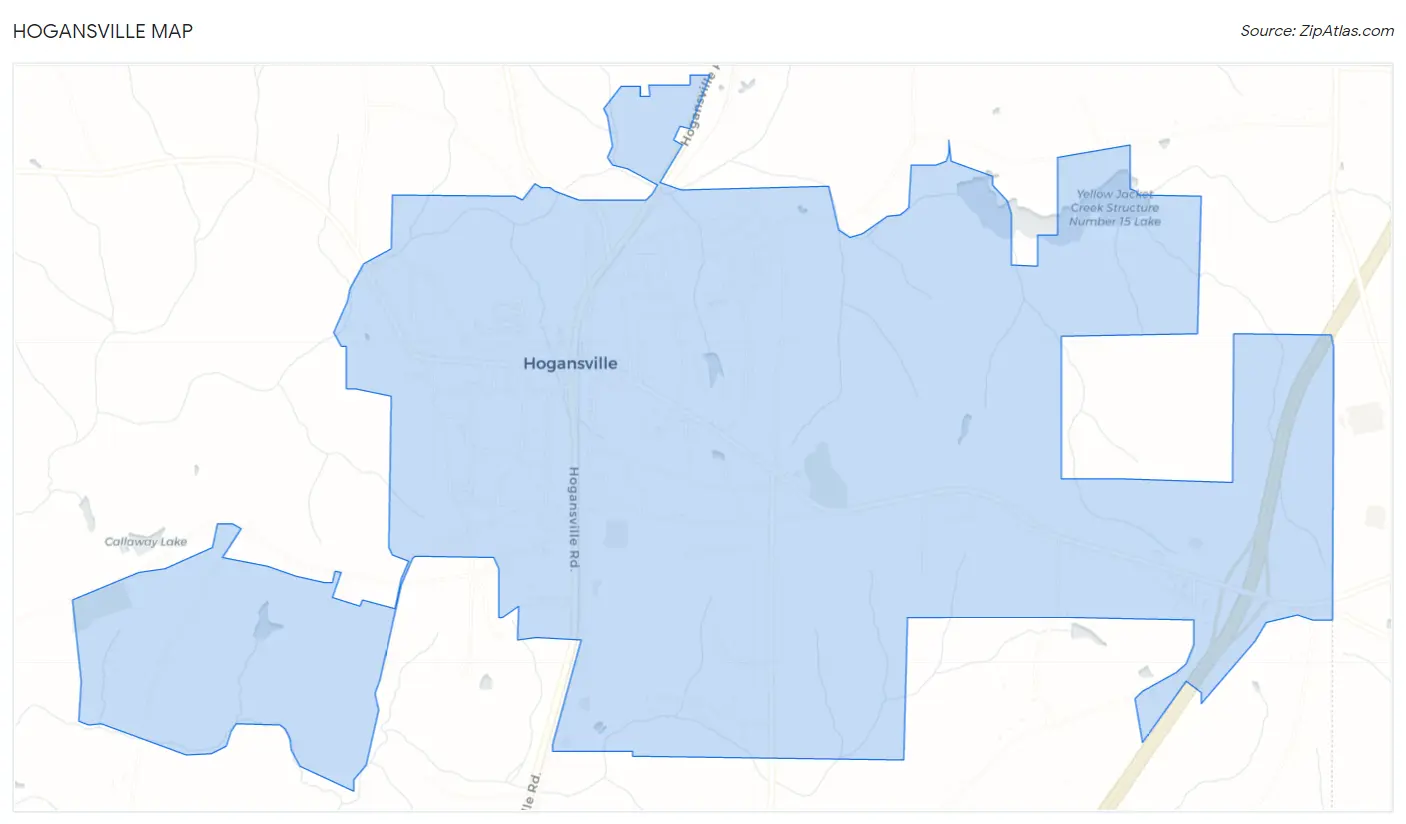
Hogansville Overview
$25,270
PER CAPITA INCOME
$66,125
AVG FAMILY INCOME
$44,712
AVG HOUSEHOLD INCOME
31.5%
WAGE / INCOME GAP [ % ]
68.5¢/ $1
WAGE / INCOME GAP [ $ ]
0.48
INEQUALITY / GINI INDEX
3,240
TOTAL POPULATION
1,444
MALE POPULATION
1,796
FEMALE POPULATION
80.40
MALES / 100 FEMALES
124.38
FEMALES / 100 MALES
36.4
MEDIAN AGE
3.3
AVG FAMILY SIZE
2.4
AVG HOUSEHOLD SIZE
1,686
LABOR FORCE [ PEOPLE ]
61.0%
PERCENT IN LABOR FORCE
0.9%
UNEMPLOYMENT RATE
Hogansville Zip Codes
Hogansville Area Codes
Income in Hogansville
Income Overview in Hogansville
Per Capita Income in Hogansville is $25,270, while median incomes of families and households are $66,125 and $44,712 respectively.
| Characteristic | Number | Measure |
| Per Capita Income | 3,240 | $25,270 |
| Median Family Income | 717 | $66,125 |
| Mean Family Income | 717 | $77,146 |
| Median Household Income | 1,331 | $44,712 |
| Mean Household Income | 1,331 | $56,605 |
| Income Deficit | 717 | $0 |
| Wage / Income Gap (%) | 3,240 | 31.53% |
| Wage / Income Gap ($) | 3,240 | 68.47¢ per $1 |
| Gini / Inequality Index | 3,240 | 0.48 |
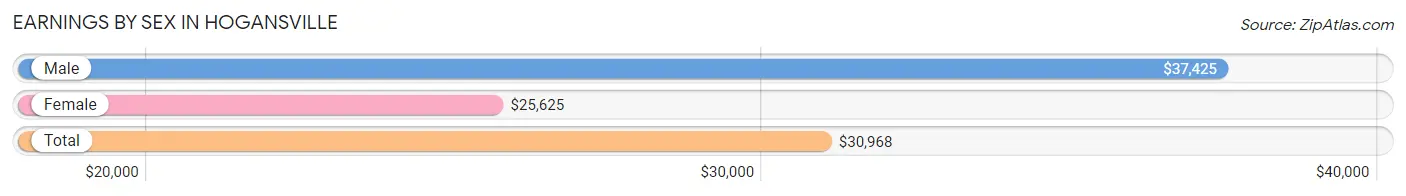
Earnings by Sex in Hogansville
Average Earnings in Hogansville are $30,968, $37,425 for men and $25,625 for women, a difference of 31.5%.
| Sex | Number | Average Earnings |
| Male | 845 (47.1%) | $37,425 |
| Female | 947 (52.8%) | $25,625 |
| Total | 1,792 (100.0%) | $30,968 |
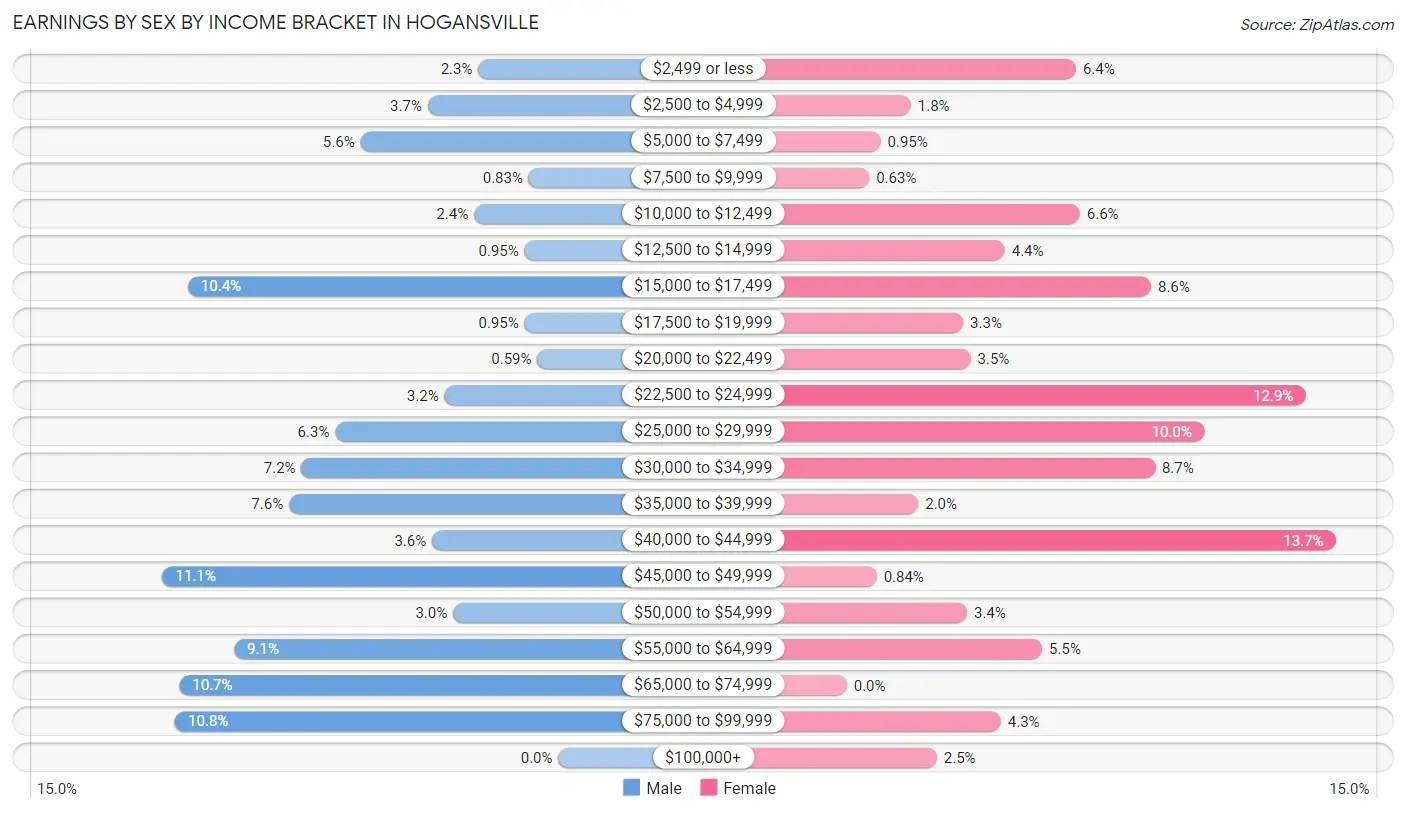
Earnings by Sex by Income Bracket in Hogansville
The most common earnings brackets in Hogansville are $45,000 to $49,999 for men (94 | 11.1%) and $40,000 to $44,999 for women (130 | 13.7%).
| Income | Male | Female |
| $2,499 or less | 19 (2.2%) | 61 (6.4%) |
| $2,500 to $4,999 | 31 (3.7%) | 17 (1.8%) |
| $5,000 to $7,499 | 47 (5.6%) | 9 (0.9%) |
| $7,500 to $9,999 | 7 (0.8%) | 6 (0.6%) |
| $10,000 to $12,499 | 20 (2.4%) | 62 (6.6%) |
| $12,500 to $14,999 | 8 (0.9%) | 42 (4.4%) |
| $15,000 to $17,499 | 88 (10.4%) | 81 (8.6%) |
| $17,500 to $19,999 | 8 (0.9%) | 31 (3.3%) |
| $20,000 to $22,499 | 5 (0.6%) | 33 (3.5%) |
| $22,500 to $24,999 | 27 (3.2%) | 122 (12.9%) |
| $25,000 to $29,999 | 53 (6.3%) | 95 (10.0%) |
| $30,000 to $34,999 | 61 (7.2%) | 82 (8.7%) |
| $35,000 to $39,999 | 64 (7.6%) | 19 (2.0%) |
| $40,000 to $44,999 | 30 (3.5%) | 130 (13.7%) |
| $45,000 to $49,999 | 94 (11.1%) | 8 (0.8%) |
| $50,000 to $54,999 | 25 (3.0%) | 32 (3.4%) |
| $55,000 to $64,999 | 77 (9.1%) | 52 (5.5%) |
| $65,000 to $74,999 | 90 (10.6%) | 0 (0.0%) |
| $75,000 to $99,999 | 91 (10.8%) | 41 (4.3%) |
| $100,000+ | 0 (0.0%) | 24 (2.5%) |
| Total | 845 (100.0%) | 947 (100.0%) |
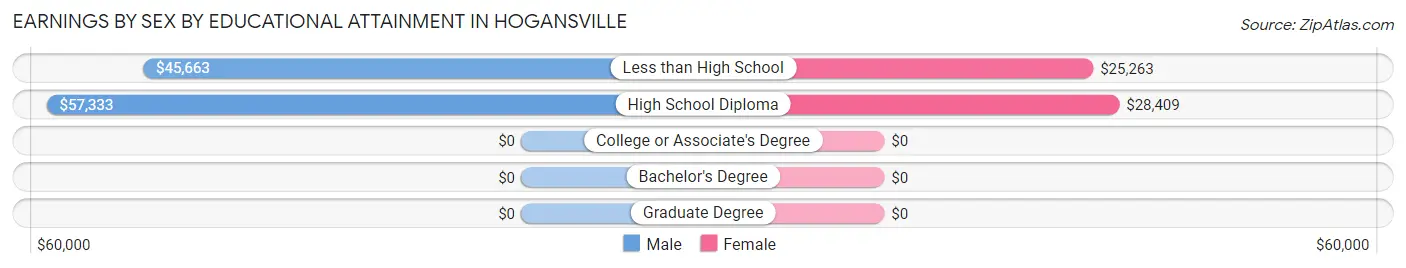
Earnings by Sex by Educational Attainment in Hogansville
Average earnings in Hogansville are $41,042 for men and $26,579 for women, a difference of 35.2%. Men with an educational attainment of high school diploma enjoy the highest average annual earnings of $57,333, while those with less than high school education earn the least with $45,663. Women with an educational attainment of high school diploma earn the most with the average annual earnings of $28,409, while those with less than high school education have the smallest earnings of $25,263.
| Educational Attainment | Male Income | Female Income |
| Less than High School | $45,663 | $25,263 |
| High School Diploma | $57,333 | $28,409 |
| College or Associate's Degree | - | - |
| Bachelor's Degree | - | - |
| Graduate Degree | - | - |
| Total | $41,042 | $26,579 |
Family Income in Hogansville
Family Income Brackets in Hogansville
According to the Hogansville family income data, there are 159 families falling into the $100,000 to $149,999 income range, which is the most common income bracket and makes up 22.2% of all families.
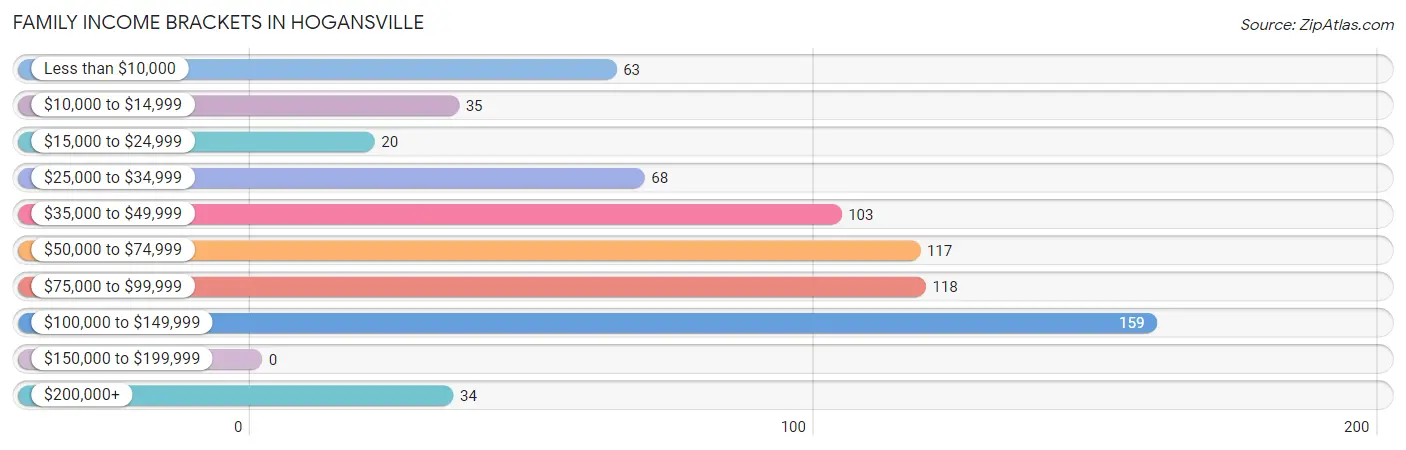
| Income Bracket | # Families | % Families |
| Less than $10,000 | 63 | 8.8% |
| $10,000 to $14,999 | 35 | 4.9% |
| $15,000 to $24,999 | 20 | 2.8% |
| $25,000 to $34,999 | 68 | 9.5% |
| $35,000 to $49,999 | 103 | 14.4% |
| $50,000 to $74,999 | 117 | 16.3% |
| $75,000 to $99,999 | 118 | 16.5% |
| $100,000 to $149,999 | 159 | 22.2% |
| $150,000 to $199,999 | 0 | 0.0% |
| $200,000+ | 34 | 4.7% |
Family Income by Famaliy Size in Hogansville
5-person families (54 | 7.5%) account for the highest median family income in Hogansville with $250,001 per family, while 5-person families (54 | 7.5%) have the highest median income of $50,000 per family member.
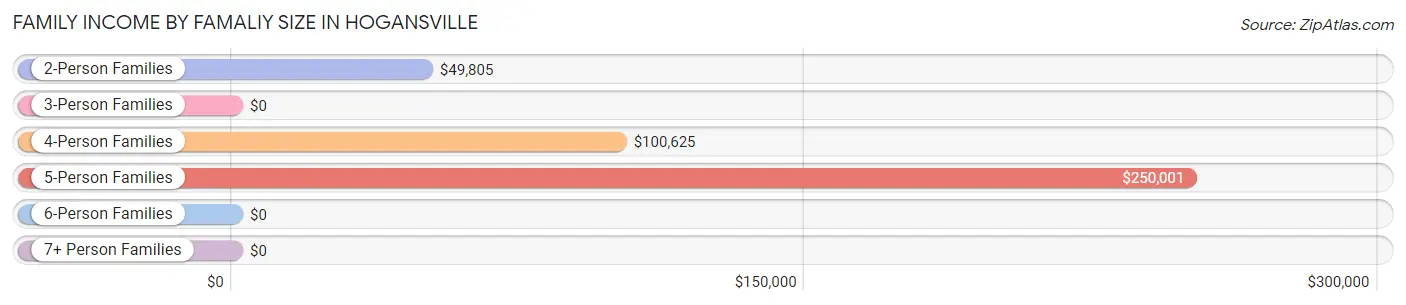
| Income Bracket | # Families | Median Income |
| 2-Person Families | 396 (55.2%) | $49,805 |
| 3-Person Families | 134 (18.7%) | $0 |
| 4-Person Families | 120 (16.7%) | $100,625 |
| 5-Person Families | 54 (7.5%) | $250,001 |
| 6-Person Families | 0 (0.0%) | $0 |
| 7+ Person Families | 13 (1.8%) | $0 |
| Total | 717 (100.0%) | $66,125 |
Family Income by Number of Earners in Hogansville
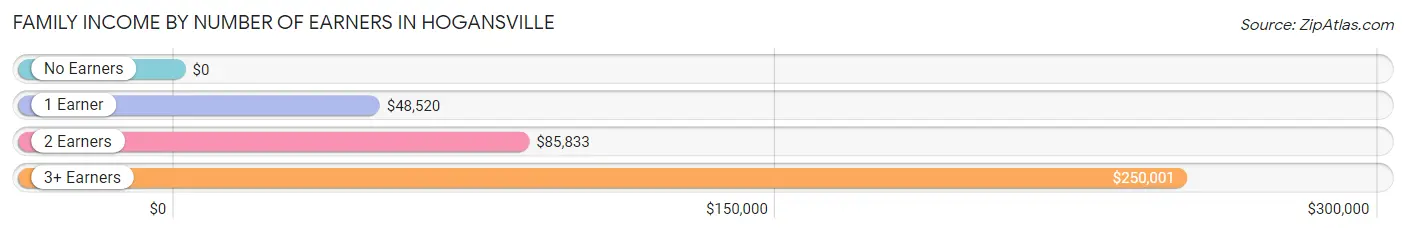
| Number of Earners | # Families | Median Income |
| No Earners | 118 (16.5%) | $0 |
| 1 Earner | 175 (24.4%) | $48,520 |
| 2 Earners | 358 (49.9%) | $85,833 |
| 3+ Earners | 66 (9.2%) | $250,001 |
| Total | 717 (100.0%) | $66,125 |
Household Income in Hogansville
Household Income Brackets in Hogansville
With 217 households falling in the category, the $50,000 to $74,999 income range is the most frequent in Hogansville, accounting for 16.3% of all households.
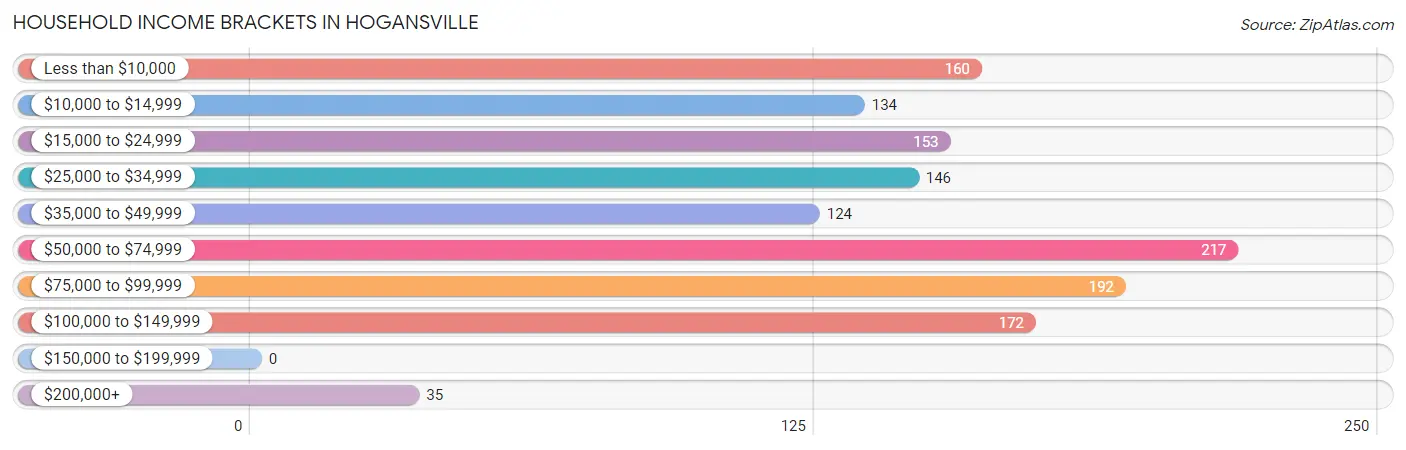
| Income Bracket | # Households | % Households |
| Less than $10,000 | 160 | 12.0% |
| $10,000 to $14,999 | 134 | 10.1% |
| $15,000 to $24,999 | 153 | 11.5% |
| $25,000 to $34,999 | 146 | 11.0% |
| $35,000 to $49,999 | 124 | 9.3% |
| $50,000 to $74,999 | 217 | 16.3% |
| $75,000 to $99,999 | 192 | 14.4% |
| $100,000 to $149,999 | 172 | 12.9% |
| $150,000 to $199,999 | 0 | 0.0% |
| $200,000+ | 35 | 2.6% |
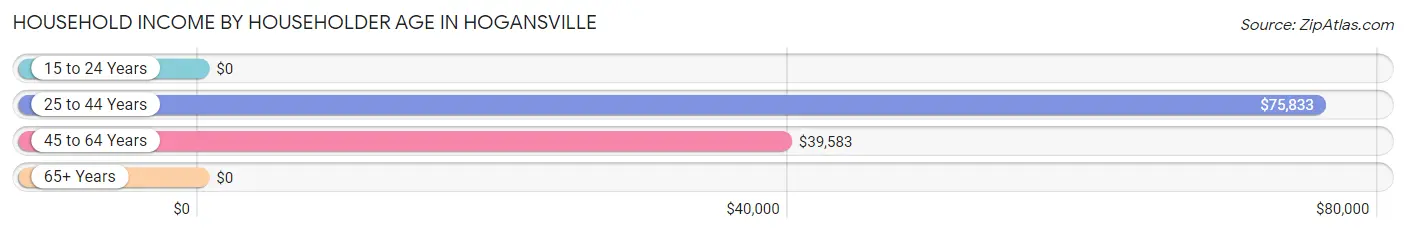
Household Income by Householder Age in Hogansville
The median household income in Hogansville is $44,712, with the highest median household income of $75,833 found in the 25 to 44 years age bracket for the primary householder. A total of 336 households (25.2%) fall into this category. Meanwhile, the 15 to 24 years age bracket for the primary householder has the lowest median household income of $0, with 75 households (5.6%) in this group.
| Income Bracket | # Households | Median Income |
| 15 to 24 Years | 75 (5.6%) | $0 |
| 25 to 44 Years | 336 (25.2%) | $75,833 |
| 45 to 64 Years | 556 (41.8%) | $39,583 |
| 65+ Years | 364 (27.4%) | $0 |
| Total | 1,331 (100.0%) | $44,712 |
Poverty in Hogansville
Income Below Poverty by Sex and Age in Hogansville
With 16.6% poverty level for males and 19.7% for females among the residents of Hogansville, 12 to 14 year old males and under 5 year old females are the most vulnerable to poverty, with 16 males (61.5%) and 73 females (62.4%) in their respective age groups living below the poverty level.
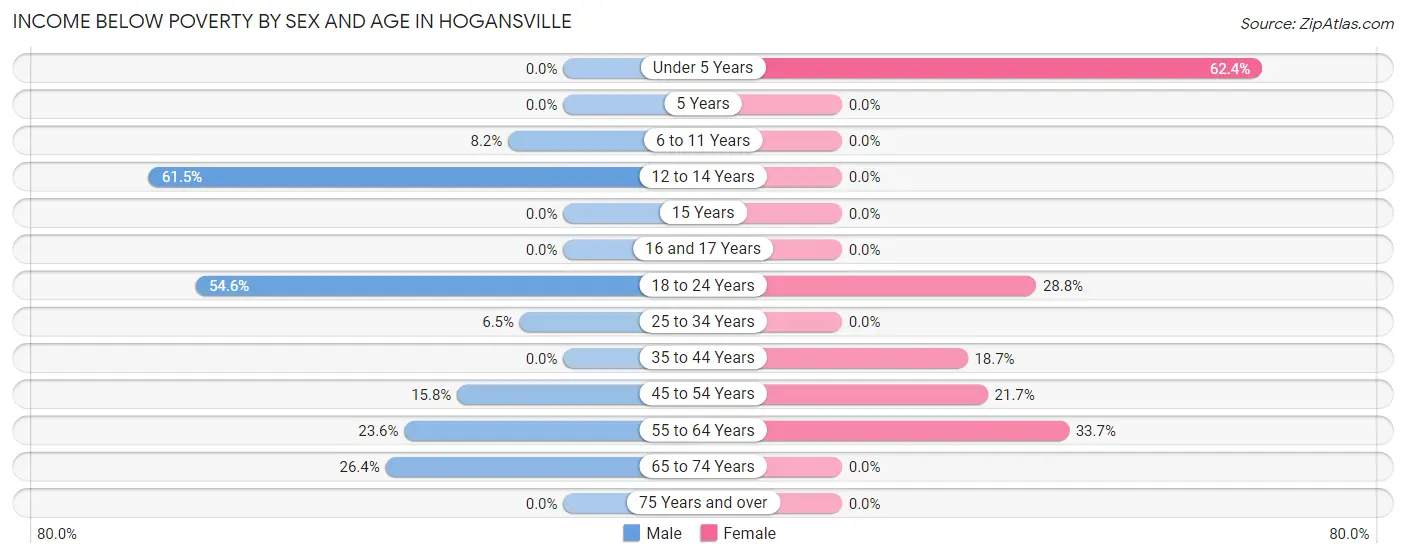
| Age Bracket | Male | Female |
| Under 5 Years | 0 (0.0%) | 73 (62.4%) |
| 5 Years | 0 (0.0%) | 0 (0.0%) |
| 6 to 11 Years | 5 (8.2%) | 0 (0.0%) |
| 12 to 14 Years | 16 (61.5%) | 0 (0.0%) |
| 15 Years | 0 (0.0%) | 0 (0.0%) |
| 16 and 17 Years | 0 (0.0%) | 0 (0.0%) |
| 18 to 24 Years | 36 (54.5%) | 113 (28.8%) |
| 25 to 34 Years | 17 (6.5%) | 0 (0.0%) |
| 35 to 44 Years | 0 (0.0%) | 25 (18.7%) |
| 45 to 54 Years | 29 (15.8%) | 21 (21.6%) |
| 55 to 64 Years | 85 (23.6%) | 122 (33.7%) |
| 65 to 74 Years | 47 (26.4%) | 0 (0.0%) |
| 75 Years and over | 0 (0.0%) | 0 (0.0%) |
| Total | 235 (16.6%) | 354 (19.7%) |
Income Above Poverty by Sex and Age in Hogansville
According to the poverty statistics in Hogansville, males aged under 5 years and females aged 6 to 11 years are the age groups that are most secure financially, with 100.0% of males and 100.0% of females in these age groups living above the poverty line.
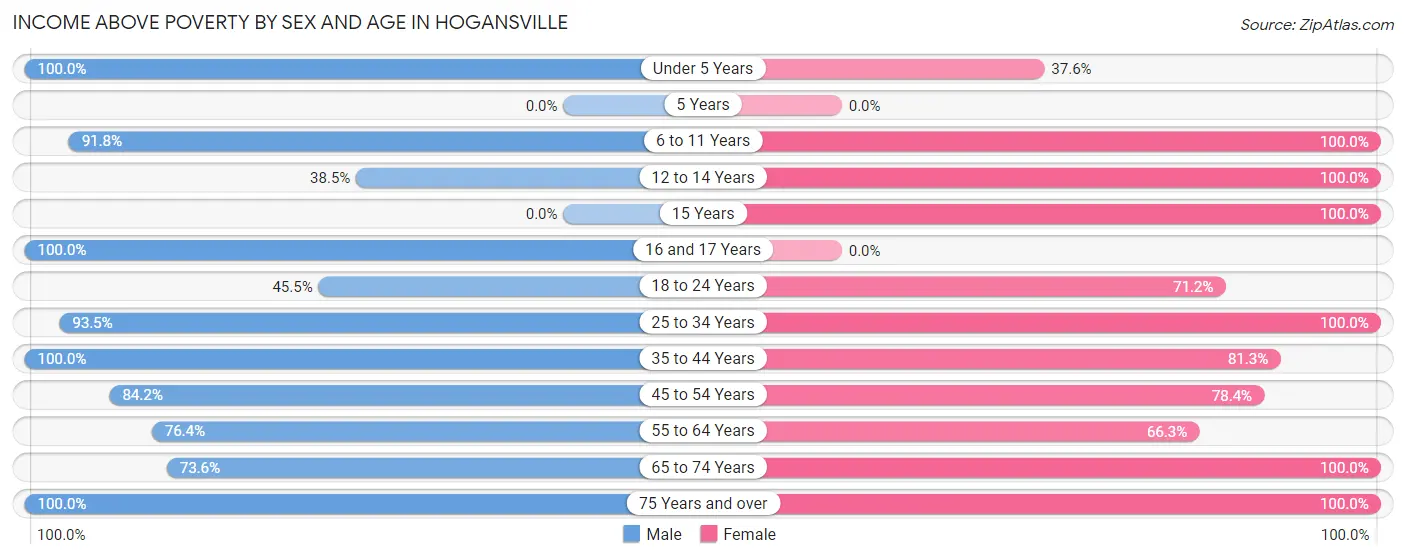
| Age Bracket | Male | Female |
| Under 5 Years | 106 (100.0%) | 44 (37.6%) |
| 5 Years | 0 (0.0%) | 0 (0.0%) |
| 6 to 11 Years | 56 (91.8%) | 115 (100.0%) |
| 12 to 14 Years | 10 (38.5%) | 13 (100.0%) |
| 15 Years | 0 (0.0%) | 9 (100.0%) |
| 16 and 17 Years | 23 (100.0%) | 0 (0.0%) |
| 18 to 24 Years | 30 (45.5%) | 279 (71.2%) |
| 25 to 34 Years | 246 (93.5%) | 313 (100.0%) |
| 35 to 44 Years | 79 (100.0%) | 109 (81.3%) |
| 45 to 54 Years | 155 (84.2%) | 76 (78.3%) |
| 55 to 64 Years | 275 (76.4%) | 240 (66.3%) |
| 65 to 74 Years | 131 (73.6%) | 178 (100.0%) |
| 75 Years and over | 69 (100.0%) | 66 (100.0%) |
| Total | 1,180 (83.4%) | 1,442 (80.3%) |
Income Below Poverty Among Married-Couple Families in Hogansville
The poverty statistics for married-couple families in Hogansville show that 1.4% or 7 of the total 505 families live below the poverty line. Families with no children have the highest poverty rate of 2.1%, comprising of 7 families. On the other hand, families with 1 or 2 children have the lowest poverty rate of 0.0%, which includes 0 families.
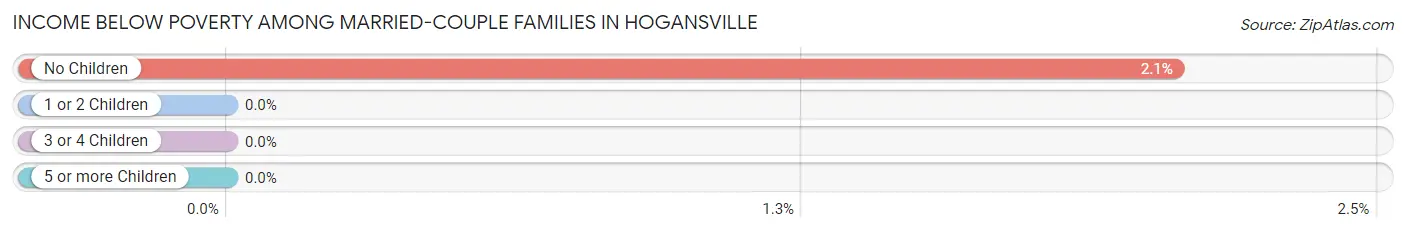
| Children | Above Poverty | Below Poverty |
| No Children | 333 (97.9%) | 7 (2.1%) |
| 1 or 2 Children | 163 (100.0%) | 0 (0.0%) |
| 3 or 4 Children | 2 (100.0%) | 0 (0.0%) |
| 5 or more Children | 0 (0.0%) | 0 (0.0%) |
| Total | 498 (98.6%) | 7 (1.4%) |
Income Below Poverty Among Single-Parent Households in Hogansville
According to the poverty data in Hogansville, 100.0% or 19 single-father households and 38.9% or 75 single-mother households are living below the poverty line. Among single-father households, those with 1 or 2 children have the highest poverty rate, with 19 households (100.0%) experiencing poverty. Likewise, among single-mother households, those with 1 or 2 children have the highest poverty rate, with 50 households (62.5%) falling below the poverty line.
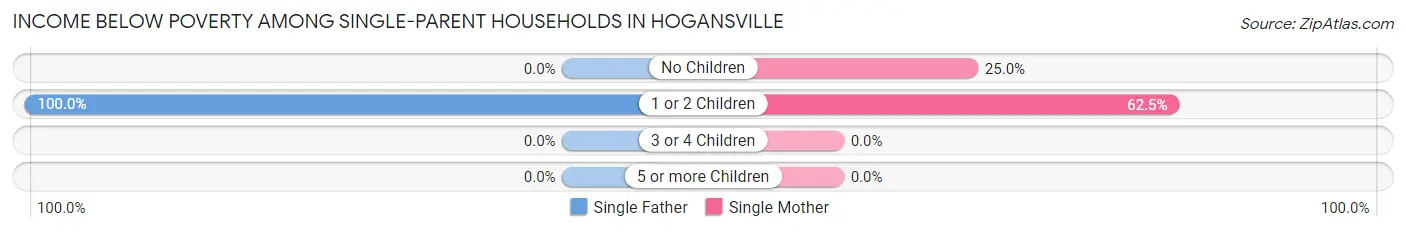
| Children | Single Father | Single Mother |
| No Children | 0 (0.0%) | 25 (25.0%) |
| 1 or 2 Children | 19 (100.0%) | 50 (62.5%) |
| 3 or 4 Children | 0 (0.0%) | 0 (0.0%) |
| 5 or more Children | 0 (0.0%) | 0 (0.0%) |
| Total | 19 (100.0%) | 75 (38.9%) |
Income Below Poverty Among Married-Couple vs Single-Parent Households in Hogansville
The poverty data for Hogansville shows that 7 of the married-couple family households (1.4%) and 94 of the single-parent households (44.3%) are living below the poverty level. Within the married-couple family households, those with no children have the highest poverty rate, with 7 households (2.1%) falling below the poverty line. Among the single-parent households, those with 1 or 2 children have the highest poverty rate, with 69 household (69.7%) living below poverty.
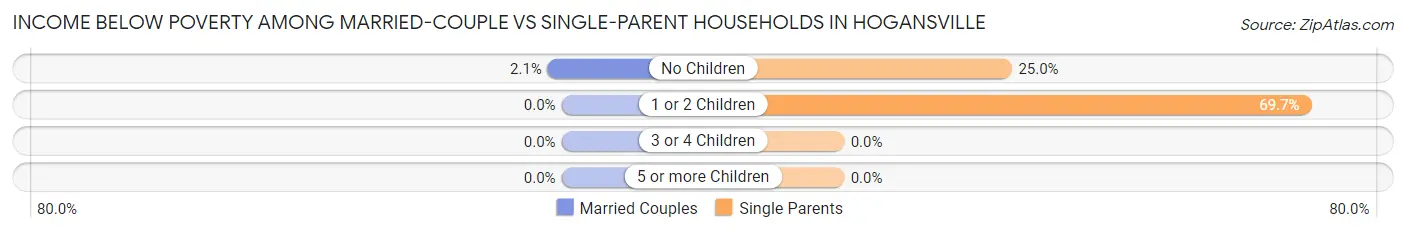
| Children | Married-Couple Families | Single-Parent Households |
| No Children | 7 (2.1%) | 25 (25.0%) |
| 1 or 2 Children | 0 (0.0%) | 69 (69.7%) |
| 3 or 4 Children | 0 (0.0%) | 0 (0.0%) |
| 5 or more Children | 0 (0.0%) | 0 (0.0%) |
| Total | 7 (1.4%) | 94 (44.3%) |
Race in Hogansville
The most populous races in Hogansville are White / Caucasian (1,964 | 60.6%), Black / African American (1,257 | 38.8%), and Hispanic or Latino (157 | 4.9%).
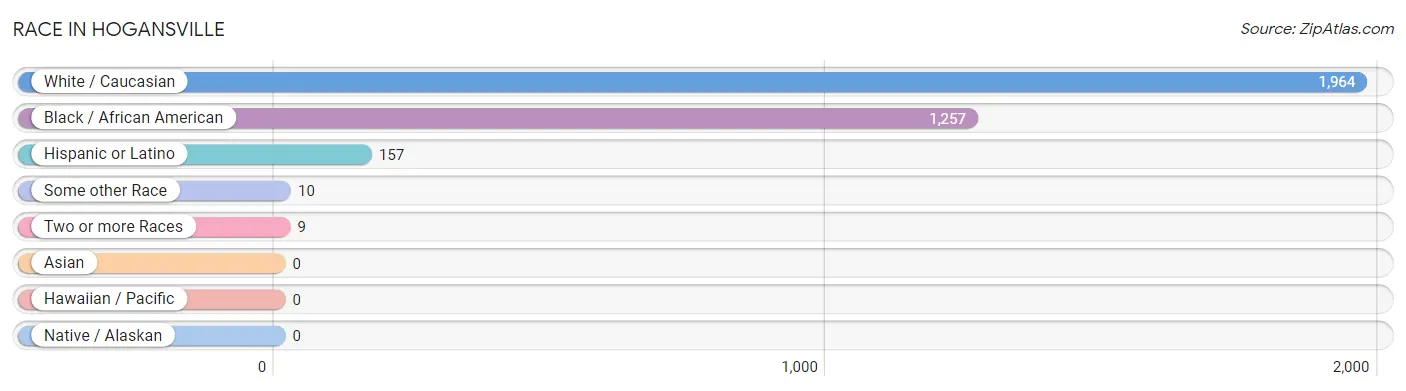
| Race | # Population | % Population |
| Asian | 0 | 0.0% |
| Black / African American | 1,257 | 38.8% |
| Hawaiian / Pacific | 0 | 0.0% |
| Hispanic or Latino | 157 | 4.9% |
| Native / Alaskan | 0 | 0.0% |
| White / Caucasian | 1,964 | 60.6% |
| Two or more Races | 9 | 0.3% |
| Some other Race | 10 | 0.3% |
| Total | 3,240 | 100.0% |
Ancestry in Hogansville
The most populous ancestries reported in Hogansville are American (465 | 14.3%), German (249 | 7.7%), Mexican (157 | 4.9%), English (134 | 4.1%), and Irish (108 | 3.3%), together accounting for 34.4% of all Hogansville residents.
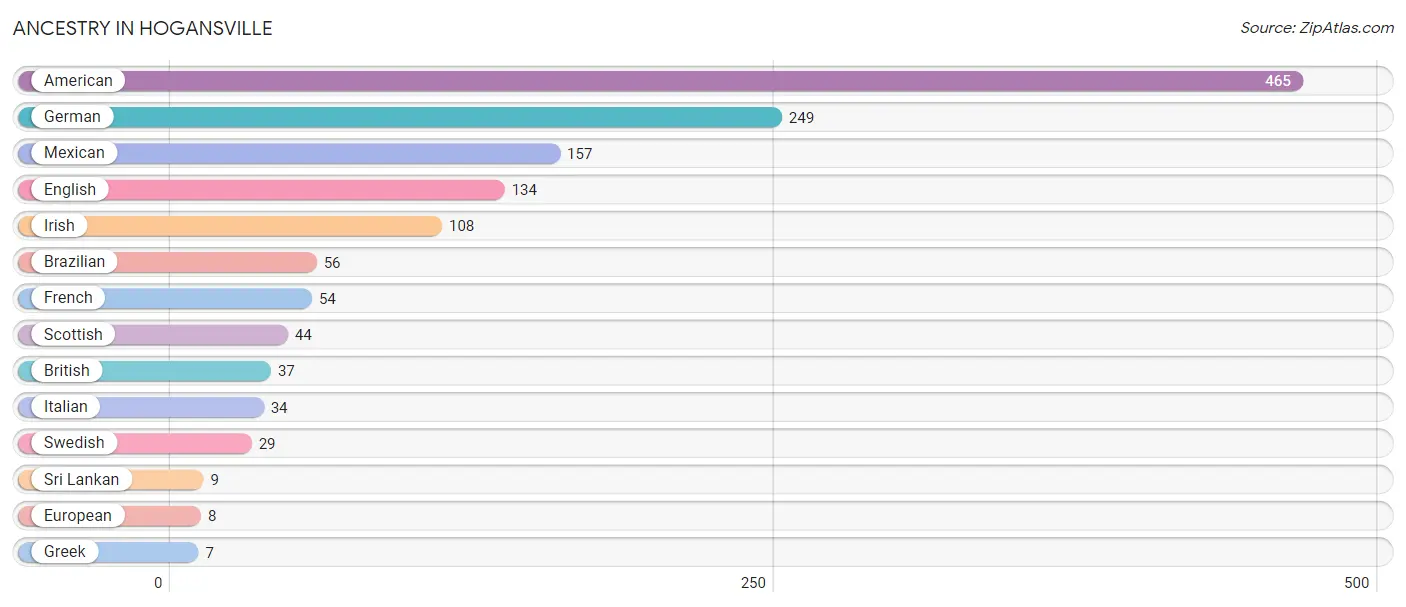
| Ancestry | # Population | % Population |
| American | 465 | 14.3% |
| Brazilian | 56 | 1.7% |
| British | 37 | 1.1% |
| English | 134 | 4.1% |
| European | 8 | 0.3% |
| French | 54 | 1.7% |
| German | 249 | 7.7% |
| Greek | 7 | 0.2% |
| Irish | 108 | 3.3% |
| Italian | 34 | 1.1% |
| Mexican | 157 | 4.9% |
| Scottish | 44 | 1.4% |
| Sri Lankan | 9 | 0.3% |
| Swedish | 29 | 0.9% | View All 14 Rows |
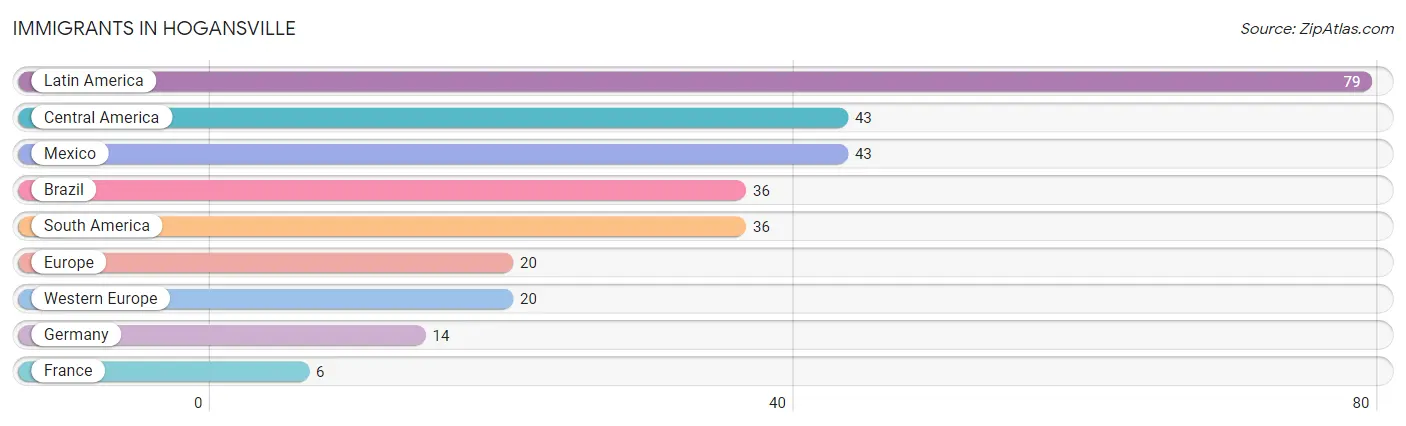
Immigrants in Hogansville
The most numerous immigrant groups reported in Hogansville came from Latin America (79 | 2.4%), Central America (43 | 1.3%), Mexico (43 | 1.3%), Brazil (36 | 1.1%), and South America (36 | 1.1%), together accounting for 7.3% of all Hogansville residents.
| Immigration Origin | # Population | % Population |
| Brazil | 36 | 1.1% |
| Central America | 43 | 1.3% |
| Europe | 20 | 0.6% |
| France | 6 | 0.2% |
| Germany | 14 | 0.4% |
| Latin America | 79 | 2.4% |
| Mexico | 43 | 1.3% |
| South America | 36 | 1.1% |
| Western Europe | 20 | 0.6% | View All 9 Rows |
Sex and Age in Hogansville
Sex and Age in Hogansville
The most populous age groups in Hogansville are 55 to 59 Years (205 | 14.2%) for men and 20 to 24 Years (361 | 20.1%) for women.
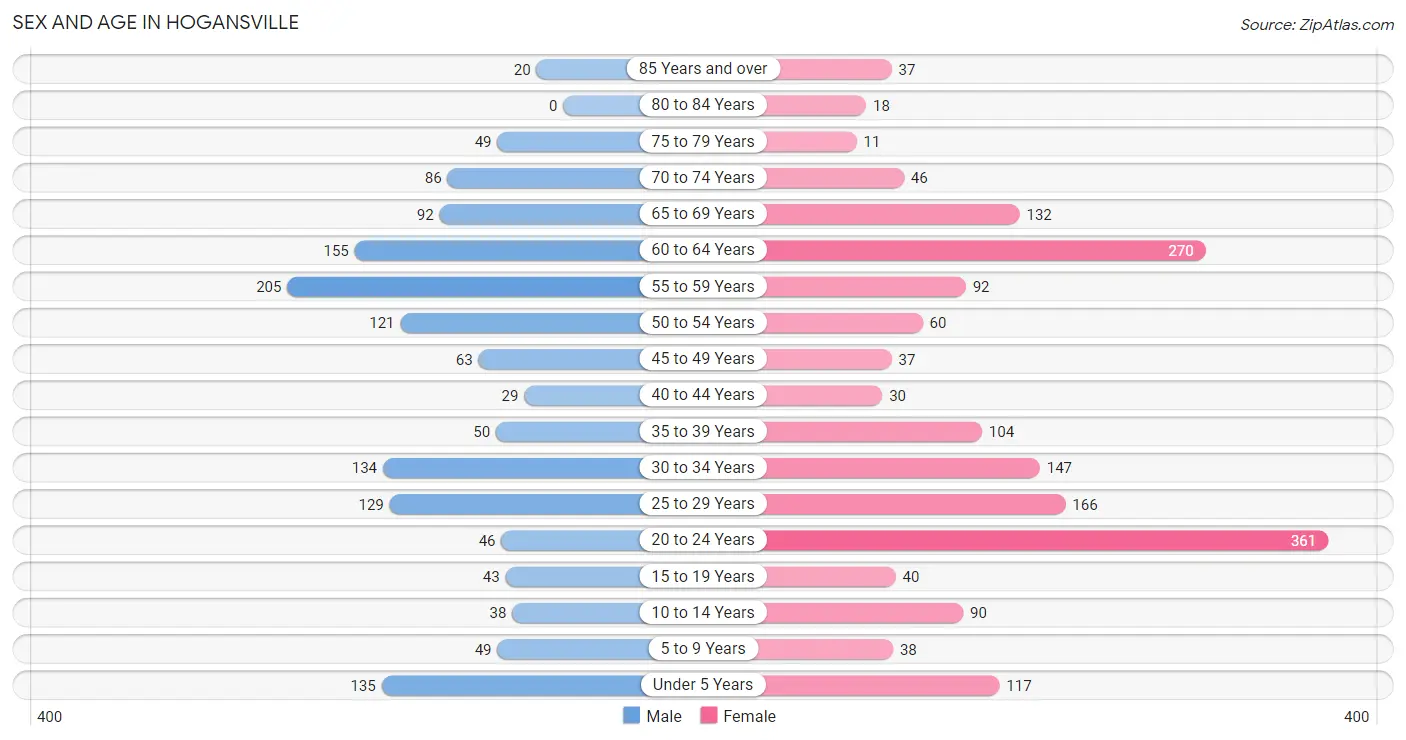
| Age Bracket | Male | Female |
| Under 5 Years | 135 (9.3%) | 117 (6.5%) |
| 5 to 9 Years | 49 (3.4%) | 38 (2.1%) |
| 10 to 14 Years | 38 (2.6%) | 90 (5.0%) |
| 15 to 19 Years | 43 (3.0%) | 40 (2.2%) |
| 20 to 24 Years | 46 (3.2%) | 361 (20.1%) |
| 25 to 29 Years | 129 (8.9%) | 166 (9.2%) |
| 30 to 34 Years | 134 (9.3%) | 147 (8.2%) |
| 35 to 39 Years | 50 (3.5%) | 104 (5.8%) |
| 40 to 44 Years | 29 (2.0%) | 30 (1.7%) |
| 45 to 49 Years | 63 (4.4%) | 37 (2.1%) |
| 50 to 54 Years | 121 (8.4%) | 60 (3.3%) |
| 55 to 59 Years | 205 (14.2%) | 92 (5.1%) |
| 60 to 64 Years | 155 (10.7%) | 270 (15.0%) |
| 65 to 69 Years | 92 (6.4%) | 132 (7.3%) |
| 70 to 74 Years | 86 (6.0%) | 46 (2.6%) |
| 75 to 79 Years | 49 (3.4%) | 11 (0.6%) |
| 80 to 84 Years | 0 (0.0%) | 18 (1.0%) |
| 85 Years and over | 20 (1.4%) | 37 (2.1%) |
| Total | 1,444 (100.0%) | 1,796 (100.0%) |
Families and Households in Hogansville
Median Family Size in Hogansville
The median family size in Hogansville is 3.30 persons per family, with single male/father families (19 | 2.6%) accounting for the largest median family size of 6.68 persons per family. On the other hand, married-couple families (505 | 70.4%) represent the smallest median family size with 3.21 persons per family.
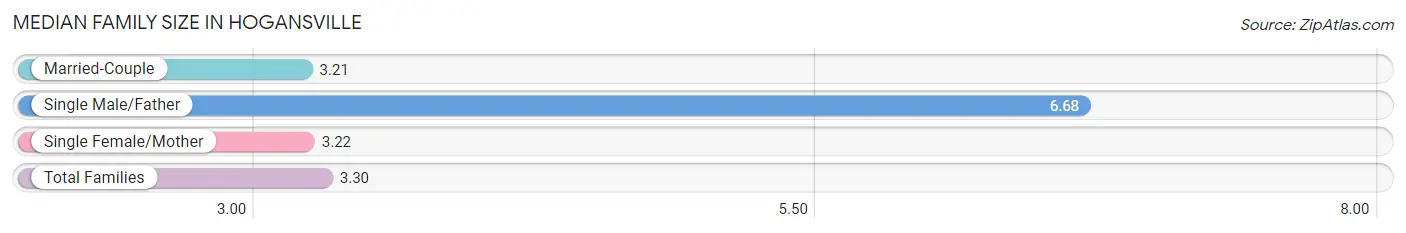
| Family Type | # Families | Family Size |
| Married-Couple | 505 (70.4%) | 3.21 |
| Single Male/Father | 19 (2.6%) | 6.68 |
| Single Female/Mother | 193 (26.9%) | 3.22 |
| Total Families | 717 (100.0%) | 3.30 |
Median Household Size in Hogansville
The median household size in Hogansville is 2.43 persons per household, with single male/father households (19 | 1.4%) accounting for the largest median household size of 6.68 persons per household. non-family households (614 | 46.1%) represent the smallest median household size with 1.12 persons per household.
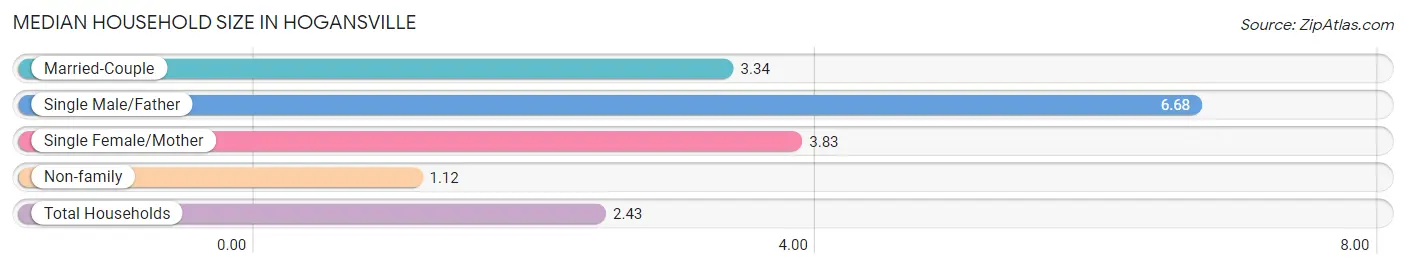
| Household Type | # Households | Household Size |
| Married-Couple | 505 (37.9%) | 3.34 |
| Single Male/Father | 19 (1.4%) | 6.68 |
| Single Female/Mother | 193 (14.5%) | 3.83 |
| Non-family | 614 (46.1%) | 1.12 |
| Total Households | 1,331 (100.0%) | 2.43 |
Household Size by Marriage Status in Hogansville
Out of a total of 1,331 households in Hogansville, 717 (53.9%) are family households, while 614 (46.1%) are nonfamily households. The most numerous type of family households are 2-person households, comprising 317, and the most common type of nonfamily households are 1-person households, comprising 563.
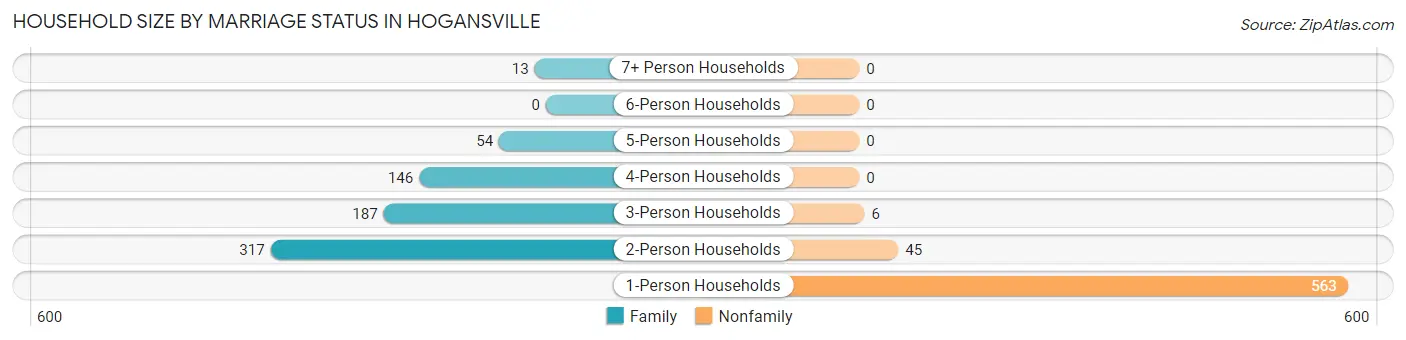
| Household Size | Family Households | Nonfamily Households |
| 1-Person Households | - | 563 (42.3%) |
| 2-Person Households | 317 (23.8%) | 45 (3.4%) |
| 3-Person Households | 187 (14.1%) | 6 (0.4%) |
| 4-Person Households | 146 (11.0%) | 0 (0.0%) |
| 5-Person Households | 54 (4.1%) | 0 (0.0%) |
| 6-Person Households | 0 (0.0%) | 0 (0.0%) |
| 7+ Person Households | 13 (1.0%) | 0 (0.0%) |
| Total | 717 (53.9%) | 614 (46.1%) |
Female Fertility in Hogansville
Fertility by Age in Hogansville
Average fertility rate in Hogansville is 84.0 births per 1,000 women. Women in the age bracket of 15 to 19 years have the highest fertility rate with 775.0 births per 1,000 women. Women in the age bracket of 20 to 34 years acount for 58.7% of all women with births.
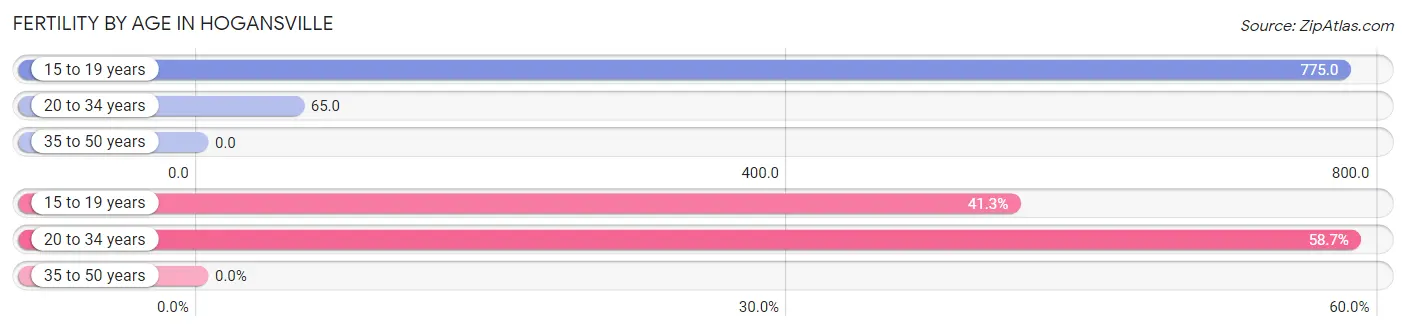
| Age Bracket | Women with Births | Births / 1,000 Women |
| 15 to 19 years | 31 (41.3%) | 775.0 |
| 20 to 34 years | 44 (58.7%) | 65.0 |
| 35 to 50 years | 0 (0.0%) | 0.0 |
| Total | 75 (100.0%) | 84.0 |
Fertility by Age by Marriage Status in Hogansville
26.7% of women with births (75) in Hogansville are married. The highest percentage of unmarried women with births falls into 15 to 19 years age bracket with 100.0% of them unmarried at the time of birth, while the lowest percentage of unmarried women with births belong to 20 to 34 years age bracket with 54.5% of them unmarried.
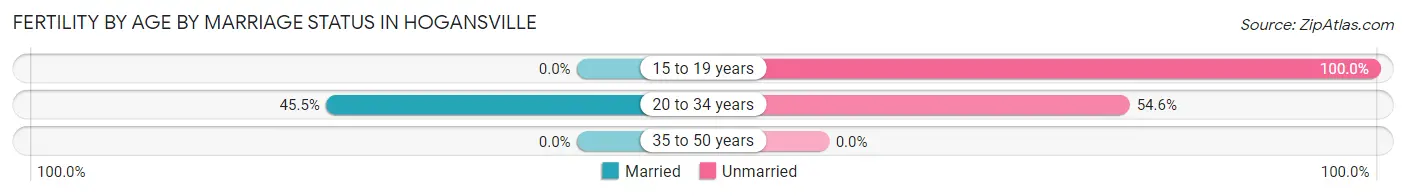
| Age Bracket | Married | Unmarried |
| 15 to 19 years | 0 (0.0%) | 31 (100.0%) |
| 20 to 34 years | 20 (45.5%) | 24 (54.5%) |
| 35 to 50 years | 0 (0.0%) | 0 (0.0%) |
| Total | 20 (26.7%) | 55 (73.3%) |
Fertility by Education in Hogansville
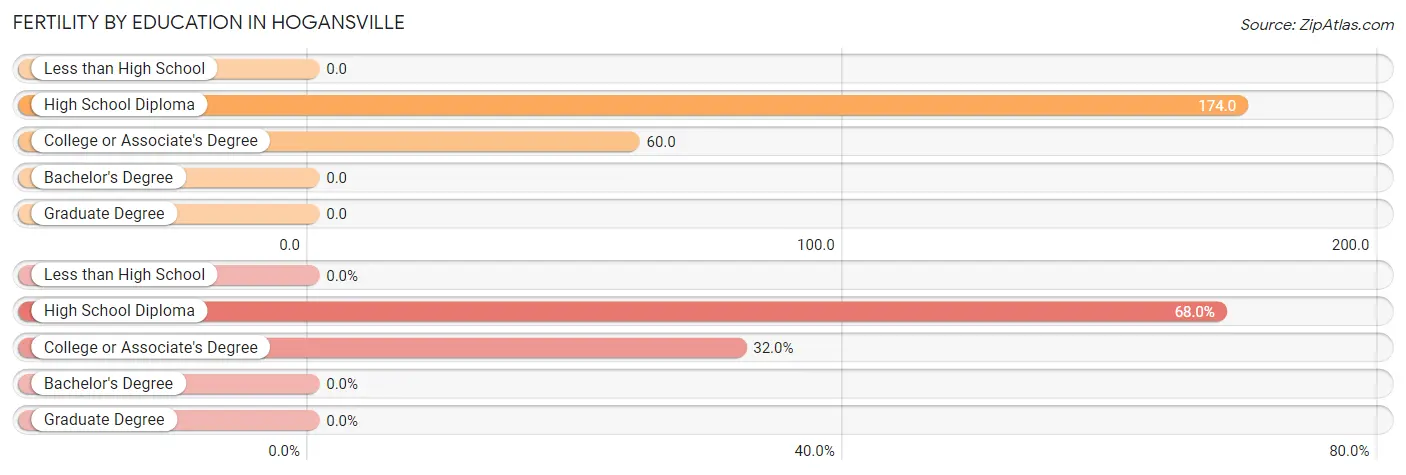
| Educational Attainment | Women with Births | Births / 1,000 Women |
| Less than High School | 0 (0.0%) | 0.0 |
| High School Diploma | 51 (68.0%) | 174.0 |
| College or Associate's Degree | 24 (32.0%) | 60.0 |
| Bachelor's Degree | 0 (0.0%) | 0.0 |
| Graduate Degree | 0 (0.0%) | 0.0 |
| Total | 75 (100.0%) | 84.0 |
Fertility by Education by Marriage Status in Hogansville
73.3% of women with births in Hogansville are unmarried. Women with the educational attainment of high school diploma are most likely to be married with 39.2% of them married at childbirth, while women with the educational attainment of college or associate's degree are least likely to be married with 100.0% of them unmarried at childbirth.
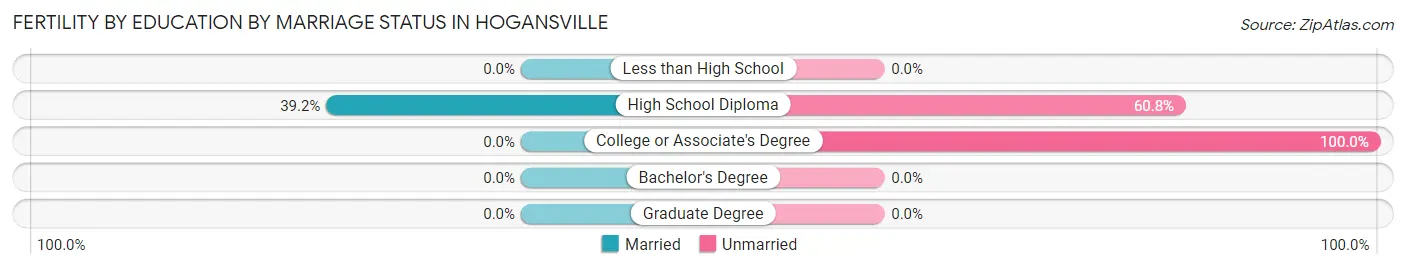
| Educational Attainment | Married | Unmarried |
| Less than High School | 0 (0.0%) | 0 (0.0%) |
| High School Diploma | 20 (39.2%) | 31 (60.8%) |
| College or Associate's Degree | 0 (0.0%) | 24 (100.0%) |
| Bachelor's Degree | 0 (0.0%) | 0 (0.0%) |
| Graduate Degree | 0 (0.0%) | 0 (0.0%) |
| Total | 20 (26.7%) | 55 (73.3%) |
Employment Characteristics in Hogansville
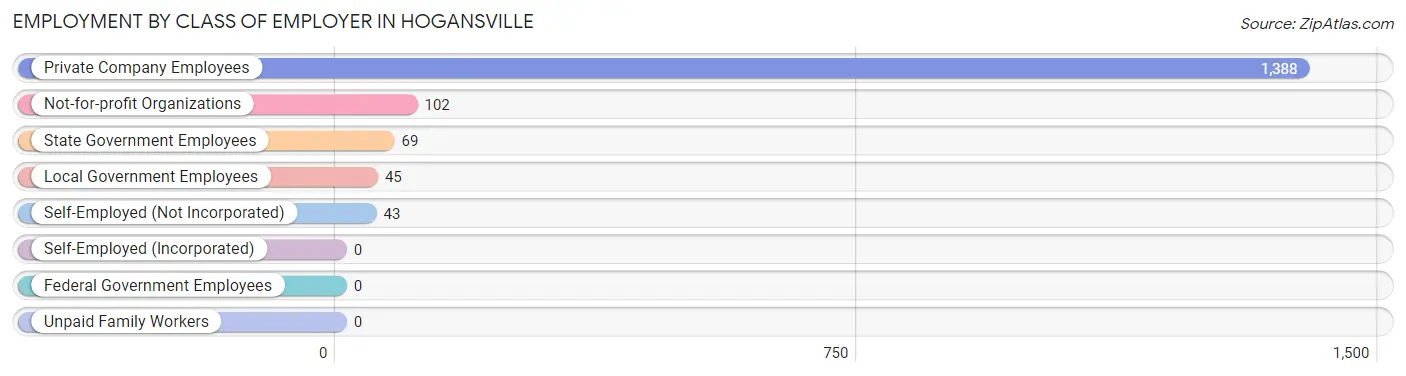
Employment by Class of Employer in Hogansville
Among the 1,647 employed individuals in Hogansville, private company employees (1,388 | 84.3%), not-for-profit organizations (102 | 6.2%), and state government employees (69 | 4.2%) make up the most common classes of employment.
| Employer Class | # Employees | % Employees |
| Private Company Employees | 1,388 | 84.3% |
| Self-Employed (Incorporated) | 0 | 0.0% |
| Self-Employed (Not Incorporated) | 43 | 2.6% |
| Not-for-profit Organizations | 102 | 6.2% |
| Local Government Employees | 45 | 2.7% |
| State Government Employees | 69 | 4.2% |
| Federal Government Employees | 0 | 0.0% |
| Unpaid Family Workers | 0 | 0.0% |
| Total | 1,647 | 100.0% |
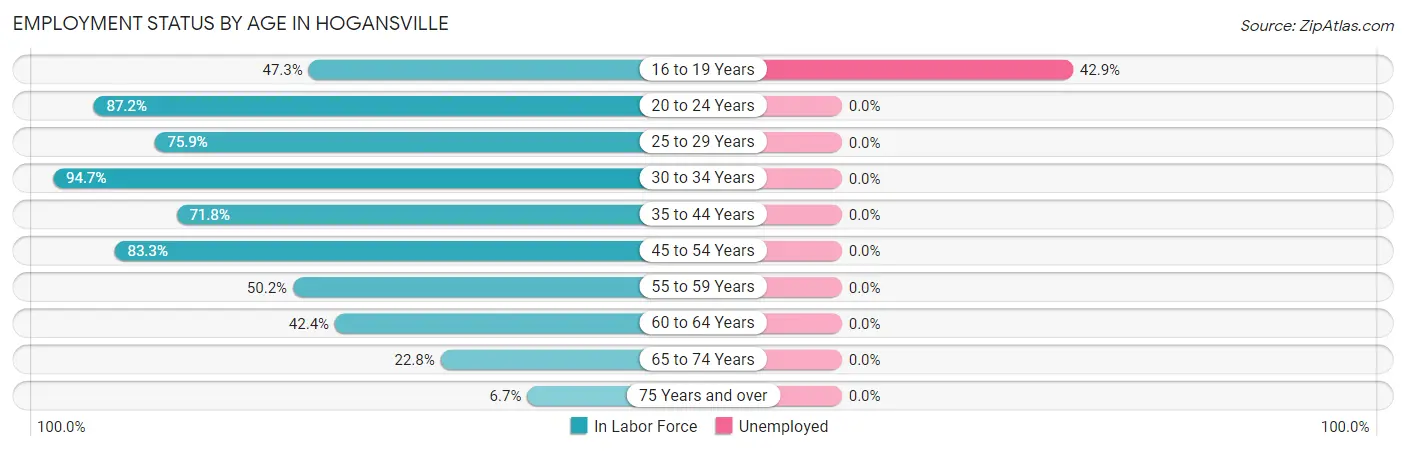
Employment Status by Age in Hogansville
According to the labor force statistics for Hogansville, out of the total population over 16 years of age (2,764), 61.0% or 1,686 individuals are in the labor force, with 0.9% or 15 of them unemployed. The age group with the highest labor force participation rate is 30 to 34 years, with 94.7% or 266 individuals in the labor force. Within the labor force, the 16 to 19 years age range has the highest percentage of unemployed individuals, with 42.9% or 15 of them being unemployed.
| Age Bracket | In Labor Force | Unemployed |
| 16 to 19 Years | 35 (47.3%) | 15 (42.9%) |
| 20 to 24 Years | 355 (87.2%) | 0 (0.0%) |
| 25 to 29 Years | 224 (75.9%) | 0 (0.0%) |
| 30 to 34 Years | 266 (94.7%) | 0 (0.0%) |
| 35 to 44 Years | 153 (71.8%) | 0 (0.0%) |
| 45 to 54 Years | 234 (83.3%) | 0 (0.0%) |
| 55 to 59 Years | 149 (50.2%) | 0 (0.0%) |
| 60 to 64 Years | 180 (42.4%) | 0 (0.0%) |
| 65 to 74 Years | 81 (22.8%) | 0 (0.0%) |
| 75 Years and over | 9 (6.7%) | 0 (0.0%) |
| Total | 1,686 (61.0%) | 15 (0.9%) |
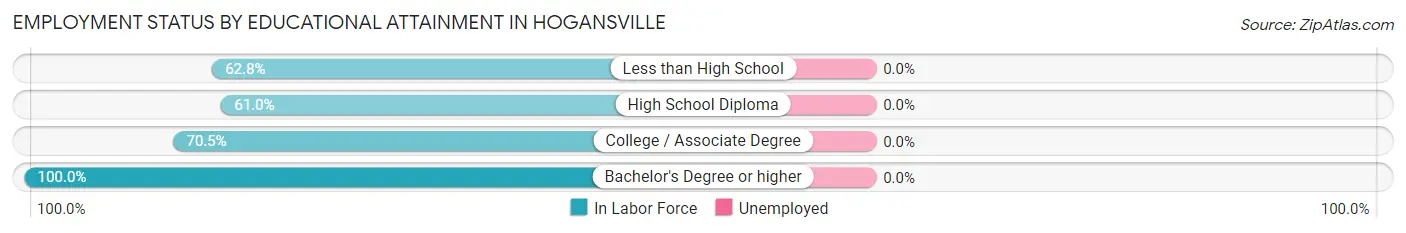
Employment Status by Educational Attainment in Hogansville
| Educational Attainment | In Labor Force | Unemployed |
| Less than High School | 262 (62.8%) | 0 (0.0%) |
| High School Diploma | 412 (61.0%) | 0 (0.0%) |
| College / Associate Degree | 402 (70.5%) | 0 (0.0%) |
| Bachelor's Degree or higher | 130 (100.0%) | 0 (0.0%) |
| Total | 1,206 (67.3%) | 0 (0.0%) |
Employment Occupations by Sex in Hogansville
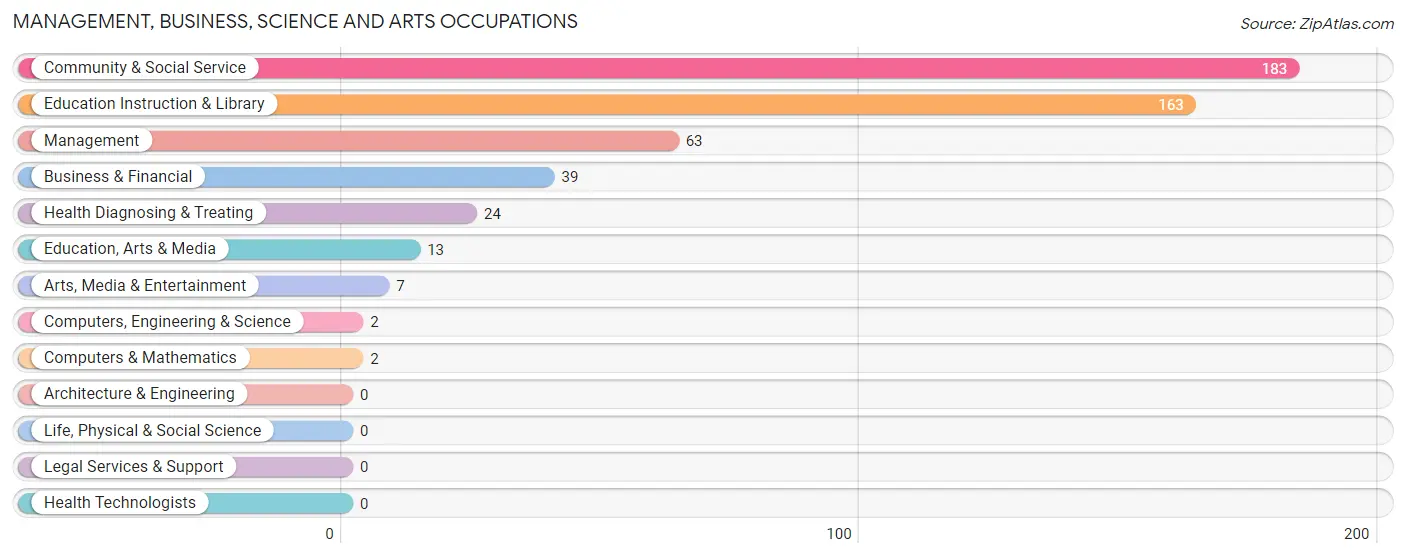
Management, Business, Science and Arts Occupations
The most common Management, Business, Science and Arts occupations in Hogansville are Community & Social Service (183 | 11.0%), Education Instruction & Library (163 | 9.8%), Management (63 | 3.8%), Business & Financial (39 | 2.3%), and Health Diagnosing & Treating (24 | 1.4%).
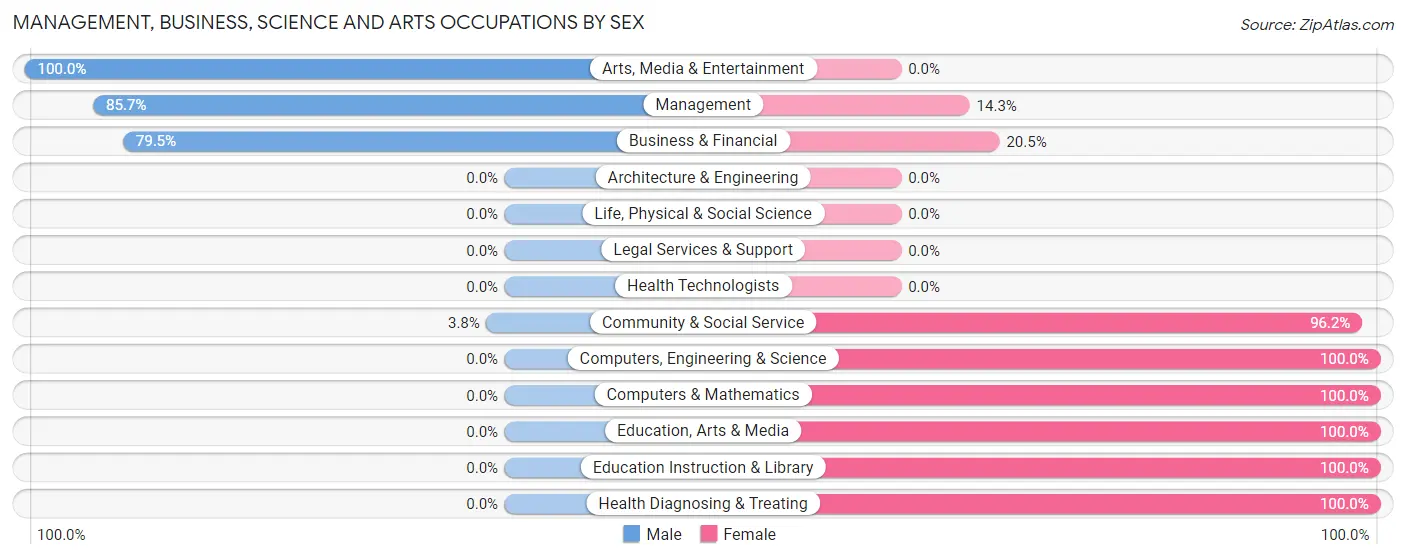
Management, Business, Science and Arts Occupations by Sex
Within the Management, Business, Science and Arts occupations in Hogansville, the most male-oriented occupations are Arts, Media & Entertainment (100.0%), Management (85.7%), and Business & Financial (79.5%), while the most female-oriented occupations are Computers, Engineering & Science (100.0%), Computers & Mathematics (100.0%), and Education, Arts & Media (100.0%).
| Occupation | Male | Female |
| Management | 54 (85.7%) | 9 (14.3%) |
| Business & Financial | 31 (79.5%) | 8 (20.5%) |
| Computers, Engineering & Science | 0 (0.0%) | 2 (100.0%) |
| Computers & Mathematics | 0 (0.0%) | 2 (100.0%) |
| Architecture & Engineering | 0 (0.0%) | 0 (0.0%) |
| Life, Physical & Social Science | 0 (0.0%) | 0 (0.0%) |
| Community & Social Service | 7 (3.8%) | 176 (96.2%) |
| Education, Arts & Media | 0 (0.0%) | 13 (100.0%) |
| Legal Services & Support | 0 (0.0%) | 0 (0.0%) |
| Education Instruction & Library | 0 (0.0%) | 163 (100.0%) |
| Arts, Media & Entertainment | 7 (100.0%) | 0 (0.0%) |
| Health Diagnosing & Treating | 0 (0.0%) | 24 (100.0%) |
| Health Technologists | 0 (0.0%) | 0 (0.0%) |
| Total (Category) | 92 (29.6%) | 219 (70.4%) |
| Total (Overall) | 814 (48.7%) | 857 (51.3%) |
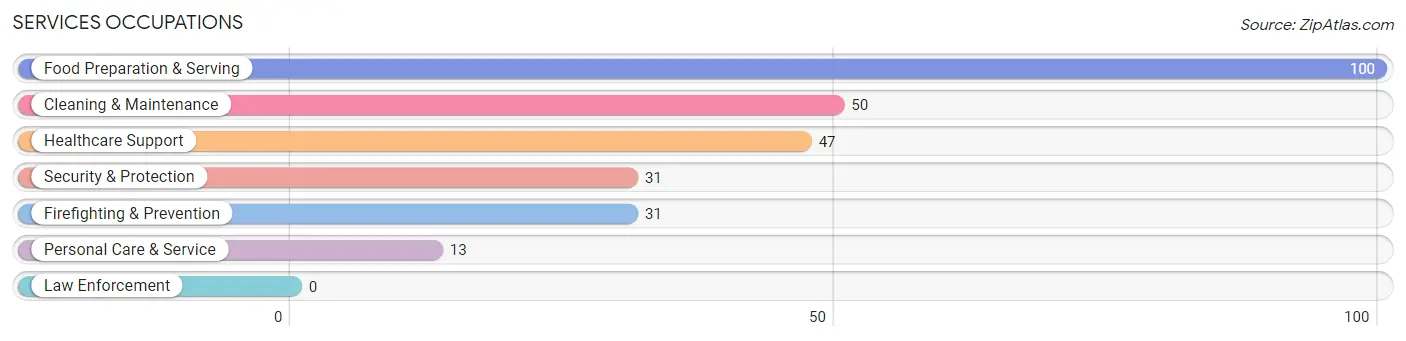
Services Occupations
The most common Services occupations in Hogansville are Food Preparation & Serving (100 | 6.0%), Cleaning & Maintenance (50 | 3.0%), Healthcare Support (47 | 2.8%), Security & Protection (31 | 1.9%), and Firefighting & Prevention (31 | 1.9%).
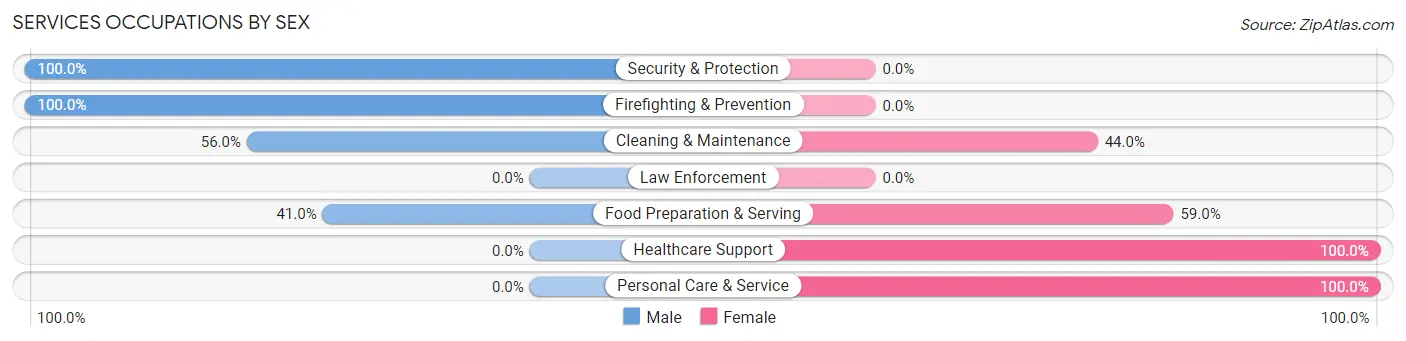
Services Occupations by Sex
Within the Services occupations in Hogansville, the most male-oriented occupations are Security & Protection (100.0%), Firefighting & Prevention (100.0%), and Cleaning & Maintenance (56.0%), while the most female-oriented occupations are Healthcare Support (100.0%), Personal Care & Service (100.0%), and Food Preparation & Serving (59.0%).
| Occupation | Male | Female |
| Healthcare Support | 0 (0.0%) | 47 (100.0%) |
| Security & Protection | 31 (100.0%) | 0 (0.0%) |
| Firefighting & Prevention | 31 (100.0%) | 0 (0.0%) |
| Law Enforcement | 0 (0.0%) | 0 (0.0%) |
| Food Preparation & Serving | 41 (41.0%) | 59 (59.0%) |
| Cleaning & Maintenance | 28 (56.0%) | 22 (44.0%) |
| Personal Care & Service | 0 (0.0%) | 13 (100.0%) |
| Total (Category) | 100 (41.5%) | 141 (58.5%) |
| Total (Overall) | 814 (48.7%) | 857 (51.3%) |
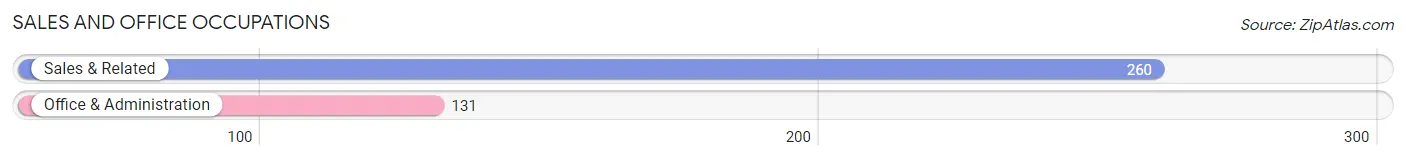
Sales and Office Occupations
The most common Sales and Office occupations in Hogansville are Sales & Related (260 | 15.6%), and Office & Administration (131 | 7.8%).
Sales and Office Occupations by Sex
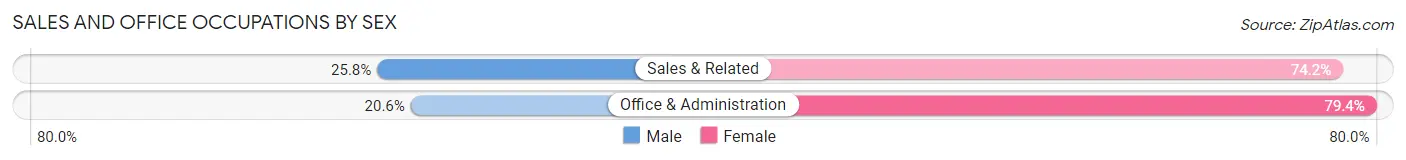
| Occupation | Male | Female |
| Sales & Related | 67 (25.8%) | 193 (74.2%) |
| Office & Administration | 27 (20.6%) | 104 (79.4%) |
| Total (Category) | 94 (24.0%) | 297 (76.0%) |
| Total (Overall) | 814 (48.7%) | 857 (51.3%) |
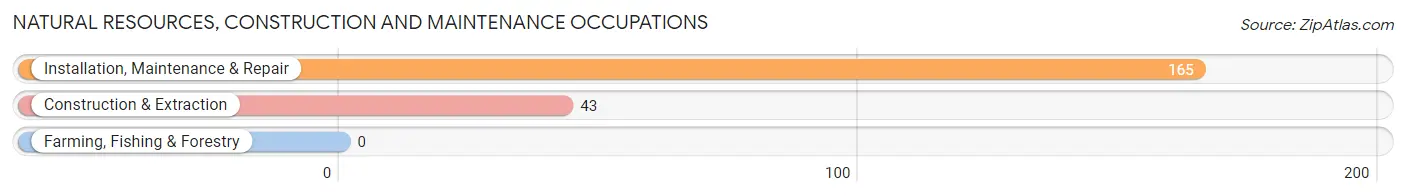
Natural Resources, Construction and Maintenance Occupations
The most common Natural Resources, Construction and Maintenance occupations in Hogansville are Installation, Maintenance & Repair (165 | 9.9%), and Construction & Extraction (43 | 2.6%).
Natural Resources, Construction and Maintenance Occupations by Sex
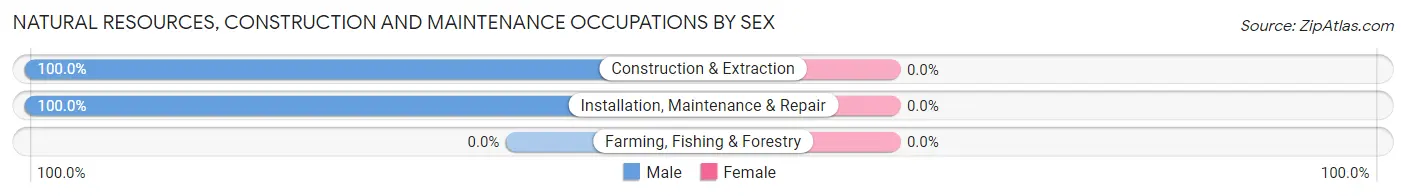
| Occupation | Male | Female |
| Farming, Fishing & Forestry | 0 (0.0%) | 0 (0.0%) |
| Construction & Extraction | 43 (100.0%) | 0 (0.0%) |
| Installation, Maintenance & Repair | 165 (100.0%) | 0 (0.0%) |
| Total (Category) | 208 (100.0%) | 0 (0.0%) |
| Total (Overall) | 814 (48.7%) | 857 (51.3%) |
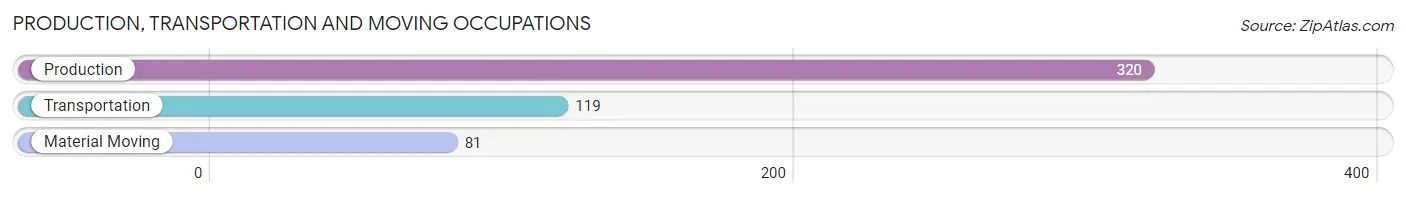
Production, Transportation and Moving Occupations
The most common Production, Transportation and Moving occupations in Hogansville are Production (320 | 19.2%), Transportation (119 | 7.1%), and Material Moving (81 | 4.9%).
Production, Transportation and Moving Occupations by Sex
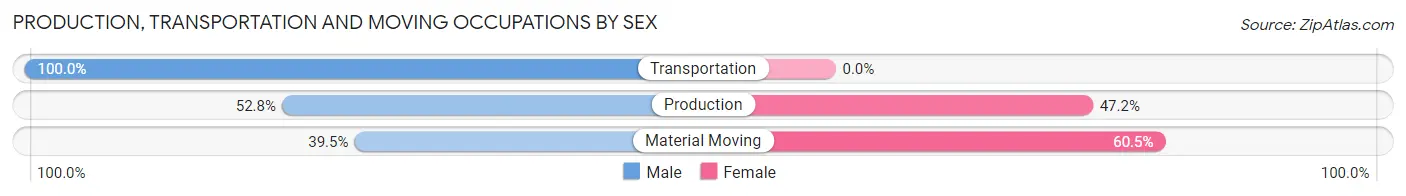
| Occupation | Male | Female |
| Production | 169 (52.8%) | 151 (47.2%) |
| Transportation | 119 (100.0%) | 0 (0.0%) |
| Material Moving | 32 (39.5%) | 49 (60.5%) |
| Total (Category) | 320 (61.5%) | 200 (38.5%) |
| Total (Overall) | 814 (48.7%) | 857 (51.3%) |
Employment Industries by Sex in Hogansville
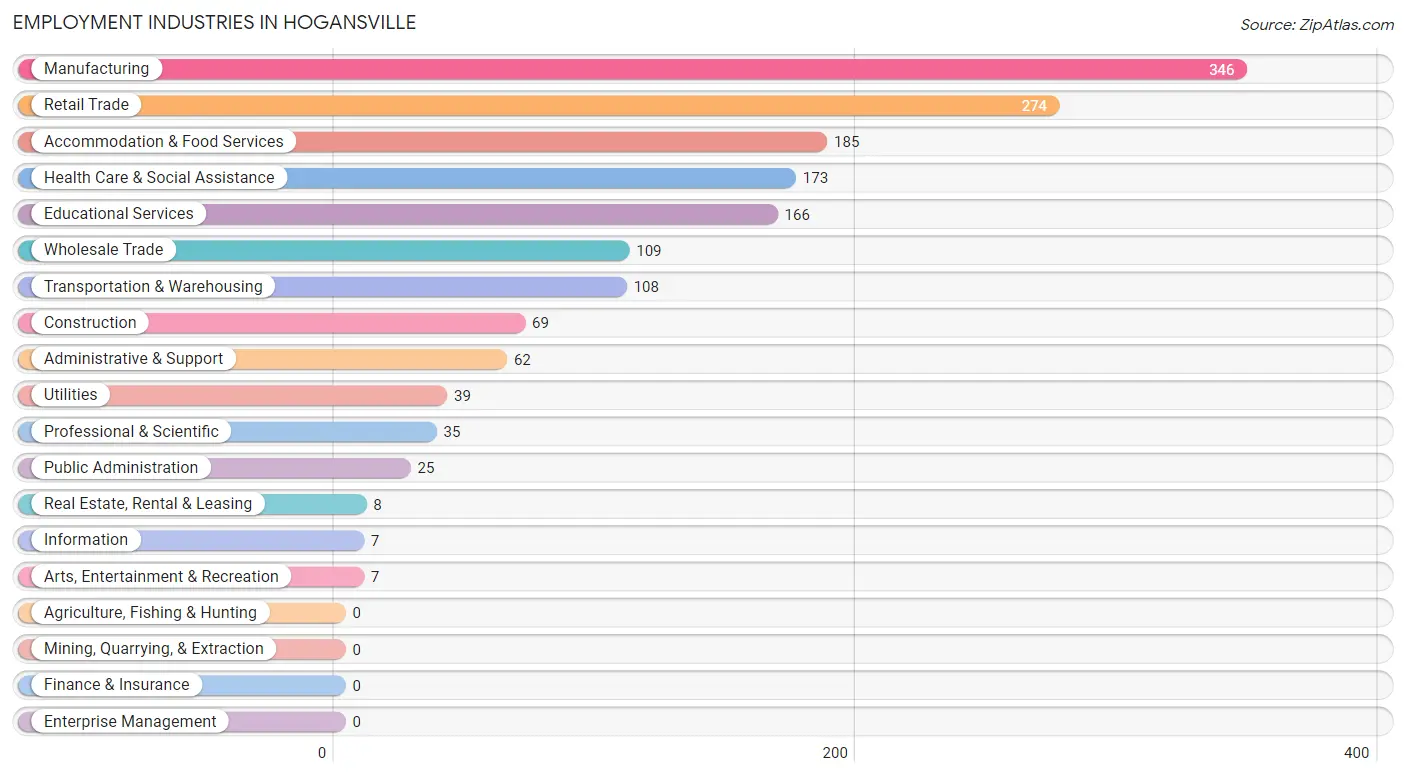
Employment Industries in Hogansville
The major employment industries in Hogansville include Manufacturing (346 | 20.7%), Retail Trade (274 | 16.4%), Accommodation & Food Services (185 | 11.1%), Health Care & Social Assistance (173 | 10.3%), and Educational Services (166 | 9.9%).
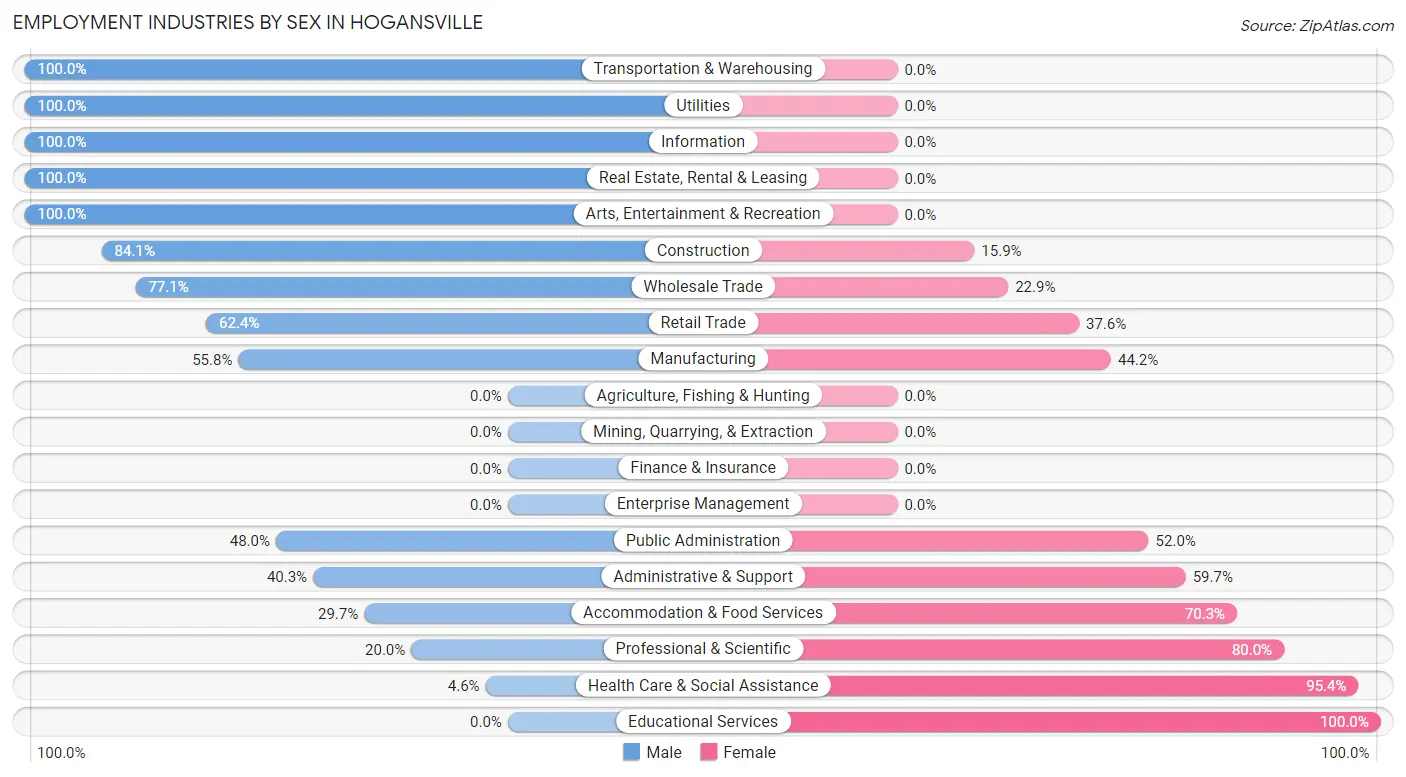
Employment Industries by Sex in Hogansville
The Hogansville industries that see more men than women are Transportation & Warehousing (100.0%), Utilities (100.0%), and Information (100.0%), whereas the industries that tend to have a higher number of women are Educational Services (100.0%), Health Care & Social Assistance (95.4%), and Professional & Scientific (80.0%).
| Industry | Male | Female |
| Agriculture, Fishing & Hunting | 0 (0.0%) | 0 (0.0%) |
| Mining, Quarrying, & Extraction | 0 (0.0%) | 0 (0.0%) |
| Construction | 58 (84.1%) | 11 (15.9%) |
| Manufacturing | 193 (55.8%) | 153 (44.2%) |
| Wholesale Trade | 84 (77.1%) | 25 (22.9%) |
| Retail Trade | 171 (62.4%) | 103 (37.6%) |
| Transportation & Warehousing | 108 (100.0%) | 0 (0.0%) |
| Utilities | 39 (100.0%) | 0 (0.0%) |
| Information | 7 (100.0%) | 0 (0.0%) |
| Finance & Insurance | 0 (0.0%) | 0 (0.0%) |
| Real Estate, Rental & Leasing | 8 (100.0%) | 0 (0.0%) |
| Professional & Scientific | 7 (20.0%) | 28 (80.0%) |
| Enterprise Management | 0 (0.0%) | 0 (0.0%) |
| Administrative & Support | 25 (40.3%) | 37 (59.7%) |
| Educational Services | 0 (0.0%) | 166 (100.0%) |
| Health Care & Social Assistance | 8 (4.6%) | 165 (95.4%) |
| Arts, Entertainment & Recreation | 7 (100.0%) | 0 (0.0%) |
| Accommodation & Food Services | 55 (29.7%) | 130 (70.3%) |
| Public Administration | 12 (48.0%) | 13 (52.0%) |
| Total | 814 (48.7%) | 857 (51.3%) |
Education in Hogansville
School Enrollment in Hogansville
The most common levels of schooling among the 428 students in Hogansville are college / undergraduate (137 | 32.0%), middle school (110 | 25.7%), and elementary school (82 | 19.2%).
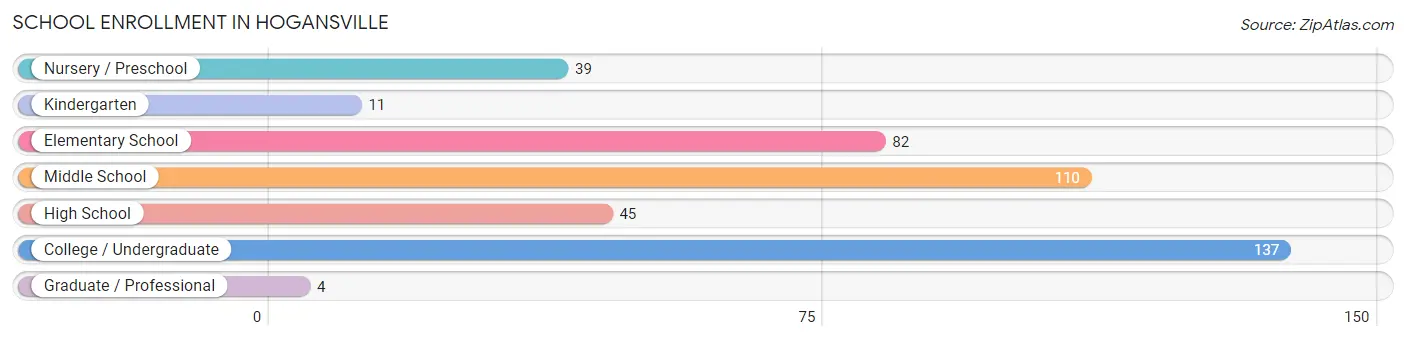
| School Level | # Students | % Students |
| Nursery / Preschool | 39 | 9.1% |
| Kindergarten | 11 | 2.6% |
| Elementary School | 82 | 19.2% |
| Middle School | 110 | 25.7% |
| High School | 45 | 10.5% |
| College / Undergraduate | 137 | 32.0% |
| Graduate / Professional | 4 | 0.9% |
| Total | 428 | 100.0% |
School Enrollment by Age by Funding Source in Hogansville
Out of a total of 428 students who are enrolled in schools in Hogansville, 9 (2.1%) attend a private institution, while the remaining 419 (97.9%) are enrolled in public schools. The age group of 35 years and over has the highest likelihood of being enrolled in private schools, with 6 (17.1% in the age bracket) enrolled. Conversely, the age group of 3 to 4 year olds has the lowest likelihood of being enrolled in a private school, with 39 (100.0% in the age bracket) attending a public institution.
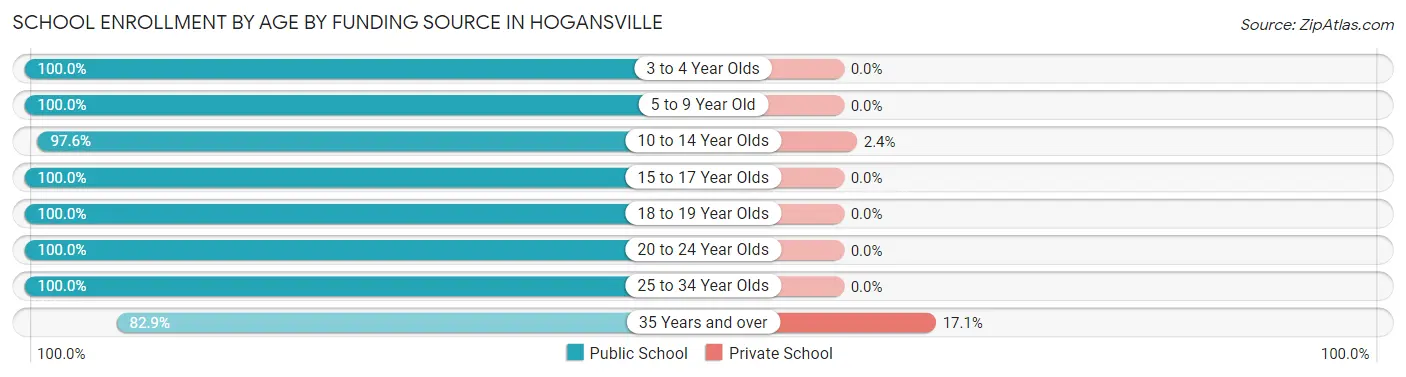
| Age Bracket | Public School | Private School |
| 3 to 4 Year Olds | 39 (100.0%) | 0 (0.0%) |
| 5 to 9 Year Old | 82 (100.0%) | 0 (0.0%) |
| 10 to 14 Year Olds | 120 (97.6%) | 3 (2.4%) |
| 15 to 17 Year Olds | 32 (100.0%) | 0 (0.0%) |
| 18 to 19 Year Olds | 5 (100.0%) | 0 (0.0%) |
| 20 to 24 Year Olds | 95 (100.0%) | 0 (0.0%) |
| 25 to 34 Year Olds | 17 (100.0%) | 0 (0.0%) |
| 35 Years and over | 29 (82.9%) | 6 (17.1%) |
| Total | 419 (97.9%) | 9 (2.1%) |
Educational Attainment by Field of Study in Hogansville
Business (102 | 50.0%), education (67 | 32.8%), literature & languages (14 | 6.9%), multidisciplinary studies (9 | 4.4%), and arts & humanities (8 | 3.9%) are the most common fields of study among 204 individuals in Hogansville who have obtained a bachelor's degree or higher.
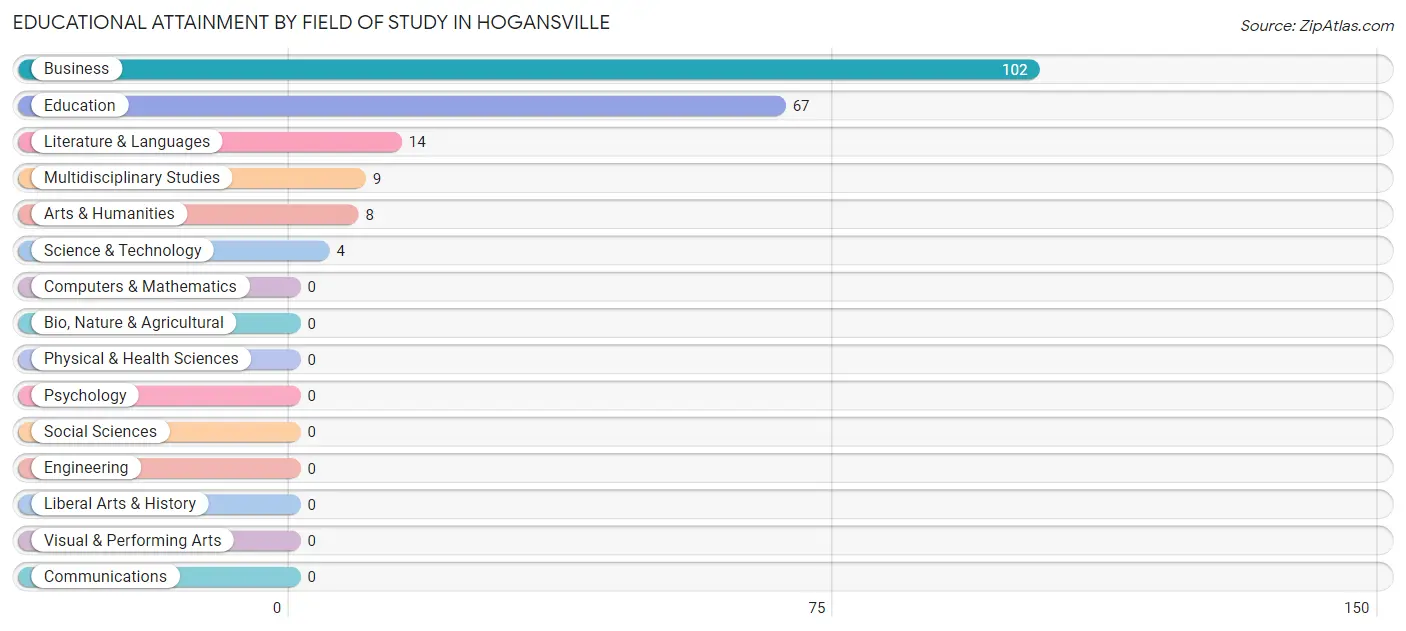
| Field of Study | # Graduates | % Graduates |
| Computers & Mathematics | 0 | 0.0% |
| Bio, Nature & Agricultural | 0 | 0.0% |
| Physical & Health Sciences | 0 | 0.0% |
| Psychology | 0 | 0.0% |
| Social Sciences | 0 | 0.0% |
| Engineering | 0 | 0.0% |
| Multidisciplinary Studies | 9 | 4.4% |
| Science & Technology | 4 | 2.0% |
| Business | 102 | 50.0% |
| Education | 67 | 32.8% |
| Literature & Languages | 14 | 6.9% |
| Liberal Arts & History | 0 | 0.0% |
| Visual & Performing Arts | 0 | 0.0% |
| Communications | 0 | 0.0% |
| Arts & Humanities | 8 | 3.9% |
| Total | 204 | 100.0% |
Transportation & Commute in Hogansville
Vehicle Availability by Sex in Hogansville
The most prevalent vehicle ownership categories in Hogansville are males with 2 vehicles (338, accounting for 42.4%) and females with 2 vehicles (234, making up 39.8%).
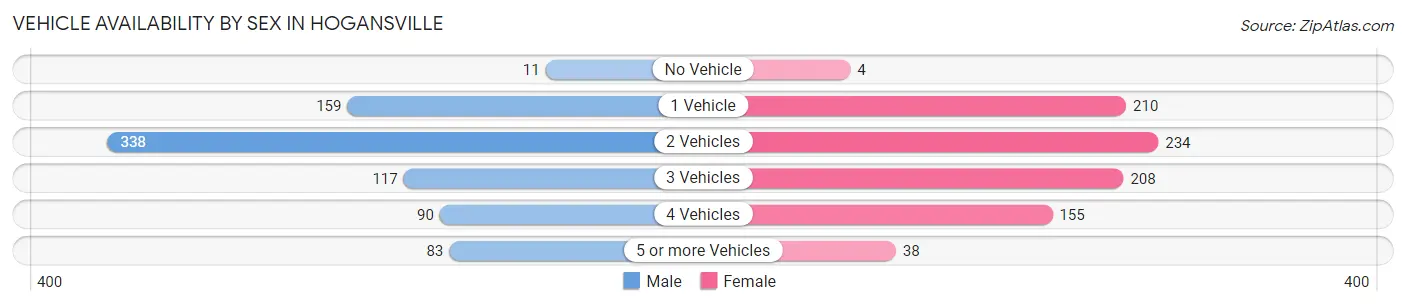
| Vehicles Available | Male | Female |
| No Vehicle | 11 (1.4%) | 4 (0.5%) |
| 1 Vehicle | 159 (19.9%) | 210 (24.7%) |
| 2 Vehicles | 338 (42.4%) | 234 (27.6%) |
| 3 Vehicles | 117 (14.7%) | 208 (24.5%) |
| 4 Vehicles | 90 (11.3%) | 155 (18.3%) |
| 5 or more Vehicles | 83 (10.4%) | 38 (4.5%) |
| Total | 798 (100.0%) | 849 (100.0%) |
Commute Time in Hogansville
The most frequently occuring commute durations in Hogansville are 20 to 24 minutes (479 commuters, 29.6%), 30 to 34 minutes (359 commuters, 22.2%), and 15 to 19 minutes (167 commuters, 10.3%).
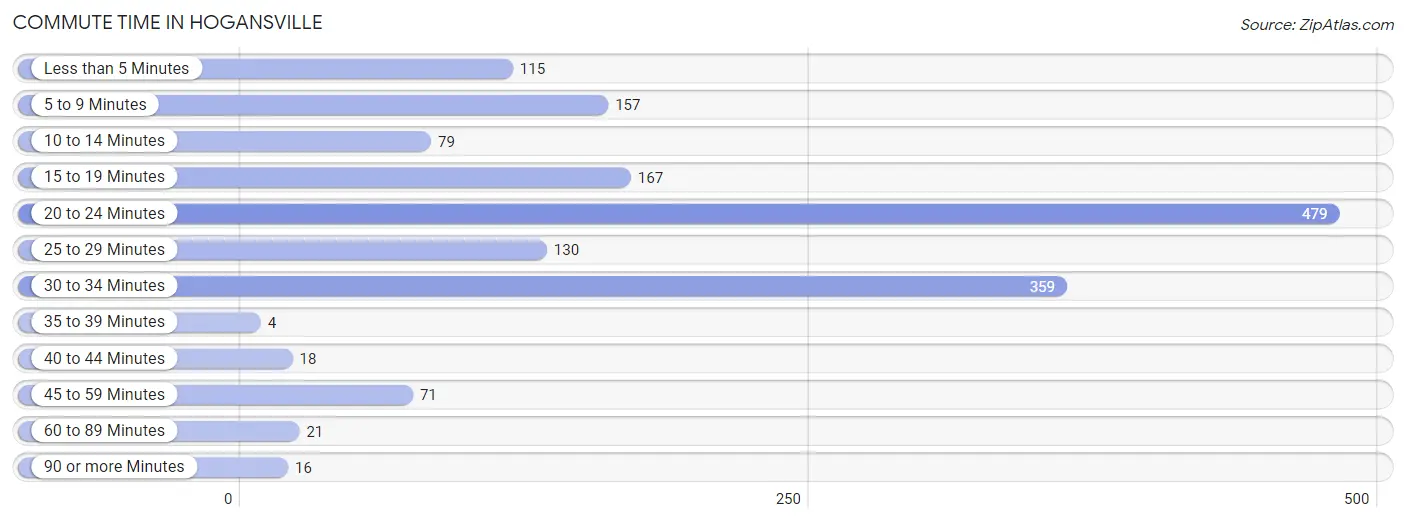
| Commute Time | # Commuters | % Commuters |
| Less than 5 Minutes | 115 | 7.1% |
| 5 to 9 Minutes | 157 | 9.7% |
| 10 to 14 Minutes | 79 | 4.9% |
| 15 to 19 Minutes | 167 | 10.3% |
| 20 to 24 Minutes | 479 | 29.6% |
| 25 to 29 Minutes | 130 | 8.0% |
| 30 to 34 Minutes | 359 | 22.2% |
| 35 to 39 Minutes | 4 | 0.3% |
| 40 to 44 Minutes | 18 | 1.1% |
| 45 to 59 Minutes | 71 | 4.4% |
| 60 to 89 Minutes | 21 | 1.3% |
| 90 or more Minutes | 16 | 1.0% |
Commute Time by Sex in Hogansville
The most common commute times in Hogansville are 20 to 24 minutes (243 commuters, 30.4%) for males and 20 to 24 minutes (236 commuters, 28.8%) for females.
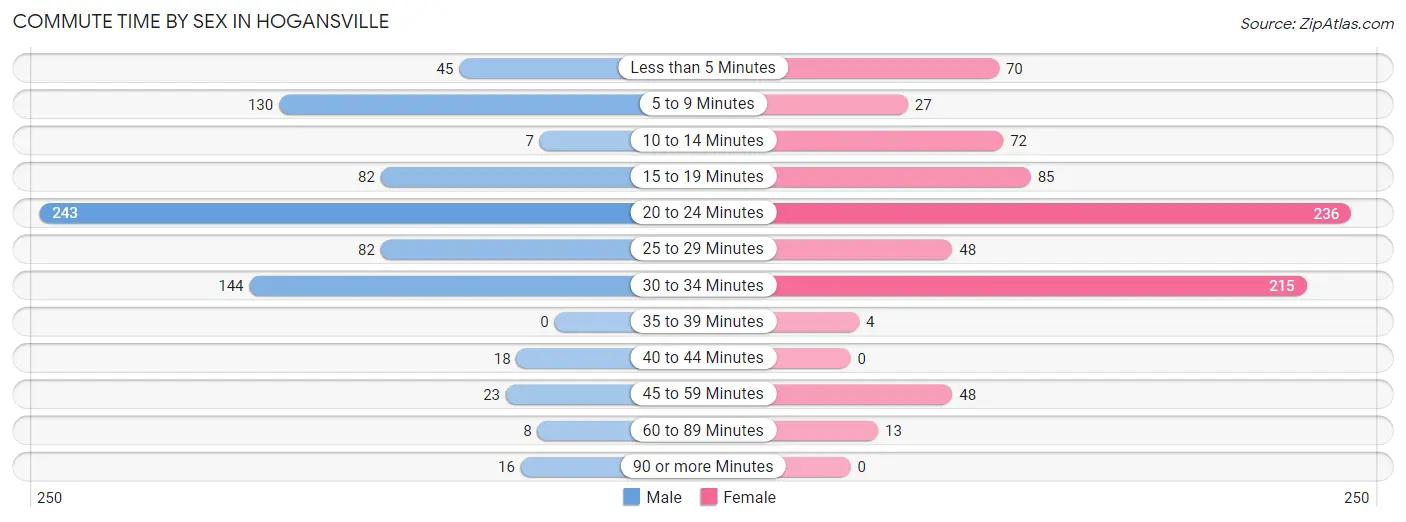
| Commute Time | Male | Female |
| Less than 5 Minutes | 45 (5.6%) | 70 (8.6%) |
| 5 to 9 Minutes | 130 (16.3%) | 27 (3.3%) |
| 10 to 14 Minutes | 7 (0.9%) | 72 (8.8%) |
| 15 to 19 Minutes | 82 (10.3%) | 85 (10.4%) |
| 20 to 24 Minutes | 243 (30.4%) | 236 (28.8%) |
| 25 to 29 Minutes | 82 (10.3%) | 48 (5.9%) |
| 30 to 34 Minutes | 144 (18.0%) | 215 (26.3%) |
| 35 to 39 Minutes | 0 (0.0%) | 4 (0.5%) |
| 40 to 44 Minutes | 18 (2.3%) | 0 (0.0%) |
| 45 to 59 Minutes | 23 (2.9%) | 48 (5.9%) |
| 60 to 89 Minutes | 8 (1.0%) | 13 (1.6%) |
| 90 or more Minutes | 16 (2.0%) | 0 (0.0%) |
Time of Departure to Work by Sex in Hogansville
The most frequent times of departure to work in Hogansville are 12:00 PM to 3:59 PM (133, 16.7%) for males and 6:30 AM to 6:59 AM (146, 17.8%) for females.
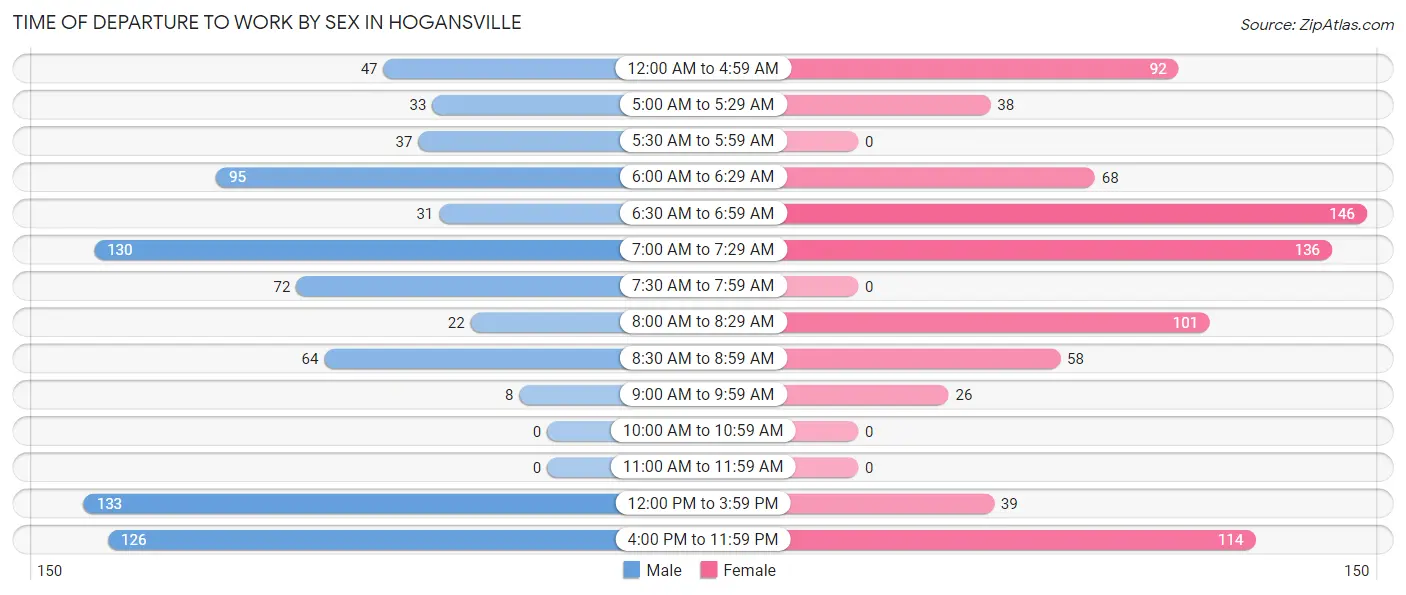
| Time of Departure | Male | Female |
| 12:00 AM to 4:59 AM | 47 (5.9%) | 92 (11.3%) |
| 5:00 AM to 5:29 AM | 33 (4.1%) | 38 (4.6%) |
| 5:30 AM to 5:59 AM | 37 (4.6%) | 0 (0.0%) |
| 6:00 AM to 6:29 AM | 95 (11.9%) | 68 (8.3%) |
| 6:30 AM to 6:59 AM | 31 (3.9%) | 146 (17.8%) |
| 7:00 AM to 7:29 AM | 130 (16.3%) | 136 (16.6%) |
| 7:30 AM to 7:59 AM | 72 (9.0%) | 0 (0.0%) |
| 8:00 AM to 8:29 AM | 22 (2.8%) | 101 (12.3%) |
| 8:30 AM to 8:59 AM | 64 (8.0%) | 58 (7.1%) |
| 9:00 AM to 9:59 AM | 8 (1.0%) | 26 (3.2%) |
| 10:00 AM to 10:59 AM | 0 (0.0%) | 0 (0.0%) |
| 11:00 AM to 11:59 AM | 0 (0.0%) | 0 (0.0%) |
| 12:00 PM to 3:59 PM | 133 (16.7%) | 39 (4.8%) |
| 4:00 PM to 11:59 PM | 126 (15.8%) | 114 (13.9%) |
| Total | 798 (100.0%) | 818 (100.0%) |
Housing Occupancy in Hogansville
Occupancy by Ownership in Hogansville
Of the total 1,331 dwellings in Hogansville, owner-occupied units account for 670 (50.3%), while renter-occupied units make up 661 (49.7%).
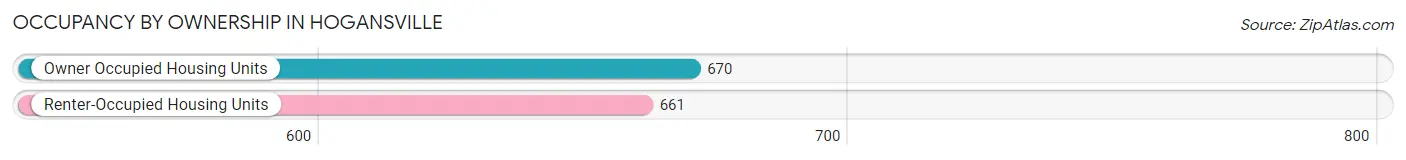
| Occupancy | # Housing Units | % Housing Units |
| Owner Occupied Housing Units | 670 | 50.3% |
| Renter-Occupied Housing Units | 661 | 49.7% |
| Total Occupied Housing Units | 1,331 | 100.0% |
Occupancy by Household Size in Hogansville
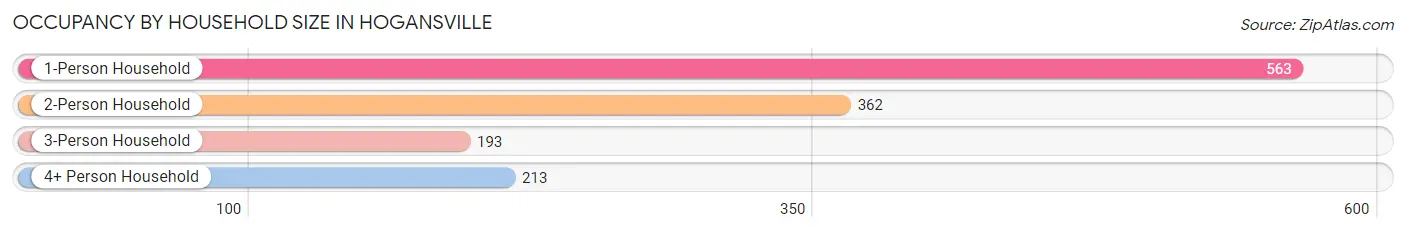
| Household Size | # Housing Units | % Housing Units |
| 1-Person Household | 563 | 42.3% |
| 2-Person Household | 362 | 27.2% |
| 3-Person Household | 193 | 14.5% |
| 4+ Person Household | 213 | 16.0% |
| Total Housing Units | 1,331 | 100.0% |
Occupancy by Ownership by Household Size in Hogansville
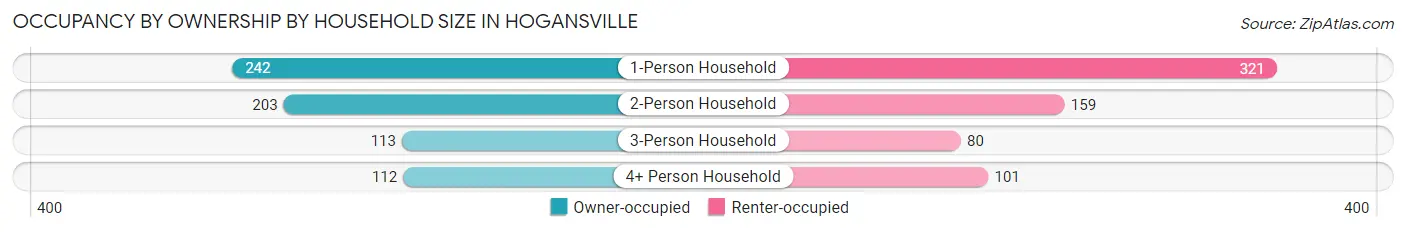
| Household Size | Owner-occupied | Renter-occupied |
| 1-Person Household | 242 (43.0%) | 321 (57.0%) |
| 2-Person Household | 203 (56.1%) | 159 (43.9%) |
| 3-Person Household | 113 (58.6%) | 80 (41.4%) |
| 4+ Person Household | 112 (52.6%) | 101 (47.4%) |
| Total Housing Units | 670 (50.3%) | 661 (49.7%) |
Occupancy by Educational Attainment in Hogansville
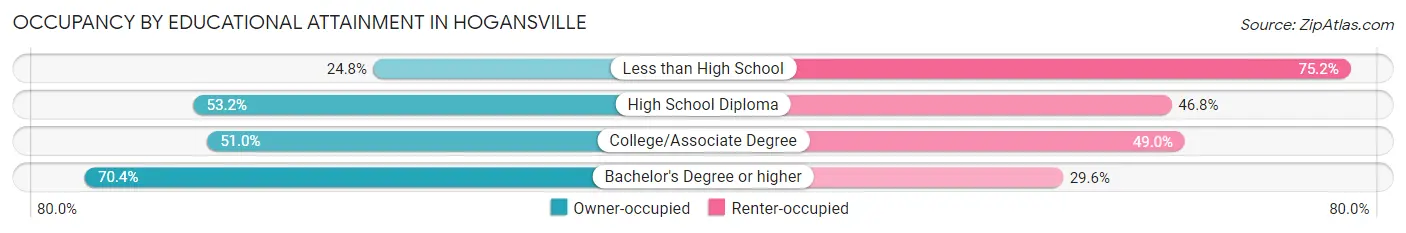
| Household Size | Owner-occupied | Renter-occupied |
| Less than High School | 51 (24.8%) | 155 (75.2%) |
| High School Diploma | 301 (53.2%) | 265 (46.8%) |
| College/Associate Degree | 199 (51.0%) | 191 (49.0%) |
| Bachelor's Degree or higher | 119 (70.4%) | 50 (29.6%) |
Occupancy by Age of Householder in Hogansville
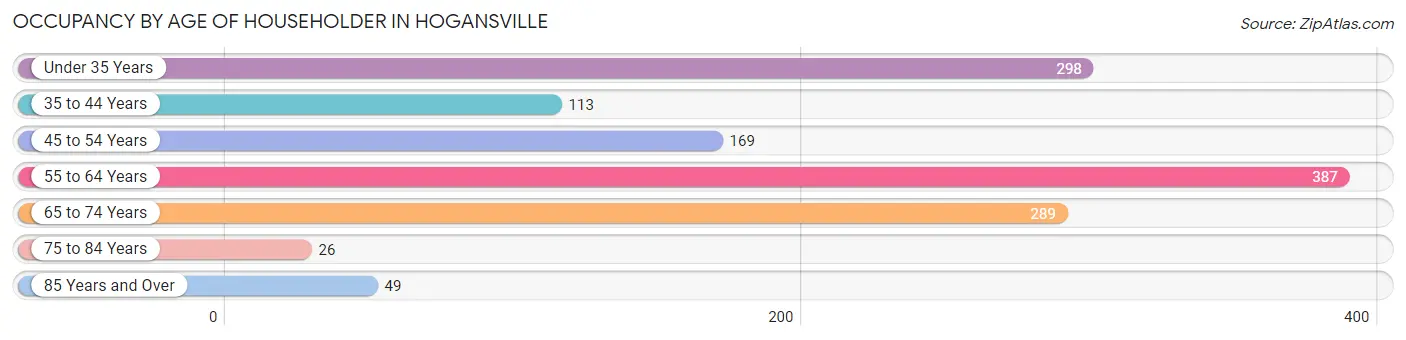
| Age Bracket | # Households | % Households |
| Under 35 Years | 298 | 22.4% |
| 35 to 44 Years | 113 | 8.5% |
| 45 to 54 Years | 169 | 12.7% |
| 55 to 64 Years | 387 | 29.1% |
| 65 to 74 Years | 289 | 21.7% |
| 75 to 84 Years | 26 | 1.9% |
| 85 Years and Over | 49 | 3.7% |
| Total | 1,331 | 100.0% |
Housing Finances in Hogansville
Median Income by Occupancy in Hogansville
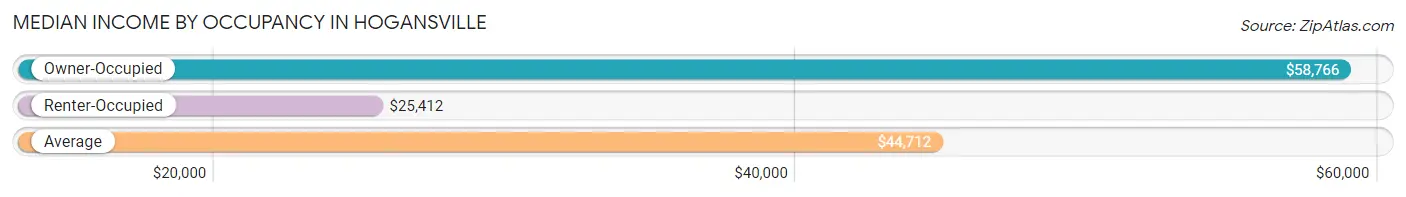
| Occupancy Type | # Households | Median Income |
| Owner-Occupied | 670 (50.3%) | $58,766 |
| Renter-Occupied | 661 (49.7%) | $25,412 |
| Average | 1,331 (100.0%) | $44,712 |
Occupancy by Householder Income Bracket in Hogansville
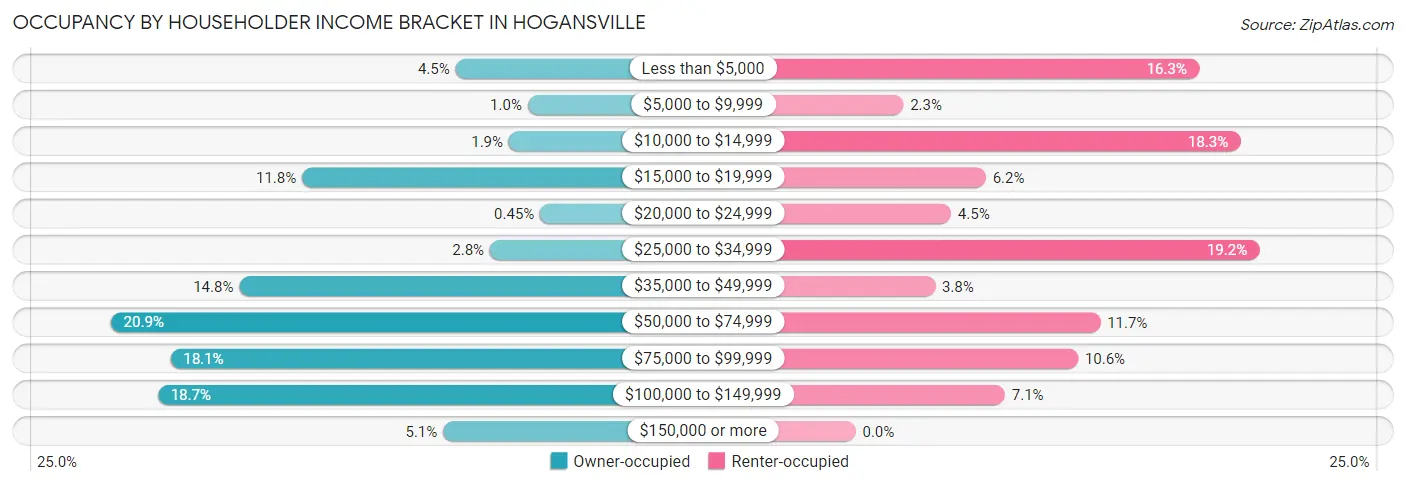
| Income Bracket | Owner-occupied | Renter-occupied |
| Less than $5,000 | 30 (4.5%) | 108 (16.3%) |
| $5,000 to $9,999 | 7 (1.0%) | 15 (2.3%) |
| $10,000 to $14,999 | 13 (1.9%) | 121 (18.3%) |
| $15,000 to $19,999 | 79 (11.8%) | 41 (6.2%) |
| $20,000 to $24,999 | 3 (0.4%) | 30 (4.5%) |
| $25,000 to $34,999 | 19 (2.8%) | 127 (19.2%) |
| $35,000 to $49,999 | 99 (14.8%) | 25 (3.8%) |
| $50,000 to $74,999 | 140 (20.9%) | 77 (11.7%) |
| $75,000 to $99,999 | 121 (18.1%) | 70 (10.6%) |
| $100,000 to $149,999 | 125 (18.7%) | 47 (7.1%) |
| $150,000 or more | 34 (5.1%) | 0 (0.0%) |
| Total | 670 (100.0%) | 661 (100.0%) |
Monthly Housing Cost Tiers in Hogansville
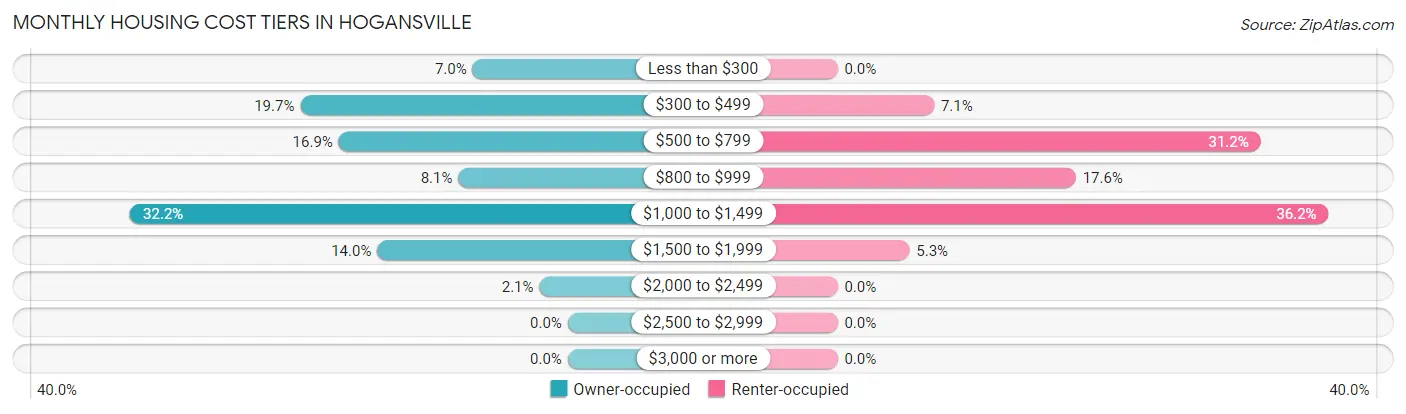
| Monthly Cost | Owner-occupied | Renter-occupied |
| Less than $300 | 47 (7.0%) | 0 (0.0%) |
| $300 to $499 | 132 (19.7%) | 47 (7.1%) |
| $500 to $799 | 113 (16.9%) | 206 (31.2%) |
| $800 to $999 | 54 (8.1%) | 116 (17.5%) |
| $1,000 to $1,499 | 216 (32.2%) | 239 (36.2%) |
| $1,500 to $1,999 | 94 (14.0%) | 35 (5.3%) |
| $2,000 to $2,499 | 14 (2.1%) | 0 (0.0%) |
| $2,500 to $2,999 | 0 (0.0%) | 0 (0.0%) |
| $3,000 or more | 0 (0.0%) | 0 (0.0%) |
| Total | 670 (100.0%) | 661 (100.0%) |
Physical Housing Characteristics in Hogansville
Housing Structures in Hogansville
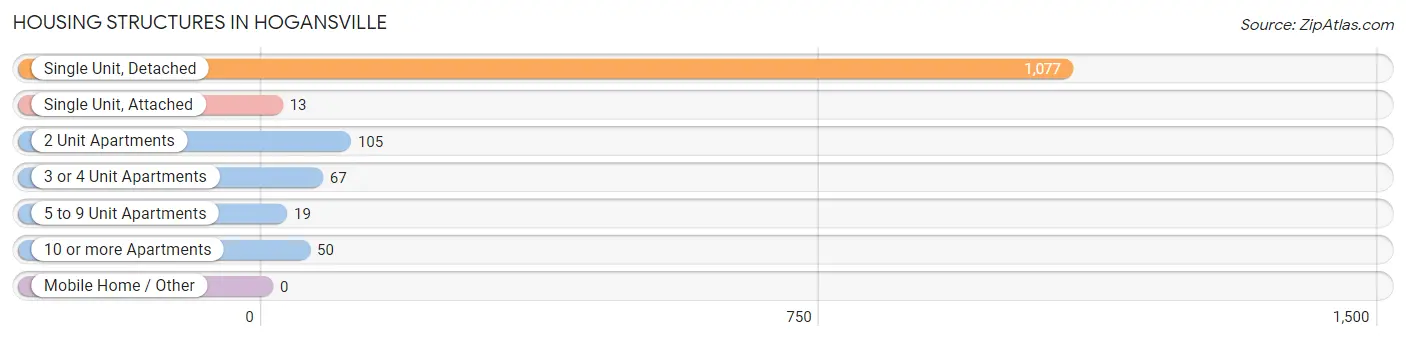
| Structure Type | # Housing Units | % Housing Units |
| Single Unit, Detached | 1,077 | 80.9% |
| Single Unit, Attached | 13 | 1.0% |
| 2 Unit Apartments | 105 | 7.9% |
| 3 or 4 Unit Apartments | 67 | 5.0% |
| 5 to 9 Unit Apartments | 19 | 1.4% |
| 10 or more Apartments | 50 | 3.8% |
| Mobile Home / Other | 0 | 0.0% |
| Total | 1,331 | 100.0% |
Housing Structures by Occupancy in Hogansville
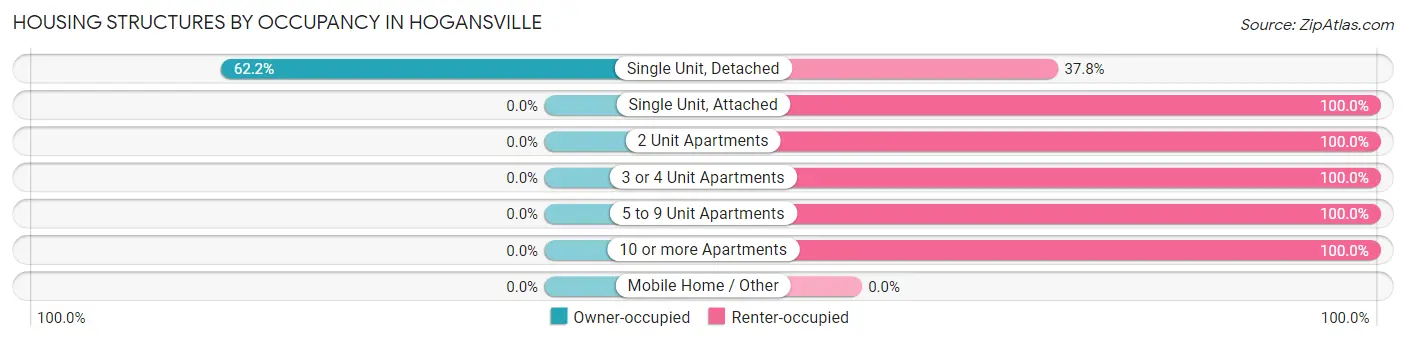
| Structure Type | Owner-occupied | Renter-occupied |
| Single Unit, Detached | 670 (62.2%) | 407 (37.8%) |
| Single Unit, Attached | 0 (0.0%) | 13 (100.0%) |
| 2 Unit Apartments | 0 (0.0%) | 105 (100.0%) |
| 3 or 4 Unit Apartments | 0 (0.0%) | 67 (100.0%) |
| 5 to 9 Unit Apartments | 0 (0.0%) | 19 (100.0%) |
| 10 or more Apartments | 0 (0.0%) | 50 (100.0%) |
| Mobile Home / Other | 0 (0.0%) | 0 (0.0%) |
| Total | 670 (50.3%) | 661 (49.7%) |
Housing Structures by Number of Rooms in Hogansville
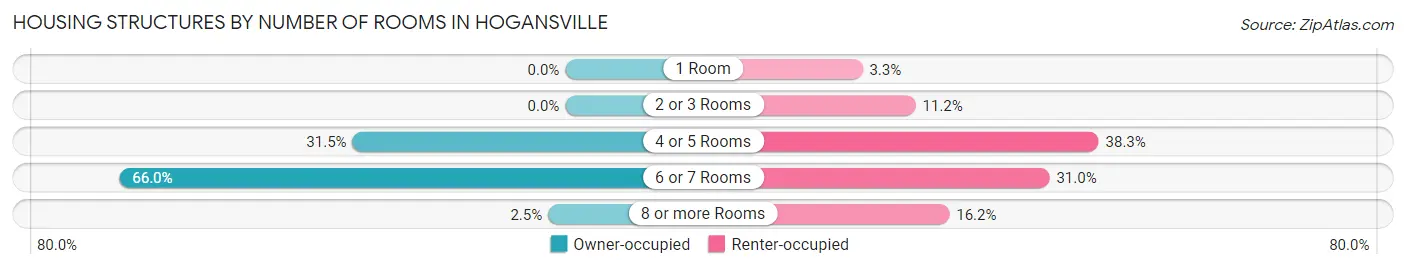
| Number of Rooms | Owner-occupied | Renter-occupied |
| 1 Room | 0 (0.0%) | 22 (3.3%) |
| 2 or 3 Rooms | 0 (0.0%) | 74 (11.2%) |
| 4 or 5 Rooms | 211 (31.5%) | 253 (38.3%) |
| 6 or 7 Rooms | 442 (66.0%) | 205 (31.0%) |
| 8 or more Rooms | 17 (2.5%) | 107 (16.2%) |
| Total | 670 (100.0%) | 661 (100.0%) |
Housing Structure by Heating Type in Hogansville
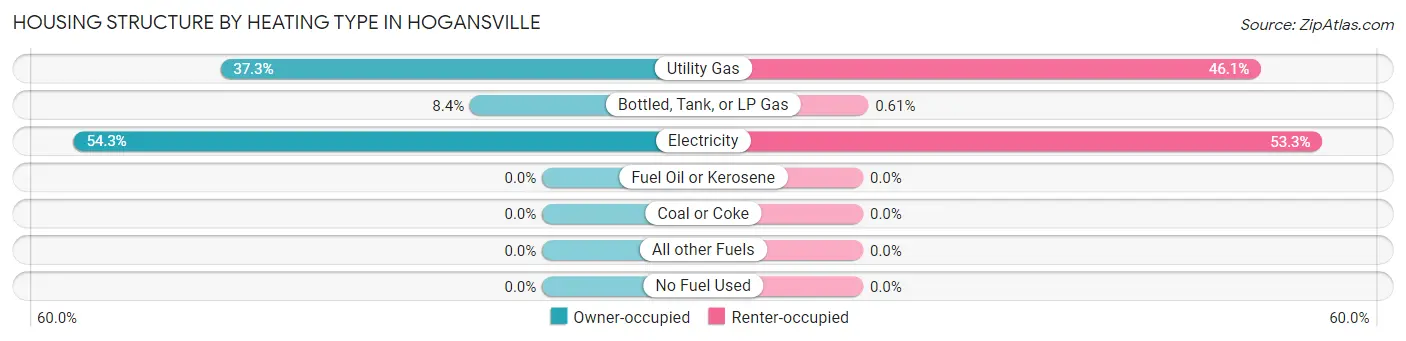
| Heating Type | Owner-occupied | Renter-occupied |
| Utility Gas | 250 (37.3%) | 305 (46.1%) |
| Bottled, Tank, or LP Gas | 56 (8.4%) | 4 (0.6%) |
| Electricity | 364 (54.3%) | 352 (53.2%) |
| Fuel Oil or Kerosene | 0 (0.0%) | 0 (0.0%) |
| Coal or Coke | 0 (0.0%) | 0 (0.0%) |
| All other Fuels | 0 (0.0%) | 0 (0.0%) |
| No Fuel Used | 0 (0.0%) | 0 (0.0%) |
| Total | 670 (100.0%) | 661 (100.0%) |
Household Vehicle Usage in Hogansville
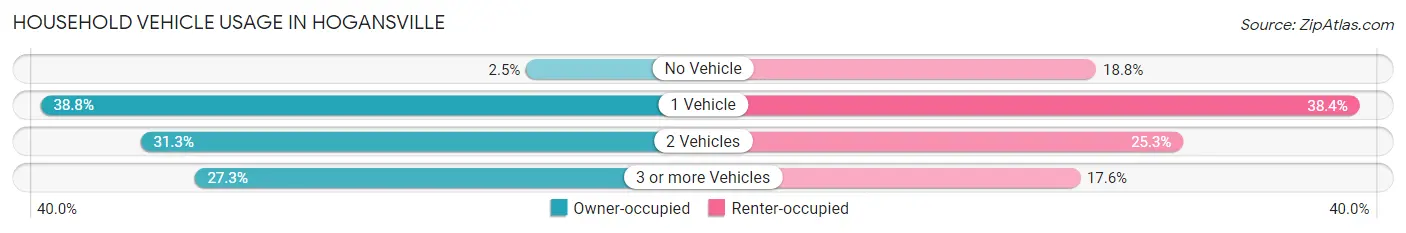
| Vehicles per Household | Owner-occupied | Renter-occupied |
| No Vehicle | 17 (2.5%) | 124 (18.8%) |
| 1 Vehicle | 260 (38.8%) | 254 (38.4%) |
| 2 Vehicles | 210 (31.3%) | 167 (25.3%) |
| 3 or more Vehicles | 183 (27.3%) | 116 (17.5%) |
| Total | 670 (100.0%) | 661 (100.0%) |
Real Estate & Mortgages in Hogansville
Real Estate and Mortgage Overview in Hogansville
| Characteristic | Without Mortgage | With Mortgage |
| Housing Units | 266 | 404 |
| Median Property Value | $130,800 | $156,000 |
| Median Household Income | - | - |
| Monthly Housing Costs | $453 | $0 |
| Real Estate Taxes | $1,257 | $80 |
Property Value by Mortgage Status in Hogansville
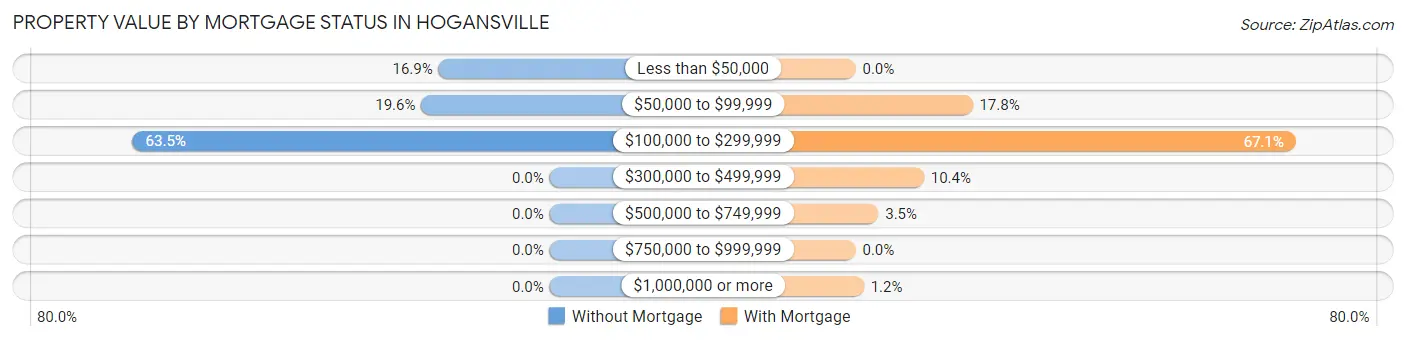
| Property Value | Without Mortgage | With Mortgage |
| Less than $50,000 | 45 (16.9%) | 0 (0.0%) |
| $50,000 to $99,999 | 52 (19.6%) | 72 (17.8%) |
| $100,000 to $299,999 | 169 (63.5%) | 271 (67.1%) |
| $300,000 to $499,999 | 0 (0.0%) | 42 (10.4%) |
| $500,000 to $749,999 | 0 (0.0%) | 14 (3.5%) |
| $750,000 to $999,999 | 0 (0.0%) | 0 (0.0%) |
| $1,000,000 or more | 0 (0.0%) | 5 (1.2%) |
| Total | 266 (100.0%) | 404 (100.0%) |
Household Income by Mortgage Status in Hogansville
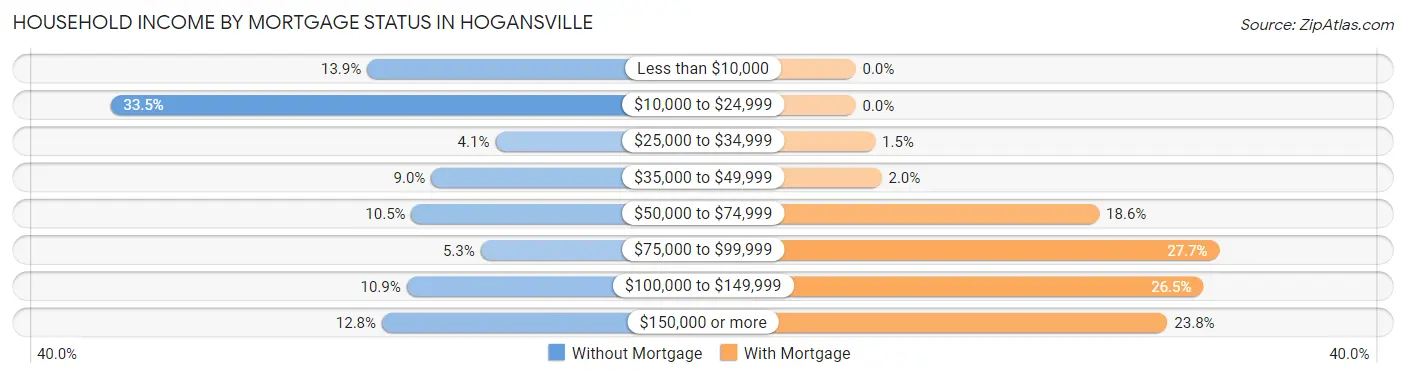
| Household Income | Without Mortgage | With Mortgage |
| Less than $10,000 | 37 (13.9%) | 0 (0.0%) |
| $10,000 to $24,999 | 89 (33.5%) | 0 (0.0%) |
| $25,000 to $34,999 | 11 (4.1%) | 6 (1.5%) |
| $35,000 to $49,999 | 24 (9.0%) | 8 (2.0%) |
| $50,000 to $74,999 | 28 (10.5%) | 75 (18.6%) |
| $75,000 to $99,999 | 14 (5.3%) | 112 (27.7%) |
| $100,000 to $149,999 | 29 (10.9%) | 107 (26.5%) |
| $150,000 or more | 34 (12.8%) | 96 (23.8%) |
| Total | 266 (100.0%) | 404 (100.0%) |
Property Value to Household Income Ratio in Hogansville
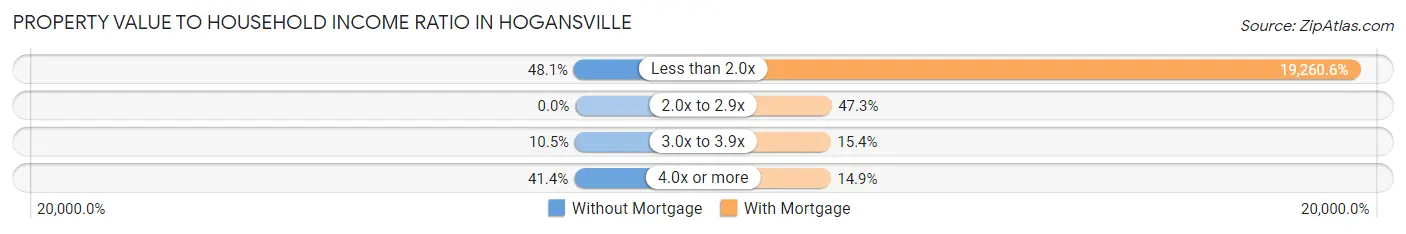
| Value-to-Income Ratio | Without Mortgage | With Mortgage |
| Less than 2.0x | 128 (48.1%) | 77,813 (19,260.6%) |
| 2.0x to 2.9x | 0 (0.0%) | 191 (47.3%) |
| 3.0x to 3.9x | 28 (10.5%) | 62 (15.3%) |
| 4.0x or more | 110 (41.3%) | 60 (14.8%) |
| Total | 266 (100.0%) | 404 (100.0%) |
Real Estate Taxes by Mortgage Status in Hogansville
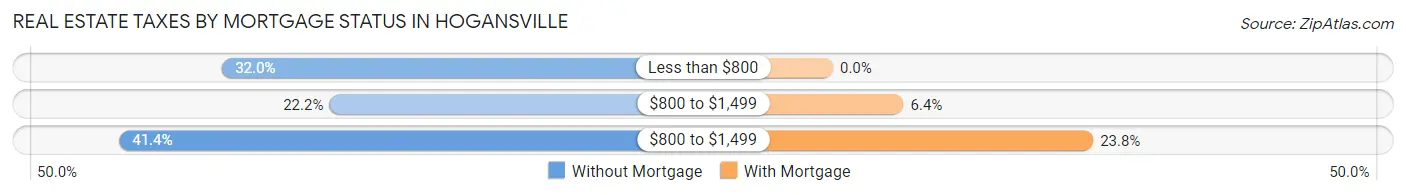
| Property Taxes | Without Mortgage | With Mortgage |
| Less than $800 | 85 (32.0%) | 0 (0.0%) |
| $800 to $1,499 | 59 (22.2%) | 26 (6.4%) |
| $800 to $1,499 | 110 (41.3%) | 96 (23.8%) |
| Total | 266 (100.0%) | 404 (100.0%) |
Health & Disability in Hogansville
Health Insurance Coverage by Age in Hogansville
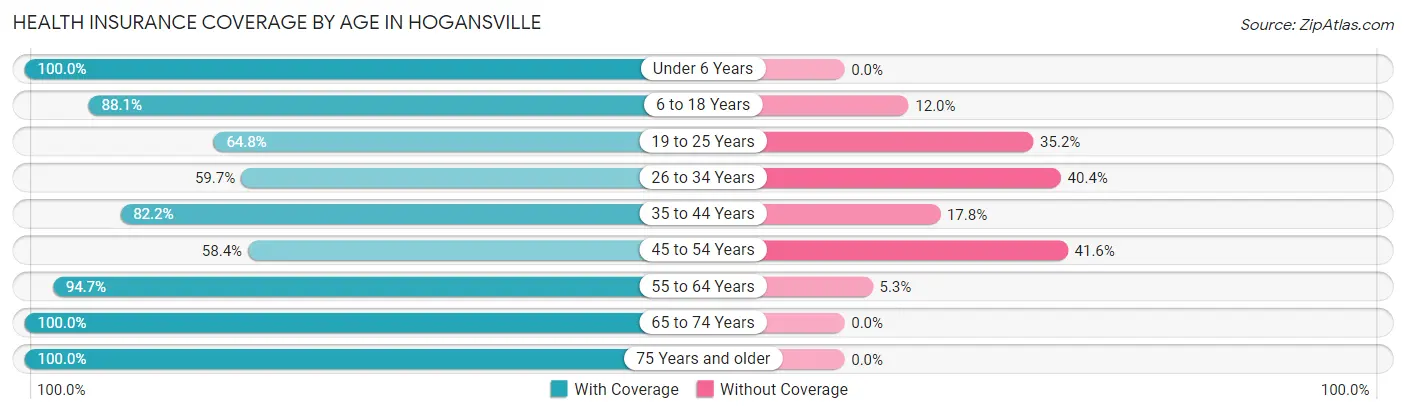
| Age Bracket | With Coverage | Without Coverage |
| Under 6 Years | 252 (100.0%) | 0 (0.0%) |
| 6 to 18 Years | 258 (88.0%) | 35 (11.9%) |
| 19 to 25 Years | 274 (64.8%) | 149 (35.2%) |
| 26 to 34 Years | 337 (59.7%) | 228 (40.4%) |
| 35 to 44 Years | 175 (82.2%) | 38 (17.8%) |
| 45 to 54 Years | 164 (58.4%) | 117 (41.6%) |
| 55 to 64 Years | 684 (94.7%) | 38 (5.3%) |
| 65 to 74 Years | 356 (100.0%) | 0 (0.0%) |
| 75 Years and older | 135 (100.0%) | 0 (0.0%) |
| Total | 2,635 (81.3%) | 605 (18.7%) |
Health Insurance Coverage by Citizenship Status in Hogansville
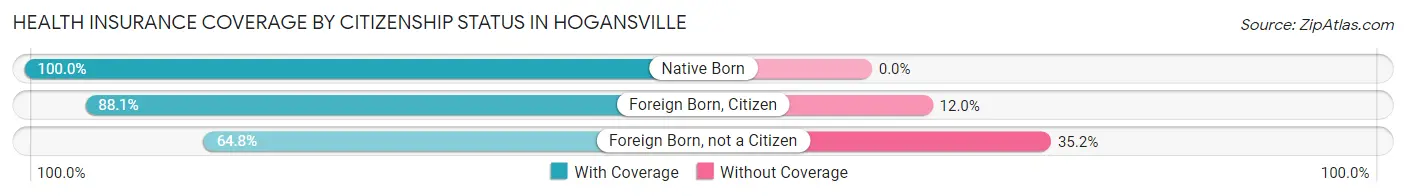
| Citizenship Status | With Coverage | Without Coverage |
| Native Born | 252 (100.0%) | 0 (0.0%) |
| Foreign Born, Citizen | 258 (88.0%) | 35 (11.9%) |
| Foreign Born, not a Citizen | 274 (64.8%) | 149 (35.2%) |
Health Insurance Coverage by Household Income in Hogansville
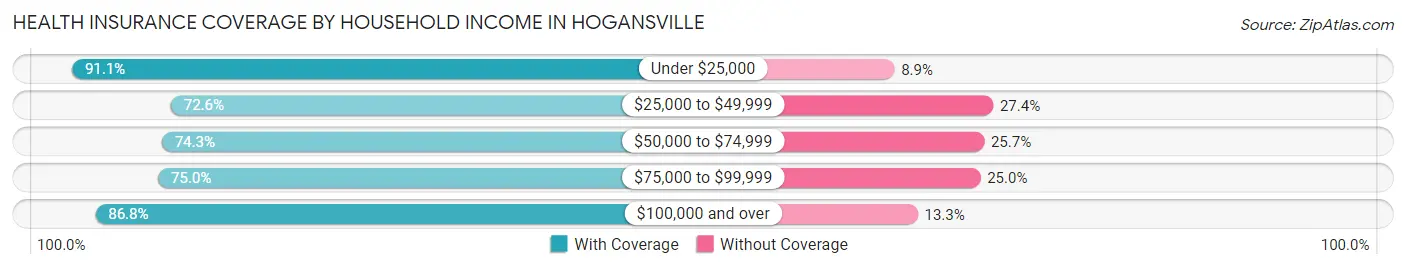
| Household Income | With Coverage | Without Coverage |
| Under $25,000 | 677 (91.1%) | 66 (8.9%) |
| $25,000 to $49,999 | 326 (72.6%) | 123 (27.4%) |
| $50,000 to $74,999 | 451 (74.3%) | 156 (25.7%) |
| $75,000 to $99,999 | 441 (75.0%) | 147 (25.0%) |
| $100,000 and over | 740 (86.8%) | 113 (13.3%) |
Public vs Private Health Insurance Coverage by Age in Hogansville
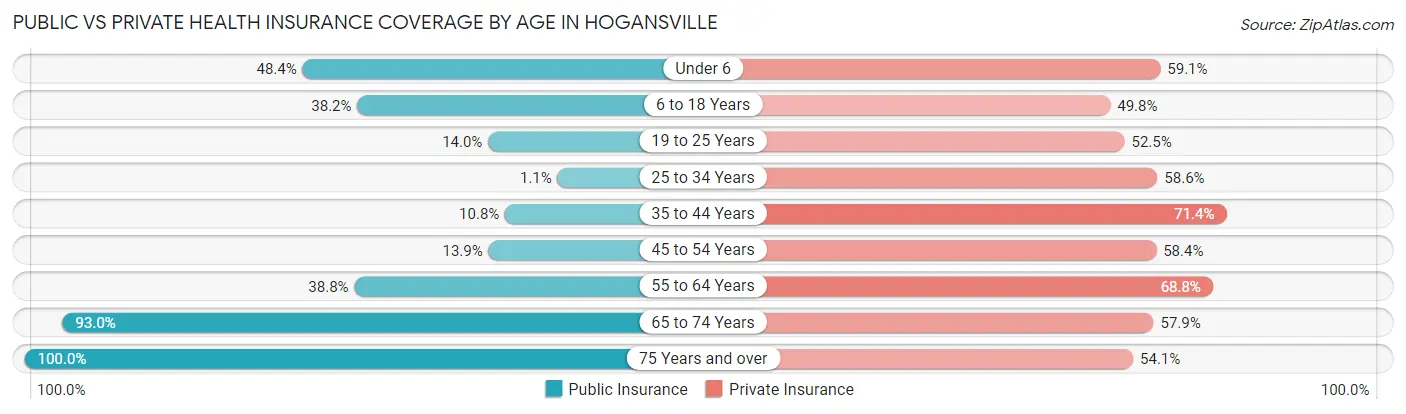
| Age Bracket | Public Insurance | Private Insurance |
| Under 6 | 122 (48.4%) | 149 (59.1%) |
| 6 to 18 Years | 112 (38.2%) | 146 (49.8%) |
| 19 to 25 Years | 59 (14.0%) | 222 (52.5%) |
| 25 to 34 Years | 6 (1.1%) | 331 (58.6%) |
| 35 to 44 Years | 23 (10.8%) | 152 (71.4%) |
| 45 to 54 Years | 39 (13.9%) | 164 (58.4%) |
| 55 to 64 Years | 280 (38.8%) | 497 (68.8%) |
| 65 to 74 Years | 331 (93.0%) | 206 (57.9%) |
| 75 Years and over | 135 (100.0%) | 73 (54.1%) |
| Total | 1,107 (34.2%) | 1,940 (59.9%) |
Disability Status by Sex by Age in Hogansville
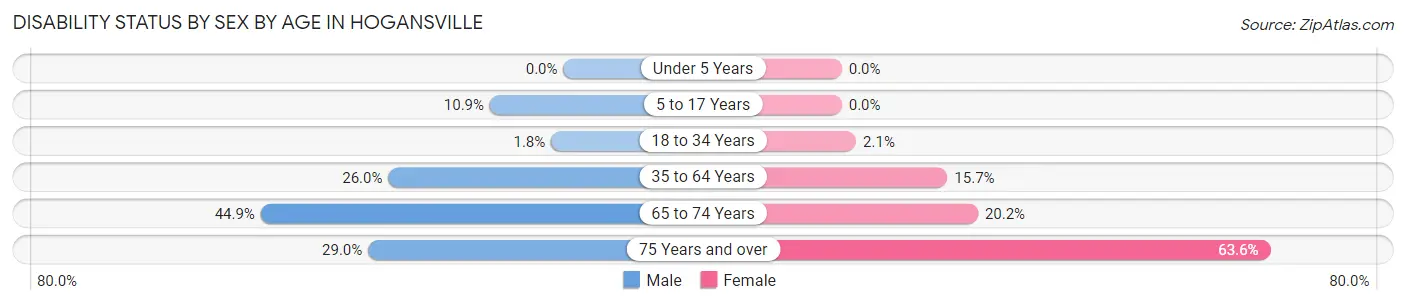
| Age Bracket | Male | Female |
| Under 5 Years | 0 (0.0%) | 0 (0.0%) |
| 5 to 17 Years | 12 (10.9%) | 0 (0.0%) |
| 18 to 34 Years | 6 (1.8%) | 15 (2.1%) |
| 35 to 64 Years | 162 (26.0%) | 93 (15.7%) |
| 65 to 74 Years | 80 (44.9%) | 36 (20.2%) |
| 75 Years and over | 20 (29.0%) | 42 (63.6%) |
Disability Class by Sex by Age in Hogansville
Disability Class: Hearing Difficulty
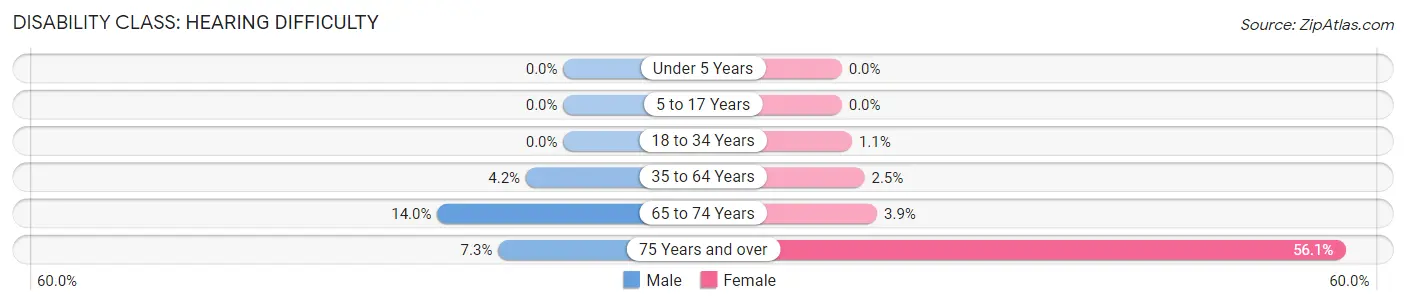
| Age Bracket | Male | Female |
| Under 5 Years | 0 (0.0%) | 0 (0.0%) |
| 5 to 17 Years | 0 (0.0%) | 0 (0.0%) |
| 18 to 34 Years | 0 (0.0%) | 8 (1.1%) |
| 35 to 64 Years | 26 (4.2%) | 15 (2.5%) |
| 65 to 74 Years | 25 (14.0%) | 7 (3.9%) |
| 75 Years and over | 5 (7.2%) | 37 (56.1%) |
Disability Class: Vision Difficulty
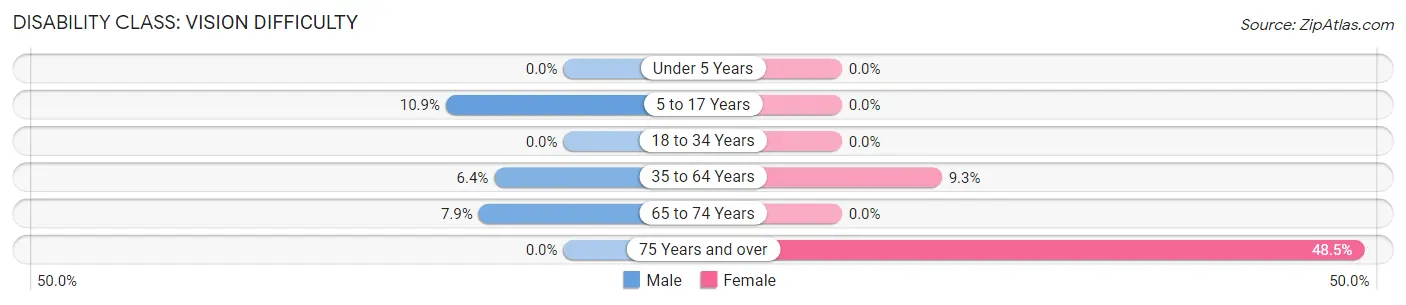
| Age Bracket | Male | Female |
| Under 5 Years | 0 (0.0%) | 0 (0.0%) |
| 5 to 17 Years | 12 (10.9%) | 0 (0.0%) |
| 18 to 34 Years | 0 (0.0%) | 0 (0.0%) |
| 35 to 64 Years | 40 (6.4%) | 55 (9.3%) |
| 65 to 74 Years | 14 (7.9%) | 0 (0.0%) |
| 75 Years and over | 0 (0.0%) | 32 (48.5%) |
Disability Class: Cognitive Difficulty
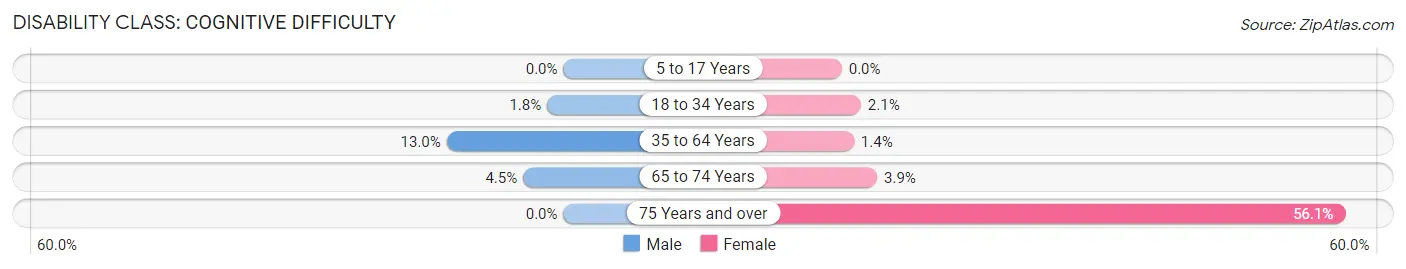
| Age Bracket | Male | Female |
| 5 to 17 Years | 0 (0.0%) | 0 (0.0%) |
| 18 to 34 Years | 6 (1.8%) | 15 (2.1%) |
| 35 to 64 Years | 81 (13.0%) | 8 (1.3%) |
| 65 to 74 Years | 8 (4.5%) | 7 (3.9%) |
| 75 Years and over | 0 (0.0%) | 37 (56.1%) |
Disability Class: Ambulatory Difficulty
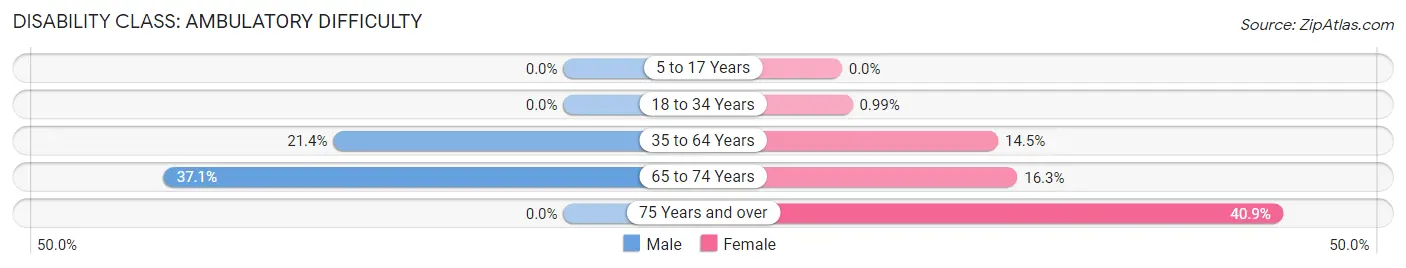
| Age Bracket | Male | Female |
| 5 to 17 Years | 0 (0.0%) | 0 (0.0%) |
| 18 to 34 Years | 0 (0.0%) | 7 (1.0%) |
| 35 to 64 Years | 133 (21.3%) | 86 (14.5%) |
| 65 to 74 Years | 66 (37.1%) | 29 (16.3%) |
| 75 Years and over | 0 (0.0%) | 27 (40.9%) |
Disability Class: Self-Care Difficulty
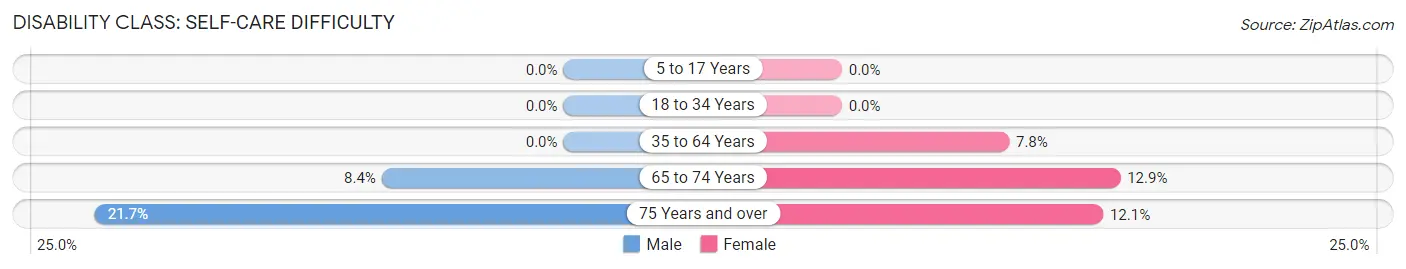
| Age Bracket | Male | Female |
| 5 to 17 Years | 0 (0.0%) | 0 (0.0%) |
| 18 to 34 Years | 0 (0.0%) | 0 (0.0%) |
| 35 to 64 Years | 0 (0.0%) | 46 (7.8%) |
| 65 to 74 Years | 15 (8.4%) | 23 (12.9%) |
| 75 Years and over | 15 (21.7%) | 8 (12.1%) |
Technology Access in Hogansville
Computing Device Access in Hogansville
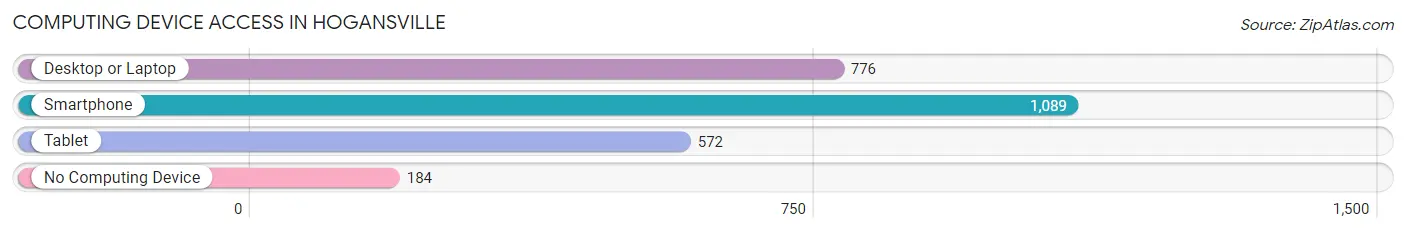
| Device Type | # Households | % Households |
| Desktop or Laptop | 776 | 58.3% |
| Smartphone | 1,089 | 81.8% |
| Tablet | 572 | 43.0% |
| No Computing Device | 184 | 13.8% |
| Total | 1,331 | 100.0% |
Internet Access in Hogansville
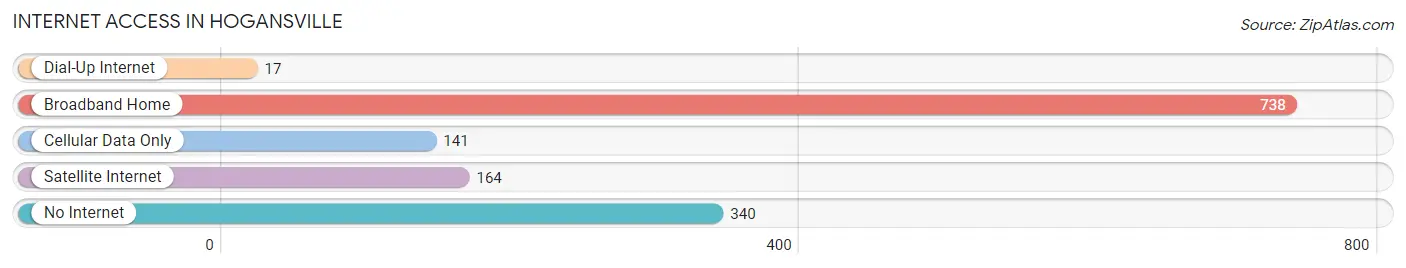
| Internet Type | # Households | % Households |
| Dial-Up Internet | 17 | 1.3% |
| Broadband Home | 738 | 55.4% |
| Cellular Data Only | 141 | 10.6% |
| Satellite Internet | 164 | 12.3% |
| No Internet | 340 | 25.5% |
| Total | 1,331 | 100.0% |
Hogansville Summary
Hogansville is a city located in Troup County, Georgia, United States. The population was 2,731 at the 2010 census. It is part of the LaGrange, Georgia Metropolitan Statistical Area.
History
Hogansville was founded in 1827 by William Hogan, a planter from South Carolina. The city was incorporated in 1837 and named after its founder. The city was a major stop on the Montgomery and West Point Railroad, which connected Montgomery, Alabama to Atlanta. The railroad was completed in 1851 and Hogansville became a major shipping point for cotton and other agricultural products.
During the Civil War, Hogansville was the site of a major battle between Union and Confederate forces. The Battle of Hogansville was fought on July 4, 1864 and resulted in a Confederate victory.
Geography
Hogansville is located at 33°7′25″N 85°7′17″W (33.123611, -85.121389). According to the United States Census Bureau, the city has a total area of 3.2 square miles (8.3 km2), all land.
Economy
Hogansville is home to several businesses, including a manufacturing plant, a lumber yard, and a variety of retail stores. The city is also home to a number of small businesses, including restaurants, antique stores, and a variety of other services.
Demographics
As of the census of 2000, there were 2,731 people, 1,093 households, and 745 families residing in the city. The population density was 851.2 people per square mile (329.2/km2). There were 1,183 housing units at an average density of 368.2 per square mile (142.3/km2). The racial makeup of the city was 68.45% White, 29.90% African American, 0.15% Native American, 0.07% Asian, 0.07% Pacific Islander, 0.37% from other races, and 0.99% from two or more races. Hispanic or Latino of any race were 1.09% of the population.
There were 1,093 households, out of which 32.2% had children under the age of 18 living with them, 46.2% were married couples living together, 19.2% had a female householder with no husband present, and 30.2% were non-families. 26.3% of all households were made up of individuals, and 12.2% had someone living alone who was 65 years of age or older. The average household size was 2.50 and the average family size was 3.01.
In the city, the population was spread out, with 26.2% under the age of 18, 8.7% from 18 to 24, 28.2% from 25 to 44, 21.3% from 45 to 64, and 15.6% who were 65 years of age or older. The median age was 36 years. For every 100 females, there were 86.2 males. For every 100 females age 18 and over, there were 81.2 males.
The median income for a household in the city was $27,917, and the median income for a family was $32,917. Males had a median income of $27,917 versus $20,000 for females. The per capita income for the city was $14,917. About 17.2% of families and 20.2% of the population were below the poverty line, including 28.2% of those under age 18 and 16.2% of those age 65 or over.
Common Questions
What is Per Capita Income in Hogansville?
Per Capita income in Hogansville is $25,270.
What is the Median Family Income in Hogansville?
Median Family Income in Hogansville is $66,125.
What is the Median Household income in Hogansville?
Median Household Income in Hogansville is $44,712.
What is Income or Wage Gap in Hogansville?
Income or Wage Gap in Hogansville is 31.5%.
Women in Hogansville earn 68.5 cents for every dollar earned by a man.
What is Inequality or Gini Index in Hogansville?
Inequality or Gini Index in Hogansville is 0.48.
What is the Total Population of Hogansville?
Total Population of Hogansville is 3,240.
What is the Total Male Population of Hogansville?
Total Male Population of Hogansville is 1,444.
What is the Total Female Population of Hogansville?
Total Female Population of Hogansville is 1,796.
What is the Ratio of Males per 100 Females in Hogansville?
There are 80.40 Males per 100 Females in Hogansville.
What is the Ratio of Females per 100 Males in Hogansville?
There are 124.38 Females per 100 Males in Hogansville.
What is the Median Population Age in Hogansville?
Median Population Age in Hogansville is 36.4 Years.
What is the Average Family Size in Hogansville
Average Family Size in Hogansville is 3.3 People.
What is the Average Household Size in Hogansville
Average Household Size in Hogansville is 2.4 People.
How Large is the Labor Force in Hogansville?
There are 1,686 People in the Labor Forcein in Hogansville.
What is the Percentage of People in the Labor Force in Hogansville?
61.0% of People are in the Labor Force in Hogansville.
What is the Unemployment Rate in Hogansville?
Unemployment Rate in Hogansville is 0.9%.