Vidalia, GA Map & Demographics
Vidalia Map
Vidalia Overview
$33,701
PER CAPITA INCOME
$57,383
AVG FAMILY INCOME
$47,124
AVG HOUSEHOLD INCOME
29.0%
WAGE / INCOME GAP [ % ]
71.0¢/ $1
WAGE / INCOME GAP [ $ ]
$11,346
FAMILY INCOME DEFICIT
0.59
INEQUALITY / GINI INDEX
10,732
TOTAL POPULATION
4,583
MALE POPULATION
6,149
FEMALE POPULATION
74.53
MALES / 100 FEMALES
134.17
FEMALES / 100 MALES
37.4
MEDIAN AGE
3.4
AVG FAMILY SIZE
2.6
AVG HOUSEHOLD SIZE
4,295
LABOR FORCE [ PEOPLE ]
51.3%
PERCENT IN LABOR FORCE
7.4%
UNEMPLOYMENT RATE
Vidalia Zip Codes
Vidalia Area Codes
Income in Vidalia
Income Overview in Vidalia
Per Capita Income in Vidalia is $33,701, while median incomes of families and households are $57,383 and $47,124 respectively.
| Characteristic | Number | Measure |
| Per Capita Income | 10,732 | $33,701 |
| Median Family Income | 2,471 | $57,383 |
| Mean Family Income | 2,471 | $105,714 |
| Median Household Income | 3,955 | $47,124 |
| Mean Household Income | 3,955 | $82,421 |
| Income Deficit | 2,471 | $11,346 |
| Wage / Income Gap (%) | 10,732 | 29.00% |
| Wage / Income Gap ($) | 10,732 | 71.00¢ per $1 |
| Gini / Inequality Index | 10,732 | 0.59 |
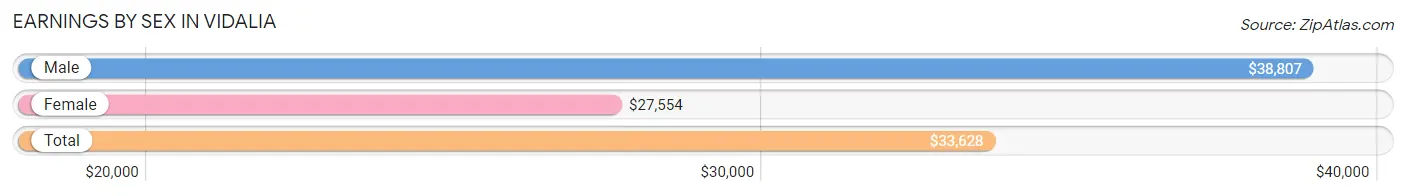
Earnings by Sex in Vidalia
Average Earnings in Vidalia are $33,628, $38,807 for men and $27,554 for women, a difference of 29.0%.
| Sex | Number | Average Earnings |
| Male | 2,240 (48.1%) | $38,807 |
| Female | 2,419 (51.9%) | $27,554 |
| Total | 4,659 (100.0%) | $33,628 |
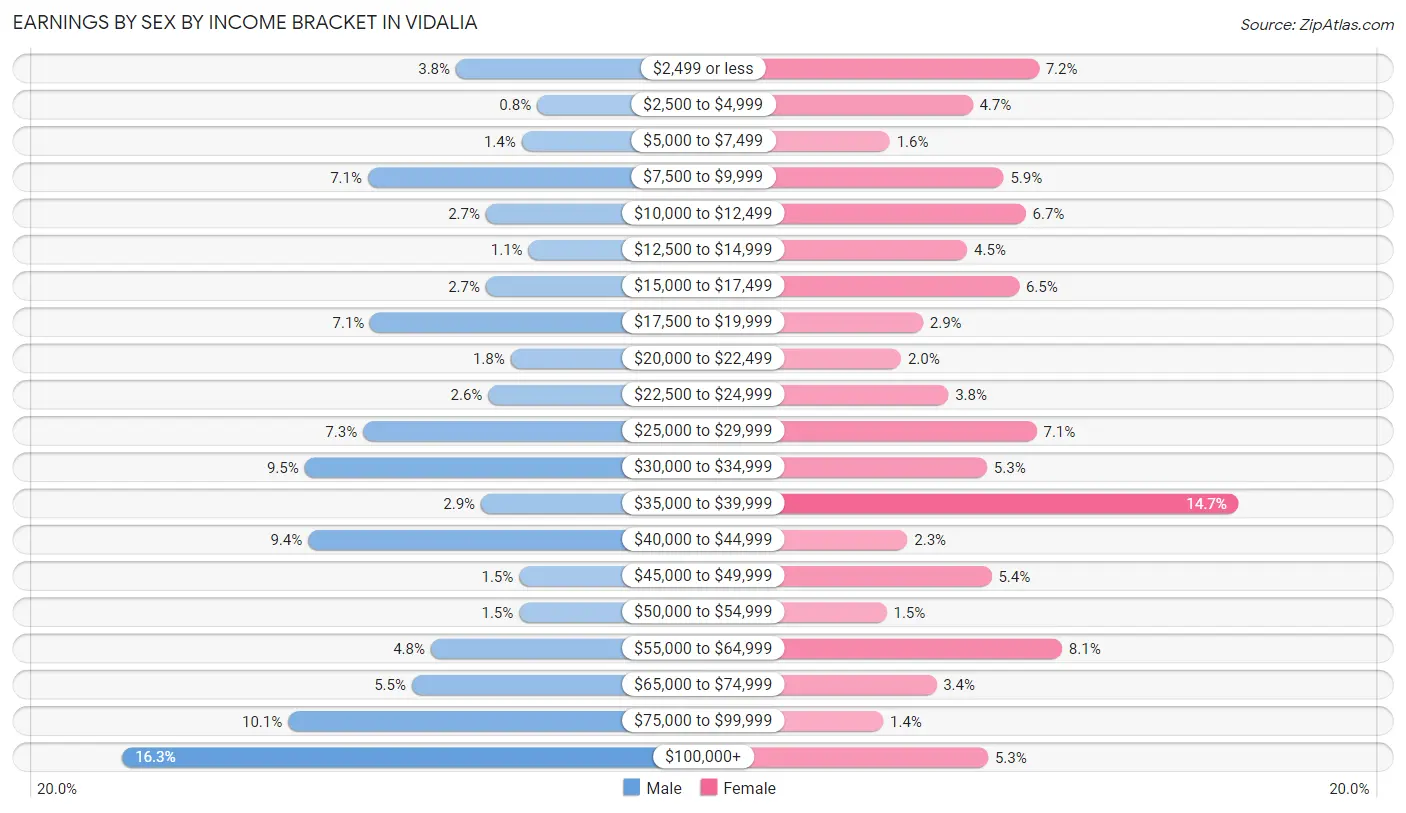
Earnings by Sex by Income Bracket in Vidalia
The most common earnings brackets in Vidalia are $100,000+ for men (366 | 16.3%) and $35,000 to $39,999 for women (355 | 14.7%).
| Income | Male | Female |
| $2,499 or less | 86 (3.8%) | 174 (7.2%) |
| $2,500 to $4,999 | 18 (0.8%) | 114 (4.7%) |
| $5,000 to $7,499 | 31 (1.4%) | 39 (1.6%) |
| $7,500 to $9,999 | 160 (7.1%) | 142 (5.9%) |
| $10,000 to $12,499 | 61 (2.7%) | 162 (6.7%) |
| $12,500 to $14,999 | 25 (1.1%) | 109 (4.5%) |
| $15,000 to $17,499 | 61 (2.7%) | 156 (6.5%) |
| $17,500 to $19,999 | 158 (7.0%) | 69 (2.9%) |
| $20,000 to $22,499 | 40 (1.8%) | 49 (2.0%) |
| $22,500 to $24,999 | 59 (2.6%) | 92 (3.8%) |
| $25,000 to $29,999 | 164 (7.3%) | 172 (7.1%) |
| $30,000 to $34,999 | 213 (9.5%) | 127 (5.2%) |
| $35,000 to $39,999 | 65 (2.9%) | 355 (14.7%) |
| $40,000 to $44,999 | 210 (9.4%) | 55 (2.3%) |
| $45,000 to $49,999 | 33 (1.5%) | 131 (5.4%) |
| $50,000 to $54,999 | 33 (1.5%) | 36 (1.5%) |
| $55,000 to $64,999 | 107 (4.8%) | 195 (8.1%) |
| $65,000 to $74,999 | 123 (5.5%) | 81 (3.4%) |
| $75,000 to $99,999 | 227 (10.1%) | 33 (1.4%) |
| $100,000+ | 366 (16.3%) | 128 (5.3%) |
| Total | 2,240 (100.0%) | 2,419 (100.0%) |
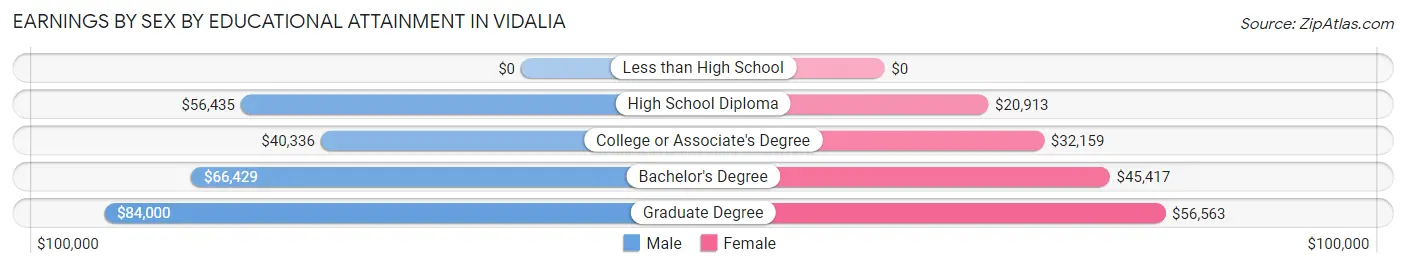
Earnings by Sex by Educational Attainment in Vidalia
Average earnings in Vidalia are $42,239 for men and $35,247 for women, a difference of 16.6%. Men with an educational attainment of graduate degree enjoy the highest average annual earnings of $84,000, while those with college or associate's degree education earn the least with $40,336. Women with an educational attainment of graduate degree earn the most with the average annual earnings of $56,563, while those with high school diploma education have the smallest earnings of $20,913.
| Educational Attainment | Male Income | Female Income |
| Less than High School | - | - |
| High School Diploma | $56,435 | $20,913 |
| College or Associate's Degree | $40,336 | $32,159 |
| Bachelor's Degree | $66,429 | $45,417 |
| Graduate Degree | $84,000 | $56,563 |
| Total | $42,239 | $35,247 |
Family Income in Vidalia
Family Income Brackets in Vidalia
According to the Vidalia family income data, there are 509 families falling into the $50,000 to $74,999 income range, which is the most common income bracket and makes up 20.6% of all families. Conversely, the $150,000 to $199,999 income bracket is the least frequent group with only 128 families (5.2%) belonging to this category.
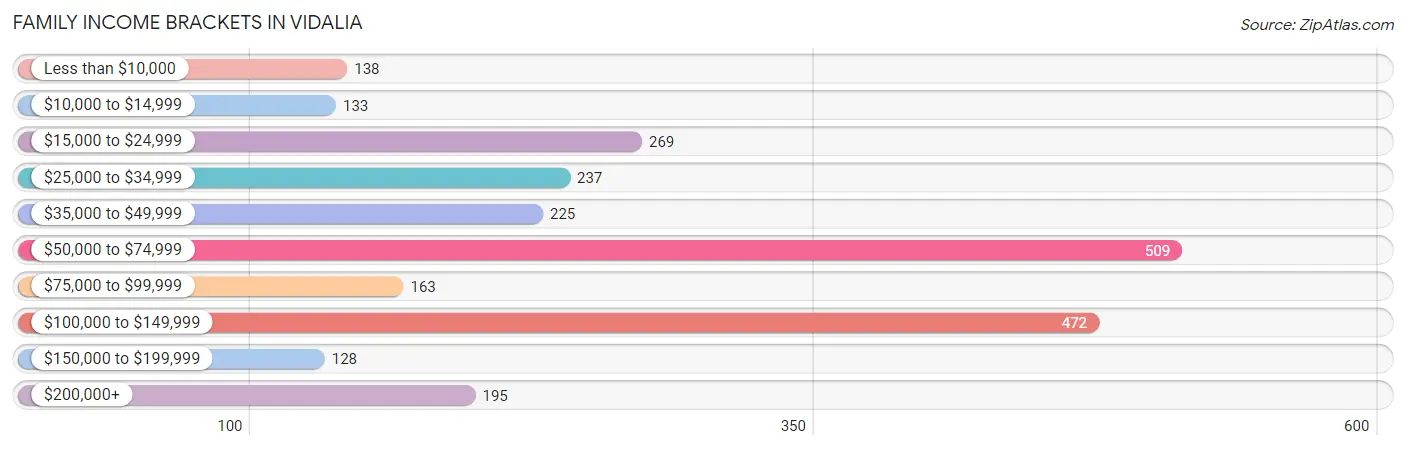
| Income Bracket | # Families | % Families |
| Less than $10,000 | 138 | 5.6% |
| $10,000 to $14,999 | 133 | 5.4% |
| $15,000 to $24,999 | 269 | 10.9% |
| $25,000 to $34,999 | 237 | 9.6% |
| $35,000 to $49,999 | 225 | 9.1% |
| $50,000 to $74,999 | 509 | 20.6% |
| $75,000 to $99,999 | 163 | 6.6% |
| $100,000 to $149,999 | 472 | 19.1% |
| $150,000 to $199,999 | 128 | 5.2% |
| $200,000+ | 195 | 7.9% |
Family Income by Famaliy Size in Vidalia
4-person families (418 | 16.9%) account for the highest median family income in Vidalia with $90,263 per family, while 2-person families (1,186 | 48.0%) have the highest median income of $27,550 per family member.
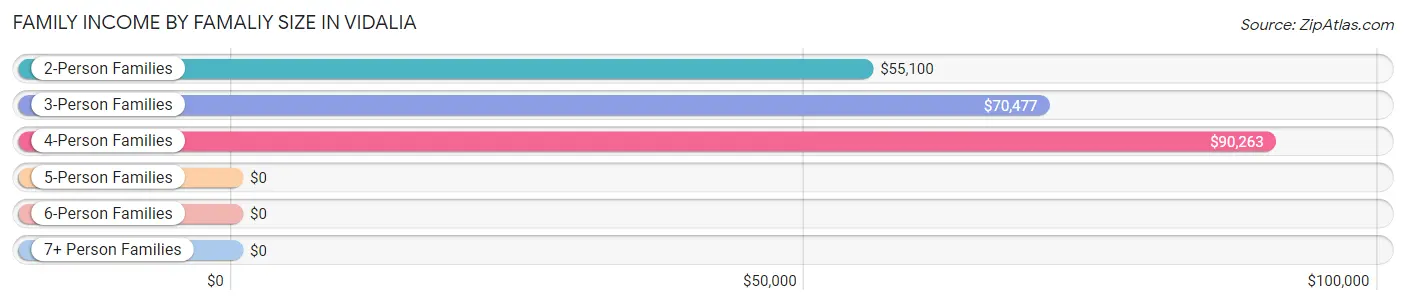
| Income Bracket | # Families | Median Income |
| 2-Person Families | 1,186 (48.0%) | $55,100 |
| 3-Person Families | 567 (23.0%) | $70,477 |
| 4-Person Families | 418 (16.9%) | $90,263 |
| 5-Person Families | 217 (8.8%) | $0 |
| 6-Person Families | 6 (0.2%) | $0 |
| 7+ Person Families | 77 (3.1%) | $0 |
| Total | 2,471 (100.0%) | $57,383 |
Family Income by Number of Earners in Vidalia
The median family income in Vidalia is $57,383, with families comprising 3+ earners (277) having the highest median family income of $140,688, while families with no earners (560) have the lowest median family income of $26,585, accounting for 11.2% and 22.7% of families, respectively.
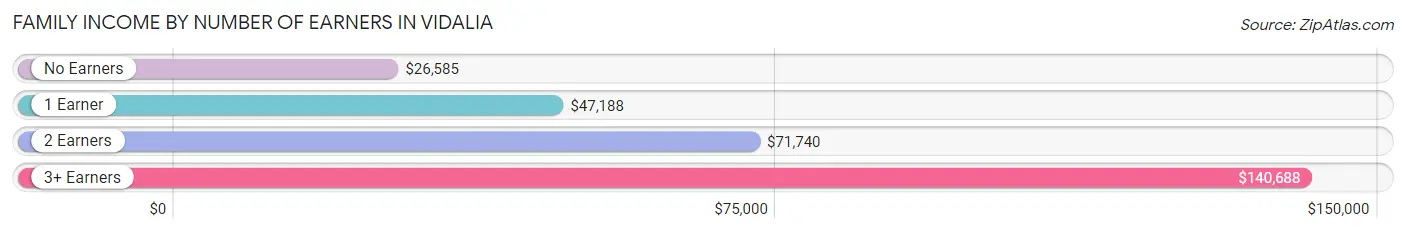
| Number of Earners | # Families | Median Income |
| No Earners | 560 (22.7%) | $26,585 |
| 1 Earner | 921 (37.3%) | $47,188 |
| 2 Earners | 713 (28.8%) | $71,740 |
| 3+ Earners | 277 (11.2%) | $140,688 |
| Total | 2,471 (100.0%) | $57,383 |
Household Income in Vidalia
Household Income Brackets in Vidalia
With 771 households falling in the category, the $50,000 to $74,999 income range is the most frequent in Vidalia, accounting for 19.5% of all households. In contrast, only 186 households (4.7%) fall into the $150,000 to $199,999 income bracket, making it the least populous group.
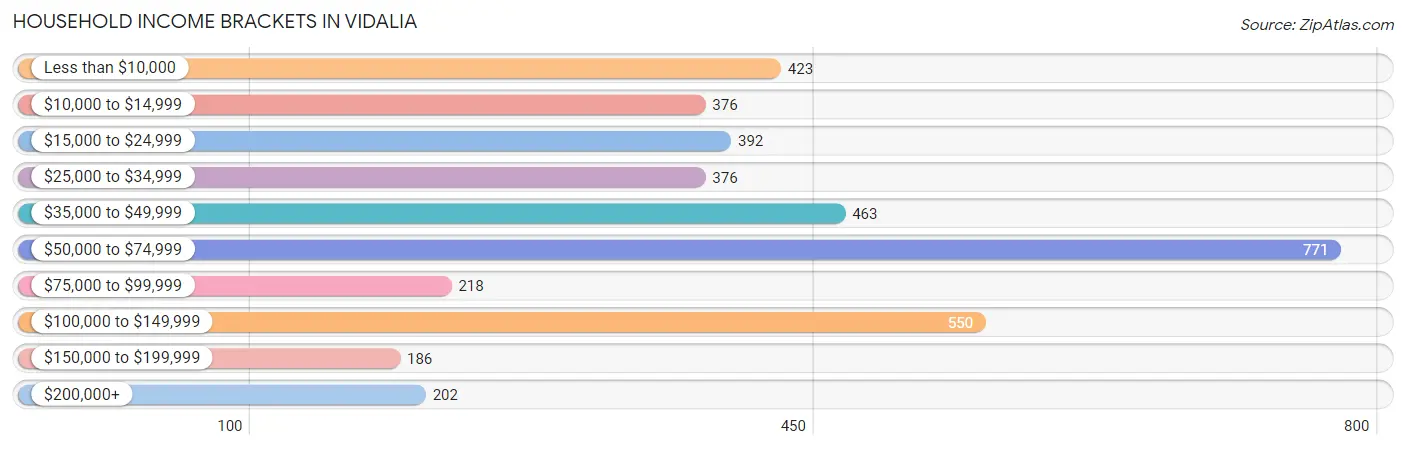
| Income Bracket | # Households | % Households |
| Less than $10,000 | 423 | 10.7% |
| $10,000 to $14,999 | 376 | 9.5% |
| $15,000 to $24,999 | 392 | 9.9% |
| $25,000 to $34,999 | 376 | 9.5% |
| $35,000 to $49,999 | 463 | 11.7% |
| $50,000 to $74,999 | 771 | 19.5% |
| $75,000 to $99,999 | 218 | 5.5% |
| $100,000 to $149,999 | 550 | 13.9% |
| $150,000 to $199,999 | 186 | 4.7% |
| $200,000+ | 202 | 5.1% |
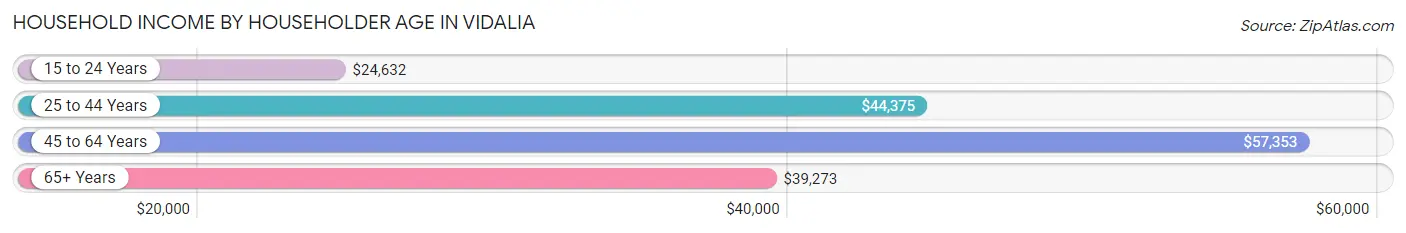
Household Income by Householder Age in Vidalia
The median household income in Vidalia is $47,124, with the highest median household income of $57,353 found in the 45 to 64 years age bracket for the primary householder. A total of 1,346 households (34.0%) fall into this category. Meanwhile, the 15 to 24 years age bracket for the primary householder has the lowest median household income of $24,632, with 83 households (2.1%) in this group.
| Income Bracket | # Households | Median Income |
| 15 to 24 Years | 83 (2.1%) | $24,632 |
| 25 to 44 Years | 1,139 (28.8%) | $44,375 |
| 45 to 64 Years | 1,346 (34.0%) | $57,353 |
| 65+ Years | 1,387 (35.1%) | $39,273 |
| Total | 3,955 (100.0%) | $47,124 |
Poverty in Vidalia
Income Below Poverty by Sex and Age in Vidalia
With 22.3% poverty level for males and 29.8% for females among the residents of Vidalia, 15 year old males and 15 year old females are the most vulnerable to poverty, with 65 males (78.3%) and 83 females (100.0%) in their respective age groups living below the poverty level.
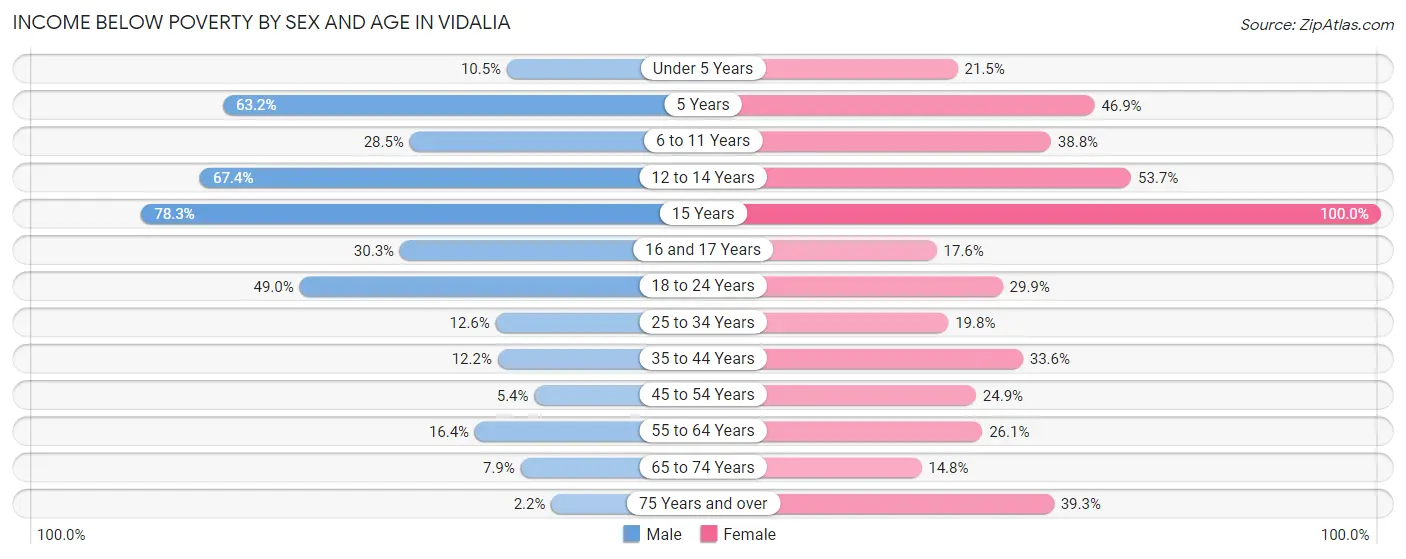
| Age Bracket | Male | Female |
| Under 5 Years | 27 (10.5%) | 63 (21.5%) |
| 5 Years | 24 (63.2%) | 53 (46.9%) |
| 6 to 11 Years | 150 (28.5%) | 104 (38.8%) |
| 12 to 14 Years | 178 (67.4%) | 167 (53.7%) |
| 15 Years | 65 (78.3%) | 83 (100.0%) |
| 16 and 17 Years | 44 (30.3%) | 44 (17.6%) |
| 18 to 24 Years | 212 (49.0%) | 223 (29.8%) |
| 25 to 34 Years | 68 (12.6%) | 131 (19.8%) |
| 35 to 44 Years | 62 (12.2%) | 251 (33.6%) |
| 45 to 54 Years | 22 (5.4%) | 171 (24.9%) |
| 55 to 64 Years | 95 (16.4%) | 158 (26.1%) |
| 65 to 74 Years | 36 (7.9%) | 86 (14.7%) |
| 75 Years and over | 4 (2.2%) | 251 (39.3%) |
| Total | 987 (22.3%) | 1,785 (29.8%) |
Income Above Poverty by Sex and Age in Vidalia
According to the poverty statistics in Vidalia, males aged 75 years and over and females aged 65 to 74 years are the age groups that are most secure financially, with 97.8% of males and 85.3% of females in these age groups living above the poverty line.
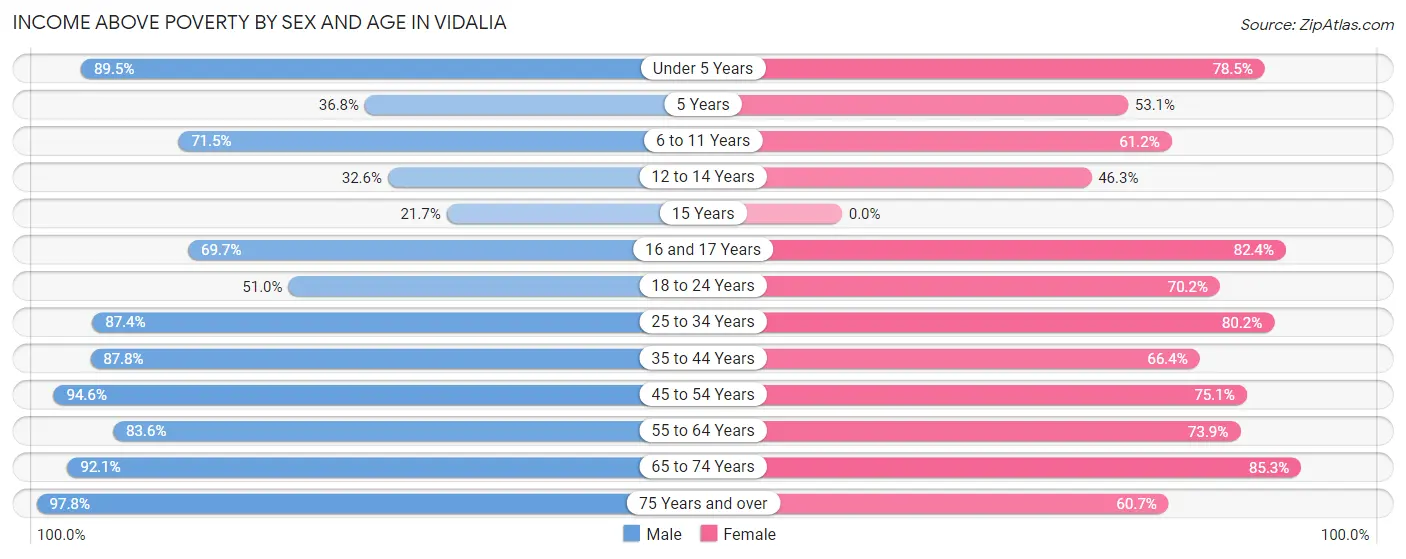
| Age Bracket | Male | Female |
| Under 5 Years | 231 (89.5%) | 230 (78.5%) |
| 5 Years | 14 (36.8%) | 60 (53.1%) |
| 6 to 11 Years | 376 (71.5%) | 164 (61.2%) |
| 12 to 14 Years | 86 (32.6%) | 144 (46.3%) |
| 15 Years | 18 (21.7%) | 0 (0.0%) |
| 16 and 17 Years | 101 (69.7%) | 206 (82.4%) |
| 18 to 24 Years | 221 (51.0%) | 524 (70.2%) |
| 25 to 34 Years | 473 (87.4%) | 532 (80.2%) |
| 35 to 44 Years | 447 (87.8%) | 496 (66.4%) |
| 45 to 54 Years | 387 (94.6%) | 516 (75.1%) |
| 55 to 64 Years | 484 (83.6%) | 448 (73.9%) |
| 65 to 74 Years | 418 (92.1%) | 497 (85.3%) |
| 75 Years and over | 175 (97.8%) | 387 (60.7%) |
| Total | 3,431 (77.7%) | 4,204 (70.2%) |
Income Below Poverty Among Married-Couple Families in Vidalia
The poverty statistics for married-couple families in Vidalia show that 13.1% or 204 of the total 1,559 families live below the poverty line. Families with 3 or 4 children have the highest poverty rate of 30.0%, comprising of 18 families. On the other hand, families with 5 or more children have the lowest poverty rate of 0.0%, which includes 0 families.
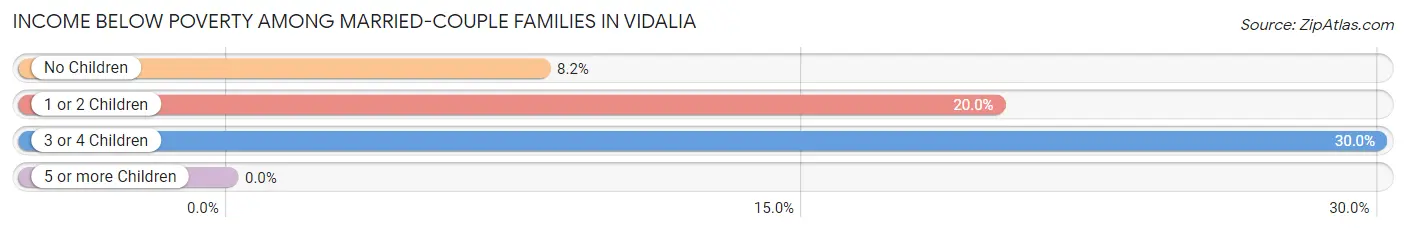
| Children | Above Poverty | Below Poverty |
| No Children | 868 (91.8%) | 77 (8.2%) |
| 1 or 2 Children | 435 (80.0%) | 109 (20.0%) |
| 3 or 4 Children | 42 (70.0%) | 18 (30.0%) |
| 5 or more Children | 10 (100.0%) | 0 (0.0%) |
| Total | 1,355 (86.9%) | 204 (13.1%) |
Income Below Poverty Among Single-Parent Households in Vidalia
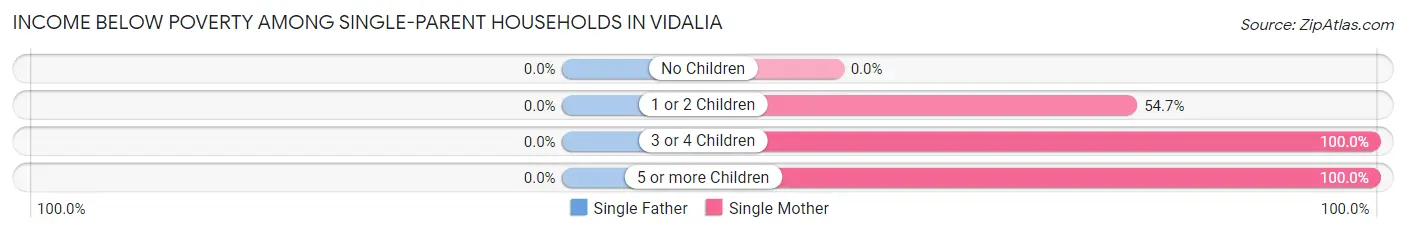
| Children | Single Father | Single Mother |
| No Children | 0 (0.0%) | 0 (0.0%) |
| 1 or 2 Children | 0 (0.0%) | 257 (54.7%) |
| 3 or 4 Children | 0 (0.0%) | 50 (100.0%) |
| 5 or more Children | 0 (0.0%) | 29 (100.0%) |
| Total | 0 (0.0%) | 336 (46.6%) |
Income Below Poverty Among Married-Couple vs Single-Parent Households in Vidalia
The poverty data for Vidalia shows that 204 of the married-couple family households (13.1%) and 336 of the single-parent households (36.8%) are living below the poverty level. Within the married-couple family households, those with 3 or 4 children have the highest poverty rate, with 18 households (30.0%) falling below the poverty line. Among the single-parent households, those with 3 or 4 children have the highest poverty rate, with 50 household (100.0%) living below poverty.
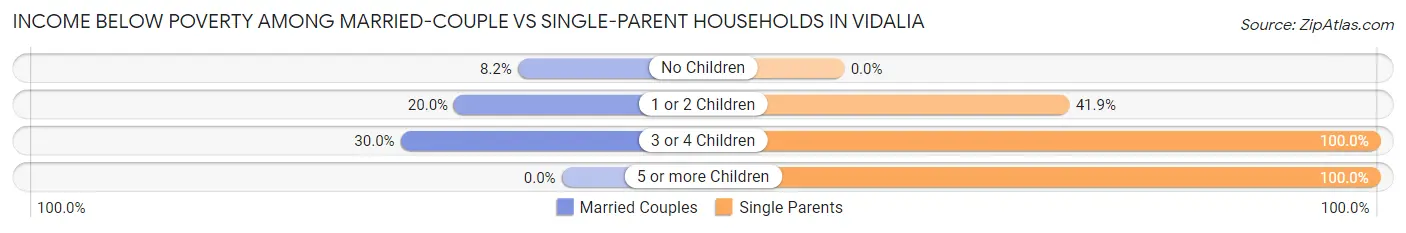
| Children | Married-Couple Families | Single-Parent Households |
| No Children | 77 (8.2%) | 0 (0.0%) |
| 1 or 2 Children | 109 (20.0%) | 257 (41.9%) |
| 3 or 4 Children | 18 (30.0%) | 50 (100.0%) |
| 5 or more Children | 0 (0.0%) | 29 (100.0%) |
| Total | 204 (13.1%) | 336 (36.8%) |
Race in Vidalia
The most populous races in Vidalia are White / Caucasian (5,598 | 52.2%), Black / African American (4,151 | 38.7%), and Two or more Races (736 | 6.9%).
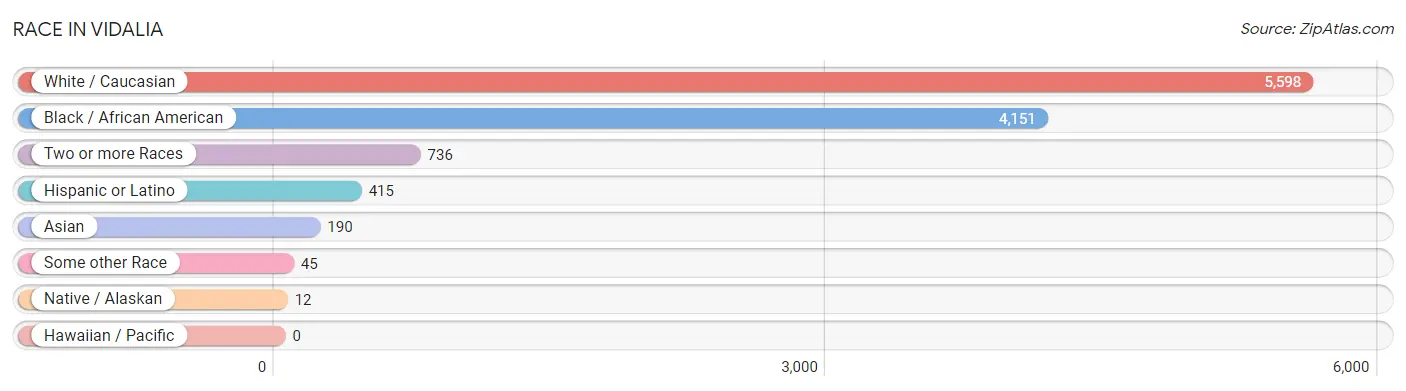
| Race | # Population | % Population |
| Asian | 190 | 1.8% |
| Black / African American | 4,151 | 38.7% |
| Hawaiian / Pacific | 0 | 0.0% |
| Hispanic or Latino | 415 | 3.9% |
| Native / Alaskan | 12 | 0.1% |
| White / Caucasian | 5,598 | 52.2% |
| Two or more Races | 736 | 6.9% |
| Some other Race | 45 | 0.4% |
| Total | 10,732 | 100.0% |
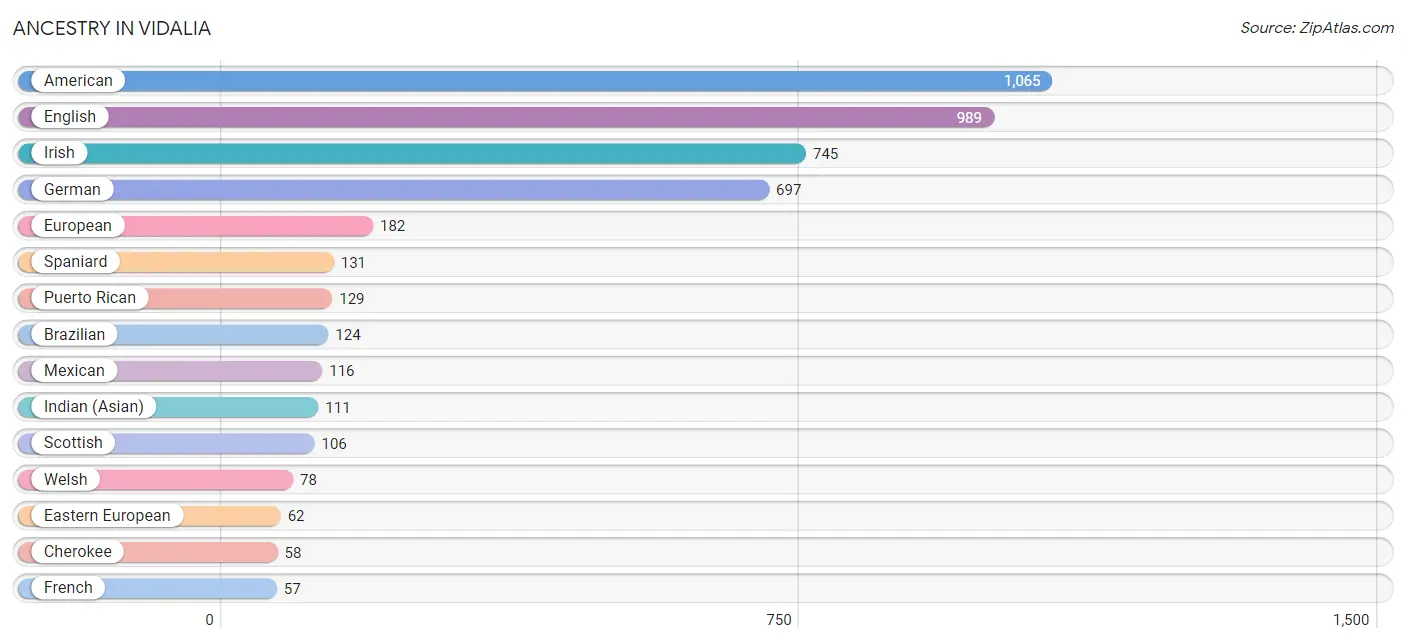
Ancestry in Vidalia
The most populous ancestries reported in Vidalia are American (1,065 | 9.9%), English (989 | 9.2%), Irish (745 | 6.9%), German (697 | 6.5%), and European (182 | 1.7%), together accounting for 34.3% of all Vidalia residents.
| Ancestry | # Population | % Population |
| African | 30 | 0.3% |
| American | 1,065 | 9.9% |
| Brazilian | 124 | 1.2% |
| British | 36 | 0.3% |
| Burmese | 15 | 0.1% |
| Cherokee | 58 | 0.5% |
| Choctaw | 13 | 0.1% |
| Czech | 13 | 0.1% |
| Eastern European | 62 | 0.6% |
| English | 989 | 9.2% |
| European | 182 | 1.7% |
| French | 57 | 0.5% |
| German | 697 | 6.5% |
| German Russian | 24 | 0.2% |
| Greek | 10 | 0.1% |
| Haitian | 1 | 0.0% |
| Indian (Asian) | 111 | 1.0% |
| Irish | 745 | 6.9% |
| Korean | 25 | 0.2% |
| Latvian | 49 | 0.5% |
| Mexican | 116 | 1.1% |
| Native Hawaiian | 8 | 0.1% |
| Northern European | 1 | 0.0% |
| Polish | 37 | 0.3% |
| Puerto Rican | 129 | 1.2% |
| Russian | 38 | 0.4% |
| Scotch-Irish | 49 | 0.5% |
| Scottish | 106 | 1.0% |
| Spaniard | 131 | 1.2% |
| Spanish | 39 | 0.4% |
| Subsaharan African | 30 | 0.3% |
| Thai | 39 | 0.4% |
| Welsh | 78 | 0.7% | View All 33 Rows |
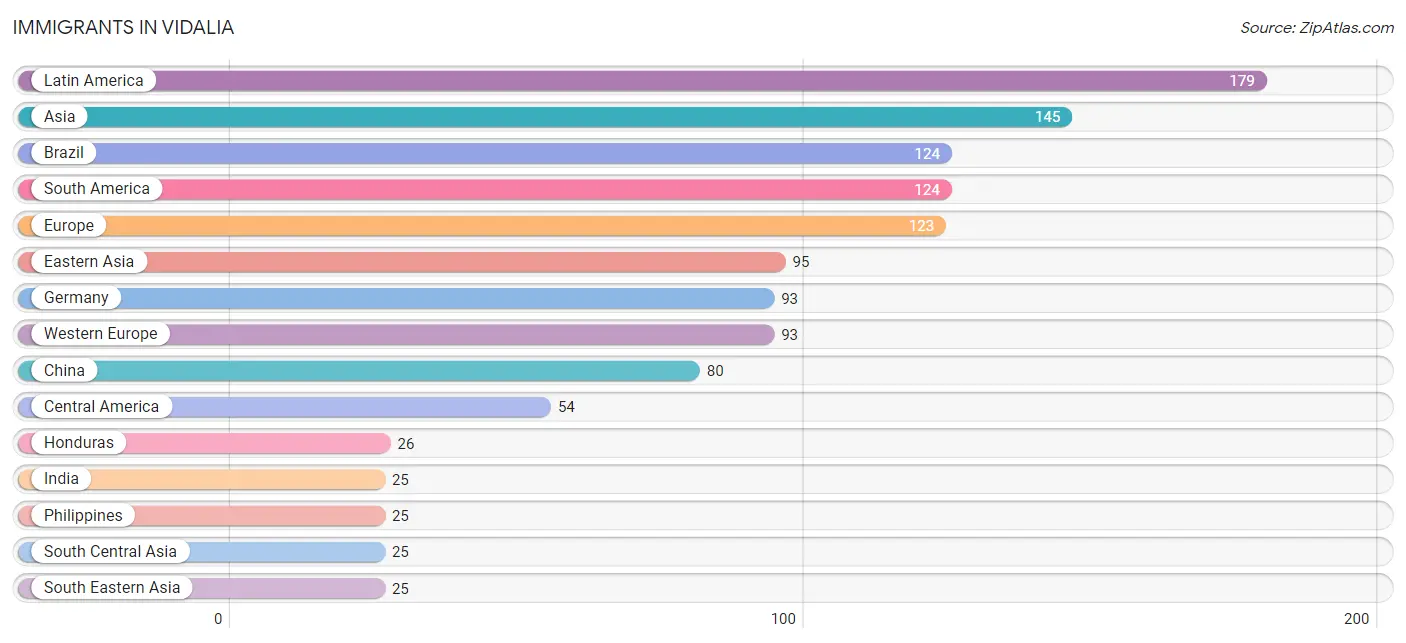
Immigrants in Vidalia
The most numerous immigrant groups reported in Vidalia came from Latin America (179 | 1.7%), Asia (145 | 1.3%), Brazil (124 | 1.2%), South America (124 | 1.2%), and Europe (123 | 1.1%), together accounting for 6.5% of all Vidalia residents.
| Immigration Origin | # Population | % Population |
| Asia | 145 | 1.3% |
| Brazil | 124 | 1.2% |
| Caribbean | 1 | 0.0% |
| Central America | 54 | 0.5% |
| China | 80 | 0.7% |
| Eastern Asia | 95 | 0.9% |
| Eastern Europe | 21 | 0.2% |
| El Salvador | 13 | 0.1% |
| Europe | 123 | 1.1% |
| Germany | 93 | 0.9% |
| Haiti | 1 | 0.0% |
| Honduras | 26 | 0.2% |
| India | 25 | 0.2% |
| Ireland | 9 | 0.1% |
| Korea | 15 | 0.1% |
| Latin America | 179 | 1.7% |
| Mexico | 15 | 0.1% |
| Northern Europe | 9 | 0.1% |
| Philippines | 25 | 0.2% |
| South America | 124 | 1.2% |
| South Central Asia | 25 | 0.2% |
| South Eastern Asia | 25 | 0.2% |
| Western Europe | 93 | 0.9% | View All 23 Rows |
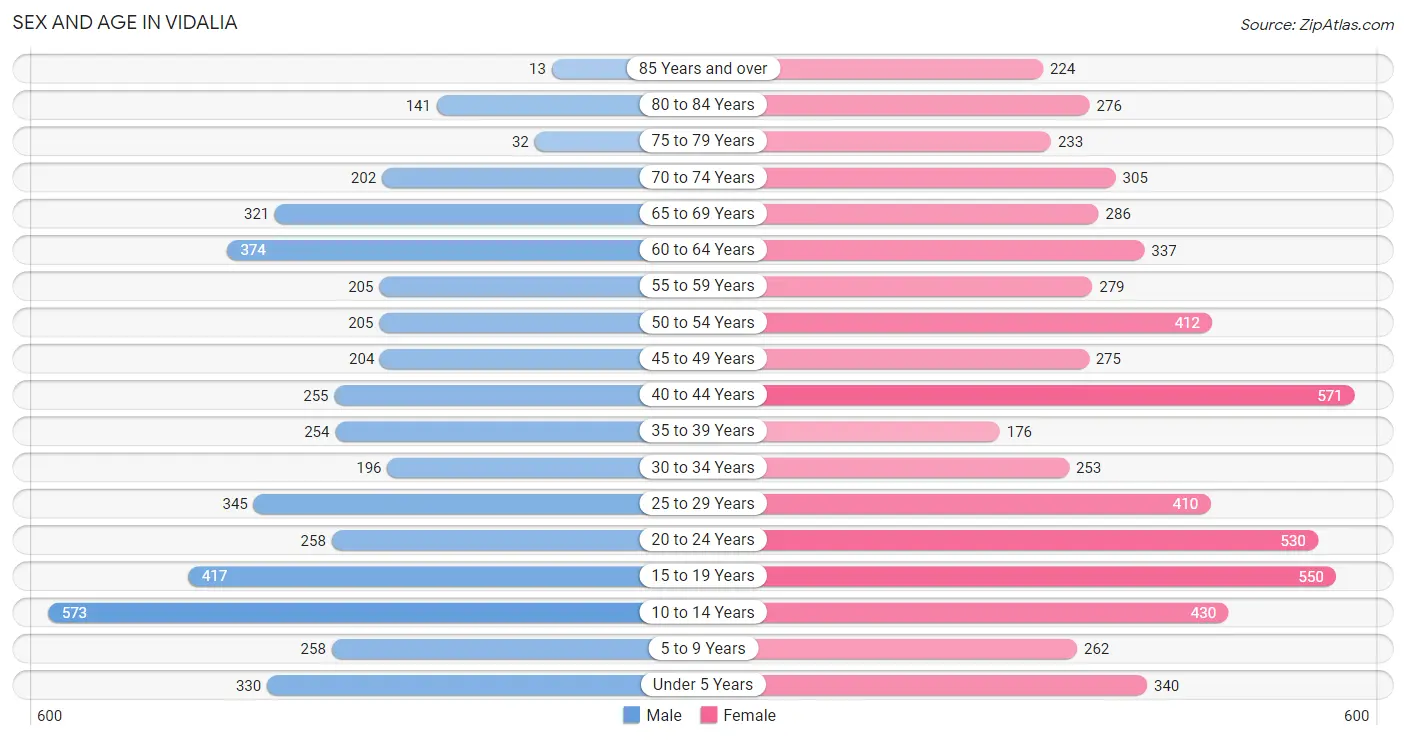
Sex and Age in Vidalia
Sex and Age in Vidalia
The most populous age groups in Vidalia are 10 to 14 Years (573 | 12.5%) for men and 40 to 44 Years (571 | 9.3%) for women.
| Age Bracket | Male | Female |
| Under 5 Years | 330 (7.2%) | 340 (5.5%) |
| 5 to 9 Years | 258 (5.6%) | 262 (4.3%) |
| 10 to 14 Years | 573 (12.5%) | 430 (7.0%) |
| 15 to 19 Years | 417 (9.1%) | 550 (8.9%) |
| 20 to 24 Years | 258 (5.6%) | 530 (8.6%) |
| 25 to 29 Years | 345 (7.5%) | 410 (6.7%) |
| 30 to 34 Years | 196 (4.3%) | 253 (4.1%) |
| 35 to 39 Years | 254 (5.5%) | 176 (2.9%) |
| 40 to 44 Years | 255 (5.6%) | 571 (9.3%) |
| 45 to 49 Years | 204 (4.4%) | 275 (4.5%) |
| 50 to 54 Years | 205 (4.5%) | 412 (6.7%) |
| 55 to 59 Years | 205 (4.5%) | 279 (4.5%) |
| 60 to 64 Years | 374 (8.2%) | 337 (5.5%) |
| 65 to 69 Years | 321 (7.0%) | 286 (4.6%) |
| 70 to 74 Years | 202 (4.4%) | 305 (5.0%) |
| 75 to 79 Years | 32 (0.7%) | 233 (3.8%) |
| 80 to 84 Years | 141 (3.1%) | 276 (4.5%) |
| 85 Years and over | 13 (0.3%) | 224 (3.6%) |
| Total | 4,583 (100.0%) | 6,149 (100.0%) |
Families and Households in Vidalia
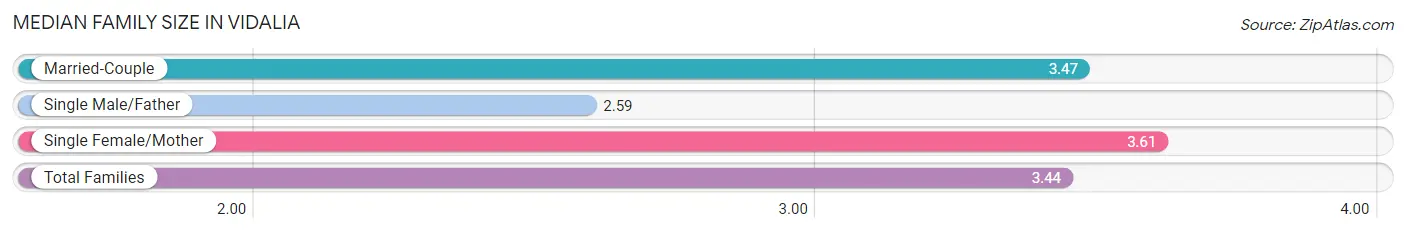
Median Family Size in Vidalia
The median family size in Vidalia is 3.44 persons per family, with single female/mother families (721 | 29.2%) accounting for the largest median family size of 3.61 persons per family. On the other hand, single male/father families (191 | 7.7%) represent the smallest median family size with 2.59 persons per family.
| Family Type | # Families | Family Size |
| Married-Couple | 1,559 (63.1%) | 3.47 |
| Single Male/Father | 191 (7.7%) | 2.59 |
| Single Female/Mother | 721 (29.2%) | 3.61 |
| Total Families | 2,471 (100.0%) | 3.44 |
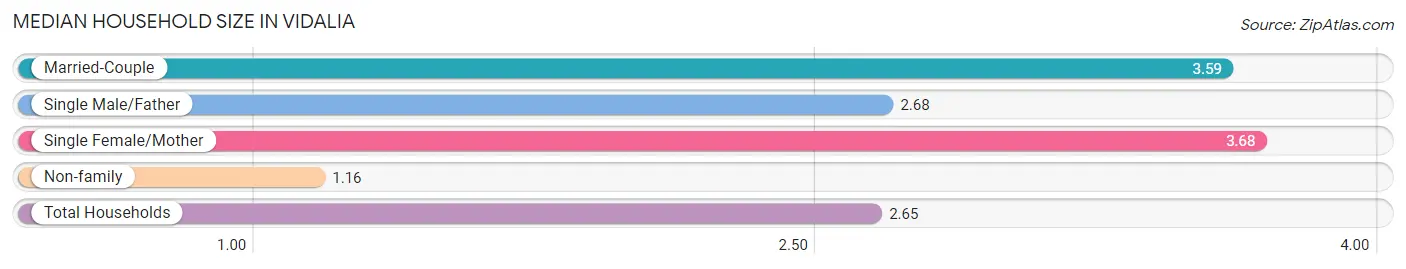
Median Household Size in Vidalia
The median household size in Vidalia is 2.65 persons per household, with single female/mother households (721 | 18.2%) accounting for the largest median household size of 3.68 persons per household. non-family households (1,484 | 37.5%) represent the smallest median household size with 1.16 persons per household.
| Household Type | # Households | Household Size |
| Married-Couple | 1,559 (39.4%) | 3.59 |
| Single Male/Father | 191 (4.8%) | 2.68 |
| Single Female/Mother | 721 (18.2%) | 3.68 |
| Non-family | 1,484 (37.5%) | 1.16 |
| Total Households | 3,955 (100.0%) | 2.65 |
Household Size by Marriage Status in Vidalia
Out of a total of 3,955 households in Vidalia, 2,471 (62.5%) are family households, while 1,484 (37.5%) are nonfamily households. The most numerous type of family households are 2-person households, comprising 1,165, and the most common type of nonfamily households are 1-person households, comprising 1,350.
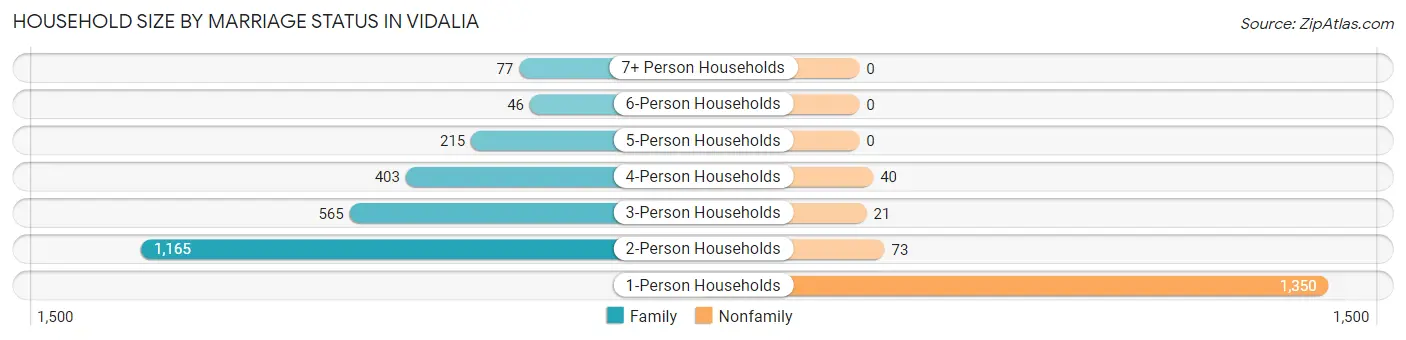
| Household Size | Family Households | Nonfamily Households |
| 1-Person Households | - | 1,350 (34.1%) |
| 2-Person Households | 1,165 (29.5%) | 73 (1.8%) |
| 3-Person Households | 565 (14.3%) | 21 (0.5%) |
| 4-Person Households | 403 (10.2%) | 40 (1.0%) |
| 5-Person Households | 215 (5.4%) | 0 (0.0%) |
| 6-Person Households | 46 (1.2%) | 0 (0.0%) |
| 7+ Person Households | 77 (1.9%) | 0 (0.0%) |
| Total | 2,471 (62.5%) | 1,484 (37.5%) |
Female Fertility in Vidalia
Fertility by Age in Vidalia
Average fertility rate in Vidalia is 46.0 births per 1,000 women. Women in the age bracket of 20 to 34 years have the highest fertility rate with 88.0 births per 1,000 women. Women in the age bracket of 20 to 34 years acount for 80.1% of all women with births.
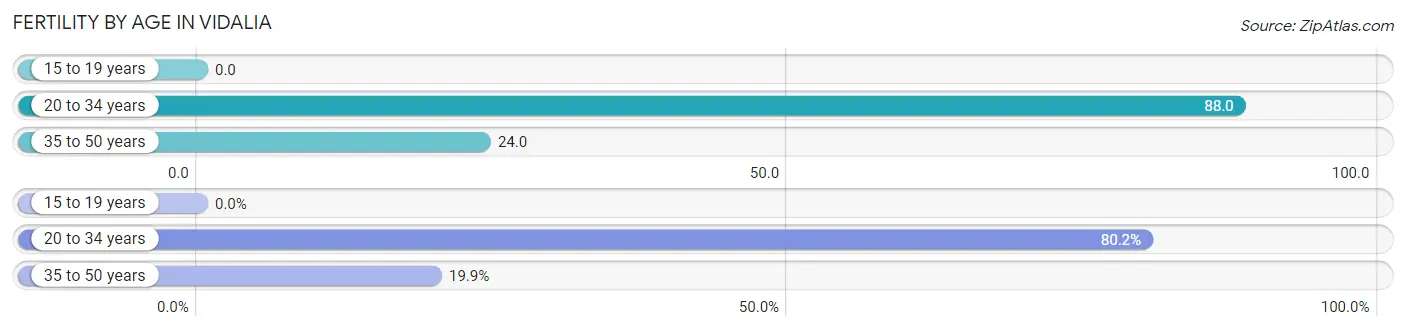
| Age Bracket | Women with Births | Births / 1,000 Women |
| 15 to 19 years | 0 (0.0%) | 0.0 |
| 20 to 34 years | 105 (80.1%) | 88.0 |
| 35 to 50 years | 26 (19.9%) | 24.0 |
| Total | 131 (100.0%) | 46.0 |
Fertility by Age by Marriage Status in Vidalia
87.0% of women with births (131) in Vidalia are married. The highest percentage of unmarried women with births falls into 20 to 34 years age bracket with 16.2% of them unmarried at the time of birth, while the lowest percentage of unmarried women with births belong to 35 to 50 years age bracket with 0.0% of them unmarried.
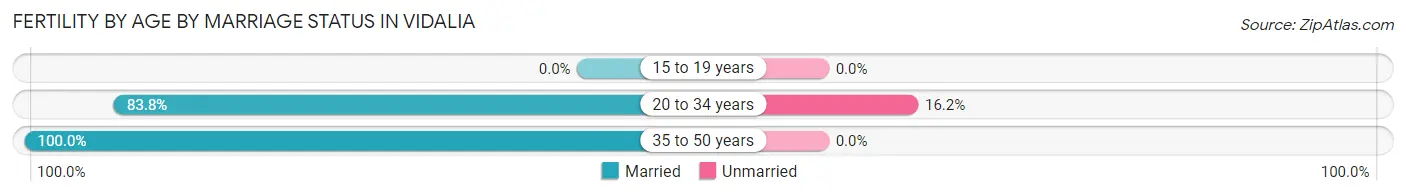
| Age Bracket | Married | Unmarried |
| 15 to 19 years | 0 (0.0%) | 0 (0.0%) |
| 20 to 34 years | 88 (83.8%) | 17 (16.2%) |
| 35 to 50 years | 26 (100.0%) | 0 (0.0%) |
| Total | 114 (87.0%) | 17 (13.0%) |
Fertility by Education in Vidalia
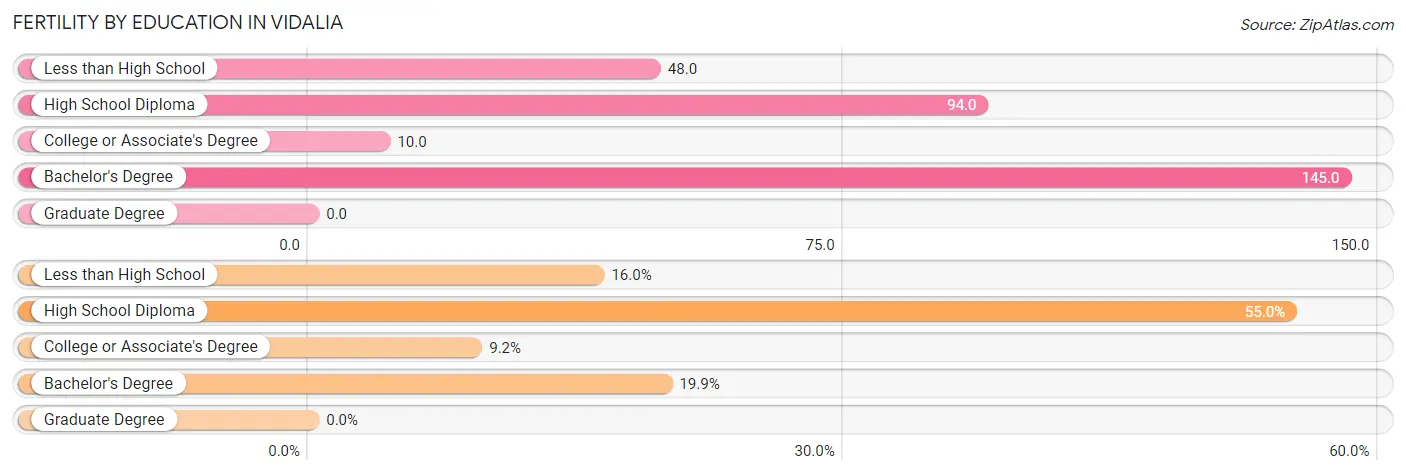
| Educational Attainment | Women with Births | Births / 1,000 Women |
| Less than High School | 21 (16.0%) | 48.0 |
| High School Diploma | 72 (55.0%) | 94.0 |
| College or Associate's Degree | 12 (9.2%) | 10.0 |
| Bachelor's Degree | 26 (19.9%) | 145.0 |
| Graduate Degree | 0 (0.0%) | 0.0 |
| Total | 131 (100.0%) | 46.0 |
Fertility by Education by Marriage Status in Vidalia
13.0% of women with births in Vidalia are unmarried. Women with the educational attainment of high school diploma are most likely to be married with 100.0% of them married at childbirth, while women with the educational attainment of less than high school are least likely to be married with 80.9% of them unmarried at childbirth.
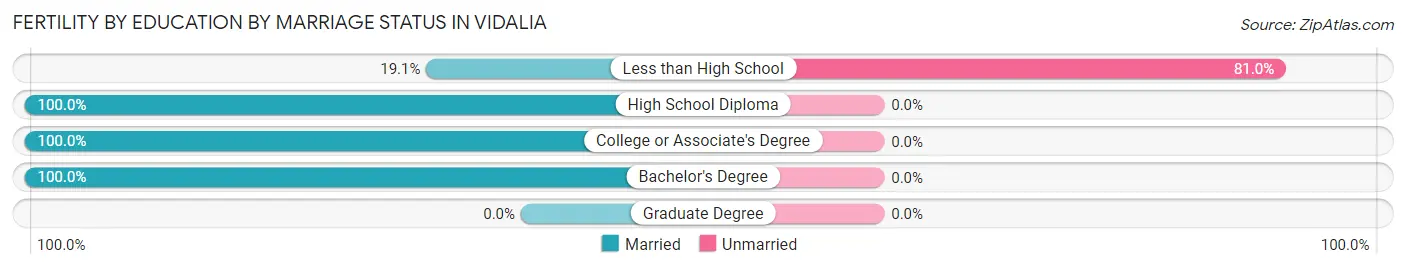
| Educational Attainment | Married | Unmarried |
| Less than High School | 4 (19.1%) | 17 (80.9%) |
| High School Diploma | 72 (100.0%) | 0 (0.0%) |
| College or Associate's Degree | 12 (100.0%) | 0 (0.0%) |
| Bachelor's Degree | 26 (100.0%) | 0 (0.0%) |
| Graduate Degree | 0 (0.0%) | 0 (0.0%) |
| Total | 114 (87.0%) | 17 (13.0%) |
Employment Characteristics in Vidalia
Employment by Class of Employer in Vidalia
Among the 3,928 employed individuals in Vidalia, private company employees (2,524 | 64.3%), state government employees (379 | 9.7%), and local government employees (356 | 9.1%) make up the most common classes of employment.
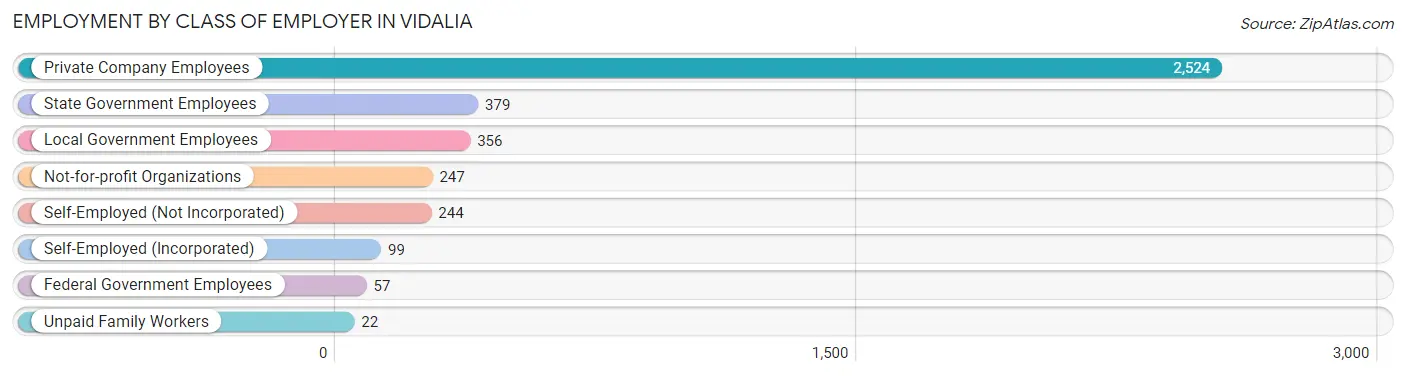
| Employer Class | # Employees | % Employees |
| Private Company Employees | 2,524 | 64.3% |
| Self-Employed (Incorporated) | 99 | 2.5% |
| Self-Employed (Not Incorporated) | 244 | 6.2% |
| Not-for-profit Organizations | 247 | 6.3% |
| Local Government Employees | 356 | 9.1% |
| State Government Employees | 379 | 9.7% |
| Federal Government Employees | 57 | 1.5% |
| Unpaid Family Workers | 22 | 0.6% |
| Total | 3,928 | 100.0% |
Employment Status by Age in Vidalia
According to the labor force statistics for Vidalia, out of the total population over 16 years of age (8,372), 51.3% or 4,295 individuals are in the labor force, with 7.4% or 318 of them unemployed. The age group with the highest labor force participation rate is 45 to 54 years, with 83.6% or 916 individuals in the labor force. Within the labor force, the 20 to 24 years age range has the highest percentage of unemployed individuals, with 17.7% or 78 of them being unemployed.
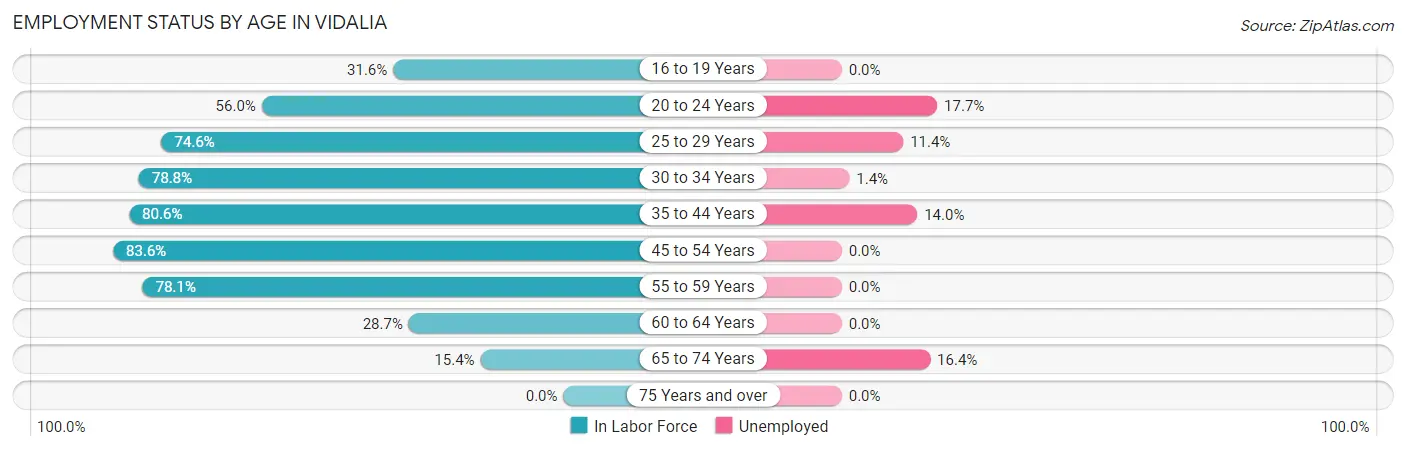
| Age Bracket | In Labor Force | Unemployed |
| 16 to 19 Years | 253 (31.6%) | 0 (0.0%) |
| 20 to 24 Years | 441 (56.0%) | 78 (17.7%) |
| 25 to 29 Years | 563 (74.6%) | 64 (11.4%) |
| 30 to 34 Years | 354 (78.8%) | 5 (1.4%) |
| 35 to 44 Years | 1,012 (80.6%) | 142 (14.0%) |
| 45 to 54 Years | 916 (83.6%) | 0 (0.0%) |
| 55 to 59 Years | 378 (78.1%) | 0 (0.0%) |
| 60 to 64 Years | 204 (28.7%) | 0 (0.0%) |
| 65 to 74 Years | 172 (15.4%) | 28 (16.4%) |
| 75 Years and over | 0 (0.0%) | 0 (0.0%) |
| Total | 4,295 (51.3%) | 318 (7.4%) |
Employment Status by Educational Attainment in Vidalia
According to labor force statistics for Vidalia, 72.1% of individuals (3,425) out of the total population between 25 and 64 years of age (4,751) are in the labor force, with 6.2% or 212 of them being unemployed. The group with the highest labor force participation rate are those with the educational attainment of bachelor's degree or higher, with 90.7% or 904 individuals in the labor force. Within the labor force, individuals with high school diploma education have the highest percentage of unemployment, with 19.6% or 190 of them being unemployed.
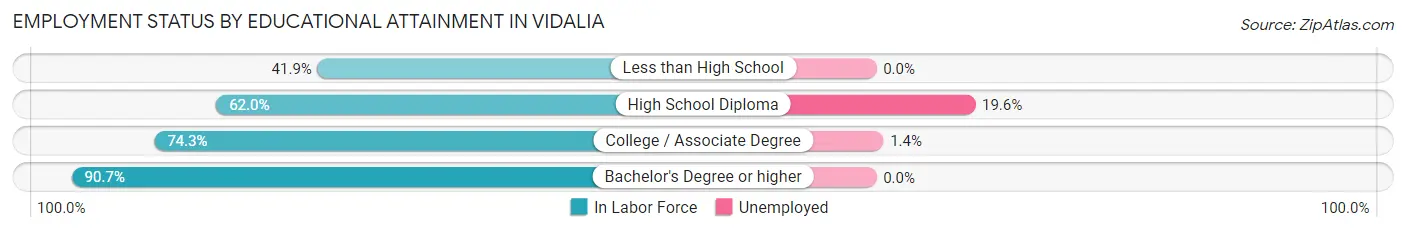
| Educational Attainment | In Labor Force | Unemployed |
| Less than High School | 96 (41.9%) | 0 (0.0%) |
| High School Diploma | 967 (62.0%) | 306 (19.6%) |
| College / Associate Degree | 1,461 (74.3%) | 28 (1.4%) |
| Bachelor's Degree or higher | 904 (90.7%) | 0 (0.0%) |
| Total | 3,425 (72.1%) | 295 (6.2%) |
Employment Occupations by Sex in Vidalia
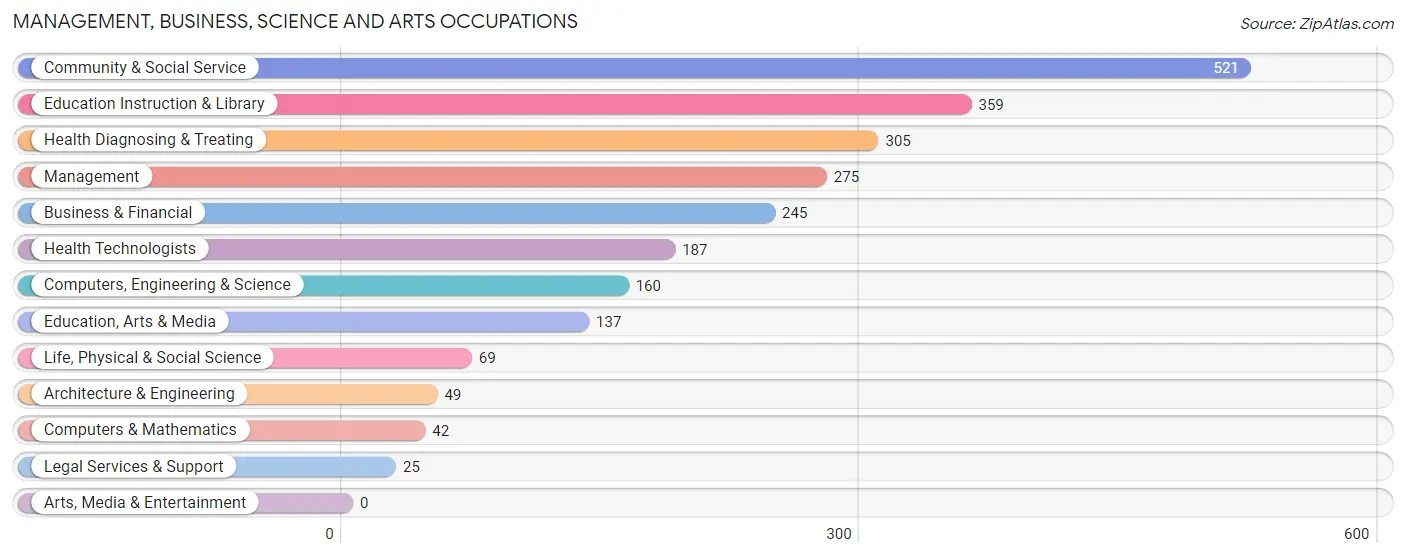
Management, Business, Science and Arts Occupations
The most common Management, Business, Science and Arts occupations in Vidalia are Community & Social Service (521 | 13.1%), Education Instruction & Library (359 | 9.0%), Health Diagnosing & Treating (305 | 7.7%), Management (275 | 6.9%), and Business & Financial (245 | 6.2%).
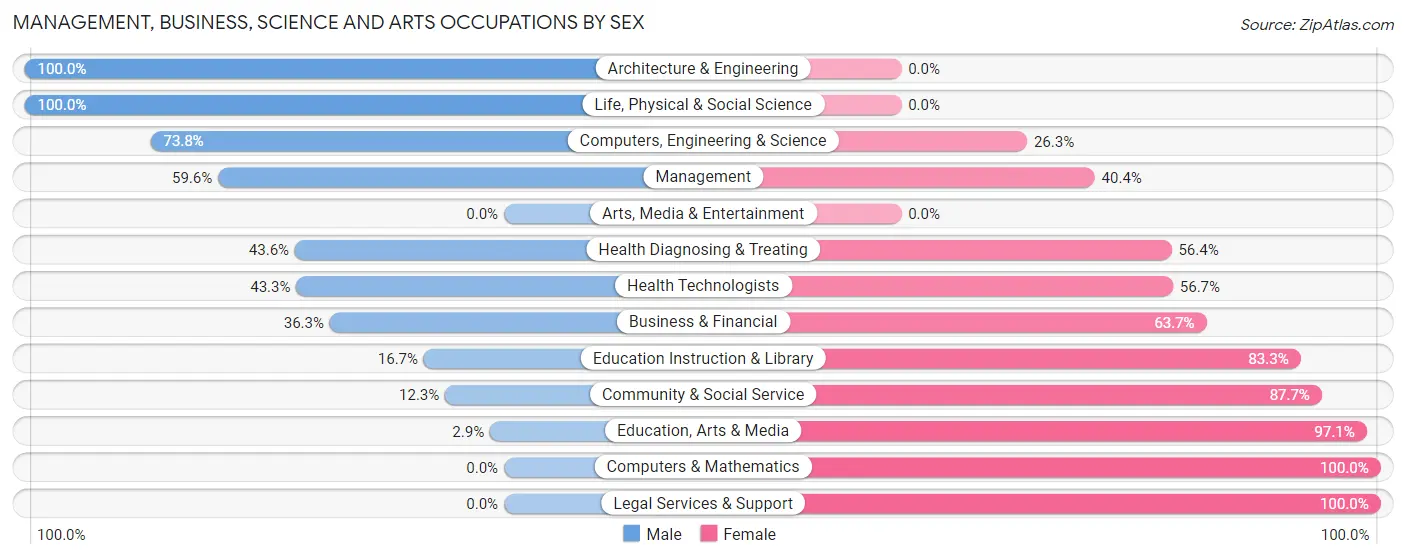
Management, Business, Science and Arts Occupations by Sex
Within the Management, Business, Science and Arts occupations in Vidalia, the most male-oriented occupations are Architecture & Engineering (100.0%), Life, Physical & Social Science (100.0%), and Computers, Engineering & Science (73.8%), while the most female-oriented occupations are Computers & Mathematics (100.0%), Legal Services & Support (100.0%), and Education, Arts & Media (97.1%).
| Occupation | Male | Female |
| Management | 164 (59.6%) | 111 (40.4%) |
| Business & Financial | 89 (36.3%) | 156 (63.7%) |
| Computers, Engineering & Science | 118 (73.8%) | 42 (26.3%) |
| Computers & Mathematics | 0 (0.0%) | 42 (100.0%) |
| Architecture & Engineering | 49 (100.0%) | 0 (0.0%) |
| Life, Physical & Social Science | 69 (100.0%) | 0 (0.0%) |
| Community & Social Service | 64 (12.3%) | 457 (87.7%) |
| Education, Arts & Media | 4 (2.9%) | 133 (97.1%) |
| Legal Services & Support | 0 (0.0%) | 25 (100.0%) |
| Education Instruction & Library | 60 (16.7%) | 299 (83.3%) |
| Arts, Media & Entertainment | 0 (0.0%) | 0 (0.0%) |
| Health Diagnosing & Treating | 133 (43.6%) | 172 (56.4%) |
| Health Technologists | 81 (43.3%) | 106 (56.7%) |
| Total (Category) | 568 (37.7%) | 938 (62.3%) |
| Total (Overall) | 1,773 (44.6%) | 2,202 (55.4%) |
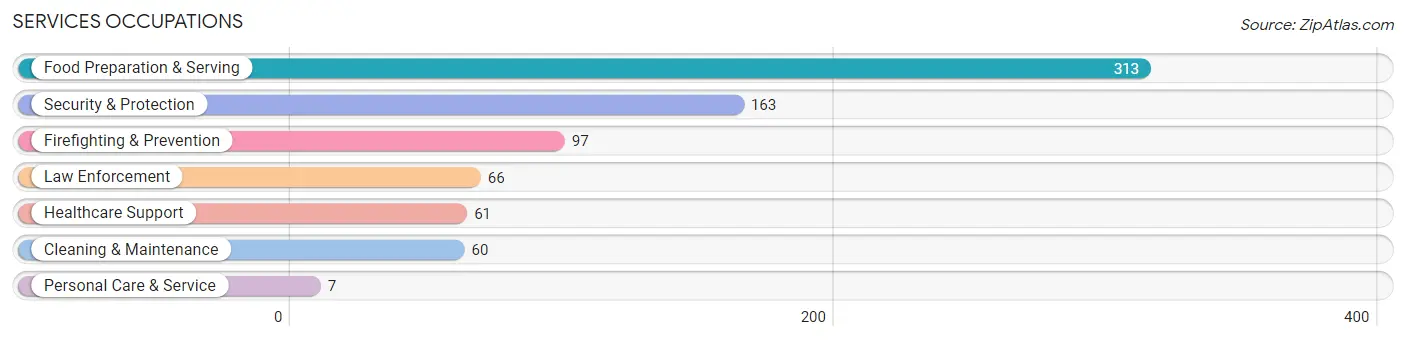
Services Occupations
The most common Services occupations in Vidalia are Food Preparation & Serving (313 | 7.9%), Security & Protection (163 | 4.1%), Firefighting & Prevention (97 | 2.4%), Law Enforcement (66 | 1.7%), and Healthcare Support (61 | 1.5%).
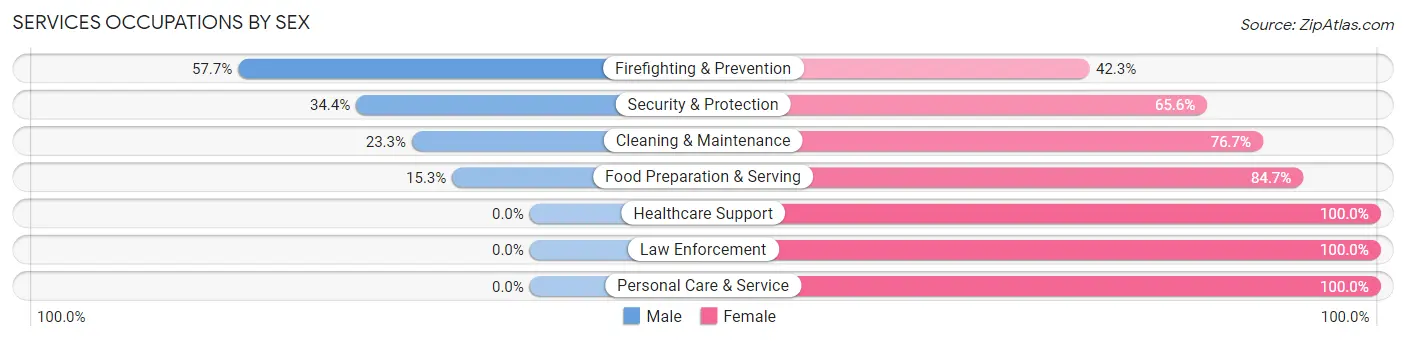
Services Occupations by Sex
Within the Services occupations in Vidalia, the most male-oriented occupations are Firefighting & Prevention (57.7%), Security & Protection (34.4%), and Cleaning & Maintenance (23.3%), while the most female-oriented occupations are Healthcare Support (100.0%), Law Enforcement (100.0%), and Personal Care & Service (100.0%).
| Occupation | Male | Female |
| Healthcare Support | 0 (0.0%) | 61 (100.0%) |
| Security & Protection | 56 (34.4%) | 107 (65.6%) |
| Firefighting & Prevention | 56 (57.7%) | 41 (42.3%) |
| Law Enforcement | 0 (0.0%) | 66 (100.0%) |
| Food Preparation & Serving | 48 (15.3%) | 265 (84.7%) |
| Cleaning & Maintenance | 14 (23.3%) | 46 (76.7%) |
| Personal Care & Service | 0 (0.0%) | 7 (100.0%) |
| Total (Category) | 118 (19.5%) | 486 (80.5%) |
| Total (Overall) | 1,773 (44.6%) | 2,202 (55.4%) |
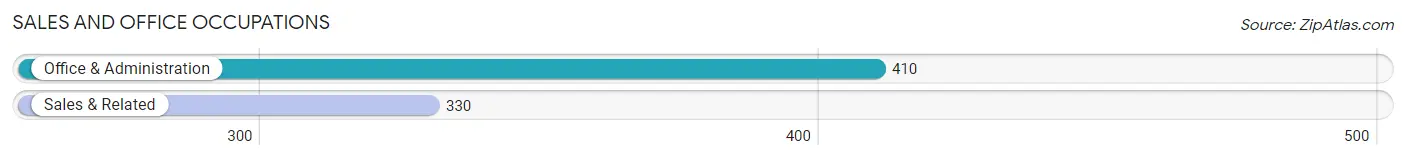
Sales and Office Occupations
The most common Sales and Office occupations in Vidalia are Office & Administration (410 | 10.3%), and Sales & Related (330 | 8.3%).
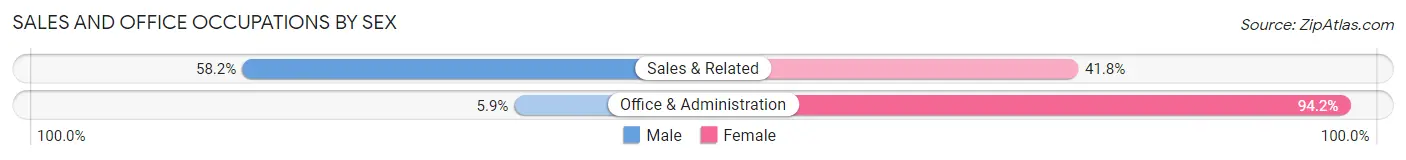
Sales and Office Occupations by Sex
| Occupation | Male | Female |
| Sales & Related | 192 (58.2%) | 138 (41.8%) |
| Office & Administration | 24 (5.9%) | 386 (94.2%) |
| Total (Category) | 216 (29.2%) | 524 (70.8%) |
| Total (Overall) | 1,773 (44.6%) | 2,202 (55.4%) |
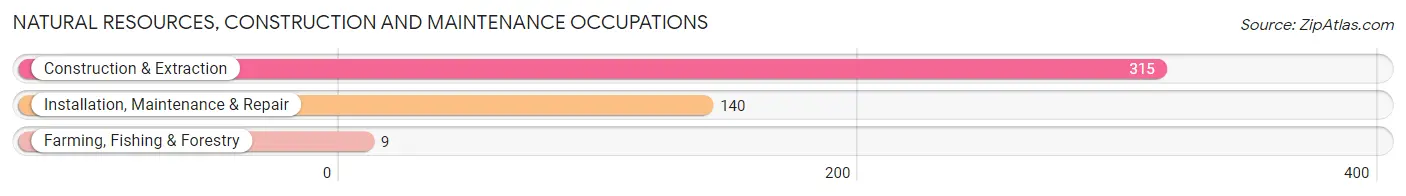
Natural Resources, Construction and Maintenance Occupations
The most common Natural Resources, Construction and Maintenance occupations in Vidalia are Construction & Extraction (315 | 7.9%), Installation, Maintenance & Repair (140 | 3.5%), and Farming, Fishing & Forestry (9 | 0.2%).
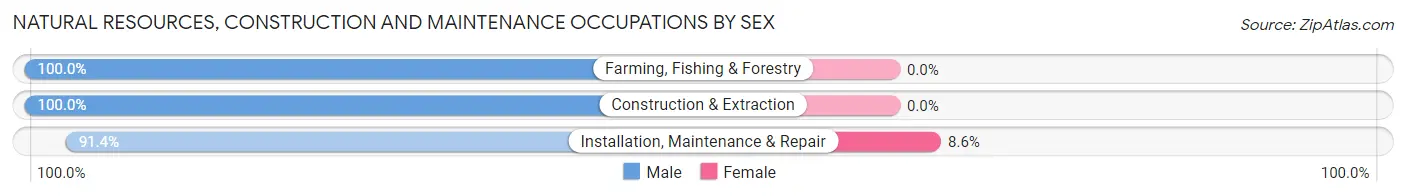
Natural Resources, Construction and Maintenance Occupations by Sex
| Occupation | Male | Female |
| Farming, Fishing & Forestry | 9 (100.0%) | 0 (0.0%) |
| Construction & Extraction | 315 (100.0%) | 0 (0.0%) |
| Installation, Maintenance & Repair | 128 (91.4%) | 12 (8.6%) |
| Total (Category) | 452 (97.4%) | 12 (2.6%) |
| Total (Overall) | 1,773 (44.6%) | 2,202 (55.4%) |
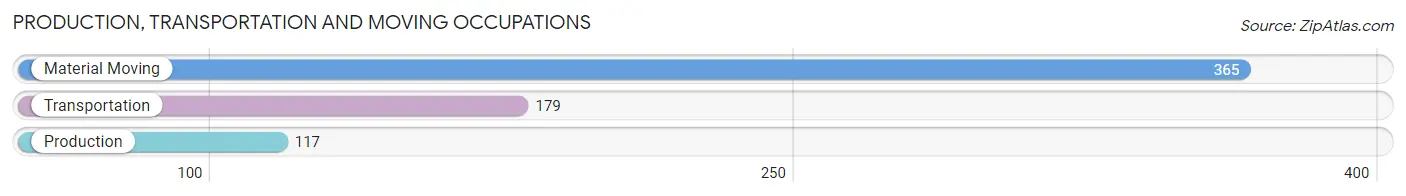
Production, Transportation and Moving Occupations
The most common Production, Transportation and Moving occupations in Vidalia are Material Moving (365 | 9.2%), Transportation (179 | 4.5%), and Production (117 | 2.9%).
Production, Transportation and Moving Occupations by Sex
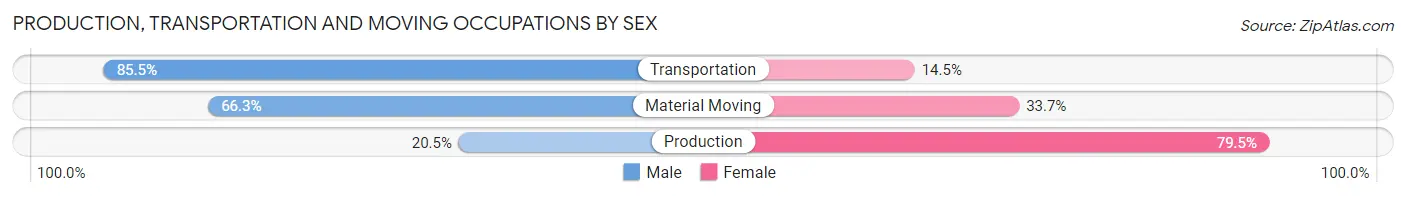
| Occupation | Male | Female |
| Production | 24 (20.5%) | 93 (79.5%) |
| Transportation | 153 (85.5%) | 26 (14.5%) |
| Material Moving | 242 (66.3%) | 123 (33.7%) |
| Total (Category) | 419 (63.4%) | 242 (36.6%) |
| Total (Overall) | 1,773 (44.6%) | 2,202 (55.4%) |
Employment Industries by Sex in Vidalia
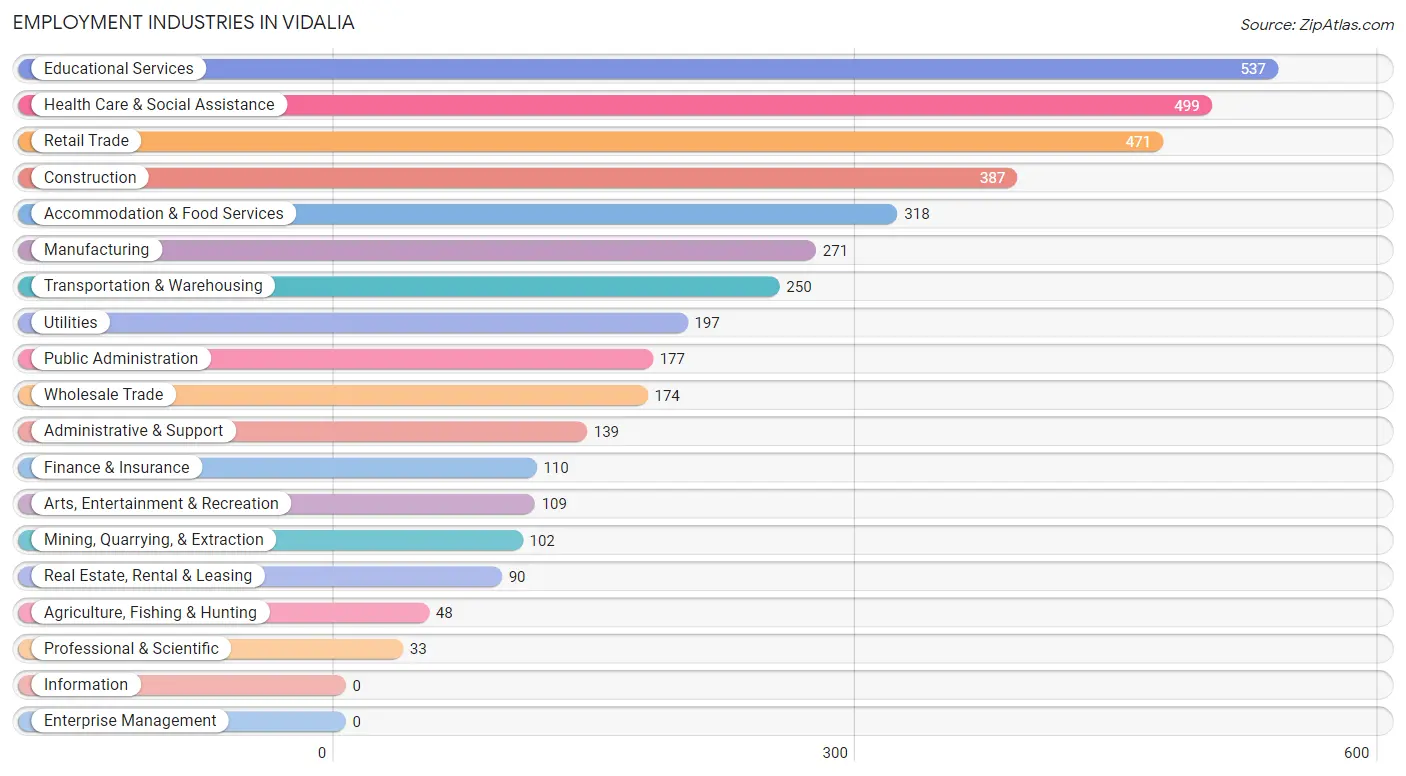
Employment Industries in Vidalia
The major employment industries in Vidalia include Educational Services (537 | 13.5%), Health Care & Social Assistance (499 | 12.6%), Retail Trade (471 | 11.8%), Construction (387 | 9.7%), and Accommodation & Food Services (318 | 8.0%).
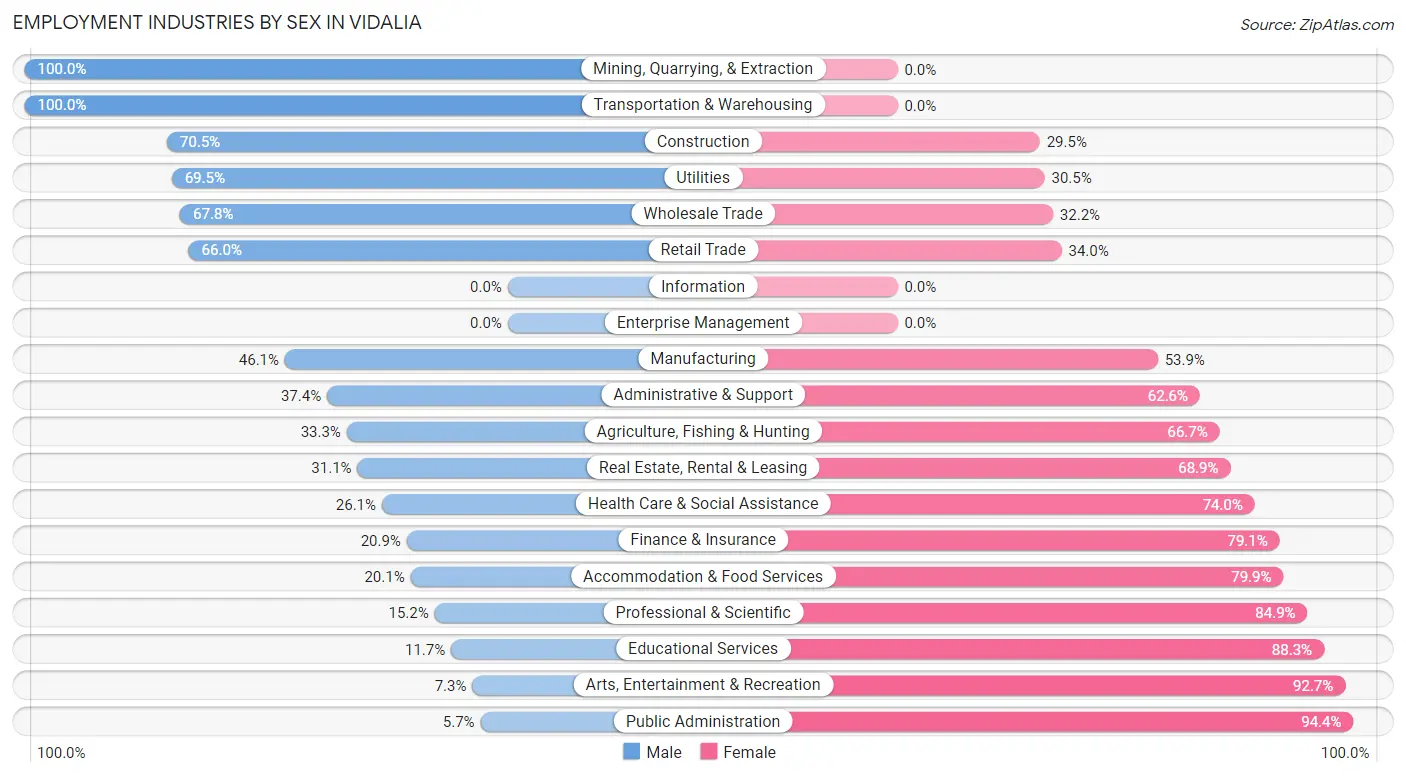
Employment Industries by Sex in Vidalia
The Vidalia industries that see more men than women are Mining, Quarrying, & Extraction (100.0%), Transportation & Warehousing (100.0%), and Construction (70.5%), whereas the industries that tend to have a higher number of women are Public Administration (94.4%), Arts, Entertainment & Recreation (92.7%), and Educational Services (88.3%).
| Industry | Male | Female |
| Agriculture, Fishing & Hunting | 16 (33.3%) | 32 (66.7%) |
| Mining, Quarrying, & Extraction | 102 (100.0%) | 0 (0.0%) |
| Construction | 273 (70.5%) | 114 (29.5%) |
| Manufacturing | 125 (46.1%) | 146 (53.9%) |
| Wholesale Trade | 118 (67.8%) | 56 (32.2%) |
| Retail Trade | 311 (66.0%) | 160 (34.0%) |
| Transportation & Warehousing | 250 (100.0%) | 0 (0.0%) |
| Utilities | 137 (69.5%) | 60 (30.5%) |
| Information | 0 (0.0%) | 0 (0.0%) |
| Finance & Insurance | 23 (20.9%) | 87 (79.1%) |
| Real Estate, Rental & Leasing | 28 (31.1%) | 62 (68.9%) |
| Professional & Scientific | 5 (15.1%) | 28 (84.9%) |
| Enterprise Management | 0 (0.0%) | 0 (0.0%) |
| Administrative & Support | 52 (37.4%) | 87 (62.6%) |
| Educational Services | 63 (11.7%) | 474 (88.3%) |
| Health Care & Social Assistance | 130 (26.1%) | 369 (74.0%) |
| Arts, Entertainment & Recreation | 8 (7.3%) | 101 (92.7%) |
| Accommodation & Food Services | 64 (20.1%) | 254 (79.9%) |
| Public Administration | 10 (5.7%) | 167 (94.4%) |
| Total | 1,773 (44.6%) | 2,202 (55.4%) |
Education in Vidalia
School Enrollment in Vidalia
The most common levels of schooling among the 2,922 students in Vidalia are middle school (885 | 30.3%), high school (686 | 23.5%), and college / undergraduate (672 | 23.0%).
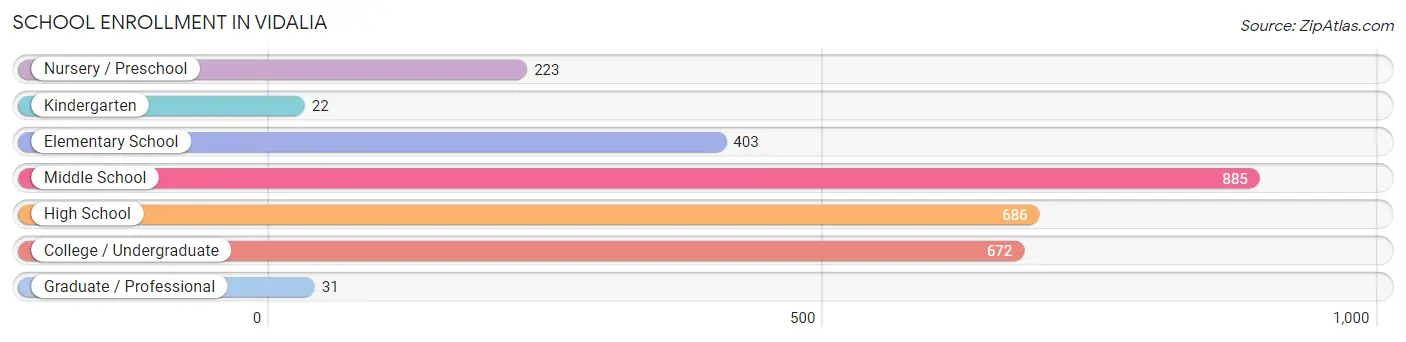
| School Level | # Students | % Students |
| Nursery / Preschool | 223 | 7.6% |
| Kindergarten | 22 | 0.7% |
| Elementary School | 403 | 13.8% |
| Middle School | 885 | 30.3% |
| High School | 686 | 23.5% |
| College / Undergraduate | 672 | 23.0% |
| Graduate / Professional | 31 | 1.1% |
| Total | 2,922 | 100.0% |
School Enrollment by Age by Funding Source in Vidalia
Out of a total of 2,922 students who are enrolled in schools in Vidalia, 348 (11.9%) attend a private institution, while the remaining 2,574 (88.1%) are enrolled in public schools. The age group of 5 to 9 year old has the highest likelihood of being enrolled in private schools, with 197 (38.6% in the age bracket) enrolled. Conversely, the age group of 20 to 24 year olds has the lowest likelihood of being enrolled in a private school, with 220 (100.0% in the age bracket) attending a public institution.
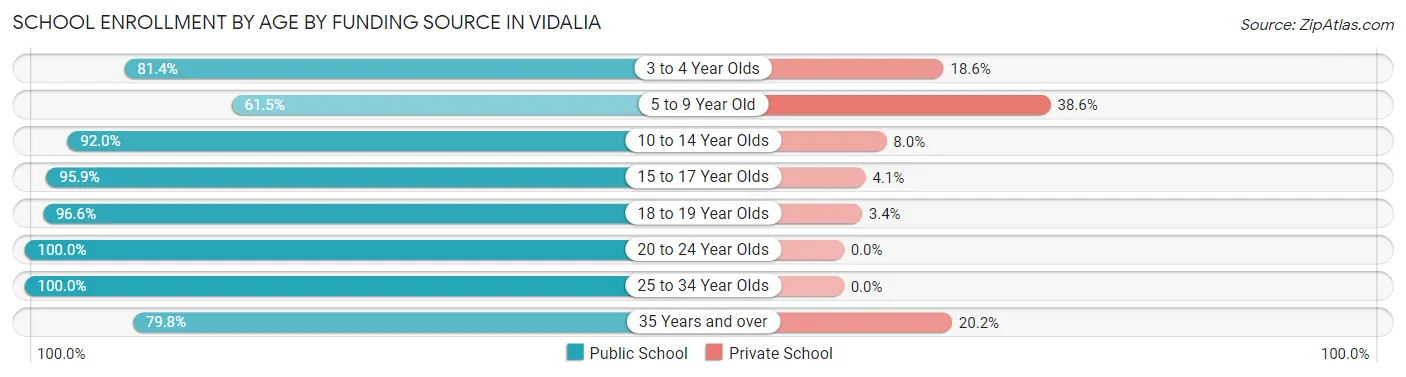
| Age Bracket | Public School | Private School |
| 3 to 4 Year Olds | 70 (81.4%) | 16 (18.6%) |
| 5 to 9 Year Old | 314 (61.5%) | 197 (38.6%) |
| 10 to 14 Year Olds | 913 (92.0%) | 79 (8.0%) |
| 15 to 17 Year Olds | 544 (95.9%) | 23 (4.1%) |
| 18 to 19 Year Olds | 200 (96.6%) | 7 (3.4%) |
| 20 to 24 Year Olds | 220 (100.0%) | 0 (0.0%) |
| 25 to 34 Year Olds | 210 (100.0%) | 0 (0.0%) |
| 35 Years and over | 103 (79.8%) | 26 (20.2%) |
| Total | 2,574 (88.1%) | 348 (11.9%) |
Educational Attainment by Field of Study in Vidalia
Education (367 | 22.4%), business (248 | 15.1%), arts & humanities (200 | 12.2%), science & technology (183 | 11.2%), and social sciences (145 | 8.9%) are the most common fields of study among 1,637 individuals in Vidalia who have obtained a bachelor's degree or higher.
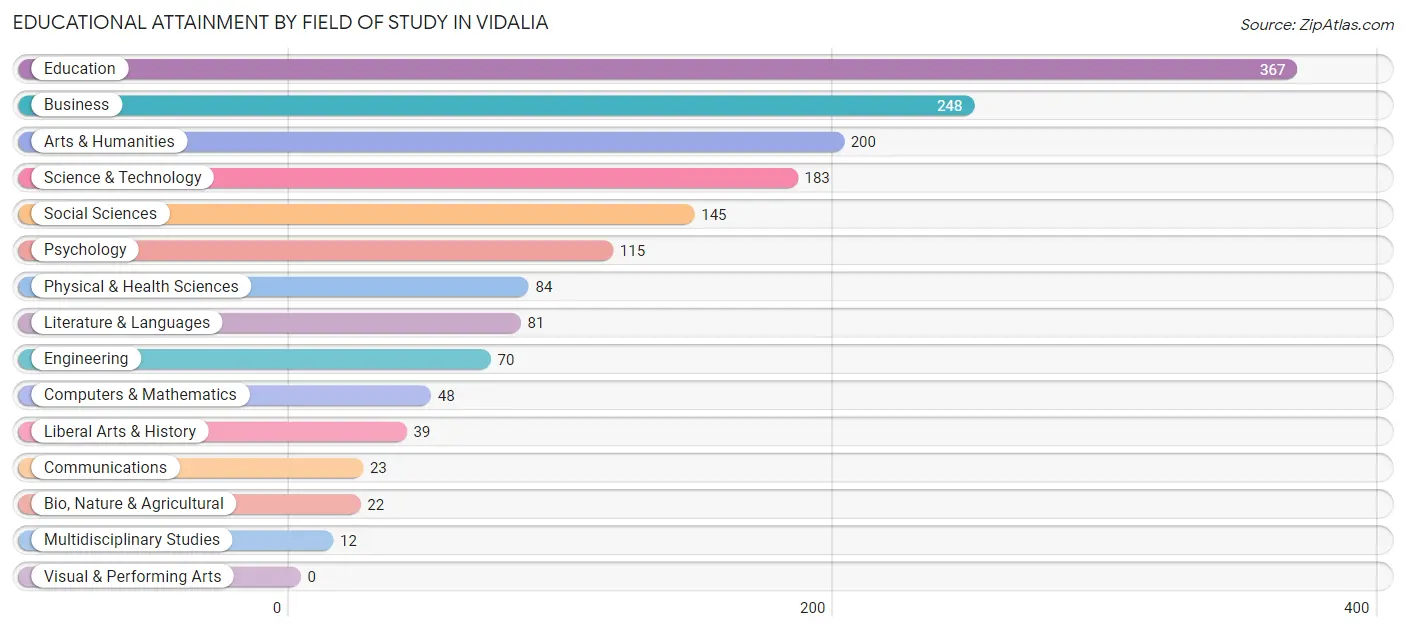
| Field of Study | # Graduates | % Graduates |
| Computers & Mathematics | 48 | 2.9% |
| Bio, Nature & Agricultural | 22 | 1.3% |
| Physical & Health Sciences | 84 | 5.1% |
| Psychology | 115 | 7.0% |
| Social Sciences | 145 | 8.9% |
| Engineering | 70 | 4.3% |
| Multidisciplinary Studies | 12 | 0.7% |
| Science & Technology | 183 | 11.2% |
| Business | 248 | 15.1% |
| Education | 367 | 22.4% |
| Literature & Languages | 81 | 5.0% |
| Liberal Arts & History | 39 | 2.4% |
| Visual & Performing Arts | 0 | 0.0% |
| Communications | 23 | 1.4% |
| Arts & Humanities | 200 | 12.2% |
| Total | 1,637 | 100.0% |
Transportation & Commute in Vidalia
Vehicle Availability by Sex in Vidalia
The most prevalent vehicle ownership categories in Vidalia are males with 2 vehicles (590, accounting for 33.9%) and females with 2 vehicles (576, making up 27.2%).
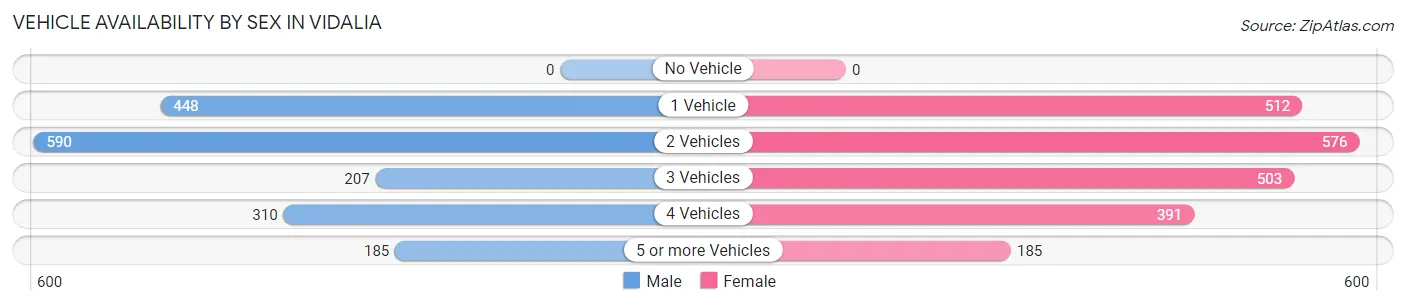
| Vehicles Available | Male | Female |
| No Vehicle | 0 (0.0%) | 0 (0.0%) |
| 1 Vehicle | 448 (25.8%) | 512 (23.6%) |
| 2 Vehicles | 590 (33.9%) | 576 (26.6%) |
| 3 Vehicles | 207 (11.9%) | 503 (23.2%) |
| 4 Vehicles | 310 (17.8%) | 391 (18.0%) |
| 5 or more Vehicles | 185 (10.6%) | 185 (8.5%) |
| Total | 1,740 (100.0%) | 2,167 (100.0%) |
Commute Time in Vidalia
The most frequently occuring commute durations in Vidalia are 10 to 14 minutes (834 commuters, 21.9%), 15 to 19 minutes (724 commuters, 19.0%), and 5 to 9 minutes (670 commuters, 17.6%).
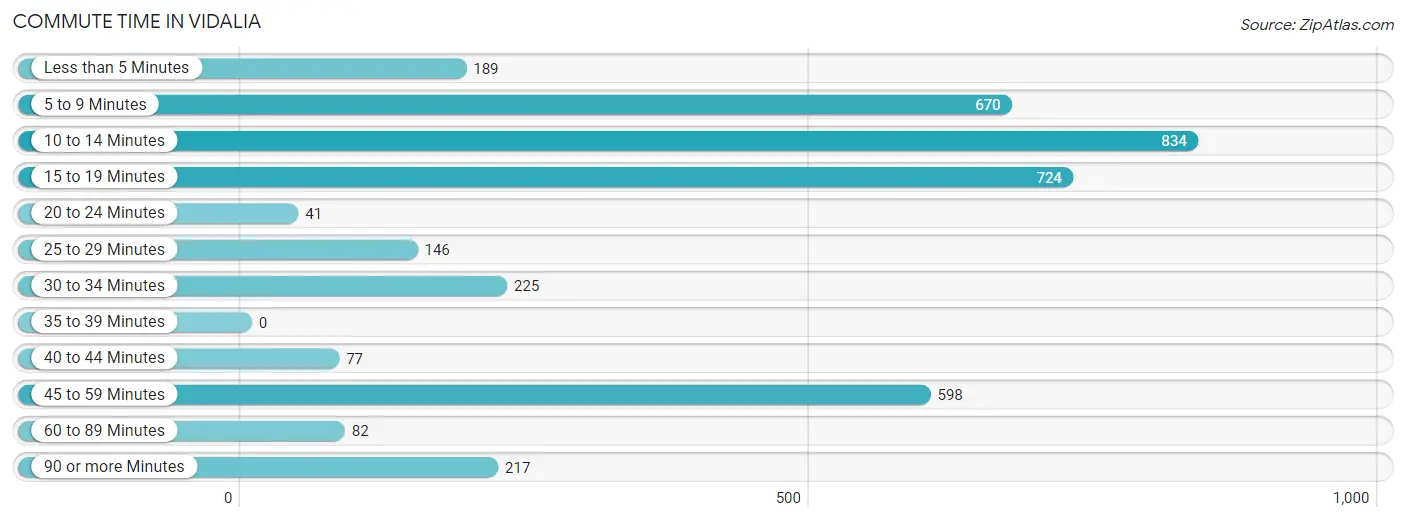
| Commute Time | # Commuters | % Commuters |
| Less than 5 Minutes | 189 | 5.0% |
| 5 to 9 Minutes | 670 | 17.6% |
| 10 to 14 Minutes | 834 | 21.9% |
| 15 to 19 Minutes | 724 | 19.0% |
| 20 to 24 Minutes | 41 | 1.1% |
| 25 to 29 Minutes | 146 | 3.8% |
| 30 to 34 Minutes | 225 | 5.9% |
| 35 to 39 Minutes | 0 | 0.0% |
| 40 to 44 Minutes | 77 | 2.0% |
| 45 to 59 Minutes | 598 | 15.7% |
| 60 to 89 Minutes | 82 | 2.2% |
| 90 or more Minutes | 217 | 5.7% |
Commute Time by Sex in Vidalia
The most common commute times in Vidalia are 10 to 14 minutes (527 commuters, 30.3%) for males and 45 to 59 minutes (461 commuters, 22.3%) for females.
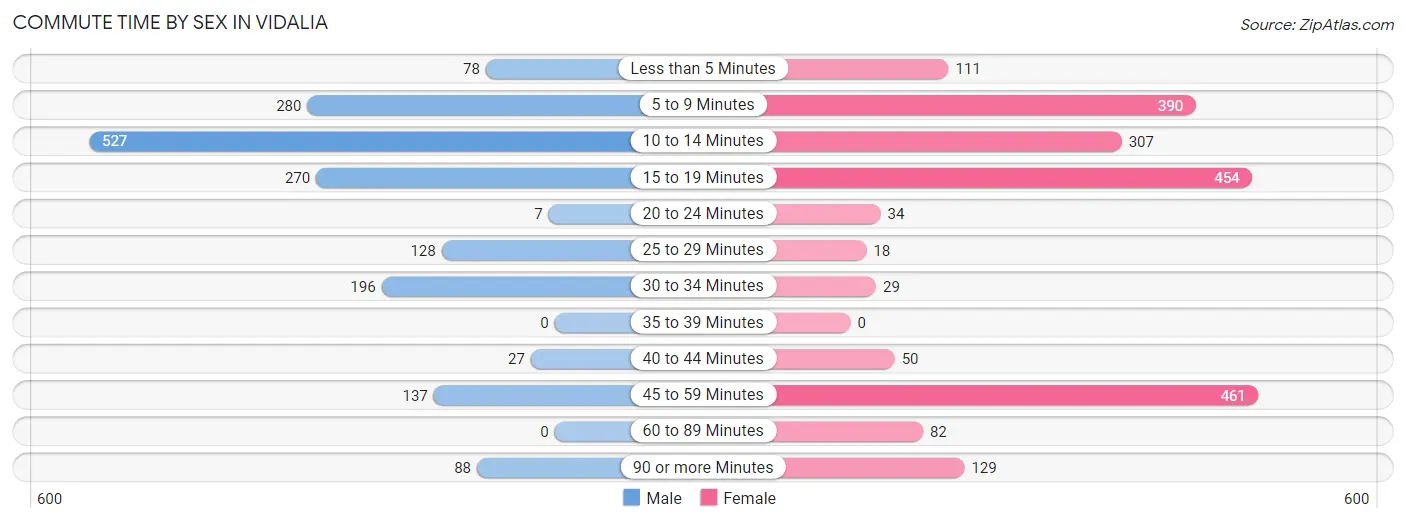
| Commute Time | Male | Female |
| Less than 5 Minutes | 78 (4.5%) | 111 (5.4%) |
| 5 to 9 Minutes | 280 (16.1%) | 390 (18.9%) |
| 10 to 14 Minutes | 527 (30.3%) | 307 (14.9%) |
| 15 to 19 Minutes | 270 (15.5%) | 454 (22.0%) |
| 20 to 24 Minutes | 7 (0.4%) | 34 (1.7%) |
| 25 to 29 Minutes | 128 (7.4%) | 18 (0.9%) |
| 30 to 34 Minutes | 196 (11.3%) | 29 (1.4%) |
| 35 to 39 Minutes | 0 (0.0%) | 0 (0.0%) |
| 40 to 44 Minutes | 27 (1.5%) | 50 (2.4%) |
| 45 to 59 Minutes | 137 (7.9%) | 461 (22.3%) |
| 60 to 89 Minutes | 0 (0.0%) | 82 (4.0%) |
| 90 or more Minutes | 88 (5.1%) | 129 (6.2%) |
Time of Departure to Work by Sex in Vidalia
The most frequent times of departure to work in Vidalia are 7:00 AM to 7:29 AM (267, 15.4%) for males and 7:30 AM to 7:59 AM (534, 25.9%) for females.
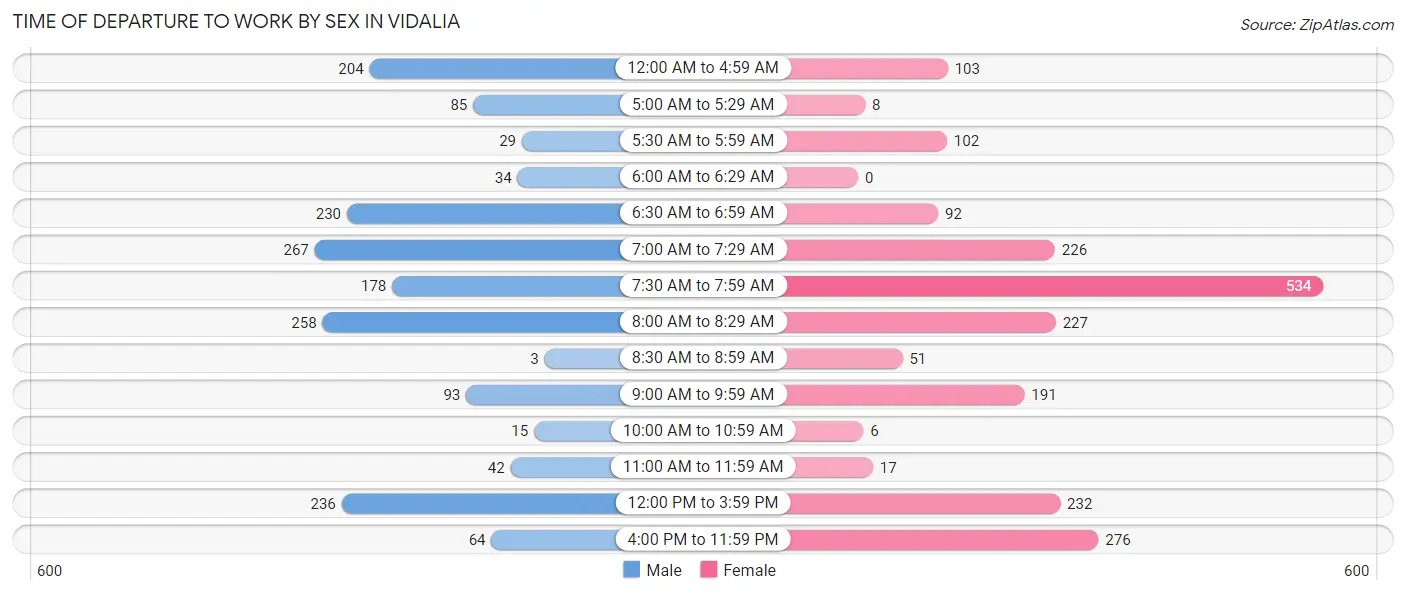
| Time of Departure | Male | Female |
| 12:00 AM to 4:59 AM | 204 (11.7%) | 103 (5.0%) |
| 5:00 AM to 5:29 AM | 85 (4.9%) | 8 (0.4%) |
| 5:30 AM to 5:59 AM | 29 (1.7%) | 102 (4.9%) |
| 6:00 AM to 6:29 AM | 34 (2.0%) | 0 (0.0%) |
| 6:30 AM to 6:59 AM | 230 (13.2%) | 92 (4.5%) |
| 7:00 AM to 7:29 AM | 267 (15.4%) | 226 (10.9%) |
| 7:30 AM to 7:59 AM | 178 (10.2%) | 534 (25.9%) |
| 8:00 AM to 8:29 AM | 258 (14.8%) | 227 (11.0%) |
| 8:30 AM to 8:59 AM | 3 (0.2%) | 51 (2.5%) |
| 9:00 AM to 9:59 AM | 93 (5.3%) | 191 (9.2%) |
| 10:00 AM to 10:59 AM | 15 (0.9%) | 6 (0.3%) |
| 11:00 AM to 11:59 AM | 42 (2.4%) | 17 (0.8%) |
| 12:00 PM to 3:59 PM | 236 (13.6%) | 232 (11.2%) |
| 4:00 PM to 11:59 PM | 64 (3.7%) | 276 (13.4%) |
| Total | 1,738 (100.0%) | 2,065 (100.0%) |
Housing Occupancy in Vidalia
Occupancy by Ownership in Vidalia
Of the total 3,955 dwellings in Vidalia, owner-occupied units account for 2,121 (53.6%), while renter-occupied units make up 1,834 (46.4%).
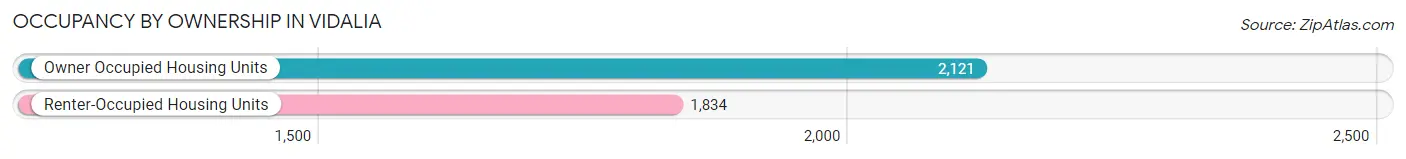
| Occupancy | # Housing Units | % Housing Units |
| Owner Occupied Housing Units | 2,121 | 53.6% |
| Renter-Occupied Housing Units | 1,834 | 46.4% |
| Total Occupied Housing Units | 3,955 | 100.0% |
Occupancy by Household Size in Vidalia
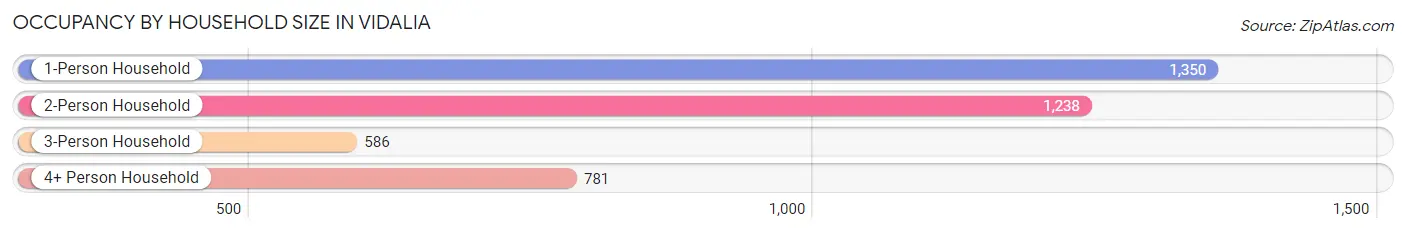
| Household Size | # Housing Units | % Housing Units |
| 1-Person Household | 1,350 | 34.1% |
| 2-Person Household | 1,238 | 31.3% |
| 3-Person Household | 586 | 14.8% |
| 4+ Person Household | 781 | 19.8% |
| Total Housing Units | 3,955 | 100.0% |
Occupancy by Ownership by Household Size in Vidalia
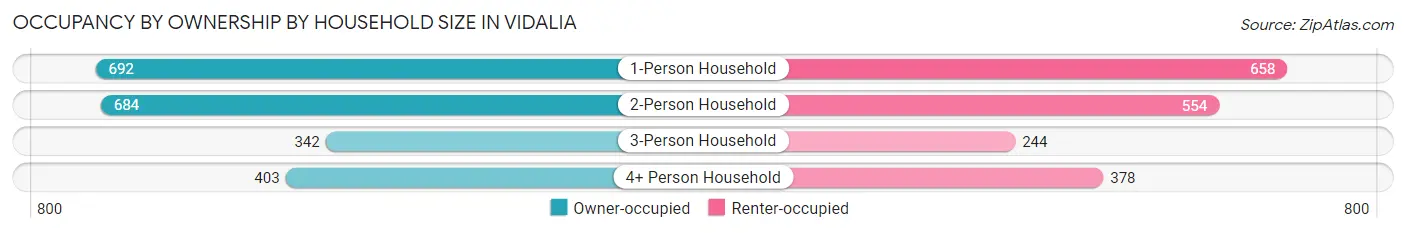
| Household Size | Owner-occupied | Renter-occupied |
| 1-Person Household | 692 (51.3%) | 658 (48.7%) |
| 2-Person Household | 684 (55.2%) | 554 (44.8%) |
| 3-Person Household | 342 (58.4%) | 244 (41.6%) |
| 4+ Person Household | 403 (51.6%) | 378 (48.4%) |
| Total Housing Units | 2,121 (53.6%) | 1,834 (46.4%) |
Occupancy by Educational Attainment in Vidalia
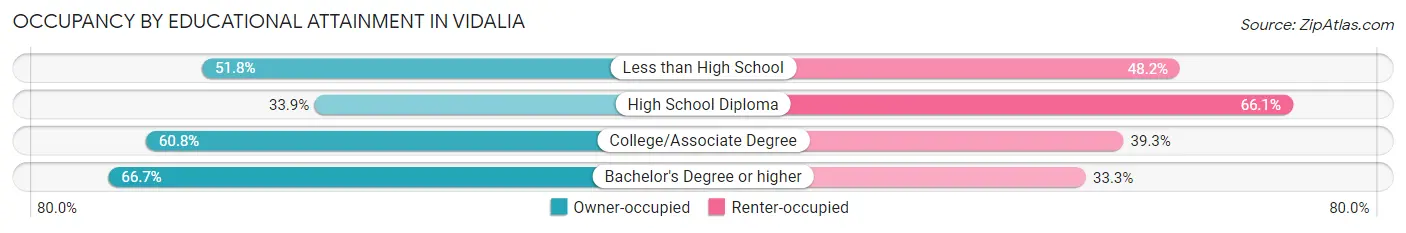
| Household Size | Owner-occupied | Renter-occupied |
| Less than High School | 170 (51.8%) | 158 (48.2%) |
| High School Diploma | 395 (33.9%) | 769 (66.1%) |
| College/Associate Degree | 887 (60.8%) | 573 (39.3%) |
| Bachelor's Degree or higher | 669 (66.7%) | 334 (33.3%) |
Occupancy by Age of Householder in Vidalia
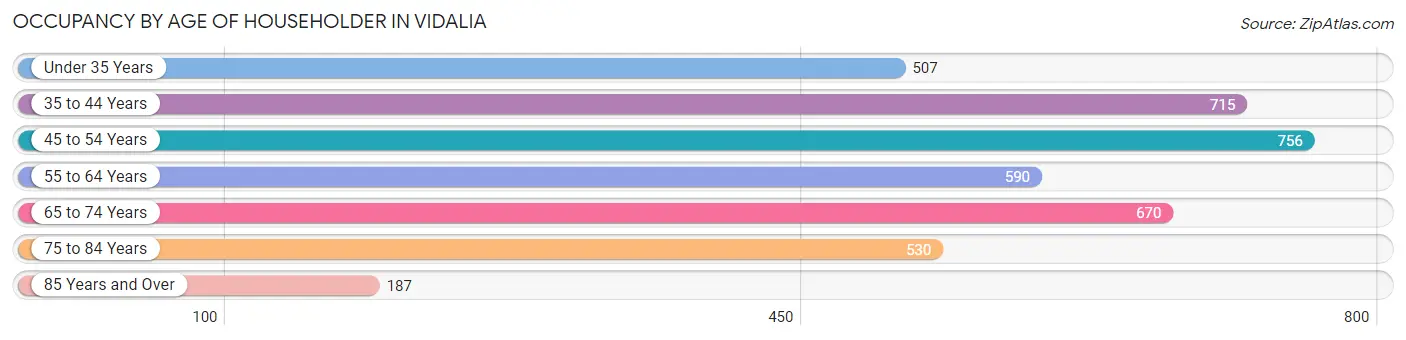
| Age Bracket | # Households | % Households |
| Under 35 Years | 507 | 12.8% |
| 35 to 44 Years | 715 | 18.1% |
| 45 to 54 Years | 756 | 19.1% |
| 55 to 64 Years | 590 | 14.9% |
| 65 to 74 Years | 670 | 16.9% |
| 75 to 84 Years | 530 | 13.4% |
| 85 Years and Over | 187 | 4.7% |
| Total | 3,955 | 100.0% |
Housing Finances in Vidalia
Median Income by Occupancy in Vidalia
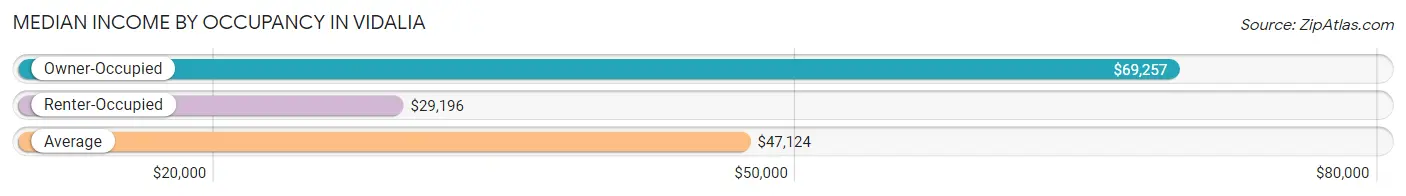
| Occupancy Type | # Households | Median Income |
| Owner-Occupied | 2,121 (53.6%) | $69,257 |
| Renter-Occupied | 1,834 (46.4%) | $29,196 |
| Average | 3,955 (100.0%) | $47,124 |
Occupancy by Householder Income Bracket in Vidalia
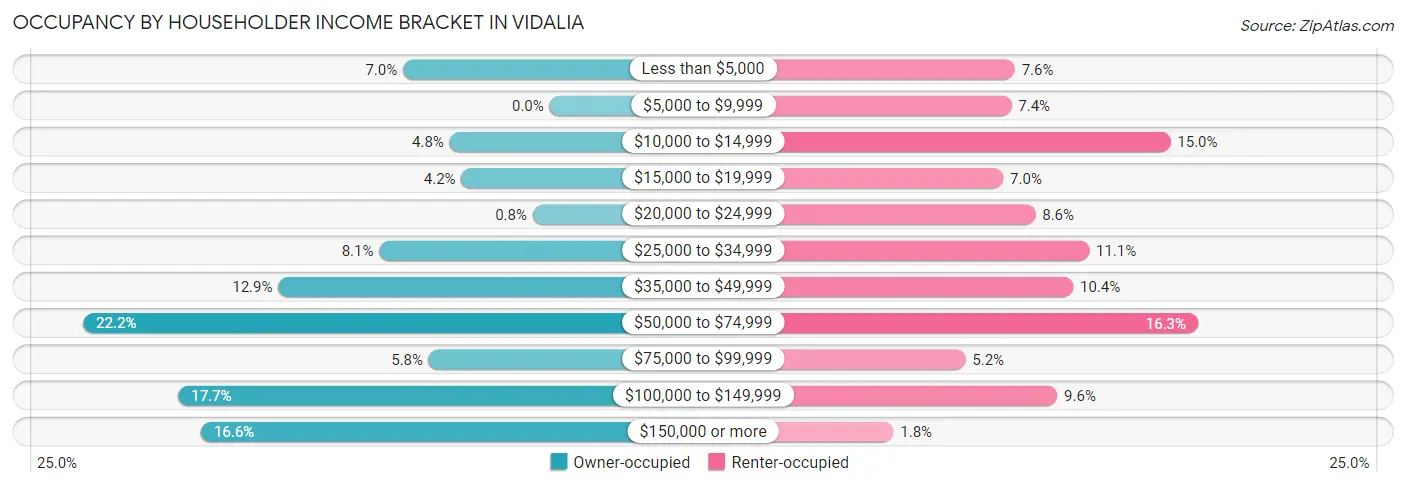
| Income Bracket | Owner-occupied | Renter-occupied |
| Less than $5,000 | 148 (7.0%) | 139 (7.6%) |
| $5,000 to $9,999 | 0 (0.0%) | 136 (7.4%) |
| $10,000 to $14,999 | 101 (4.8%) | 275 (15.0%) |
| $15,000 to $19,999 | 89 (4.2%) | 129 (7.0%) |
| $20,000 to $24,999 | 17 (0.8%) | 157 (8.6%) |
| $25,000 to $34,999 | 172 (8.1%) | 204 (11.1%) |
| $35,000 to $49,999 | 274 (12.9%) | 190 (10.4%) |
| $50,000 to $74,999 | 471 (22.2%) | 299 (16.3%) |
| $75,000 to $99,999 | 122 (5.8%) | 96 (5.2%) |
| $100,000 to $149,999 | 375 (17.7%) | 176 (9.6%) |
| $150,000 or more | 352 (16.6%) | 33 (1.8%) |
| Total | 2,121 (100.0%) | 1,834 (100.0%) |
Monthly Housing Cost Tiers in Vidalia
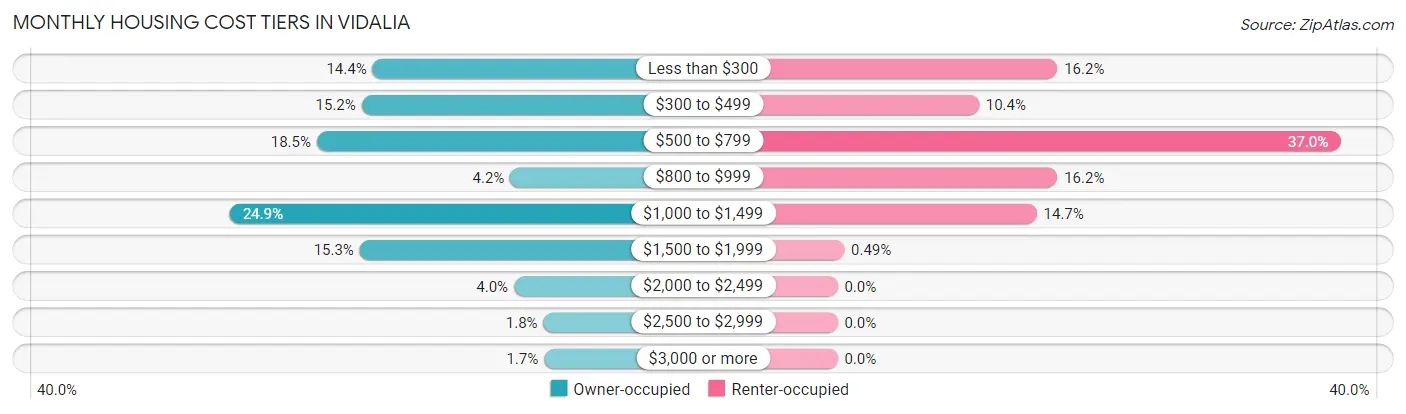
| Monthly Cost | Owner-occupied | Renter-occupied |
| Less than $300 | 305 (14.4%) | 297 (16.2%) |
| $300 to $499 | 322 (15.2%) | 191 (10.4%) |
| $500 to $799 | 392 (18.5%) | 679 (37.0%) |
| $800 to $999 | 90 (4.2%) | 297 (16.2%) |
| $1,000 to $1,499 | 528 (24.9%) | 269 (14.7%) |
| $1,500 to $1,999 | 325 (15.3%) | 9 (0.5%) |
| $2,000 to $2,499 | 84 (4.0%) | 0 (0.0%) |
| $2,500 to $2,999 | 38 (1.8%) | 0 (0.0%) |
| $3,000 or more | 37 (1.7%) | 0 (0.0%) |
| Total | 2,121 (100.0%) | 1,834 (100.0%) |
Physical Housing Characteristics in Vidalia
Housing Structures in Vidalia
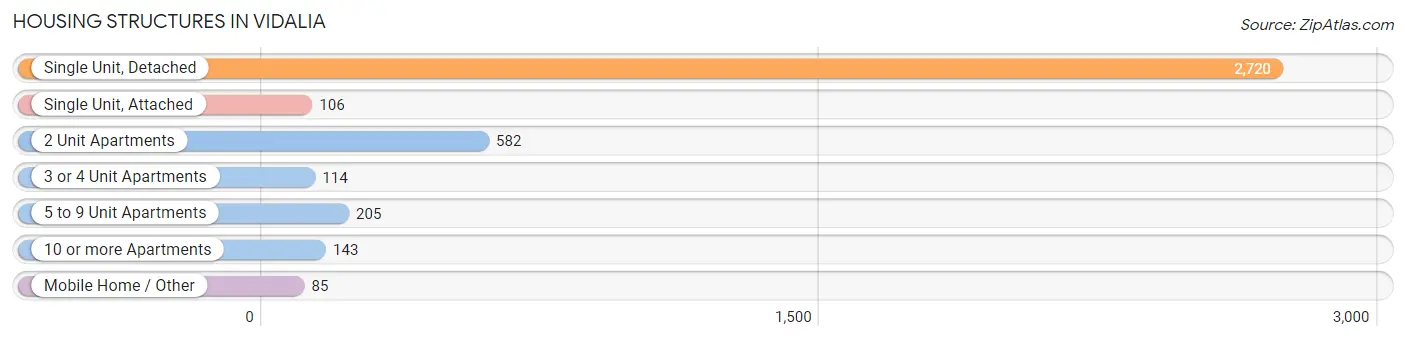
| Structure Type | # Housing Units | % Housing Units |
| Single Unit, Detached | 2,720 | 68.8% |
| Single Unit, Attached | 106 | 2.7% |
| 2 Unit Apartments | 582 | 14.7% |
| 3 or 4 Unit Apartments | 114 | 2.9% |
| 5 to 9 Unit Apartments | 205 | 5.2% |
| 10 or more Apartments | 143 | 3.6% |
| Mobile Home / Other | 85 | 2.1% |
| Total | 3,955 | 100.0% |
Housing Structures by Occupancy in Vidalia
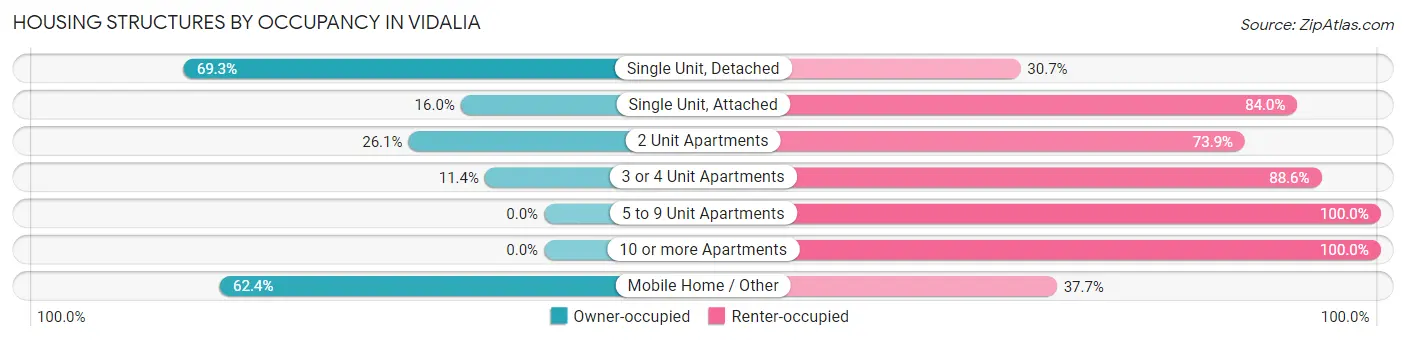
| Structure Type | Owner-occupied | Renter-occupied |
| Single Unit, Detached | 1,886 (69.3%) | 834 (30.7%) |
| Single Unit, Attached | 17 (16.0%) | 89 (84.0%) |
| 2 Unit Apartments | 152 (26.1%) | 430 (73.9%) |
| 3 or 4 Unit Apartments | 13 (11.4%) | 101 (88.6%) |
| 5 to 9 Unit Apartments | 0 (0.0%) | 205 (100.0%) |
| 10 or more Apartments | 0 (0.0%) | 143 (100.0%) |
| Mobile Home / Other | 53 (62.4%) | 32 (37.7%) |
| Total | 2,121 (53.6%) | 1,834 (46.4%) |
Housing Structures by Number of Rooms in Vidalia
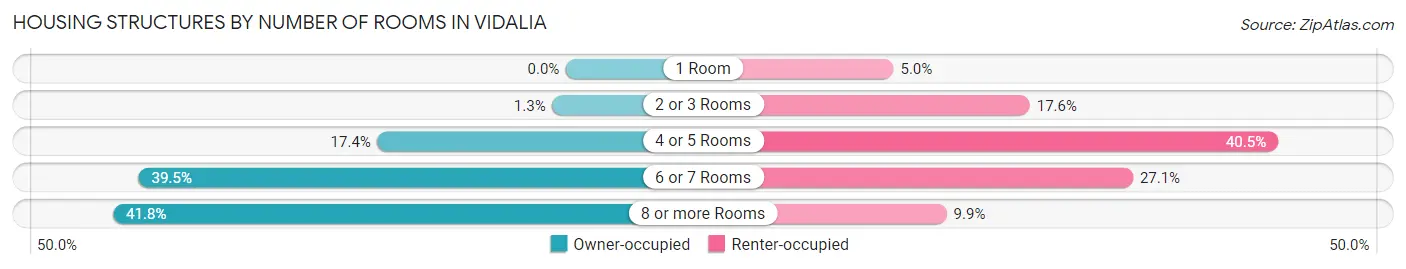
| Number of Rooms | Owner-occupied | Renter-occupied |
| 1 Room | 0 (0.0%) | 91 (5.0%) |
| 2 or 3 Rooms | 27 (1.3%) | 322 (17.6%) |
| 4 or 5 Rooms | 370 (17.4%) | 743 (40.5%) |
| 6 or 7 Rooms | 837 (39.5%) | 497 (27.1%) |
| 8 or more Rooms | 887 (41.8%) | 181 (9.9%) |
| Total | 2,121 (100.0%) | 1,834 (100.0%) |
Housing Structure by Heating Type in Vidalia
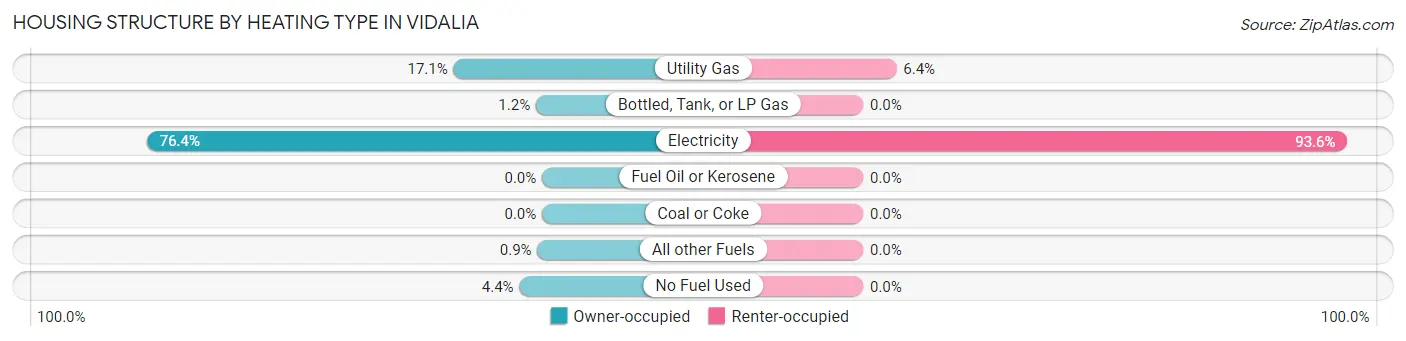
| Heating Type | Owner-occupied | Renter-occupied |
| Utility Gas | 363 (17.1%) | 118 (6.4%) |
| Bottled, Tank, or LP Gas | 25 (1.2%) | 0 (0.0%) |
| Electricity | 1,621 (76.4%) | 1,716 (93.6%) |
| Fuel Oil or Kerosene | 0 (0.0%) | 0 (0.0%) |
| Coal or Coke | 0 (0.0%) | 0 (0.0%) |
| All other Fuels | 19 (0.9%) | 0 (0.0%) |
| No Fuel Used | 93 (4.4%) | 0 (0.0%) |
| Total | 2,121 (100.0%) | 1,834 (100.0%) |
Household Vehicle Usage in Vidalia
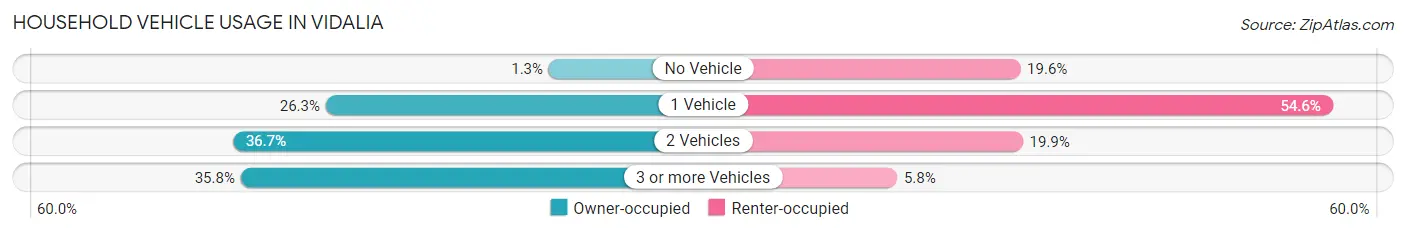
| Vehicles per Household | Owner-occupied | Renter-occupied |
| No Vehicle | 27 (1.3%) | 360 (19.6%) |
| 1 Vehicle | 557 (26.3%) | 1,002 (54.6%) |
| 2 Vehicles | 778 (36.7%) | 365 (19.9%) |
| 3 or more Vehicles | 759 (35.8%) | 107 (5.8%) |
| Total | 2,121 (100.0%) | 1,834 (100.0%) |
Real Estate & Mortgages in Vidalia
Real Estate and Mortgage Overview in Vidalia
| Characteristic | Without Mortgage | With Mortgage |
| Housing Units | 901 | 1,220 |
| Median Property Value | $122,900 | $156,100 |
| Median Household Income | $66,576 | $159 |
| Monthly Housing Costs | $418 | $37 |
| Real Estate Taxes | $1,388 | $5 |
Property Value by Mortgage Status in Vidalia
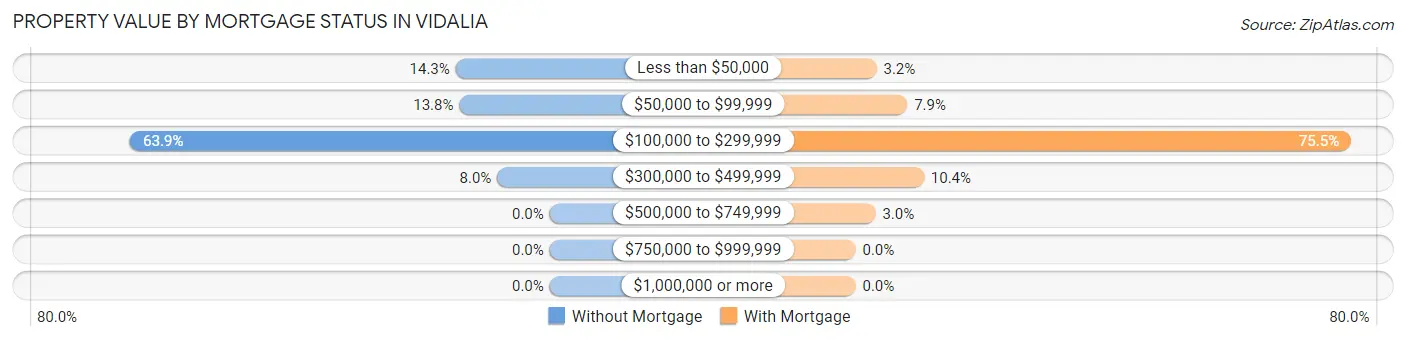
| Property Value | Without Mortgage | With Mortgage |
| Less than $50,000 | 129 (14.3%) | 39 (3.2%) |
| $50,000 to $99,999 | 124 (13.8%) | 96 (7.9%) |
| $100,000 to $299,999 | 576 (63.9%) | 921 (75.5%) |
| $300,000 to $499,999 | 72 (8.0%) | 127 (10.4%) |
| $500,000 to $749,999 | 0 (0.0%) | 37 (3.0%) |
| $750,000 to $999,999 | 0 (0.0%) | 0 (0.0%) |
| $1,000,000 or more | 0 (0.0%) | 0 (0.0%) |
| Total | 901 (100.0%) | 1,220 (100.0%) |
Household Income by Mortgage Status in Vidalia
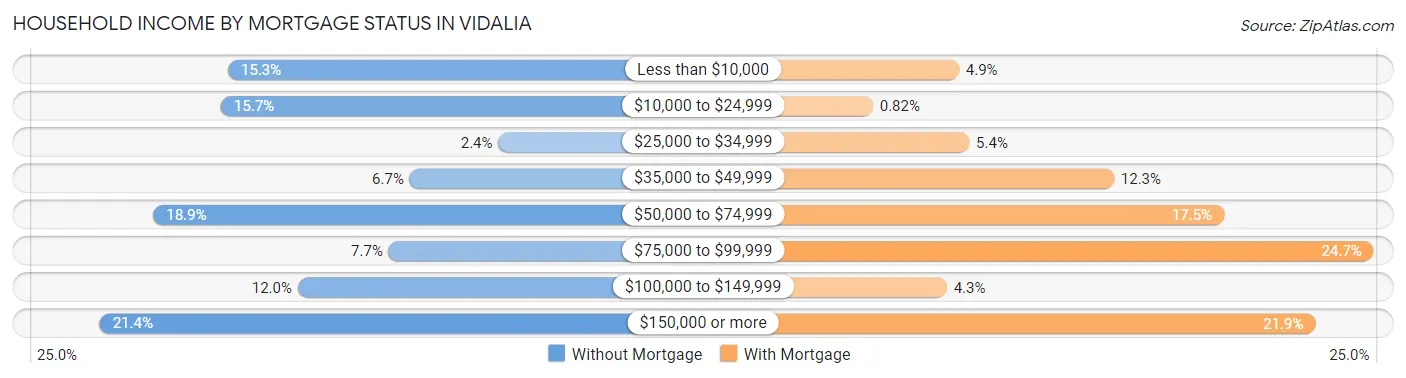
| Household Income | Without Mortgage | With Mortgage |
| Less than $10,000 | 138 (15.3%) | 60 (4.9%) |
| $10,000 to $24,999 | 141 (15.7%) | 10 (0.8%) |
| $25,000 to $34,999 | 22 (2.4%) | 66 (5.4%) |
| $35,000 to $49,999 | 60 (6.7%) | 150 (12.3%) |
| $50,000 to $74,999 | 170 (18.9%) | 214 (17.5%) |
| $75,000 to $99,999 | 69 (7.7%) | 301 (24.7%) |
| $100,000 to $149,999 | 108 (12.0%) | 53 (4.3%) |
| $150,000 or more | 193 (21.4%) | 267 (21.9%) |
| Total | 901 (100.0%) | 1,220 (100.0%) |
Property Value to Household Income Ratio in Vidalia
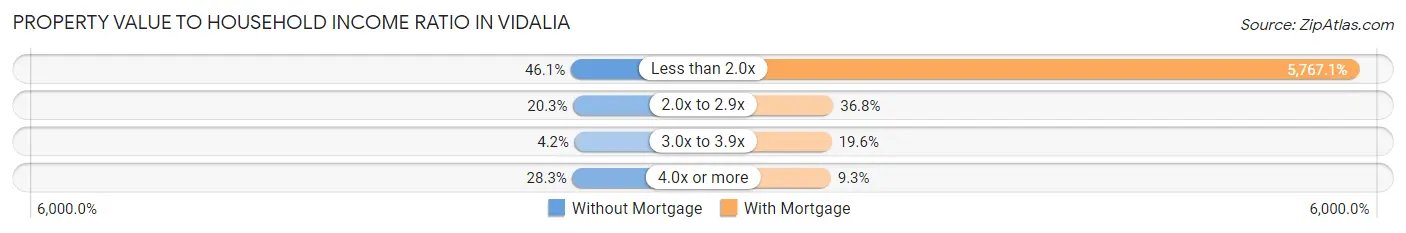
| Value-to-Income Ratio | Without Mortgage | With Mortgage |
| Less than 2.0x | 415 (46.1%) | 70,359 (5,767.1%) |
| 2.0x to 2.9x | 183 (20.3%) | 449 (36.8%) |
| 3.0x to 3.9x | 38 (4.2%) | 239 (19.6%) |
| 4.0x or more | 255 (28.3%) | 113 (9.3%) |
| Total | 901 (100.0%) | 1,220 (100.0%) |
Real Estate Taxes by Mortgage Status in Vidalia
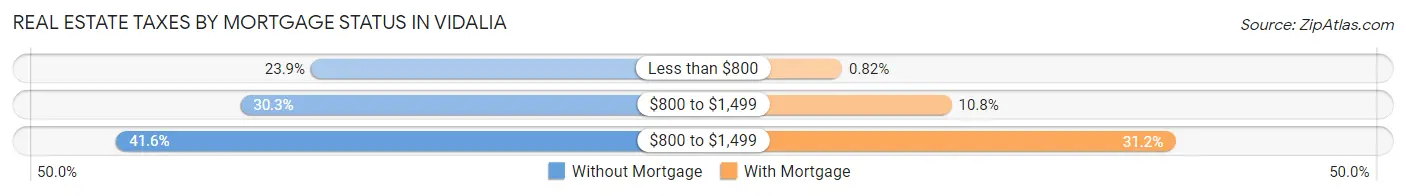
| Property Taxes | Without Mortgage | With Mortgage |
| Less than $800 | 215 (23.9%) | 10 (0.8%) |
| $800 to $1,499 | 273 (30.3%) | 132 (10.8%) |
| $800 to $1,499 | 375 (41.6%) | 381 (31.2%) |
| Total | 901 (100.0%) | 1,220 (100.0%) |
Health & Disability in Vidalia
Health Insurance Coverage by Age in Vidalia
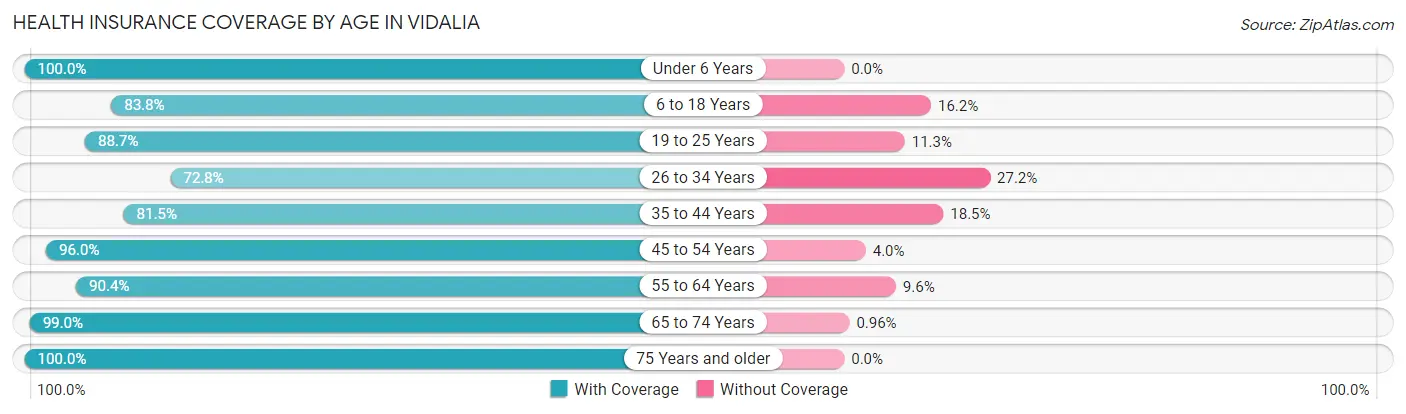
| Age Bracket | With Coverage | Without Coverage |
| Under 6 Years | 821 (100.0%) | 0 (0.0%) |
| 6 to 18 Years | 1,813 (83.8%) | 350 (16.2%) |
| 19 to 25 Years | 1,109 (88.7%) | 141 (11.3%) |
| 26 to 34 Years | 656 (72.8%) | 245 (27.2%) |
| 35 to 44 Years | 1,024 (81.5%) | 232 (18.5%) |
| 45 to 54 Years | 1,052 (96.0%) | 44 (4.0%) |
| 55 to 64 Years | 1,071 (90.4%) | 114 (9.6%) |
| 65 to 74 Years | 1,027 (99.0%) | 10 (1.0%) |
| 75 Years and older | 817 (100.0%) | 0 (0.0%) |
| Total | 9,390 (89.2%) | 1,136 (10.8%) |
Health Insurance Coverage by Citizenship Status in Vidalia
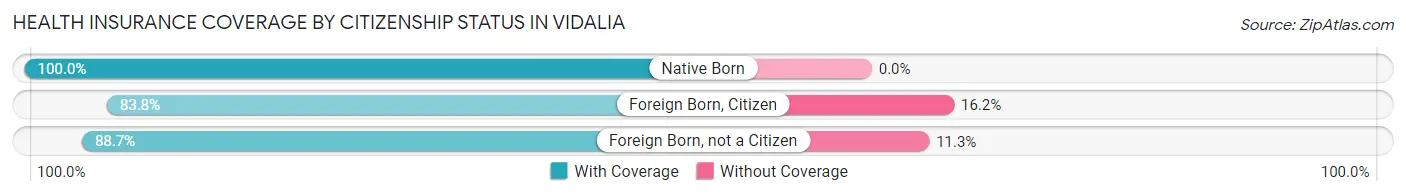
| Citizenship Status | With Coverage | Without Coverage |
| Native Born | 821 (100.0%) | 0 (0.0%) |
| Foreign Born, Citizen | 1,813 (83.8%) | 350 (16.2%) |
| Foreign Born, not a Citizen | 1,109 (88.7%) | 141 (11.3%) |
Health Insurance Coverage by Household Income in Vidalia
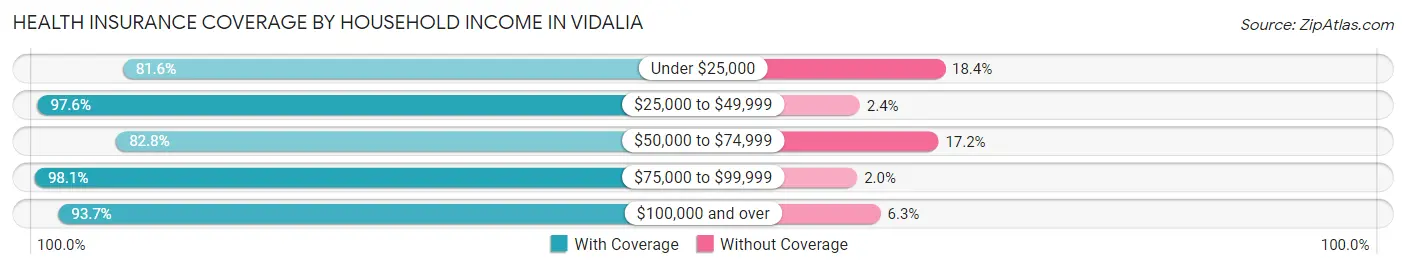
| Household Income | With Coverage | Without Coverage |
| Under $25,000 | 2,022 (81.6%) | 456 (18.4%) |
| $25,000 to $49,999 | 1,758 (97.6%) | 44 (2.4%) |
| $50,000 to $74,999 | 1,741 (82.8%) | 361 (17.2%) |
| $75,000 to $99,999 | 553 (98.1%) | 11 (1.9%) |
| $100,000 and over | 3,308 (93.7%) | 224 (6.3%) |
Public vs Private Health Insurance Coverage by Age in Vidalia
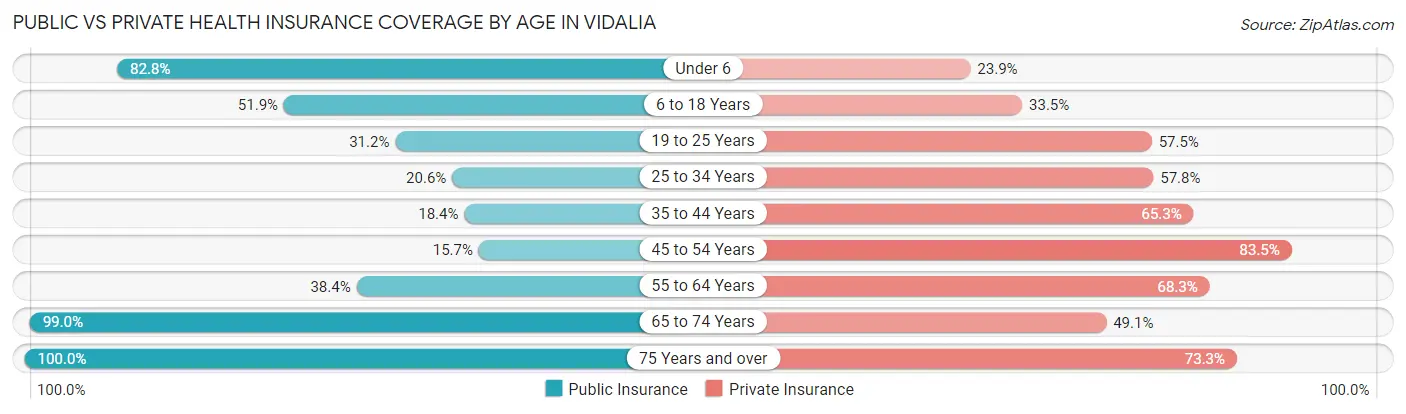
| Age Bracket | Public Insurance | Private Insurance |
| Under 6 | 680 (82.8%) | 196 (23.9%) |
| 6 to 18 Years | 1,122 (51.9%) | 724 (33.5%) |
| 19 to 25 Years | 390 (31.2%) | 719 (57.5%) |
| 25 to 34 Years | 186 (20.6%) | 521 (57.8%) |
| 35 to 44 Years | 231 (18.4%) | 820 (65.3%) |
| 45 to 54 Years | 172 (15.7%) | 915 (83.5%) |
| 55 to 64 Years | 455 (38.4%) | 809 (68.3%) |
| 65 to 74 Years | 1,027 (99.0%) | 509 (49.1%) |
| 75 Years and over | 817 (100.0%) | 599 (73.3%) |
| Total | 5,080 (48.3%) | 5,812 (55.2%) |
Disability Status by Sex by Age in Vidalia
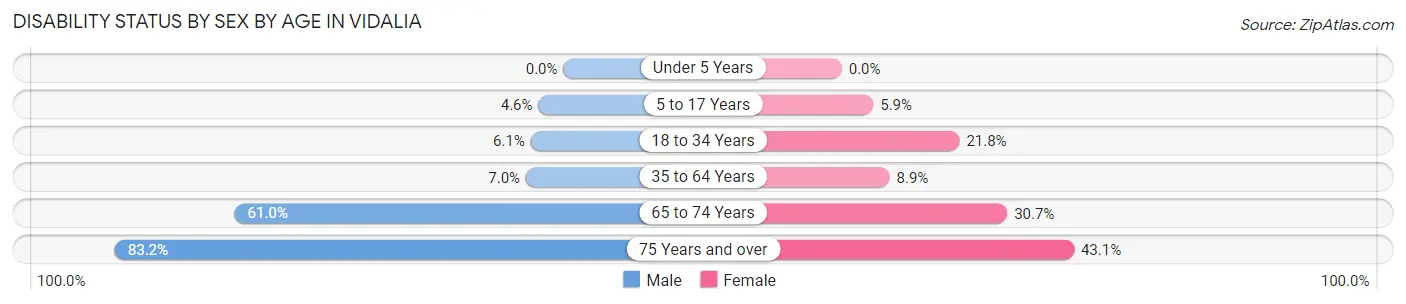
| Age Bracket | Male | Female |
| Under 5 Years | 0 (0.0%) | 0 (0.0%) |
| 5 to 17 Years | 49 (4.6%) | 60 (5.9%) |
| 18 to 34 Years | 59 (6.1%) | 308 (21.8%) |
| 35 to 64 Years | 104 (7.0%) | 181 (8.9%) |
| 65 to 74 Years | 277 (61.0%) | 179 (30.7%) |
| 75 Years and over | 149 (83.2%) | 275 (43.1%) |
Disability Class by Sex by Age in Vidalia
Disability Class: Hearing Difficulty
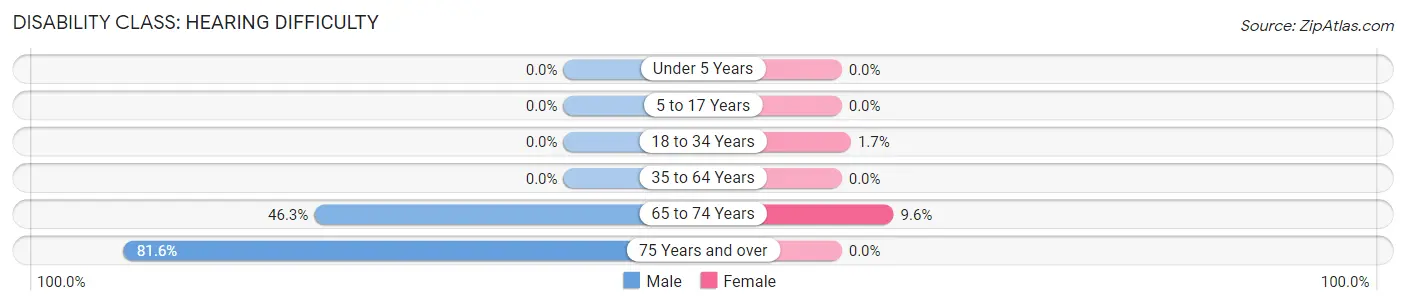
| Age Bracket | Male | Female |
| Under 5 Years | 0 (0.0%) | 0 (0.0%) |
| 5 to 17 Years | 0 (0.0%) | 0 (0.0%) |
| 18 to 34 Years | 0 (0.0%) | 24 (1.7%) |
| 35 to 64 Years | 0 (0.0%) | 0 (0.0%) |
| 65 to 74 Years | 210 (46.3%) | 56 (9.6%) |
| 75 Years and over | 146 (81.6%) | 0 (0.0%) |
Disability Class: Vision Difficulty
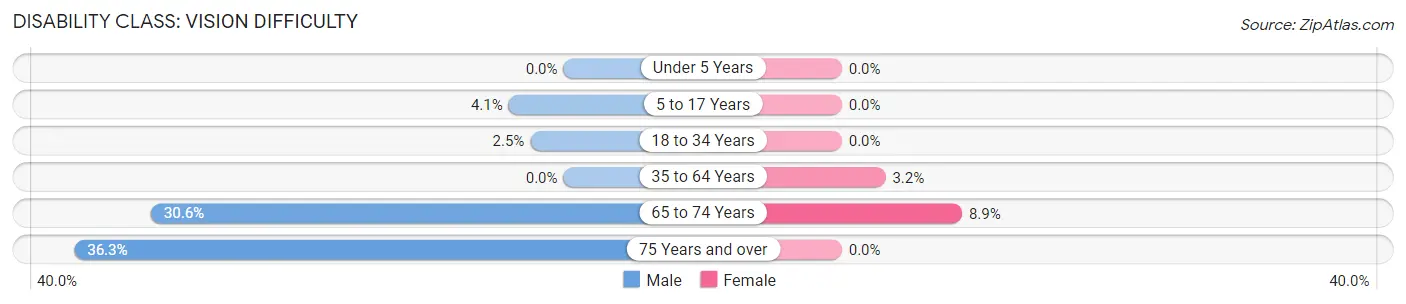
| Age Bracket | Male | Female |
| Under 5 Years | 0 (0.0%) | 0 (0.0%) |
| 5 to 17 Years | 43 (4.1%) | 0 (0.0%) |
| 18 to 34 Years | 24 (2.5%) | 0 (0.0%) |
| 35 to 64 Years | 0 (0.0%) | 66 (3.2%) |
| 65 to 74 Years | 139 (30.6%) | 52 (8.9%) |
| 75 Years and over | 65 (36.3%) | 0 (0.0%) |
Disability Class: Cognitive Difficulty
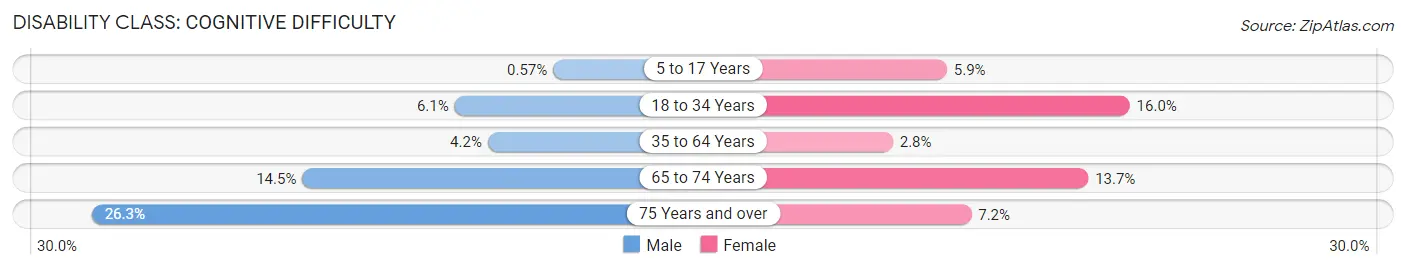
| Age Bracket | Male | Female |
| 5 to 17 Years | 6 (0.6%) | 60 (5.9%) |
| 18 to 34 Years | 59 (6.1%) | 226 (16.0%) |
| 35 to 64 Years | 63 (4.2%) | 58 (2.8%) |
| 65 to 74 Years | 66 (14.5%) | 80 (13.7%) |
| 75 Years and over | 47 (26.3%) | 46 (7.2%) |
Disability Class: Ambulatory Difficulty
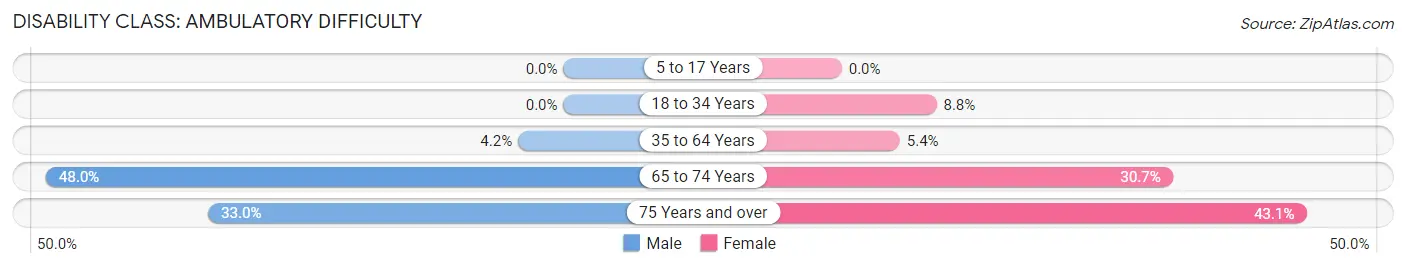
| Age Bracket | Male | Female |
| 5 to 17 Years | 0 (0.0%) | 0 (0.0%) |
| 18 to 34 Years | 0 (0.0%) | 124 (8.8%) |
| 35 to 64 Years | 63 (4.2%) | 110 (5.4%) |
| 65 to 74 Years | 218 (48.0%) | 179 (30.7%) |
| 75 Years and over | 59 (33.0%) | 275 (43.1%) |
Disability Class: Self-Care Difficulty
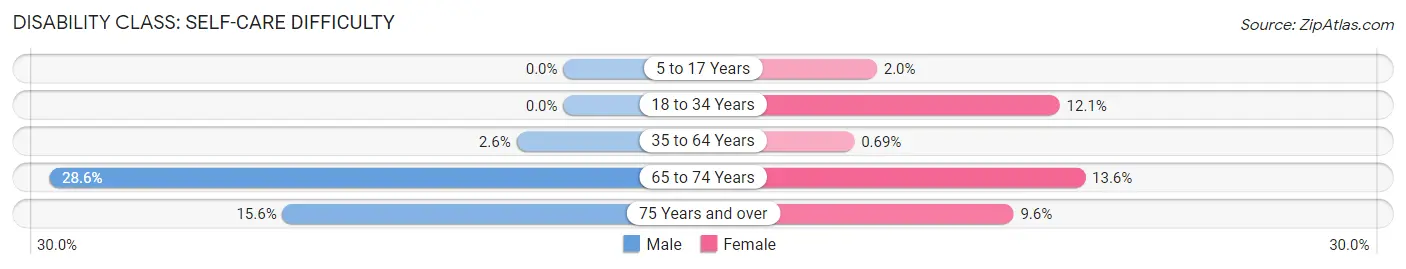
| Age Bracket | Male | Female |
| 5 to 17 Years | 0 (0.0%) | 20 (1.9%) |
| 18 to 34 Years | 0 (0.0%) | 171 (12.1%) |
| 35 to 64 Years | 39 (2.6%) | 14 (0.7%) |
| 65 to 74 Years | 130 (28.6%) | 79 (13.6%) |
| 75 Years and over | 28 (15.6%) | 61 (9.6%) |
Technology Access in Vidalia
Computing Device Access in Vidalia
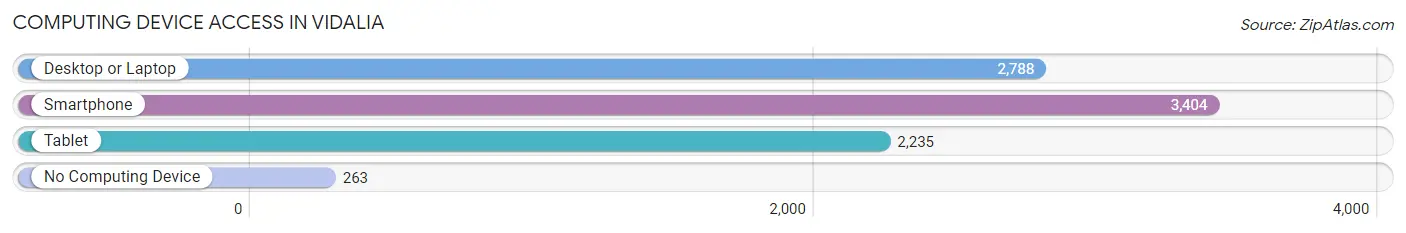
| Device Type | # Households | % Households |
| Desktop or Laptop | 2,788 | 70.5% |
| Smartphone | 3,404 | 86.1% |
| Tablet | 2,235 | 56.5% |
| No Computing Device | 263 | 6.7% |
| Total | 3,955 | 100.0% |
Internet Access in Vidalia
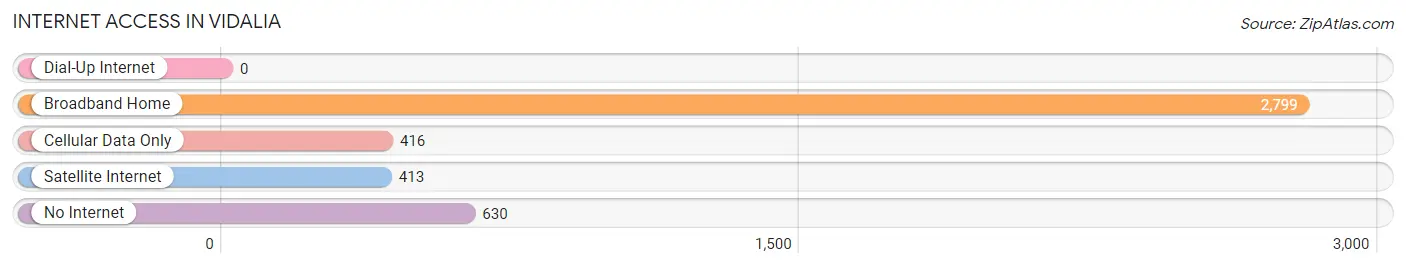
| Internet Type | # Households | % Households |
| Dial-Up Internet | 0 | 0.0% |
| Broadband Home | 2,799 | 70.8% |
| Cellular Data Only | 416 | 10.5% |
| Satellite Internet | 413 | 10.4% |
| No Internet | 630 | 15.9% |
| Total | 3,955 | 100.0% |
Vidalia Summary
Vidalia is a city located in Toombs County, Georgia, United States. It is the county seat of Toombs County and is the largest city in the county. The population of Vidalia was 10,473 at the 2010 census, an increase of over 10% since 2000.
History
Vidalia was founded in 1905 and was named after the Vidalia onion, which is grown in the area. The city was incorporated in 1906 and is the county seat of Toombs County. The city was originally known as "White Sulphur Springs" and was a popular destination for people seeking the healing properties of the sulfur springs.
The city was also the site of a major battle during the Civil War. In 1864, Confederate forces under General Joseph Wheeler attacked a Union force under General William T. Sherman. The battle resulted in a Confederate victory, but the Union forces were able to retreat and the city was spared from destruction.
Geography
Vidalia is located in the southeastern corner of Georgia, near the border with South Carolina. It is situated on the banks of the Oconee River, which forms the border between Georgia and South Carolina. The city is located about 60 miles southeast of Macon and about 90 miles northwest of Savannah.
The city has a total area of 8.3 square miles, of which 8.2 square miles is land and 0.1 square miles is water. The city is located in the Piedmont region of Georgia and is part of the Central Savannah River Area.
Economy
Vidalia's economy is largely based on agriculture, with the Vidalia onion being the most important crop. Other crops grown in the area include corn, cotton, soybeans, and peanuts. The city is also home to several manufacturing companies, including a paper mill, a furniture factory, and a plastics plant.
The city is also home to several retail stores, restaurants, and other businesses. The city is served by the Vidalia Regional Airport, which offers flights to Atlanta and other cities in the region.
Demographics
As of the 2010 census, the population of Vidalia was 10,473. The racial makeup of the city was 65.2% White, 28.3% African American, 0.3% Native American, 0.7% Asian, 0.1% Pacific Islander, 4.2% from other races, and 1.4% from two or more races. Hispanic or Latino of any race were 8.2% of the population.
The median income for a household in the city was $30,945, and the median income for a family was $37,945. The per capita income for the city was $17,845. About 17.2% of families and 20.3% of the population were below the poverty line, including 28.2% of those under age 18 and 16.2% of those age 65 or over.
Conclusion
Vidalia is a city located in Toombs County, Georgia, United States. It is the county seat of Toombs County and is the largest city in the county. The city was founded in 1905 and was named after the Vidalia onion, which is grown in the area. The city's economy is largely based on agriculture, with the Vidalia onion being the most important crop. The city is also home to several manufacturing companies, retail stores, restaurants, and other businesses. As of the 2010 census, the population of Vidalia was 10,473. The median income for a household in the city was $30,945, and the median income for a family was $37,945.
Common Questions
What is Per Capita Income in Vidalia?
Per Capita income in Vidalia is $33,701.
What is the Median Family Income in Vidalia?
Median Family Income in Vidalia is $57,383.
What is the Median Household income in Vidalia?
Median Household Income in Vidalia is $47,124.
What is Income or Wage Gap in Vidalia?
Income or Wage Gap in Vidalia is 29.0%.
Women in Vidalia earn 71.0 cents for every dollar earned by a man.
What is Family Income Deficit in Vidalia?
Family Income Deficit in Vidalia is $11,346.
Families that are below poverty line in Vidalia earn $11,346 less on average than the poverty threshold level.
What is Inequality or Gini Index in Vidalia?
Inequality or Gini Index in Vidalia is 0.59.
What is the Total Population of Vidalia?
Total Population of Vidalia is 10,732.
What is the Total Male Population of Vidalia?
Total Male Population of Vidalia is 4,583.
What is the Total Female Population of Vidalia?
Total Female Population of Vidalia is 6,149.
What is the Ratio of Males per 100 Females in Vidalia?
There are 74.53 Males per 100 Females in Vidalia.
What is the Ratio of Females per 100 Males in Vidalia?
There are 134.17 Females per 100 Males in Vidalia.
What is the Median Population Age in Vidalia?
Median Population Age in Vidalia is 37.4 Years.
What is the Average Family Size in Vidalia
Average Family Size in Vidalia is 3.4 People.
What is the Average Household Size in Vidalia
Average Household Size in Vidalia is 2.6 People.
How Large is the Labor Force in Vidalia?
There are 4,295 People in the Labor Forcein in Vidalia.
What is the Percentage of People in the Labor Force in Vidalia?
51.3% of People are in the Labor Force in Vidalia.
What is the Unemployment Rate in Vidalia?
Unemployment Rate in Vidalia is 7.4%.