Temple, GA Map & Demographics
Temple Map
Temple Overview
$29,345
PER CAPITA INCOME
$88,430
AVG FAMILY INCOME
$71,917
AVG HOUSEHOLD INCOME
22.4%
WAGE / INCOME GAP [ % ]
77.6¢/ $1
WAGE / INCOME GAP [ $ ]
0.32
INEQUALITY / GINI INDEX
5,395
TOTAL POPULATION
2,792
MALE POPULATION
2,603
FEMALE POPULATION
107.26
MALES / 100 FEMALES
93.23
FEMALES / 100 MALES
31.8
MEDIAN AGE
3.3
AVG FAMILY SIZE
3.0
AVG HOUSEHOLD SIZE
2,653
LABOR FORCE [ PEOPLE ]
66.5%
PERCENT IN LABOR FORCE
Temple Zip Codes
Income in Temple
Income Overview in Temple
Per Capita Income in Temple is $29,345, while median incomes of families and households are $88,430 and $71,917 respectively.
| Characteristic | Number | Measure |
| Per Capita Income | 5,395 | $29,345 |
| Median Family Income | 1,412 | $88,430 |
| Mean Family Income | 1,412 | $89,806 |
| Median Household Income | 1,829 | $71,917 |
| Mean Household Income | 1,829 | $81,340 |
| Income Deficit | 1,412 | $0 |
| Wage / Income Gap (%) | 5,395 | 22.38% |
| Wage / Income Gap ($) | 5,395 | 77.62¢ per $1 |
| Gini / Inequality Index | 5,395 | 0.32 |
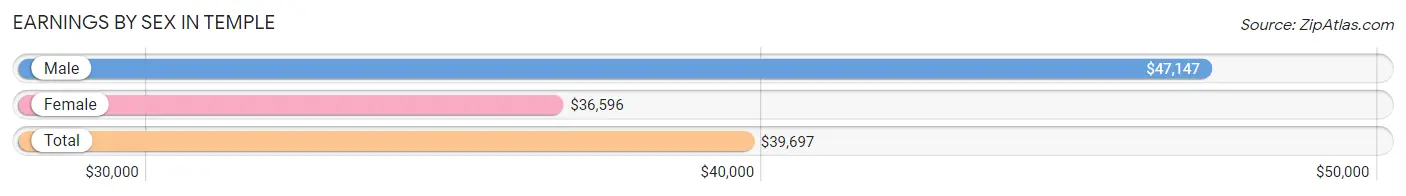
Earnings by Sex in Temple
Average Earnings in Temple are $39,697, $47,147 for men and $36,596 for women, a difference of 22.4%.
| Sex | Number | Average Earnings |
| Male | 1,529 (54.7%) | $47,147 |
| Female | 1,264 (45.3%) | $36,596 |
| Total | 2,793 (100.0%) | $39,697 |
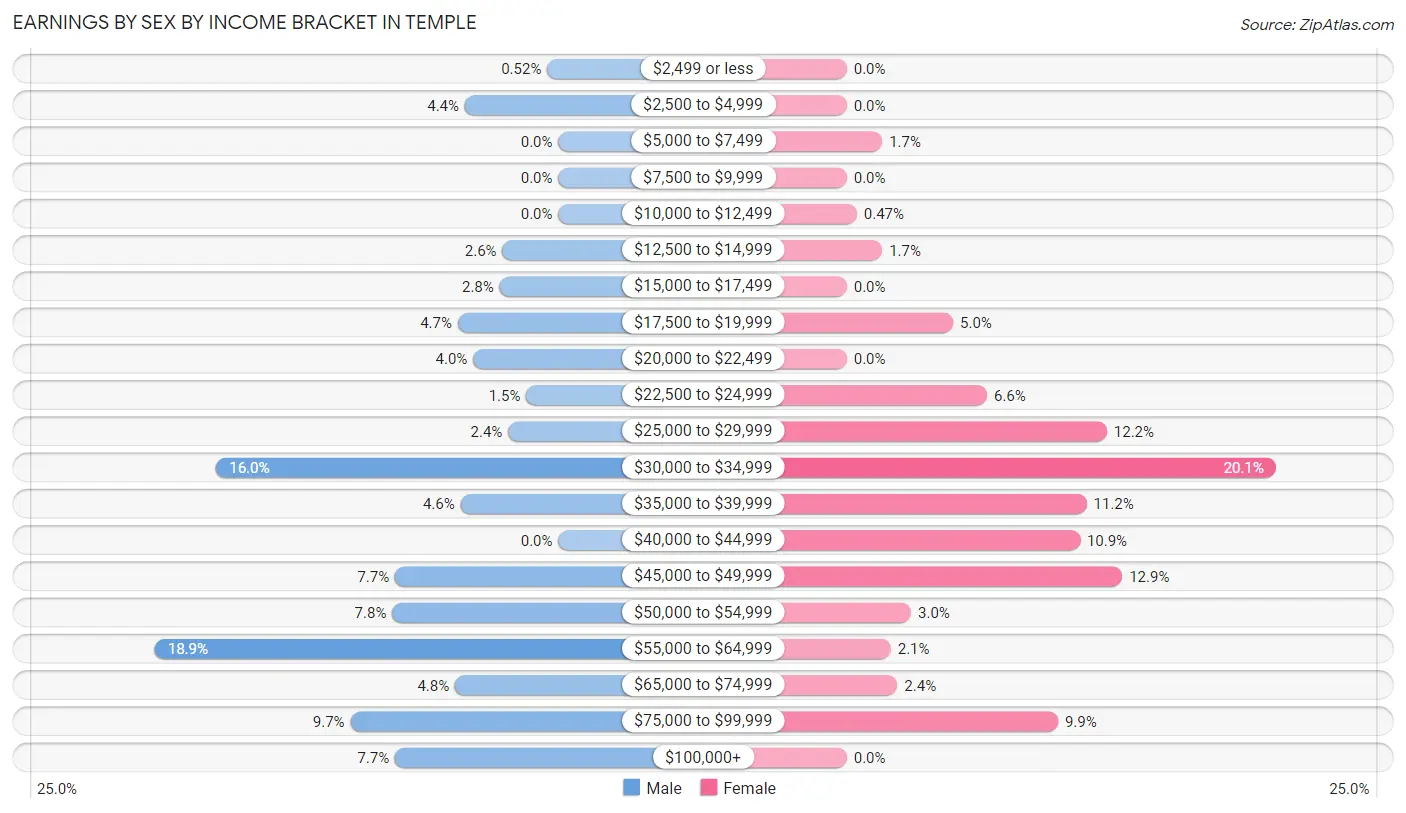
Earnings by Sex by Income Bracket in Temple
The most common earnings brackets in Temple are $55,000 to $64,999 for men (289 | 18.9%) and $30,000 to $34,999 for women (254 | 20.1%).
| Income | Male | Female |
| $2,499 or less | 8 (0.5%) | 0 (0.0%) |
| $2,500 to $4,999 | 67 (4.4%) | 0 (0.0%) |
| $5,000 to $7,499 | 0 (0.0%) | 21 (1.7%) |
| $7,500 to $9,999 | 0 (0.0%) | 0 (0.0%) |
| $10,000 to $12,499 | 0 (0.0%) | 6 (0.5%) |
| $12,500 to $14,999 | 40 (2.6%) | 21 (1.7%) |
| $15,000 to $17,499 | 42 (2.8%) | 0 (0.0%) |
| $17,500 to $19,999 | 72 (4.7%) | 63 (5.0%) |
| $20,000 to $22,499 | 61 (4.0%) | 0 (0.0%) |
| $22,500 to $24,999 | 23 (1.5%) | 83 (6.6%) |
| $25,000 to $29,999 | 36 (2.4%) | 154 (12.2%) |
| $30,000 to $34,999 | 245 (16.0%) | 254 (20.1%) |
| $35,000 to $39,999 | 70 (4.6%) | 142 (11.2%) |
| $40,000 to $44,999 | 0 (0.0%) | 138 (10.9%) |
| $45,000 to $49,999 | 117 (7.6%) | 163 (12.9%) |
| $50,000 to $54,999 | 119 (7.8%) | 38 (3.0%) |
| $55,000 to $64,999 | 289 (18.9%) | 26 (2.1%) |
| $65,000 to $74,999 | 74 (4.8%) | 30 (2.4%) |
| $75,000 to $99,999 | 149 (9.7%) | 125 (9.9%) |
| $100,000+ | 117 (7.6%) | 0 (0.0%) |
| Total | 1,529 (100.0%) | 1,264 (100.0%) |
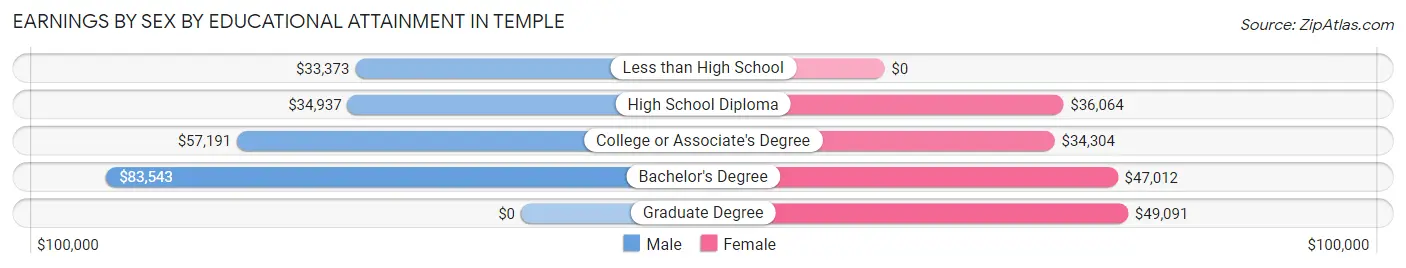
Earnings by Sex by Educational Attainment in Temple
Average earnings in Temple are $53,575 for men and $37,207 for women, a difference of 30.5%. Men with an educational attainment of bachelor's degree enjoy the highest average annual earnings of $83,543, while those with less than high school education earn the least with $33,373. Women with an educational attainment of graduate degree earn the most with the average annual earnings of $49,091, while those with college or associate's degree education have the smallest earnings of $34,304.
| Educational Attainment | Male Income | Female Income |
| Less than High School | $33,373 | $0 |
| High School Diploma | $34,937 | $36,064 |
| College or Associate's Degree | $57,191 | $34,304 |
| Bachelor's Degree | $83,543 | $47,012 |
| Graduate Degree | - | - |
| Total | $53,575 | $37,207 |
Family Income in Temple
Family Income Brackets in Temple
According to the Temple family income data, there are 361 families falling into the $100,000 to $149,999 income range, which is the most common income bracket and makes up 25.6% of all families.
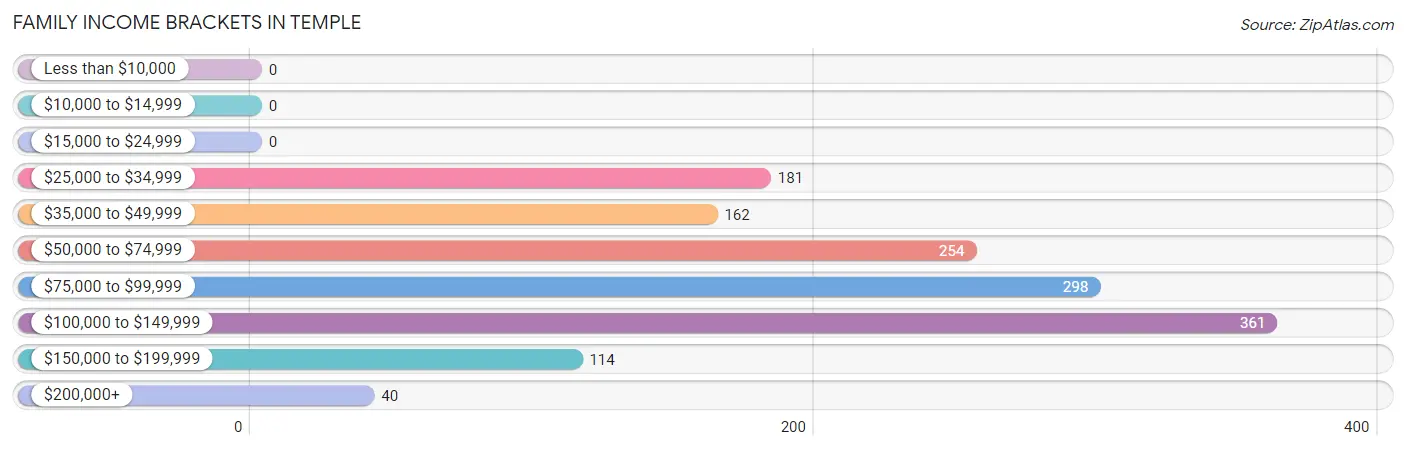
| Income Bracket | # Families | % Families |
| Less than $10,000 | 0 | 0.0% |
| $10,000 to $14,999 | 0 | 0.0% |
| $15,000 to $24,999 | 0 | 0.0% |
| $25,000 to $34,999 | 181 | 12.8% |
| $35,000 to $49,999 | 162 | 11.5% |
| $50,000 to $74,999 | 254 | 18.0% |
| $75,000 to $99,999 | 298 | 21.1% |
| $100,000 to $149,999 | 361 | 25.6% |
| $150,000 to $199,999 | 114 | 8.1% |
| $200,000+ | 40 | 2.8% |
Family Income by Famaliy Size in Temple
5-person families (167 | 11.8%) account for the highest median family income in Temple with $123,603 per family, while 2-person families (470 | 33.3%) have the highest median income of $36,369 per family member.
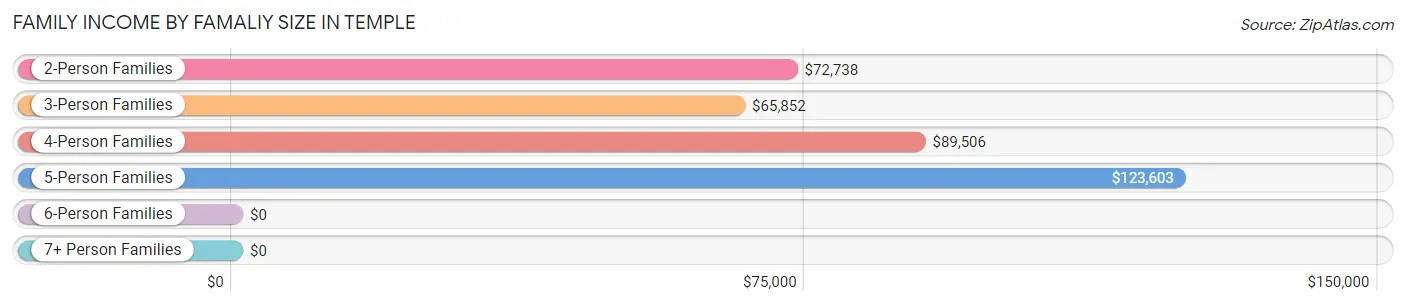
| Income Bracket | # Families | Median Income |
| 2-Person Families | 470 (33.3%) | $72,738 |
| 3-Person Families | 499 (35.3%) | $65,852 |
| 4-Person Families | 251 (17.8%) | $89,506 |
| 5-Person Families | 167 (11.8%) | $123,603 |
| 6-Person Families | 25 (1.8%) | $0 |
| 7+ Person Families | 0 (0.0%) | $0 |
| Total | 1,412 (100.0%) | $88,430 |
Family Income by Number of Earners in Temple
The median family income in Temple is $88,430, with families comprising 3+ earners (146) having the highest median family income of $104,919, while families with no earners (92) have the lowest median family income of $33,261, accounting for 10.3% and 6.5% of families, respectively.
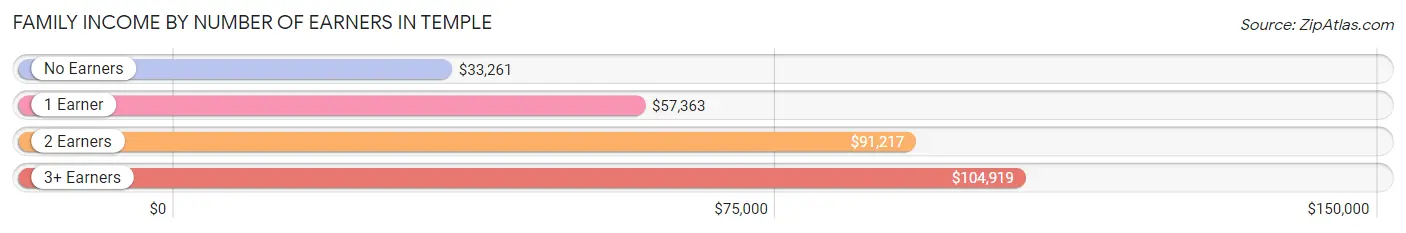
| Number of Earners | # Families | Median Income |
| No Earners | 92 (6.5%) | $33,261 |
| 1 Earner | 652 (46.2%) | $57,363 |
| 2 Earners | 522 (37.0%) | $91,217 |
| 3+ Earners | 146 (10.3%) | $104,919 |
| Total | 1,412 (100.0%) | $88,430 |
Household Income in Temple
Household Income Brackets in Temple
With 368 households falling in the category, the $50,000 to $74,999 income range is the most frequent in Temple, accounting for 20.1% of all households.
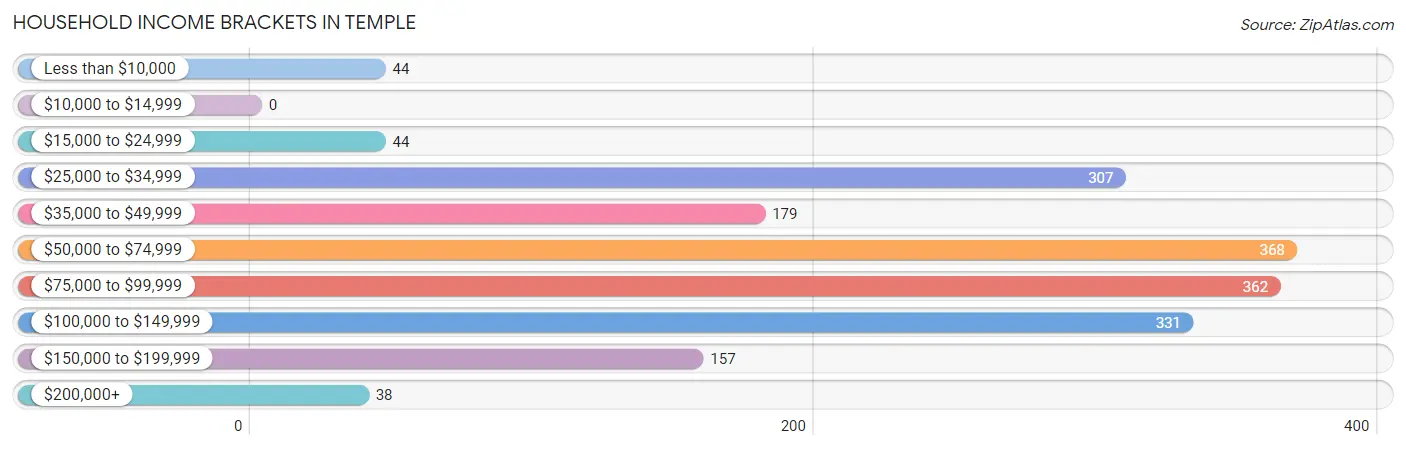
| Income Bracket | # Households | % Households |
| Less than $10,000 | 44 | 2.4% |
| $10,000 to $14,999 | 0 | 0.0% |
| $15,000 to $24,999 | 44 | 2.4% |
| $25,000 to $34,999 | 307 | 16.8% |
| $35,000 to $49,999 | 179 | 9.8% |
| $50,000 to $74,999 | 368 | 20.1% |
| $75,000 to $99,999 | 362 | 19.8% |
| $100,000 to $149,999 | 331 | 18.1% |
| $150,000 to $199,999 | 157 | 8.6% |
| $200,000+ | 38 | 2.1% |
Household Income by Householder Age in Temple
The median household income in Temple is $71,917, with the highest median household income of $87,980 found in the 25 to 44 years age bracket for the primary householder. A total of 793 households (43.4%) fall into this category. Meanwhile, the 15 to 24 years age bracket for the primary householder has the lowest median household income of $0, with 72 households (3.9%) in this group.
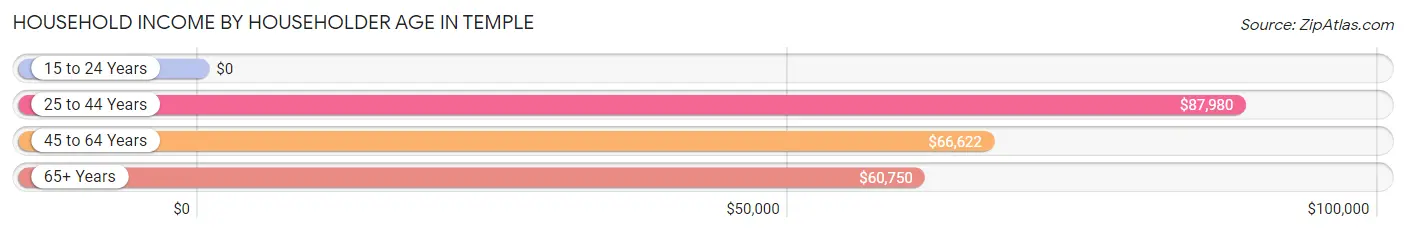
| Income Bracket | # Households | Median Income |
| 15 to 24 Years | 72 (3.9%) | $0 |
| 25 to 44 Years | 793 (43.4%) | $87,980 |
| 45 to 64 Years | 666 (36.4%) | $66,622 |
| 65+ Years | 298 (16.3%) | $60,750 |
| Total | 1,829 (100.0%) | $71,917 |
Poverty in Temple
Income Below Poverty by Sex and Age in Temple
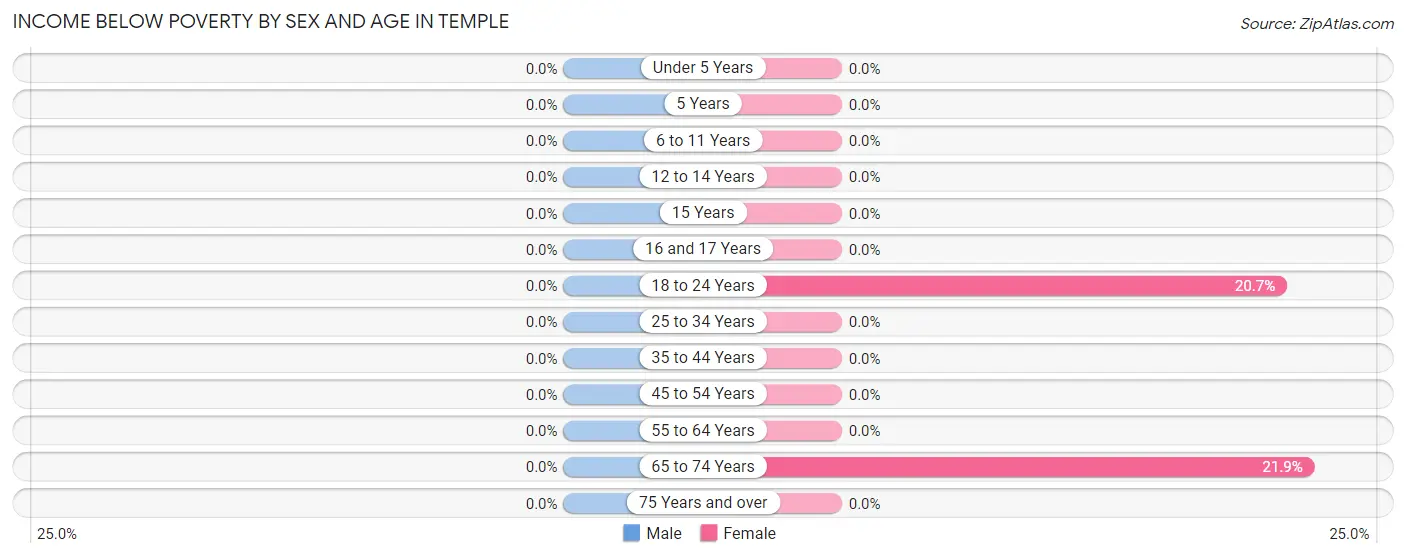
| Age Bracket | Male | Female |
| Under 5 Years | 0 (0.0%) | 0 (0.0%) |
| 5 Years | 0 (0.0%) | 0 (0.0%) |
| 6 to 11 Years | 0 (0.0%) | 0 (0.0%) |
| 12 to 14 Years | 0 (0.0%) | 0 (0.0%) |
| 15 Years | 0 (0.0%) | 0 (0.0%) |
| 16 and 17 Years | 0 (0.0%) | 0 (0.0%) |
| 18 to 24 Years | 0 (0.0%) | 50 (20.7%) |
| 25 to 34 Years | 0 (0.0%) | 0 (0.0%) |
| 35 to 44 Years | 0 (0.0%) | 0 (0.0%) |
| 45 to 54 Years | 0 (0.0%) | 0 (0.0%) |
| 55 to 64 Years | 0 (0.0%) | 0 (0.0%) |
| 65 to 74 Years | 0 (0.0%) | 43 (21.9%) |
| 75 Years and over | 0 (0.0%) | 0 (0.0%) |
| Total | 0 (0.0%) | 93 (3.7%) |
Income Above Poverty by Sex and Age in Temple
According to the poverty statistics in Temple, males aged under 5 years and females aged under 5 years are the age groups that are most secure financially, with 100.0% of males and 100.0% of females in these age groups living above the poverty line.
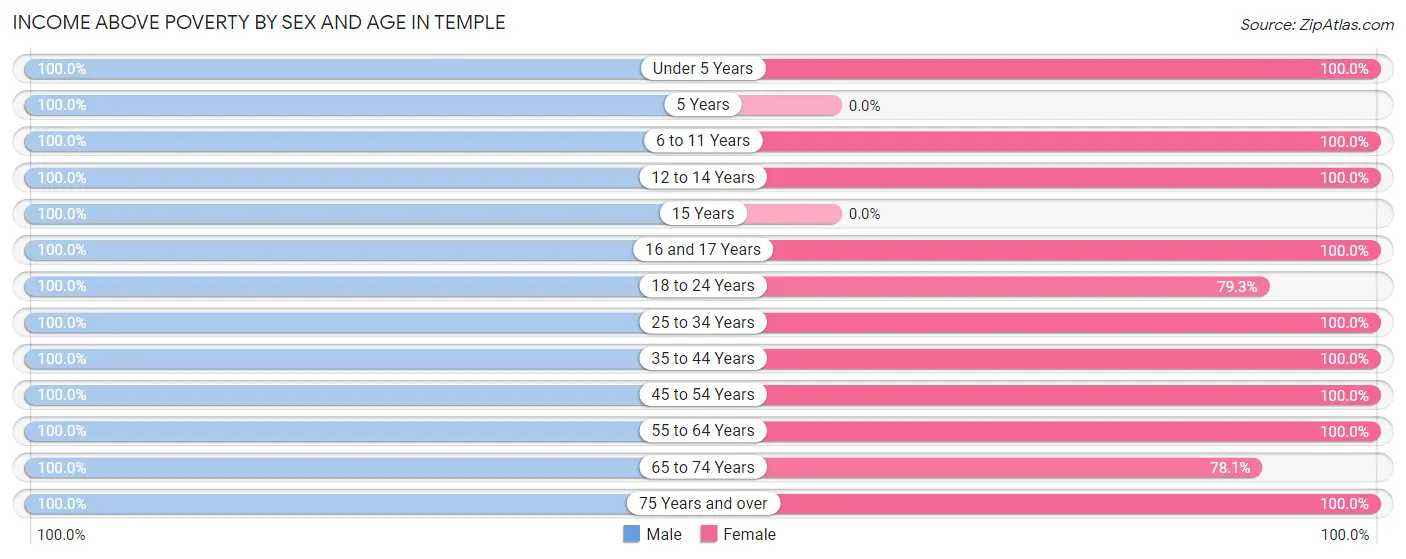
| Age Bracket | Male | Female |
| Under 5 Years | 122 (100.0%) | 297 (100.0%) |
| 5 Years | 226 (100.0%) | 0 (0.0%) |
| 6 to 11 Years | 193 (100.0%) | 127 (100.0%) |
| 12 to 14 Years | 172 (100.0%) | 110 (100.0%) |
| 15 Years | 70 (100.0%) | 0 (0.0%) |
| 16 and 17 Years | 151 (100.0%) | 21 (100.0%) |
| 18 to 24 Years | 147 (100.0%) | 192 (79.3%) |
| 25 to 34 Years | 369 (100.0%) | 601 (100.0%) |
| 35 to 44 Years | 378 (100.0%) | 270 (100.0%) |
| 45 to 54 Years | 335 (100.0%) | 298 (100.0%) |
| 55 to 64 Years | 273 (100.0%) | 209 (100.0%) |
| 65 to 74 Years | 109 (100.0%) | 153 (78.1%) |
| 75 Years and over | 247 (100.0%) | 144 (100.0%) |
| Total | 2,792 (100.0%) | 2,422 (96.3%) |
Income Below Poverty Among Married-Couple Families in Temple
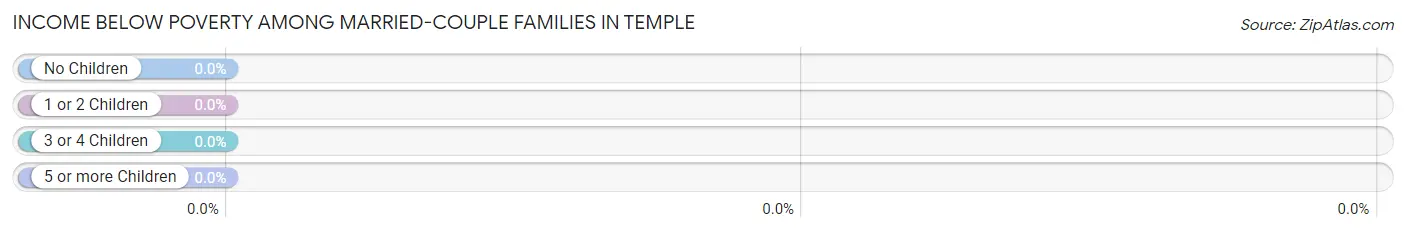
| Children | Above Poverty | Below Poverty |
| No Children | 461 (100.0%) | 0 (0.0%) |
| 1 or 2 Children | 409 (100.0%) | 0 (0.0%) |
| 3 or 4 Children | 131 (100.0%) | 0 (0.0%) |
| 5 or more Children | 0 (0.0%) | 0 (0.0%) |
| Total | 1,001 (100.0%) | 0 (0.0%) |
Income Below Poverty Among Single-Parent Households in Temple
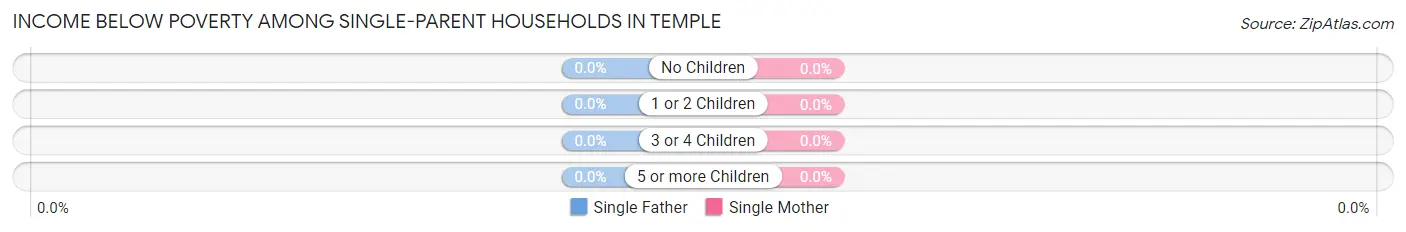
| Children | Single Father | Single Mother |
| No Children | 0 (0.0%) | 0 (0.0%) |
| 1 or 2 Children | 0 (0.0%) | 0 (0.0%) |
| 3 or 4 Children | 0 (0.0%) | 0 (0.0%) |
| 5 or more Children | 0 (0.0%) | 0 (0.0%) |
| Total | 0 (0.0%) | 0 (0.0%) |
Income Below Poverty Among Married-Couple vs Single-Parent Households in Temple
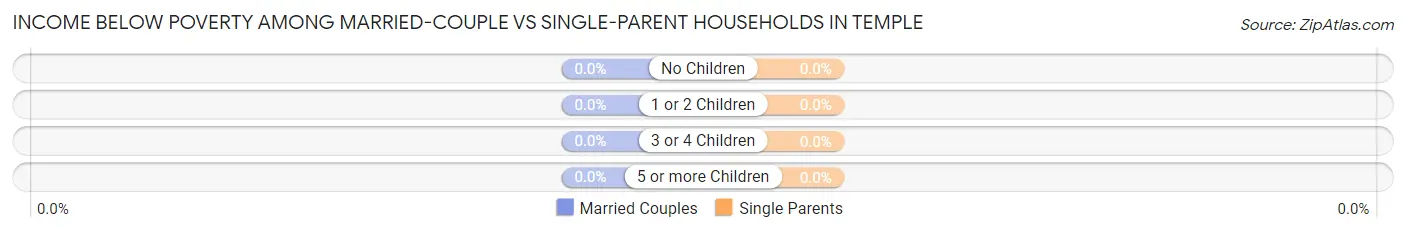
| Children | Married-Couple Families | Single-Parent Households |
| No Children | 0 (0.0%) | 0 (0.0%) |
| 1 or 2 Children | 0 (0.0%) | 0 (0.0%) |
| 3 or 4 Children | 0 (0.0%) | 0 (0.0%) |
| 5 or more Children | 0 (0.0%) | 0 (0.0%) |
| Total | 0 (0.0%) | 0 (0.0%) |
Race in Temple
The most populous races in Temple are White / Caucasian (4,321 | 80.1%), Black / African American (964 | 17.9%), and Hispanic or Latino (194 | 3.6%).
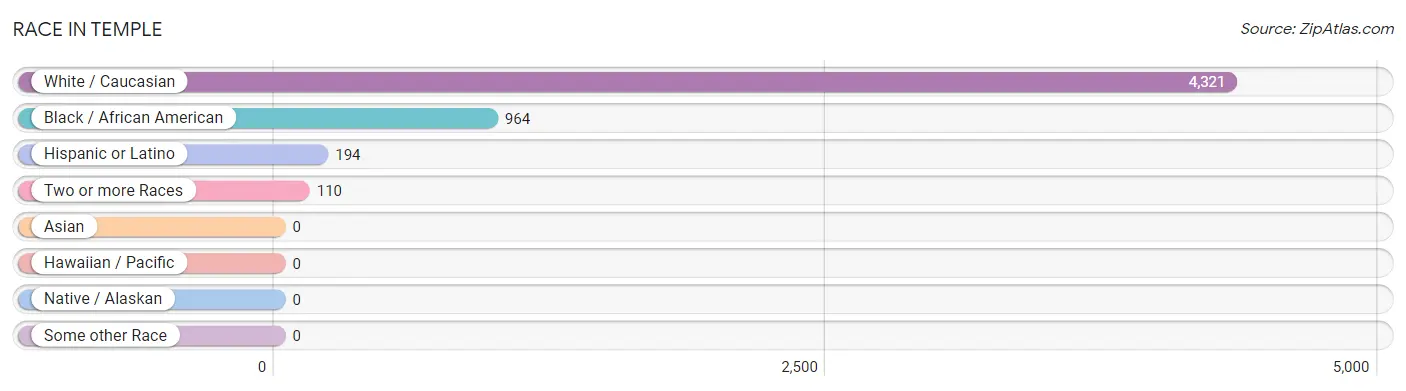
| Race | # Population | % Population |
| Asian | 0 | 0.0% |
| Black / African American | 964 | 17.9% |
| Hawaiian / Pacific | 0 | 0.0% |
| Hispanic or Latino | 194 | 3.6% |
| Native / Alaskan | 0 | 0.0% |
| White / Caucasian | 4,321 | 80.1% |
| Two or more Races | 110 | 2.0% |
| Some other Race | 0 | 0.0% |
| Total | 5,395 | 100.0% |
Ancestry in Temple
The most populous ancestries reported in Temple are American (1,077 | 20.0%), Irish (597 | 11.1%), English (579 | 10.7%), German (276 | 5.1%), and French Canadian (226 | 4.2%), together accounting for 51.1% of all Temple residents.
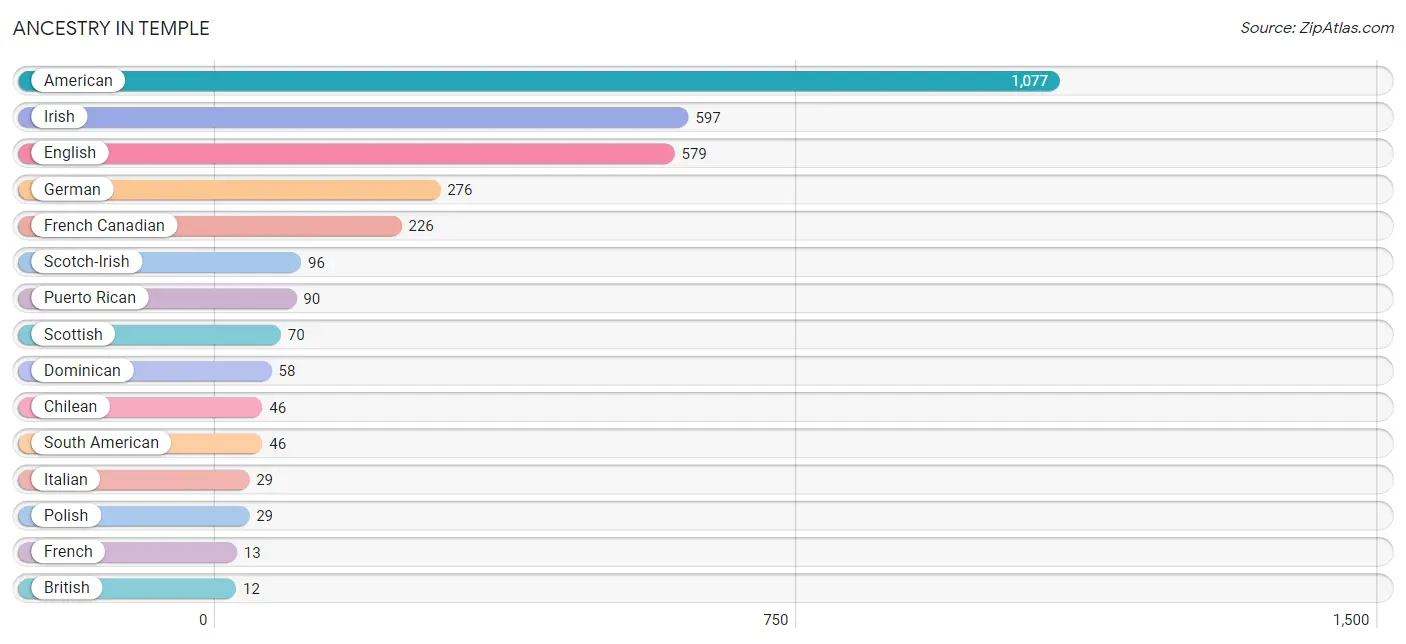
| Ancestry | # Population | % Population |
| American | 1,077 | 20.0% |
| British | 12 | 0.2% |
| Chilean | 46 | 0.9% |
| Creek | 6 | 0.1% |
| Czech | 8 | 0.2% |
| Dominican | 58 | 1.1% |
| English | 579 | 10.7% |
| French | 13 | 0.2% |
| French Canadian | 226 | 4.2% |
| German | 276 | 5.1% |
| Irish | 597 | 11.1% |
| Italian | 29 | 0.5% |
| Polish | 29 | 0.5% |
| Puerto Rican | 90 | 1.7% |
| Scotch-Irish | 96 | 1.8% |
| Scottish | 70 | 1.3% |
| South American | 46 | 0.9% | View All 17 Rows |
Immigrants in Temple
The most numerous immigrant groups reported in Temple came from Latin America (104 | 1.9%), Caribbean (58 | 1.1%), Dominican Republic (58 | 1.1%), Chile (46 | 0.9%), and South America (46 | 0.9%), together accounting for 5.8% of all Temple residents.
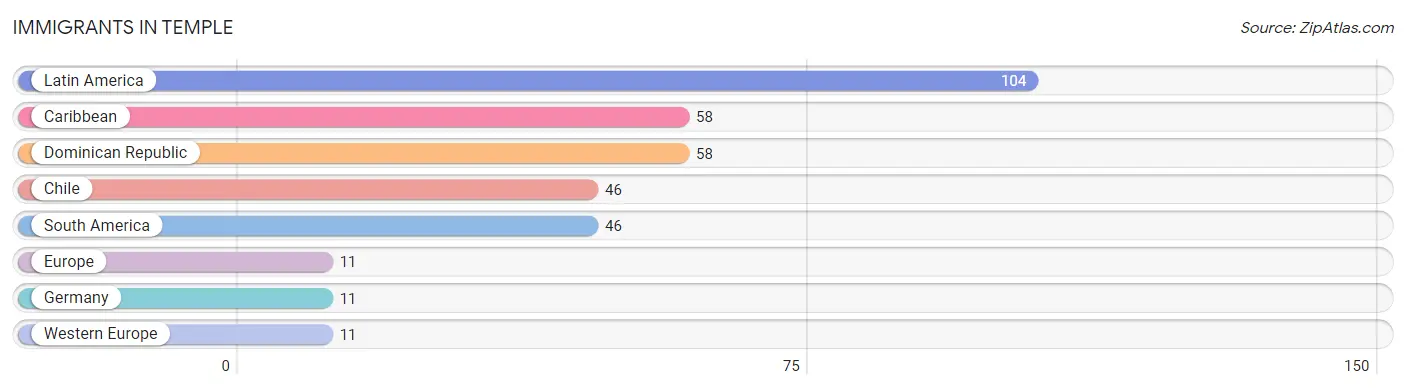
| Immigration Origin | # Population | % Population |
| Caribbean | 58 | 1.1% |
| Chile | 46 | 0.9% |
| Dominican Republic | 58 | 1.1% |
| Europe | 11 | 0.2% |
| Germany | 11 | 0.2% |
| Latin America | 104 | 1.9% |
| South America | 46 | 0.9% |
| Western Europe | 11 | 0.2% | View All 8 Rows |
Sex and Age in Temple
Sex and Age in Temple
The most populous age groups in Temple are 5 to 9 Years (419 | 15.0%) for men and 25 to 29 Years (436 | 16.8%) for women.
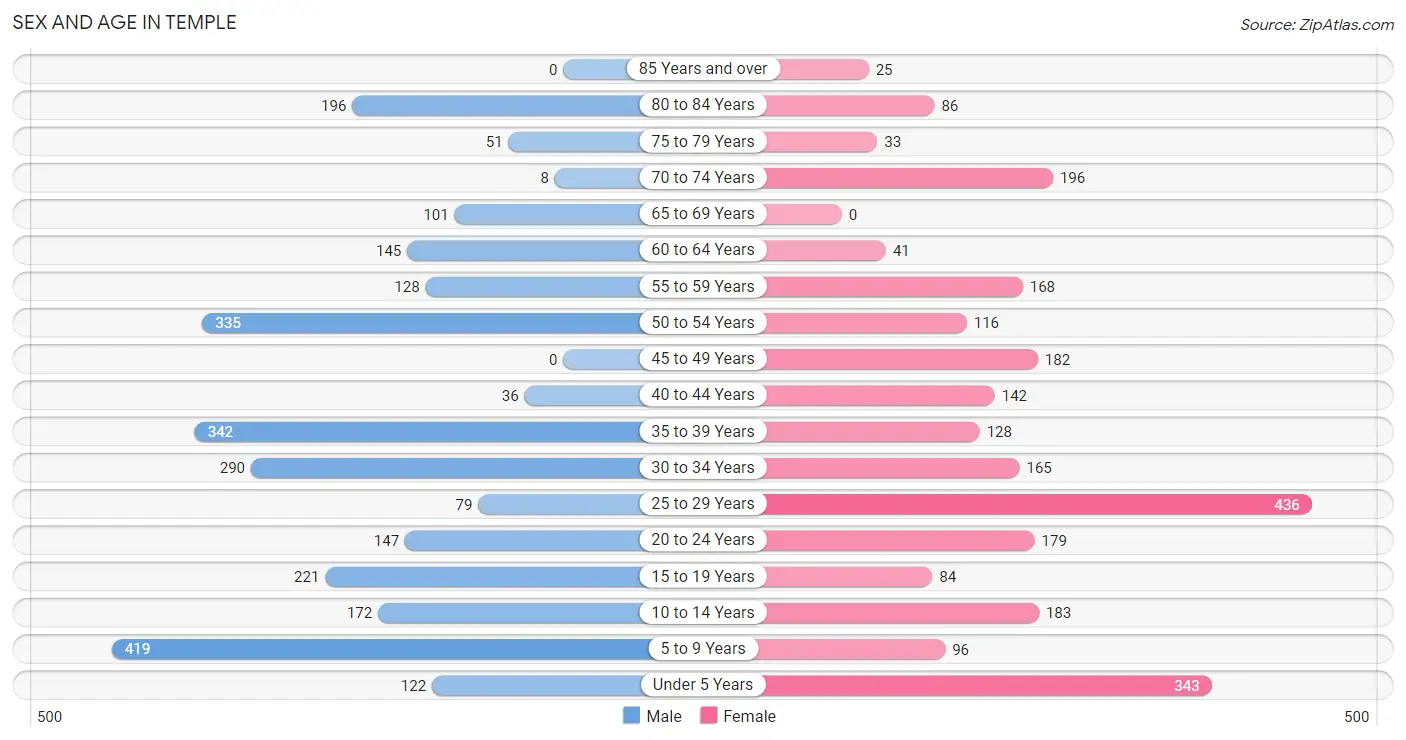
| Age Bracket | Male | Female |
| Under 5 Years | 122 (4.4%) | 343 (13.2%) |
| 5 to 9 Years | 419 (15.0%) | 96 (3.7%) |
| 10 to 14 Years | 172 (6.2%) | 183 (7.0%) |
| 15 to 19 Years | 221 (7.9%) | 84 (3.2%) |
| 20 to 24 Years | 147 (5.3%) | 179 (6.9%) |
| 25 to 29 Years | 79 (2.8%) | 436 (16.8%) |
| 30 to 34 Years | 290 (10.4%) | 165 (6.3%) |
| 35 to 39 Years | 342 (12.2%) | 128 (4.9%) |
| 40 to 44 Years | 36 (1.3%) | 142 (5.5%) |
| 45 to 49 Years | 0 (0.0%) | 182 (7.0%) |
| 50 to 54 Years | 335 (12.0%) | 116 (4.5%) |
| 55 to 59 Years | 128 (4.6%) | 168 (6.5%) |
| 60 to 64 Years | 145 (5.2%) | 41 (1.6%) |
| 65 to 69 Years | 101 (3.6%) | 0 (0.0%) |
| 70 to 74 Years | 8 (0.3%) | 196 (7.5%) |
| 75 to 79 Years | 51 (1.8%) | 33 (1.3%) |
| 80 to 84 Years | 196 (7.0%) | 86 (3.3%) |
| 85 Years and over | 0 (0.0%) | 25 (1.0%) |
| Total | 2,792 (100.0%) | 2,603 (100.0%) |
Families and Households in Temple
Median Family Size in Temple
The median family size in Temple is 3.30 persons per family, with married-couple families (1,001 | 70.9%) accounting for the largest median family size of 3.51 persons per family. On the other hand, single male/father families (124 | 8.8%) represent the smallest median family size with 2.01 persons per family.
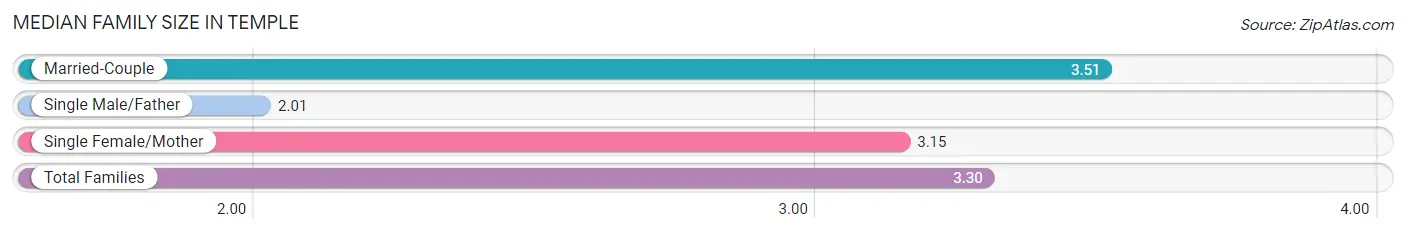
| Family Type | # Families | Family Size |
| Married-Couple | 1,001 (70.9%) | 3.51 |
| Single Male/Father | 124 (8.8%) | 2.01 |
| Single Female/Mother | 287 (20.3%) | 3.15 |
| Total Families | 1,412 (100.0%) | 3.30 |
Median Household Size in Temple
The median household size in Temple is 2.95 persons per household, with married-couple households (1,001 | 54.7%) accounting for the largest median household size of 3.68 persons per household. non-family households (417 | 22.8%) represent the smallest median household size with 1.08 persons per household.
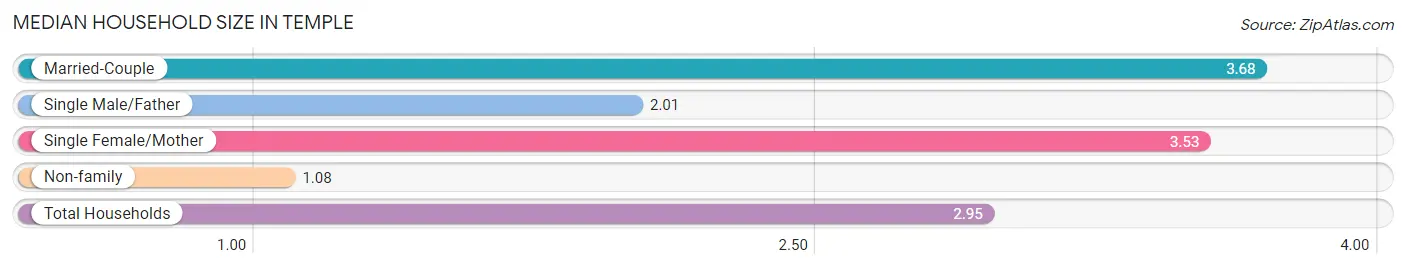
| Household Type | # Households | Household Size |
| Married-Couple | 1,001 (54.7%) | 3.68 |
| Single Male/Father | 124 (6.8%) | 2.01 |
| Single Female/Mother | 287 (15.7%) | 3.53 |
| Non-family | 417 (22.8%) | 1.08 |
| Total Households | 1,829 (100.0%) | 2.95 |
Household Size by Marriage Status in Temple
Out of a total of 1,829 households in Temple, 1,412 (77.2%) are family households, while 417 (22.8%) are nonfamily households. The most numerous type of family households are 2-person households, comprising 470, and the most common type of nonfamily households are 1-person households, comprising 383.
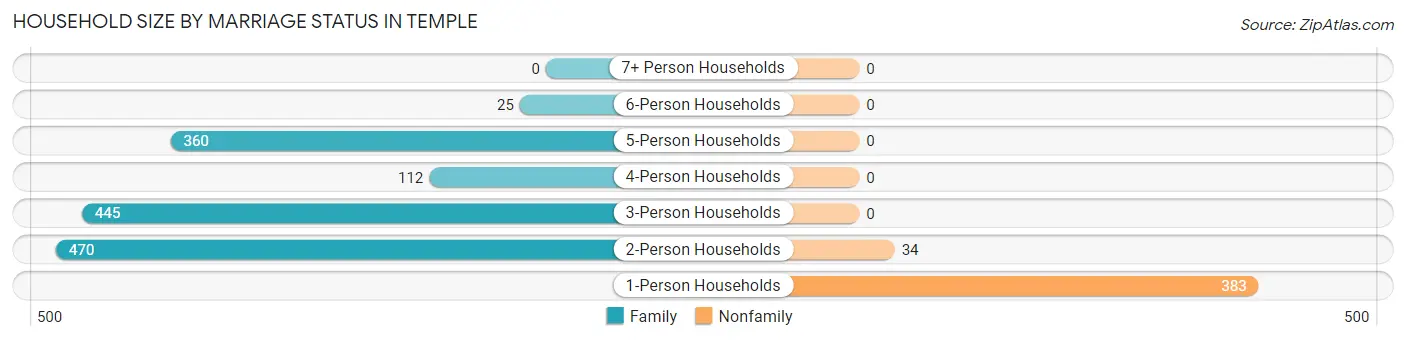
| Household Size | Family Households | Nonfamily Households |
| 1-Person Households | - | 383 (20.9%) |
| 2-Person Households | 470 (25.7%) | 34 (1.9%) |
| 3-Person Households | 445 (24.3%) | 0 (0.0%) |
| 4-Person Households | 112 (6.1%) | 0 (0.0%) |
| 5-Person Households | 360 (19.7%) | 0 (0.0%) |
| 6-Person Households | 25 (1.4%) | 0 (0.0%) |
| 7+ Person Households | 0 (0.0%) | 0 (0.0%) |
| Total | 1,412 (77.2%) | 417 (22.8%) |
Female Fertility in Temple
Fertility by Age in Temple
Average fertility rate in Temple is 44.0 births per 1,000 women. Women in the age bracket of 20 to 34 years have the highest fertility rate with 55.0 births per 1,000 women. Women in the age bracket of 20 to 34 years acount for 74.1% of all women with births.
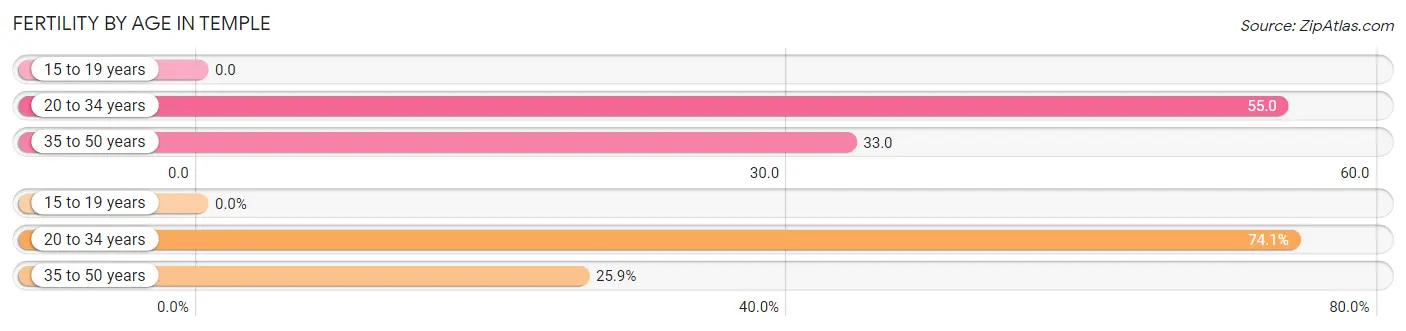
| Age Bracket | Women with Births | Births / 1,000 Women |
| 15 to 19 years | 0 (0.0%) | 0.0 |
| 20 to 34 years | 43 (74.1%) | 55.0 |
| 35 to 50 years | 15 (25.9%) | 33.0 |
| Total | 58 (100.0%) | 44.0 |
Fertility by Age by Marriage Status in Temple
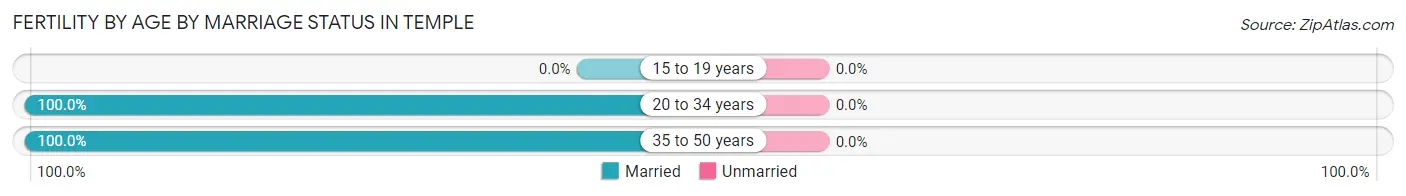
| Age Bracket | Married | Unmarried |
| 15 to 19 years | 0 (0.0%) | 0 (0.0%) |
| 20 to 34 years | 43 (100.0%) | 0 (0.0%) |
| 35 to 50 years | 15 (100.0%) | 0 (0.0%) |
| Total | 58 (100.0%) | 0 (0.0%) |
Fertility by Education in Temple
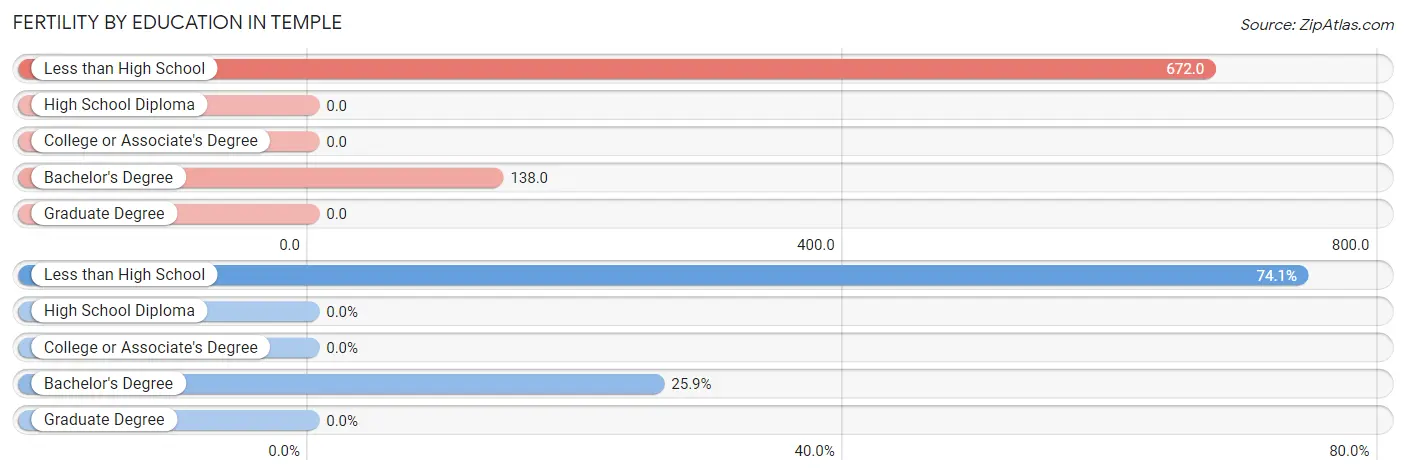
| Educational Attainment | Women with Births | Births / 1,000 Women |
| Less than High School | 43 (74.1%) | 672.0 |
| High School Diploma | 0 (0.0%) | 0.0 |
| College or Associate's Degree | 0 (0.0%) | 0.0 |
| Bachelor's Degree | 15 (25.9%) | 138.0 |
| Graduate Degree | 0 (0.0%) | 0.0 |
| Total | 58 (100.0%) | 44.0 |
Fertility by Education by Marriage Status in Temple
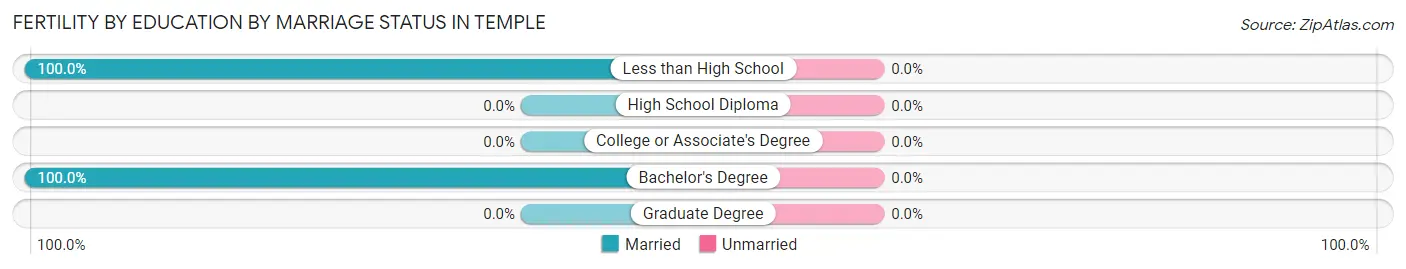
| Educational Attainment | Married | Unmarried |
| Less than High School | 43 (100.0%) | 0 (0.0%) |
| High School Diploma | 0 (0.0%) | 0 (0.0%) |
| College or Associate's Degree | 0 (0.0%) | 0 (0.0%) |
| Bachelor's Degree | 15 (100.0%) | 0 (0.0%) |
| Graduate Degree | 0 (0.0%) | 0 (0.0%) |
| Total | 58 (100.0%) | 0 (0.0%) |
Employment Characteristics in Temple
Employment by Class of Employer in Temple
Among the 2,653 employed individuals in Temple, private company employees (2,209 | 83.3%), local government employees (168 | 6.3%), and not-for-profit organizations (101 | 3.8%) make up the most common classes of employment.
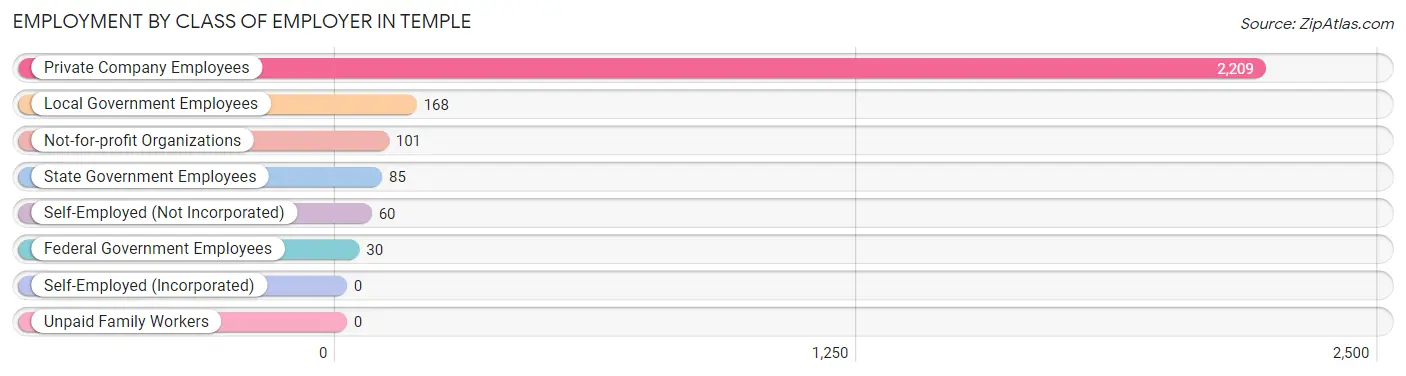
| Employer Class | # Employees | % Employees |
| Private Company Employees | 2,209 | 83.3% |
| Self-Employed (Incorporated) | 0 | 0.0% |
| Self-Employed (Not Incorporated) | 60 | 2.3% |
| Not-for-profit Organizations | 101 | 3.8% |
| Local Government Employees | 168 | 6.3% |
| State Government Employees | 85 | 3.2% |
| Federal Government Employees | 30 | 1.1% |
| Unpaid Family Workers | 0 | 0.0% |
| Total | 2,653 | 100.0% |
Employment Status by Age in Temple
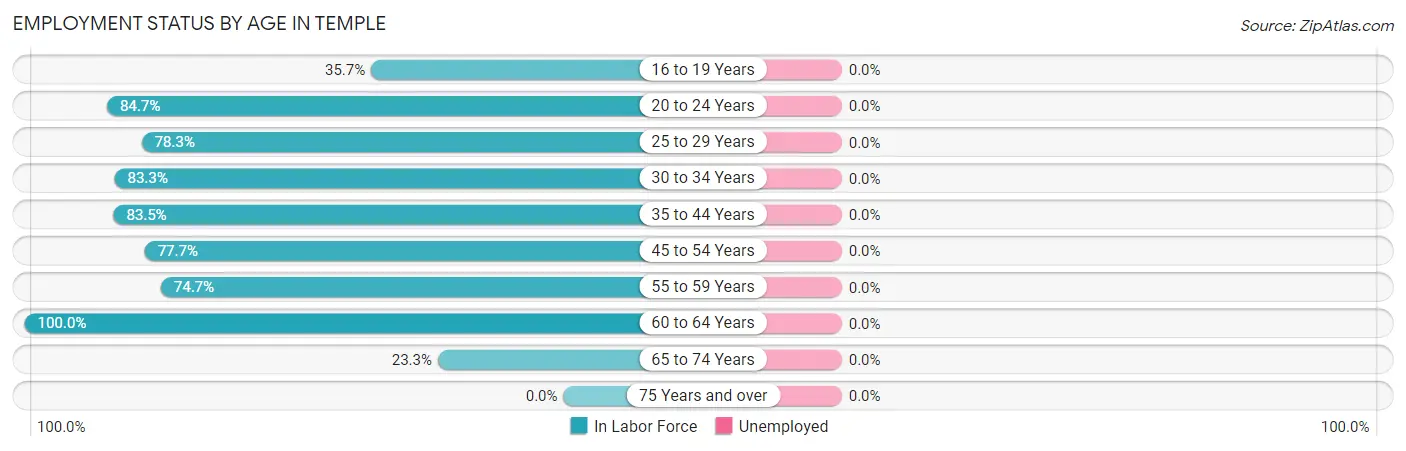
| Age Bracket | In Labor Force | Unemployed |
| 16 to 19 Years | 84 (35.7%) | 0 (0.0%) |
| 20 to 24 Years | 276 (84.7%) | 0 (0.0%) |
| 25 to 29 Years | 403 (78.3%) | 0 (0.0%) |
| 30 to 34 Years | 379 (83.3%) | 0 (0.0%) |
| 35 to 44 Years | 541 (83.5%) | 0 (0.0%) |
| 45 to 54 Years | 492 (77.7%) | 0 (0.0%) |
| 55 to 59 Years | 221 (74.7%) | 0 (0.0%) |
| 60 to 64 Years | 186 (100.0%) | 0 (0.0%) |
| 65 to 74 Years | 71 (23.3%) | 0 (0.0%) |
| 75 Years and over | 0 (0.0%) | 0 (0.0%) |
| Total | 2,653 (66.5%) | 0 (0.0%) |
Employment Status by Educational Attainment in Temple
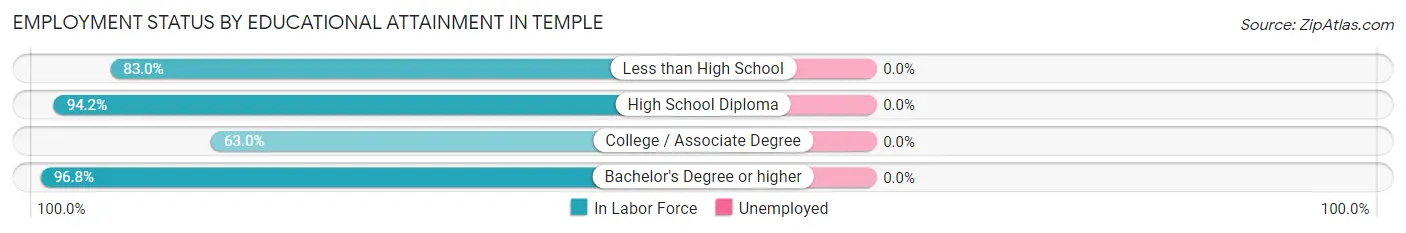
| Educational Attainment | In Labor Force | Unemployed |
| Less than High School | 210 (83.0%) | 0 (0.0%) |
| High School Diploma | 872 (94.2%) | 0 (0.0%) |
| College / Associate Degree | 680 (63.0%) | 0 (0.0%) |
| Bachelor's Degree or higher | 460 (96.8%) | 0 (0.0%) |
| Total | 2,222 (81.3%) | 0 (0.0%) |
Employment Occupations by Sex in Temple
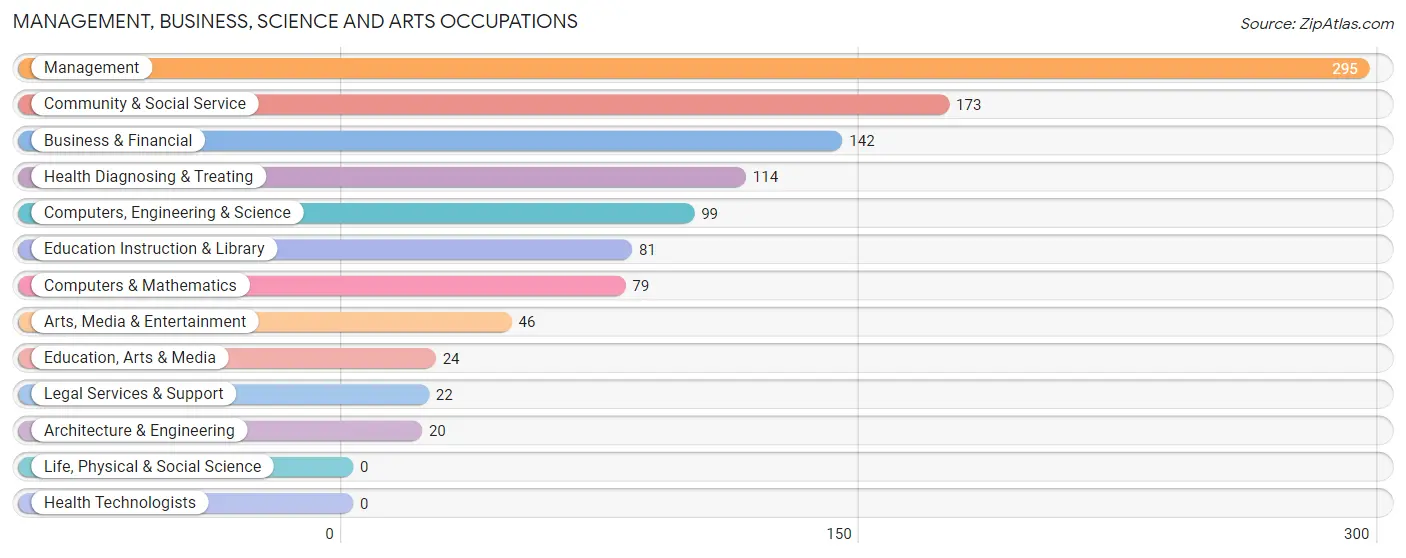
Management, Business, Science and Arts Occupations
The most common Management, Business, Science and Arts occupations in Temple are Management (295 | 11.1%), Community & Social Service (173 | 6.5%), Business & Financial (142 | 5.3%), Health Diagnosing & Treating (114 | 4.3%), and Computers, Engineering & Science (99 | 3.7%).
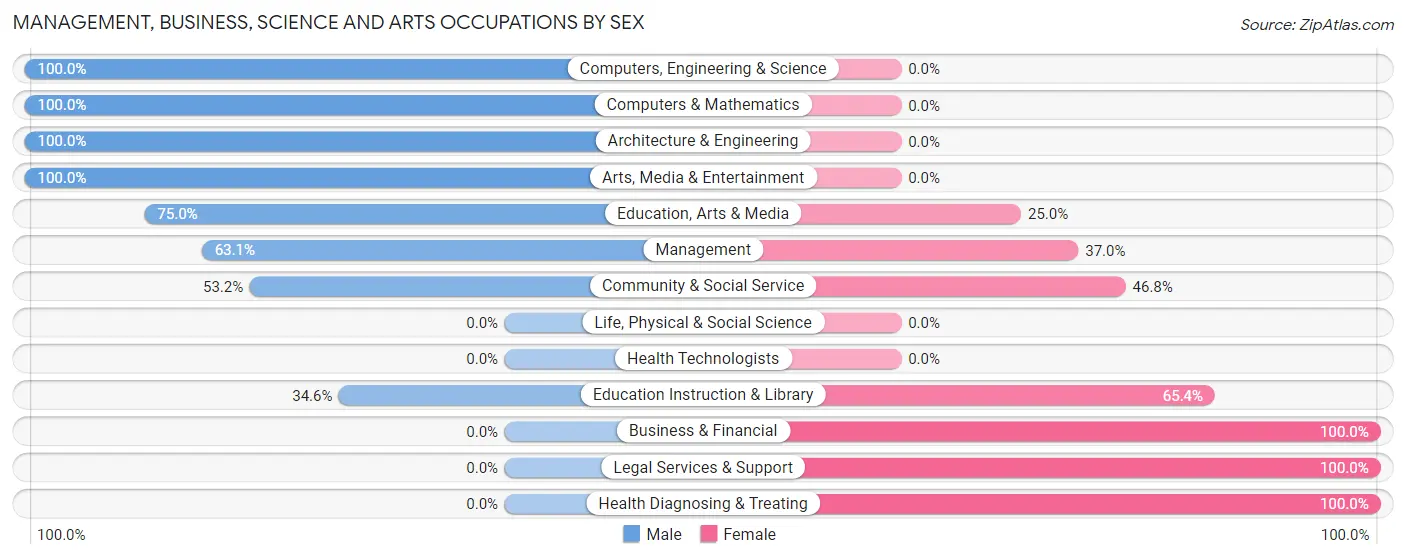
Management, Business, Science and Arts Occupations by Sex
Within the Management, Business, Science and Arts occupations in Temple, the most male-oriented occupations are Computers, Engineering & Science (100.0%), Computers & Mathematics (100.0%), and Architecture & Engineering (100.0%), while the most female-oriented occupations are Business & Financial (100.0%), Legal Services & Support (100.0%), and Health Diagnosing & Treating (100.0%).
| Occupation | Male | Female |
| Management | 186 (63.0%) | 109 (36.9%) |
| Business & Financial | 0 (0.0%) | 142 (100.0%) |
| Computers, Engineering & Science | 99 (100.0%) | 0 (0.0%) |
| Computers & Mathematics | 79 (100.0%) | 0 (0.0%) |
| Architecture & Engineering | 20 (100.0%) | 0 (0.0%) |
| Life, Physical & Social Science | 0 (0.0%) | 0 (0.0%) |
| Community & Social Service | 92 (53.2%) | 81 (46.8%) |
| Education, Arts & Media | 18 (75.0%) | 6 (25.0%) |
| Legal Services & Support | 0 (0.0%) | 22 (100.0%) |
| Education Instruction & Library | 28 (34.6%) | 53 (65.4%) |
| Arts, Media & Entertainment | 46 (100.0%) | 0 (0.0%) |
| Health Diagnosing & Treating | 0 (0.0%) | 114 (100.0%) |
| Health Technologists | 0 (0.0%) | 0 (0.0%) |
| Total (Category) | 377 (45.8%) | 446 (54.2%) |
| Total (Overall) | 1,454 (54.8%) | 1,199 (45.2%) |
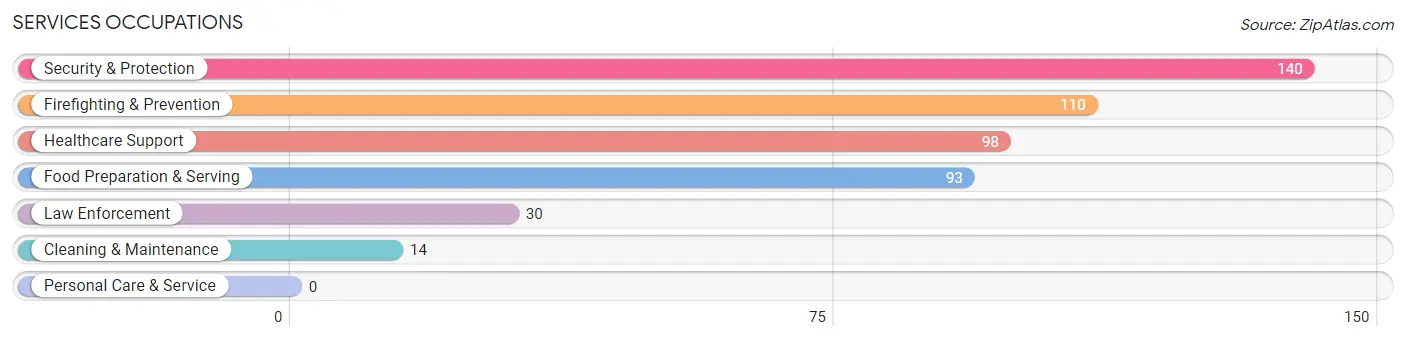
Services Occupations
The most common Services occupations in Temple are Security & Protection (140 | 5.3%), Firefighting & Prevention (110 | 4.2%), Healthcare Support (98 | 3.7%), Food Preparation & Serving (93 | 3.5%), and Law Enforcement (30 | 1.1%).
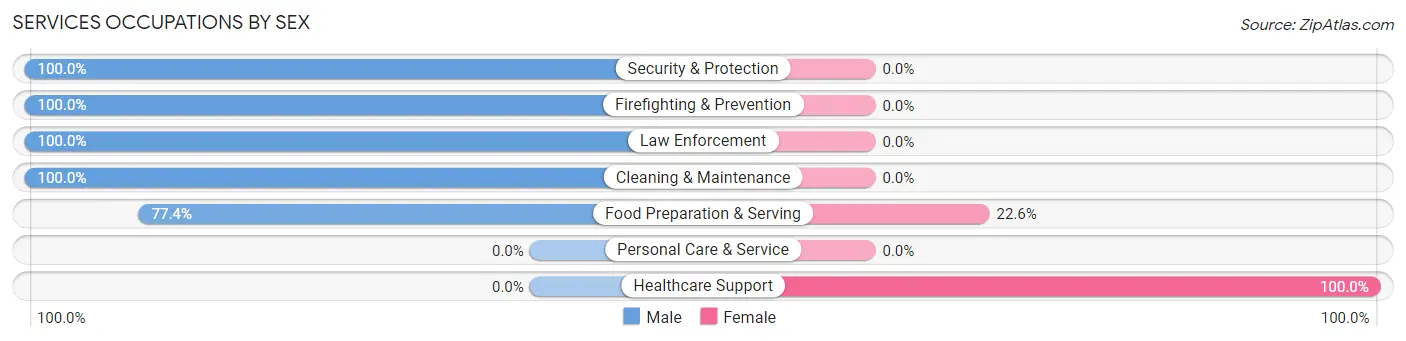
Services Occupations by Sex
Within the Services occupations in Temple, the most male-oriented occupations are Security & Protection (100.0%), Firefighting & Prevention (100.0%), and Law Enforcement (100.0%), while the most female-oriented occupations are Healthcare Support (100.0%), and Food Preparation & Serving (22.6%).
| Occupation | Male | Female |
| Healthcare Support | 0 (0.0%) | 98 (100.0%) |
| Security & Protection | 140 (100.0%) | 0 (0.0%) |
| Firefighting & Prevention | 110 (100.0%) | 0 (0.0%) |
| Law Enforcement | 30 (100.0%) | 0 (0.0%) |
| Food Preparation & Serving | 72 (77.4%) | 21 (22.6%) |
| Cleaning & Maintenance | 14 (100.0%) | 0 (0.0%) |
| Personal Care & Service | 0 (0.0%) | 0 (0.0%) |
| Total (Category) | 226 (65.5%) | 119 (34.5%) |
| Total (Overall) | 1,454 (54.8%) | 1,199 (45.2%) |
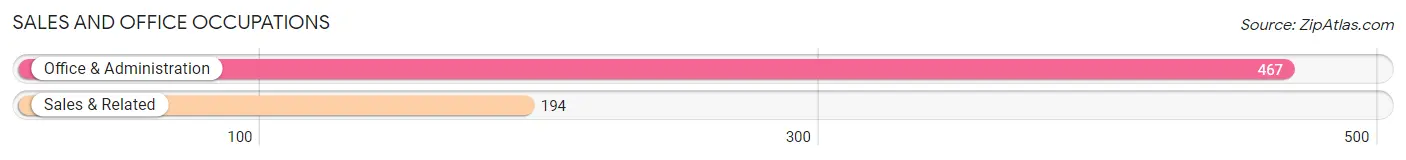
Sales and Office Occupations
The most common Sales and Office occupations in Temple are Office & Administration (467 | 17.6%), and Sales & Related (194 | 7.3%).
Sales and Office Occupations by Sex
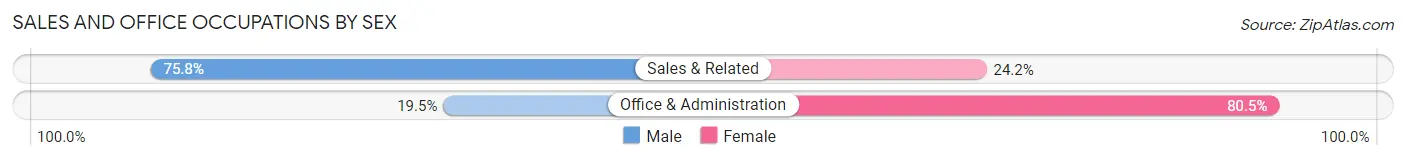
| Occupation | Male | Female |
| Sales & Related | 147 (75.8%) | 47 (24.2%) |
| Office & Administration | 91 (19.5%) | 376 (80.5%) |
| Total (Category) | 238 (36.0%) | 423 (64.0%) |
| Total (Overall) | 1,454 (54.8%) | 1,199 (45.2%) |
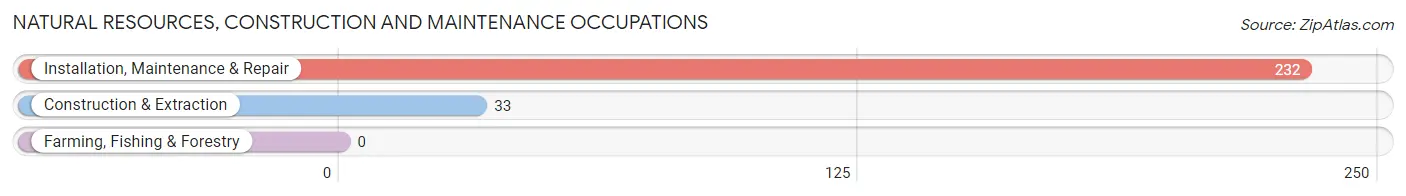
Natural Resources, Construction and Maintenance Occupations
The most common Natural Resources, Construction and Maintenance occupations in Temple are Installation, Maintenance & Repair (232 | 8.7%), and Construction & Extraction (33 | 1.2%).
Natural Resources, Construction and Maintenance Occupations by Sex
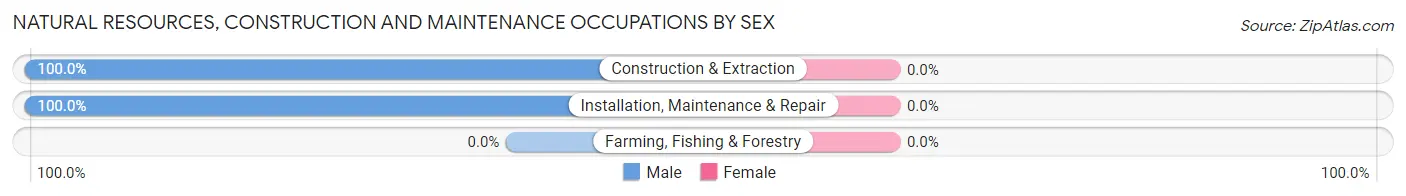
| Occupation | Male | Female |
| Farming, Fishing & Forestry | 0 (0.0%) | 0 (0.0%) |
| Construction & Extraction | 33 (100.0%) | 0 (0.0%) |
| Installation, Maintenance & Repair | 232 (100.0%) | 0 (0.0%) |
| Total (Category) | 265 (100.0%) | 0 (0.0%) |
| Total (Overall) | 1,454 (54.8%) | 1,199 (45.2%) |
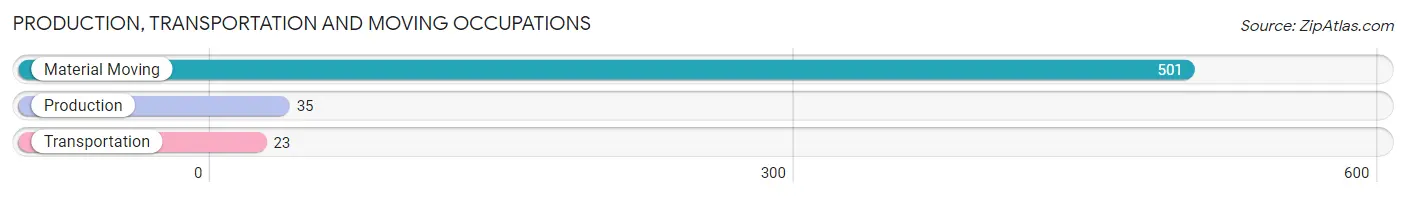
Production, Transportation and Moving Occupations
The most common Production, Transportation and Moving occupations in Temple are Material Moving (501 | 18.9%), Production (35 | 1.3%), and Transportation (23 | 0.9%).
Production, Transportation and Moving Occupations by Sex
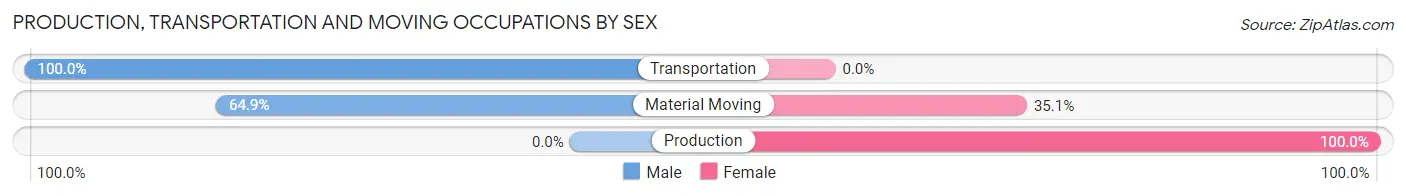
| Occupation | Male | Female |
| Production | 0 (0.0%) | 35 (100.0%) |
| Transportation | 23 (100.0%) | 0 (0.0%) |
| Material Moving | 325 (64.9%) | 176 (35.1%) |
| Total (Category) | 348 (62.3%) | 211 (37.8%) |
| Total (Overall) | 1,454 (54.8%) | 1,199 (45.2%) |
Employment Industries by Sex in Temple
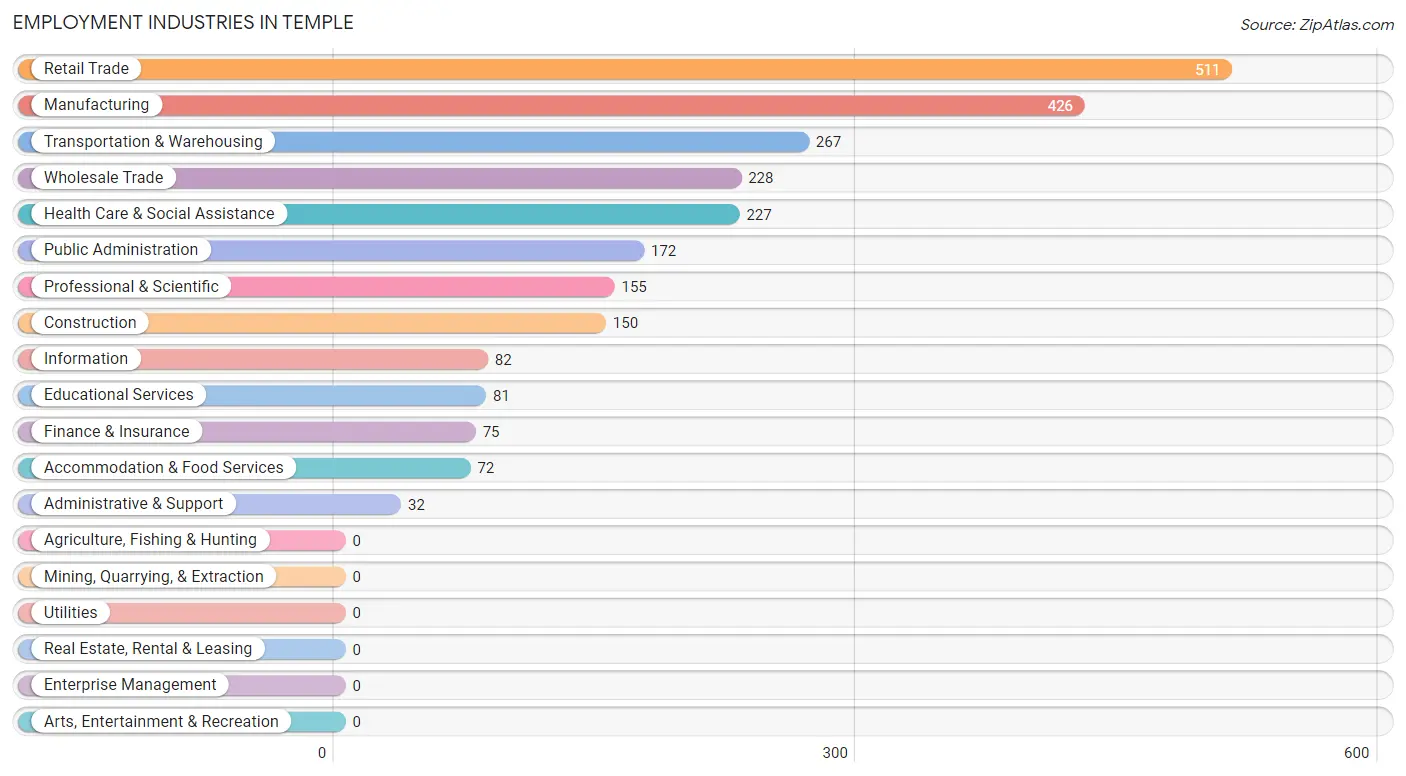
Employment Industries in Temple
The major employment industries in Temple include Retail Trade (511 | 19.3%), Manufacturing (426 | 16.1%), Transportation & Warehousing (267 | 10.1%), Wholesale Trade (228 | 8.6%), and Health Care & Social Assistance (227 | 8.6%).
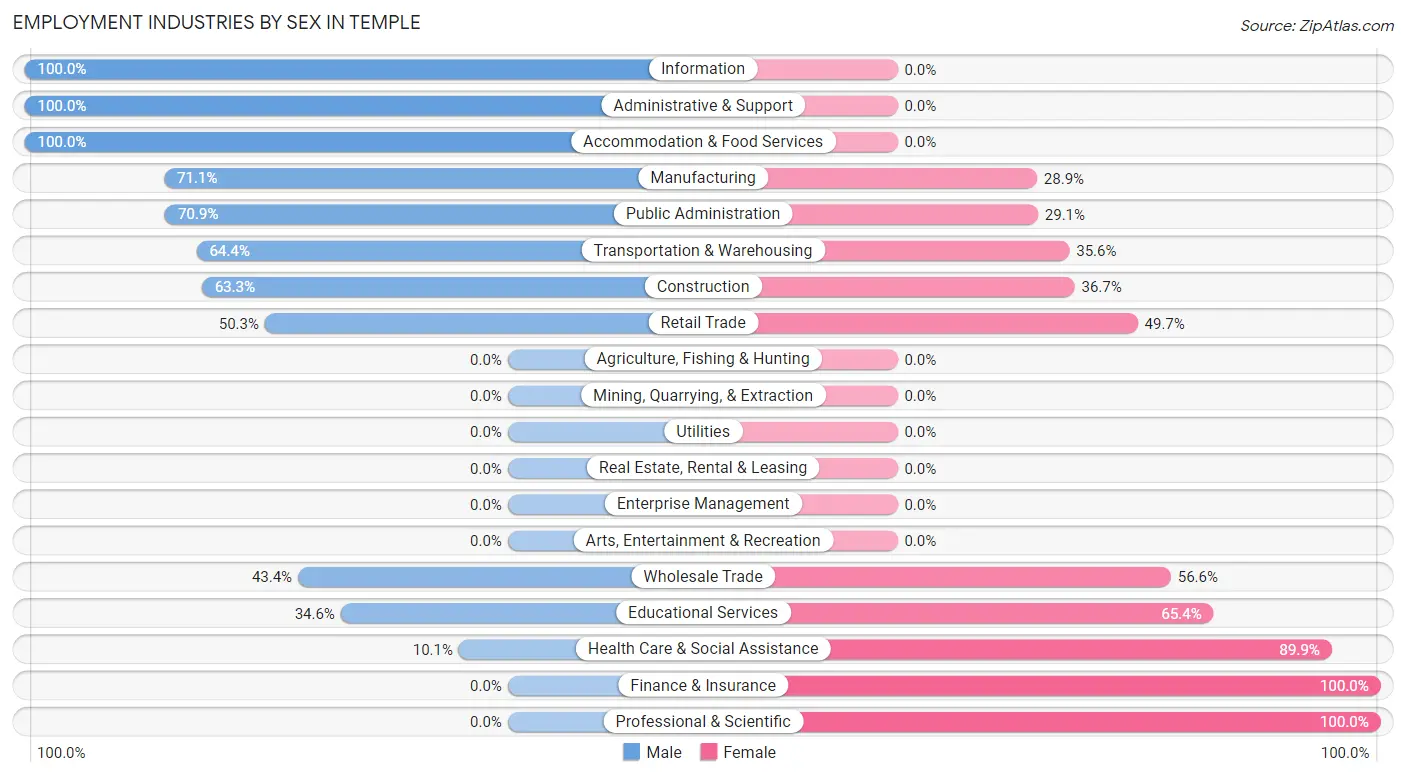
Employment Industries by Sex in Temple
The Temple industries that see more men than women are Information (100.0%), Administrative & Support (100.0%), and Accommodation & Food Services (100.0%), whereas the industries that tend to have a higher number of women are Finance & Insurance (100.0%), Professional & Scientific (100.0%), and Health Care & Social Assistance (89.9%).
| Industry | Male | Female |
| Agriculture, Fishing & Hunting | 0 (0.0%) | 0 (0.0%) |
| Mining, Quarrying, & Extraction | 0 (0.0%) | 0 (0.0%) |
| Construction | 95 (63.3%) | 55 (36.7%) |
| Manufacturing | 303 (71.1%) | 123 (28.9%) |
| Wholesale Trade | 99 (43.4%) | 129 (56.6%) |
| Retail Trade | 257 (50.3%) | 254 (49.7%) |
| Transportation & Warehousing | 172 (64.4%) | 95 (35.6%) |
| Utilities | 0 (0.0%) | 0 (0.0%) |
| Information | 82 (100.0%) | 0 (0.0%) |
| Finance & Insurance | 0 (0.0%) | 75 (100.0%) |
| Real Estate, Rental & Leasing | 0 (0.0%) | 0 (0.0%) |
| Professional & Scientific | 0 (0.0%) | 155 (100.0%) |
| Enterprise Management | 0 (0.0%) | 0 (0.0%) |
| Administrative & Support | 32 (100.0%) | 0 (0.0%) |
| Educational Services | 28 (34.6%) | 53 (65.4%) |
| Health Care & Social Assistance | 23 (10.1%) | 204 (89.9%) |
| Arts, Entertainment & Recreation | 0 (0.0%) | 0 (0.0%) |
| Accommodation & Food Services | 72 (100.0%) | 0 (0.0%) |
| Public Administration | 122 (70.9%) | 50 (29.1%) |
| Total | 1,454 (54.8%) | 1,199 (45.2%) |
Education in Temple
School Enrollment in Temple
The most common levels of schooling among the 1,554 students in Temple are middle school (329 | 21.2%), college / undergraduate (306 | 19.7%), and high school (268 | 17.2%).
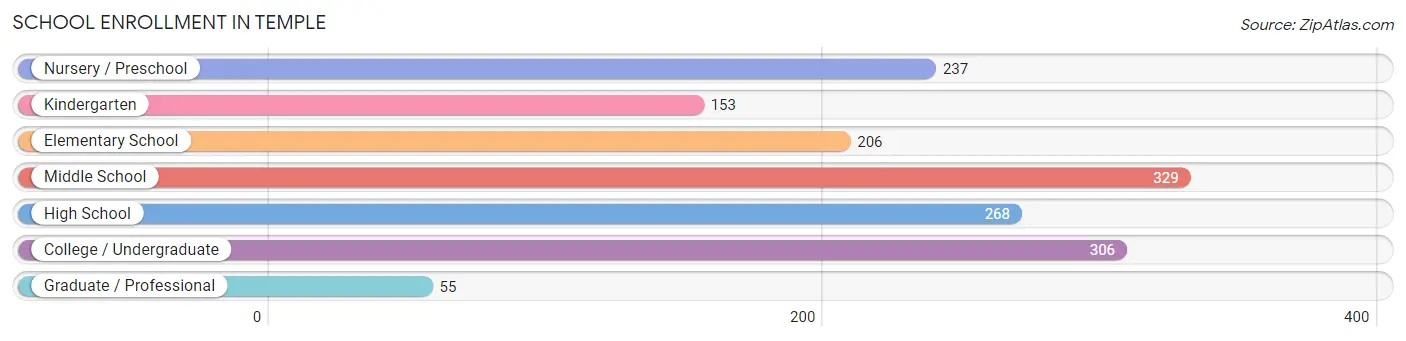
| School Level | # Students | % Students |
| Nursery / Preschool | 237 | 15.2% |
| Kindergarten | 153 | 9.9% |
| Elementary School | 206 | 13.3% |
| Middle School | 329 | 21.2% |
| High School | 268 | 17.2% |
| College / Undergraduate | 306 | 19.7% |
| Graduate / Professional | 55 | 3.5% |
| Total | 1,554 | 100.0% |
School Enrollment by Age by Funding Source in Temple
Out of a total of 1,554 students who are enrolled in schools in Temple, 127 (8.2%) attend a private institution, while the remaining 1,427 (91.8%) are enrolled in public schools. The age group of 25 to 34 year olds has the highest likelihood of being enrolled in private schools, with 128 (50.0% in the age bracket) enrolled. Conversely, the age group of 3 to 4 year olds has the lowest likelihood of being enrolled in a private school, with 98 (100.0% in the age bracket) attending a public institution.
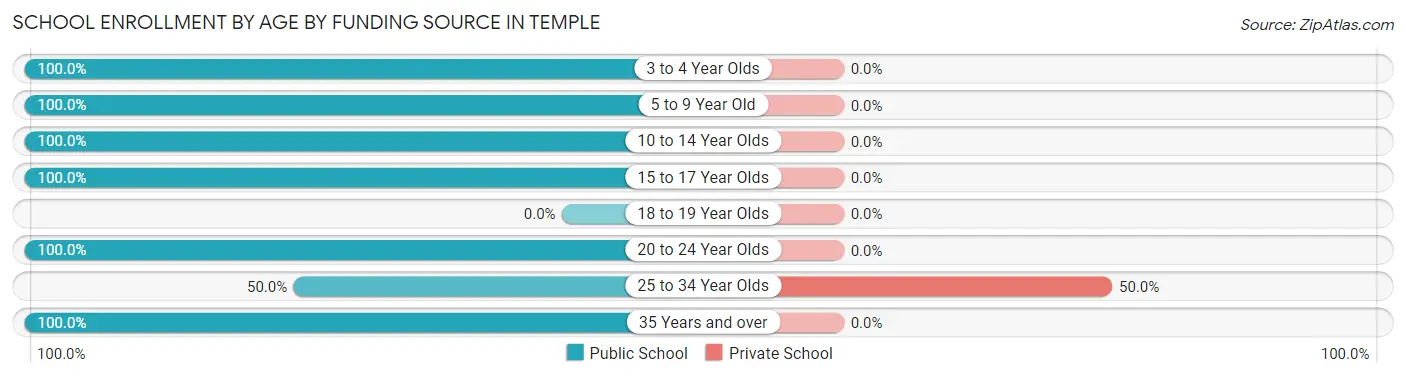
| Age Bracket | Public School | Private School |
| 3 to 4 Year Olds | 98 (100.0%) | 0 (0.0%) |
| 5 to 9 Year Old | 498 (100.0%) | 0 (0.0%) |
| 10 to 14 Year Olds | 355 (100.0%) | 0 (0.0%) |
| 15 to 17 Year Olds | 242 (100.0%) | 0 (0.0%) |
| 18 to 19 Year Olds | 0 (0.0%) | 0 (0.0%) |
| 20 to 24 Year Olds | 50 (100.0%) | 0 (0.0%) |
| 25 to 34 Year Olds | 128 (50.0%) | 128 (50.0%) |
| 35 Years and over | 55 (100.0%) | 0 (0.0%) |
| Total | 1,427 (91.8%) | 127 (8.2%) |
Educational Attainment by Field of Study in Temple
Education (167 | 25.4%), bio, nature & agricultural (136 | 20.7%), physical & health sciences (115 | 17.5%), social sciences (87 | 13.2%), and business (71 | 10.8%) are the most common fields of study among 657 individuals in Temple who have obtained a bachelor's degree or higher.
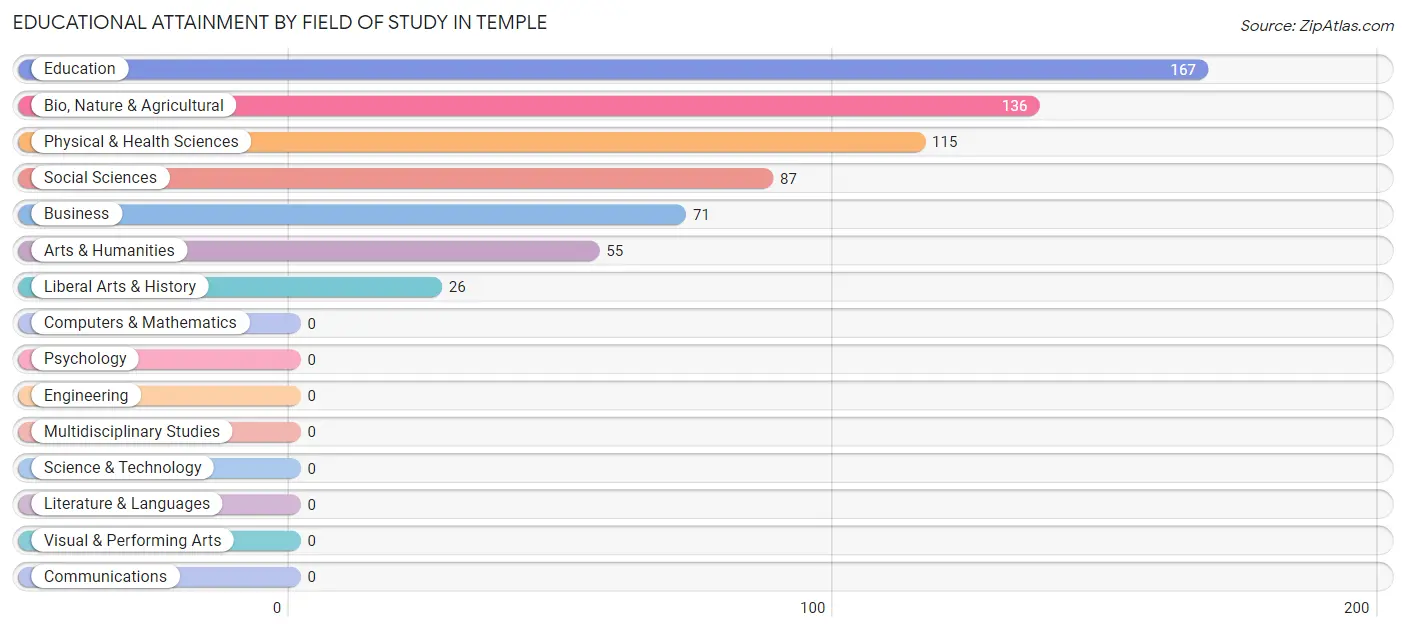
| Field of Study | # Graduates | % Graduates |
| Computers & Mathematics | 0 | 0.0% |
| Bio, Nature & Agricultural | 136 | 20.7% |
| Physical & Health Sciences | 115 | 17.5% |
| Psychology | 0 | 0.0% |
| Social Sciences | 87 | 13.2% |
| Engineering | 0 | 0.0% |
| Multidisciplinary Studies | 0 | 0.0% |
| Science & Technology | 0 | 0.0% |
| Business | 71 | 10.8% |
| Education | 167 | 25.4% |
| Literature & Languages | 0 | 0.0% |
| Liberal Arts & History | 26 | 4.0% |
| Visual & Performing Arts | 0 | 0.0% |
| Communications | 0 | 0.0% |
| Arts & Humanities | 55 | 8.4% |
| Total | 657 | 100.0% |
Transportation & Commute in Temple
Vehicle Availability by Sex in Temple
The most prevalent vehicle ownership categories in Temple are males with 2 vehicles (623, accounting for 42.8%) and females with 2 vehicles (450, making up 52.0%).
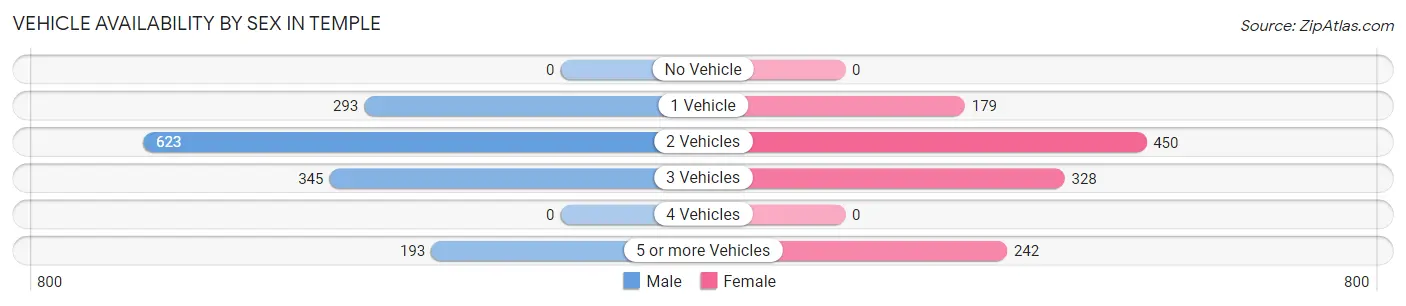
| Vehicles Available | Male | Female |
| No Vehicle | 0 (0.0%) | 0 (0.0%) |
| 1 Vehicle | 293 (20.2%) | 179 (14.9%) |
| 2 Vehicles | 623 (42.8%) | 450 (37.5%) |
| 3 Vehicles | 345 (23.7%) | 328 (27.4%) |
| 4 Vehicles | 0 (0.0%) | 0 (0.0%) |
| 5 or more Vehicles | 193 (13.3%) | 242 (20.2%) |
| Total | 1,454 (100.0%) | 1,199 (100.0%) |
Commute Time in Temple
The most frequently occuring commute durations in Temple are 15 to 19 minutes (557 commuters, 23.9%), 30 to 34 minutes (492 commuters, 21.1%), and 20 to 24 minutes (223 commuters, 9.6%).
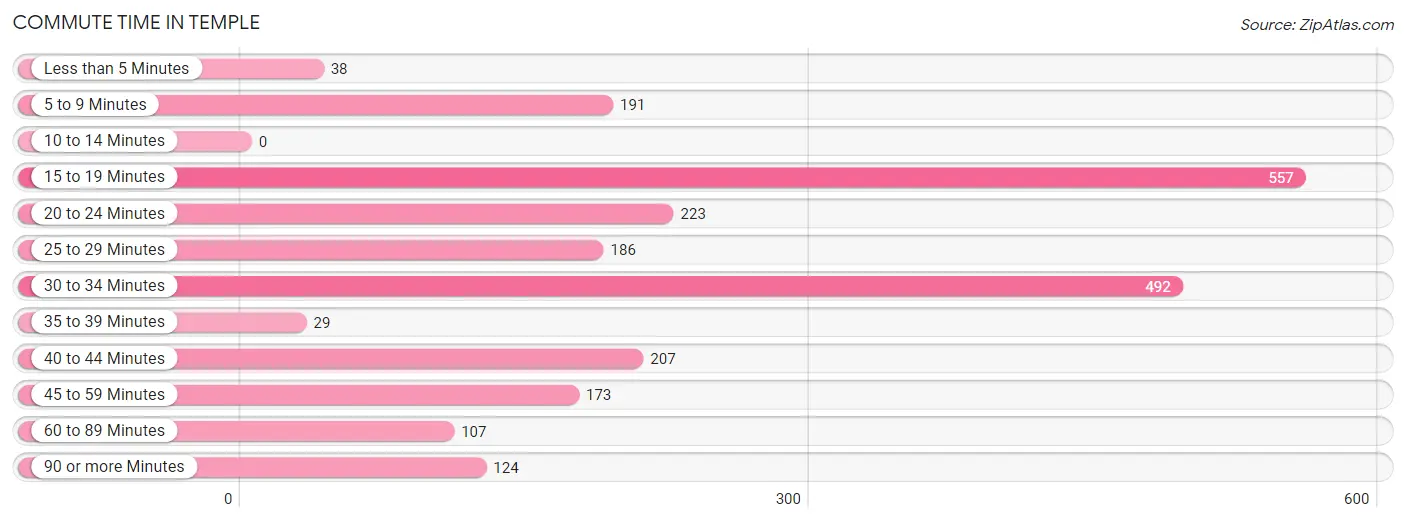
| Commute Time | # Commuters | % Commuters |
| Less than 5 Minutes | 38 | 1.6% |
| 5 to 9 Minutes | 191 | 8.2% |
| 10 to 14 Minutes | 0 | 0.0% |
| 15 to 19 Minutes | 557 | 23.9% |
| 20 to 24 Minutes | 223 | 9.6% |
| 25 to 29 Minutes | 186 | 8.0% |
| 30 to 34 Minutes | 492 | 21.1% |
| 35 to 39 Minutes | 29 | 1.3% |
| 40 to 44 Minutes | 207 | 8.9% |
| 45 to 59 Minutes | 173 | 7.4% |
| 60 to 89 Minutes | 107 | 4.6% |
| 90 or more Minutes | 124 | 5.3% |
Commute Time by Sex in Temple
The most common commute times in Temple are 15 to 19 minutes (373 commuters, 28.6%) for males and 20 to 24 minutes (223 commuters, 21.8%) for females.
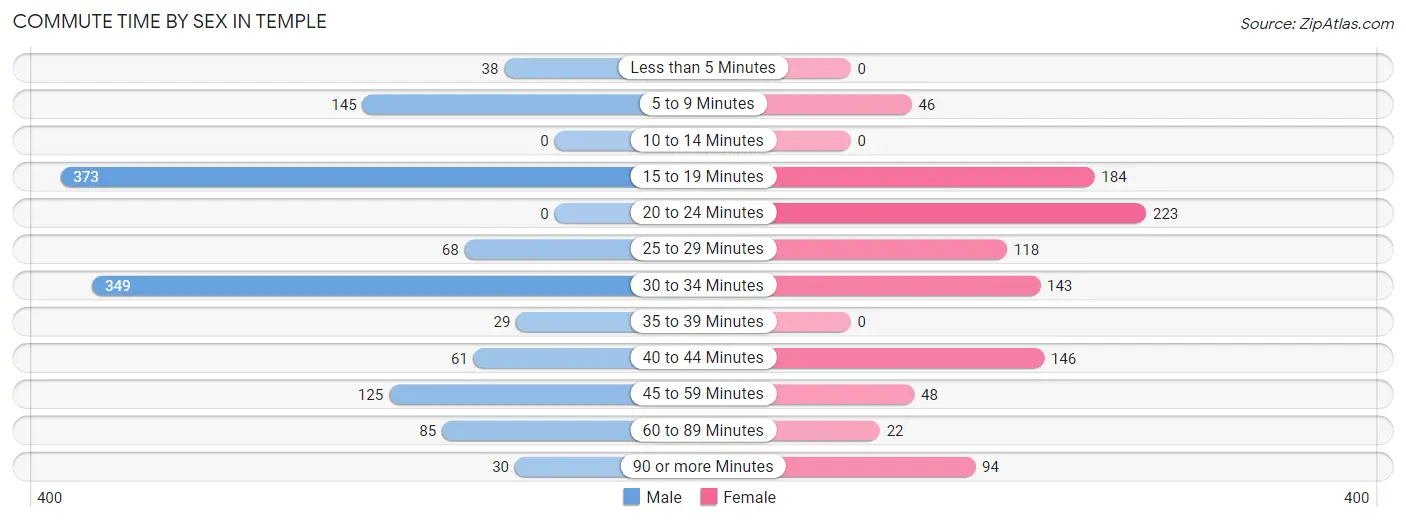
| Commute Time | Male | Female |
| Less than 5 Minutes | 38 (2.9%) | 0 (0.0%) |
| 5 to 9 Minutes | 145 (11.1%) | 46 (4.5%) |
| 10 to 14 Minutes | 0 (0.0%) | 0 (0.0%) |
| 15 to 19 Minutes | 373 (28.6%) | 184 (18.0%) |
| 20 to 24 Minutes | 0 (0.0%) | 223 (21.8%) |
| 25 to 29 Minutes | 68 (5.2%) | 118 (11.5%) |
| 30 to 34 Minutes | 349 (26.8%) | 143 (14.0%) |
| 35 to 39 Minutes | 29 (2.2%) | 0 (0.0%) |
| 40 to 44 Minutes | 61 (4.7%) | 146 (14.3%) |
| 45 to 59 Minutes | 125 (9.6%) | 48 (4.7%) |
| 60 to 89 Minutes | 85 (6.5%) | 22 (2.1%) |
| 90 or more Minutes | 30 (2.3%) | 94 (9.2%) |
Time of Departure to Work by Sex in Temple
The most frequent times of departure to work in Temple are 6:30 AM to 6:59 AM (276, 21.2%) for males and 7:30 AM to 7:59 AM (350, 34.2%) for females.
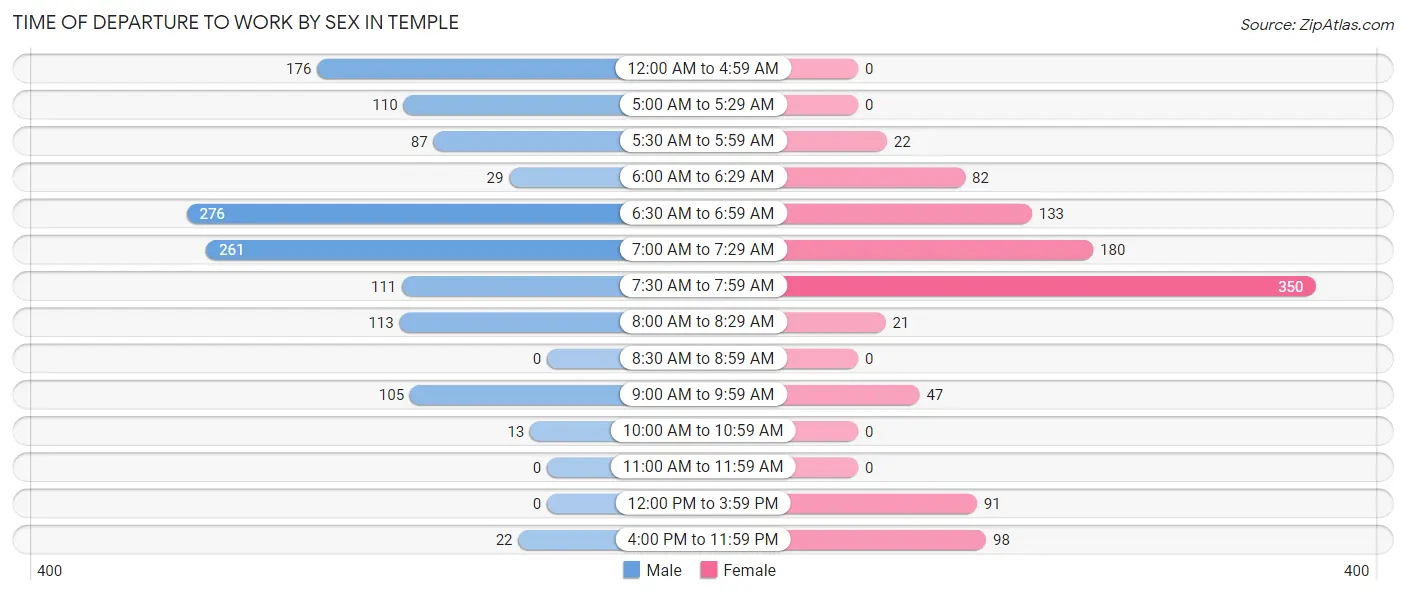
| Time of Departure | Male | Female |
| 12:00 AM to 4:59 AM | 176 (13.5%) | 0 (0.0%) |
| 5:00 AM to 5:29 AM | 110 (8.4%) | 0 (0.0%) |
| 5:30 AM to 5:59 AM | 87 (6.7%) | 22 (2.1%) |
| 6:00 AM to 6:29 AM | 29 (2.2%) | 82 (8.0%) |
| 6:30 AM to 6:59 AM | 276 (21.2%) | 133 (13.0%) |
| 7:00 AM to 7:29 AM | 261 (20.0%) | 180 (17.6%) |
| 7:30 AM to 7:59 AM | 111 (8.5%) | 350 (34.2%) |
| 8:00 AM to 8:29 AM | 113 (8.7%) | 21 (2.1%) |
| 8:30 AM to 8:59 AM | 0 (0.0%) | 0 (0.0%) |
| 9:00 AM to 9:59 AM | 105 (8.1%) | 47 (4.6%) |
| 10:00 AM to 10:59 AM | 13 (1.0%) | 0 (0.0%) |
| 11:00 AM to 11:59 AM | 0 (0.0%) | 0 (0.0%) |
| 12:00 PM to 3:59 PM | 0 (0.0%) | 91 (8.9%) |
| 4:00 PM to 11:59 PM | 22 (1.7%) | 98 (9.6%) |
| Total | 1,303 (100.0%) | 1,024 (100.0%) |
Housing Occupancy in Temple
Occupancy by Ownership in Temple
Of the total 1,829 dwellings in Temple, owner-occupied units account for 1,606 (87.8%), while renter-occupied units make up 223 (12.2%).
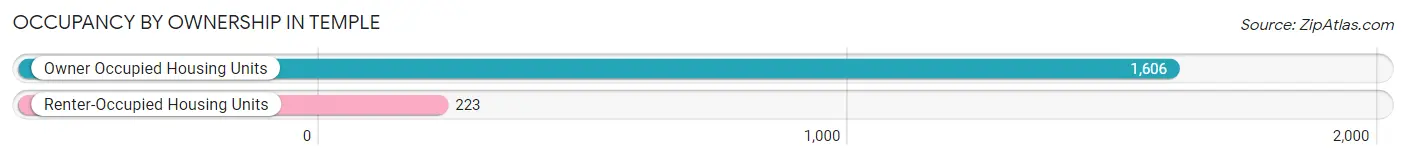
| Occupancy | # Housing Units | % Housing Units |
| Owner Occupied Housing Units | 1,606 | 87.8% |
| Renter-Occupied Housing Units | 223 | 12.2% |
| Total Occupied Housing Units | 1,829 | 100.0% |
Occupancy by Household Size in Temple
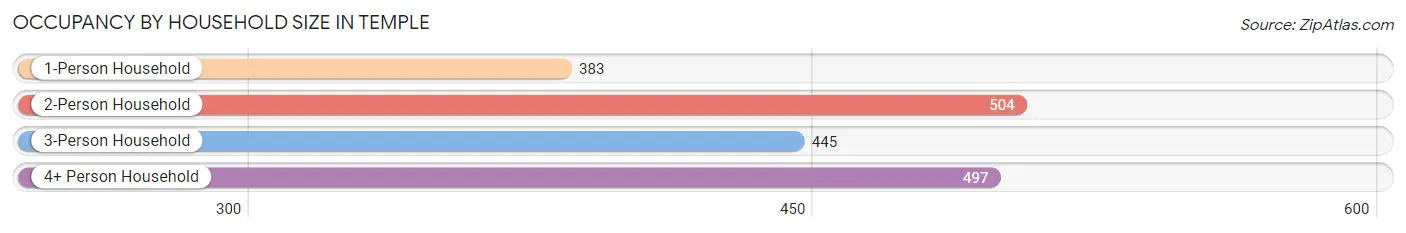
| Household Size | # Housing Units | % Housing Units |
| 1-Person Household | 383 | 20.9% |
| 2-Person Household | 504 | 27.6% |
| 3-Person Household | 445 | 24.3% |
| 4+ Person Household | 497 | 27.2% |
| Total Housing Units | 1,829 | 100.0% |
Occupancy by Ownership by Household Size in Temple
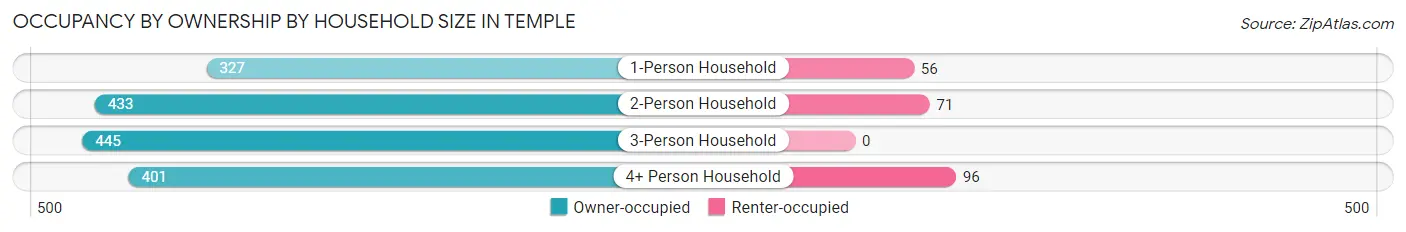
| Household Size | Owner-occupied | Renter-occupied |
| 1-Person Household | 327 (85.4%) | 56 (14.6%) |
| 2-Person Household | 433 (85.9%) | 71 (14.1%) |
| 3-Person Household | 445 (100.0%) | 0 (0.0%) |
| 4+ Person Household | 401 (80.7%) | 96 (19.3%) |
| Total Housing Units | 1,606 (87.8%) | 223 (12.2%) |
Occupancy by Educational Attainment in Temple
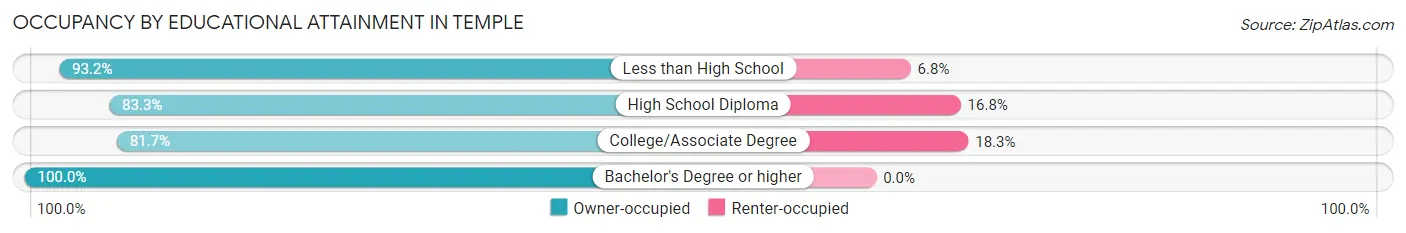
| Household Size | Owner-occupied | Renter-occupied |
| Less than High School | 245 (93.2%) | 18 (6.8%) |
| High School Diploma | 338 (83.3%) | 68 (16.8%) |
| College/Associate Degree | 613 (81.7%) | 137 (18.3%) |
| Bachelor's Degree or higher | 410 (100.0%) | 0 (0.0%) |
Occupancy by Age of Householder in Temple
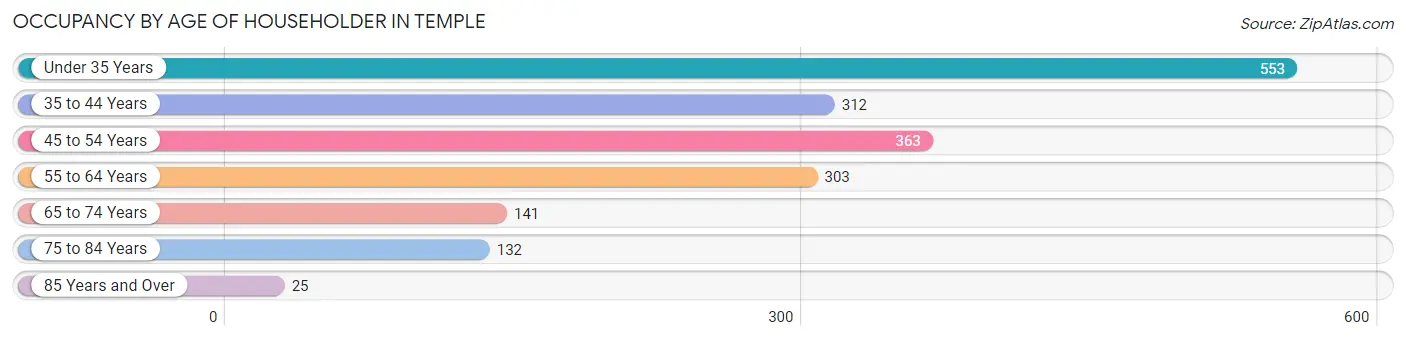
| Age Bracket | # Households | % Households |
| Under 35 Years | 553 | 30.2% |
| 35 to 44 Years | 312 | 17.1% |
| 45 to 54 Years | 363 | 19.9% |
| 55 to 64 Years | 303 | 16.6% |
| 65 to 74 Years | 141 | 7.7% |
| 75 to 84 Years | 132 | 7.2% |
| 85 Years and Over | 25 | 1.4% |
| Total | 1,829 | 100.0% |
Housing Finances in Temple
Median Income by Occupancy in Temple
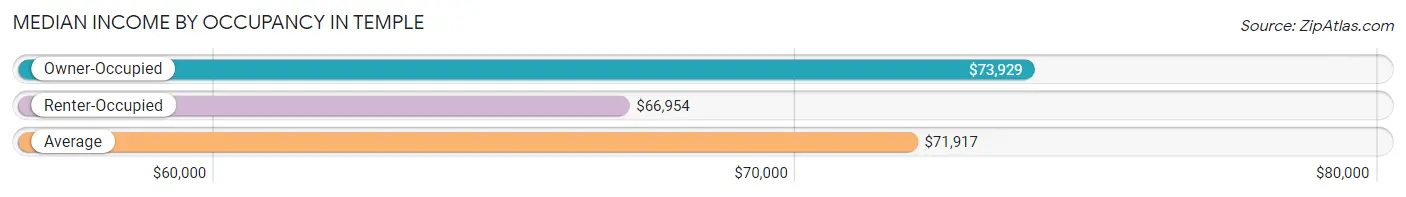
| Occupancy Type | # Households | Median Income |
| Owner-Occupied | 1,606 (87.8%) | $73,929 |
| Renter-Occupied | 223 (12.2%) | $66,954 |
| Average | 1,829 (100.0%) | $71,917 |
Occupancy by Householder Income Bracket in Temple
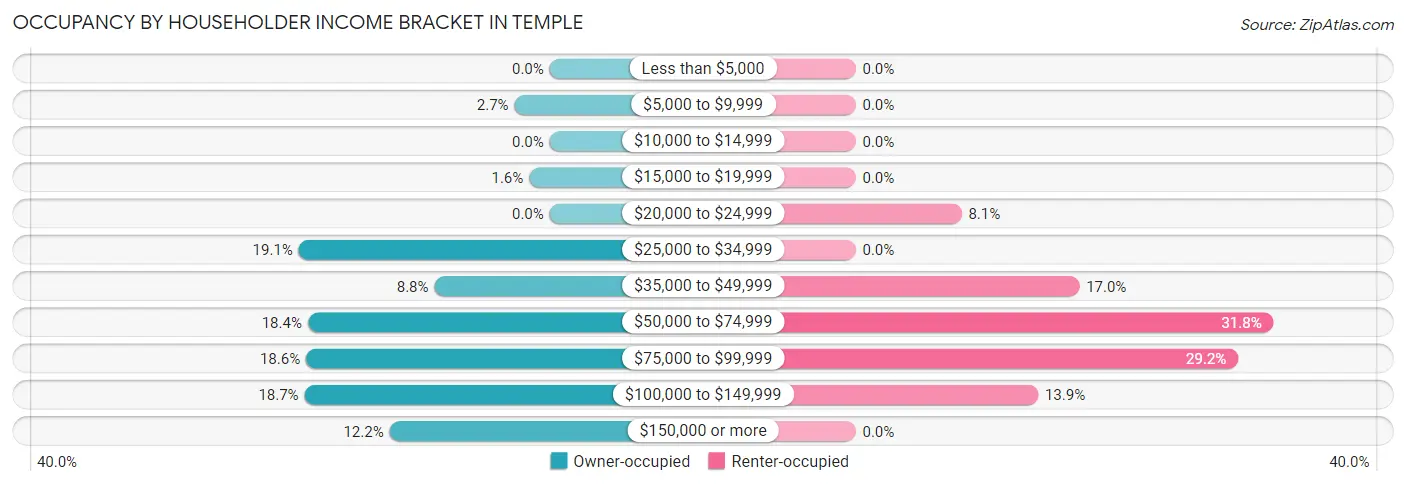
| Income Bracket | Owner-occupied | Renter-occupied |
| Less than $5,000 | 0 (0.0%) | 0 (0.0%) |
| $5,000 to $9,999 | 43 (2.7%) | 0 (0.0%) |
| $10,000 to $14,999 | 0 (0.0%) | 0 (0.0%) |
| $15,000 to $19,999 | 25 (1.6%) | 0 (0.0%) |
| $20,000 to $24,999 | 0 (0.0%) | 18 (8.1%) |
| $25,000 to $34,999 | 307 (19.1%) | 0 (0.0%) |
| $35,000 to $49,999 | 141 (8.8%) | 38 (17.0%) |
| $50,000 to $74,999 | 296 (18.4%) | 71 (31.8%) |
| $75,000 to $99,999 | 298 (18.6%) | 65 (29.1%) |
| $100,000 to $149,999 | 300 (18.7%) | 31 (13.9%) |
| $150,000 or more | 196 (12.2%) | 0 (0.0%) |
| Total | 1,606 (100.0%) | 223 (100.0%) |
Monthly Housing Cost Tiers in Temple
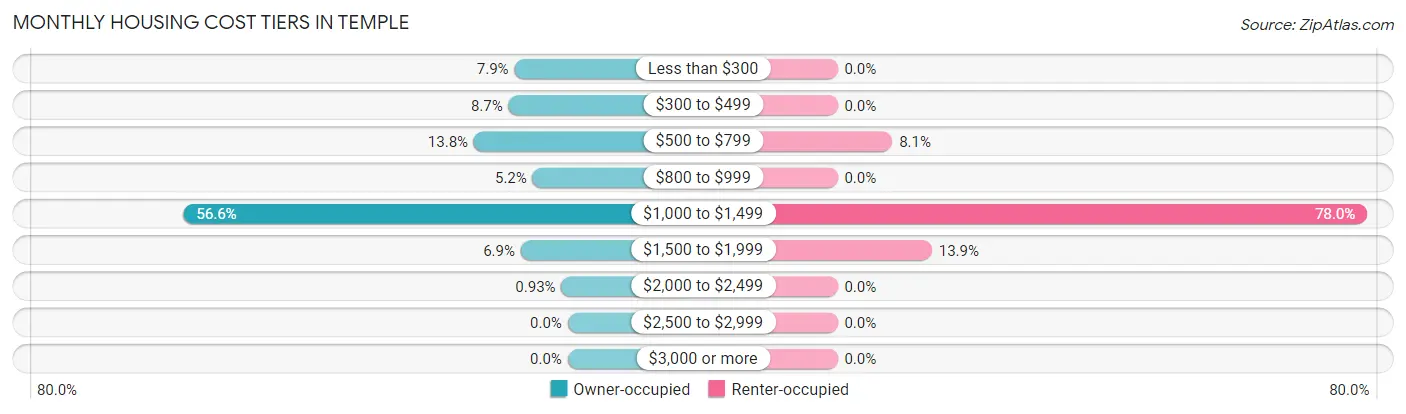
| Monthly Cost | Owner-occupied | Renter-occupied |
| Less than $300 | 126 (7.9%) | 0 (0.0%) |
| $300 to $499 | 140 (8.7%) | 0 (0.0%) |
| $500 to $799 | 222 (13.8%) | 18 (8.1%) |
| $800 to $999 | 83 (5.2%) | 0 (0.0%) |
| $1,000 to $1,499 | 909 (56.6%) | 174 (78.0%) |
| $1,500 to $1,999 | 111 (6.9%) | 31 (13.9%) |
| $2,000 to $2,499 | 15 (0.9%) | 0 (0.0%) |
| $2,500 to $2,999 | 0 (0.0%) | 0 (0.0%) |
| $3,000 or more | 0 (0.0%) | 0 (0.0%) |
| Total | 1,606 (100.0%) | 223 (100.0%) |
Physical Housing Characteristics in Temple
Housing Structures in Temple
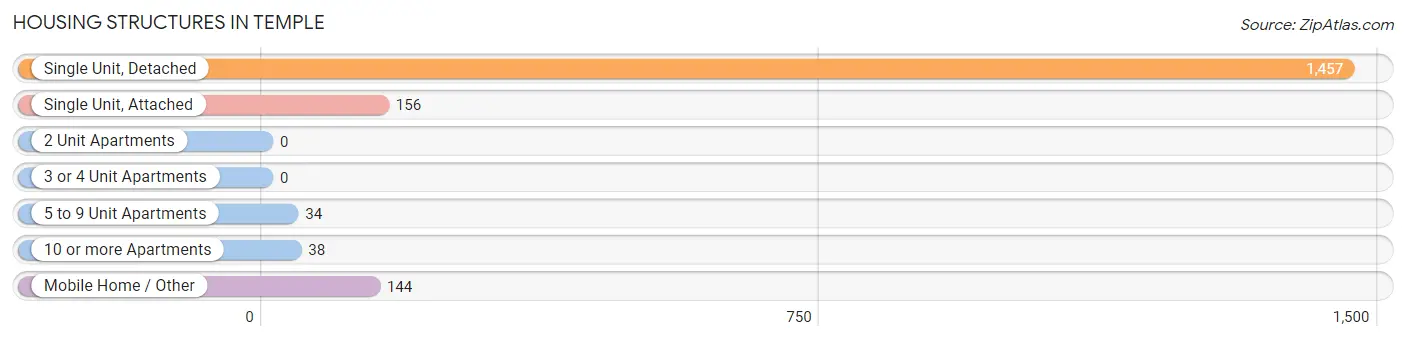
| Structure Type | # Housing Units | % Housing Units |
| Single Unit, Detached | 1,457 | 79.7% |
| Single Unit, Attached | 156 | 8.5% |
| 2 Unit Apartments | 0 | 0.0% |
| 3 or 4 Unit Apartments | 0 | 0.0% |
| 5 to 9 Unit Apartments | 34 | 1.9% |
| 10 or more Apartments | 38 | 2.1% |
| Mobile Home / Other | 144 | 7.9% |
| Total | 1,829 | 100.0% |
Housing Structures by Occupancy in Temple
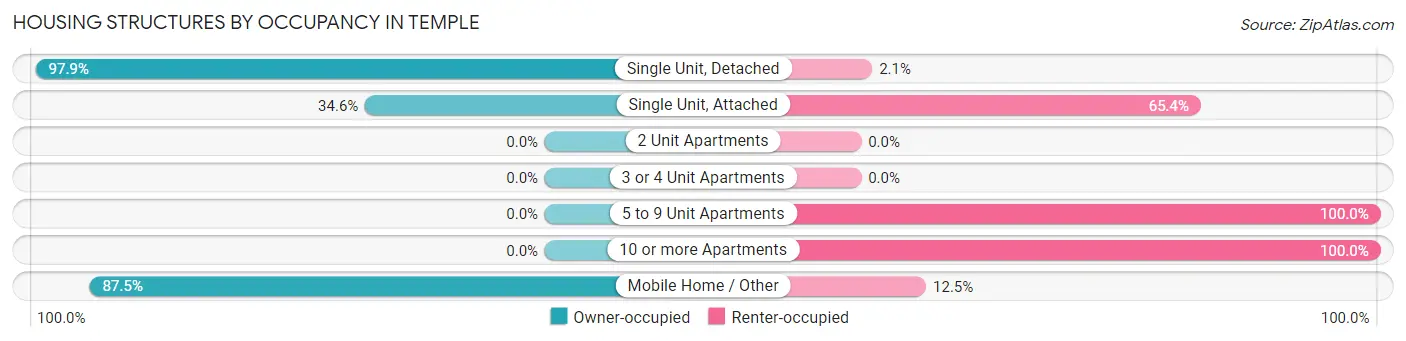
| Structure Type | Owner-occupied | Renter-occupied |
| Single Unit, Detached | 1,426 (97.9%) | 31 (2.1%) |
| Single Unit, Attached | 54 (34.6%) | 102 (65.4%) |
| 2 Unit Apartments | 0 (0.0%) | 0 (0.0%) |
| 3 or 4 Unit Apartments | 0 (0.0%) | 0 (0.0%) |
| 5 to 9 Unit Apartments | 0 (0.0%) | 34 (100.0%) |
| 10 or more Apartments | 0 (0.0%) | 38 (100.0%) |
| Mobile Home / Other | 126 (87.5%) | 18 (12.5%) |
| Total | 1,606 (87.8%) | 223 (12.2%) |
Housing Structures by Number of Rooms in Temple
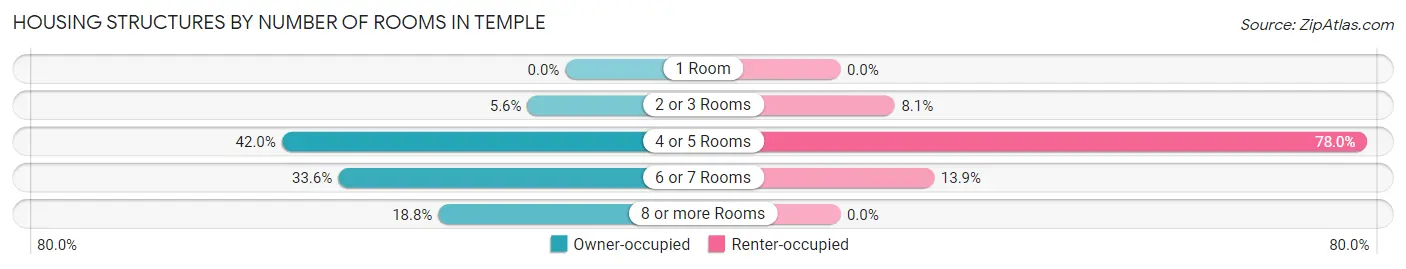
| Number of Rooms | Owner-occupied | Renter-occupied |
| 1 Room | 0 (0.0%) | 0 (0.0%) |
| 2 or 3 Rooms | 90 (5.6%) | 18 (8.1%) |
| 4 or 5 Rooms | 674 (42.0%) | 174 (78.0%) |
| 6 or 7 Rooms | 540 (33.6%) | 31 (13.9%) |
| 8 or more Rooms | 302 (18.8%) | 0 (0.0%) |
| Total | 1,606 (100.0%) | 223 (100.0%) |
Housing Structure by Heating Type in Temple
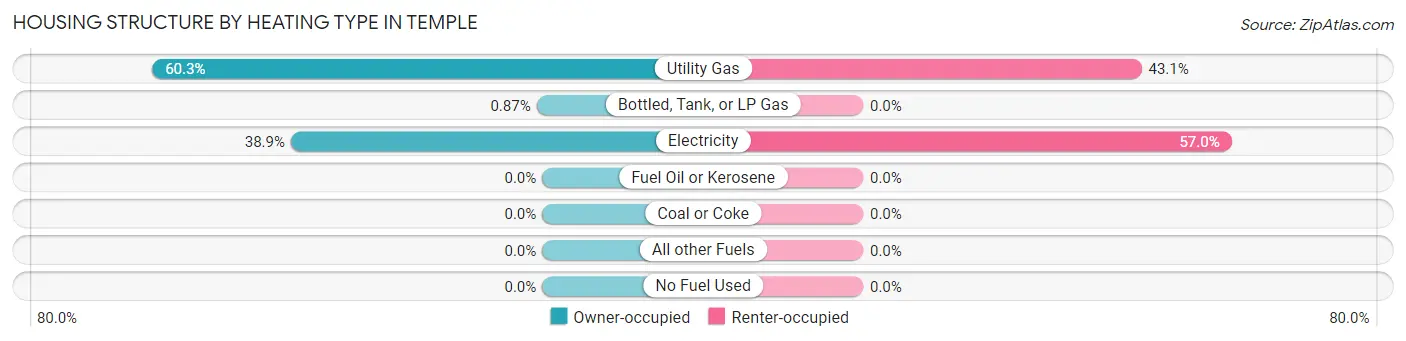
| Heating Type | Owner-occupied | Renter-occupied |
| Utility Gas | 968 (60.3%) | 96 (43.0%) |
| Bottled, Tank, or LP Gas | 14 (0.9%) | 0 (0.0%) |
| Electricity | 624 (38.9%) | 127 (57.0%) |
| Fuel Oil or Kerosene | 0 (0.0%) | 0 (0.0%) |
| Coal or Coke | 0 (0.0%) | 0 (0.0%) |
| All other Fuels | 0 (0.0%) | 0 (0.0%) |
| No Fuel Used | 0 (0.0%) | 0 (0.0%) |
| Total | 1,606 (100.0%) | 223 (100.0%) |
Household Vehicle Usage in Temple
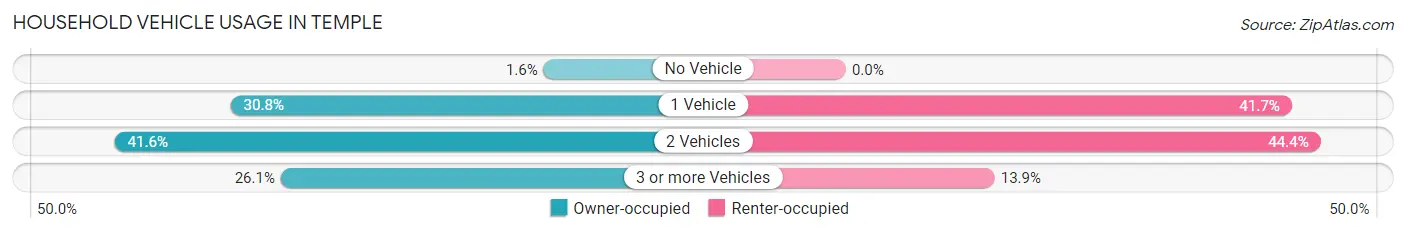
| Vehicles per Household | Owner-occupied | Renter-occupied |
| No Vehicle | 25 (1.6%) | 0 (0.0%) |
| 1 Vehicle | 494 (30.8%) | 93 (41.7%) |
| 2 Vehicles | 668 (41.6%) | 99 (44.4%) |
| 3 or more Vehicles | 419 (26.1%) | 31 (13.9%) |
| Total | 1,606 (100.0%) | 223 (100.0%) |
Real Estate & Mortgages in Temple
Real Estate and Mortgage Overview in Temple
| Characteristic | Without Mortgage | With Mortgage |
| Housing Units | 434 | 1,172 |
| Median Property Value | - | - |
| Median Household Income | $124,265 | $60 |
| Monthly Housing Costs | $383 | $0 |
| Real Estate Taxes | - | - |
Property Value by Mortgage Status in Temple
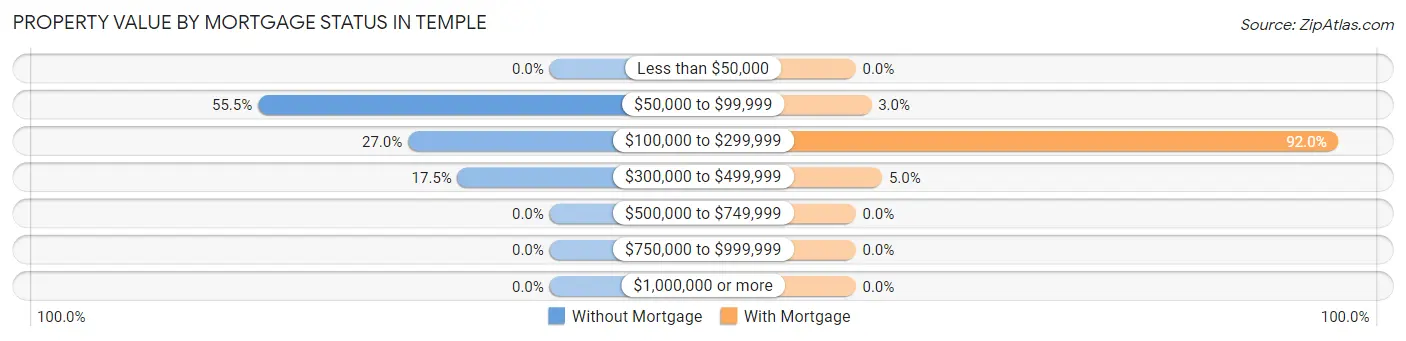
| Property Value | Without Mortgage | With Mortgage |
| Less than $50,000 | 0 (0.0%) | 0 (0.0%) |
| $50,000 to $99,999 | 241 (55.5%) | 35 (3.0%) |
| $100,000 to $299,999 | 117 (27.0%) | 1,078 (92.0%) |
| $300,000 to $499,999 | 76 (17.5%) | 59 (5.0%) |
| $500,000 to $749,999 | 0 (0.0%) | 0 (0.0%) |
| $750,000 to $999,999 | 0 (0.0%) | 0 (0.0%) |
| $1,000,000 or more | 0 (0.0%) | 0 (0.0%) |
| Total | 434 (100.0%) | 1,172 (100.0%) |
Household Income by Mortgage Status in Temple
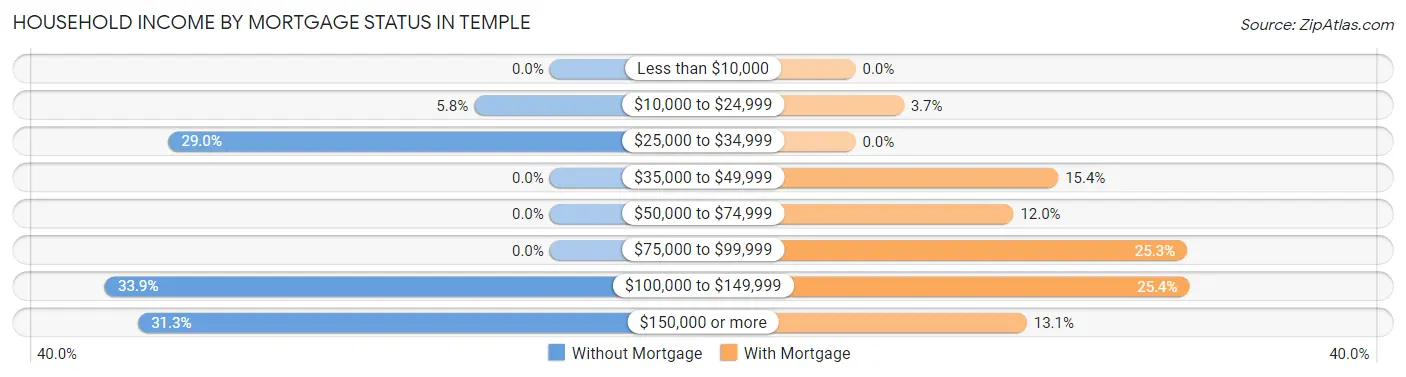
| Household Income | Without Mortgage | With Mortgage |
| Less than $10,000 | 0 (0.0%) | 0 (0.0%) |
| $10,000 to $24,999 | 25 (5.8%) | 43 (3.7%) |
| $25,000 to $34,999 | 126 (29.0%) | 0 (0.0%) |
| $35,000 to $49,999 | 0 (0.0%) | 181 (15.4%) |
| $50,000 to $74,999 | 0 (0.0%) | 141 (12.0%) |
| $75,000 to $99,999 | 0 (0.0%) | 296 (25.3%) |
| $100,000 to $149,999 | 147 (33.9%) | 298 (25.4%) |
| $150,000 or more | 136 (31.3%) | 153 (13.1%) |
| Total | 434 (100.0%) | 1,172 (100.0%) |
Property Value to Household Income Ratio in Temple
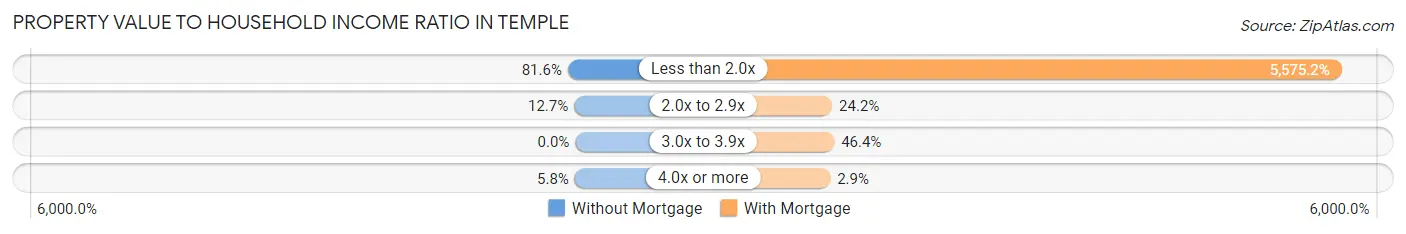
| Value-to-Income Ratio | Without Mortgage | With Mortgage |
| Less than 2.0x | 354 (81.6%) | 65,341 (5,575.2%) |
| 2.0x to 2.9x | 55 (12.7%) | 283 (24.1%) |
| 3.0x to 3.9x | 0 (0.0%) | 544 (46.4%) |
| 4.0x or more | 25 (5.8%) | 34 (2.9%) |
| Total | 434 (100.0%) | 1,172 (100.0%) |
Real Estate Taxes by Mortgage Status in Temple
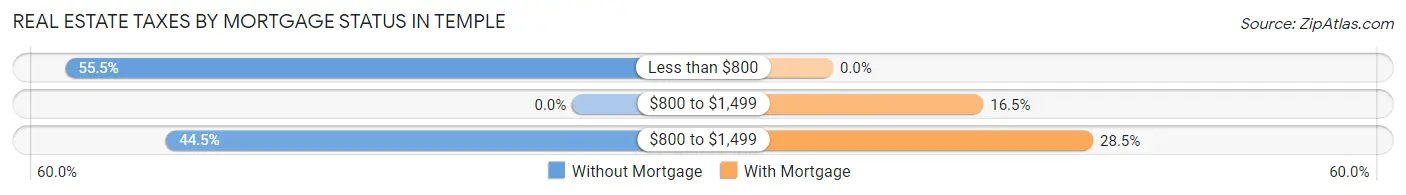
| Property Taxes | Without Mortgage | With Mortgage |
| Less than $800 | 241 (55.5%) | 0 (0.0%) |
| $800 to $1,499 | 0 (0.0%) | 193 (16.5%) |
| $800 to $1,499 | 193 (44.5%) | 334 (28.5%) |
| Total | 434 (100.0%) | 1,172 (100.0%) |
Health & Disability in Temple
Health Insurance Coverage by Age in Temple
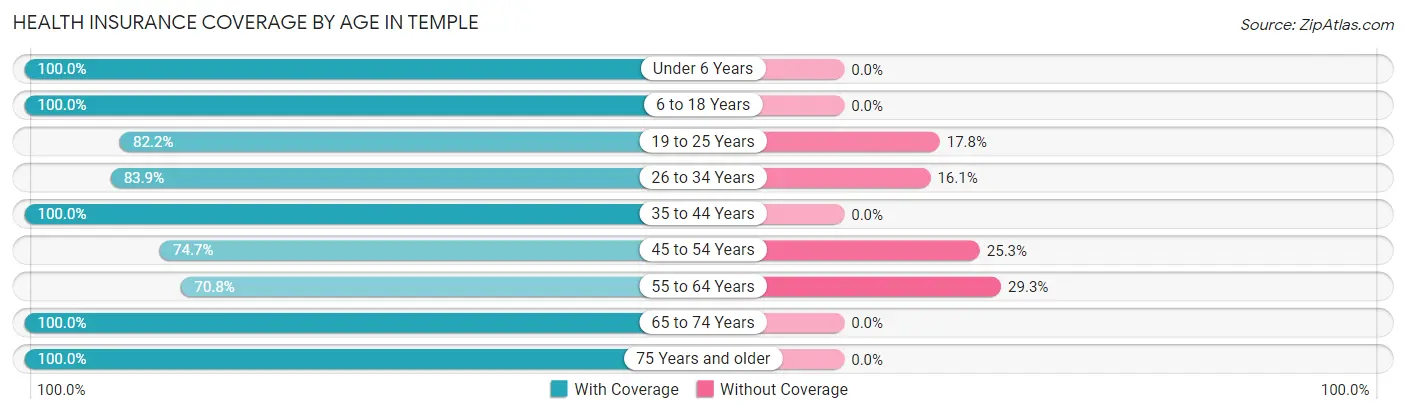
| Age Bracket | With Coverage | Without Coverage |
| Under 6 Years | 733 (100.0%) | 0 (0.0%) |
| 6 to 18 Years | 844 (100.0%) | 0 (0.0%) |
| 19 to 25 Years | 360 (82.2%) | 78 (17.8%) |
| 26 to 34 Years | 773 (83.9%) | 148 (16.1%) |
| 35 to 44 Years | 648 (100.0%) | 0 (0.0%) |
| 45 to 54 Years | 473 (74.7%) | 160 (25.3%) |
| 55 to 64 Years | 341 (70.8%) | 141 (29.2%) |
| 65 to 74 Years | 305 (100.0%) | 0 (0.0%) |
| 75 Years and older | 391 (100.0%) | 0 (0.0%) |
| Total | 4,868 (90.2%) | 527 (9.8%) |
Health Insurance Coverage by Citizenship Status in Temple
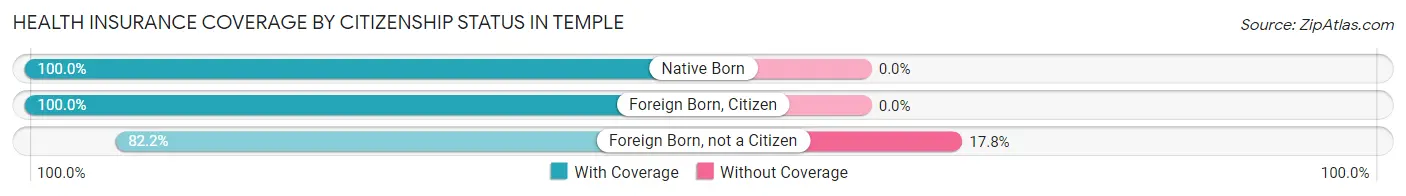
| Citizenship Status | With Coverage | Without Coverage |
| Native Born | 733 (100.0%) | 0 (0.0%) |
| Foreign Born, Citizen | 844 (100.0%) | 0 (0.0%) |
| Foreign Born, not a Citizen | 360 (82.2%) | 78 (17.8%) |
Health Insurance Coverage by Household Income in Temple
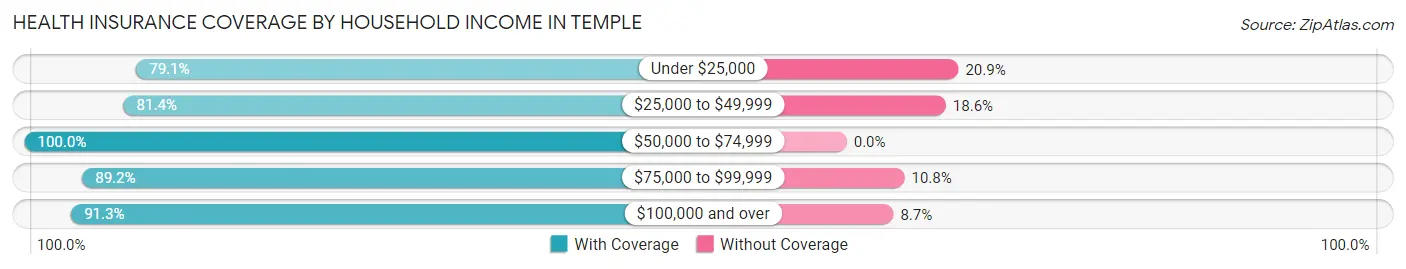
| Household Income | With Coverage | Without Coverage |
| Under $25,000 | 68 (79.1%) | 18 (20.9%) |
| $25,000 to $49,999 | 719 (81.4%) | 164 (18.6%) |
| $50,000 to $74,999 | 805 (100.0%) | 0 (0.0%) |
| $75,000 to $99,999 | 1,220 (89.2%) | 148 (10.8%) |
| $100,000 and over | 2,056 (91.3%) | 197 (8.7%) |
Public vs Private Health Insurance Coverage by Age in Temple
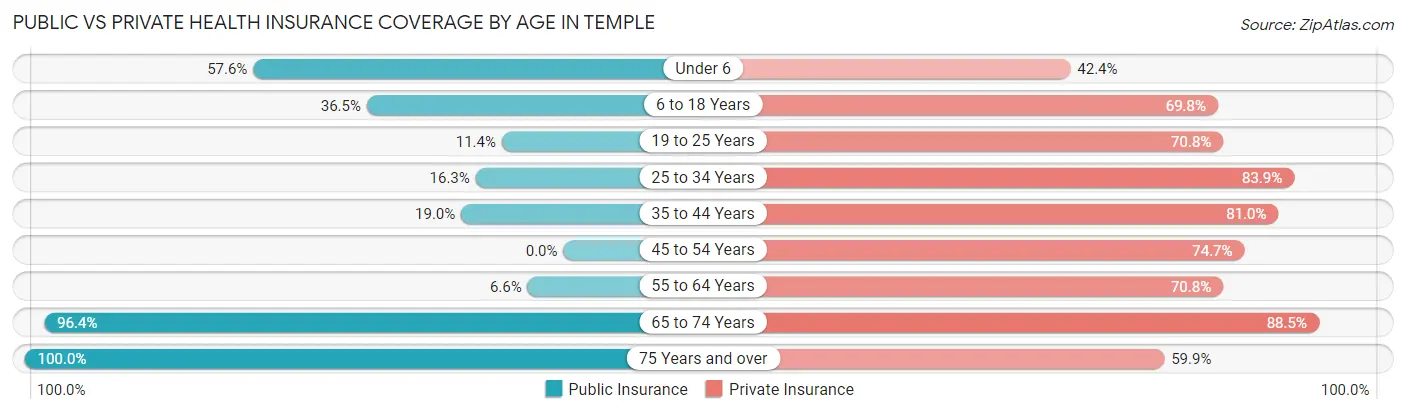
| Age Bracket | Public Insurance | Private Insurance |
| Under 6 | 422 (57.6%) | 311 (42.4%) |
| 6 to 18 Years | 308 (36.5%) | 589 (69.8%) |
| 19 to 25 Years | 50 (11.4%) | 310 (70.8%) |
| 25 to 34 Years | 150 (16.3%) | 773 (83.9%) |
| 35 to 44 Years | 123 (19.0%) | 525 (81.0%) |
| 45 to 54 Years | 0 (0.0%) | 473 (74.7%) |
| 55 to 64 Years | 32 (6.6%) | 341 (70.8%) |
| 65 to 74 Years | 294 (96.4%) | 270 (88.5%) |
| 75 Years and over | 391 (100.0%) | 234 (59.9%) |
| Total | 1,770 (32.8%) | 3,826 (70.9%) |
Disability Status by Sex by Age in Temple
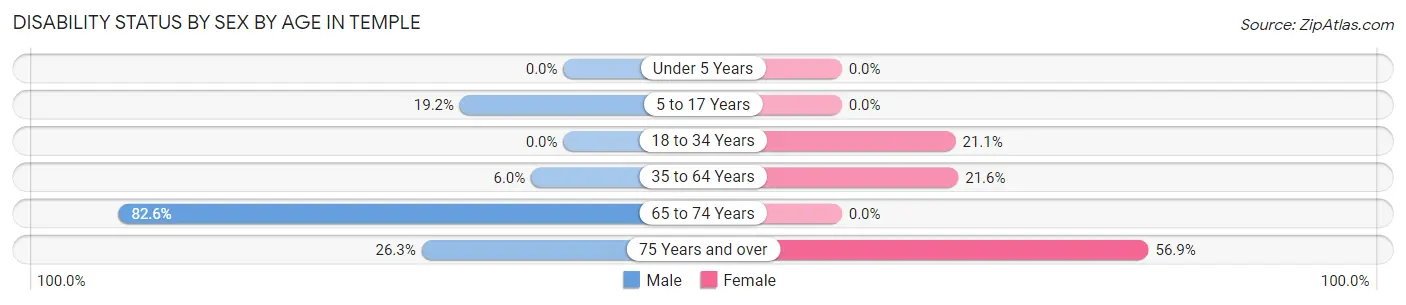
| Age Bracket | Male | Female |
| Under 5 Years | 0 (0.0%) | 0 (0.0%) |
| 5 to 17 Years | 156 (19.2%) | 0 (0.0%) |
| 18 to 34 Years | 0 (0.0%) | 178 (21.1%) |
| 35 to 64 Years | 59 (6.0%) | 168 (21.6%) |
| 65 to 74 Years | 90 (82.6%) | 0 (0.0%) |
| 75 Years and over | 65 (26.3%) | 82 (56.9%) |
Disability Class by Sex by Age in Temple
Disability Class: Hearing Difficulty
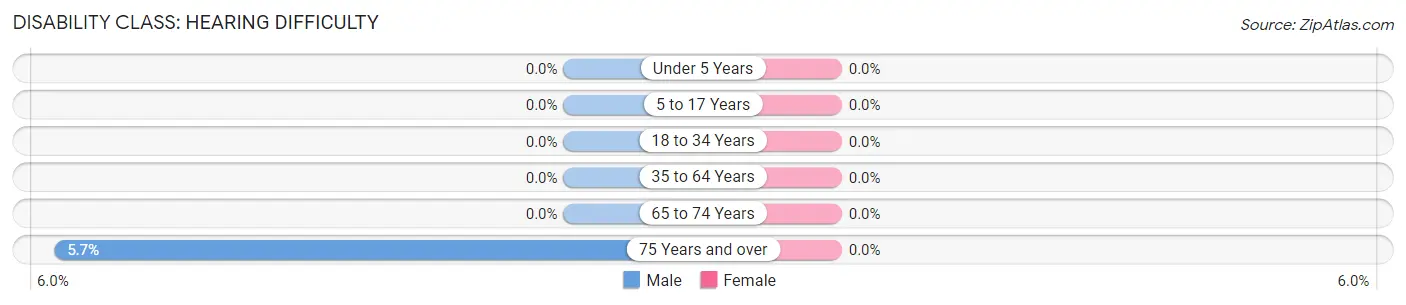
| Age Bracket | Male | Female |
| Under 5 Years | 0 (0.0%) | 0 (0.0%) |
| 5 to 17 Years | 0 (0.0%) | 0 (0.0%) |
| 18 to 34 Years | 0 (0.0%) | 0 (0.0%) |
| 35 to 64 Years | 0 (0.0%) | 0 (0.0%) |
| 65 to 74 Years | 0 (0.0%) | 0 (0.0%) |
| 75 Years and over | 14 (5.7%) | 0 (0.0%) |
Disability Class: Vision Difficulty
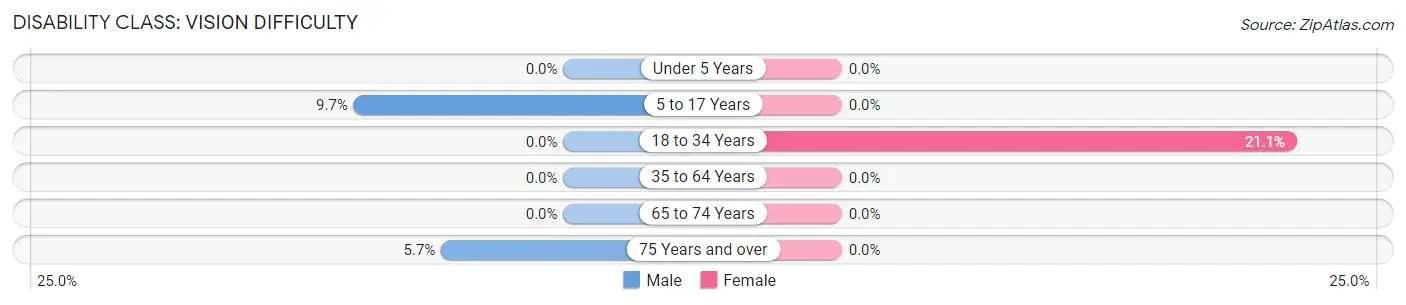
| Age Bracket | Male | Female |
| Under 5 Years | 0 (0.0%) | 0 (0.0%) |
| 5 to 17 Years | 79 (9.7%) | 0 (0.0%) |
| 18 to 34 Years | 0 (0.0%) | 178 (21.1%) |
| 35 to 64 Years | 0 (0.0%) | 0 (0.0%) |
| 65 to 74 Years | 0 (0.0%) | 0 (0.0%) |
| 75 Years and over | 14 (5.7%) | 0 (0.0%) |
Disability Class: Cognitive Difficulty
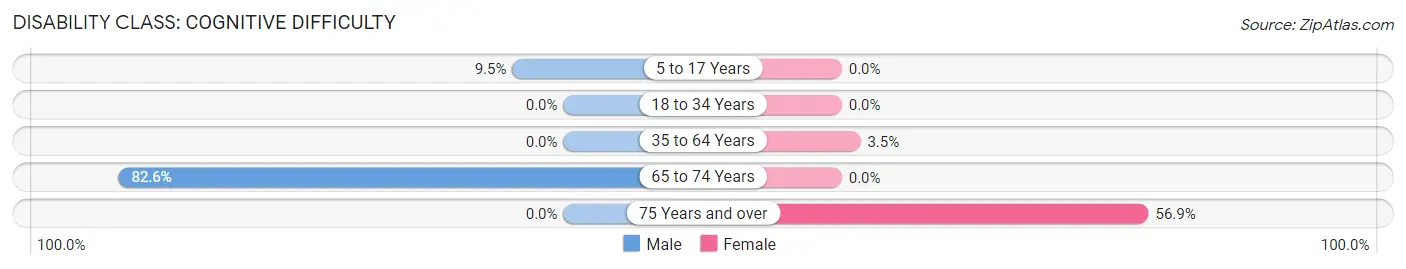
| Age Bracket | Male | Female |
| 5 to 17 Years | 77 (9.5%) | 0 (0.0%) |
| 18 to 34 Years | 0 (0.0%) | 0 (0.0%) |
| 35 to 64 Years | 0 (0.0%) | 27 (3.5%) |
| 65 to 74 Years | 90 (82.6%) | 0 (0.0%) |
| 75 Years and over | 0 (0.0%) | 82 (56.9%) |
Disability Class: Ambulatory Difficulty
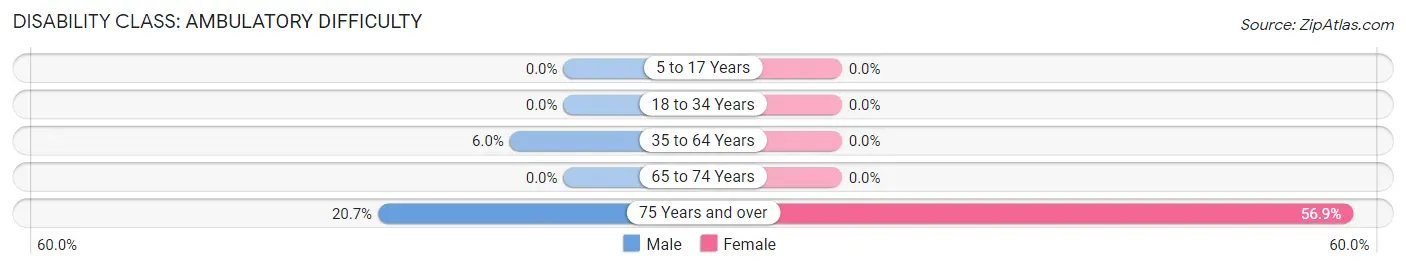
| Age Bracket | Male | Female |
| 5 to 17 Years | 0 (0.0%) | 0 (0.0%) |
| 18 to 34 Years | 0 (0.0%) | 0 (0.0%) |
| 35 to 64 Years | 59 (6.0%) | 0 (0.0%) |
| 65 to 74 Years | 0 (0.0%) | 0 (0.0%) |
| 75 Years and over | 51 (20.6%) | 82 (56.9%) |
Disability Class: Self-Care Difficulty
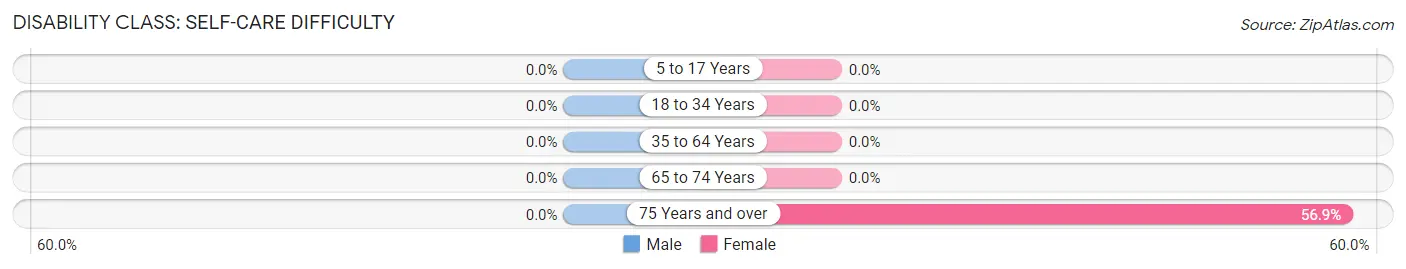
| Age Bracket | Male | Female |
| 5 to 17 Years | 0 (0.0%) | 0 (0.0%) |
| 18 to 34 Years | 0 (0.0%) | 0 (0.0%) |
| 35 to 64 Years | 0 (0.0%) | 0 (0.0%) |
| 65 to 74 Years | 0 (0.0%) | 0 (0.0%) |
| 75 Years and over | 0 (0.0%) | 82 (56.9%) |
Technology Access in Temple
Computing Device Access in Temple
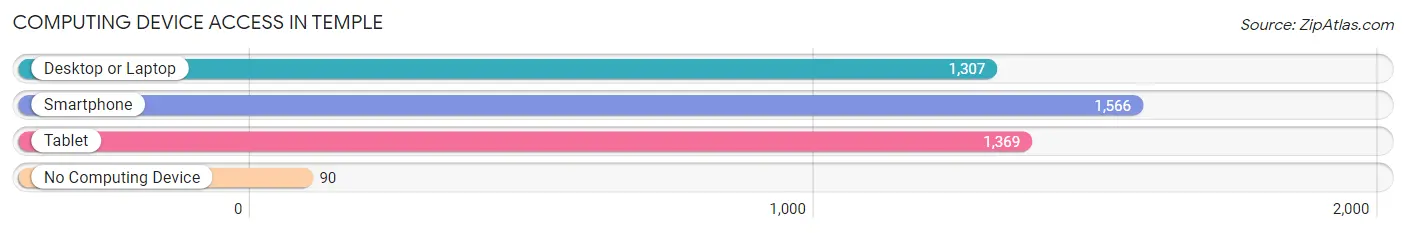
| Device Type | # Households | % Households |
| Desktop or Laptop | 1,307 | 71.5% |
| Smartphone | 1,566 | 85.6% |
| Tablet | 1,369 | 74.9% |
| No Computing Device | 90 | 4.9% |
| Total | 1,829 | 100.0% |
Internet Access in Temple
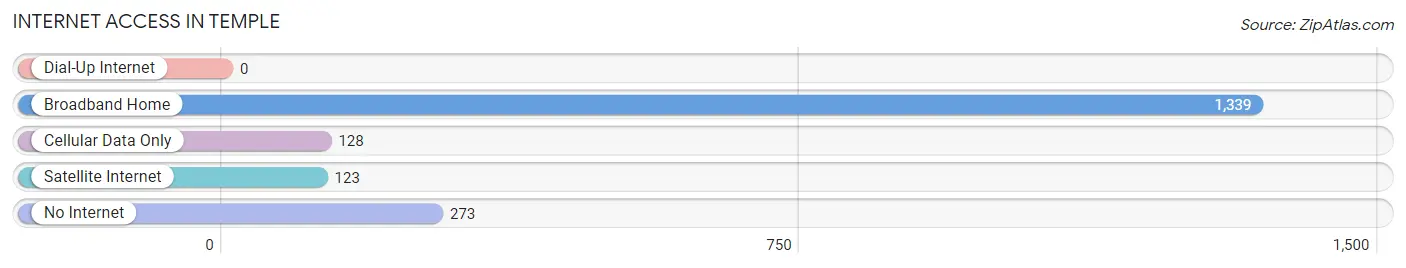
| Internet Type | # Households | % Households |
| Dial-Up Internet | 0 | 0.0% |
| Broadband Home | 1,339 | 73.2% |
| Cellular Data Only | 128 | 7.0% |
| Satellite Internet | 123 | 6.7% |
| No Internet | 273 | 14.9% |
| Total | 1,829 | 100.0% |
Temple Summary
Temple, Georgia is a small city located in Carroll County, Georgia, United States. It is situated about 45 miles west of Atlanta and is part of the Atlanta metropolitan area. The city has a population of approximately 4,000 people and is known for its rural charm and small-town atmosphere.
History
Temple was founded in 1845 by a group of settlers from South Carolina. The town was named after the Temple family, who were among the first settlers. The town was incorporated in 1891 and has remained a small, rural community ever since.
The town was an important stop on the Central of Georgia Railway, which ran through the town from 1845 to the late 1960s. The railway was a major factor in the growth of the town, as it allowed for the transportation of goods and people to and from the area.
Geography
Temple is located in the foothills of the Appalachian Mountains in northwest Georgia. The city is situated on the banks of the Chattahoochee River, which provides a scenic backdrop to the city. The city is surrounded by rolling hills and forests, making it a popular destination for outdoor activities such as hiking, camping, and fishing.
The climate in Temple is mild and humid, with hot summers and mild winters. The average temperature in the summer is around 80 degrees Fahrenheit, while the average temperature in the winter is around 50 degrees Fahrenheit.
Economy
The economy of Temple is largely based on agriculture and manufacturing. The city is home to several large poultry processing plants, as well as a number of smaller businesses. The city also has a thriving tourism industry, with many visitors coming to the area to enjoy the natural beauty and outdoor activities.
Demographics
As of the 2010 census, the population of Temple was 4,092. The racial makeup of the city was 79.3% White, 16.2% African American, 0.3% Native American, 0.7% Asian, 0.1% Pacific Islander, and 3.4% from other races. The median household income was $37,917, and the median family income was $45,938.
Conclusion
Temple, Georgia is a small city located in Carroll County, Georgia, United States. It is situated about 45 miles west of Atlanta and is part of the Atlanta metropolitan area. The city has a population of approximately 4,000 people and is known for its rural charm and small-town atmosphere. The economy of Temple is largely based on agriculture and manufacturing, and the city is home to several large poultry processing plants, as well as a number of smaller businesses. The city also has a thriving tourism industry, with many visitors coming to the area to enjoy the natural beauty and outdoor activities. The racial makeup of the city is 79.3% White, 16.2% African American, 0.3% Native American, 0.7% Asian, 0.1% Pacific Islander, and 3.4% from other races. The median household income was $37,917, and the median family income was $45,938.
Common Questions
What is Per Capita Income in Temple?
Per Capita income in Temple is $29,345.
What is the Median Family Income in Temple?
Median Family Income in Temple is $88,430.
What is the Median Household income in Temple?
Median Household Income in Temple is $71,917.
What is Income or Wage Gap in Temple?
Income or Wage Gap in Temple is 22.4%.
Women in Temple earn 77.6 cents for every dollar earned by a man.
What is Inequality or Gini Index in Temple?
Inequality or Gini Index in Temple is 0.32.
What is the Total Population of Temple?
Total Population of Temple is 5,395.
What is the Total Male Population of Temple?
Total Male Population of Temple is 2,792.
What is the Total Female Population of Temple?
Total Female Population of Temple is 2,603.
What is the Ratio of Males per 100 Females in Temple?
There are 107.26 Males per 100 Females in Temple.
What is the Ratio of Females per 100 Males in Temple?
There are 93.23 Females per 100 Males in Temple.
What is the Median Population Age in Temple?
Median Population Age in Temple is 31.8 Years.
What is the Average Family Size in Temple
Average Family Size in Temple is 3.3 People.
What is the Average Household Size in Temple
Average Household Size in Temple is 3.0 People.
How Large is the Labor Force in Temple?
There are 2,653 People in the Labor Forcein in Temple.
What is the Percentage of People in the Labor Force in Temple?
66.5% of People are in the Labor Force in Temple.