Dallas, GA Map & Demographics
Dallas Map
Dallas Overview
$26,171
PER CAPITA INCOME
$71,813
AVG FAMILY INCOME
$60,032
AVG HOUSEHOLD INCOME
16.6%
WAGE / INCOME GAP [ % ]
83.4¢/ $1
WAGE / INCOME GAP [ $ ]
0.38
INEQUALITY / GINI INDEX
14,126
TOTAL POPULATION
6,660
MALE POPULATION
7,466
FEMALE POPULATION
89.20
MALES / 100 FEMALES
112.10
FEMALES / 100 MALES
33.7
MEDIAN AGE
3.3
AVG FAMILY SIZE
2.5
AVG HOUSEHOLD SIZE
6,868
LABOR FORCE [ PEOPLE ]
63.0%
PERCENT IN LABOR FORCE
5.1%
UNEMPLOYMENT RATE
Income in Dallas
Income Overview in Dallas
Per Capita Income in Dallas is $26,171, while median incomes of families and households are $71,813 and $60,032 respectively.
| Characteristic | Number | Measure |
| Per Capita Income | 14,126 | $26,171 |
| Median Family Income | 3,374 | $71,813 |
| Mean Family Income | 3,374 | $71,487 |
| Median Household Income | 5,453 | $60,032 |
| Mean Household Income | 5,453 | $63,518 |
| Income Deficit | 3,374 | $0 |
| Wage / Income Gap (%) | 14,126 | 16.59% |
| Wage / Income Gap ($) | 14,126 | 83.41¢ per $1 |
| Gini / Inequality Index | 14,126 | 0.38 |
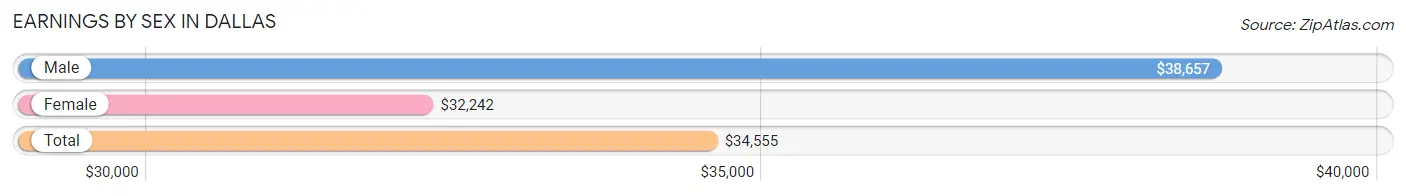
Earnings by Sex in Dallas
Average Earnings in Dallas are $34,555, $38,657 for men and $32,242 for women, a difference of 16.6%.
| Sex | Number | Average Earnings |
| Male | 3,955 (53.9%) | $38,657 |
| Female | 3,381 (46.1%) | $32,242 |
| Total | 7,336 (100.0%) | $34,555 |
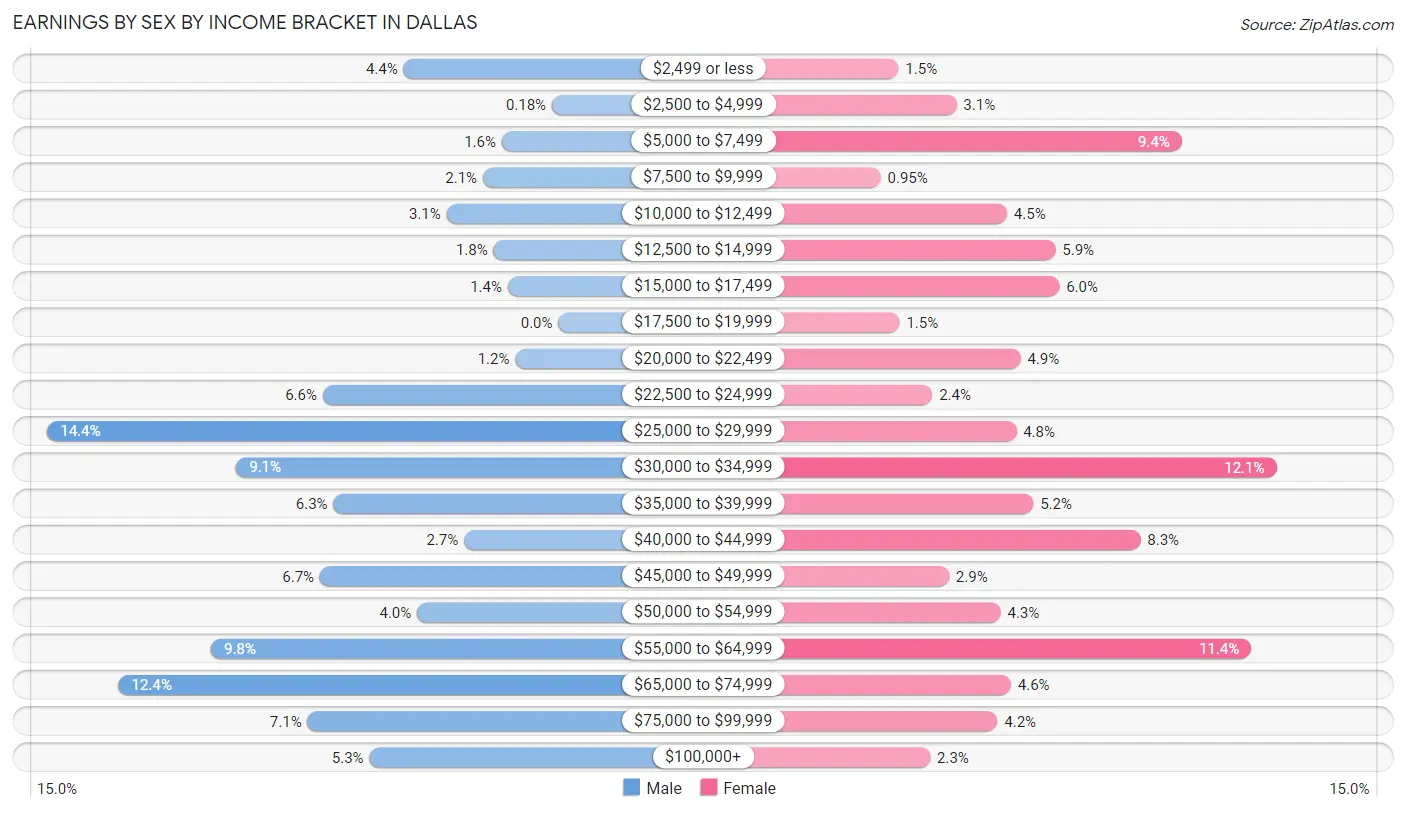
Earnings by Sex by Income Bracket in Dallas
The most common earnings brackets in Dallas are $25,000 to $29,999 for men (568 | 14.4%) and $30,000 to $34,999 for women (408 | 12.1%).
| Income | Male | Female |
| $2,499 or less | 172 (4.3%) | 49 (1.5%) |
| $2,500 to $4,999 | 7 (0.2%) | 104 (3.1%) |
| $5,000 to $7,499 | 63 (1.6%) | 318 (9.4%) |
| $7,500 to $9,999 | 84 (2.1%) | 32 (0.9%) |
| $10,000 to $12,499 | 124 (3.1%) | 152 (4.5%) |
| $12,500 to $14,999 | 72 (1.8%) | 198 (5.9%) |
| $15,000 to $17,499 | 56 (1.4%) | 202 (6.0%) |
| $17,500 to $19,999 | 0 (0.0%) | 50 (1.5%) |
| $20,000 to $22,499 | 48 (1.2%) | 165 (4.9%) |
| $22,500 to $24,999 | 262 (6.6%) | 81 (2.4%) |
| $25,000 to $29,999 | 568 (14.4%) | 161 (4.8%) |
| $30,000 to $34,999 | 358 (9.0%) | 408 (12.1%) |
| $35,000 to $39,999 | 250 (6.3%) | 177 (5.2%) |
| $40,000 to $44,999 | 105 (2.6%) | 279 (8.3%) |
| $45,000 to $49,999 | 265 (6.7%) | 97 (2.9%) |
| $50,000 to $54,999 | 157 (4.0%) | 146 (4.3%) |
| $55,000 to $64,999 | 386 (9.8%) | 384 (11.4%) |
| $65,000 to $74,999 | 489 (12.4%) | 156 (4.6%) |
| $75,000 to $99,999 | 279 (7.0%) | 143 (4.2%) |
| $100,000+ | 210 (5.3%) | 79 (2.3%) |
| Total | 3,955 (100.0%) | 3,381 (100.0%) |
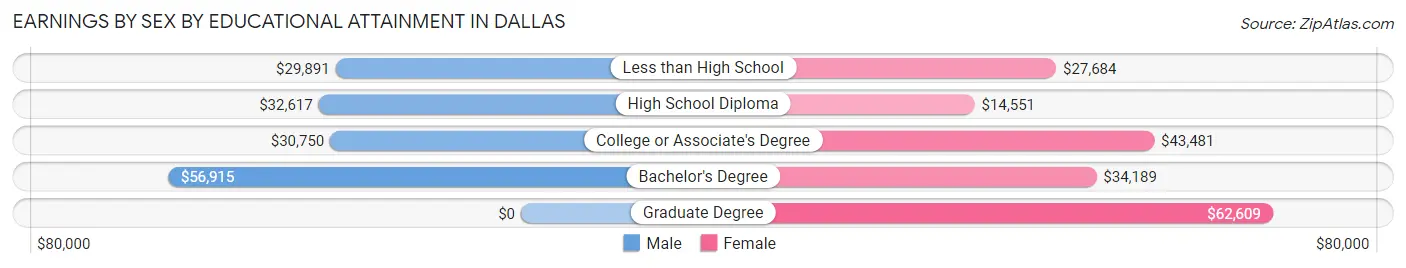
Earnings by Sex by Educational Attainment in Dallas
Average earnings in Dallas are $39,561 for men and $37,083 for women, a difference of 6.3%. Men with an educational attainment of bachelor's degree enjoy the highest average annual earnings of $56,915, while those with less than high school education earn the least with $29,891. Women with an educational attainment of graduate degree earn the most with the average annual earnings of $62,609, while those with high school diploma education have the smallest earnings of $14,551.
| Educational Attainment | Male Income | Female Income |
| Less than High School | $29,891 | $27,684 |
| High School Diploma | $32,617 | $14,551 |
| College or Associate's Degree | $30,750 | $43,481 |
| Bachelor's Degree | $56,915 | $34,189 |
| Graduate Degree | - | - |
| Total | $39,561 | $37,083 |
Family Income in Dallas
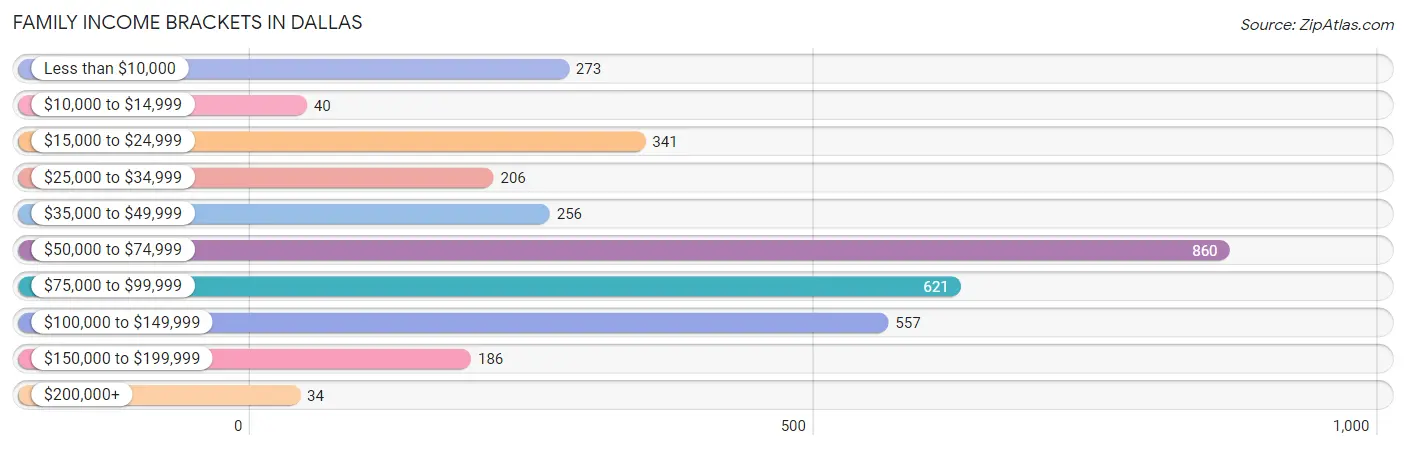
Family Income Brackets in Dallas
According to the Dallas family income data, there are 860 families falling into the $50,000 to $74,999 income range, which is the most common income bracket and makes up 25.5% of all families. Conversely, the $200,000+ income bracket is the least frequent group with only 34 families (1.0%) belonging to this category.
| Income Bracket | # Families | % Families |
| Less than $10,000 | 273 | 8.1% |
| $10,000 to $14,999 | 40 | 1.2% |
| $15,000 to $24,999 | 341 | 10.1% |
| $25,000 to $34,999 | 206 | 6.1% |
| $35,000 to $49,999 | 256 | 7.6% |
| $50,000 to $74,999 | 860 | 25.5% |
| $75,000 to $99,999 | 621 | 18.4% |
| $100,000 to $149,999 | 557 | 16.5% |
| $150,000 to $199,999 | 186 | 5.5% |
| $200,000+ | 34 | 1.0% |
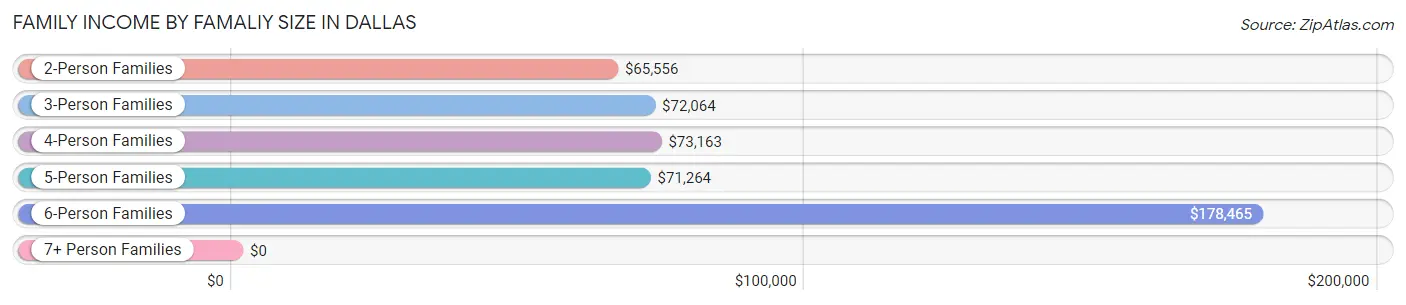
Family Income by Famaliy Size in Dallas
6-person families (97 | 2.9%) account for the highest median family income in Dallas with $178,465 per family, while 2-person families (1,208 | 35.8%) have the highest median income of $32,778 per family member.
| Income Bracket | # Families | Median Income |
| 2-Person Families | 1,208 (35.8%) | $65,556 |
| 3-Person Families | 868 (25.7%) | $72,064 |
| 4-Person Families | 923 (27.4%) | $73,163 |
| 5-Person Families | 214 (6.3%) | $71,264 |
| 6-Person Families | 97 (2.9%) | $178,465 |
| 7+ Person Families | 64 (1.9%) | $0 |
| Total | 3,374 (100.0%) | $71,813 |
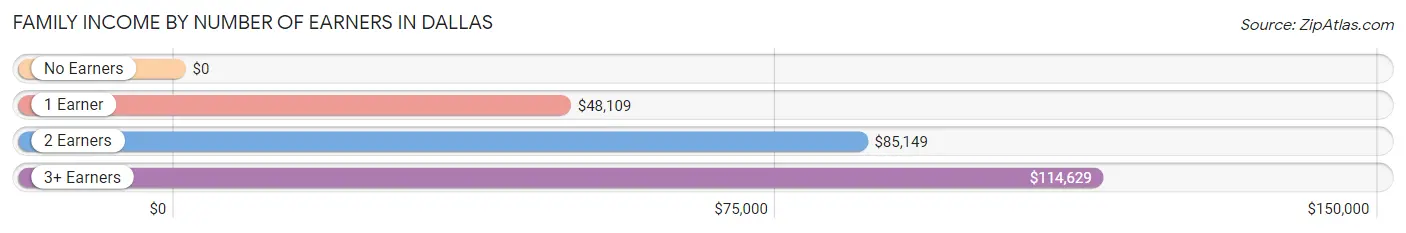
Family Income by Number of Earners in Dallas
| Number of Earners | # Families | Median Income |
| No Earners | 457 (13.5%) | $0 |
| 1 Earner | 1,205 (35.7%) | $48,109 |
| 2 Earners | 1,275 (37.8%) | $85,149 |
| 3+ Earners | 437 (13.0%) | $114,629 |
| Total | 3,374 (100.0%) | $71,813 |
Household Income in Dallas
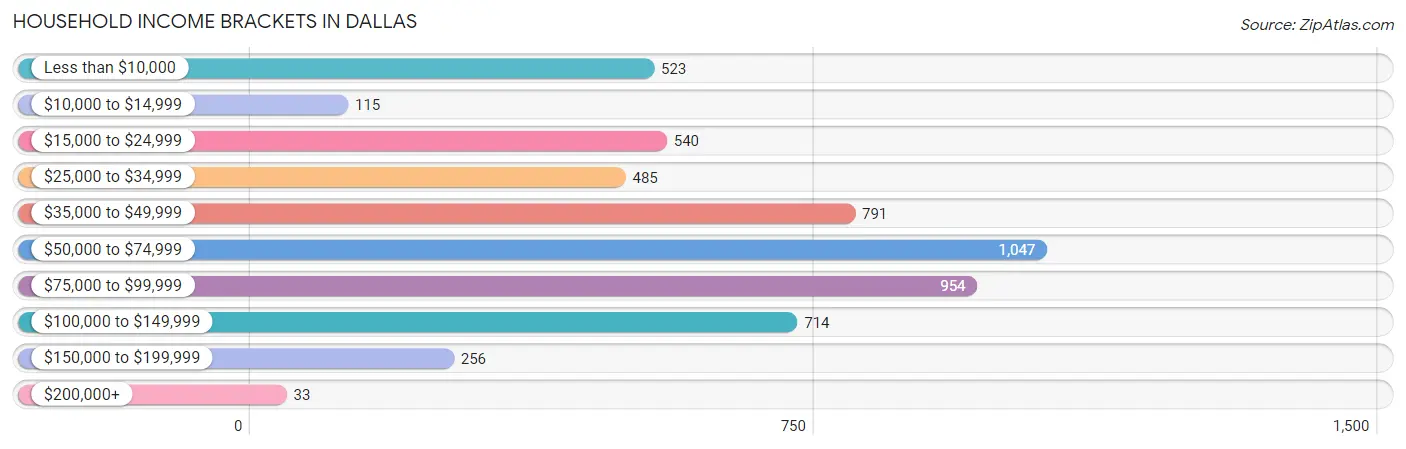
Household Income Brackets in Dallas
With 1,047 households falling in the category, the $50,000 to $74,999 income range is the most frequent in Dallas, accounting for 19.2% of all households. In contrast, only 33 households (0.6%) fall into the $200,000+ income bracket, making it the least populous group.
| Income Bracket | # Households | % Households |
| Less than $10,000 | 523 | 9.6% |
| $10,000 to $14,999 | 115 | 2.1% |
| $15,000 to $24,999 | 540 | 9.9% |
| $25,000 to $34,999 | 485 | 8.9% |
| $35,000 to $49,999 | 791 | 14.5% |
| $50,000 to $74,999 | 1,047 | 19.2% |
| $75,000 to $99,999 | 954 | 17.5% |
| $100,000 to $149,999 | 714 | 13.1% |
| $150,000 to $199,999 | 256 | 4.7% |
| $200,000+ | 33 | 0.6% |
Household Income by Householder Age in Dallas
The median household income in Dallas is $60,032, with the highest median household income of $71,913 found in the 25 to 44 years age bracket for the primary householder. A total of 2,068 households (37.9%) fall into this category. Meanwhile, the 15 to 24 years age bracket for the primary householder has the lowest median household income of $34,321, with 528 households (9.7%) in this group.
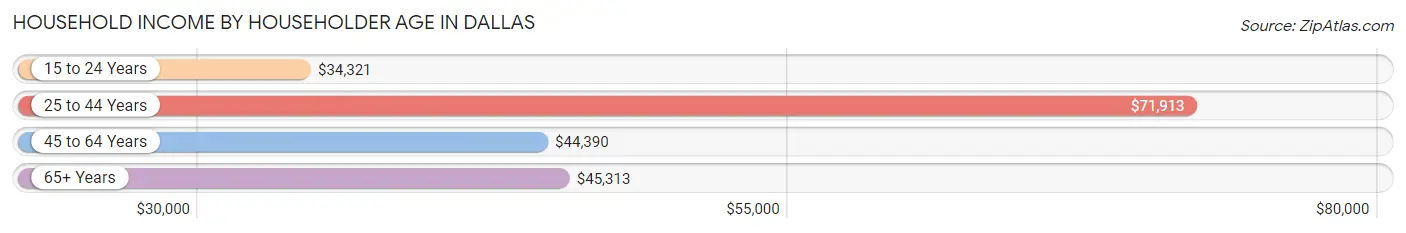
| Income Bracket | # Households | Median Income |
| 15 to 24 Years | 528 (9.7%) | $34,321 |
| 25 to 44 Years | 2,068 (37.9%) | $71,913 |
| 45 to 64 Years | 1,938 (35.5%) | $44,390 |
| 65+ Years | 919 (16.9%) | $45,313 |
| Total | 5,453 (100.0%) | $60,032 |
Poverty in Dallas
Income Below Poverty by Sex and Age in Dallas
With 18.3% poverty level for males and 17.4% for females among the residents of Dallas, 5 year old males and 18 to 24 year old females are the most vulnerable to poverty, with 51 males (57.3%) and 253 females (32.9%) in their respective age groups living below the poverty level.
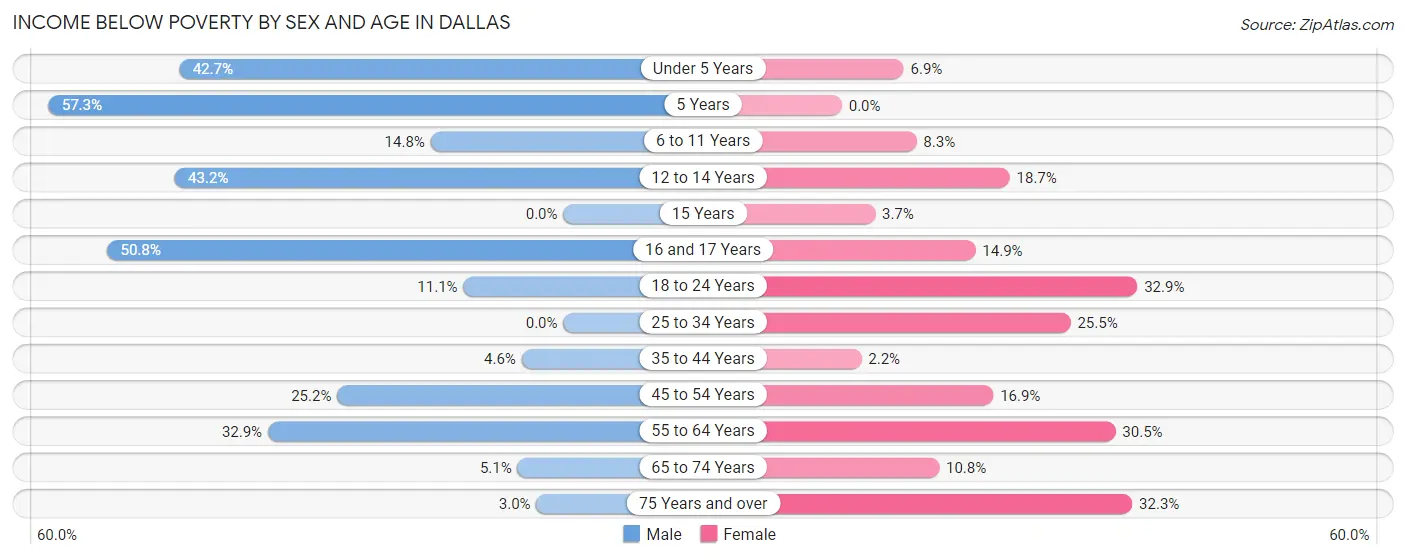
| Age Bracket | Male | Female |
| Under 5 Years | 273 (42.7%) | 48 (6.9%) |
| 5 Years | 51 (57.3%) | 0 (0.0%) |
| 6 to 11 Years | 51 (14.8%) | 37 (8.3%) |
| 12 to 14 Years | 163 (43.2%) | 77 (18.7%) |
| 15 Years | 0 (0.0%) | 3 (3.7%) |
| 16 and 17 Years | 67 (50.8%) | 36 (14.9%) |
| 18 to 24 Years | 72 (11.1%) | 253 (32.9%) |
| 25 to 34 Years | 0 (0.0%) | 287 (25.5%) |
| 35 to 44 Years | 46 (4.6%) | 22 (2.2%) |
| 45 to 54 Years | 244 (25.2%) | 162 (16.9%) |
| 55 to 64 Years | 226 (32.9%) | 142 (30.5%) |
| 65 to 74 Years | 10 (5.1%) | 56 (10.8%) |
| 75 Years and over | 10 (3.0%) | 152 (32.3%) |
| Total | 1,213 (18.3%) | 1,275 (17.4%) |
Income Above Poverty by Sex and Age in Dallas
According to the poverty statistics in Dallas, males aged 15 years and females aged 5 years are the age groups that are most secure financially, with 100.0% of males and 100.0% of females in these age groups living above the poverty line.
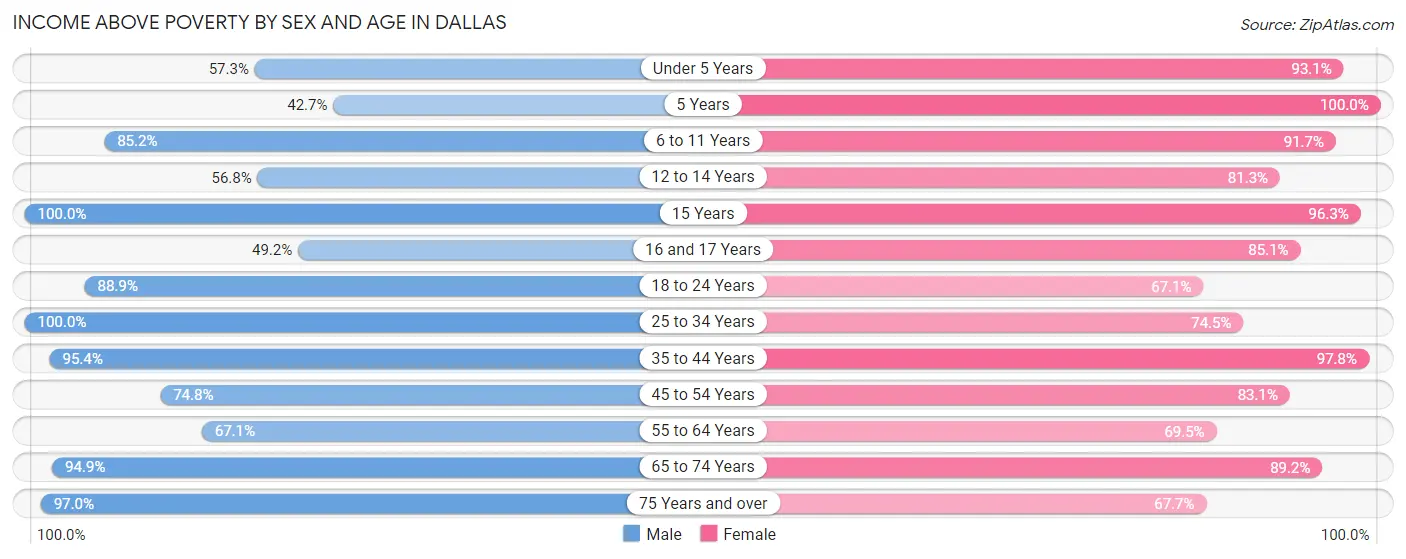
| Age Bracket | Male | Female |
| Under 5 Years | 366 (57.3%) | 650 (93.1%) |
| 5 Years | 38 (42.7%) | 112 (100.0%) |
| 6 to 11 Years | 294 (85.2%) | 408 (91.7%) |
| 12 to 14 Years | 214 (56.8%) | 335 (81.3%) |
| 15 Years | 27 (100.0%) | 78 (96.3%) |
| 16 and 17 Years | 65 (49.2%) | 206 (85.1%) |
| 18 to 24 Years | 575 (88.9%) | 516 (67.1%) |
| 25 to 34 Years | 1,199 (100.0%) | 840 (74.5%) |
| 35 to 44 Years | 945 (95.4%) | 988 (97.8%) |
| 45 to 54 Years | 725 (74.8%) | 799 (83.1%) |
| 55 to 64 Years | 461 (67.1%) | 324 (69.5%) |
| 65 to 74 Years | 186 (94.9%) | 461 (89.2%) |
| 75 Years and over | 323 (97.0%) | 318 (67.7%) |
| Total | 5,418 (81.7%) | 6,035 (82.6%) |
Income Below Poverty Among Married-Couple Families in Dallas
The poverty statistics for married-couple families in Dallas show that 9.5% or 218 of the total 2,285 families live below the poverty line. Families with 1 or 2 children have the highest poverty rate of 12.8%, comprising of 139 families. On the other hand, families with 3 or 4 children have the lowest poverty rate of 0.0%, which includes 0 families.
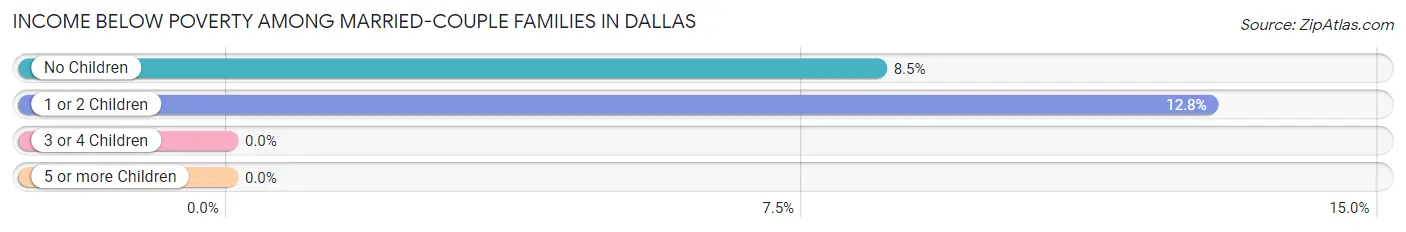
| Children | Above Poverty | Below Poverty |
| No Children | 854 (91.5%) | 79 (8.5%) |
| 1 or 2 Children | 947 (87.2%) | 139 (12.8%) |
| 3 or 4 Children | 266 (100.0%) | 0 (0.0%) |
| 5 or more Children | 0 (0.0%) | 0 (0.0%) |
| Total | 2,067 (90.5%) | 218 (9.5%) |
Income Below Poverty Among Single-Parent Households in Dallas
According to the poverty data in Dallas, 9.5% or 21 single-father households and 42.7% or 371 single-mother households are living below the poverty line. Among single-father households, those with 3 or 4 children have the highest poverty rate, with 3 households (100.0%) experiencing poverty. Likewise, among single-mother households, those with 3 or 4 children have the highest poverty rate, with 72 households (100.0%) falling below the poverty line.
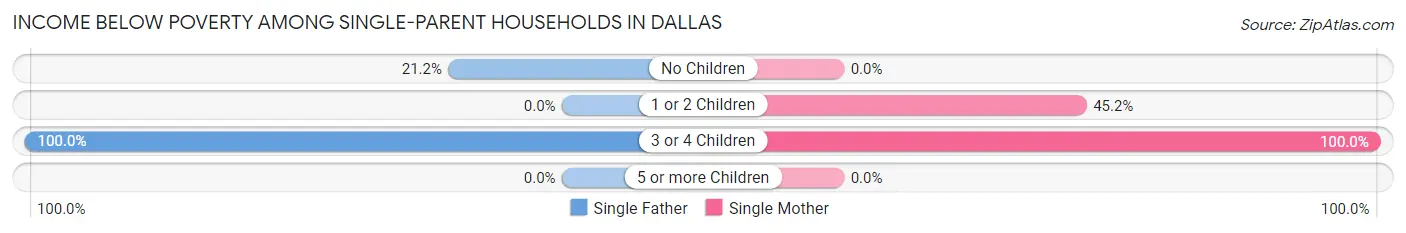
| Children | Single Father | Single Mother |
| No Children | 18 (21.2%) | 0 (0.0%) |
| 1 or 2 Children | 0 (0.0%) | 299 (45.2%) |
| 3 or 4 Children | 3 (100.0%) | 72 (100.0%) |
| 5 or more Children | 0 (0.0%) | 0 (0.0%) |
| Total | 21 (9.5%) | 371 (42.7%) |
Income Below Poverty Among Married-Couple vs Single-Parent Households in Dallas
The poverty data for Dallas shows that 218 of the married-couple family households (9.5%) and 392 of the single-parent households (36.0%) are living below the poverty level. Within the married-couple family households, those with 1 or 2 children have the highest poverty rate, with 139 households (12.8%) falling below the poverty line. Among the single-parent households, those with 3 or 4 children have the highest poverty rate, with 75 household (100.0%) living below poverty.
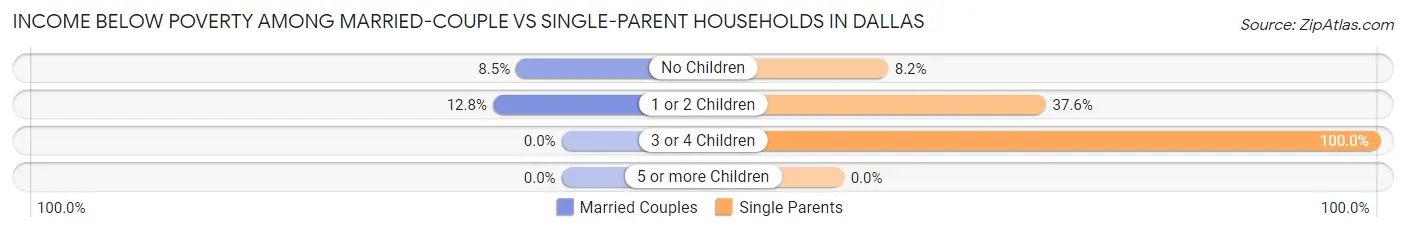
| Children | Married-Couple Families | Single-Parent Households |
| No Children | 79 (8.5%) | 18 (8.2%) |
| 1 or 2 Children | 139 (12.8%) | 299 (37.6%) |
| 3 or 4 Children | 0 (0.0%) | 75 (100.0%) |
| 5 or more Children | 0 (0.0%) | 0 (0.0%) |
| Total | 218 (9.5%) | 392 (36.0%) |
Race in Dallas
The most populous races in Dallas are White / Caucasian (7,756 | 54.9%), Black / African American (4,469 | 31.6%), and Hispanic or Latino (1,331 | 9.4%).
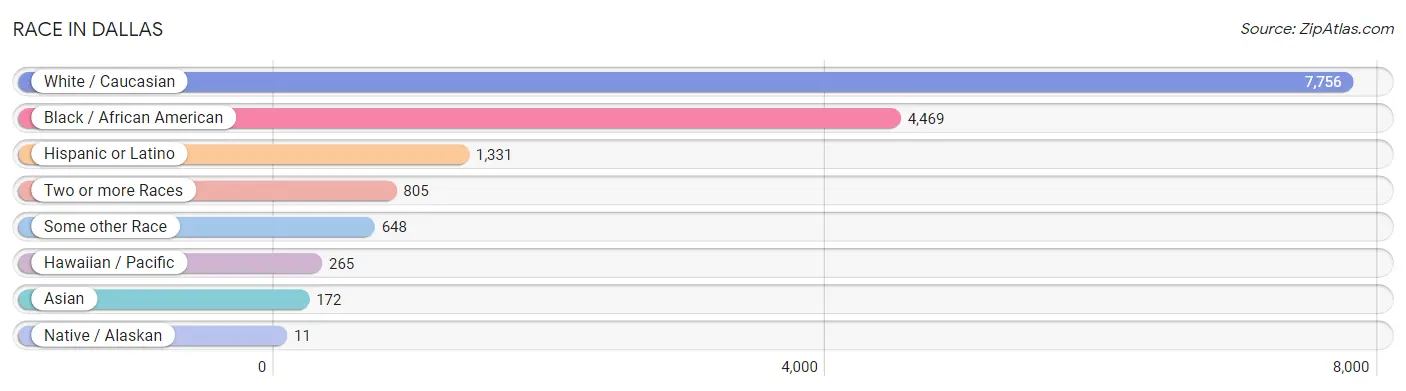
| Race | # Population | % Population |
| Asian | 172 | 1.2% |
| Black / African American | 4,469 | 31.6% |
| Hawaiian / Pacific | 265 | 1.9% |
| Hispanic or Latino | 1,331 | 9.4% |
| Native / Alaskan | 11 | 0.1% |
| White / Caucasian | 7,756 | 54.9% |
| Two or more Races | 805 | 5.7% |
| Some other Race | 648 | 4.6% |
| Total | 14,126 | 100.0% |
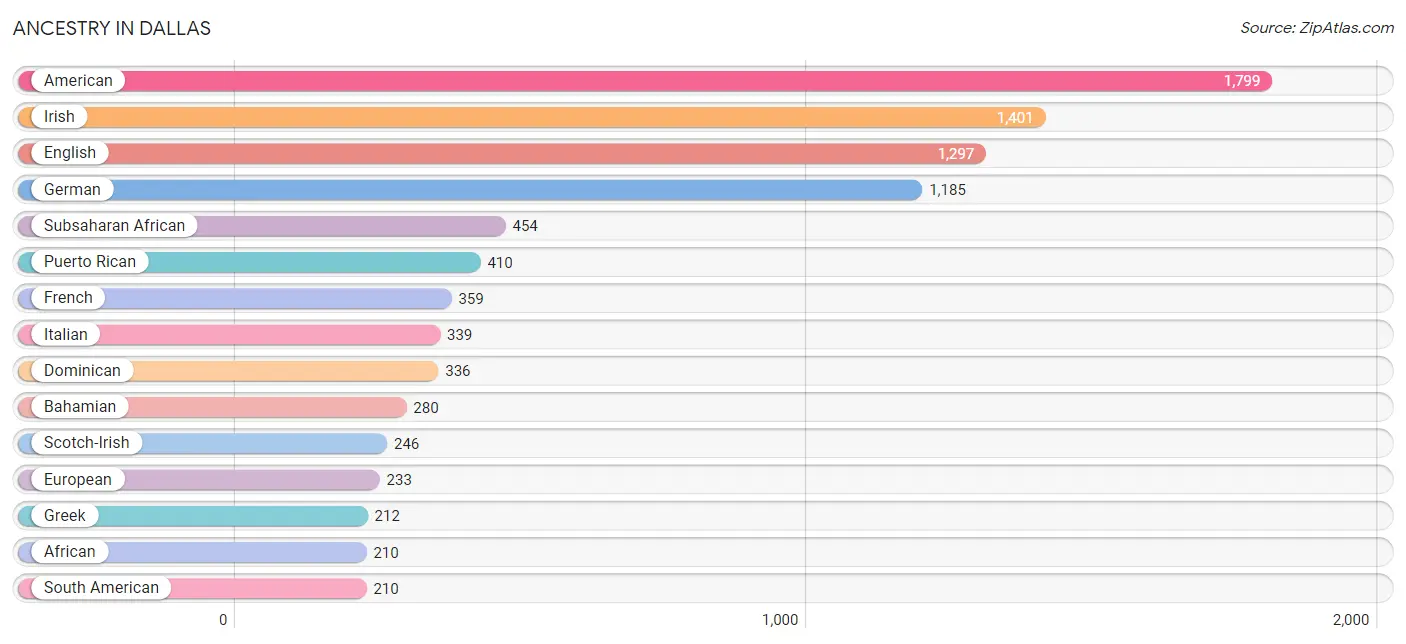
Ancestry in Dallas
The most populous ancestries reported in Dallas are American (1,799 | 12.7%), Irish (1,401 | 9.9%), English (1,297 | 9.2%), German (1,185 | 8.4%), and Subsaharan African (454 | 3.2%), together accounting for 43.4% of all Dallas residents.
| Ancestry | # Population | % Population |
| African | 210 | 1.5% |
| American | 1,799 | 12.7% |
| Arab | 21 | 0.2% |
| Bahamian | 280 | 2.0% |
| Bhutanese | 49 | 0.4% |
| British | 18 | 0.1% |
| Burmese | 15 | 0.1% |
| Central American | 197 | 1.4% |
| Cherokee | 19 | 0.1% |
| Costa Rican | 197 | 1.4% |
| Czechoslovakian | 33 | 0.2% |
| Dominican | 336 | 2.4% |
| Dutch | 24 | 0.2% |
| English | 1,297 | 9.2% |
| European | 233 | 1.7% |
| French | 359 | 2.5% |
| French Canadian | 48 | 0.3% |
| German | 1,185 | 8.4% |
| Greek | 212 | 1.5% |
| Haitian | 84 | 0.6% |
| Irish | 1,401 | 9.9% |
| Italian | 339 | 2.4% |
| Korean | 123 | 0.9% |
| Lebanese | 21 | 0.2% |
| Liberian | 81 | 0.6% |
| Mexican | 178 | 1.3% |
| Nigerian | 130 | 0.9% |
| Norwegian | 21 | 0.2% |
| Peruvian | 187 | 1.3% |
| Polish | 13 | 0.1% |
| Puerto Rican | 410 | 2.9% |
| Scotch-Irish | 246 | 1.7% |
| Scottish | 157 | 1.1% |
| Slovak | 18 | 0.1% |
| South American | 210 | 1.5% |
| Subsaharan African | 454 | 3.2% |
| Trinidadian and Tobagonian | 84 | 0.6% |
| U.S. Virgin Islander | 16 | 0.1% |
| Uruguayan | 23 | 0.2% |
| Yugoslavian | 25 | 0.2% | View All 40 Rows |
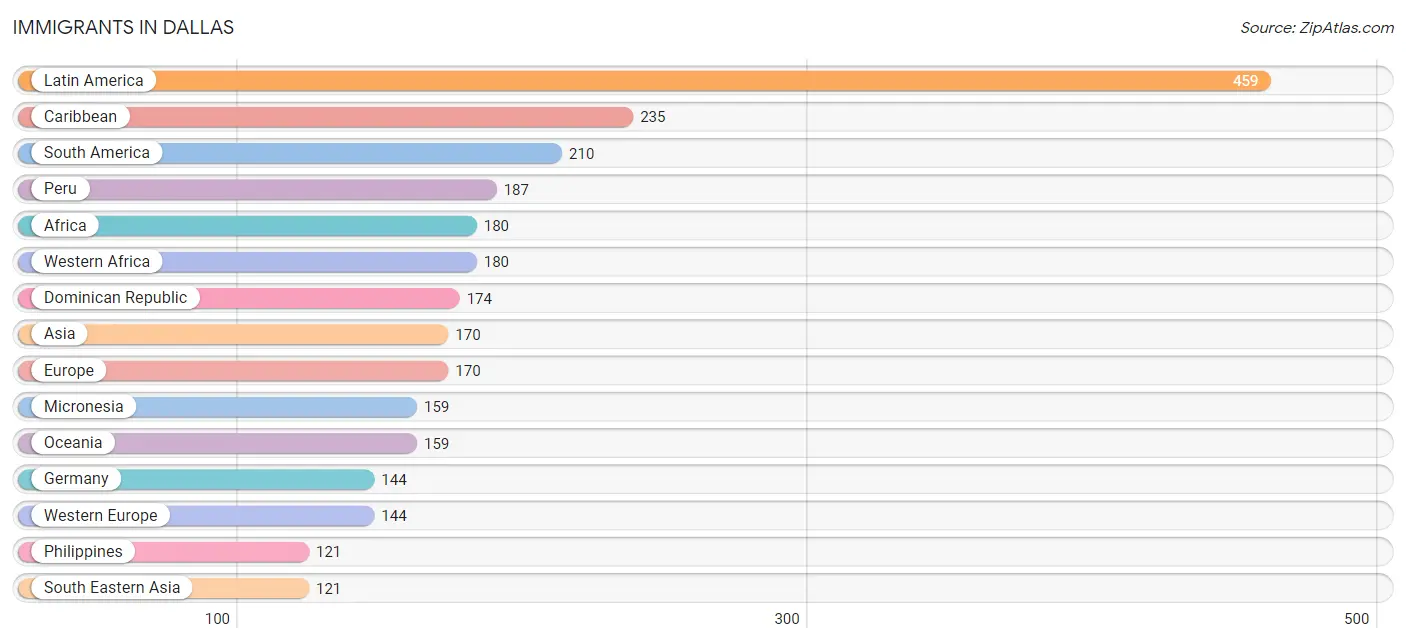
Immigrants in Dallas
The most numerous immigrant groups reported in Dallas came from Latin America (459 | 3.3%), Caribbean (235 | 1.7%), South America (210 | 1.5%), Peru (187 | 1.3%), and Africa (180 | 1.3%), together accounting for 9.0% of all Dallas residents.
| Immigration Origin | # Population | % Population |
| Africa | 180 | 1.3% |
| Asia | 170 | 1.2% |
| Canada | 21 | 0.2% |
| Caribbean | 235 | 1.7% |
| Central America | 14 | 0.1% |
| Costa Rica | 14 | 0.1% |
| Dominican Republic | 174 | 1.2% |
| Eastern Asia | 49 | 0.4% |
| Europe | 170 | 1.2% |
| Germany | 144 | 1.0% |
| Haiti | 16 | 0.1% |
| Italy | 26 | 0.2% |
| Japan | 49 | 0.4% |
| Latin America | 459 | 3.3% |
| Liberia | 71 | 0.5% |
| Micronesia | 159 | 1.1% |
| Nigeria | 109 | 0.8% |
| Oceania | 159 | 1.1% |
| Peru | 187 | 1.3% |
| Philippines | 121 | 0.9% |
| South America | 210 | 1.5% |
| South Eastern Asia | 121 | 0.9% |
| Southern Europe | 26 | 0.2% |
| Trinidad and Tobago | 45 | 0.3% |
| Uruguay | 23 | 0.2% |
| Western Africa | 180 | 1.3% |
| Western Europe | 144 | 1.0% | View All 27 Rows |
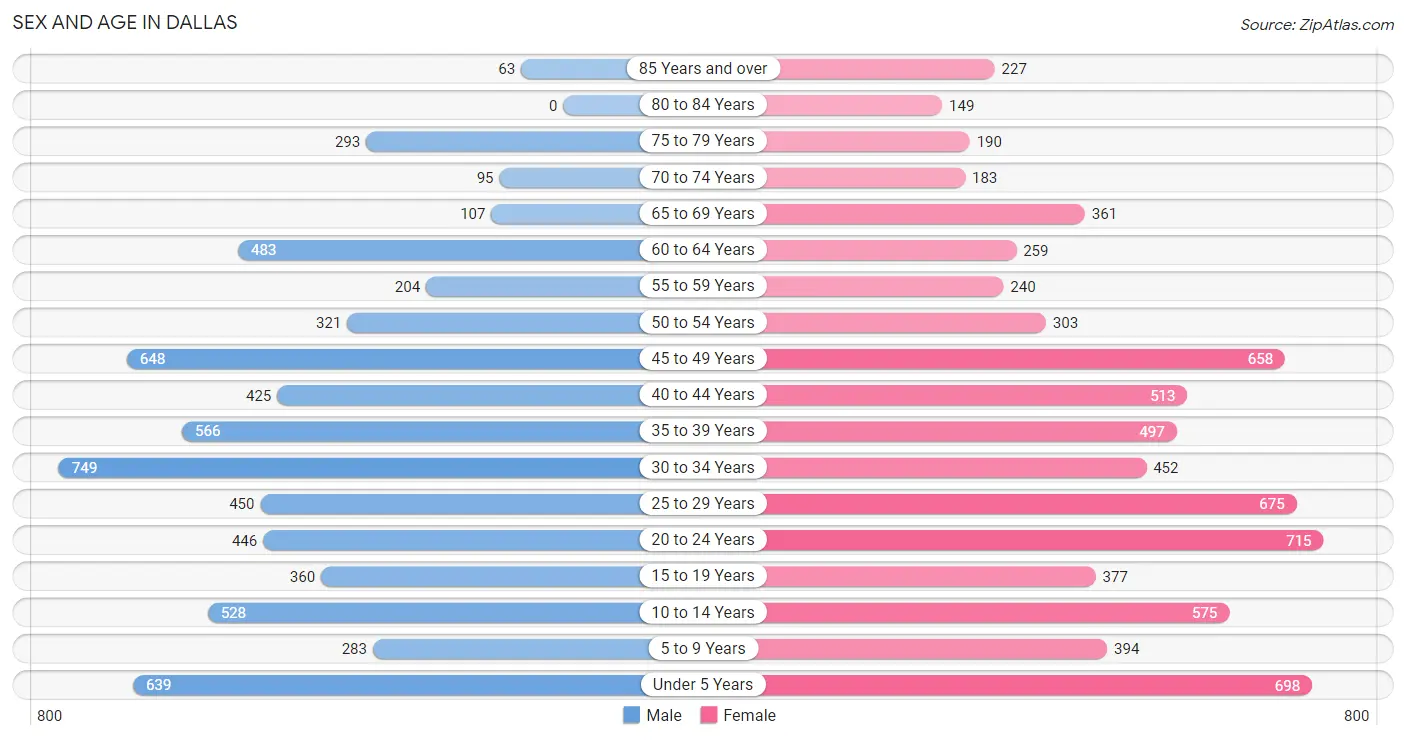
Sex and Age in Dallas
Sex and Age in Dallas
The most populous age groups in Dallas are 30 to 34 Years (749 | 11.3%) for men and 20 to 24 Years (715 | 9.6%) for women.
| Age Bracket | Male | Female |
| Under 5 Years | 639 (9.6%) | 698 (9.3%) |
| 5 to 9 Years | 283 (4.3%) | 394 (5.3%) |
| 10 to 14 Years | 528 (7.9%) | 575 (7.7%) |
| 15 to 19 Years | 360 (5.4%) | 377 (5.1%) |
| 20 to 24 Years | 446 (6.7%) | 715 (9.6%) |
| 25 to 29 Years | 450 (6.8%) | 675 (9.0%) |
| 30 to 34 Years | 749 (11.3%) | 452 (6.0%) |
| 35 to 39 Years | 566 (8.5%) | 497 (6.7%) |
| 40 to 44 Years | 425 (6.4%) | 513 (6.9%) |
| 45 to 49 Years | 648 (9.7%) | 658 (8.8%) |
| 50 to 54 Years | 321 (4.8%) | 303 (4.1%) |
| 55 to 59 Years | 204 (3.1%) | 240 (3.2%) |
| 60 to 64 Years | 483 (7.2%) | 259 (3.5%) |
| 65 to 69 Years | 107 (1.6%) | 361 (4.8%) |
| 70 to 74 Years | 95 (1.4%) | 183 (2.5%) |
| 75 to 79 Years | 293 (4.4%) | 190 (2.5%) |
| 80 to 84 Years | 0 (0.0%) | 149 (2.0%) |
| 85 Years and over | 63 (0.9%) | 227 (3.0%) |
| Total | 6,660 (100.0%) | 7,466 (100.0%) |
Families and Households in Dallas
Median Family Size in Dallas
The median family size in Dallas is 3.31 persons per family, with married-couple families (2,285 | 67.7%) accounting for the largest median family size of 3.53 persons per family. On the other hand, single male/father families (221 | 6.6%) represent the smallest median family size with 2.41 persons per family.
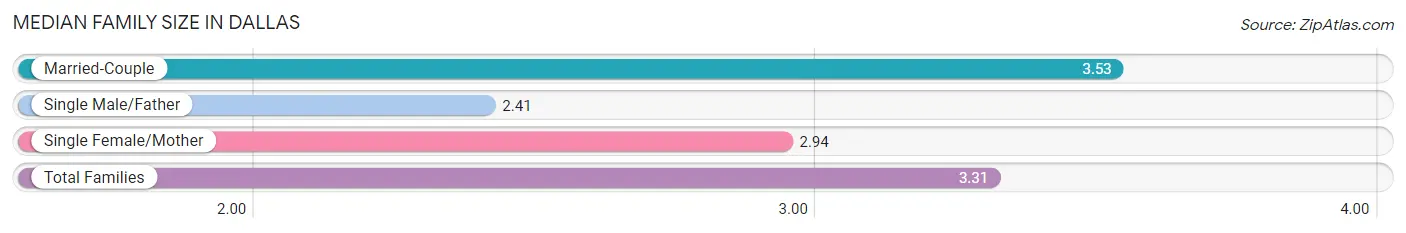
| Family Type | # Families | Family Size |
| Married-Couple | 2,285 (67.7%) | 3.53 |
| Single Male/Father | 221 (6.6%) | 2.41 |
| Single Female/Mother | 868 (25.7%) | 2.94 |
| Total Families | 3,374 (100.0%) | 3.31 |
Median Household Size in Dallas
The median household size in Dallas is 2.55 persons per household, with married-couple households (2,285 | 41.9%) accounting for the largest median household size of 3.57 persons per household. non-family households (2,079 | 38.1%) represent the smallest median household size with 1.10 persons per household.
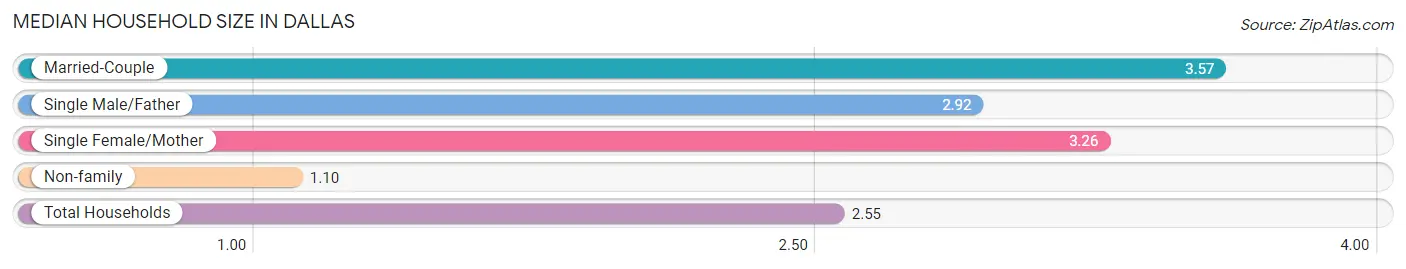
| Household Type | # Households | Household Size |
| Married-Couple | 2,285 (41.9%) | 3.57 |
| Single Male/Father | 221 (4.1%) | 2.92 |
| Single Female/Mother | 868 (15.9%) | 3.26 |
| Non-family | 2,079 (38.1%) | 1.10 |
| Total Households | 5,453 (100.0%) | 2.55 |
Household Size by Marriage Status in Dallas
Out of a total of 5,453 households in Dallas, 3,374 (61.9%) are family households, while 2,079 (38.1%) are nonfamily households. The most numerous type of family households are 3-person households, comprising 1,095, and the most common type of nonfamily households are 1-person households, comprising 1,860.
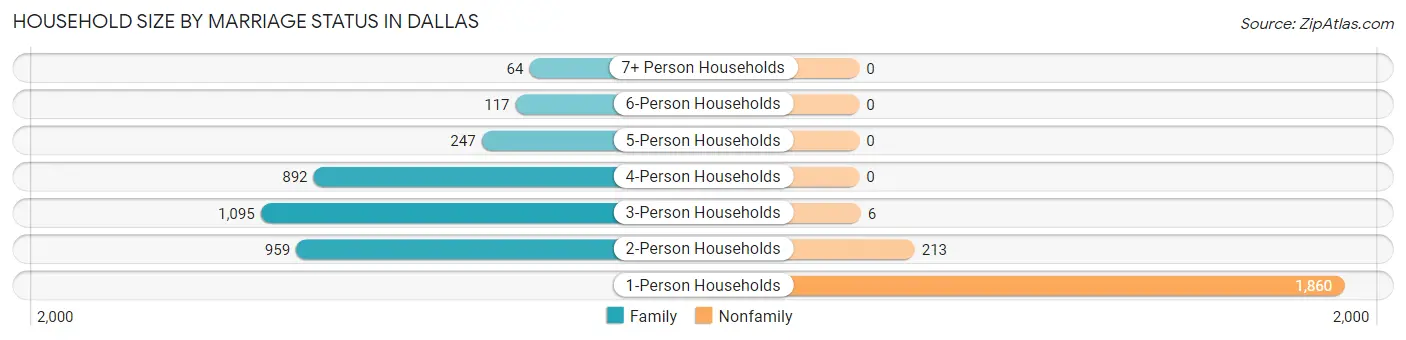
| Household Size | Family Households | Nonfamily Households |
| 1-Person Households | - | 1,860 (34.1%) |
| 2-Person Households | 959 (17.6%) | 213 (3.9%) |
| 3-Person Households | 1,095 (20.1%) | 6 (0.1%) |
| 4-Person Households | 892 (16.4%) | 0 (0.0%) |
| 5-Person Households | 247 (4.5%) | 0 (0.0%) |
| 6-Person Households | 117 (2.1%) | 0 (0.0%) |
| 7+ Person Households | 64 (1.2%) | 0 (0.0%) |
| Total | 3,374 (61.9%) | 2,079 (38.1%) |
Female Fertility in Dallas
Fertility by Age in Dallas
Average fertility rate in Dallas is 55.0 births per 1,000 women. Women in the age bracket of 20 to 34 years have the highest fertility rate with 116.0 births per 1,000 women. Women in the age bracket of 20 to 34 years acount for 100.0% of all women with births.
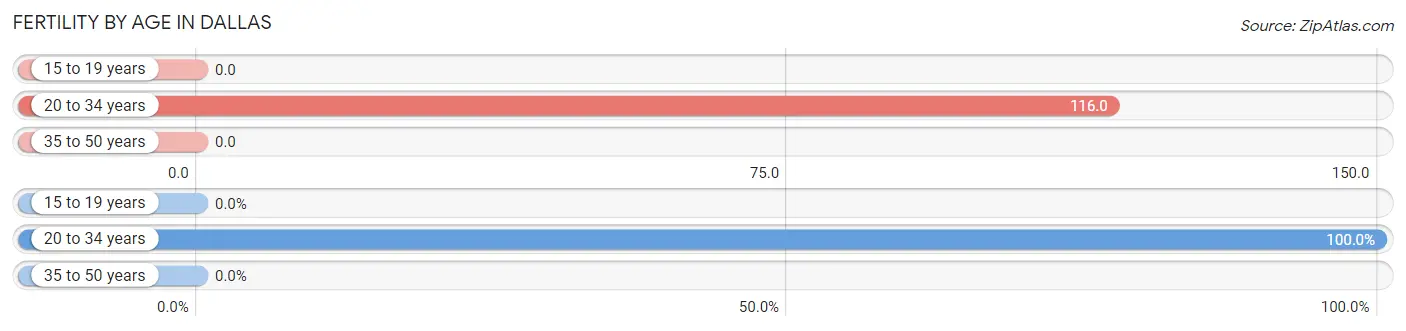
| Age Bracket | Women with Births | Births / 1,000 Women |
| 15 to 19 years | 0 (0.0%) | 0.0 |
| 20 to 34 years | 214 (100.0%) | 116.0 |
| 35 to 50 years | 0 (0.0%) | 0.0 |
| Total | 214 (100.0%) | 55.0 |
Fertility by Age by Marriage Status in Dallas
81.8% of women with births (214) in Dallas are married. The highest percentage of unmarried women with births falls into 20 to 34 years age bracket with 18.2% of them unmarried at the time of birth, while the lowest percentage of unmarried women with births belong to 20 to 34 years age bracket with 18.2% of them unmarried.
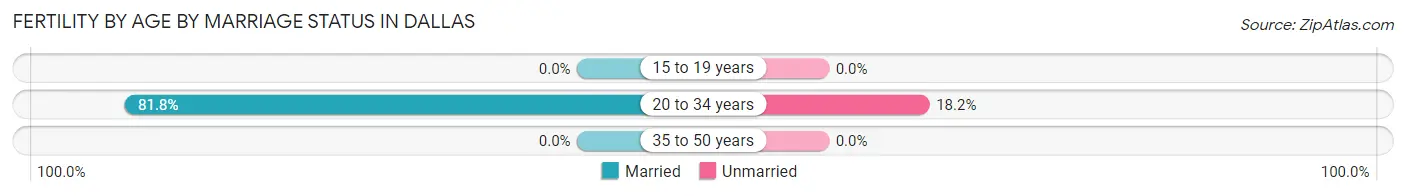
| Age Bracket | Married | Unmarried |
| 15 to 19 years | 0 (0.0%) | 0 (0.0%) |
| 20 to 34 years | 175 (81.8%) | 39 (18.2%) |
| 35 to 50 years | 0 (0.0%) | 0 (0.0%) |
| Total | 175 (81.8%) | 39 (18.2%) |
Fertility by Education in Dallas
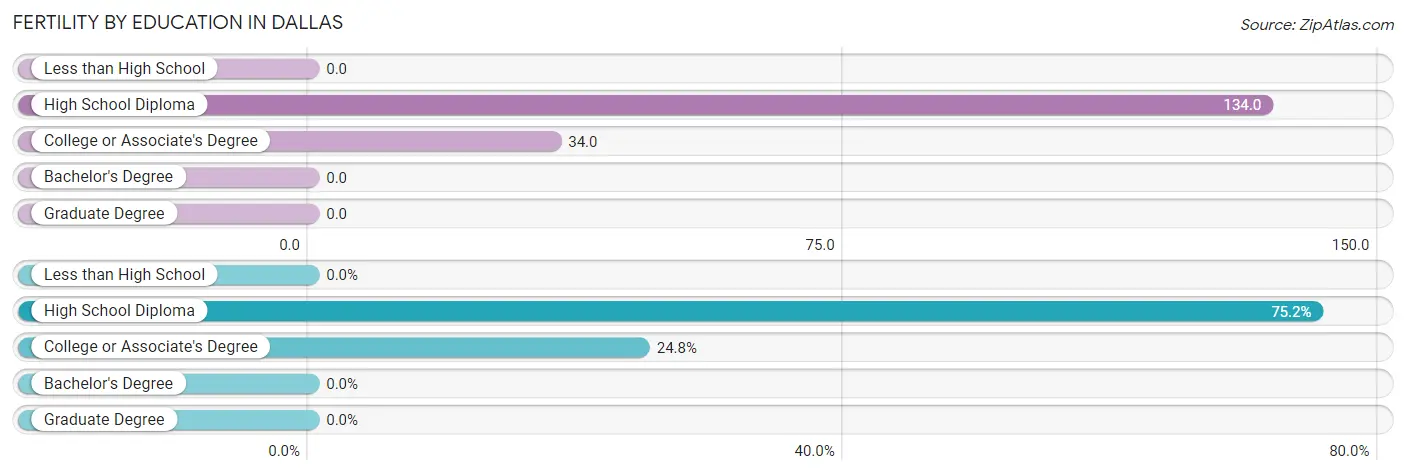
| Educational Attainment | Women with Births | Births / 1,000 Women |
| Less than High School | 0 (0.0%) | 0.0 |
| High School Diploma | 161 (75.2%) | 134.0 |
| College or Associate's Degree | 53 (24.8%) | 34.0 |
| Bachelor's Degree | 0 (0.0%) | 0.0 |
| Graduate Degree | 0 (0.0%) | 0.0 |
| Total | 214 (100.0%) | 55.0 |
Fertility by Education by Marriage Status in Dallas
18.2% of women with births in Dallas are unmarried. Women with the educational attainment of high school diploma are most likely to be married with 100.0% of them married at childbirth, while women with the educational attainment of college or associate's degree are least likely to be married with 73.6% of them unmarried at childbirth.
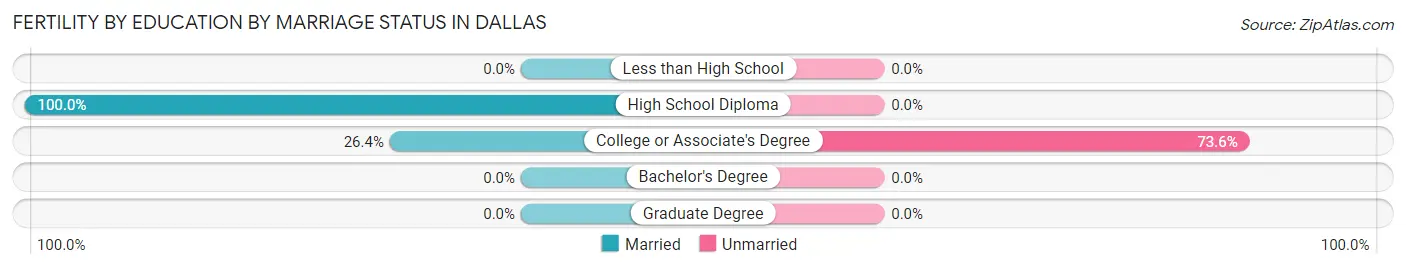
| Educational Attainment | Married | Unmarried |
| Less than High School | 0 (0.0%) | 0 (0.0%) |
| High School Diploma | 161 (100.0%) | 0 (0.0%) |
| College or Associate's Degree | 14 (26.4%) | 39 (73.6%) |
| Bachelor's Degree | 0 (0.0%) | 0 (0.0%) |
| Graduate Degree | 0 (0.0%) | 0 (0.0%) |
| Total | 175 (81.8%) | 39 (18.2%) |
Employment Characteristics in Dallas
Employment by Class of Employer in Dallas
Among the 6,450 employed individuals in Dallas, private company employees (4,454 | 69.1%), not-for-profit organizations (578 | 9.0%), and self-employed (not incorporated) (455 | 7.0%) make up the most common classes of employment.
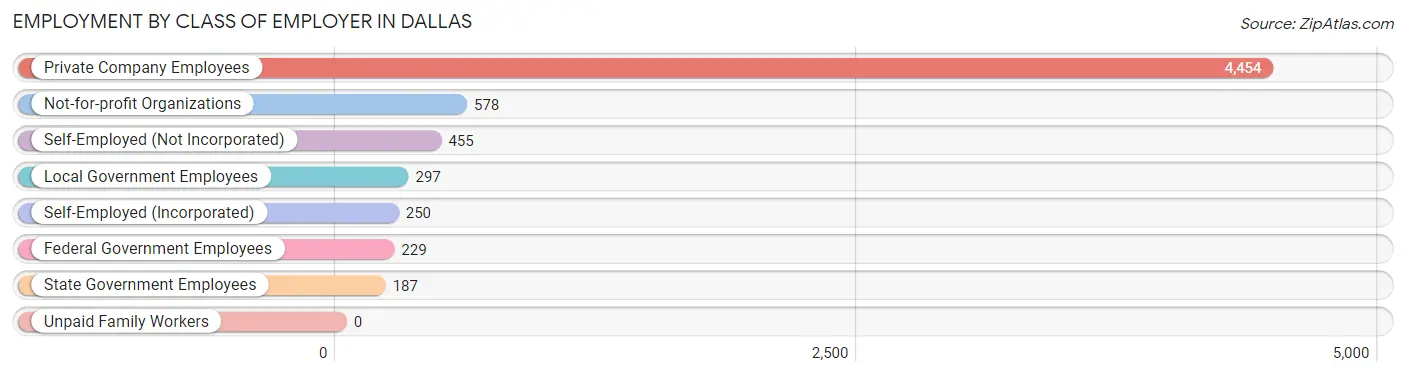
| Employer Class | # Employees | % Employees |
| Private Company Employees | 4,454 | 69.1% |
| Self-Employed (Incorporated) | 250 | 3.9% |
| Self-Employed (Not Incorporated) | 455 | 7.0% |
| Not-for-profit Organizations | 578 | 9.0% |
| Local Government Employees | 297 | 4.6% |
| State Government Employees | 187 | 2.9% |
| Federal Government Employees | 229 | 3.5% |
| Unpaid Family Workers | 0 | 0.0% |
| Total | 6,450 | 100.0% |
Employment Status by Age in Dallas
According to the labor force statistics for Dallas, out of the total population over 16 years of age (10,901), 63.0% or 6,868 individuals are in the labor force, with 5.1% or 350 of them unemployed. The age group with the highest labor force participation rate is 35 to 44 years, with 90.6% or 1,813 individuals in the labor force. Within the labor force, the 35 to 44 years age range has the highest percentage of unemployed individuals, with 10.8% or 196 of them being unemployed.
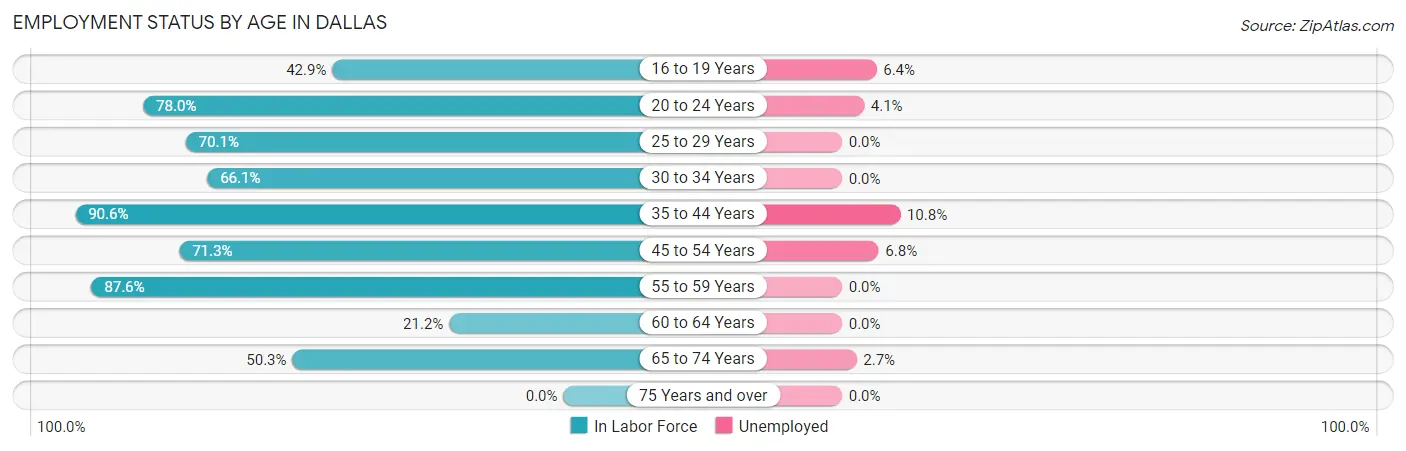
| Age Bracket | In Labor Force | Unemployed |
| 16 to 19 Years | 270 (42.9%) | 17 (6.4%) |
| 20 to 24 Years | 906 (78.0%) | 37 (4.1%) |
| 25 to 29 Years | 789 (70.1%) | 0 (0.0%) |
| 30 to 34 Years | 794 (66.1%) | 0 (0.0%) |
| 35 to 44 Years | 1,813 (90.6%) | 196 (10.8%) |
| 45 to 54 Years | 1,376 (71.3%) | 94 (6.8%) |
| 55 to 59 Years | 389 (87.6%) | 0 (0.0%) |
| 60 to 64 Years | 157 (21.2%) | 0 (0.0%) |
| 65 to 74 Years | 375 (50.3%) | 10 (2.7%) |
| 75 Years and over | 0 (0.0%) | 0 (0.0%) |
| Total | 6,868 (63.0%) | 350 (5.1%) |
Employment Status by Educational Attainment in Dallas
According to labor force statistics for Dallas, 71.4% of individuals (5,314) out of the total population between 25 and 64 years of age (7,443) are in the labor force, with 5.4% or 287 of them being unemployed. The group with the highest labor force participation rate are those with the educational attainment of bachelor's degree or higher, with 90.5% or 1,380 individuals in the labor force. Within the labor force, individuals with bachelor's degree or higher education have the highest percentage of unemployment, with 11.8% or 163 of them being unemployed.
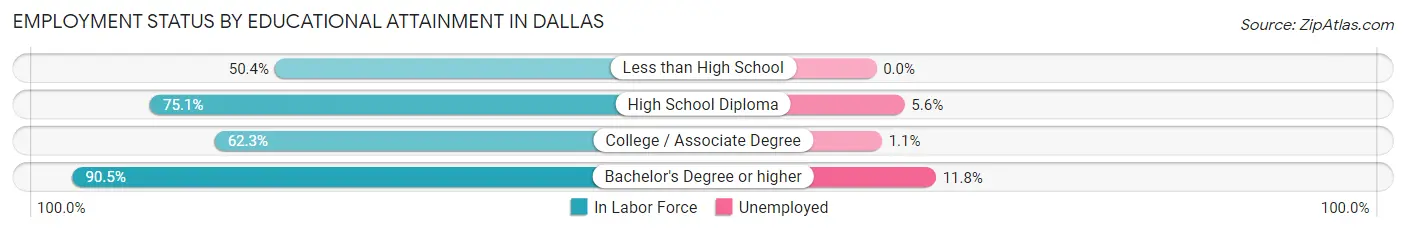
| Educational Attainment | In Labor Force | Unemployed |
| Less than High School | 269 (50.4%) | 0 (0.0%) |
| High School Diploma | 1,853 (75.1%) | 138 (5.6%) |
| College / Associate Degree | 1,817 (62.3%) | 32 (1.1%) |
| Bachelor's Degree or higher | 1,380 (90.5%) | 180 (11.8%) |
| Total | 5,314 (71.4%) | 402 (5.4%) |
Employment Occupations by Sex in Dallas
Management, Business, Science and Arts Occupations
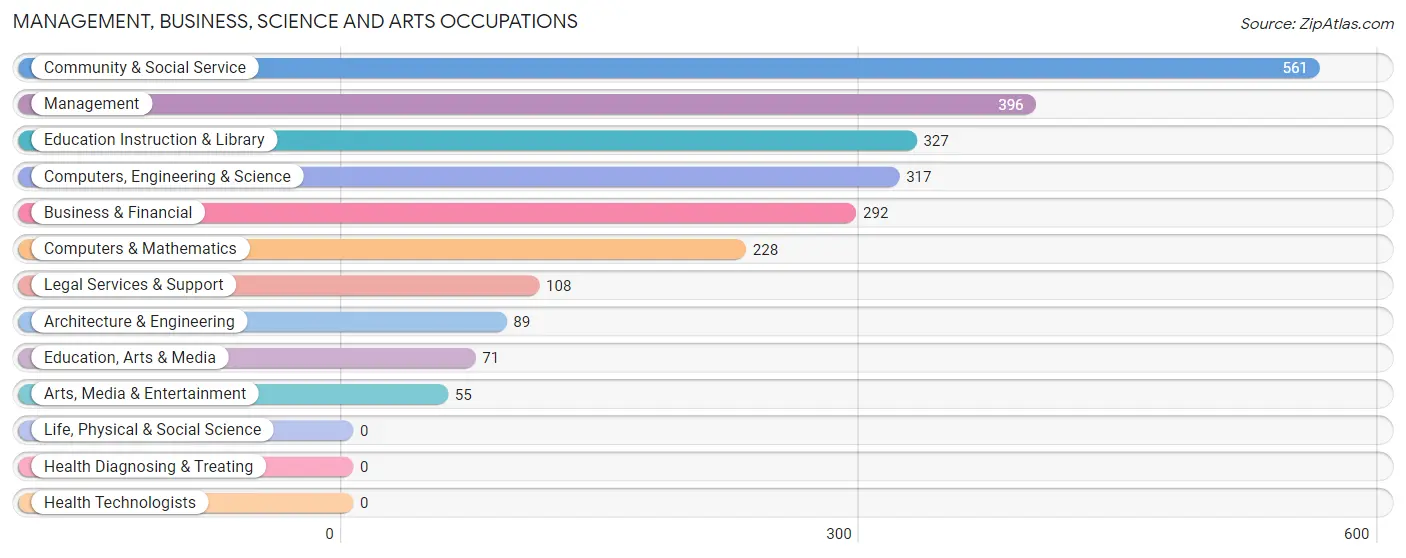
The most common Management, Business, Science and Arts occupations in Dallas are Community & Social Service (561 | 8.6%), Management (396 | 6.1%), Education Instruction & Library (327 | 5.0%), Computers, Engineering & Science (317 | 4.9%), and Business & Financial (292 | 4.5%).
Management, Business, Science and Arts Occupations by Sex
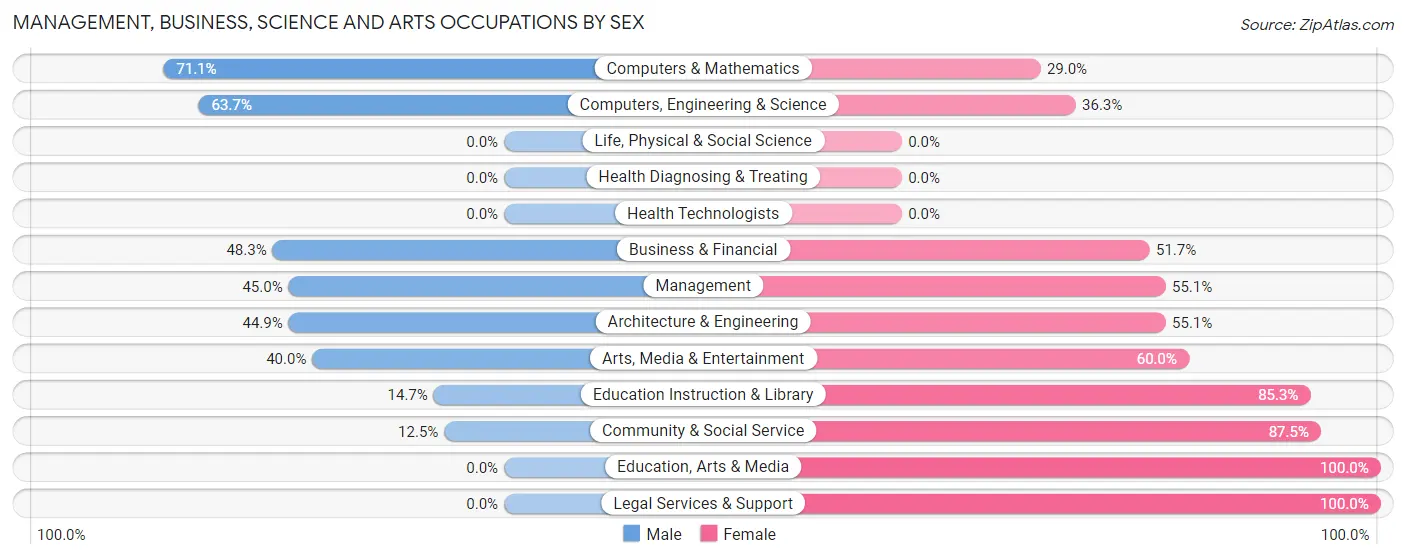
Within the Management, Business, Science and Arts occupations in Dallas, the most male-oriented occupations are Computers & Mathematics (71.1%), Computers, Engineering & Science (63.7%), and Business & Financial (48.3%), while the most female-oriented occupations are Education, Arts & Media (100.0%), Legal Services & Support (100.0%), and Community & Social Service (87.5%).
| Occupation | Male | Female |
| Management | 178 (45.0%) | 218 (55.0%) |
| Business & Financial | 141 (48.3%) | 151 (51.7%) |
| Computers, Engineering & Science | 202 (63.7%) | 115 (36.3%) |
| Computers & Mathematics | 162 (71.1%) | 66 (28.9%) |
| Architecture & Engineering | 40 (44.9%) | 49 (55.1%) |
| Life, Physical & Social Science | 0 (0.0%) | 0 (0.0%) |
| Community & Social Service | 70 (12.5%) | 491 (87.5%) |
| Education, Arts & Media | 0 (0.0%) | 71 (100.0%) |
| Legal Services & Support | 0 (0.0%) | 108 (100.0%) |
| Education Instruction & Library | 48 (14.7%) | 279 (85.3%) |
| Arts, Media & Entertainment | 22 (40.0%) | 33 (60.0%) |
| Health Diagnosing & Treating | 0 (0.0%) | 0 (0.0%) |
| Health Technologists | 0 (0.0%) | 0 (0.0%) |
| Total (Category) | 591 (37.7%) | 975 (62.3%) |
| Total (Overall) | 3,397 (52.2%) | 3,107 (47.8%) |
Services Occupations
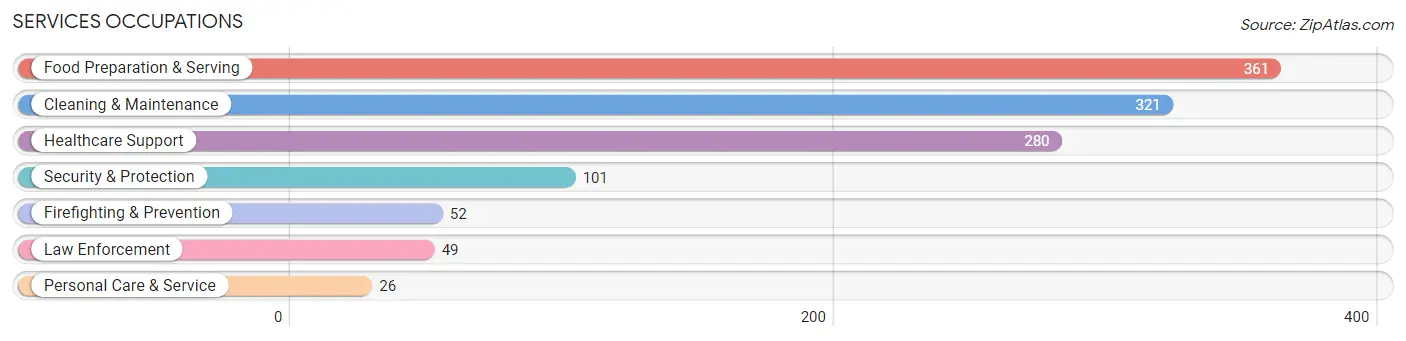
The most common Services occupations in Dallas are Food Preparation & Serving (361 | 5.6%), Cleaning & Maintenance (321 | 4.9%), Healthcare Support (280 | 4.3%), Security & Protection (101 | 1.5%), and Firefighting & Prevention (52 | 0.8%).
Services Occupations by Sex
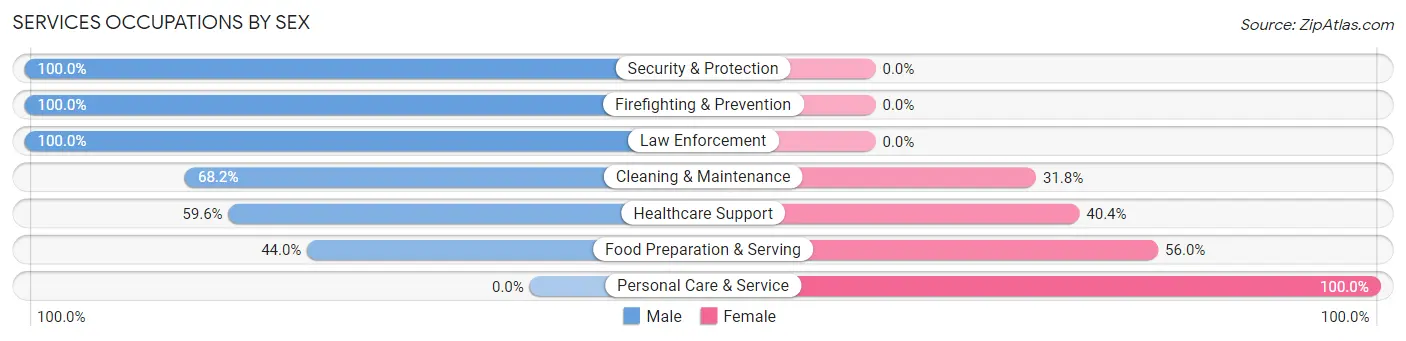
Within the Services occupations in Dallas, the most male-oriented occupations are Security & Protection (100.0%), Firefighting & Prevention (100.0%), and Law Enforcement (100.0%), while the most female-oriented occupations are Personal Care & Service (100.0%), Food Preparation & Serving (56.0%), and Healthcare Support (40.4%).
| Occupation | Male | Female |
| Healthcare Support | 167 (59.6%) | 113 (40.4%) |
| Security & Protection | 101 (100.0%) | 0 (0.0%) |
| Firefighting & Prevention | 52 (100.0%) | 0 (0.0%) |
| Law Enforcement | 49 (100.0%) | 0 (0.0%) |
| Food Preparation & Serving | 159 (44.0%) | 202 (56.0%) |
| Cleaning & Maintenance | 219 (68.2%) | 102 (31.8%) |
| Personal Care & Service | 0 (0.0%) | 26 (100.0%) |
| Total (Category) | 646 (59.3%) | 443 (40.7%) |
| Total (Overall) | 3,397 (52.2%) | 3,107 (47.8%) |
Sales and Office Occupations
The most common Sales and Office occupations in Dallas are Office & Administration (1,201 | 18.5%), and Sales & Related (915 | 14.1%).

Sales and Office Occupations by Sex

| Occupation | Male | Female |
| Sales & Related | 575 (62.8%) | 340 (37.2%) |
| Office & Administration | 258 (21.5%) | 943 (78.5%) |
| Total (Category) | 833 (39.4%) | 1,283 (60.6%) |
| Total (Overall) | 3,397 (52.2%) | 3,107 (47.8%) |
Natural Resources, Construction and Maintenance Occupations
The most common Natural Resources, Construction and Maintenance occupations in Dallas are Construction & Extraction (409 | 6.3%), and Installation, Maintenance & Repair (277 | 4.3%).

Natural Resources, Construction and Maintenance Occupations by Sex
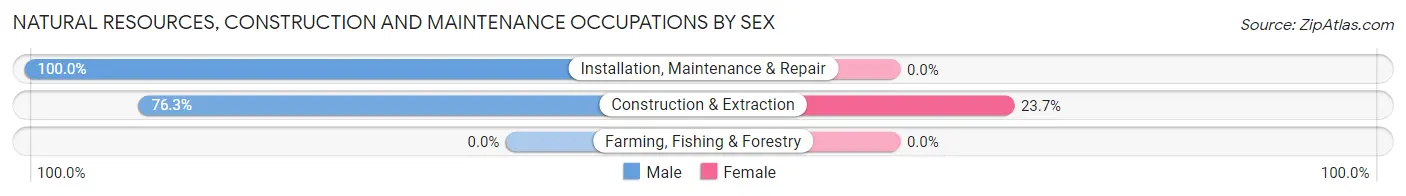
| Occupation | Male | Female |
| Farming, Fishing & Forestry | 0 (0.0%) | 0 (0.0%) |
| Construction & Extraction | 312 (76.3%) | 97 (23.7%) |
| Installation, Maintenance & Repair | 277 (100.0%) | 0 (0.0%) |
| Total (Category) | 589 (85.9%) | 97 (14.1%) |
| Total (Overall) | 3,397 (52.2%) | 3,107 (47.8%) |
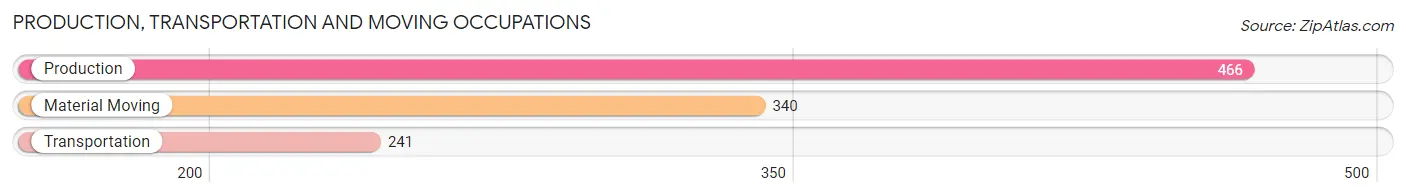
Production, Transportation and Moving Occupations
The most common Production, Transportation and Moving occupations in Dallas are Production (466 | 7.2%), Material Moving (340 | 5.2%), and Transportation (241 | 3.7%).
Production, Transportation and Moving Occupations by Sex
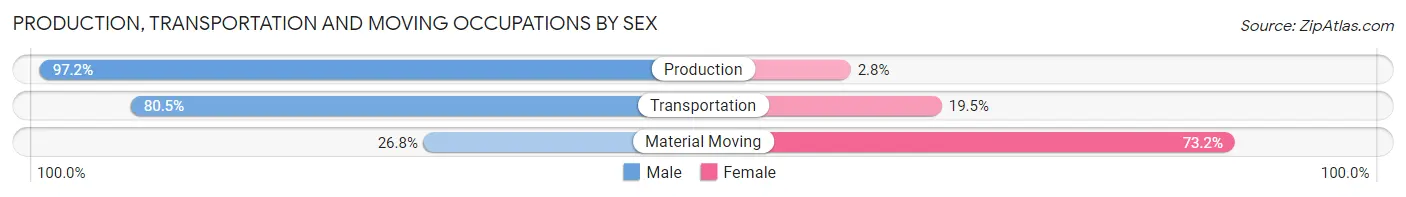
| Occupation | Male | Female |
| Production | 453 (97.2%) | 13 (2.8%) |
| Transportation | 194 (80.5%) | 47 (19.5%) |
| Material Moving | 91 (26.8%) | 249 (73.2%) |
| Total (Category) | 738 (70.5%) | 309 (29.5%) |
| Total (Overall) | 3,397 (52.2%) | 3,107 (47.8%) |
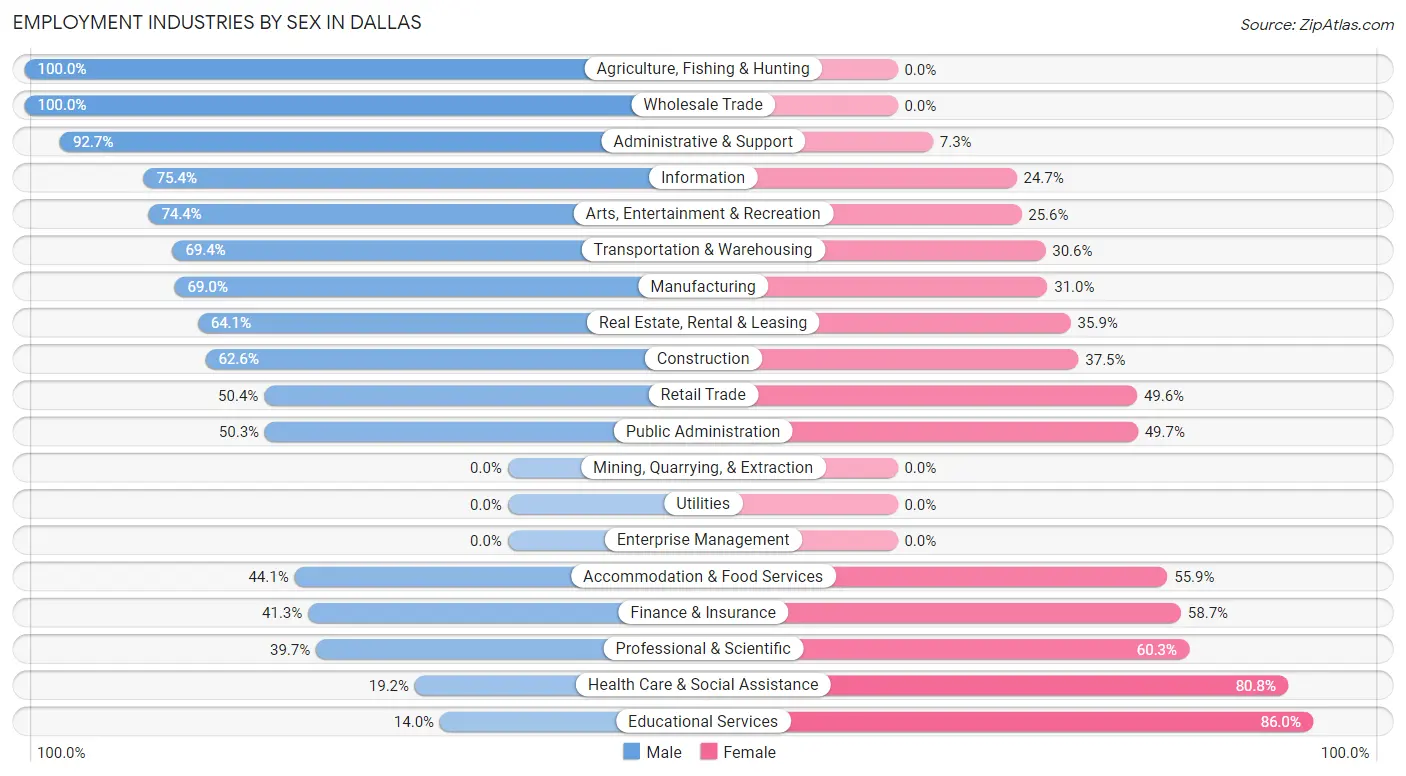
Employment Industries by Sex in Dallas
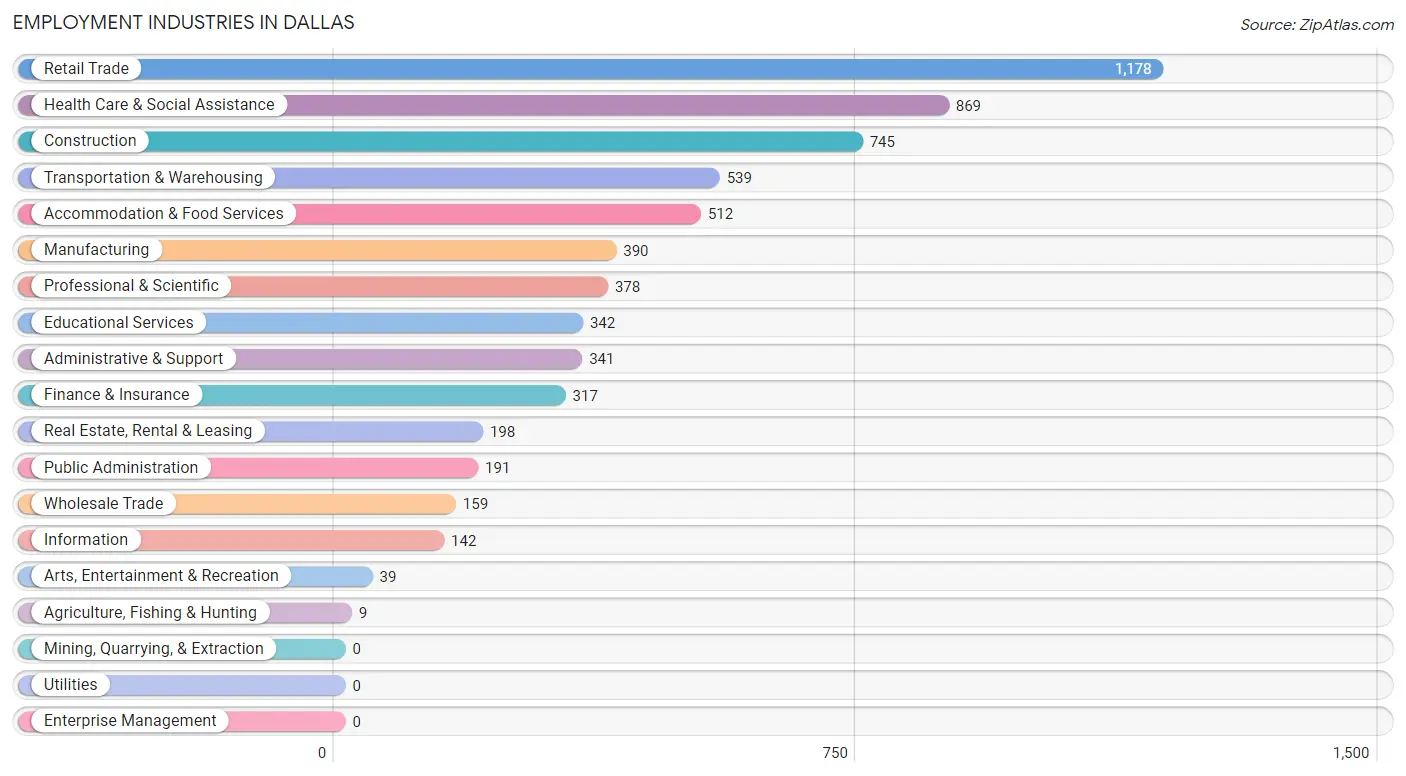
Employment Industries in Dallas
The major employment industries in Dallas include Retail Trade (1,178 | 18.1%), Health Care & Social Assistance (869 | 13.4%), Construction (745 | 11.5%), Transportation & Warehousing (539 | 8.3%), and Accommodation & Food Services (512 | 7.9%).
Employment Industries by Sex in Dallas
The Dallas industries that see more men than women are Agriculture, Fishing & Hunting (100.0%), Wholesale Trade (100.0%), and Administrative & Support (92.7%), whereas the industries that tend to have a higher number of women are Educational Services (86.0%), Health Care & Social Assistance (80.8%), and Professional & Scientific (60.3%).
| Industry | Male | Female |
| Agriculture, Fishing & Hunting | 9 (100.0%) | 0 (0.0%) |
| Mining, Quarrying, & Extraction | 0 (0.0%) | 0 (0.0%) |
| Construction | 466 (62.5%) | 279 (37.4%) |
| Manufacturing | 269 (69.0%) | 121 (31.0%) |
| Wholesale Trade | 159 (100.0%) | 0 (0.0%) |
| Retail Trade | 594 (50.4%) | 584 (49.6%) |
| Transportation & Warehousing | 374 (69.4%) | 165 (30.6%) |
| Utilities | 0 (0.0%) | 0 (0.0%) |
| Information | 107 (75.3%) | 35 (24.6%) |
| Finance & Insurance | 131 (41.3%) | 186 (58.7%) |
| Real Estate, Rental & Leasing | 127 (64.1%) | 71 (35.9%) |
| Professional & Scientific | 150 (39.7%) | 228 (60.3%) |
| Enterprise Management | 0 (0.0%) | 0 (0.0%) |
| Administrative & Support | 316 (92.7%) | 25 (7.3%) |
| Educational Services | 48 (14.0%) | 294 (86.0%) |
| Health Care & Social Assistance | 167 (19.2%) | 702 (80.8%) |
| Arts, Entertainment & Recreation | 29 (74.4%) | 10 (25.6%) |
| Accommodation & Food Services | 226 (44.1%) | 286 (55.9%) |
| Public Administration | 96 (50.3%) | 95 (49.7%) |
| Total | 3,397 (52.2%) | 3,107 (47.8%) |
Education in Dallas
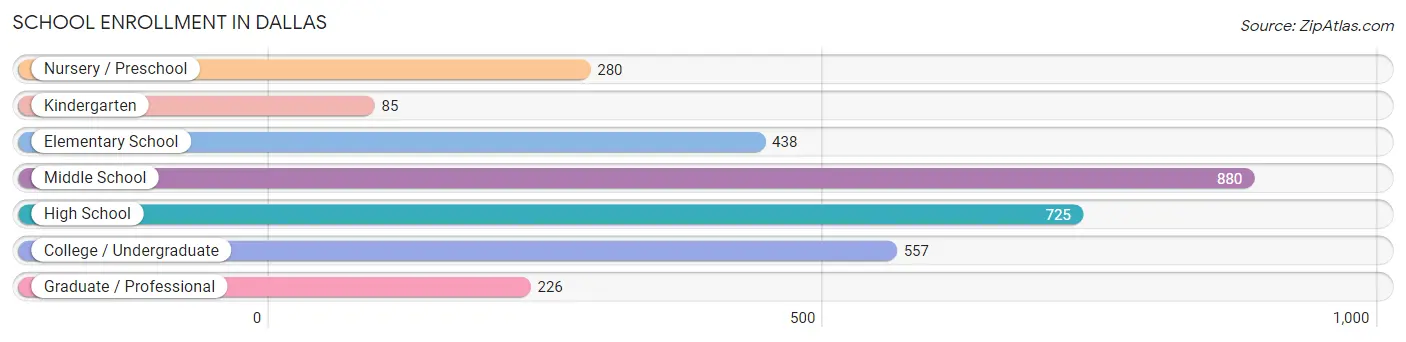
School Enrollment in Dallas
The most common levels of schooling among the 3,191 students in Dallas are middle school (880 | 27.6%), high school (725 | 22.7%), and college / undergraduate (557 | 17.5%).
| School Level | # Students | % Students |
| Nursery / Preschool | 280 | 8.8% |
| Kindergarten | 85 | 2.7% |
| Elementary School | 438 | 13.7% |
| Middle School | 880 | 27.6% |
| High School | 725 | 22.7% |
| College / Undergraduate | 557 | 17.5% |
| Graduate / Professional | 226 | 7.1% |
| Total | 3,191 | 100.0% |
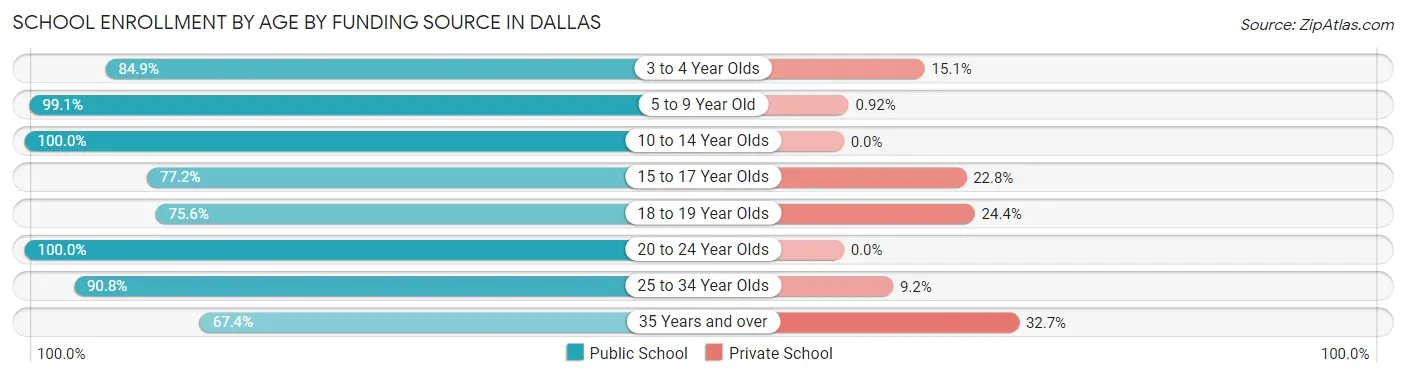
School Enrollment by Age by Funding Source in Dallas
Out of a total of 3,191 students who are enrolled in schools in Dallas, 258 (8.1%) attend a private institution, while the remaining 2,933 (91.9%) are enrolled in public schools. The age group of 35 years and over has the highest likelihood of being enrolled in private schools, with 48 (32.7% in the age bracket) enrolled. Conversely, the age group of 10 to 14 year olds has the lowest likelihood of being enrolled in a private school, with 1,103 (100.0% in the age bracket) attending a public institution.
| Age Bracket | Public School | Private School |
| 3 to 4 Year Olds | 169 (84.9%) | 30 (15.1%) |
| 5 to 9 Year Old | 537 (99.1%) | 5 (0.9%) |
| 10 to 14 Year Olds | 1,103 (100.0%) | 0 (0.0%) |
| 15 to 17 Year Olds | 372 (77.2%) | 110 (22.8%) |
| 18 to 19 Year Olds | 127 (75.6%) | 41 (24.4%) |
| 20 to 24 Year Olds | 300 (100.0%) | 0 (0.0%) |
| 25 to 34 Year Olds | 227 (90.8%) | 23 (9.2%) |
| 35 Years and over | 99 (67.3%) | 48 (32.7%) |
| Total | 2,933 (91.9%) | 258 (8.1%) |
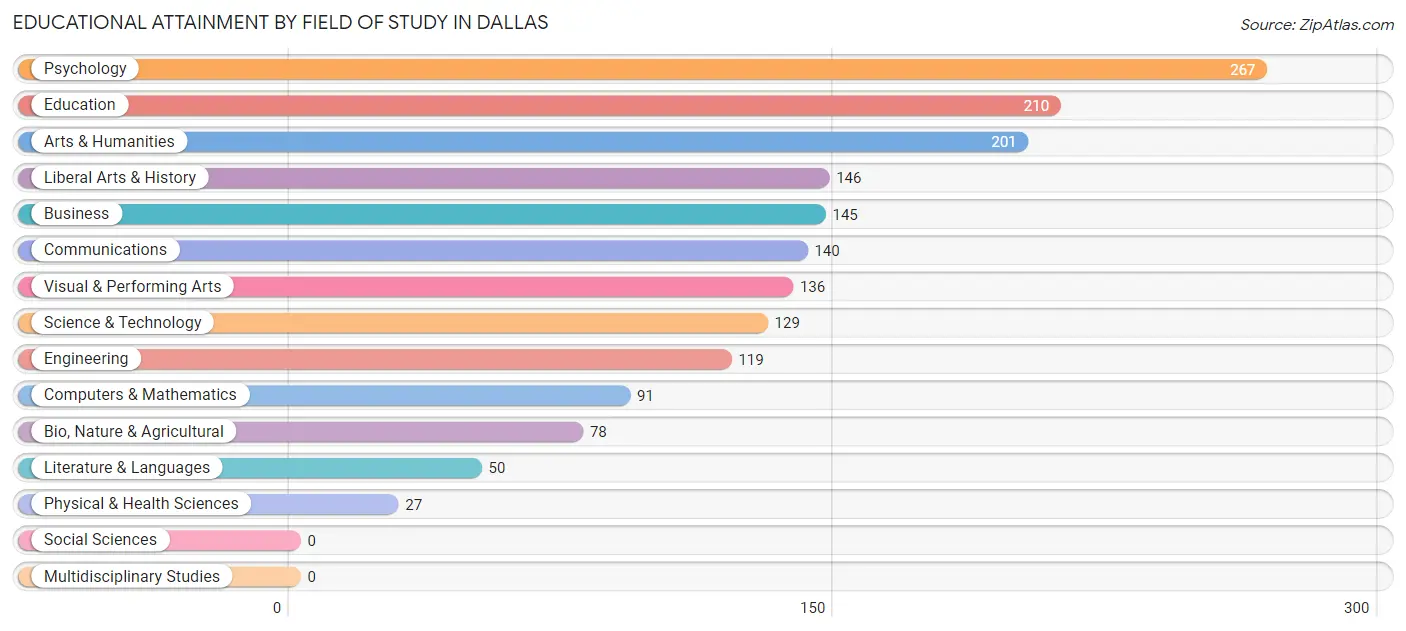
Educational Attainment by Field of Study in Dallas
Psychology (267 | 15.3%), education (210 | 12.1%), arts & humanities (201 | 11.6%), liberal arts & history (146 | 8.4%), and business (145 | 8.3%) are the most common fields of study among 1,739 individuals in Dallas who have obtained a bachelor's degree or higher.
| Field of Study | # Graduates | % Graduates |
| Computers & Mathematics | 91 | 5.2% |
| Bio, Nature & Agricultural | 78 | 4.5% |
| Physical & Health Sciences | 27 | 1.5% |
| Psychology | 267 | 15.3% |
| Social Sciences | 0 | 0.0% |
| Engineering | 119 | 6.8% |
| Multidisciplinary Studies | 0 | 0.0% |
| Science & Technology | 129 | 7.4% |
| Business | 145 | 8.3% |
| Education | 210 | 12.1% |
| Literature & Languages | 50 | 2.9% |
| Liberal Arts & History | 146 | 8.4% |
| Visual & Performing Arts | 136 | 7.8% |
| Communications | 140 | 8.1% |
| Arts & Humanities | 201 | 11.6% |
| Total | 1,739 | 100.0% |
Transportation & Commute in Dallas
Vehicle Availability by Sex in Dallas
The most prevalent vehicle ownership categories in Dallas are males with 2 vehicles (1,484, accounting for 43.5%) and females with 2 vehicles (1,051, making up 48.8%).
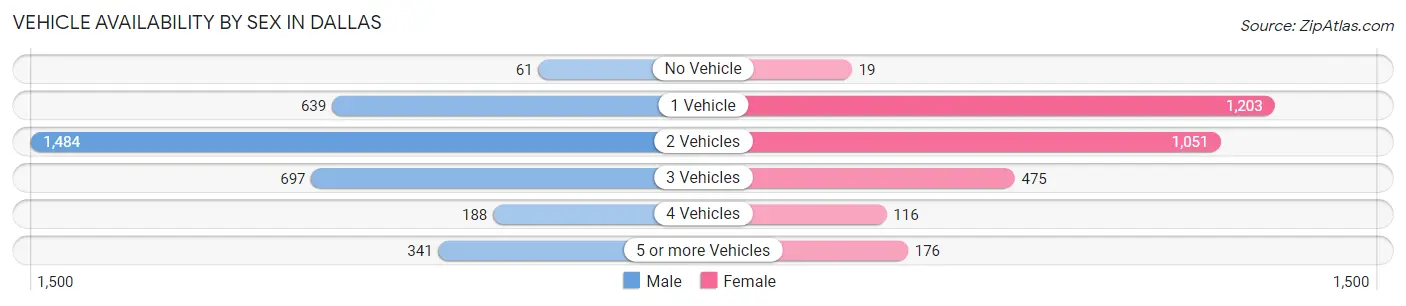
| Vehicles Available | Male | Female |
| No Vehicle | 61 (1.8%) | 19 (0.6%) |
| 1 Vehicle | 639 (18.7%) | 1,203 (39.6%) |
| 2 Vehicles | 1,484 (43.5%) | 1,051 (34.6%) |
| 3 Vehicles | 697 (20.4%) | 475 (15.6%) |
| 4 Vehicles | 188 (5.5%) | 116 (3.8%) |
| 5 or more Vehicles | 341 (10.0%) | 176 (5.8%) |
| Total | 3,410 (100.0%) | 3,040 (100.0%) |
Commute Time in Dallas
The most frequently occuring commute durations in Dallas are 60 to 89 minutes (1,247 commuters, 21.1%), 45 to 59 minutes (1,245 commuters, 21.1%), and 30 to 34 minutes (752 commuters, 12.7%).
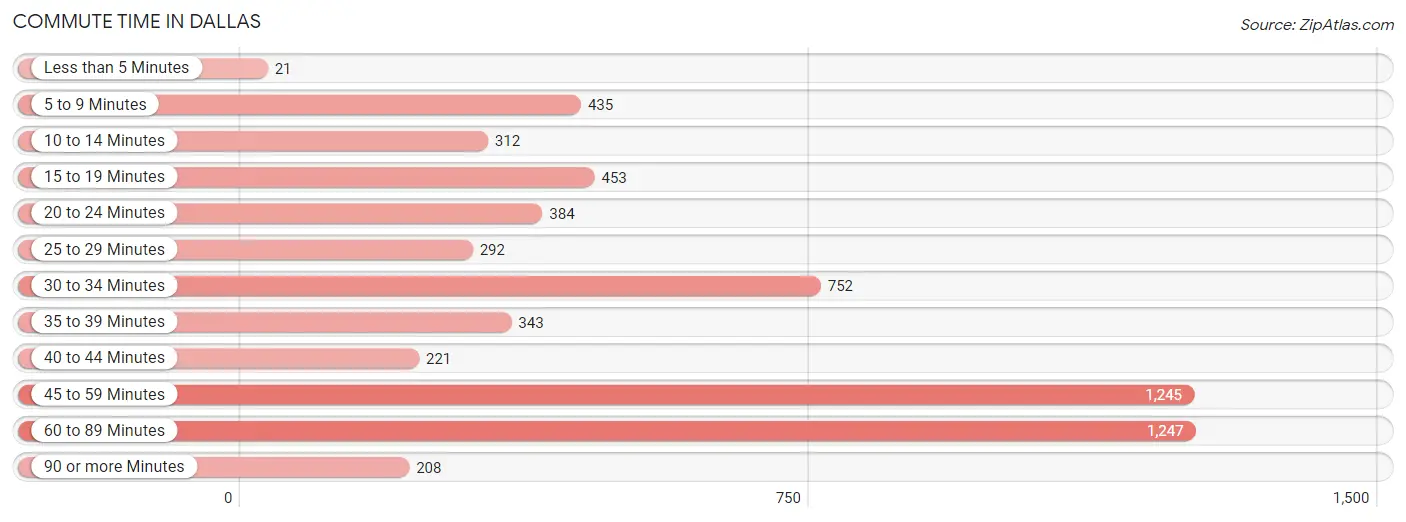
| Commute Time | # Commuters | % Commuters |
| Less than 5 Minutes | 21 | 0.4% |
| 5 to 9 Minutes | 435 | 7.4% |
| 10 to 14 Minutes | 312 | 5.3% |
| 15 to 19 Minutes | 453 | 7.7% |
| 20 to 24 Minutes | 384 | 6.5% |
| 25 to 29 Minutes | 292 | 4.9% |
| 30 to 34 Minutes | 752 | 12.7% |
| 35 to 39 Minutes | 343 | 5.8% |
| 40 to 44 Minutes | 221 | 3.7% |
| 45 to 59 Minutes | 1,245 | 21.1% |
| 60 to 89 Minutes | 1,247 | 21.1% |
| 90 or more Minutes | 208 | 3.5% |
Commute Time by Sex in Dallas
The most common commute times in Dallas are 60 to 89 minutes (745 commuters, 24.3%) for males and 45 to 59 minutes (580 commuters, 20.3%) for females.
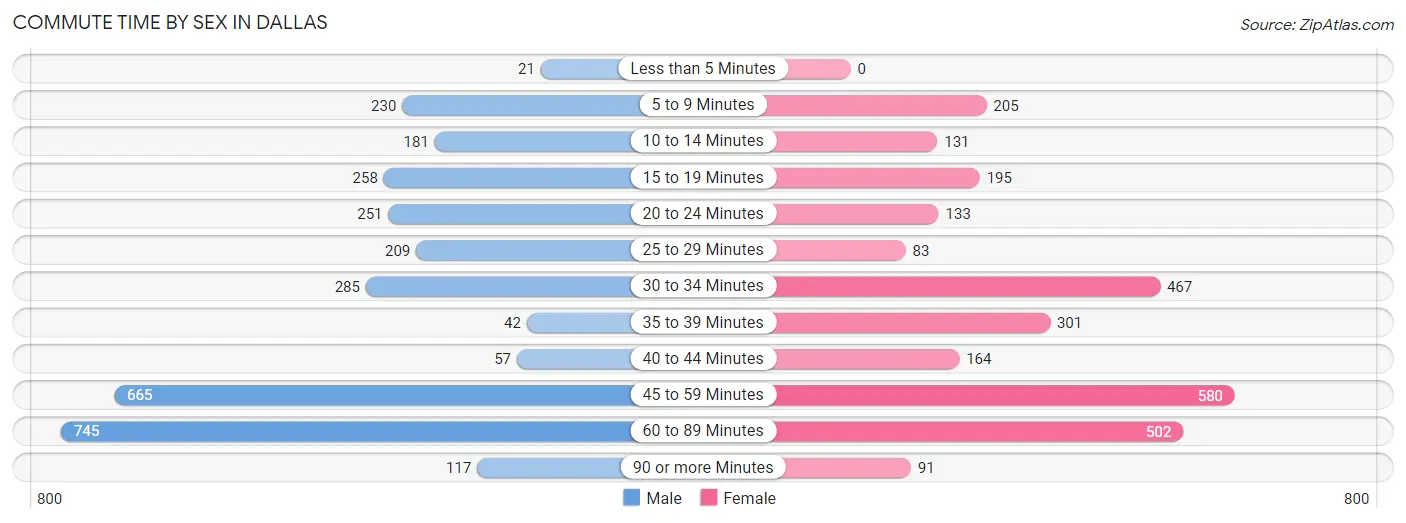
| Commute Time | Male | Female |
| Less than 5 Minutes | 21 (0.7%) | 0 (0.0%) |
| 5 to 9 Minutes | 230 (7.5%) | 205 (7.2%) |
| 10 to 14 Minutes | 181 (5.9%) | 131 (4.6%) |
| 15 to 19 Minutes | 258 (8.4%) | 195 (6.8%) |
| 20 to 24 Minutes | 251 (8.2%) | 133 (4.7%) |
| 25 to 29 Minutes | 209 (6.8%) | 83 (2.9%) |
| 30 to 34 Minutes | 285 (9.3%) | 467 (16.4%) |
| 35 to 39 Minutes | 42 (1.4%) | 301 (10.5%) |
| 40 to 44 Minutes | 57 (1.9%) | 164 (5.8%) |
| 45 to 59 Minutes | 665 (21.7%) | 580 (20.3%) |
| 60 to 89 Minutes | 745 (24.3%) | 502 (17.6%) |
| 90 or more Minutes | 117 (3.8%) | 91 (3.2%) |
Time of Departure to Work by Sex in Dallas
The most frequent times of departure to work in Dallas are 7:00 AM to 7:29 AM (591, 19.3%) for males and 6:30 AM to 6:59 AM (615, 21.6%) for females.
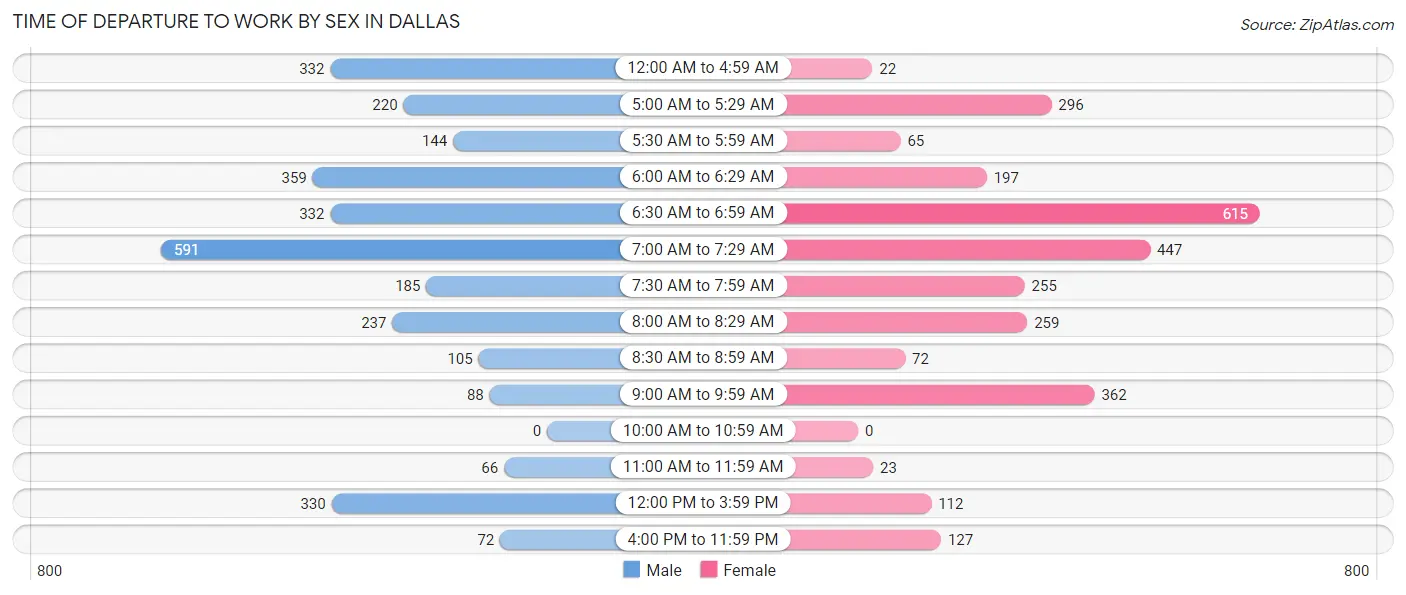
| Time of Departure | Male | Female |
| 12:00 AM to 4:59 AM | 332 (10.8%) | 22 (0.8%) |
| 5:00 AM to 5:29 AM | 220 (7.2%) | 296 (10.4%) |
| 5:30 AM to 5:59 AM | 144 (4.7%) | 65 (2.3%) |
| 6:00 AM to 6:29 AM | 359 (11.7%) | 197 (6.9%) |
| 6:30 AM to 6:59 AM | 332 (10.8%) | 615 (21.6%) |
| 7:00 AM to 7:29 AM | 591 (19.3%) | 447 (15.7%) |
| 7:30 AM to 7:59 AM | 185 (6.0%) | 255 (8.9%) |
| 8:00 AM to 8:29 AM | 237 (7.7%) | 259 (9.1%) |
| 8:30 AM to 8:59 AM | 105 (3.4%) | 72 (2.5%) |
| 9:00 AM to 9:59 AM | 88 (2.9%) | 362 (12.7%) |
| 10:00 AM to 10:59 AM | 0 (0.0%) | 0 (0.0%) |
| 11:00 AM to 11:59 AM | 66 (2.2%) | 23 (0.8%) |
| 12:00 PM to 3:59 PM | 330 (10.8%) | 112 (3.9%) |
| 4:00 PM to 11:59 PM | 72 (2.4%) | 127 (4.4%) |
| Total | 3,061 (100.0%) | 2,852 (100.0%) |
Housing Occupancy in Dallas
Occupancy by Ownership in Dallas
Of the total 5,453 dwellings in Dallas, owner-occupied units account for 3,041 (55.8%), while renter-occupied units make up 2,412 (44.2%).
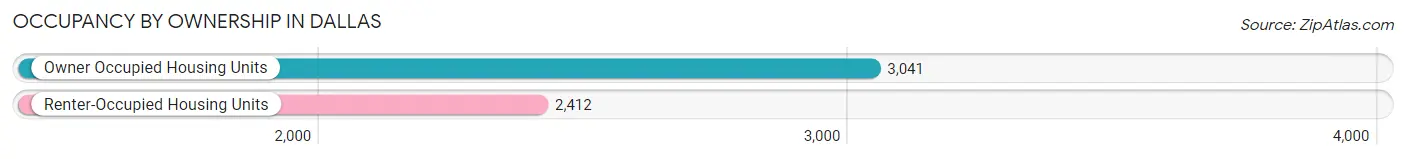
| Occupancy | # Housing Units | % Housing Units |
| Owner Occupied Housing Units | 3,041 | 55.8% |
| Renter-Occupied Housing Units | 2,412 | 44.2% |
| Total Occupied Housing Units | 5,453 | 100.0% |
Occupancy by Household Size in Dallas
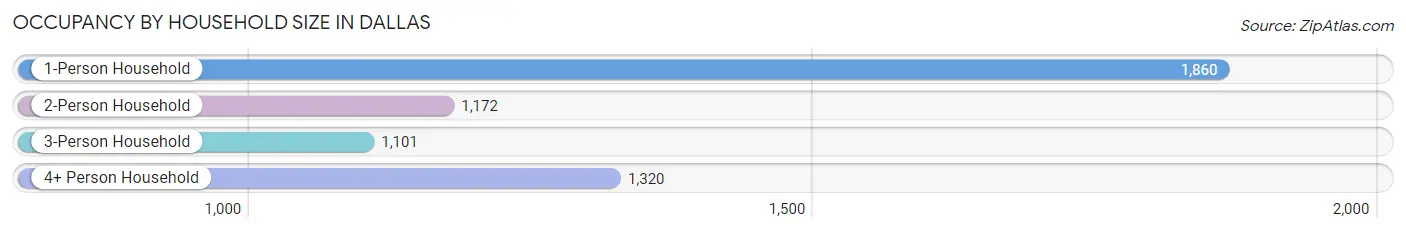
| Household Size | # Housing Units | % Housing Units |
| 1-Person Household | 1,860 | 34.1% |
| 2-Person Household | 1,172 | 21.5% |
| 3-Person Household | 1,101 | 20.2% |
| 4+ Person Household | 1,320 | 24.2% |
| Total Housing Units | 5,453 | 100.0% |
Occupancy by Ownership by Household Size in Dallas
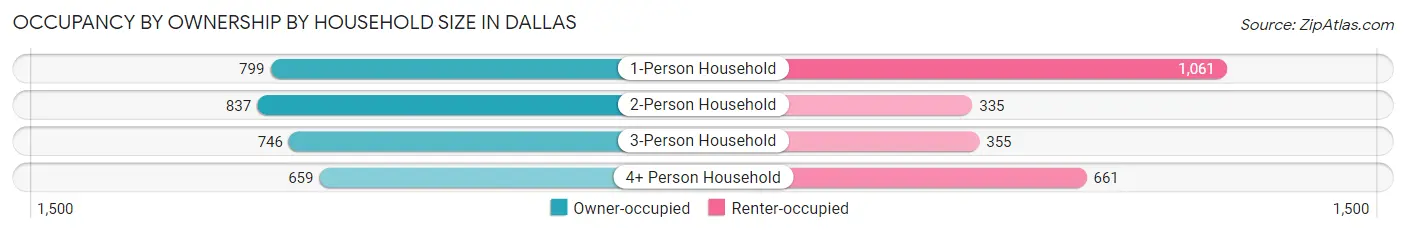
| Household Size | Owner-occupied | Renter-occupied |
| 1-Person Household | 799 (43.0%) | 1,061 (57.0%) |
| 2-Person Household | 837 (71.4%) | 335 (28.6%) |
| 3-Person Household | 746 (67.8%) | 355 (32.2%) |
| 4+ Person Household | 659 (49.9%) | 661 (50.1%) |
| Total Housing Units | 3,041 (55.8%) | 2,412 (44.2%) |
Occupancy by Educational Attainment in Dallas
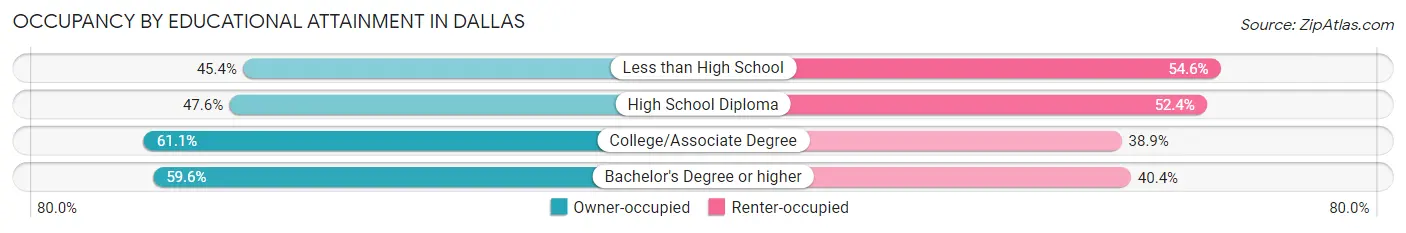
| Household Size | Owner-occupied | Renter-occupied |
| Less than High School | 153 (45.4%) | 184 (54.6%) |
| High School Diploma | 777 (47.6%) | 856 (52.4%) |
| College/Associate Degree | 1,456 (61.1%) | 928 (38.9%) |
| Bachelor's Degree or higher | 655 (59.6%) | 444 (40.4%) |
Occupancy by Age of Householder in Dallas
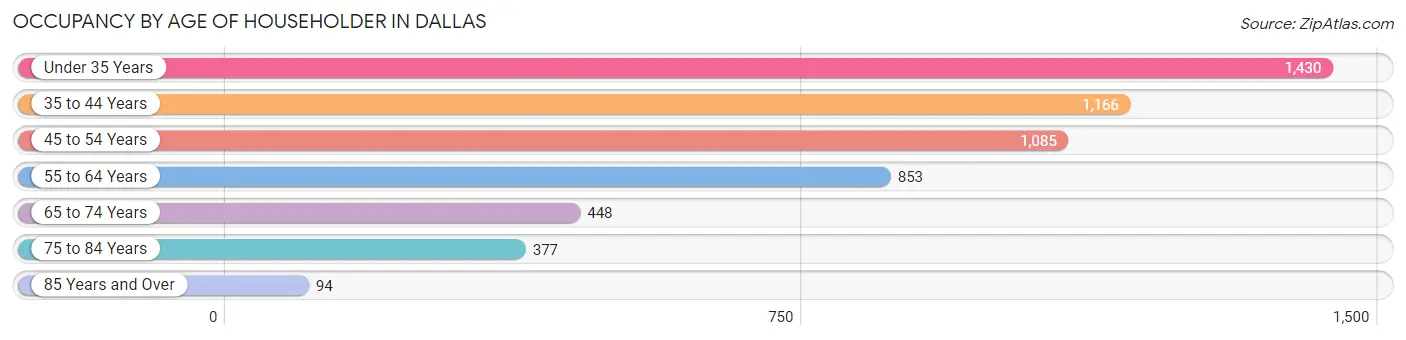
| Age Bracket | # Households | % Households |
| Under 35 Years | 1,430 | 26.2% |
| 35 to 44 Years | 1,166 | 21.4% |
| 45 to 54 Years | 1,085 | 19.9% |
| 55 to 64 Years | 853 | 15.6% |
| 65 to 74 Years | 448 | 8.2% |
| 75 to 84 Years | 377 | 6.9% |
| 85 Years and Over | 94 | 1.7% |
| Total | 5,453 | 100.0% |
Housing Finances in Dallas
Median Income by Occupancy in Dallas
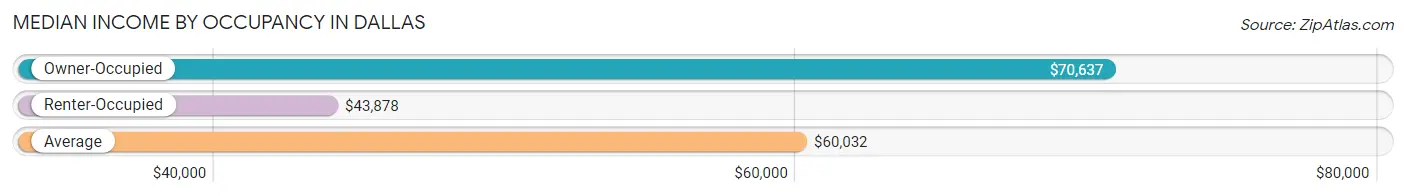
| Occupancy Type | # Households | Median Income |
| Owner-Occupied | 3,041 (55.8%) | $70,637 |
| Renter-Occupied | 2,412 (44.2%) | $43,878 |
| Average | 5,453 (100.0%) | $60,032 |
Occupancy by Householder Income Bracket in Dallas
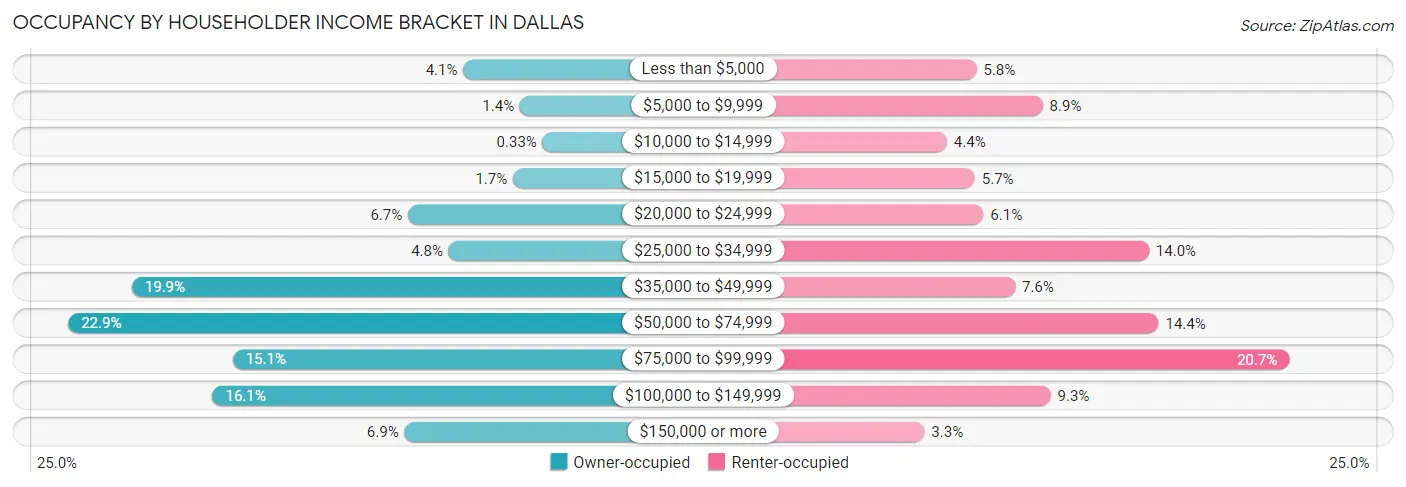
| Income Bracket | Owner-occupied | Renter-occupied |
| Less than $5,000 | 125 (4.1%) | 139 (5.8%) |
| $5,000 to $9,999 | 43 (1.4%) | 215 (8.9%) |
| $10,000 to $14,999 | 10 (0.3%) | 105 (4.3%) |
| $15,000 to $19,999 | 53 (1.7%) | 137 (5.7%) |
| $20,000 to $24,999 | 205 (6.7%) | 147 (6.1%) |
| $25,000 to $34,999 | 146 (4.8%) | 337 (14.0%) |
| $35,000 to $49,999 | 605 (19.9%) | 183 (7.6%) |
| $50,000 to $74,999 | 697 (22.9%) | 348 (14.4%) |
| $75,000 to $99,999 | 459 (15.1%) | 498 (20.6%) |
| $100,000 to $149,999 | 488 (16.1%) | 224 (9.3%) |
| $150,000 or more | 210 (6.9%) | 79 (3.3%) |
| Total | 3,041 (100.0%) | 2,412 (100.0%) |
Monthly Housing Cost Tiers in Dallas
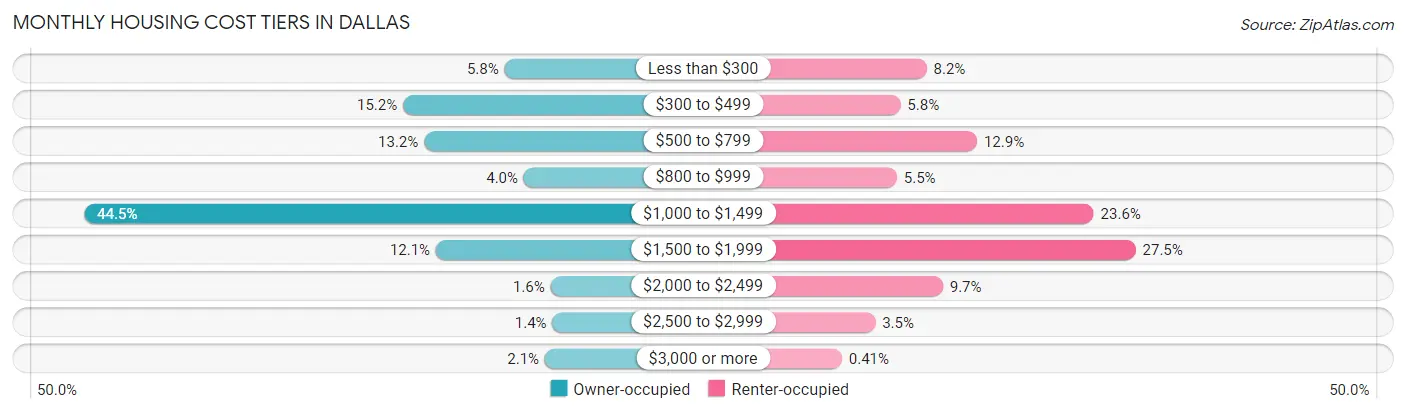
| Monthly Cost | Owner-occupied | Renter-occupied |
| Less than $300 | 177 (5.8%) | 198 (8.2%) |
| $300 to $499 | 461 (15.2%) | 140 (5.8%) |
| $500 to $799 | 402 (13.2%) | 310 (12.9%) |
| $800 to $999 | 123 (4.0%) | 132 (5.5%) |
| $1,000 to $1,499 | 1,354 (44.5%) | 569 (23.6%) |
| $1,500 to $1,999 | 369 (12.1%) | 662 (27.5%) |
| $2,000 to $2,499 | 48 (1.6%) | 234 (9.7%) |
| $2,500 to $2,999 | 43 (1.4%) | 84 (3.5%) |
| $3,000 or more | 64 (2.1%) | 10 (0.4%) |
| Total | 3,041 (100.0%) | 2,412 (100.0%) |
Physical Housing Characteristics in Dallas
Housing Structures in Dallas
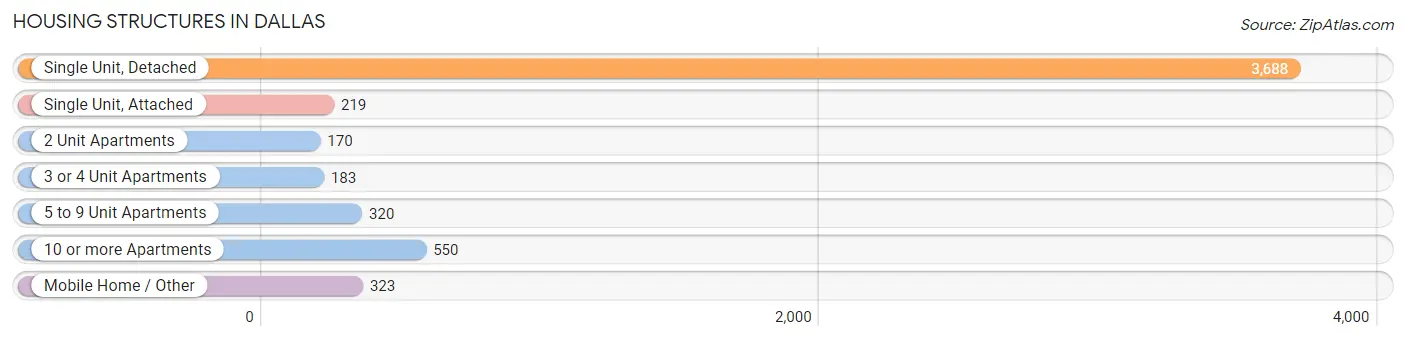
| Structure Type | # Housing Units | % Housing Units |
| Single Unit, Detached | 3,688 | 67.6% |
| Single Unit, Attached | 219 | 4.0% |
| 2 Unit Apartments | 170 | 3.1% |
| 3 or 4 Unit Apartments | 183 | 3.4% |
| 5 to 9 Unit Apartments | 320 | 5.9% |
| 10 or more Apartments | 550 | 10.1% |
| Mobile Home / Other | 323 | 5.9% |
| Total | 5,453 | 100.0% |
Housing Structures by Occupancy in Dallas
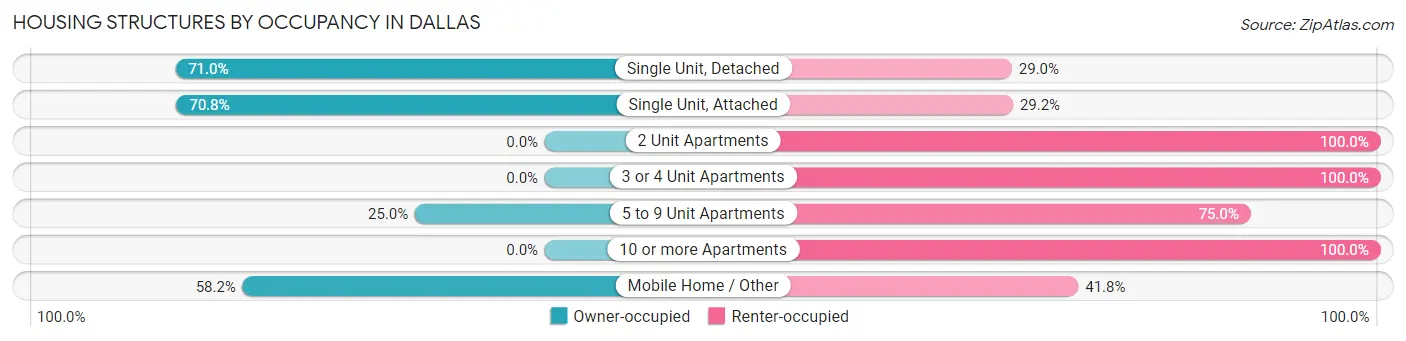
| Structure Type | Owner-occupied | Renter-occupied |
| Single Unit, Detached | 2,618 (71.0%) | 1,070 (29.0%) |
| Single Unit, Attached | 155 (70.8%) | 64 (29.2%) |
| 2 Unit Apartments | 0 (0.0%) | 170 (100.0%) |
| 3 or 4 Unit Apartments | 0 (0.0%) | 183 (100.0%) |
| 5 to 9 Unit Apartments | 80 (25.0%) | 240 (75.0%) |
| 10 or more Apartments | 0 (0.0%) | 550 (100.0%) |
| Mobile Home / Other | 188 (58.2%) | 135 (41.8%) |
| Total | 3,041 (55.8%) | 2,412 (44.2%) |
Housing Structures by Number of Rooms in Dallas
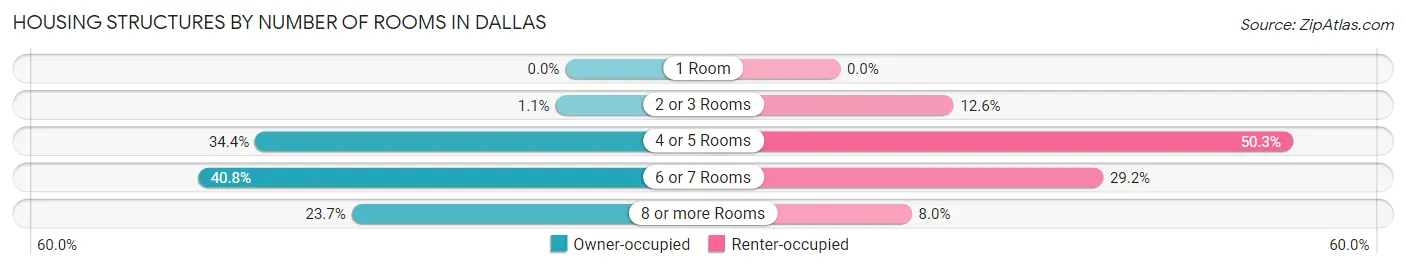
| Number of Rooms | Owner-occupied | Renter-occupied |
| 1 Room | 0 (0.0%) | 0 (0.0%) |
| 2 or 3 Rooms | 33 (1.1%) | 304 (12.6%) |
| 4 or 5 Rooms | 1,047 (34.4%) | 1,212 (50.2%) |
| 6 or 7 Rooms | 1,240 (40.8%) | 704 (29.2%) |
| 8 or more Rooms | 721 (23.7%) | 192 (8.0%) |
| Total | 3,041 (100.0%) | 2,412 (100.0%) |
Housing Structure by Heating Type in Dallas
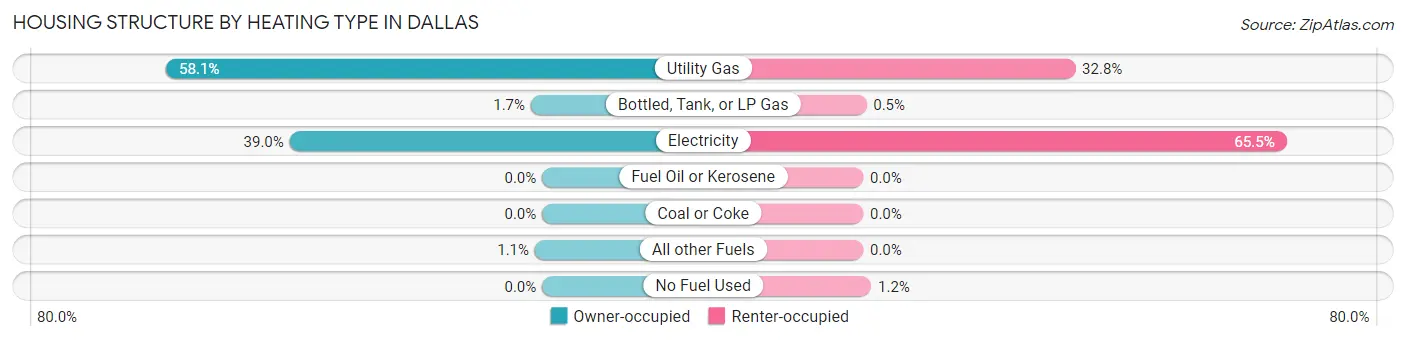
| Heating Type | Owner-occupied | Renter-occupied |
| Utility Gas | 1,767 (58.1%) | 791 (32.8%) |
| Bottled, Tank, or LP Gas | 53 (1.7%) | 12 (0.5%) |
| Electricity | 1,187 (39.0%) | 1,579 (65.5%) |
| Fuel Oil or Kerosene | 0 (0.0%) | 0 (0.0%) |
| Coal or Coke | 0 (0.0%) | 0 (0.0%) |
| All other Fuels | 34 (1.1%) | 0 (0.0%) |
| No Fuel Used | 0 (0.0%) | 30 (1.2%) |
| Total | 3,041 (100.0%) | 2,412 (100.0%) |
Household Vehicle Usage in Dallas
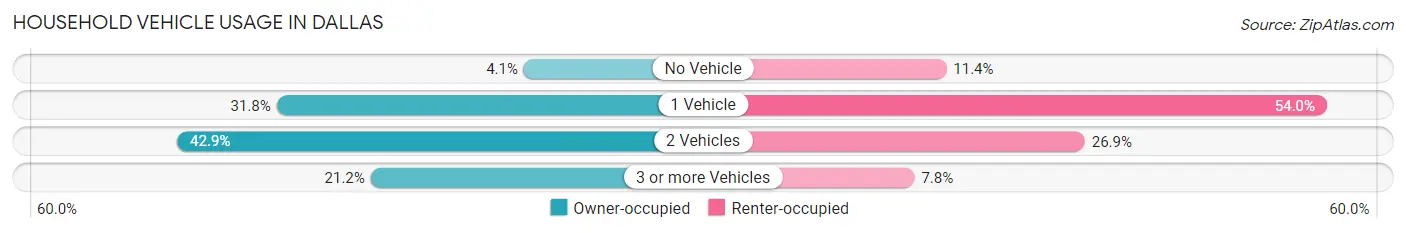
| Vehicles per Household | Owner-occupied | Renter-occupied |
| No Vehicle | 124 (4.1%) | 274 (11.4%) |
| 1 Vehicle | 966 (31.8%) | 1,302 (54.0%) |
| 2 Vehicles | 1,305 (42.9%) | 648 (26.9%) |
| 3 or more Vehicles | 646 (21.2%) | 188 (7.8%) |
| Total | 3,041 (100.0%) | 2,412 (100.0%) |
Real Estate & Mortgages in Dallas
Real Estate and Mortgage Overview in Dallas
| Characteristic | Without Mortgage | With Mortgage |
| Housing Units | 997 | 2,044 |
| Median Property Value | $174,100 | $212,100 |
| Median Household Income | $37,639 | $158 |
| Monthly Housing Costs | $414 | $64 |
| Real Estate Taxes | $1,103 | $115 |
Property Value by Mortgage Status in Dallas
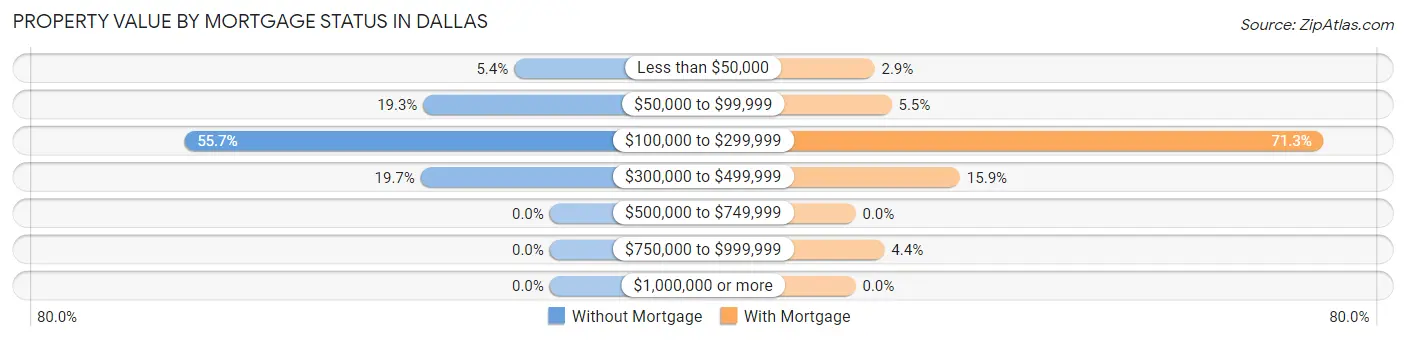
| Property Value | Without Mortgage | With Mortgage |
| Less than $50,000 | 54 (5.4%) | 59 (2.9%) |
| $50,000 to $99,999 | 192 (19.3%) | 112 (5.5%) |
| $100,000 to $299,999 | 555 (55.7%) | 1,458 (71.3%) |
| $300,000 to $499,999 | 196 (19.7%) | 325 (15.9%) |
| $500,000 to $749,999 | 0 (0.0%) | 0 (0.0%) |
| $750,000 to $999,999 | 0 (0.0%) | 90 (4.4%) |
| $1,000,000 or more | 0 (0.0%) | 0 (0.0%) |
| Total | 997 (100.0%) | 2,044 (100.0%) |
Household Income by Mortgage Status in Dallas
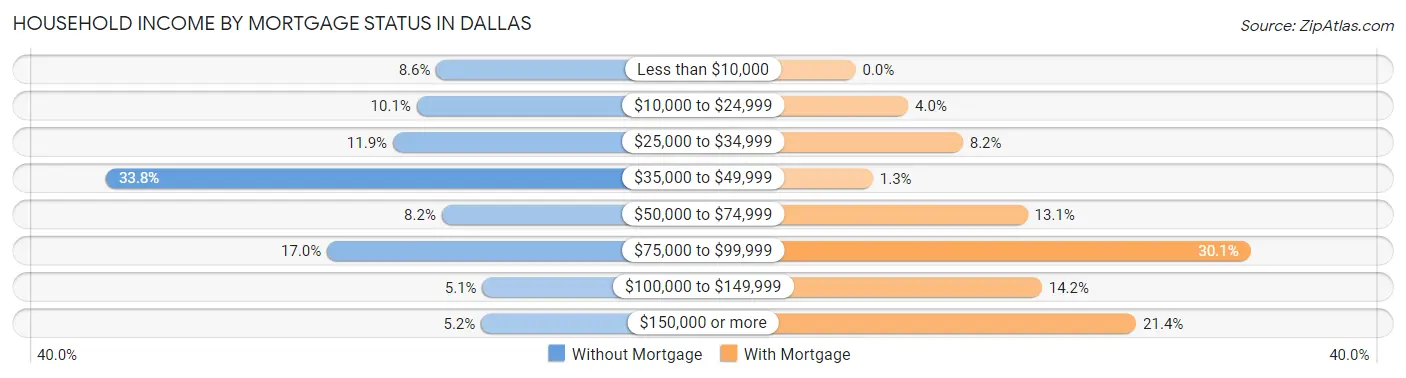
| Household Income | Without Mortgage | With Mortgage |
| Less than $10,000 | 86 (8.6%) | 0 (0.0%) |
| $10,000 to $24,999 | 101 (10.1%) | 82 (4.0%) |
| $25,000 to $34,999 | 119 (11.9%) | 167 (8.2%) |
| $35,000 to $49,999 | 337 (33.8%) | 27 (1.3%) |
| $50,000 to $74,999 | 82 (8.2%) | 268 (13.1%) |
| $75,000 to $99,999 | 169 (17.0%) | 615 (30.1%) |
| $100,000 to $149,999 | 51 (5.1%) | 290 (14.2%) |
| $150,000 or more | 52 (5.2%) | 437 (21.4%) |
| Total | 997 (100.0%) | 2,044 (100.0%) |
Property Value to Household Income Ratio in Dallas
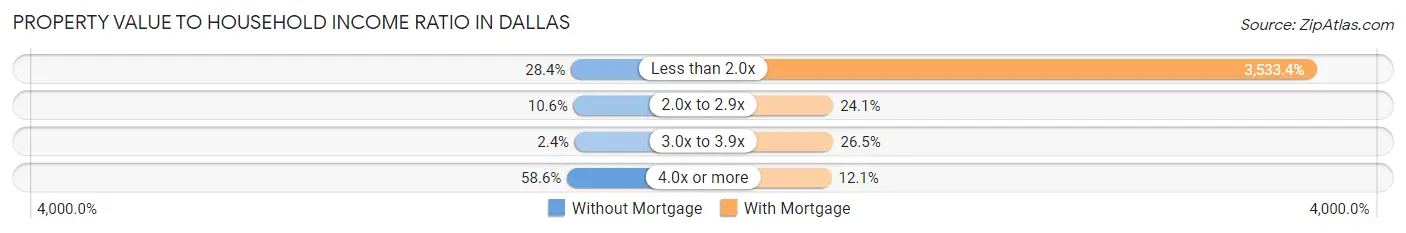
| Value-to-Income Ratio | Without Mortgage | With Mortgage |
| Less than 2.0x | 283 (28.4%) | 72,223 (3,533.4%) |
| 2.0x to 2.9x | 106 (10.6%) | 492 (24.1%) |
| 3.0x to 3.9x | 24 (2.4%) | 541 (26.5%) |
| 4.0x or more | 584 (58.6%) | 247 (12.1%) |
| Total | 997 (100.0%) | 2,044 (100.0%) |
Real Estate Taxes by Mortgage Status in Dallas
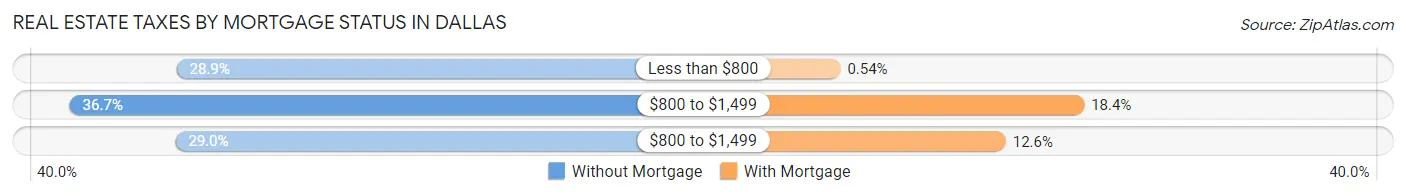
| Property Taxes | Without Mortgage | With Mortgage |
| Less than $800 | 288 (28.9%) | 11 (0.5%) |
| $800 to $1,499 | 366 (36.7%) | 375 (18.3%) |
| $800 to $1,499 | 289 (29.0%) | 258 (12.6%) |
| Total | 997 (100.0%) | 2,044 (100.0%) |
Health & Disability in Dallas
Health Insurance Coverage by Age in Dallas
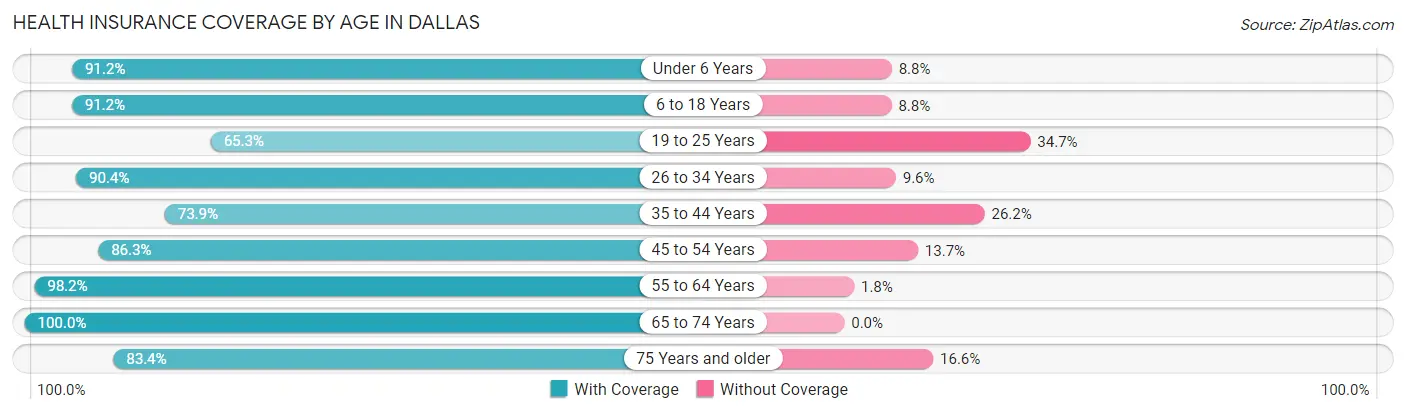
| Age Bracket | With Coverage | Without Coverage |
| Under 6 Years | 1,402 (91.2%) | 136 (8.8%) |
| 6 to 18 Years | 2,032 (91.2%) | 196 (8.8%) |
| 19 to 25 Years | 903 (65.3%) | 480 (34.7%) |
| 26 to 34 Years | 1,978 (90.4%) | 210 (9.6%) |
| 35 to 44 Years | 1,471 (73.9%) | 521 (26.2%) |
| 45 to 54 Years | 1,665 (86.3%) | 265 (13.7%) |
| 55 to 64 Years | 1,132 (98.2%) | 21 (1.8%) |
| 65 to 74 Years | 713 (100.0%) | 0 (0.0%) |
| 75 Years and older | 670 (83.4%) | 133 (16.6%) |
| Total | 11,966 (85.9%) | 1,962 (14.1%) |
Health Insurance Coverage by Citizenship Status in Dallas
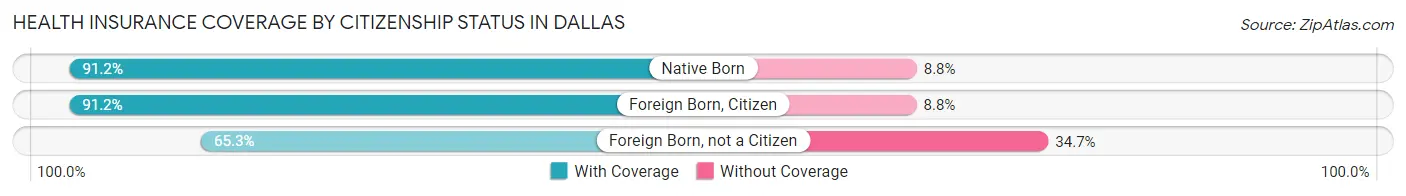
| Citizenship Status | With Coverage | Without Coverage |
| Native Born | 1,402 (91.2%) | 136 (8.8%) |
| Foreign Born, Citizen | 2,032 (91.2%) | 196 (8.8%) |
| Foreign Born, not a Citizen | 903 (65.3%) | 480 (34.7%) |
Health Insurance Coverage by Household Income in Dallas
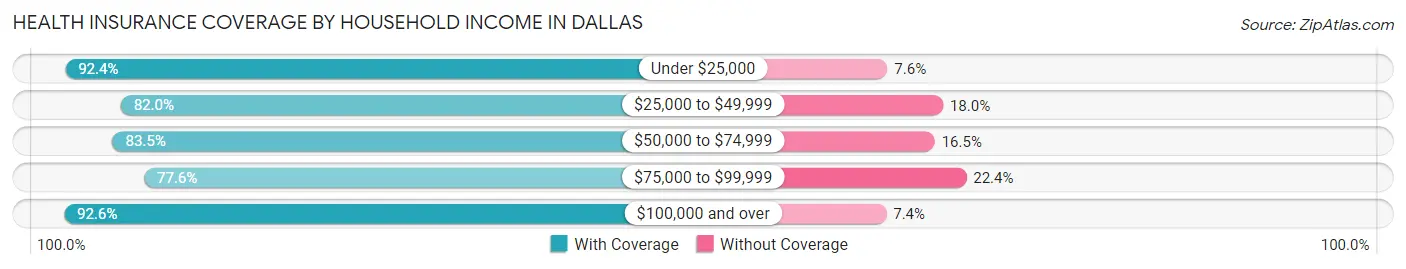
| Household Income | With Coverage | Without Coverage |
| Under $25,000 | 2,039 (92.4%) | 168 (7.6%) |
| $25,000 to $49,999 | 1,979 (82.0%) | 435 (18.0%) |
| $50,000 to $74,999 | 2,398 (83.5%) | 473 (16.5%) |
| $75,000 to $99,999 | 2,129 (77.6%) | 614 (22.4%) |
| $100,000 and over | 3,405 (92.6%) | 272 (7.4%) |
Public vs Private Health Insurance Coverage by Age in Dallas
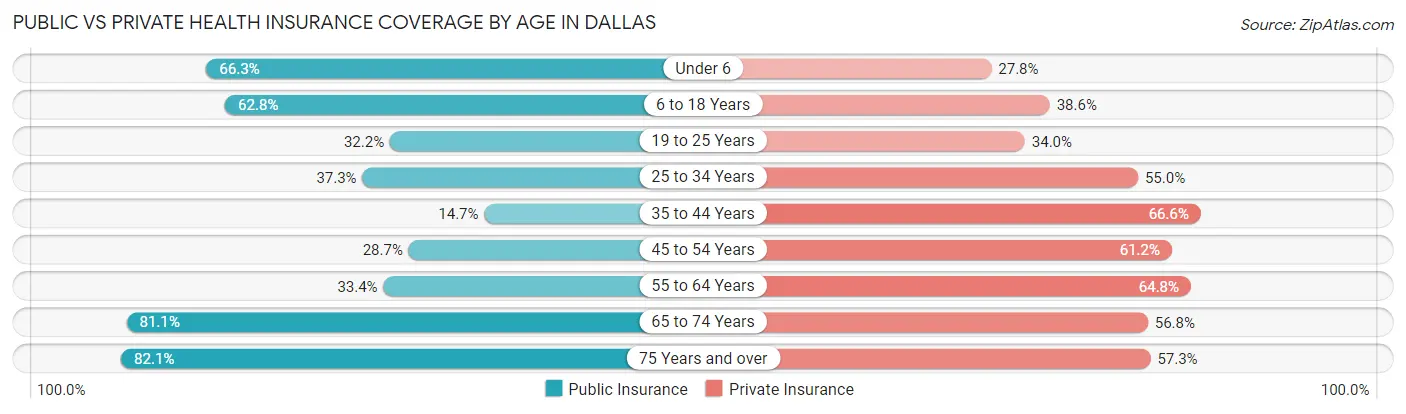
| Age Bracket | Public Insurance | Private Insurance |
| Under 6 | 1,019 (66.2%) | 427 (27.8%) |
| 6 to 18 Years | 1,399 (62.8%) | 860 (38.6%) |
| 19 to 25 Years | 445 (32.2%) | 470 (34.0%) |
| 25 to 34 Years | 816 (37.3%) | 1,203 (55.0%) |
| 35 to 44 Years | 292 (14.7%) | 1,327 (66.6%) |
| 45 to 54 Years | 554 (28.7%) | 1,182 (61.2%) |
| 55 to 64 Years | 385 (33.4%) | 747 (64.8%) |
| 65 to 74 Years | 578 (81.1%) | 405 (56.8%) |
| 75 Years and over | 659 (82.1%) | 460 (57.3%) |
| Total | 6,147 (44.1%) | 7,081 (50.8%) |
Disability Status by Sex by Age in Dallas
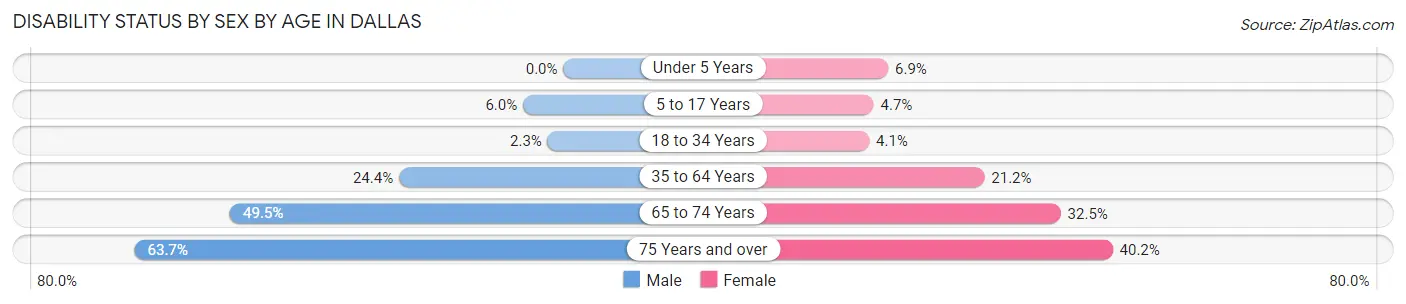
| Age Bracket | Male | Female |
| Under 5 Years | 0 (0.0%) | 48 (6.9%) |
| 5 to 17 Years | 58 (6.0%) | 61 (4.7%) |
| 18 to 34 Years | 43 (2.3%) | 77 (4.1%) |
| 35 to 64 Years | 644 (24.4%) | 516 (21.2%) |
| 65 to 74 Years | 97 (49.5%) | 168 (32.5%) |
| 75 Years and over | 212 (63.7%) | 189 (40.2%) |
Disability Class by Sex by Age in Dallas
Disability Class: Hearing Difficulty
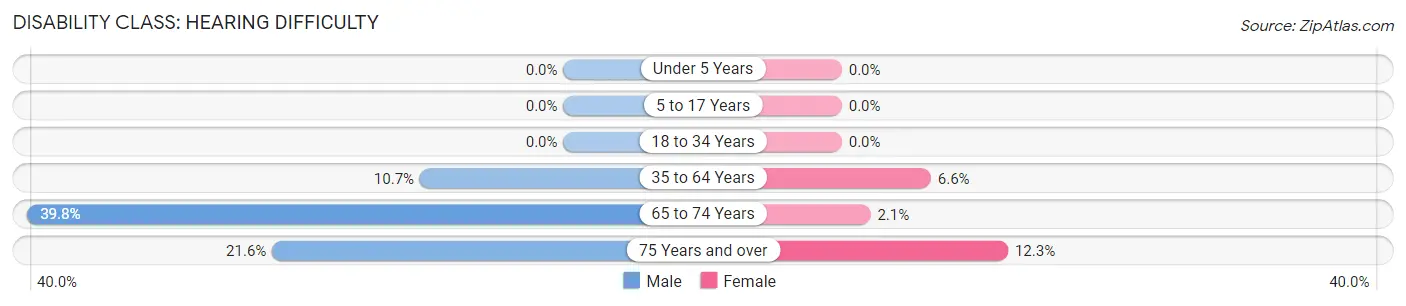
| Age Bracket | Male | Female |
| Under 5 Years | 0 (0.0%) | 0 (0.0%) |
| 5 to 17 Years | 0 (0.0%) | 0 (0.0%) |
| 18 to 34 Years | 0 (0.0%) | 0 (0.0%) |
| 35 to 64 Years | 281 (10.6%) | 161 (6.6%) |
| 65 to 74 Years | 78 (39.8%) | 11 (2.1%) |
| 75 Years and over | 72 (21.6%) | 58 (12.3%) |
Disability Class: Vision Difficulty
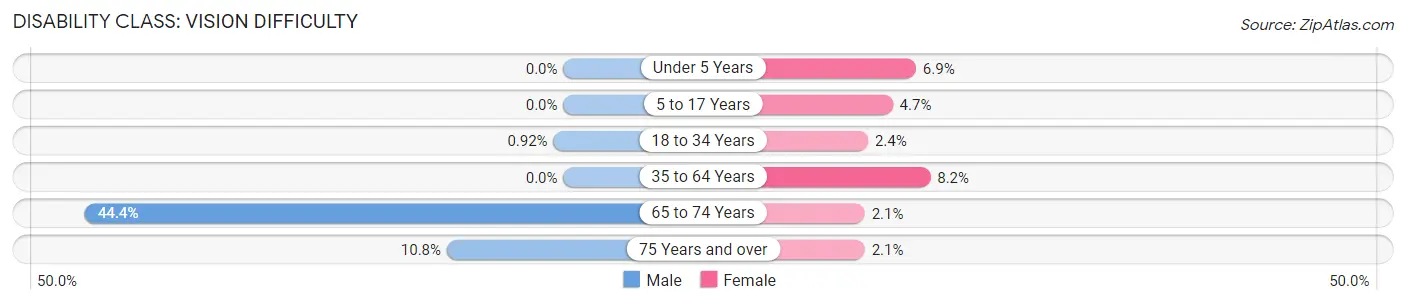
| Age Bracket | Male | Female |
| Under 5 Years | 0 (0.0%) | 48 (6.9%) |
| 5 to 17 Years | 0 (0.0%) | 61 (4.7%) |
| 18 to 34 Years | 17 (0.9%) | 46 (2.4%) |
| 35 to 64 Years | 0 (0.0%) | 200 (8.2%) |
| 65 to 74 Years | 87 (44.4%) | 11 (2.1%) |
| 75 Years and over | 36 (10.8%) | 10 (2.1%) |
Disability Class: Cognitive Difficulty
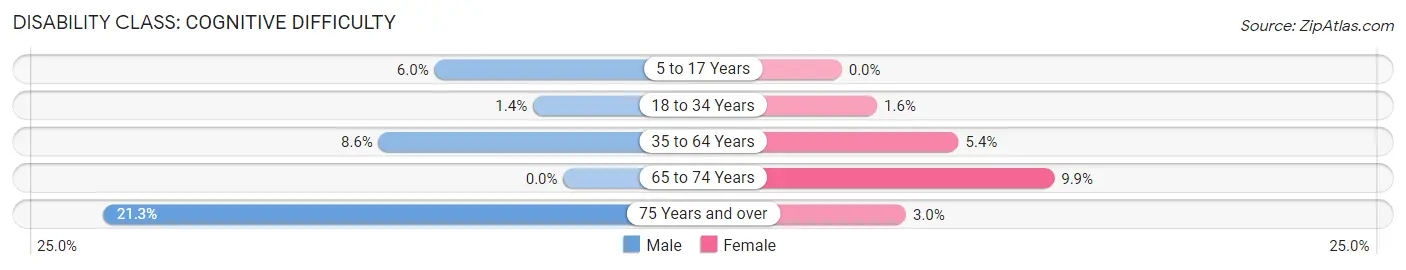
| Age Bracket | Male | Female |
| 5 to 17 Years | 58 (6.0%) | 0 (0.0%) |
| 18 to 34 Years | 26 (1.4%) | 31 (1.6%) |
| 35 to 64 Years | 226 (8.6%) | 132 (5.4%) |
| 65 to 74 Years | 0 (0.0%) | 51 (9.9%) |
| 75 Years and over | 71 (21.3%) | 14 (3.0%) |
Disability Class: Ambulatory Difficulty
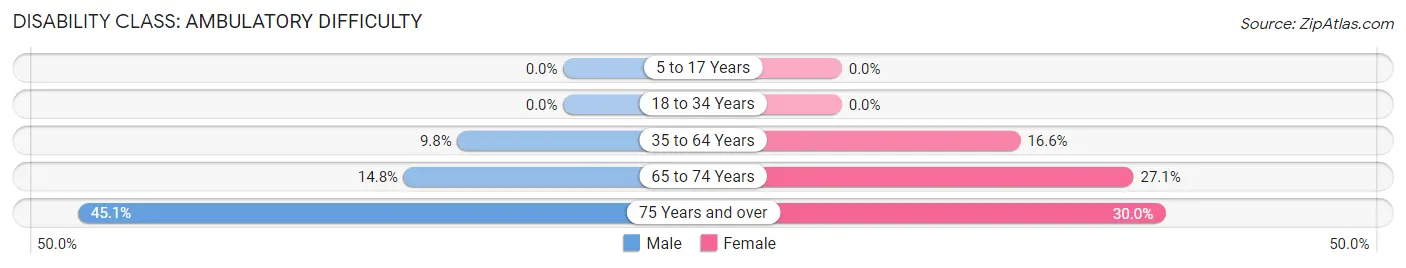
| Age Bracket | Male | Female |
| 5 to 17 Years | 0 (0.0%) | 0 (0.0%) |
| 18 to 34 Years | 0 (0.0%) | 0 (0.0%) |
| 35 to 64 Years | 259 (9.8%) | 404 (16.6%) |
| 65 to 74 Years | 29 (14.8%) | 140 (27.1%) |
| 75 Years and over | 150 (45.1%) | 141 (30.0%) |
Disability Class: Self-Care Difficulty
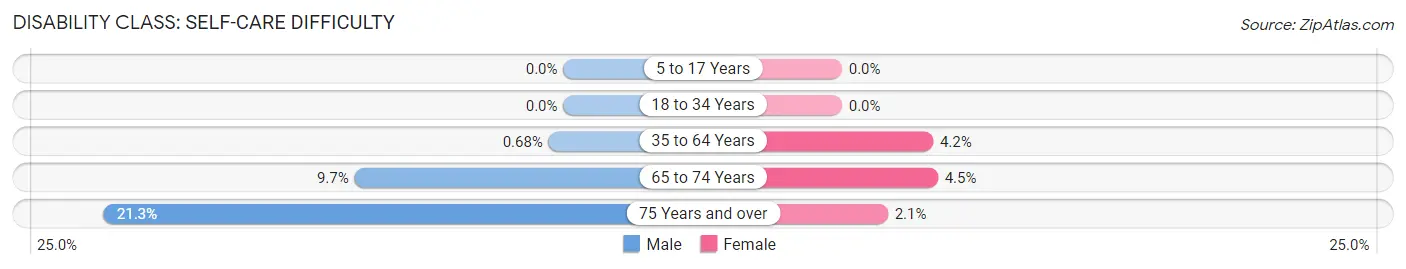
| Age Bracket | Male | Female |
| 5 to 17 Years | 0 (0.0%) | 0 (0.0%) |
| 18 to 34 Years | 0 (0.0%) | 0 (0.0%) |
| 35 to 64 Years | 18 (0.7%) | 103 (4.2%) |
| 65 to 74 Years | 19 (9.7%) | 23 (4.4%) |
| 75 Years and over | 71 (21.3%) | 10 (2.1%) |
Technology Access in Dallas
Computing Device Access in Dallas
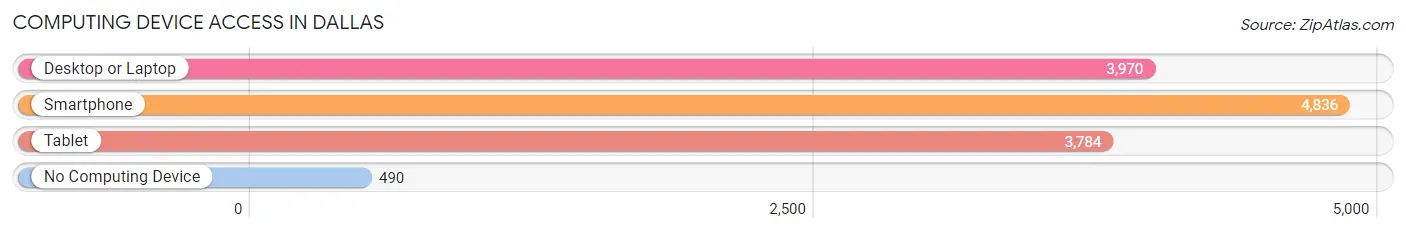
| Device Type | # Households | % Households |
| Desktop or Laptop | 3,970 | 72.8% |
| Smartphone | 4,836 | 88.7% |
| Tablet | 3,784 | 69.4% |
| No Computing Device | 490 | 9.0% |
| Total | 5,453 | 100.0% |
Internet Access in Dallas
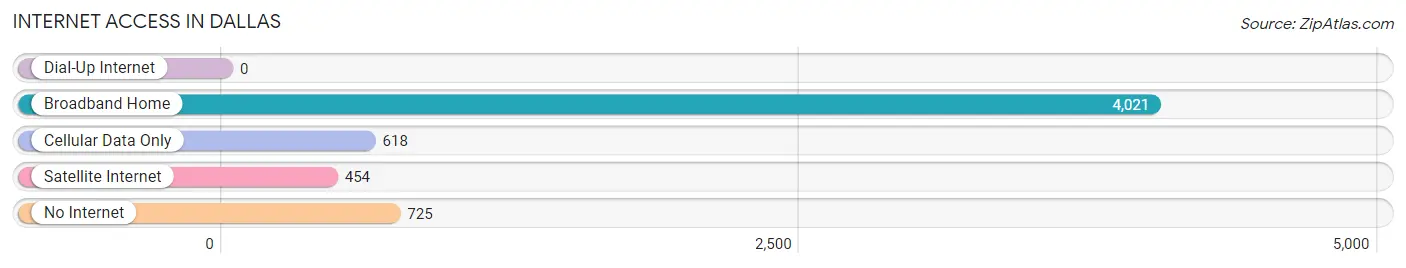
| Internet Type | # Households | % Households |
| Dial-Up Internet | 0 | 0.0% |
| Broadband Home | 4,021 | 73.7% |
| Cellular Data Only | 618 | 11.3% |
| Satellite Internet | 454 | 8.3% |
| No Internet | 725 | 13.3% |
| Total | 5,453 | 100.0% |
Dallas Summary
Dallas, Georgia is a city located in Paulding County, Georgia, United States. It is the county seat of Paulding County and is located approximately 30 miles northwest of Atlanta. The city is part of the Atlanta metropolitan area and is home to a population of approximately 13,000 people.
History
The area that is now Dallas was first settled in the early 1800s by settlers from the Carolinas. The town was originally known as Cross Roads, due to its location at the intersection of two major roads. In 1852, the town was renamed Dallas after George M. Dallas, the Vice President of the United States under James K. Polk.
In the late 1800s, Dallas was a thriving agricultural community, with cotton, corn, and other crops being grown in the area. The town also had a number of businesses, including a grist mill, a sawmill, and a cotton gin.
In the early 1900s, Dallas began to experience a period of growth and development. The town was incorporated in 1908 and the first mayor was elected in 1909. The city continued to grow throughout the 20th century, with the population reaching its peak in the 1970s.
Geography
Dallas is located in the foothills of the Appalachian Mountains in northwest Georgia. The city is situated at the intersection of two major highways, US Highway 278 and Georgia State Route 120. The city is located approximately 30 miles northwest of Atlanta and is part of the Atlanta metropolitan area.
The city has a total area of 8.3 square miles, of which 8.2 square miles is land and 0.1 square miles is water. The city is located at an elevation of 890 feet above sea level.
Economy
The economy of Dallas is largely based on manufacturing and retail. The city is home to a number of manufacturing companies, including a paper mill, a plastics plant, and a furniture factory. The city is also home to a number of retail stores, including a Walmart Supercenter and a Home Depot.
The city is also home to a number of small businesses, including restaurants, shops, and professional services. The city is also home to a number of medical facilities, including a hospital and a number of medical offices.
Demographics
As of the 2010 census, the population of Dallas was 13,068. The racial makeup of the city was 79.2% White, 15.3% African American, 0.4% Native American, 0.9% Asian, 0.1% Pacific Islander, 2.2% from other races, and 2.0% from two or more races. Hispanic or Latino of any race were 4.7% of the population.
The median household income in Dallas was $45,945, and the median family income was $51,945. The per capita income for the city was $20,945. About 11.2% of families and 14.2% of the population were below the poverty line, including 19.2% of those under age 18 and 8.2% of those age 65 or over.
Conclusion
Dallas, Georgia is a city located in Paulding County, Georgia, United States. It is the county seat of Paulding County and is located approximately 30 miles northwest of Atlanta. The city is part of the Atlanta metropolitan area and is home to a population of approximately 13,000 people. The economy of Dallas is largely based on manufacturing and retail, and the city is home to a number of small businesses, including restaurants, shops, and professional services. The racial makeup of the city is 79.2% White, 15.3% African American, 0.4% Native American, 0.9% Asian, 0.1% Pacific Islander, 2.2% from other races, and 2.0% from two or more races. The median household income in Dallas was $45,945, and the median family income was $51,945.
Common Questions
What is Per Capita Income in Dallas?
Per Capita income in Dallas is $26,171.
What is the Median Family Income in Dallas?
Median Family Income in Dallas is $71,813.
What is the Median Household income in Dallas?
Median Household Income in Dallas is $60,032.
What is Income or Wage Gap in Dallas?
Income or Wage Gap in Dallas is 16.6%.
Women in Dallas earn 83.4 cents for every dollar earned by a man.
What is Inequality or Gini Index in Dallas?
Inequality or Gini Index in Dallas is 0.38.
What is the Total Population of Dallas?
Total Population of Dallas is 14,126.
What is the Total Male Population of Dallas?
Total Male Population of Dallas is 6,660.
What is the Total Female Population of Dallas?
Total Female Population of Dallas is 7,466.
What is the Ratio of Males per 100 Females in Dallas?
There are 89.20 Males per 100 Females in Dallas.
What is the Ratio of Females per 100 Males in Dallas?
There are 112.10 Females per 100 Males in Dallas.
What is the Median Population Age in Dallas?
Median Population Age in Dallas is 33.7 Years.
What is the Average Family Size in Dallas
Average Family Size in Dallas is 3.3 People.
What is the Average Household Size in Dallas
Average Household Size in Dallas is 2.5 People.
How Large is the Labor Force in Dallas?
There are 6,868 People in the Labor Forcein in Dallas.
What is the Percentage of People in the Labor Force in Dallas?
63.0% of People are in the Labor Force in Dallas.
What is the Unemployment Rate in Dallas?
Unemployment Rate in Dallas is 5.1%.